Article

Irrigation and Planting Density Effects on Apple–Peanut Intercropping System

1
School of Soil and Water Conservation, Beijing Forestry University, Beijing 100083, China
2
Forest Ecosystem Studies, National Observation and Research Station, Jixian 042200, China
*
Author to whom correspondence should be addressed.
Agronomy 2025, 15(8), 1798; https://doi.org/10.3390/agronomy15081798
Submission received: 18 June 2025 / Revised: 18 July 2025 / Accepted: 23 July 2025 / Published: 25 July 2025

Abstract

The western Shanxi Loess region, as a typical semi-arid ecologically fragile zone, faces severe soil and water resource constraints. The apple–peanut intercropping system can significantly improve water productivity and economic benefits through complementary resource utilization, representing an effective approach for sustainable agricultural development in the region. This study took the apple–peanut intercropping system as the research object (apple variety: ‘Yanfu 8’; peanut variety: ‘Huayu 38’), setting three peanut planting densities (D1: 27,500 plants/ha; D2: 18,333 plants/ha; D3: 10,833 plants/ha) and two water regulation measures—W1 (irrigation upper limit at 85% of field capacity, FC) and W2 (65% FC), with non-irrigated controls (CK) at different planting densities for comparison. This study systematically analyzed the synergistic regulation effects of intercropping density and water management on system water use and comprehensive benefits. Results showed that medium planting density combined with medium irrigation (W2D2 treatment) could maximize intercropping advantages, effectively improving the intercropping system’s soil water content (SWC), yield (GY), and water use efficiency (WUE). This research provides a theoretical basis for precision irrigation in fruit–crop intercropping systems in semi-arid regions. However, based on the significant water-saving and yield-increasing effects observed in the current experimental year, follow-up studies should verify its stability through multi-year fixed-position observation data.

1. Introduction

Northern China’s semi-arid regions universally face dual constraints of precipitation insufficiency and inefficient water utilization [1]. This region exhibits notably low soil organic matter content, severe soil erosion, and marked ecosystem vulnerability. These combined attributes establish it as a critical zone for studying the synergistic development of rainfed agriculture and ecological restoration in northern China’s drylands. This region exhibits notably low soil organic matter content, severe soil erosion, and marked ecosystem vulnerability [2]. These combined attributes establish it as a critical zone for studying the synergistic development of rainfed agriculture and ecological restoration in northern China’s drylands [3]. Agroforestry management can efficiently utilize resources such as water, fertilizer, light, and heat, playing a significant role in soil water conservation and alleviating farmland–forestry land conflicts [4]. As an essential model of agroforestry, orchard–crop intercropping has been widely adopted on agricultural land in this region. However, inadequate annual precipitation with uneven spatiotemporal distribution, combined with poor water retention capacity of loess soil and intense evaporation, intensifies water competition within the system [5]. Deep-rooted orchard trees and shallow-rooted crops engage in vertical water competition, particularly during the co-growth period of orchard trees and crops (July–September), frequently triggering soil water deficit [6]. Additionally, traditional intercropping density configurations rely on empirical dense planting principles that increase plant numbers per unit area for short-term yield gains, while neglecting dynamic canopy management [7,8,9]. This oversight easily leads to imbalances in light–thermal resource allocation and exceeds nutrient competition thresholds, constraining further improvement of the system’s comprehensive benefits, and has become a critical bottleneck limiting agroforestry system sustainability.
Rational irrigation and density configurations not only promote crop growth and increase yield but are also important means for reducing agricultural water consumption and improving water-fertilizer utilization efficiency [10,11,12]. Alley cropping—the deliberate integration of trees with agricultural crops—ranks among the world’s most prevalent agroforestry practices, particularly in semi-arid regions where its windbreak and moisture conservation effects can significantly mitigate environmental constraints [13]. Previous studies focused on single-density plantings, neglecting how variations in planting density induced by different spacings (e.g., alley width adjustments and crop row density combinations) govern root–soil–water relations in alley cropping systems [14,15,16]. Simultaneously, current research on optimizing intercropping water management and planting density still has the following limitations: (1) most studies separately examine the single-factor effects of water or density, ignoring the non-linear regulation of resource competition through water density interactions; (2) water management only considers young orchards and single crop densities, failing to integrate water requirements of other tree ages and different crop densities; (3) existing density models largely originate from irrigated plain areas, lacking research addressing characteristics of the dry loess plateau region like low precipitation and poor soil water retention. Furthermore, differences in intercropping density may reshape water competition patterns by altering root spatial interaction intensity and canopy light–heat distribution [17,18,19,20]. For instance, while high-density peanut planting enhances topsoil coverage and suppresses evaporation, it may intensify overlapping water uptake with apple trees in the 20–40 cm soil layer [21]; whereas low-density intercropping alleviates water competition but risks insufficient light interception and land resource wastage [22]. This contradiction highlights the necessity for synergistic optimization of intercropping density and water management measures. Density regulation determines the “spatial threshold” of water competition, while water management influences “temporal dynamics,” with both jointly governing the system’s resource use efficiency. Therefore, regarding soil infertility and water scarcity problems in the loess tableland region, in-depth research on water density interaction mechanisms in intercropping remains outstanding.
This study examines the apple–peanut alley cropping system in western Shanxi’s loess region to determine how intercropping density gradients and water regulation affect (1) soil moisture distribution, (2) crop water use patterns, and (3) system productivity. The results will guide optimal management of these systems in the region.

2. Materials and Methods

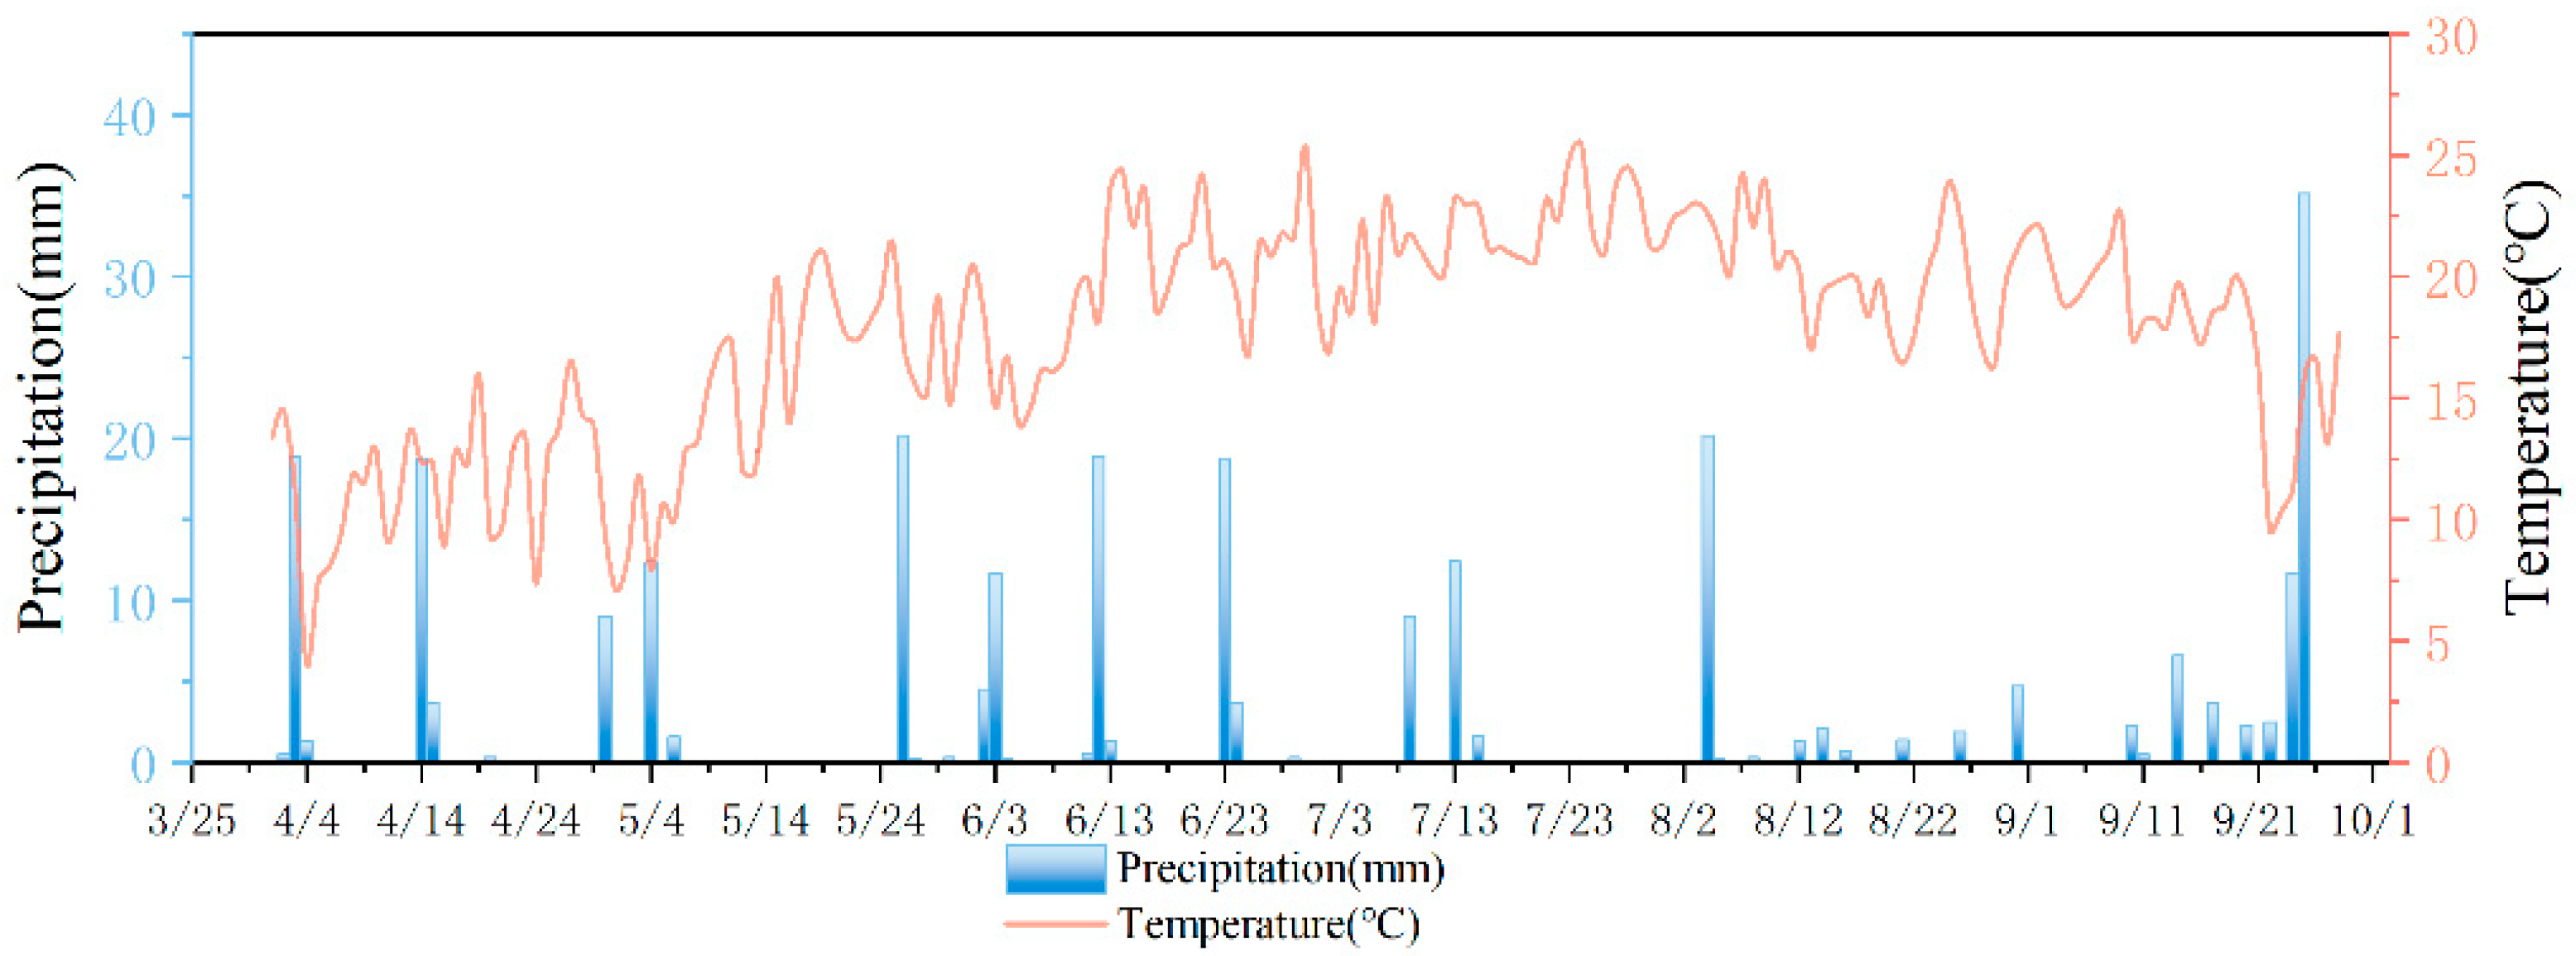
2.1. Study Area Overview

The research area is located at the Forest Ecosystem Studies, National Observation and Research Station, Jixian, Shanxi Province, China (110°26′28″–111°07′21″ E, 35°53′13″–36°21′03″ N). This region represents a typical loess tableland-gully area where the surface consists of Quaternary wind-deposited loess with organic matter content below 1%. It features a temperate continental monsoon climate with a multi-year average precipitation of 575.9 mm (primarily concentrated from June to August, accounting for approximately 61.8% of annual precipitation), average annual evaporation of 1723.9 mm, average annual frost-free period of about 170 days, mean annual temperature of 10 °C, the highest temperature is 43 °C, and the lowest temperature is 5 °C, and the mean annual accumulated temperature of 3357.9 °C. For the experimental orchard, soil bulk density in the 0–60 cm layer averaged 1.38 g/cm3, and mean field capacity (Fc) was 30%. During the 2024 growing season (April–September), precipitation totaled 268.6 mm as shown in Figure 1, with an average air temperature of 17.74 °C.

2.2. Experimental Materials

The study was carried out in 2024 in Yonggu Village, Zhongduo Township, Ji County, using an intercropping system of apple trees and peanuts. The apple trees were of the ‘Yanfu 8’ variety, planted in 2016 (8 years old at the time of the study) and already bearing fruit. The trees were planted in north–south rows with 4 m between plants and 5 m between rows. They had an average trunk diameter of 98.40 cm at chest height, with canopies measuring 2.1 m from north to south, 1.5 m from east to west, and reaching 2.7 m in height. For the peanut component, we used the ‘Huayu 38’ variety planted with 0.5 m between plants and 0.6 m between rows. We tested three planting densities relative to the apple trees: Low density: planted 1.5 m from the tree rows, arranged in 5 columns and 9 rows (10,833 plants per hectare). Medium density: planted 1.0 m from the tree rows, arranged in 7 columns and 9 rows (18,333 plants per hectare). High density: planted 0.5 m from the tree rows, arranged in 9 columns and 9 rows (27,500 plants per hectare). All planting was performed in May 2024. Each test plot contained two apple trees, with plot boundaries set 1 m from the trees, covering a total area of 20 m2. The planting layout is shown in Figure 2.

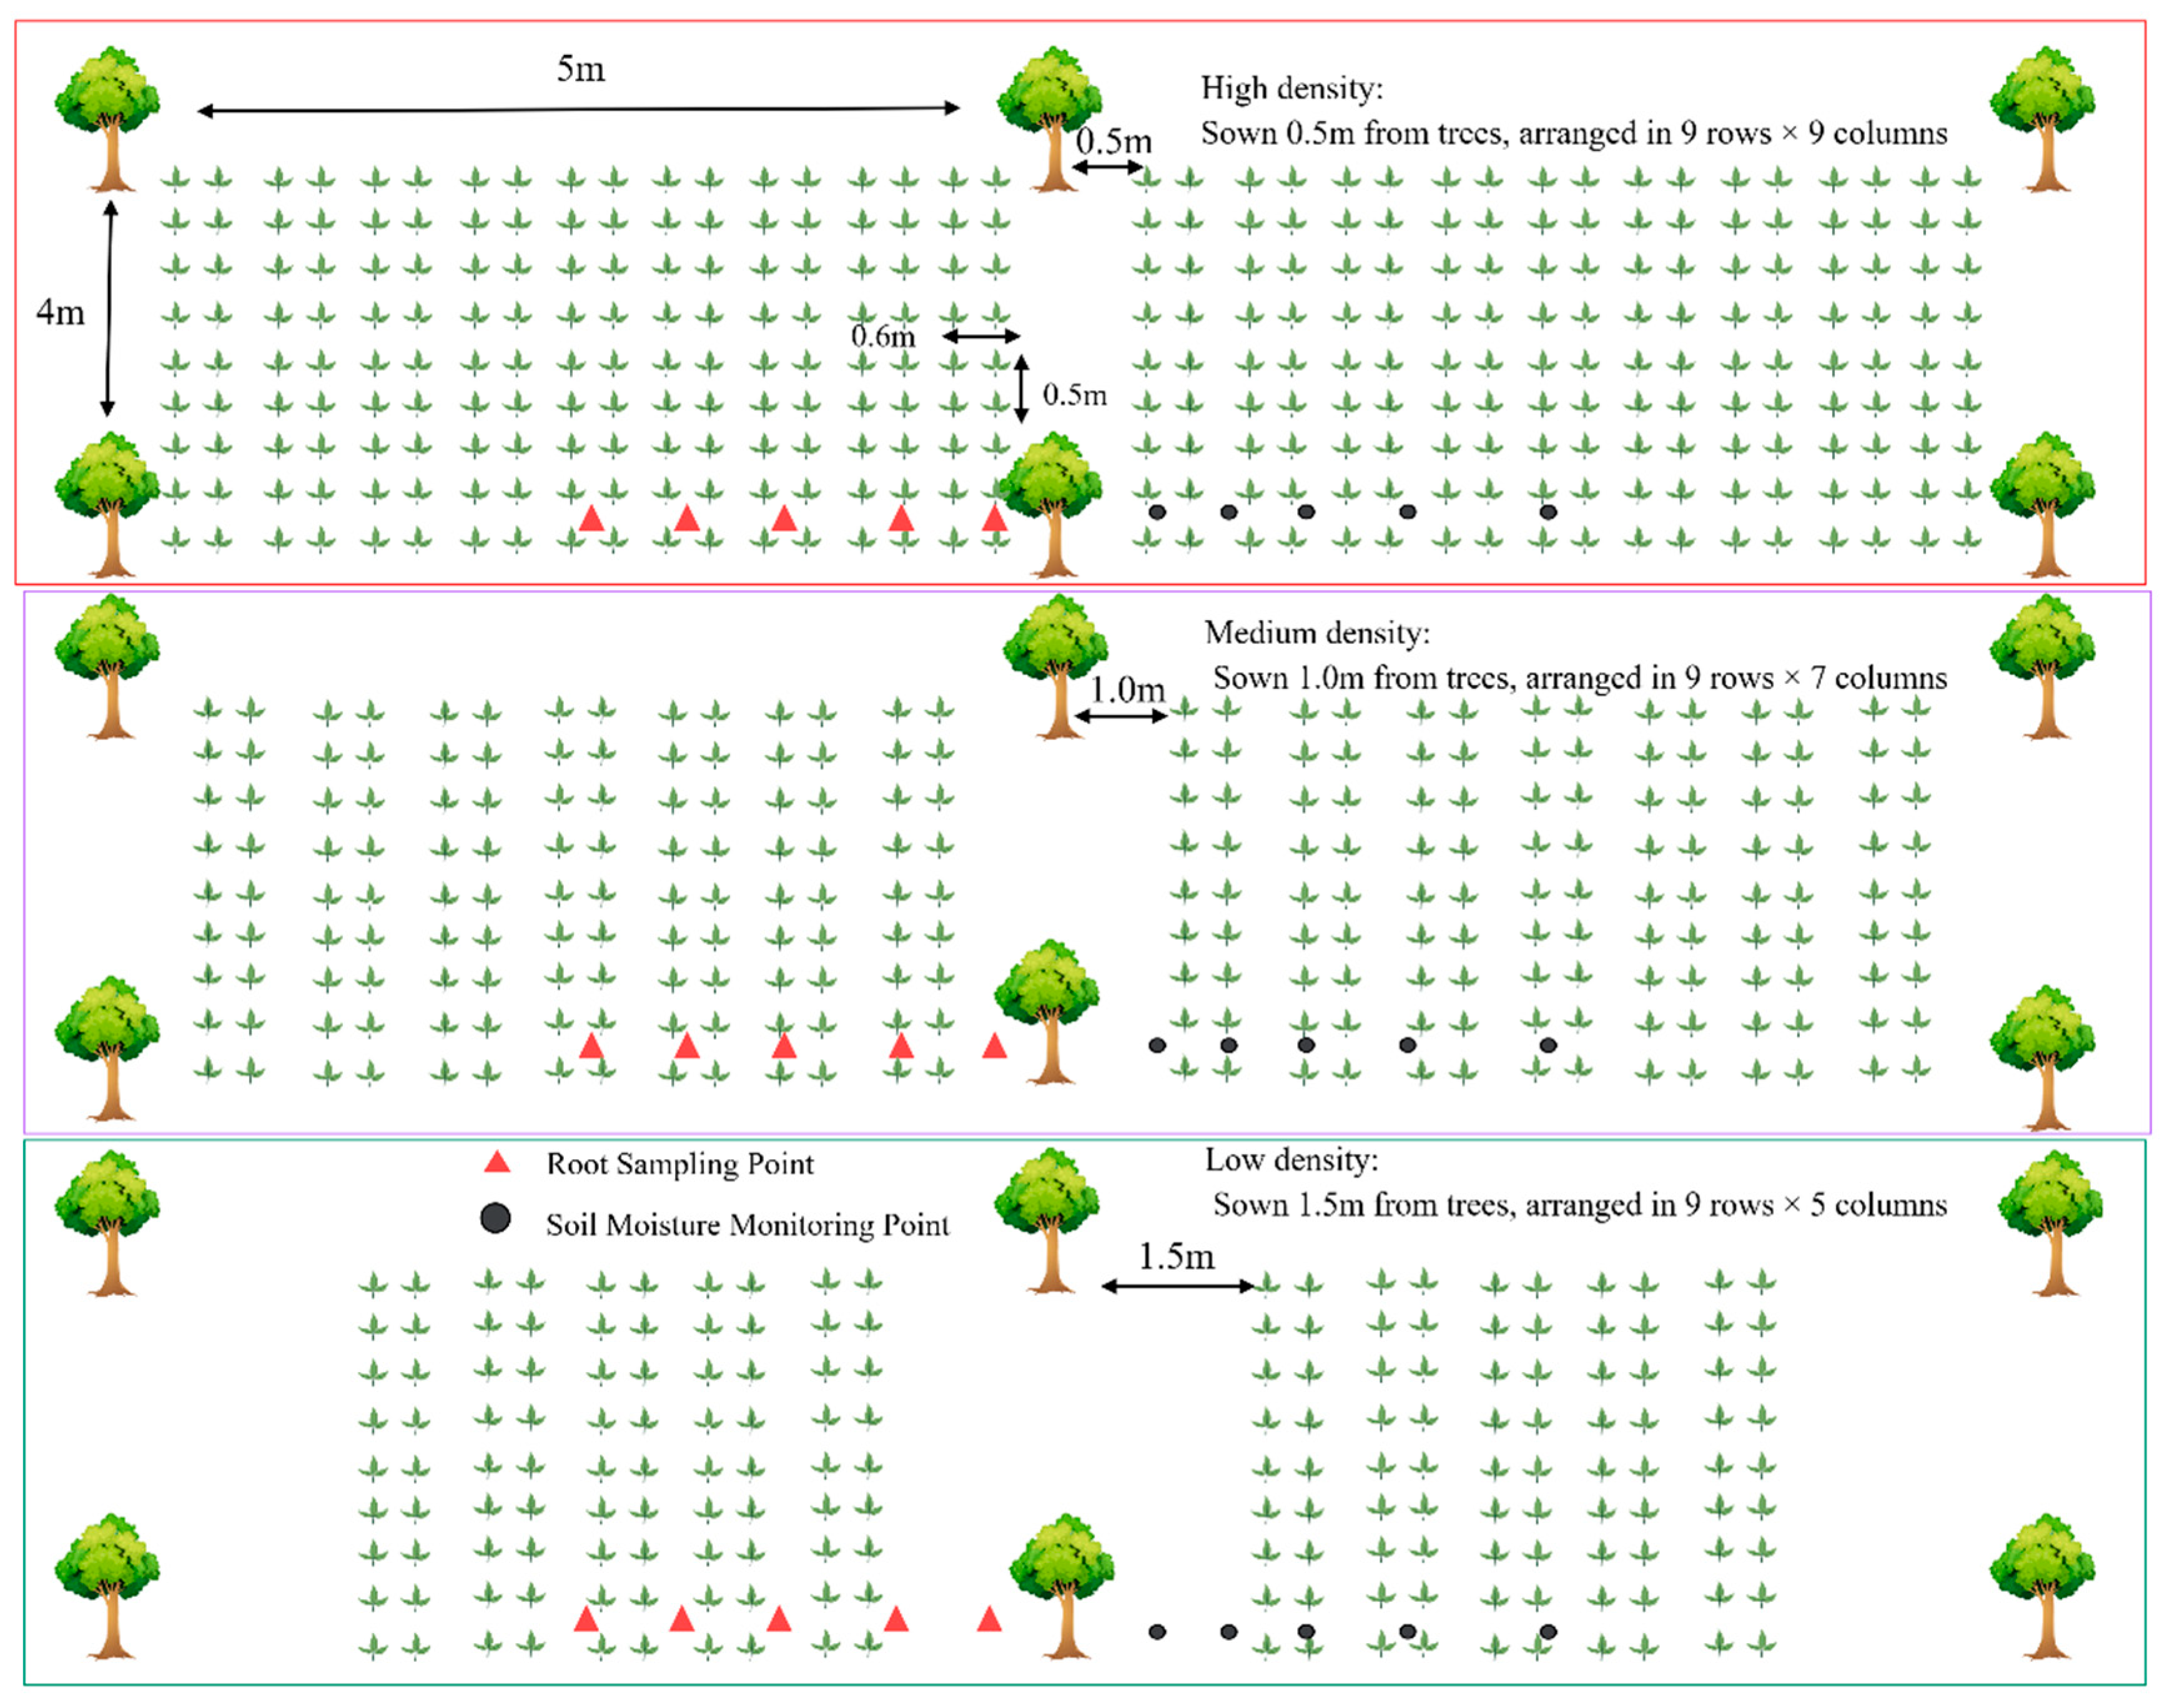
2.3. Experimental Design

The experiment was conducted from May to September 2024 as a two-factor trial involving different irrigation levels and peanut planting densities. Based on soil moisture ranges suitable for peanut and apple growth, two irrigation thresholds were established: the upper limit of irrigation was set at 85% (W1, high-water) and 65% (W2, medium-water) of field capacity (FC) averaged over the planned 60 cm wetting soil layer, with the irrigation depth uniformly maintained at 60 cm. Three density treatments included high density D1 (27,500 plants/ha), medium density D2 (18,333 plants/ha), and low density D3 (10,833 plants/ha). Black polyethylene mulch film with a width of 0.6 m was applied. Peanuts were sown manually with two seeds per hole in a double-row planting pattern. Standard field management practices were followed during the experiment, including regular pest and disease control.
The experiment comprised six treatment groups and three control groups as detailed in Table 1, with three replicates per treatment. All measurements followed a completely randomized block design, totaling 27 experimental plots. Given the overlapping growing seasons of apple and peanut (May–September) and their aligned phenological stages [23], irrigation was applied during three critical water-demand phases of peanut: flowering, pod-formation, and pod-filling. One irrigation event occurred per phenological stage during rain-free periods (>7 days without effective rainfall) using drip irrigation with flow meters controlling application rates. Soil moisture content was measured pre-irrigation to determine irrigation quotas based on the deficit between current and target moisture levels. One drip tape was deployed per peanut row at the mid-row position with 0.5 m spacing between tapes. Irrigation quotas were calculated using the dryland crop water allocation formula [24]:
W = 10 H γ ( θ w θ 0 )
where W represents the irrigation amount (mm), γ denotes the soil bulk density (g/cm3) in the planned wetting layer, H is the depth of the designed wetting layer (set at 0.6 m in this study), θw indicates the target gravimetric water content under pre-defined irrigation treatments, and θ0 signifies the measured gravimetric water content prior to irrigation implementation.
Prior to peanut sowing, compound fertilizer (N:P:K = 26:12:7) was manually applied as basal fertilizer at a uniform rate of 817 kg/ha across all plots. During peanut flowering, pod-formation, and pod-filling stages, fertigation was implemented synchronously with irrigation for all six experimental treatments (excluding CK control), applying one topdressing of compound fertilizer (N:P:K = 11:44:5) at 490 kg/ha. Fertilizer injection followed a 1/4–1/2–1/4 sequence [25]. The first quarter of fertilizer was delivered via clean irrigation water, the middle half was injected through open fertilizer tank valves, and the final quarter was flushed with clean water.

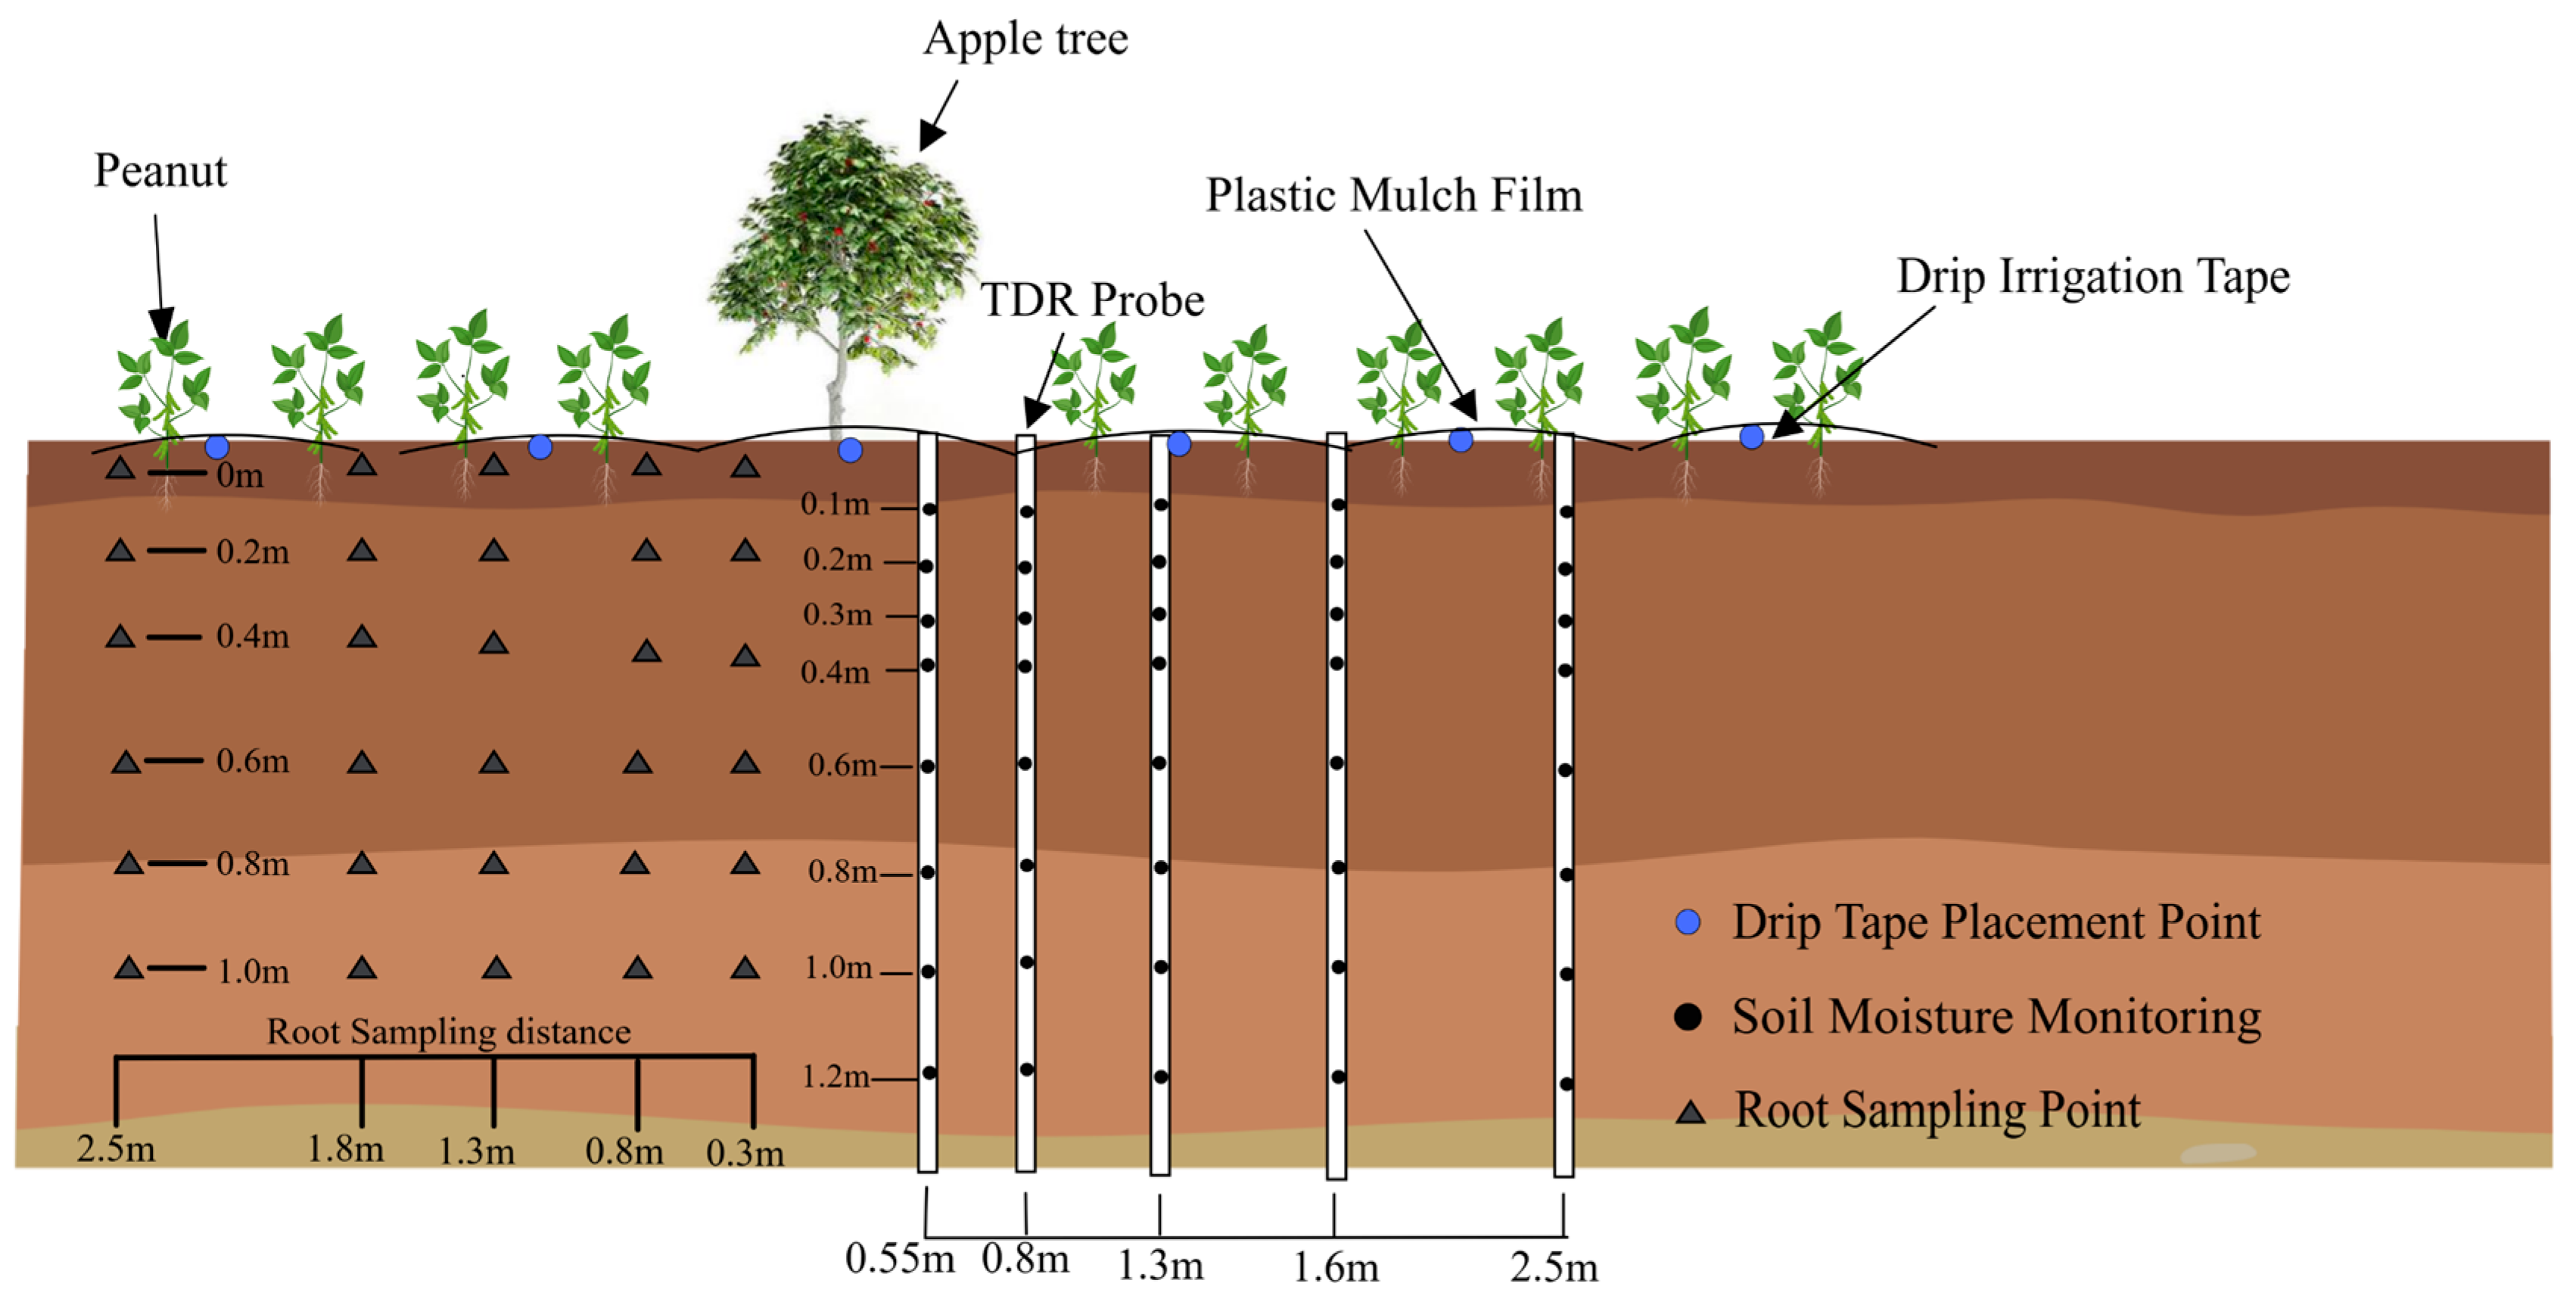
2.4. Measurement Items and Methods

2.4.1. Soil Moisture

Volumetric soil water content was measured using TDR probes (TRIME-PICO-IPH, IMKO, Germany) at monitoring points located 0.55, 0.80, 1.3, 1.6, and 2.5 m from apple tree rows (see Figure 3), with measurements taken at 10 depth intervals (0–10, 10–20, 20–30, 30–40, 40–60, 60–80, 80–100, and 100–120 cm) up to 120 cm depth. Post-sowing measurements occurred at 7-day intervals with additional readings after irrigation or rainfall events, calibrated using the gravimetric oven-drying method. Crop water consumption was calculated via the soil water balance equation:
E T = I + P + U R F ± Δ W
P = j = 1 n a j p j
where ET is the water consumption at the growth stage (mm), I represent the amount of irrigation at the growth stage (mm), P indicates effective precipitation (mm) calculated using empirical coefficients where pj is the precipitation amount of the j-th rainfall event (mm), j (j = 1,2,3, …, n) denotes rainfall occurrences, and aj is the utilization coefficient for the j-th rainfall: aj = 0 when pj < 5 mm; aj = 1 when pj = 5–50 mm; aj = 0.8–0.7 when pj > 50 mm [26]; U is the amount of groundwater recharge (mm); R is surface runoff (mm); F is the deep seepage (mm); and ΔW is the difference (mm) between the consumption of 0–120 cm of soil water storage at the beginning and the end of the growth stage. Since the terrain of the plot used in this test is flat, the surface runoff was considered to be zero. Groundwater recharge at the 30 m underground water depth is zero. Deep leakage is not considered in drip irrigation and is considered to be zero.

2.4.2. Water Use Calculation

W U E = G Y / E T
where WUE represents the water use efficiency of the crop in the orchard alley cropping system (kg ha−1 mm−1), GY denotes the sum of apple and peanut yields (kg/ha) within the alley cropping system, and ET signifies the total water consumption (mm) of the system.

2.4.3. Measurement of Comprehensive Physiological Indices in Alley Cropping System Crops

(1)
Soil Plant Analysis Development
SPAD-502 (Konica Minolta, Saitama, Japan) was used to determine relative soil–plant analysis development value (SPAD value) in the apple–peanut alley cropping system. For apple plants, during the three key growth stages of peanut (flowering, pod-formation, pod-filling), standard branches were selected from east, south, west, and north directions, with 3 plants per direction as replicates. For peanut plants, 3 rows were randomly selected in the central area of each treatment plot, consecutively marking 5 disease-free plants with robust growth per row as observation units. All measurements were conducted between 09:00 and 11:00 to minimize diurnal photosynthetic fluctuations. Measurements avoided midribs and targeted the distal third of leaf blades. Each leaf was measured three times, with the average value recorded as the SPAD representation.
(2)
Leaf Area Index (LAI)
LAI-2200 plant canopy analyzer measured fruit trees (canopy center + 0.8 m from trunk in east/south/west/north directions). Peanut measurements occurred at 0.3, 0.8, 1.3, 1.8, and 2.5 m from fruit trees.
(3)
Apple Shoot Growth and Peanut Plant Height
Apple shoot growth was measured with a tape measure from the branch fork to the parent stem (values averaged over repeated measurements). Peanut height was recorded from ground to apical meristem using the same plants selected for physiological measurements. Three height measurements per plant across growth stages were averaged.
(4)
Apple and Peanut Root Systems
Root samples were collected at 0.3, 0.8, 1.3, 1.8, and 2.5 m from trees at 20 cm-depth intervals (totaling 5 layers; see Figure 3). Roots were separated by species, cleaned, and analyzed using the WinRHIZO root scanning system for root length and surface area. Root biomass density was calculated as follows:
ρ = L / V
where ρ represents root length density (m/m3), L denotes the total root length within the soil volume (m), and V signifies the soil volume inside the root auger sampler (m3).
(5)
Yield
At maturity, all apple fruits within plots were harvested and weighed using an electronic balance (precision: 0.01 g) to record total fresh weight per tree, then converted to yield per unit area; for peanuts, 20 consecutive uniform plants were harvested from different positions relative to trees in each plot, with harvested kernels oven-dried at 75 °C to constant weight, cooled, and weighed; yield averages were standardized to per-hectare values, with the total alley cropping system yield calculated as the sum of apple and peanut yields.

2.5. Data Processing and Statistical Analysis

Experimental data were processed and calculated using Microsoft Excel 365 with graphical outputs generated in Origin 2024. Statistical analyses were performed in SPSS 27: interaction effects were assessed via two-way ANOVA testing water density interactions on all parameters; when either interaction or main effects reached significance (p < 0.05), Duncan’s Multiple Range Test (DMRT) was applied to means from three independent biological replicates for post hoc analysis controlling Type I error; principal component analysis (PCA) involved Z-score standardization of raw data followed by calculation of component scores in Origin 2024 to generate score and loading plots elucidating multidimensional variable relationships and sample clustering patterns; multiple regression modeling employed SPSS 27 with Z-score standardized data, with results visualized through Origin 2024.

3. Results and Analysis

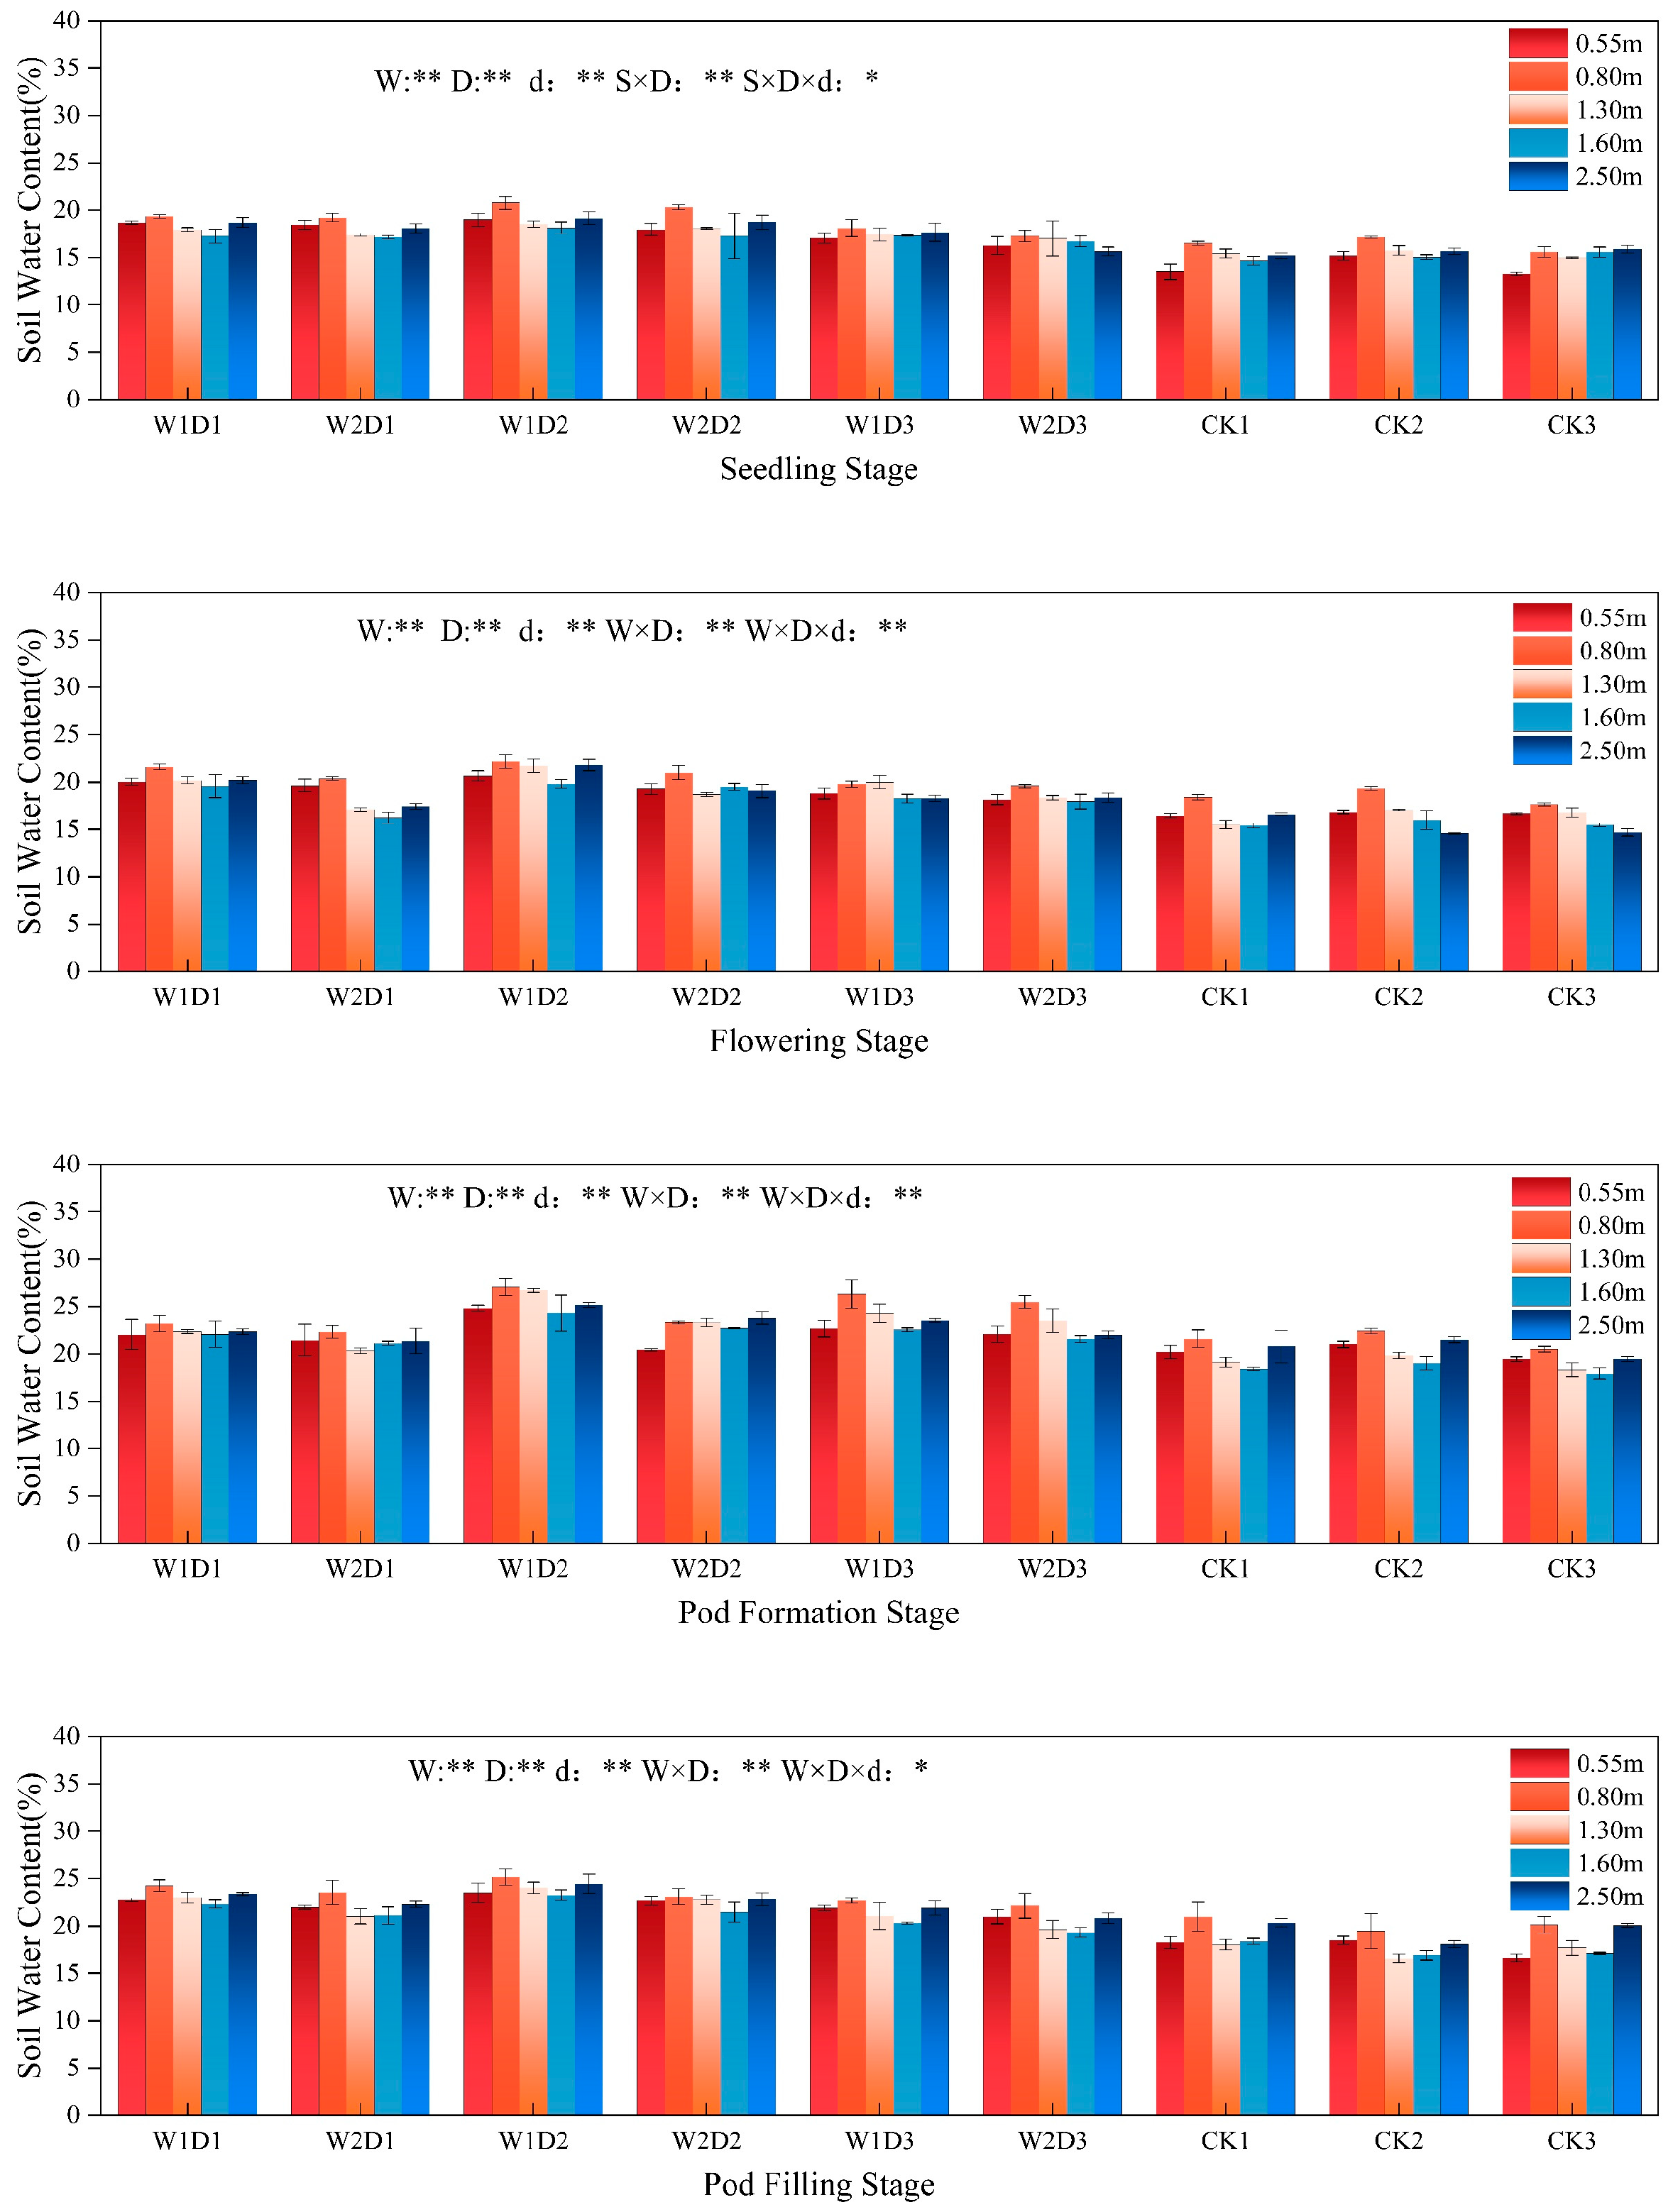
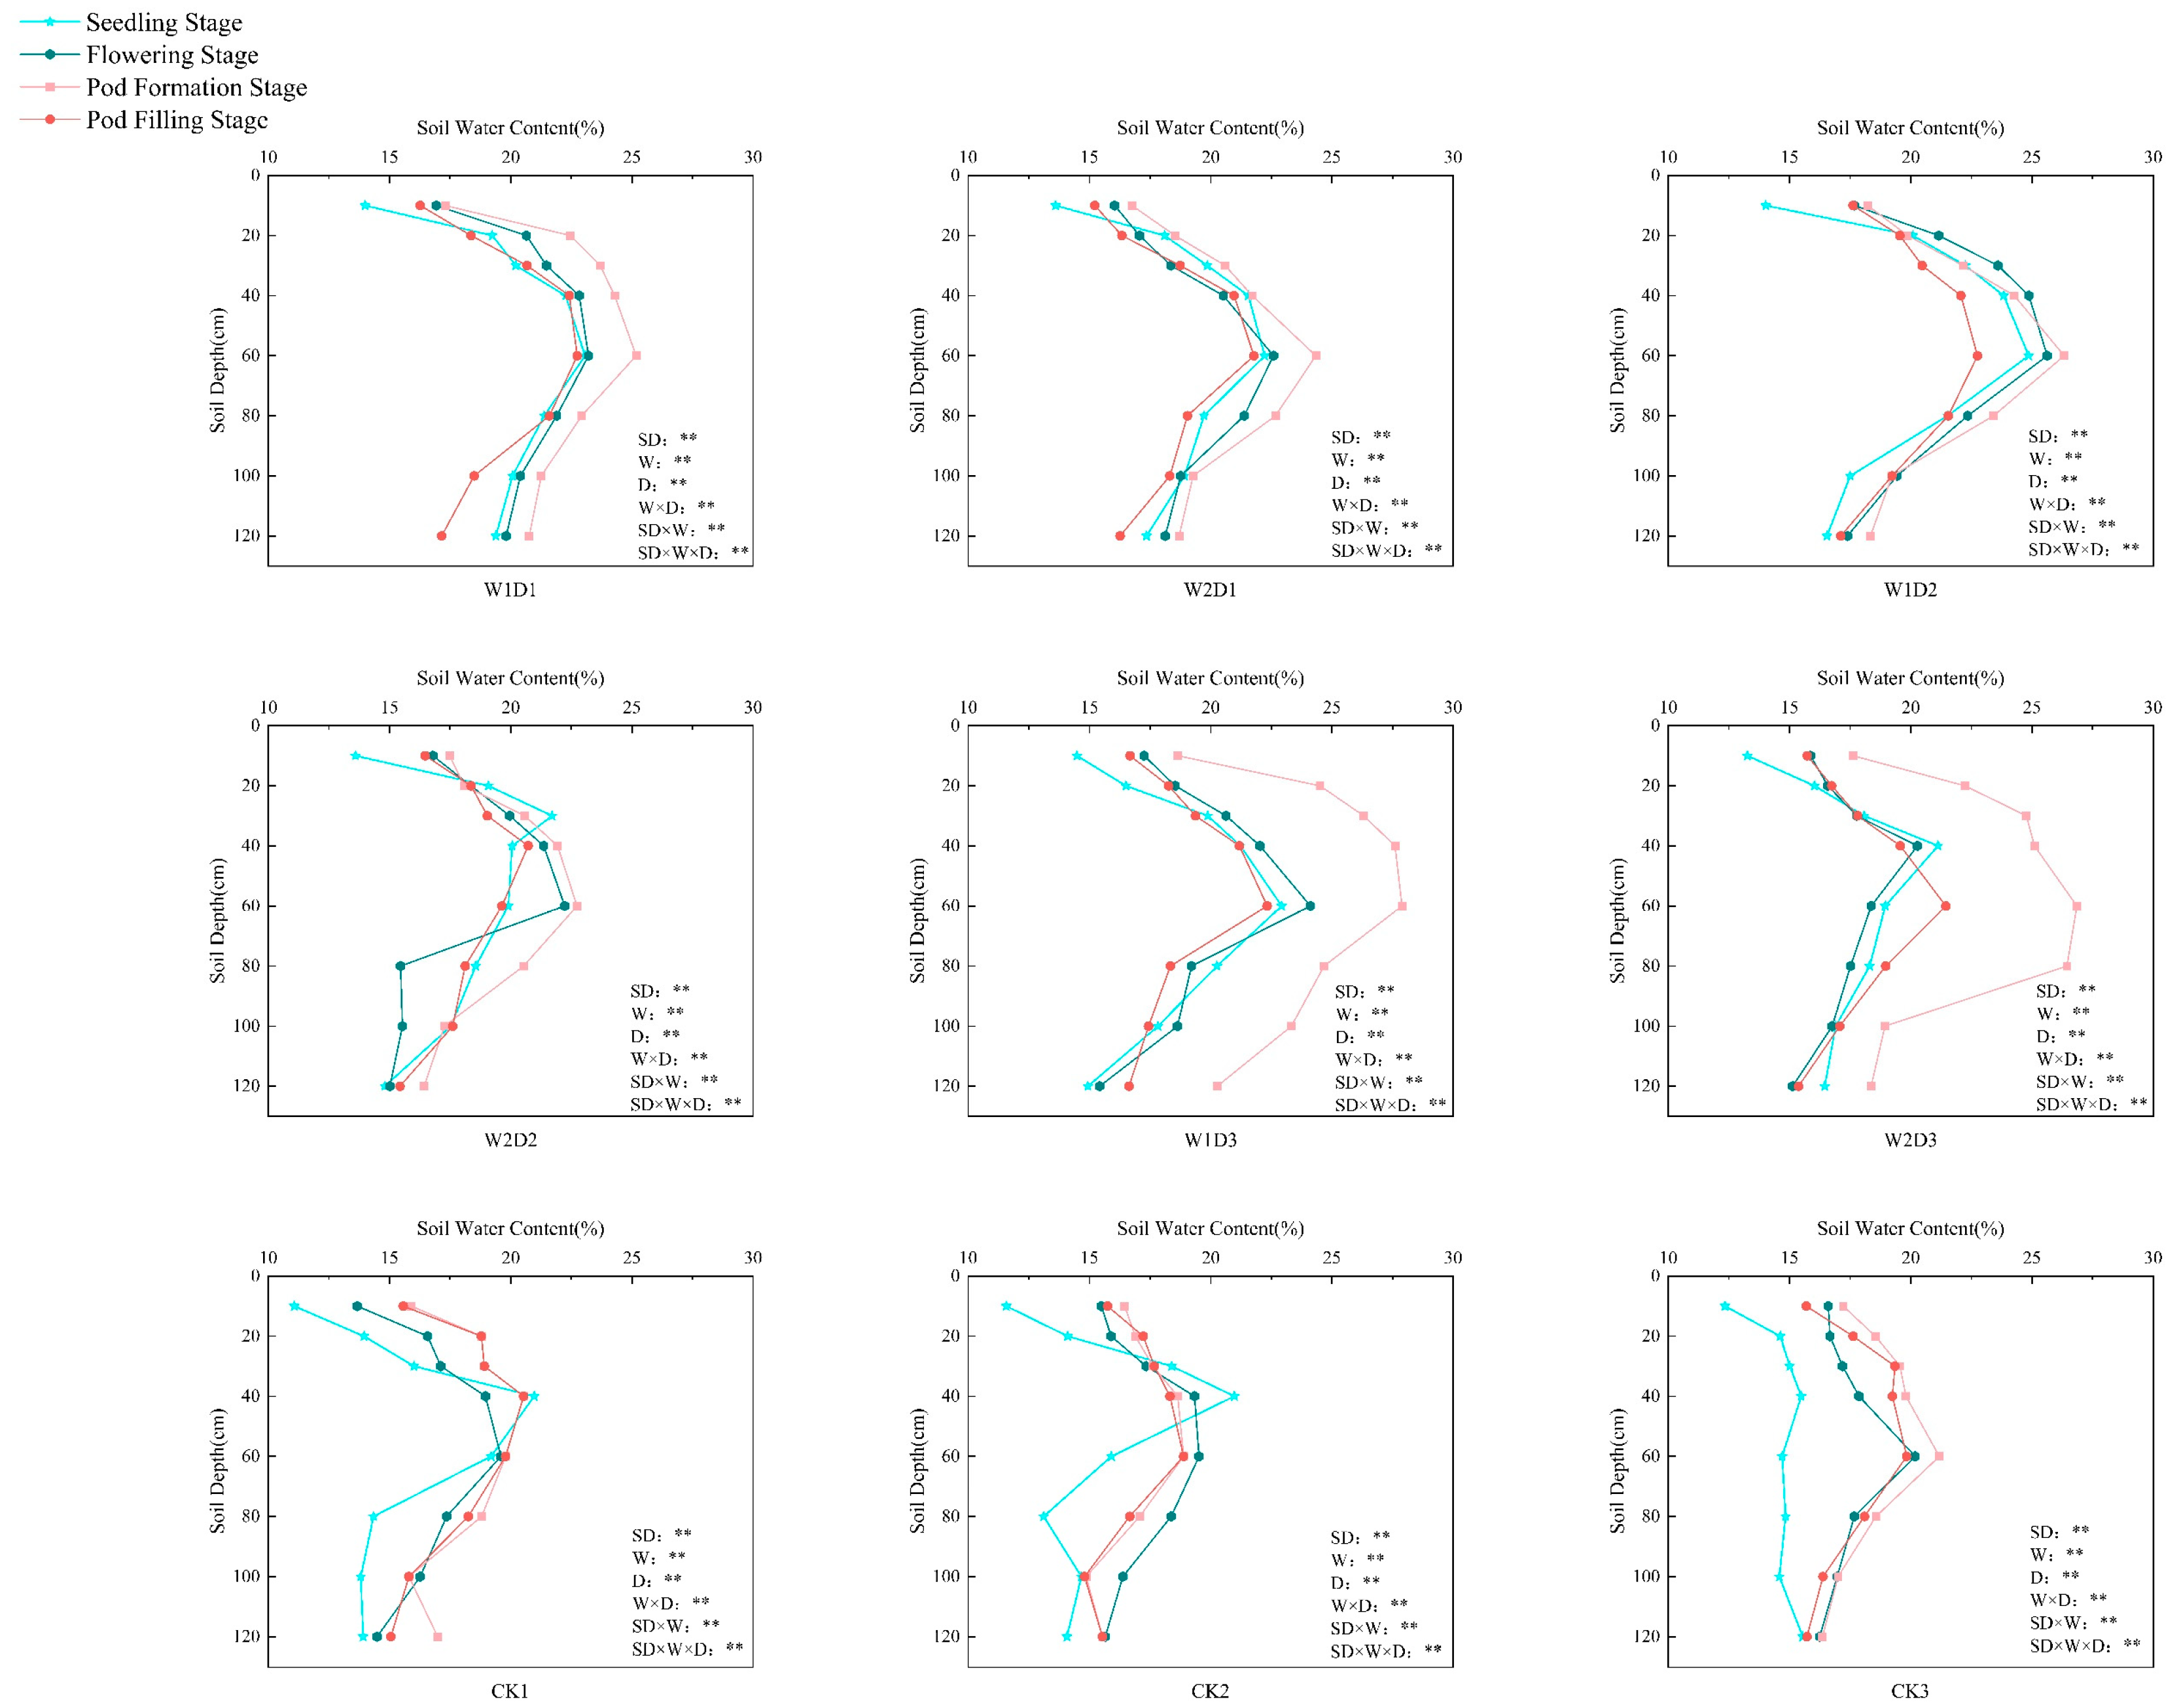
3.1. Effects of Intercropping Density and Water Regulation on Spatial Distribution of Soil Moisture Content

3.1.1. Horizontal Profile

Horizontally, Figure 4 reveals that soil moisture distribution across all intercropping treatments exhibited a dynamic pattern of increase–decrease–rise with increasing distance from apple trees, particularly pronounced during flowering and pod formation stages. Across irrigation gradients, peak moisture content consistently occurred at 0.80 m from trees (reaching 27.1%), while the minimum value was observed at 0.55 m (14.6%). Soil moisture content sequentially ranked as: pod-formation > pod-filling > flowering > emergence stages throughout the growing season. The W1D2 treatment maintained the highest moisture levels, exceeding other treatments by 25.6%~33.1%. During flowering under W1 irrigation, higher density enhanced moisture retention (D2 > D1 > D3); W1D1 treatment elevated moisture by 11.9%~23.4% versus other D1 treatments. Under identical densities during pod-formation, moisture increased with irrigation intensity (W1 > W2 > CK). In pod filling at D3 density, moisture rose by 7.6~21.0% and 2.5~15.5% versus CK. Irrigation treatments significantly enhanced soil moisture compared to non-irrigated controls throughout the season. ANOVA indicated: water regulation, density, and their interaction exerted highly significant effects on horizontal moisture distribution (p < 0.01); distance from trees significantly impacted moisture (p < 0.01); the three-way interaction (water × density × distance) was consistently significant during growth phases (p < 0.05).

3.1.2. Vertical Profile

Vertically, Figure 5 demonstrates that soil moisture content initially increased, then decreased during the growing season, peaking at the pod-formation stage. Across growth stages, moisture exhibited distinct trends with soil depth, generally rising through the 0–60 cm layer to reach maximum values. Inflection points predominantly occurred at 40–60 cm depth, followed by declining trends that stabilized at 100–120 cm. During emergence and flowering, moisture oscillated markedly within the 20–60 cm profile, with W1D2 treatment increasing moisture by up to 69.6% at 40–60 cm versus other treatments. At pod-formation under W1D3, the 40–60 cm layer recorded the seasonal maximum, exceeding other D3 treatments by 3.9–55.3%. Pod-filling stage showed declining moisture, lowest in surface layers but with treatment-specific variations; W1D2 significantly outperformed others, elevating moisture by up to 19.8%. Throughout the season, moisture increased with irrigation intensity while density exerted significant effects: at identical densities, W1 > W2, with pronounced fluctuations in 0–120 cm under D2/D3 densities. Control plots displayed an increase-decrease pattern with depth, converging at deeper layers. ANOVA confirmed: irrigation, density, and their interaction profoundly impacted vertical moisture (p < 0.01); soil depth and the three-way interaction (water × density × depth) also demonstrated highly significant effects (p < 0.01).

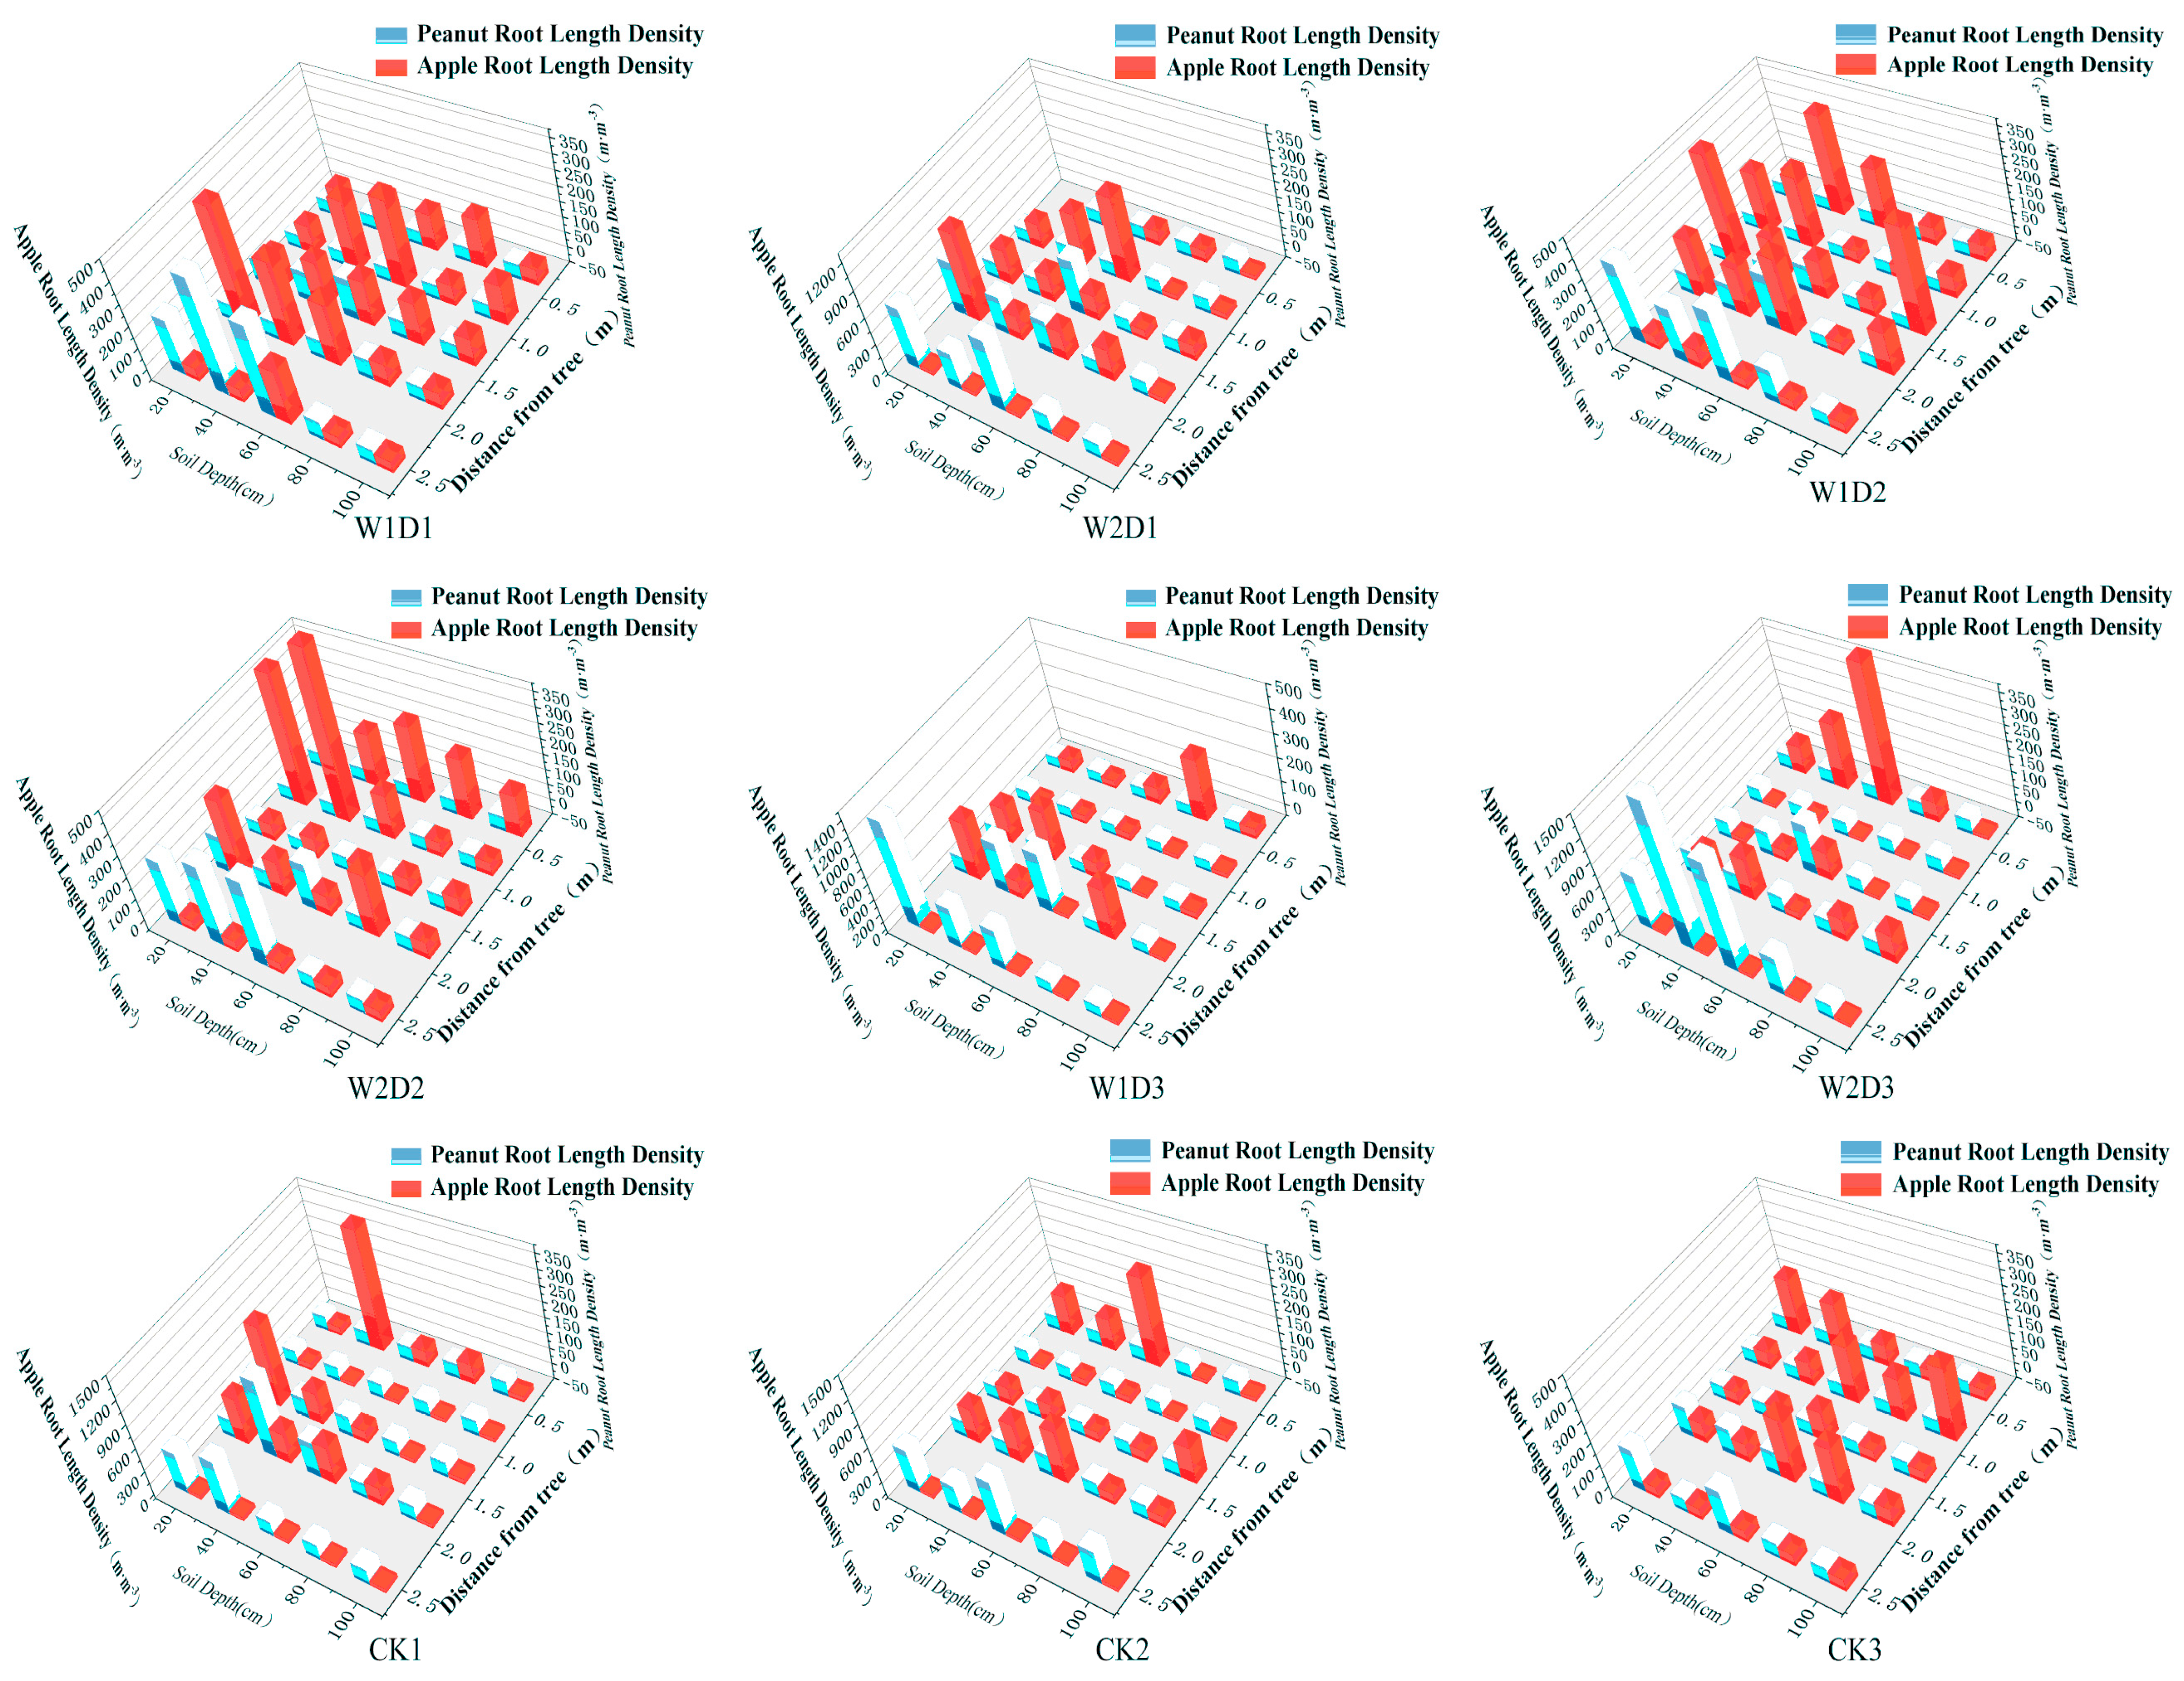
3.2. Effects of Intercropping Density and Water Regulation on Fine Root Distribution in Apple and Peanut

Apple root length density (RLD) spatial distribution (Figure 6) showed W2D3 and CK3 as treatments with maximum and minimum RLD, respectively. Apple RLD generally decreased with increasing irrigation, yet under identical densities, irrigated treatments increased mean RLD by 180.3% versus non-irrigated controls. Vertically, apple RLD declined with soil depth, concentrated within 0–60 cm; W1D1, W2D1, and W2D2 treatments showed peak concentration in 20–40 cm (73.8%, 67.0%, 88.1% of total 0–100 cm RLD). At 40–60 cm depth, W2D3 elevated RLD by 1234.7% versus CK3. Horizontally, apple RLD decreased with distance from tree rows, clustering within 0.5–2.0 m zones where irrigation significantly expanded distribution ranges. Peanut RLD spatial distribution (Figure 6) demonstrated 178.9–254.0% higher total RLD versus minimal CK3, with W2D3 as the peak treatment. Under identical densities, peanut RLD increased with irrigation intensity, whereas in controls it rose with density elevation; irrigated peanut RLD significantly exceeded non-irrigated levels. Vertically, peanut RLD decreased with depth, predominantly distributed at 40–60 cm (50.2–56.7% of 0–100 cm total). Horizontally, sparse peanut roots occurred at 0.3–1.3 m from trees, while dense concentrations emerged at 1.8–2.5 m (48.43–98.68% of total RLD per treatment).

3.3. Effects of Intercropping Density and Water Regulation on Physiological Growth in the Alley Cropping System

3.3.1. Soil–Plant Analysis Development Value

Table 2 displays the variation dynamics of SPAD content in apple and peanut under different water regulation and planting density regimes during the 2024 growing season. Both crops exhibited an initial increase followed by a decline in SPAD values across treatments, with the most rapid surge occurring at mid-growth stages before gradual decreases later. Apple SPAD peaked during fruit-setting stage > fruit-expansion stage > sprouting stage, while peanut followed flowering > pod-formation > pod-filling. Maximum SPAD values reached 62.75 (apple at fruit-setting) and 52.13 (peanut at pod-formation). Under identical densities, D2-density apples and peanuts demonstrated 3.5~12.0% and 6.4~12.7% higher SPAD values, respectively, than other irrigation groups throughout the season. During sprouting, W2D2-treated apple trees exhibited peak SPAD values, showing 5.4–11.2% enhancement relative to both D2-watered treatments and equivalent planting density controls (CK); at pod-formation, D2 peanuts increased SPAD by 6.6%~9.8% over other W2 treatments. Two-way ANOVA revealed: for apples, both water and density exerted highly significant effects on SPAD (p < 0.01), with their interaction being significant only during fruit-setting and expansion stages (p < 0.01); for peanuts, irrigation significantly impacted SPAD (p < 0.01), density affected all stages except flowering (p < 0.01), and water density interactions strongly influenced pod-formation and pod-filling SPAD (p < 0.01).

3.3.2. Leaf Area Index (LAI)

Table 3 indicates apple leaf area index (LAI) exhibited a consistent rise-decline pattern across growth stages, while peanut LAI demonstrated sustained increases throughout development. The W2D1 treatment achieved the highest mean LAI for both crops during the entire season. Peak apple LAI reached 4.30 at fruit-setting stage, whereas peanut peaked at 2.48 during pod-filling. At identical D1 density, fruit-setting apple LAI exceeded other irrigated-density treatments by 3.9~17.3% and showed a 44.8~63.7% increase against comparative benchmarks; fruit-expansion stage saw W2D1 elevate LAI by up to 240.1% versus controls. Under W2 irrigation, peanut LAI ranked D1 > D2 > D3, with pod-filling LAI increasing 53.9~76.5% over other irrigated treatments. Irrigation significantly enhanced LAI for both species: peanut LAI increased 98.3~122.2% versus the controls during the entire season, with maximum gains reaching 133.8~175.5%. Two-way ANOVA confirmed irrigation and density exerted highly significant effects on apple and peanut LAI (p < 0.01); their interaction significantly impacted the apple during sprouting and fruit-setting stages (p < 0.05), turning highly significant at fruit-expansion (p < 0.01). For peanut, interactions were highly significant at pod-formation and pod-filling but statistically insignificant at flowering (p > 0.05).

3.3.3. New Shoot Growth and Plant Height

Table 4 demonstrates that apple new shoot length and peanut plant height increased throughout the growing season, peaking during fruit-expansion and pod-filling stages. Among treatments, W1D3 achieved maximal shoot length in apples, while W1D2 yielded the highest peanut height. During apple fruit-setting, W1D3 increased length by 6.5–30.6% versus other W1 treatments and by up to 75.6% against controls; at fruit-expansion, D3-density groups elevated length by 31.3–40.2% and 8.7–16.1% compared to D1 groups and D3-density controls, respectively. For peanuts, flowering-stage height peaked at 26.59 cm under W1D2 (7.0–45.4% vs. irrigated treatments; 56.2–87.5% vs. controls), while at pod-formation, W1D2 enhanced height by 5.6–30.2% versus D3 groups and by 35.1–43.4% against same-density controls. During pod-filling, peanut height under W1 irrigation ranked D2 > D3 > D1, with D2 treatments increasing by 33.0–43.8% and 25.2–35.3% versus irrigation and control groups. Two-way ANOVA confirmed: irrigation and density significantly affected apple shoot elongation (both p < 0.01), with density exerting stage-independent significance; irrigation and water density interaction profoundly impacted peanut height (p < 0.01), particularly at pod-filling (p < 0.01); water density interactions significantly affected both crops throughout the season (p < 0.01).

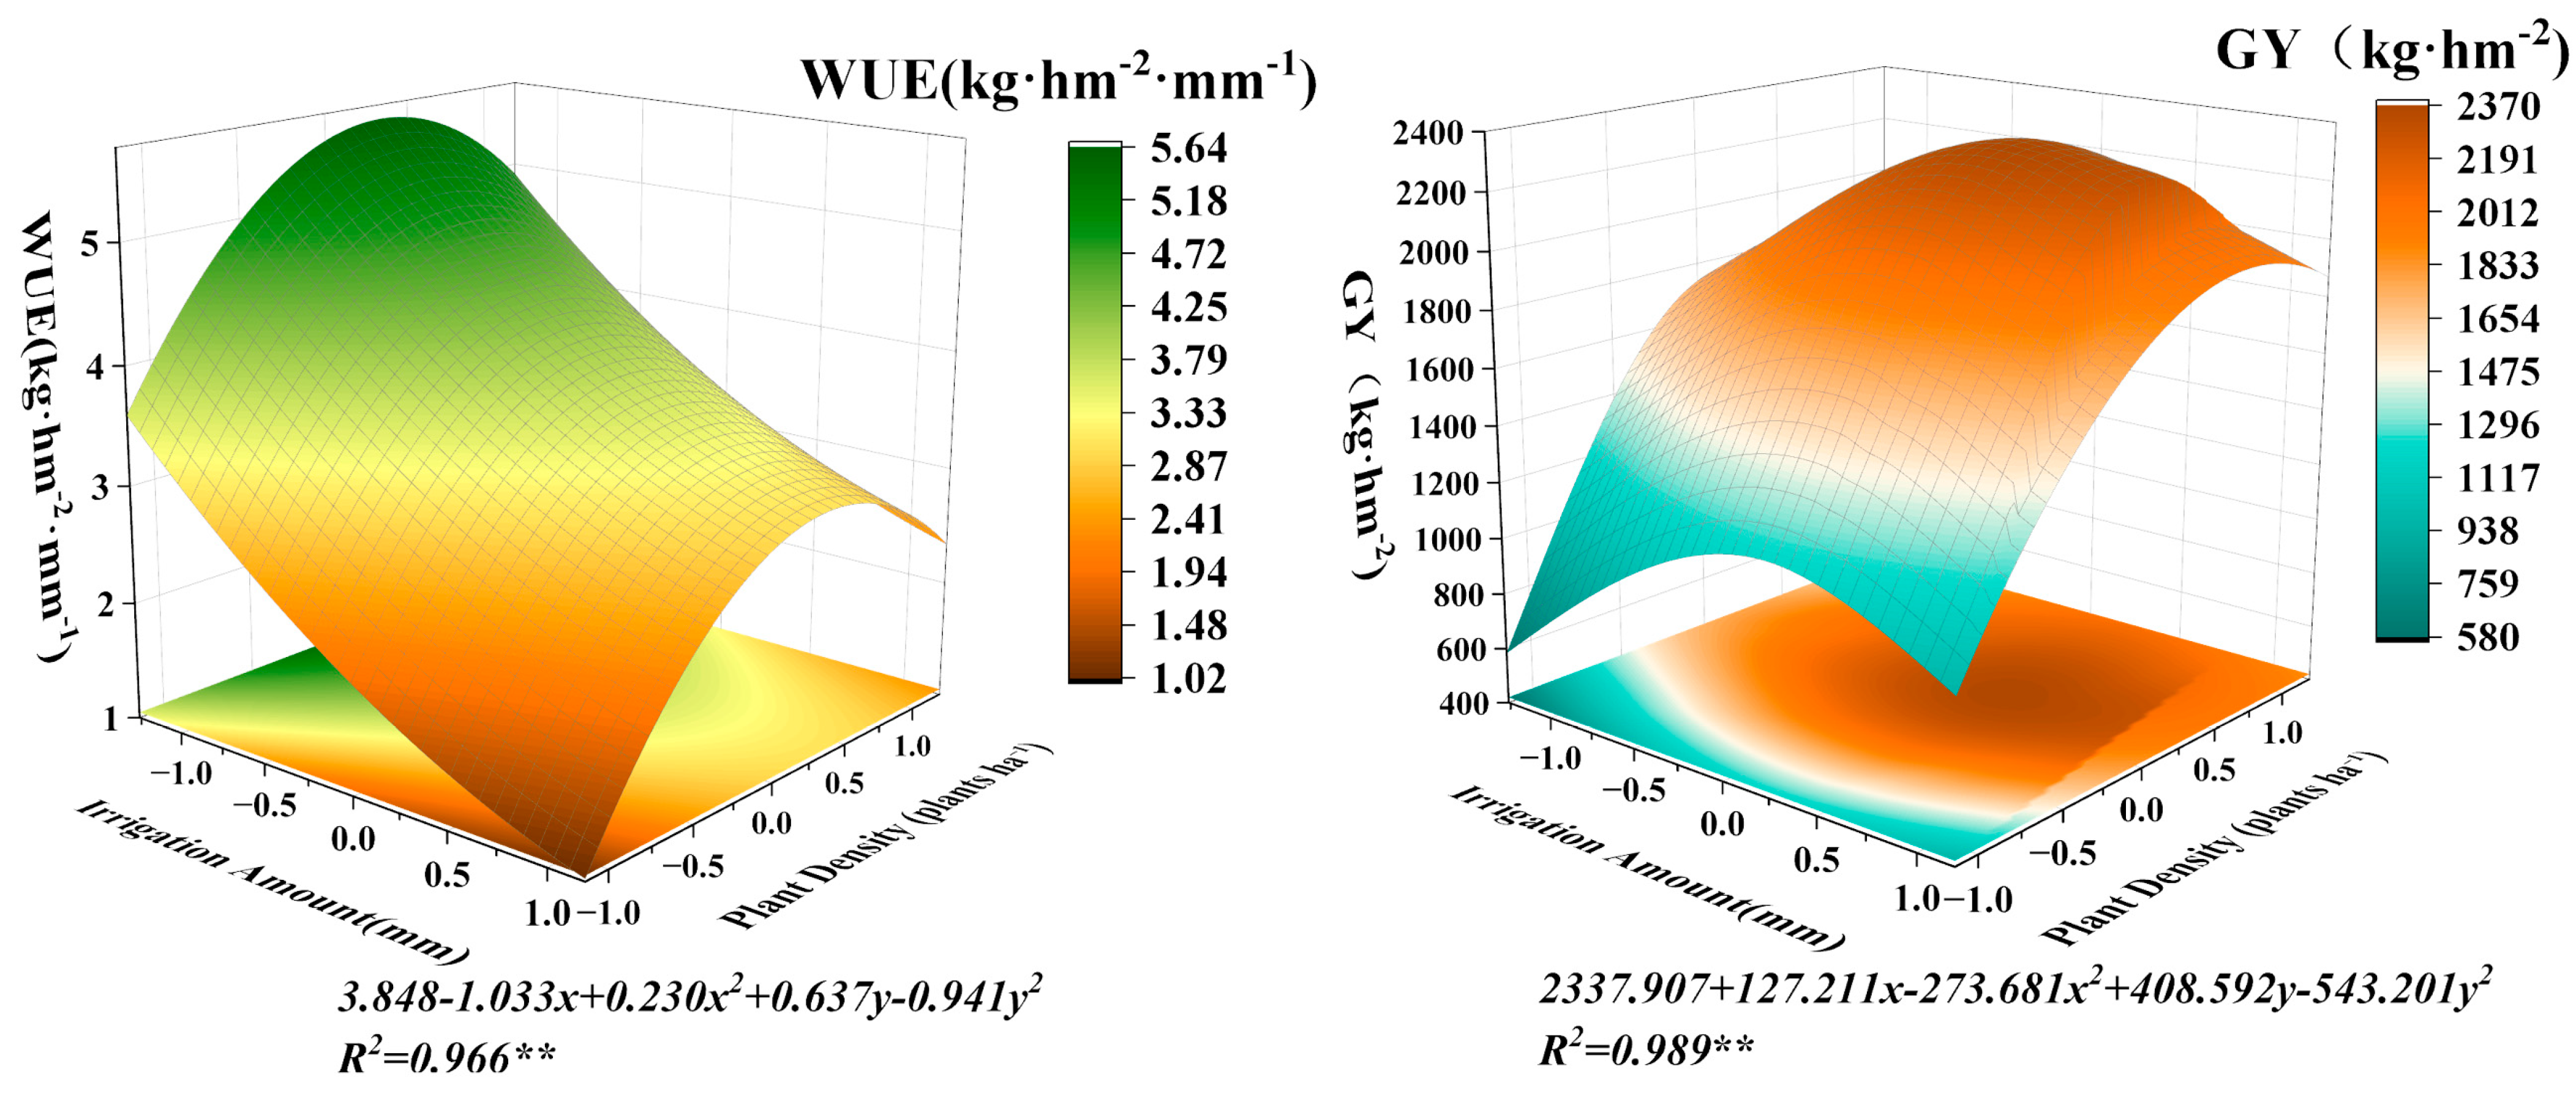
3.4. Effects of Water Regulation and Planting Density on Apple–Peanut Yield and Water Use Efficiency

Table 5 indicates that irrigation and density treatments significantly affected peanut yield. The maximum and minimum apple yields were observed in the W2D2 and CK3 treatments, respectively. The W2D2 treatment increased yield by 4.9% to 36.2% compared to other treatments. Irrigation universally enhanced peanut yields, though yield performance varied among densities (D1/D2/D3) under different irrigation levels; W1 and W2 treatments substantially exceeded controls. Peak peanut yield emerged under W2D2 (14.7–21.1% vs. other D1-density irrigated treatments). In the controls, peanut yield followed medium > high > low density. Alley cropping system water consumption peaked at 931.03 mm (W1D3) and minimized at 275.47 mm (CK3), increasing with irrigation intensity (W1 > W2). Water use efficiency (WUE) was maximized under W2D2 and minimized under W1D3. ANOVA confirmed: irrigation, density, and their interactions profoundly impacted apple and peanut yields (p < 0.01); irrigation dominated system water consumption effects (surpassing density and interaction influences), though density also exerted significant effects (p < 0.05). Irrigation and density similarly demonstrated highly significant effects on system WUE (p < 0.01), with their interaction also being highly significant (p < 0.01).

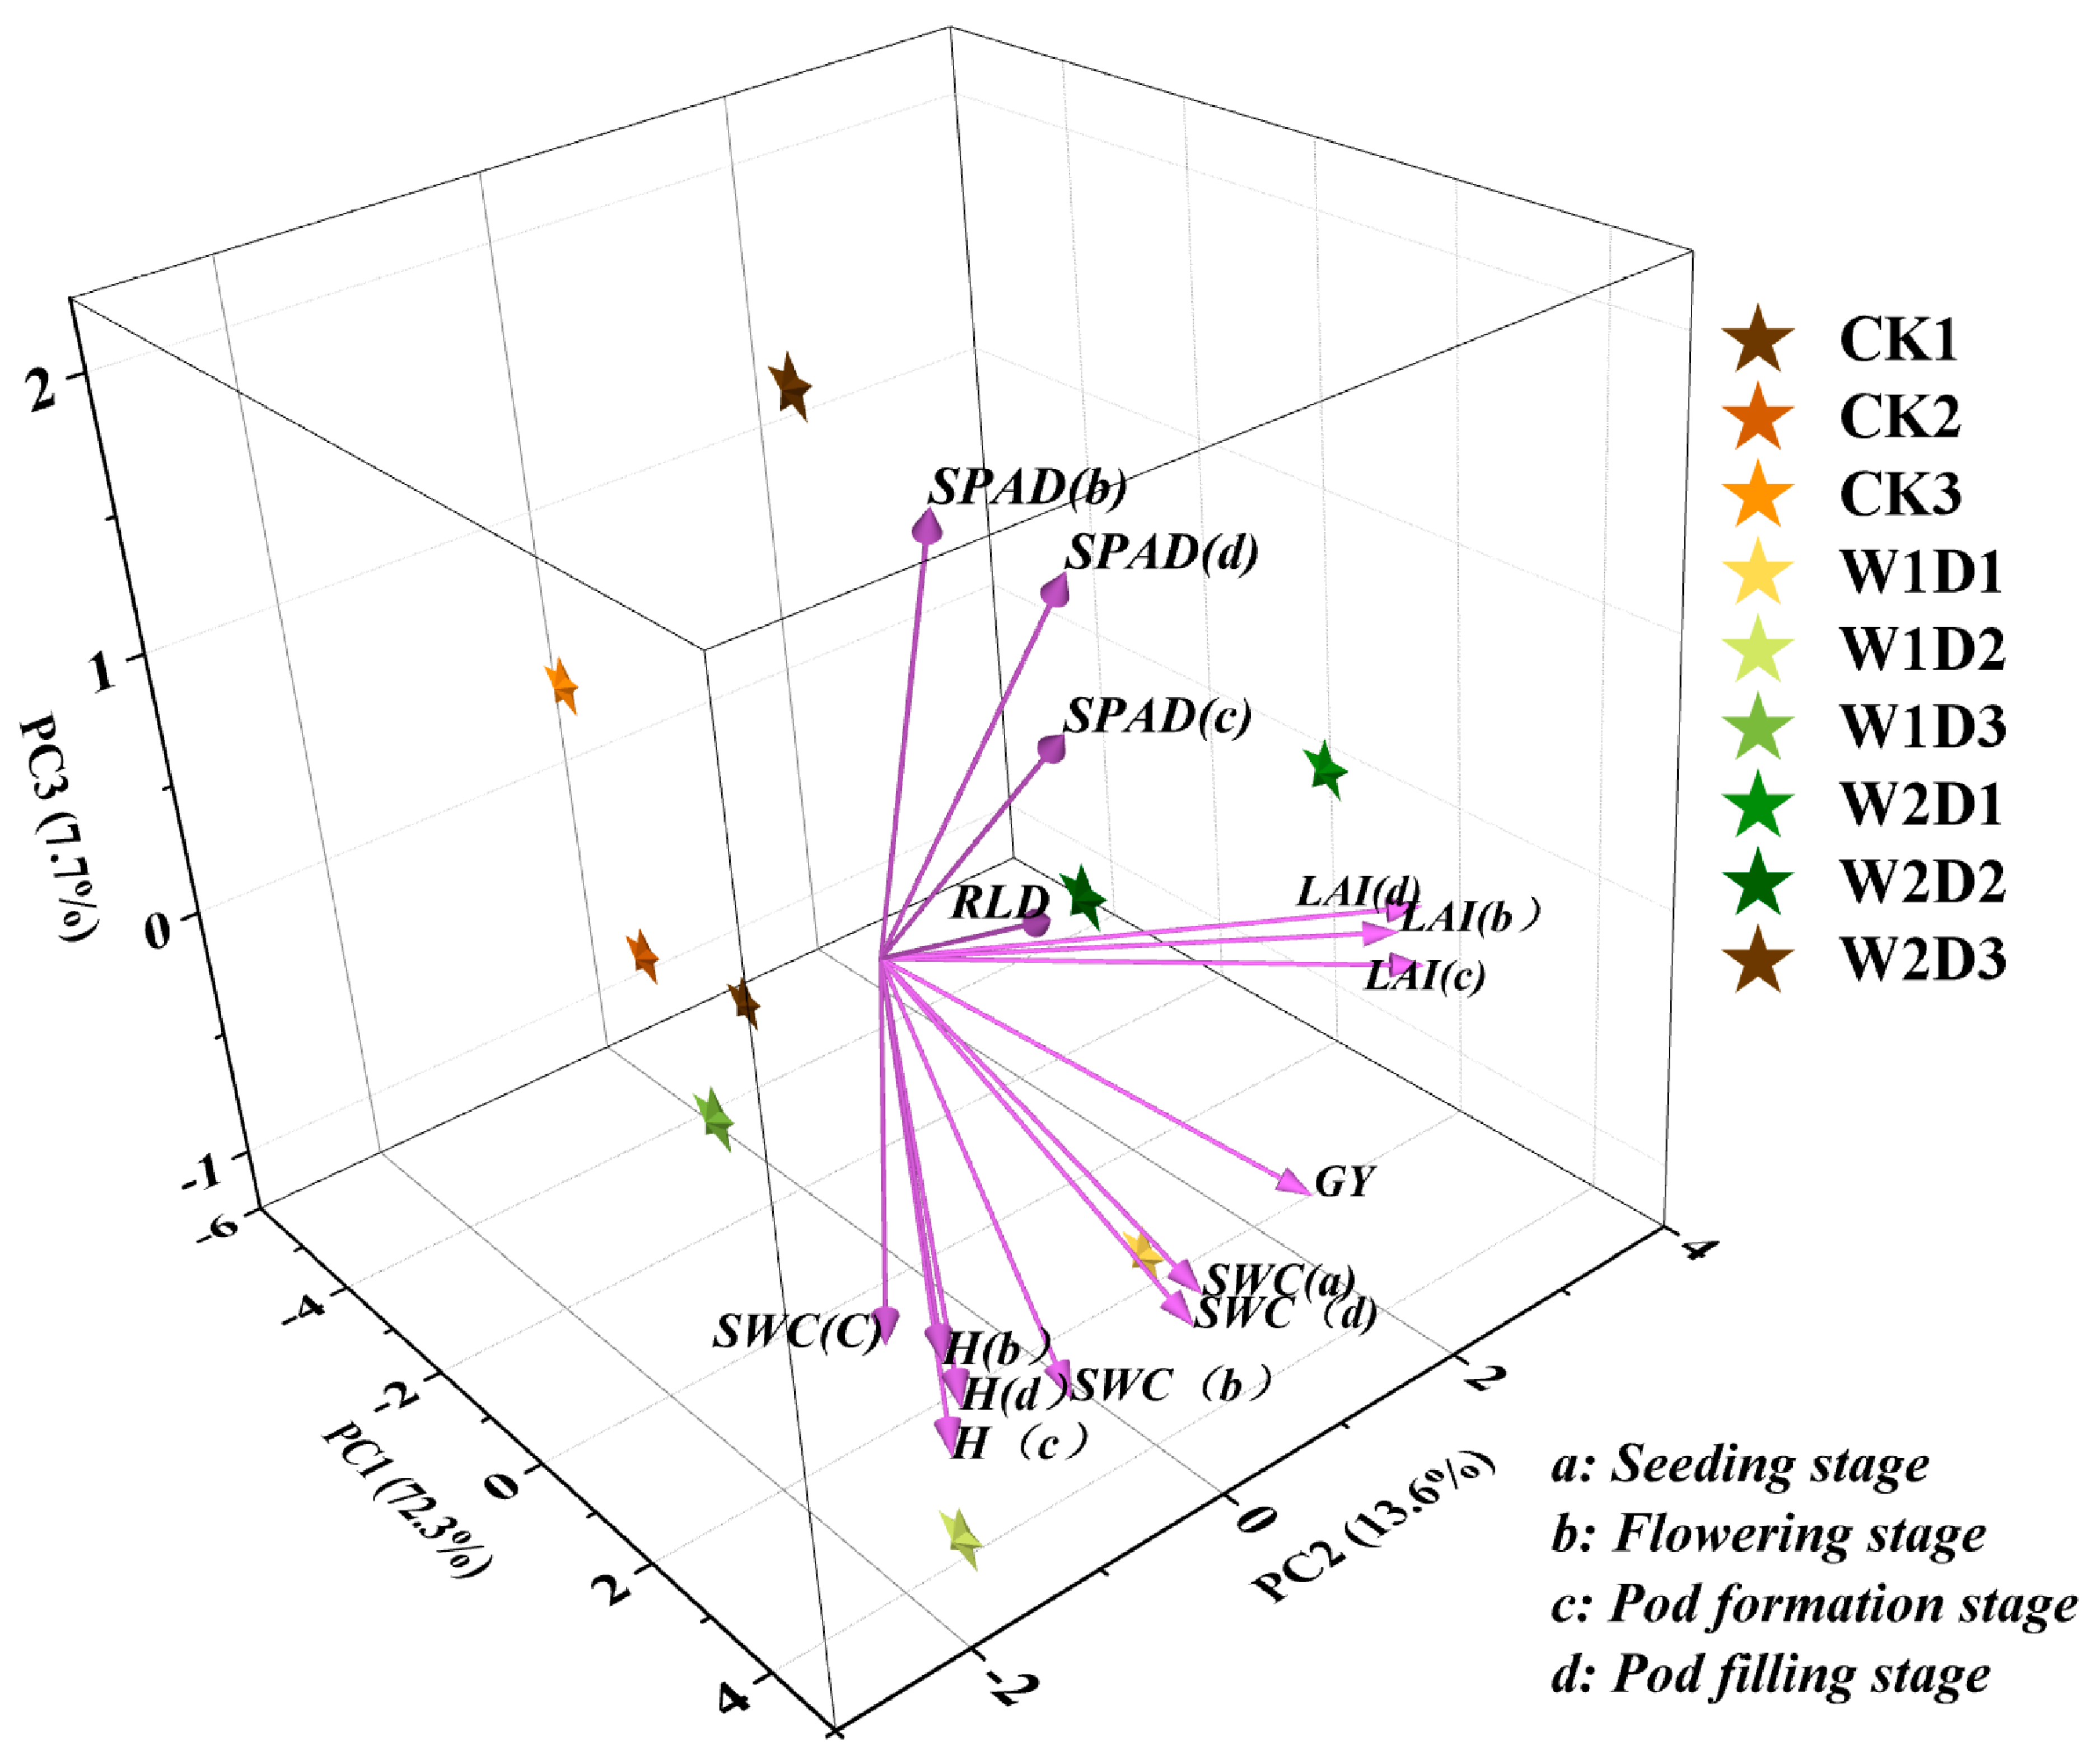
3.5. Comprehensive Benefits and Regression Analysis of the Alley Cropping System

Principal component analysis (PCA) was conducted using apple–peanut alley cropping system parameters—SWC, peanut H (plant height), LAI (leaf area index), GY (yield), RLD (root length density), and SPAD (soil–plant analysis development value)—to assess the comprehensive benefits under water density regulation. As illustrated in Figure 7, PC1, PC2, and PC3 explained 72.3%, 13.6%, and 7.7% of total system variance, respectively, cumulatively exceeding 90% explanatory power; thus, these three components were used as composite variables for benefit evaluation. Comprehensive scores across treatments (Table 6) revealed that system performance under different water density regimes exhibited divergent trends with increasing irrigation and density, peaking under W2 irrigation and D2 density (maximum score), while CK3 yielded the minimum score. Under identical irrigation, medium density (D2) consistently outperformed high and low densities; medium-density controls also surpassed high- and low-density control groups. Non-linear multiple regression results (Figure 8) modeled relationships among peanut yield, water use efficiency (WUE), water consumption, and planting density after data standardization. Regression equations indicated maximum peanut WUE and yield of 5.64 kg ha−1 mm−1 and 2370 kg ha−1. The W2D2 treatment achieved the fitted yield maximum and reached 63.9% of the regressed WUE peak. For a given density, WUE decreased with increasing irrigation, while yield declined with rising irrigation intensity under identical density levels. Figure 8 illustrates regression equations relating irrigation amount, planting density, water use efficiency (WUE), and yield.

4. Discussion

4.1. Effects of Water Regulation and Planting Density on Soil Moisture and Root Distribution

This study revealed distinct spatial variations in soil moisture under different water density regimes. Horizontally, soil moisture content initially increased then decreased with increasing distance from tree rows, peaking at 0.80 m and reaching minima at 0.55 m. observed similar parabolic soil moisture patterns in apple–soybean alley cropping systems in western Shanxi, corroborating our findings [27]. Within 0.55 m of the trees, soil water content is generally low, possibly caused by apple root extension and non-concentrated root distribution at close distances; near the trees (0.55~1.30 m), soil water content is significantly higher than at 1.6~2.5 m. The reason may be due to apple tree root growth and concentrated root distribution of apple trees in this area (Figure 6). Therefore, based on the findings of this experiment, it is recommended to plant peanut rows within the range of 0.55~1.30 m, which can more effectively utilize soil moisture within a limited space. Vertically, moisture increased to 60 cm depth before declining, stabilizing below 100–120 cm. This profile reflects fine root stratification—both crops concentrate roots within 0–60 cm, creating overlapping absorption zones, This moisture distribution pattern enables peanuts to effectively utilize reserved water in the 0–60 cm soil layer during critical growth stages, but may intensify the risk of late-stage water stress due to deep-layer water competition, particularly in drought years. Water regulation and density exhibited highly significant interactive effects (p < 0.01). At identical densities, moisture increased with irrigation intensity (W1 > W2 > CK), while fixed irrigation showed D2 > D1 > D3. It is noteworthy that in the non-irrigated control treatments with three different densities, soil moisture content in the low-density treatment was lower than in the high-density treatment. This may be attributed to the weakened canopy shading effect of peanuts under low-density conditions, which resulted in increased absorption of solar radiation at the soil surface, subsequently leading to intensified evaporation of surface soil moisture [28]. Conversely, high-density treatments effectively suppressed evaporation by forming dense canopies, a phenomenon particularly prominent under rainfed conditions [29].
This study found that factors that influenced different planting densities, the root length density of peanuts in the alley cropping system generally showed an increasing trend with rising density. Under identical densities, root length density overall increased with irrigation amount, and under control treatments, peanut root length density exhibited an increasing trend with rising density. Influenced by irrigation, fine roots of apple were mainly distributed in the 0–60 cm soil layer, while fine roots of peanut were mainly distributed in the 40–60 cm soil layer. Due to the strong wetting capacity of drip irrigation under film on the surface soil, the soil moisture distribution in the surface layer was increased, thus promoting root growth in the 0–60 cm alley cropping system. Overall, under water and density regulation, soil moisture in the alley cropping system was significantly affected by the root distribution of apple and peanut, exhibiting a decrease with increasing distance from the tree row horizontally, and an initial increase followed by a decrease with increasing depth vertically. Therefore, the results demonstrate that the drip irrigation under plastic film mulching treatment in this experiment can effectively enhance both root length density and soil moisture content in the alley system [30].

4.2. Effects of Water Regulation and Planting Density on Apple and Peanut Physiological Growth

SPAD in both crops increased under water density treatments versus controls, with W2D2 demonstrating superior enhancement during mid-late growth stages. Higher SPAD values indicate enhanced nutritional value, particularly nitrogen content [31]. Increased planting density reduced peanut SPAD values due to mutual shading-induced photosynthetic inhibition and leaf thickness reduction, contrasting with Zhang et al. [32] who reported higher SPAD in dense stands—a discrepancy potentially attributable to varietal differences in shade tolerance. Irrigation significantly elevated SPAD, confirming water’s critical role in SPAD. Leaf area index (LAI) exhibited unimodal curves peaking at mid-season, with W2D1 achieving maximum mean peanut LAI. Density responses followed D2 > D1 > D3 across irrigation levels, aligning with Huang et al. [33]. However, even with a higher leaf area index (LAI), excessively high planting density may lead to shading of lower leaves, thereby reducing photosynthetic efficiency. Additionally, the leaf area index of peanuts in all film-mulched treatments was consistently higher than in non-mulched treatments. This could be due to the fact that film mulching effectively reduces evaporative loss of soil moisture, adjusts soil temperature, and improves light-use efficiency. Consequently, it enables peanuts to enter the peak growth period more rapidly and accumulate greater leaf area earlier [34]. The findings of this study reveal that irrigation significantly improves peanut SPAD values and leaf area index (LAI). Planting density also shows substantial effects, where moderate density (D2) cultivation effectively enhances both SPAD and LAI. However, excessive planting density (D3) intensifies inter-plant competition for light, space, and nutrients, ultimately leading to the suppression of these growth parameters.
Rational spatial configuration can promote effective competition among crop populations to exploit interspecific complementarity [35,36,37]. Apple shoot growth and peanut plant height were significantly affected by water and density. Apple shoot growth showed a continuous increasing trend throughout the growth period, with W1D3 yielding the highest mean value and CK1 the lowest. This is primarily because sufficient irrigation effectively promotes nutrient transport and absorption in fruit trees in arid regions [38], ensuring trees maintain high photosynthetic efficiency and nutrient uptake capacity during the growth period, thereby driving continuous shoot elongation; whereas under non-irrigated conditions, tree growth is suppressed, with significantly reduced growth rates [39]. Plant height variation serves as an important indicator for measuring crop growth speed and can reflect crop growth status to some extent [40]. In this experiment, the peanut plant height continuously increased during the growth period, reaching its maximum at the pod-filling stage. Under W2 conditions influenced by irrigation and density, peanut plant height ranked as W2D2 > W2D1 > W2D3. This phenomenon may result from intensified intraspecific competition with increasing density: high-density planting may cause intense intraspecific competition where limited growing space leads to insufficient light and nutrient competition [41], thereby affecting plant height growth; however, its dense root system enhances absorption efficiency, promoting plant height growth [42]. Conversely, reduced intraspecific competition under low density fails to fully utilize water and fertilizer resources, resulting in slower plant height increase that is insufficient to fully realize its growth potential.

4.3. Effects of Water Regulation and Planting Density on Water Use and Comprehensive Benefits in Apple and Peanut

Intercropping alters plant physiological traits and root exudation characteristics [43]. Crop yields are influenced by planting density, and enhancing individual plant development to boost yield constitutes a key research focus in agriculture. Zhen Zhigao et al. demonstrated that medium density (180,000 plants/ha) yielded the highest output for Yuhua 37 peanut, followed by low density (165,000 plants/ha), then high density (210,000 plants/ha), aligning with our findings [44]. Apple and peanut yields responded significantly to irrigation and density: under identical densities, peanut yield decreased with increasing irrigation. This may result from poor soil aeration under high irrigation, causing root hypoxia and restricted oxygen supply; excessive irrigation may also leach nutrients (particularly N, P, and K) from the soil [45]. This experiment confirmed significant effects of irrigation and density on yield components: coupling effects between irrigation gradients and densities profoundly regulated peanut yield (p < 0.01), with W2 (medium irrigation) and D2 (medium density) achieving peak yield (2380.39 kg/ha)—248.6% higher than the lowest treatment. Identical densities significantly increased peanut yield versus controls; water stress critically impacted apple yield, where optimal irrigation increased production while excessive application reduced output.
This study found that water use efficiency (WUE) in the alley cropping system was significantly influenced by yield and water consumption. Specifically, under high water consumption conditions, a decline in intercropping system yield leads to reduced WUE, whereas increased yield substantially enhances WUE, as evidenced by our experimental results. Unlike monoculture systems, enhanced WUE in intercropping relies not only on optimizing water use in individual crops but also on interspecific interactions reconstructing the yield-water consumption relationship. Under W1 and W2 irrigation levels, the D2 group exhibited significantly higher WUE than D3 with increasing planting density. This may result from medium density (D2) optimizing canopy light distribution and root architecture, thereby reducing soil evaporation while improving water capture efficiency. For instance, during the pod-filling stage, leaf area index (LAI) under W1D2 and W2D2 treatments increased by 17.9% and 22.4%, respectively, compared to W1D3 and W2D3. Although the W1 treatment demonstrated a yield-increasing trend, its higher water consumption resulted in reduced water use efficiency (WUE). Consequently, this trade-off necessitates careful consideration in water-limited regions. Additionally, yield influences contributed to this pattern: lower water consumption in D2 treatments enabled significantly higher yields versus D3, aligning with previous research [46].
The PCA revealed distinct clustering patterns across three principal components: PC1 was primarily driven by soil water content (SWC), PC2 by leaf area index (LAI) reflecting canopy structure regulation, and PC3 was dominated by SPAD values indicating leaf nitrogen status. This clustering pattern demonstrates that the system’s productivity is governed by a tripartite ‘water–light–nitrogen’ regulation mechanism, with the W2D2 treatment showing balanced development across all three dimensions, confirming its optimal performance (Figure 7). Thus, W2D2 represents the optimal combination under various water density conditions. This study established optimal regression equations for water density patterns; multiple regression analysis (Figure 8) indicated that peanut yield under W2D2 treatment reached the theoretical maximum. Yield per unit area increased with rising density but decreased significantly beyond a threshold, aligning with previous research [47]. When peanut planting adopted 0.5 × 0.6m spacing with seven columns and nine rows (density: 18,333 plants/hm2) and irrigation amount reached 747 mm, water use efficiency achieved 100% of the regressed maximum.

5. Conclusions

This study investigated an apple–peanut intercropping system under different water regulation and planting density conditions. By analyzing the variations in soil water content (SWC), yield, and physiological growth indicators, we found that the interaction between water and density significantly regulated system productivity. The results demonstrated that the W2D2 treatment (moderate irrigation at 65% field capacity + peanut planting density of 18,333 plants/ha) significantly improved SWC, SPAD, LAI, and GY compared to other treatments and the control. Therefore, we recommend adopting moderate irrigation (W2) combined with moderate planting density (D2) to achieve optimal benefits. However, since the experiment was based on single-year data, the long-term adaptability of this model to multi-year climate variations, soil nutrient cycling, and interspecies competition dynamics requires further validation through continuous field monitoring. Future studies should integrate multi-growth-stage field experiments with model simulations to comprehensively evaluate the stability of this model under both drought and wet years.

Author Contributions

Conceptualization, F.Y. and R.W.; methodology, F.Y.; software, X.Z.; validation, H.Z., L.W. and S.J.; formal analysis, Q.R.; investigation, R.W.; resources, R.W.; data curation, B.Z.; writing—original draft preparation, F.Y.; writing—review and editing, F.Y.; visualization, C.X.; supervision, F.Y.; project administration, F.Y.; funding acquisition, R.W. All authors have read and agreed to the published version of the manuscript.

Funding

This research was funded by the National Natural Science Fund (32271960) and the National Key Research and Development Program of China (2022YFE0115300).

Data Availability Statement

The data presented in this study are available on request from the corresponding author. The data are not publicly available due to ethical restrictions.

Acknowledgments

We are grateful for the support from the Forest Ecosystem Studies, National Observation and Research Station, Jixian, Shanxi, China.

Conflicts of Interest

The authors declare no conflicts of interest.

References

  1. Xiao, G.J.; Zhang, F.J.; Qiu, Z.J.; Yao, Y.B.; Wang, R.Y.; Huang, J.Y. Response to climate change for potato water use efficiency in semi-arid areas of China. Agric. Water Manag. 2013, 127, 119–123. [Google Scholar] [CrossRef]
  2. Zhang, Y.; Zhao, X.L. Dynamic Evaluation and Analysis on Ecosystem Service Value in the Loess Plateau. Res. Soil Water Conserv. 2018, 25, 170–176. [Google Scholar]
  3. Wang, C.; Liu, X.F. Spatial pattern, tradeoffs and synergies of ecosystem services in loess hilly region: A casestudy in Yuzhong County. Chin. J. Ecol. 2019, 38, 521–531. [Google Scholar]
  4. Cong, W.F.; Hoffland, E.; Li, L.; Six, J.; Sun, J.H.; Bao, X.G.; Zhang, F.S.; van der Werf, W. Intercropping enhances soil carbon and nitrogen. Glob. Change Biol. 2015, 21, 1715–1726. [Google Scholar] [CrossRef]
  5. Wang, J.; Guo, J.L. The Correlation Between Soil Temperature and Water Content During the Natural VegetationRestoration on the Loess Plateau. J. Soil Water Conserv. 2022, 36, 130–137. [Google Scholar]
  6. Zheng, C.H.; Wang, R.S.; Zhou, X.; Li, C.N.; Dou, X.Y. Effects of mulch and irrigation regimes on water distribution and root competition in an apple-soybean intercropping system in Loess Plateau, China. Agric. Water Manag. 2021, 246, 106656. [Google Scholar] [CrossRef]
  7. Dou, X.; Wang, R.; Zhou, X.; Gao, F.; Yu, Y.; Li, C.; Zheng, C. Soil water, nutrient distribution and use efficiencies under different water and fertilizer coupling in an apple-maize alley cropping system in the Loess Plateau, China. Soil Tillage Res. 2022, 218, 105308. [Google Scholar] [CrossRef]
  8. Ren, Y.; Liu, J.; Wang, Z.; Zhang, S. Planting density and sowing proportions of maize-soybean intercrops affected competitive interactions and water-use efficiencies on the Loess Plateau, China. Eur. J. Agron. 2016, 72, 70–79. [Google Scholar] [CrossRef]
  9. Zhou, X.; Wang, R.S.; Gao, F.; Xiao, H.J.; Xu, H.S.; Wang, D.M. Apple and maize physiological characteristics and water-use efficiency in an alley cropping system under water and fertilizer coupling in Loess Plateau, China. Agric. Water Manag. 2019, 221, 1–12. [Google Scholar] [CrossRef]
  10. Zheng, H.; Hou, H.; Wu, J.; Tian, D.; Miao, P. Irrigation Schedule Optimization for Wheat and Sunflower Intercropping under Water Supply Restrictions in Inner Mongolia, China. Atmosphere 2024, 15, 566. [Google Scholar] [CrossRef]
  11. Yang, C.H.; Chai, Q.; Huang, G.B. Root distribution and yield responses of wheat/maize intercropping to alternate irrigation in the arid areas of northwest China. Plant Soil Environ. 2010, 56, 253–262. [Google Scholar] [CrossRef]
  12. Dai, H.; Wang, R.; Chen, L.; Wang, L.; Xiong, C.; Wang, X.; Zhang, M. Effects of Different Micro-Irrigation Methods on Water Use and the Economic Benefits of an Apple-Soybean Intercropping System. Agronomy 2023, 13, 1143. [Google Scholar] [CrossRef]
  13. Wolz, K.J.; DeLucia, E.H. Alley cropping: Global patterns of species composition and function. Agric. Ecosyst. Environ. 2018, 252, 61–68. [Google Scholar] [CrossRef]
  14. Yang, H.; Chai, Q.; Yin, W.; Hu, F.; Qin, A.; Fan, Z.; Yu, A.; Zhao, C.; Fan, H. Yield photosynthesis and leaf anatomy of maize in inter- and mono-cropping systems at varying plant densities. Crop J. 2022, 10, 893–903. [Google Scholar] [CrossRef]
  15. Wang, Q.; Sun, Z.; Bai, W.; Zhang, D.; Zhang, Y.; Wang, R.; Van der Werf, W.; Evers, J.B.; Stomph, T.-J.; Guo, J.; et al. Light interception and use efficiency differ with maize plant density in maize-peanut intercropping. Front. Agric. Sci. Eng. 2021, 8, 432–446. [Google Scholar] [CrossRef]
  16. Fan, Z.; Zhao, Y.; Chai, Q.; Zhao, C.; Yu, A.; Coulter, J.A.; Gan, Y.; Cao, W. Synchrony of nitrogen supply and crop demand are driven via high maize density in maize/pea strip intercropping. Sci. Rep. 2019, 9, 10954. [Google Scholar] [CrossRef]
  17. Zegada-Lizarazu, W.; Kanyomeka, L.; Izumi, Y.; Iijima, M. Pearl millet developed deep roots and changed water sources by competition with intercropped cowpea in the semiarid environment of northern Namibia. Plant Prod. Sci. 2006, 9, 355–363. [Google Scholar] [CrossRef]
  18. Yang, B.; Meng, X.; Singh, A.K.; Wang, P.; Song, L.; Zakari, S.; Liu, W. Intercrops improve surface water availability in rubber-based agroforestry systems. Agric. Ecosyst. Environ. 2020, 298, 106937. [Google Scholar] [CrossRef]
  19. Shen, L.; Wang, X.; Liu, T.; Wei, W.; Zhang, S.; Zhu, Y.; Tuerti, T.; Li, L.; Zhang, W. Apple-Soybean Mixed Stand Increased Fine Root Distribution and Soil Water Content with Reduced Soil Nitrate Nitrogen. Agronomy 2023, 13, 548. [Google Scholar] [CrossRef]
  20. Duan, Z.P.; Gan, Y.W.; Wang, B.J.; Hao, X.D.; Xu, W.L.; Zhang, W.; Li, L.H. Interspecific interaction alters root morphology in young walnut/wheat agroforestry systems in northwest China. Agrofor. Syst. 2019, 93, 419–434. [Google Scholar] [CrossRef]
  21. Li, L.; Sun, J.; Zhang, F.; Li, X.; Rengel, Z.; Yang, S. Wheat/maize or wheat/soybean strip intercropping: II. Recovery or compensation of maize and soybean after wheat harvesting. Field Crops Res. 2001, 71, 173–181. [Google Scholar] [CrossRef]
  22. Zhang, L.; van der Werf, W.; Bastiaans, L.; Zhang, S.; Li, B.; Spiertz, J.H.J. Light interception and utilization in relay intercrops of wheat and cotton. Field Crops Res. 2008, 107, 29–42. [Google Scholar] [CrossRef]
  23. Zhao, J.; Han, T.; Wang, C.; Jia, H.; Worqlul, A.W.; Norelli, N.; Zeng, Z.H.; Chu, Q.Q. Optimizing irrigation strategies to synchronously improve the yield and water productivity of winter wheat under interannual precipitation variability in the North China Plain. Agric. Water Manag. 2020, 240, 106298. [Google Scholar] [CrossRef]
  24. Dou, X.Y.; Wang, R.S.; Li, C.N.; Zheng, C.H.; Zhou, X. Spatial distribution of soil water, plant roots, and water use pattern under different drip fertigation regimes in an apple-soybean intercropping system on the Loess Plateau, China. Agric. Water Manag. 2022, 269, 107718. [Google Scholar] [CrossRef]
  25. Li, C.N.; Wang, R.S. Effects of Water and Fertilizer Regulation on Photosynthetic CharacteristicsYield and Water Use of Apple soybean Intercropping System Under Drip lrrigation. J. Soil Water Conserv. 2020, 34, 299–310. [Google Scholar]
  26. Xu, F.Q. Analysis of effective precipitation. Meteorol. Hydrol. Mar. Instrum. 2009, 26, 96–100. [Google Scholar]
  27. Liao, W.C.; Bi, H.X. Distribution of soil moisture in Malus pumila and Glycine maxintercropping system and its impact on the soybean growth. Sci. Soil Water Conserv. 2014, 12, 24–28. [Google Scholar]
  28. Kang, S.Z.; Hao, X.M.; Du, T.S.; Tong, L.; Su, X.L.; Lu, H.N.; Li, X.L.; Huo, Z.L.; Li, S.E.; Ding, R.S. Improving agricultural water productivity to ensure food security in China under changing environment: From research to practice. Agric. Water Manag. 2017, 179, 5–17. [Google Scholar] [CrossRef]
  29. Pelech, E.A.; Evers, J.B.; Pederson, T.L.; Drag, D.W.; Fu, P.; Bernacchi, C.J. Leaf, plant, to canopy: A mechanistic study on aboveground plasticity and plant density within a maize-soybean intercrop system for the Midwest, USA. Plant Cell Environ. 2023, 46, 405–421. [Google Scholar] [CrossRef]
  30. Singh, K.; Singh, K.; Brar, A.S.; Sahoo, P.; Gupta, N.; Mishra, S.K. Water Productivity of Sugarcane plus Summer Moong Intercropping System Under Subsurface Drip Irrigation and Straw Mulching. Sugar Tech 2024, 26, 876–893. [Google Scholar] [CrossRef]
  31. Mehrabi, F.; Sepaskhah, A.R. Leaf Nitrogen, Based on SPAD Chlorophyll Reading Can Determine Agronomic Parameters of Winter Wheat. Int. J. Plant Prod. 2022, 16, 77–91. [Google Scholar] [CrossRef]
  32. Zhang, J. Effeets of different dense planting methods on leaf funetion and yield ofsummer-sowing peanut. Chin. J. Oil Crop Sci. 2021, 43, 656–663. [Google Scholar]
  33. Huang, X.S. Effects of Density and Potassium Fertilizer on PhotosyntheticPhysiological Characteristics and Yield of Peanutunder Intercropping with Apricot Trees. Shandong Agric. Sci. 2025, 57, 72–80. [Google Scholar]
  34. Adekaldu, E.; Amponsah, W.; Tuffour, H.O.; Adu, M.O.; Agyare, W.A. Response of chilli pepper to different irrigation schedules and mulching technologies in semi-arid environments. J. Agric. Food Res. 2021, 6, 100222. [Google Scholar] [CrossRef]
  35. Wang, Z.; Wang, C.; Tan, X.; Gao, G.; El-Badri, A.M.; Batool, M.; Li, Z.; Ai, X.; Kuai, J.; Wang, J.; et al. Diversified spatial configuration of rapeseed-vetch intercropping benefits soil quality, radiation utilization, and forage production in the Yangtze River Basin. Field Crops Res. 2024, 318, 109587. [Google Scholar] [CrossRef]
  36. Raza, M.A.; Din, A.M.U.; Shah, G.A.; Wang, Z.; Feng, L.Y.; Gul, H.; Yasin, H.S.; Rahman, M.S.u.; Juan, C.; Liang, X.; et al. Legume choice and planting configuration influence intercrop nutrient and yield gains through complementarity and selection effects in legume-based wheat intercropping systems. Agric. Syst. 2024, 220, 104081. [Google Scholar] [CrossRef]
  37. Li, S.; van Der Werf, W.; Zhu, J.; Guo, Y.; Li, B.; Ma, Y.; Evers, J.B. Estimating the contribution of plant traits to light partitioning in simultaneous maize/soybean intercropping. J. Exp. Bot. 2021, 72, 3630–3646. [Google Scholar] [CrossRef] [PubMed]
  38. Yang, C.H.; Huang, G.B.; Chai, Q.; Luo, Z.X. Water use and yield of wheat/maize intercropping under alternate irrigation in the oasis field of northwest China. Field Crops Res. 2011, 124, 426–432. [Google Scholar] [CrossRef]
  39. Chen, L.; Wang, R.S.; Xiao, W.; Wang, L.S. Optimizing irrigation and mulching strategies to improve root-water relations, water use efficiency, and yield in apple-soybean alley cropping systems on the Loess Plateau, China. Eur. J. Agron. 2025, 168, 127586. [Google Scholar] [CrossRef]
  40. Shen, X.F.; Zhao, Z.H.; Chen, Y. Effects of Intercropping with Peanut and Silicon Application on Sugarcane Growth, Yield and Quality. Sugar Tech 2019, 21, 437–443. [Google Scholar] [CrossRef]
  41. Hauggaard-Nielsen, H.; Andersen, M.K.; Jornsgaard, B.; Jensen, E.S. Density and relative frequency effects on competitive interactions and resource use in pea-barley intercrops. Field Crops Res. 2006, 95, 256–267. [Google Scholar] [CrossRef]
  42. Wei, W.W.; Liu, T.T.; Shen, L.; Wang, X.Y.; Zhang, S.; Zhang, W. Effect of Maize (Zeal mays) and Soybean (Glycine max) Intercropping on Yield and Root Development in Xinjiang, China. Agriculture 2022, 12, 996. [Google Scholar] [CrossRef]
  43. Zhang, W.P.; Li, Z.X.; Gao, S.N.; Yang, H.; Xu, H.S.; Yang, X.; Fan, H.X.; Su, Y.; Surigaoge; Weiner, J.; et al. Resistance vs. surrender: Different responses of functional traits of soybean and peanut to intercropping with maize. Field Crops Res. 2023, 291, 108779. [Google Scholar] [CrossRef]
  44. Zheng, Z.G.; Wang, X.L. Effects of Sowing Date and Planting Density on Agronomic Traits and Yield of a New High-Oleic Peanut Cultivar Yuhua 37. Bull. Agric. Sci. Technol. 2021, 5, 140–142. [Google Scholar]
  45. Ma, X.L.; Zhu, Q.L.; Geng, C.X.; Lu, Z.G.; Long, G.Q.; Tang, L. Contribution of nutrient uptake and utilization on yield advantage in maize and potato intercropping under different nitrogen application rates. Ying Yong Sheng Tai Xue Bao = J. Appl. Ecol. 2017, 28, 1265–1273. [Google Scholar]
  46. Wang, L.S.; Wang, R.S.; Luo, C.W.; Dai, H.S.; Xiong, C.; Wang, X.; Zhang, M.; Xiao, W. Effects of Different Soil Water and Heat Regulation Patterns on the Physiological Growth and Water Use in an Apple-Soybean Intercropping System. Agronomy 2023, 13, 511. [Google Scholar] [CrossRef]
  47. Wang, Q.; Bai, W.; Sun, Z.X.; Zhang, D.S.; Zhang, Y.; Wang, R.N.; Evers, J.B.; Stomph, T.J.; van der Werf, W.; Feng, C.; et al. Does reduced intraspecific competition of the dominant species in intercrops allow for a higher population density? Food Energy Secur. 2021, 10, 285–298. [Google Scholar] [CrossRef]
Figure 1. Precipitation and air temperature at the experimental site in 2024. Note: Meteorological data were obtained from the Beijing Forestry University Meteorological Station in Ji County, Linfen City, Shanxi Province, using CR3000 (Campbell Scientific, Logan, UT, USA) equipment with daily and hourly measurements.
Agronomy 15 01798 g001
Figure 2. Plan layout of the apple–peanut alley cropping system.
Agronomy 15 01798 g002
Figure 3. Schematic Diagram of Soil Moisture Monitoring Placement and Root Sampling.
Agronomy 15 01798 g003
Figure 4. Horizontal dynamics of soil moisture content in the alley cropping system during the growing season. Note: W denotes water regulation, D represents planting density, d indicates distance from trees; W × D signifies the interaction effect between water regulation and planting density; W × D × d corresponds to the three-way interaction of water regulation, planting density, and distance from trees; asterisks denote statistical significance of factors on horizontal soil moisture distribution: * for p < 0.05, ** for p < 0.01, and ns for non-significant effects.
Agronomy 15 01798 g004
Figure 5. Vertical dynamics of soil moisture content in the alley cropping system during the growing season. Note: W denotes water regulation, D represents planting density, d indicates distance from trees; W × D signifies the interaction effect between water regulation and planting density; W × D × d corresponds to the three-way interaction of water regulation, planting density, and distance from trees; asterisks denote statistical significance of factors on vertical soil moisture distribution: ** for p < 0.01, and ns for non-significant effects. Hereafter similarly applied.
Agronomy 15 01798 g005
Figure 6. Root spatial distribution characteristics of apple and peanut under different water and density treatments.
Agronomy 15 01798 g006
Figure 7. Schematic diagram of principal component analysis across treatments. Note: SWC (soil water content), SPAD (soil–plant analysis development), GY (peanut yield), H (peanut plant height), LAI (leaf area index), and RLD (peanut root length density) in the figure represent comprehensive physiological-growth indicators of peanut; PC1, PC2, and PC3 denote the first, second, and third principal components.
Agronomy 15 01798 g007
Figure 8. Illustration of regression equations relating irrigation amount, planting density, water use efficiency (WUE), and yield. Note: WUE and yield values represent means of experimental data; x and y denote standardized inputs for water consumption and planting density, respectively; ** indicates statistical significance at p < 0.01.
Agronomy 15 01798 g008
Table 1. Irrigation amounts during the growing season, mulching methods, and planting densities of the peanuts across treatments.
TreatmentIrrigation Amount (m3·ha−1)Mulching MethodPlanting Density (Plants/ha)
Flowering StagePod Formation StagePod-Filling Stage
W1D1162.1180.8186.0Drip irrigation under plastic mulch-85%FC27,500
W2D1121.4126.7124.5Drip irrigation under plastic mulch-65%FC27,500
W1D2173.0195.5214.1Drip irrigation under plastic mulch-85%FC18,333
W2D2125.8135.6147.4Drip irrigation under plastic mulch-65%FC18,333
W1D3196.6213.2225.8Drip irrigation under plastic mulch-85%FC10,833
W2D3118.5142.2163.1Drip irrigation under plastic mulch-65%FC10,833
CK1///Mulching without irrigation27,500
CK2///Mulching without irrigation18,333
CK3///Mulching without irrigation10,833
Table 2. Variations in SPAD of apple and peanut under different water density regulation regimes.
SPAD
TreatmentApplePeanut
Bud Break StageFruit-Setting StageFruit-Expansion StageFlowering StagePod Formation StagePod-Filling Stage
W1D141.04 ± 0.62 d46.49 ± 0.61 c43.08 ± 0.67 d52.05 ± 0.55 f55.32 ± 1.05 d53.77 ± 0.88 de
W2D143.10 ± 0.72 c47.35 ± 0.54 c46.03 ± 0.30 bc53.43 ± 0.78 de57.16 ± 0.29 c56.04 ± 1.22 bc
W1D244.17 ± 0.67 bc48.72 ± 0.60 b45.07 ± 0.38 c55.40 ± 1.01 bc59.18 ± 0.35 b56.89 ± 0.68 b
W2D245.06 ± 0.36 b52.13 ± 0.81 a49.01 ± 0.89 a58.39 ± 0.69 a62.75 ± 0.71 a60.43 ± 0.53 a
W1D343.83 ± 1.03 bc47.19 ± 0.63 c45.55 ± 0.37 c54.63 ± 0.52 cd57.53 ± 0.95 c56.61 ± 1.13 bc
W3D346.96 ± 1.23 a48.85 ± 0.59 b46.61 ± 0.50 b56.14 ± 0.93 b58.87 ± 0.74 b57.32 ± 0.80 b
CK136.58 ± 1.23 f40.67 ± 0.51 f38.85 ± 0.61 g49.87 ± 0.43 g53.63 ± 0.59 e52.24 ± 0.97 e
CK238.74 ± 0.40 e42.23 ± 0.89 e40.60 ± 0.55 f52.53 ± 0.69 ef55.23 ± 0.48 d53.25 ± 0.80 e
CK340.54 ± 0.35 d43.97 ± 0.55 d41.93 ± 0.51 e51.86 ± 0.89 f54.71 ± 0.63 de55.12 ± 1.10 cd
Significance test (F-value)
W85.527 **123.539 **50.483 **148.939 **293.839 **336.163 **
D56.395 **65.234 **23.974 **45.150 **45.145 **44.631 **
W × D2.111 ns7.714 **5.810 **1.865 ns13.334 **9.620 **
Note: W denotes water regulation; D represents planting density; d indicates distance from trees; W × D signifies the interaction effect between water regulation and planting density; Data presented as mean ± standard deviation; different lowercase letters within a row indicate significant differences among treatments (p < 0.05). ** highly significant effect (p < 0.01), and ns non-significant effect. The same conventions apply hereafter.
Table 3. Variations in leaf area index of apple and peanut under different water density regulation regimes.
Leaf Area Index
TreatmentApplePeanut
Bud Break StageFruit-Setting StageFruit-Expansion StageFlowering StagePod Formation StagePod-Filling Stage
W1D12.63 ± 0.17 b3.08 ± 0.22 b2.77 ± 0.11 b1.76 ± 0.09 b2.83 ± 0.11 ab3.18 ± 0.08 b
W2D13.45 ± 0.13 a4.30 ± 0.17 a4.10 ± 0.02 a2.16 ± 0.12 a3.11 ± 0.22 a4.28 ± 0.20 a
W1D22.26 ± 0.17 cd2.86 ± 0.17 cd2.56 ± 0.10 cd1.52 ± 0.03 bc2.15 ± 0.37 c2.73 ± 0.16 c
W2D22.40 ± 0.06 c2.97 ± 0.06 bc2.67 ± 0.03 bc1.64 ± 0.16 bc2.58 ± 0.27 b2.99 ± 0.10 b
W1D31.81 ± 0.12 e2.63 ± 0.04 e2.32 ± 0.10 e1.36 ± 0.08 cd1.74 ± 0.04 de2.33 ± 0.12 d
W2D32.19 ± 0.13 cd2.74 ± 0.07 de2.49 ± 0.04 de1.46 ± 0.03 c1.95 ± 0.16 cd2.47 ± 0.28 d
CK12.11 ± 0.03 d2.55 ± 0.11 e2.26 ± 0.06 e1.16 ± 0.06 de1.63 ± 0.13 def2.03 ± 0.12 e
CK21.78 ± 0.17 e2.30 ± 0.05 f2.15 ± 0.04 f0.92 ± 0.37 ef1.45 ± 0.11 ef1.85 ± 0.08 ef
CK31.74 ± 0.08 e2.16 ± 0.04 f1.85 ± 0.07 f0.78 ± 0.16 f1.33 ± 0.19 f1.60 ± 0.12 f
Significance test (F-value)
W88.835 **153.846 **452.887 **62.574 **68.823 **206.633 **
D97.873 **108.268 **323.210 **22.826 **40.486 **106.676 **
W × D12.185 **29.094 **101.900 **1.160 ns4.411 *19.045 **
Note: W denotes water regulation; D represents planting density; d indicates distance from trees; W × D signifies the interaction effect between water regulation and planting density; Data presented as mean ± standard deviation; different lowercase letters within a row indicate significant differences among treatments (p < 0.05). * denotes a significant effect (p < 0.05), ** highly significant effect (p < 0.01), and ns non-significant effect. The same conventions apply hereafter.
Table 4. Variation dynamics of apple new shoot length and peanut plant height under water density regulation.
New Shoot Growth and Plant Height
TreatmentApplePeanut
Bud Break StageFruit-Setting StageFruit-Expansion StageFlowering StagePod Formation StagePod-Filling Stage
W1D134.41 ± 0.42 e41.11 ± 0.73 e47.62 ± 0.53 e21.63 ± 0.36 d32.33 ± 0.30 d36.66 ± 0.28 d
W2D132.23 ± 0.88 f39.33 ± 0.86 f44.59 ± 0.65 f19.46 ± 0.40 e30.60 ± 0.57 e34.69 ± 0.58 e
W1D239.67 ± 0.53 b50.41 ± 0.71 b55.44 ± 0.57 b26.59 ± 0.72 a37.87 ± 0.79 a42.27 ± 0.14 a
W2D236.30 ± 0.63 d44.85 ± 0.81 d49.54 ± 0.68 d23.78 ± 0.68 c34.71 ± 0.67 c39.80 ± 0.06 c
W1D341.58 ± 0.45 a53.71 ± 0.61 a62.52 ± 0.58 a24.84 ± 0.54 b35.87 ± 0.67 b40.72 ± 0.44 b
W2D338.42 ± 0.46 c47.78 ± 0.59 c51.77 ± 0.73 c18.29 ± 0.28 f29.08 ± 0.30 f33.62 ± 0.61 f
CK126.89 ± 0.21 h34.45 ± 0.39 h39.85 ± 0.54 h14.18 ± 0.25 i26.76 ± 0.68 h30.29 ± 0.42 h
CK227.27 ± 0.32 h35.22 ± 0.13 h42.71 ± 0.52 g15.52 ± 0.35 h28.02 ± 0.51 g31.78 ± 0.88 g
CK330.08 ± 0.26 g38.05 ± 0.53 g44.18 ± 0.25 f17.02 ± 0.23 g26.40 ± 0.39 h29.41 ± 0.54 i
Significance test (F-value)
W1045.418 **907.453 **1128.687 **825.427 **484.793 **800.008 **
D275.095 **389.705 **527.691 **135.315 **108.179 **170.213 **
W × D21.810 **48.483 **67.949 **52.468 **25.998 **39.145 **
Note: W denotes water regulation; D represents planting density; d indicates distance from trees; W × D signifies the interaction effect between water regulation and planting density; Data presented as mean ± standard deviation; different lowercase letters within a row indicate significant differences among treatments (p < 0.05). ** highly significant effect (p < 0.01). The same conventions apply hereafter.
Table 5. Yield, water consumption, and water use efficiency across treatments under water density regulation regimes.
TreatmentApple GY/(kg·hm−2)Peanut GY/(kg·hm−2)ET/(mm)WUE/(kg·hm−2·mm−1)
W1D1152.89 ± 2.74 d1966.09 ± 27.52 d817.50 ± 32.91 b2.59 ± 0.03 c
W2D1167.44 ± 3.19 bc2074.60 ± 50.02 c670.63 ± 13.63 d3.34 ± 0.07 b
W1D2202.38 ± 4.33 a2183.34 ± 21.39 b875.44 ± 8.83 a2.73 ± 0.03 c
W2D2212.23 ± 5.38 a2380.39 ± 19.08 a696.58 ± 33.47 c3.72 ± 0.03 a
W1D3163.99 ± 10.63 cd943.41 ± 13.99 f886.59 ± 15.22 a1.25 ± 0.03 e
W2D3176.83 ± 6.57 b1094.57 ± 13.17 e674.40 ± 54.03 d1.89 ± 0.04 d
CK1155.80 ± 3.81 d885.50 ± 30.99 g302.58 ± 24.43 f3.45 ± 0.24 b
CK2167.27 ± 9.36 bc917.28 ± 22.94 fg320.38 ± 18.70 e3.39 ± 0.18 b
CK3172.01 ± 5.49 bc617.23 ± 20.70 h302.27 ± 49.83 f2.61 ± 0.13 c
Significance test (F-value)
W24.361 **4040.500 **7565.886 **186.171 **
D73.388 **3169.446 **29.146 **393.457 **
W × D13.015 **359.601 **12.205 **17.575 **
Note: W denotes water regulation; D represents planting density; d indicates distance from trees; W × D signifies the interaction effect between water regulation and planting density; Data presented as mean ± standard deviation; different lowercase letters within a row indicate significant differences among treatments (p < 0.05). ** highly significant effect (p < 0.01). The same conventions apply hereafter.
Table 6. Comprehensive scores and rankings of experimental treatments.
TreatmentW1D1W2D1W1D2W2D2W1D3W2D3CK1CK2CK3
Comprehensive Scores1.4221.7382.672.3730.7880.399−3.071−2.908−3.209
Rank431256879
Disclaimer/Publisher’s Note: The statements, opinions and data contained in all publications are solely those of the individual author(s) and contributor(s) and not of MDPI and/or the editor(s). MDPI and/or the editor(s) disclaim responsibility for any injury to people or property resulting from any ideas, methods, instructions or products referred to in the content.

