Article

Monitoring Rose Black Spot Disease Using Electrical Impedance Spectroscopy

College of Horticulture, Hebei Agriculture University, Baoding 071000, China
*
Authors to whom correspondence should be addressed.
Agronomy 2025, 15(8), 1800; https://doi.org/10.3390/agronomy15081800
Submission received: 16 June 2025 / Revised: 17 July 2025 / Accepted: 24 July 2025 / Published: 25 July 2025

Abstract

Rosa hybrida is a globally important ornamental species, but its economic and aesthetic value is often compromised by rose black spot disease (Diplocarpon rosae). Effective monitoring and early detection are essential for disease management. This study investigated physiological and biophysical responses to infection in a resistant cultivar (‘Carefree Wonder’) and a susceptible cultivar (‘Red Cap’) using electrical impedance spectroscopy (EIS), biochemical assays, and ultrastructural analysis. Key EIS parameters (ri, re, τ), reducing sugar and free proline content, chitinase and β-1,3-glucanase activities, and chloroplast ultrastructure were monitored. The results showed that ‘Carefree Wonder’ had a higher initial EIS arc magnitude and osmolyte levels than ‘Red Cap’. Following infection, ‘Red Cap’ displayed earlier and more pronounced increases in EIS arc magnitude, while ‘Carefree Wonder’ responded more gradually. Reducing sugar and proline levels increased in both cultivars, with earlier accumulation in the resistant cultivar. Notably, extracellular resistivity (re) exhibited strong positive correlations with reducing sugar (R2 = 0.479), free proline (R2 = 0.399), chitinase (R2 = 0.399), and β-1,3-glucanase activities (R2 = 0.401). These findings highlight re as the most reliable EIS-derived indicator for early, non-destructive detection of rose black spot resistance. This study supports the potential of EIS for rapid disease diagnostics in rose breeding and cultivation.

1. Introduction

Roses, belonging to the Rosaceae family, are semi-evergreen shrubs with a long history of cultivation. As one of the most important ornamental plants worldwide, roses are highly popular and therefore widely cultivated [1,2]. However, black spot disease, a globally prevalent and highly destructive fungal disease, severely affects the appearance and quality of roses. Effective prevention and control of this disease remain a critical challenge in rose production [3,4,5].
Extensive research has been conducted by scholars on the prevention and control of rose black spot disease. However, the lack of accurate tools to monitor disease progression has hindered the development of effective and precise control strategies for rose diseases. Traditional visual inspection methods suffer from inconsistent evaluation criteria, delayed response time, and high labor costs. Pathogen-based physicochemical detection methods are often complex and expensive, while thermal infrared techniques for sclerotium identification require costly equipment and are sensitive to environmental conditions. Therefore, in practical production settings, there is an urgent need to develop a rapid, simple, and effective early warning technique [6,7,8].
Plant diseases are the result of complex interactions between the host plant and the pathogen under the influence of environmental conditions. Pathological responses represent abnormal physiological states, and every type of disease is associated with a specific physiological background. The relationship between host plant physiology and disease development has long been a central focus of scientific research [9]. In the early stages of disease infection, plants initiate a series of defense responses to cope with pathogenic stress by altering their internal structure, producing antimicrobial compounds, and increasing the accumulation of osmotic regulatory substances. For example, plants may thicken their cell walls to block pathogen invasion and utilize reducing sugars to synthesize antifungal compounds or inhibit the synthesis of certain enzymes in pathogens. Plants may also accumulate free proline to enhance stress resistance and increase the activity of chitinase and β-1,3-glucanase to hydrolyze the cell walls of pathogenic fungi. These responses could thereby strengthen their defense against pathogen infection [10,11,12,13,14].
Electrical impedance spectroscopy (EIS) is a bioelectrical technology that integrates biological and electrical principles. Its core mechanism involves applying an electromagnetic field below the excitation threshold to the target object via an electrode system, thereby obtaining electrical parameters, such as impedance, that reflect subtle cellular changes and, in turn, the physiological state of the plant [15,16,17,18]. To date, EIS technology has achieved notable success in detecting abiotic stressors, such as temperature, water availability, salinity, and heavy metal exposure [19,20,21,22,23]. However, its application in biotic stress remains in the early stages of exploration. Changes in cellular ultrastructure and intracellular substance concentrations can both be captured through EIS parameters. Therefore, by continuously monitoring changes in plant EIS parameters, it is possible to determine whether the plant has been infected by disease, thereby avoiding the subjectivity and delay of traditional empirical control methods, while also reducing production costs and environmental pollution [24,25].
In this study, two modern rose variants (Rosa hybrida Hort.) with contrasting resistance to black spot disease, ‘Carefree Wonder’ (highly resistant) and ‘Red Cap’ (highly susceptible), were selected for artificial inoculation with Diplocarpon rosae. The disease progression at different infection stages was monitored, and corresponding EIS spectra, impedance parameters, and physiological indices were recorded. By analyzing the relationships among EIS parameters, physiological responses, and disease severity across variants, this study aims to evaluate the potential of EIS for characterizing plant responses to biotic stress. The findings are expected to provide both theoretical support and practical guidance for applying EIS in the assessment of disease resistance influenced by biological factors, thereby offering innovative solutions for precision agriculture and plant disease management.

2. Materials and Methods

2.1. Experimental Materials

The experimental materials consisted of one-year-old rose (Rosa hybrida) cuttings purchased from Beijing Florascape Co., Ltd. (Beijing, China) (39°91′ N, 116°37′ E). Two cultivars were selected: ‘Carefree Wonder’, which is highly resistant to black spot disease, and ‘Red Cap’, which is susceptible. The experiment was conducted in two greenhouses located at the Botanical Garden of Hebei Agricultural University in Baoding City, Hebei Province (38°50′ N, 115°26′ E). The greenhouse conditions were maintained with a daytime temperature of 25–30 °C, a nighttime temperature of approximately 25 °C, and a relative humidity of around 80%. Plants were divided into inoculated and control groups, with the control group treated with distilled water. In May 2023, the rose seedlings were transplanted into the greenhouses using a completely randomized block design. After more than two months of acclimatization under standard management practices, all plants were maintained under uniform growth conditions. Each treatment (inoculated and control) was replicated four times.

2.2. Treatment Methods

The inoculation treatments began in September 2023. Inoculations were conducted twice daily, at 6:00 a.m. and 6:00 p.m., using a spore suspension with a concentration of 8 × 10⁵ spores/mL. After inoculation, environmental conditions were adjusted to favor the survival and infection of the black spot pathogen. Leaf samples from both variants were collected on days 1, 4, 7, 10, 13, 17, and 21 post-inoculation for measurement of electrical impedance spectroscopy (EIS) parameters and physiological indices. Additionally, leaf ultrastructure was observed on days 1, 7, and 17 post-inoculation.
For each sampling time point, nine rose plants per cultivar and per replicate, with similar growth status (plant height and stem diameter), were selected. From each plant, the 3rd to 5th fully expanded leaves from the top were collected. The leaves were rinsed three times each with distilled water and deionized water, then blotted dry with absorbent paper. A portion of the fresh samples was immediately used for EIS measurements, another portion was oven-dried for reducing sugar and related physiological assessments, and the remaining portion was snap-frozen in liquid nitrogen for other physiological measurements.

2.3. Parameters Measurement

EIS measurements and parameter extraction were conducted following the method described by Zhang et al. [26]. The reducing sugar content was determined using the 3,5-dinitrosalicylic acid (DNS) colorimetric method [27], while the free proline content was measured using the acidic ninhydrin method [28]. Chitinase activity was determined using the p-dimethylaminobenzaldehyde colorimetric method [29], and β-1,3-glucanase activity was measured according to the method described by Ramada [30]. For ultrastructural analysis, leaf tissues were sectioned with a razor blade and examined using a transmission electron microscope operating at 80 kV. Images were acquired with a Bioscan camera (JEOL Ltd., Tokyo, Japan) attached to the microscope and further processed using Adobe Photoshop 2020 (v21.x, Adobe Inc., San Jose, CA, USA). Key parameters evaluated included chloroplast size, starch granule dimensions, and the extent of thylakoid membrane damage.

2.4. Statistical Analysis

Based on the established equivalent circuit model, the Colo-colo model was applied to fit the electrical impedance spectra and extract the high-frequency resistance (R), low-frequency resistance (R1), relaxation time (τ), and dispersion coefficient of relaxation time (ψ). From these, the extracellular resistivity (re) and intracellular resistivity (ri) were calculated. The physiological indices were averaged for graphical presentation. The EIS spectra of rose leaves exhibited a single semicircle. Therefore, according to the Cole–Cole model, a single-DCE (distributed circuit element) equivalent circuit model was adopted. The equivalent circuit parameters were fitted using the LEVM 8.06 software (Macdonald JR). The impedance in the model was calculated using the following equation:
Z = R + R 1 1 + ( i τ ω ) ψ
where Z is the impedance; R and R 1 are resistances; i = 1 is the imaginary unit; ω is the angular frequency, defined as ω = 2 × π × f , where f is the frequency; τ is the relaxation time; and ψ is the distribution coefficient of the relaxation time.
The calculation formulas for extracellular resistance ( r e ) and intracellular resistance ( r i ) are as follows:
r e = R + R 1 r i = R 1 + R R 1
The resistivity parameters were calculated by normalizing the resistance of each sample to its cross-sectional area and length using the following formula:
r x ( Ω m ) = R x A l
where r x is the resistivity of the corresponding resistance component (e.g., r e   for extracellular resistivity, r i for intracellular resistivity); R x is the measured resistance value (Ω); l is the length of the sample (m); and A is the cross-sectional area of the sample (m2).
The experimental data obtained from the measurements were processed and plotted using Microsoft Excel 2019. Statistical analyses were performed using SPSS 26.0 (IBM Corp, Armonk, NY, USA). The significance level p was used to determine whether the observed correlations were statistically valid, with p < 0.05 considered statistically significant. Duncan’s multiple range test was applied to assess significant differences among the indicators at different sampling times, in order to evaluate the trends of variable changes. Additionally, tests for normality and homogeneity of variance were conducted on the residuals to ensure the reliability of the analysis results.

3. Results

3.1. Changes in Electrical Impedance Spectroscopy and Parameters

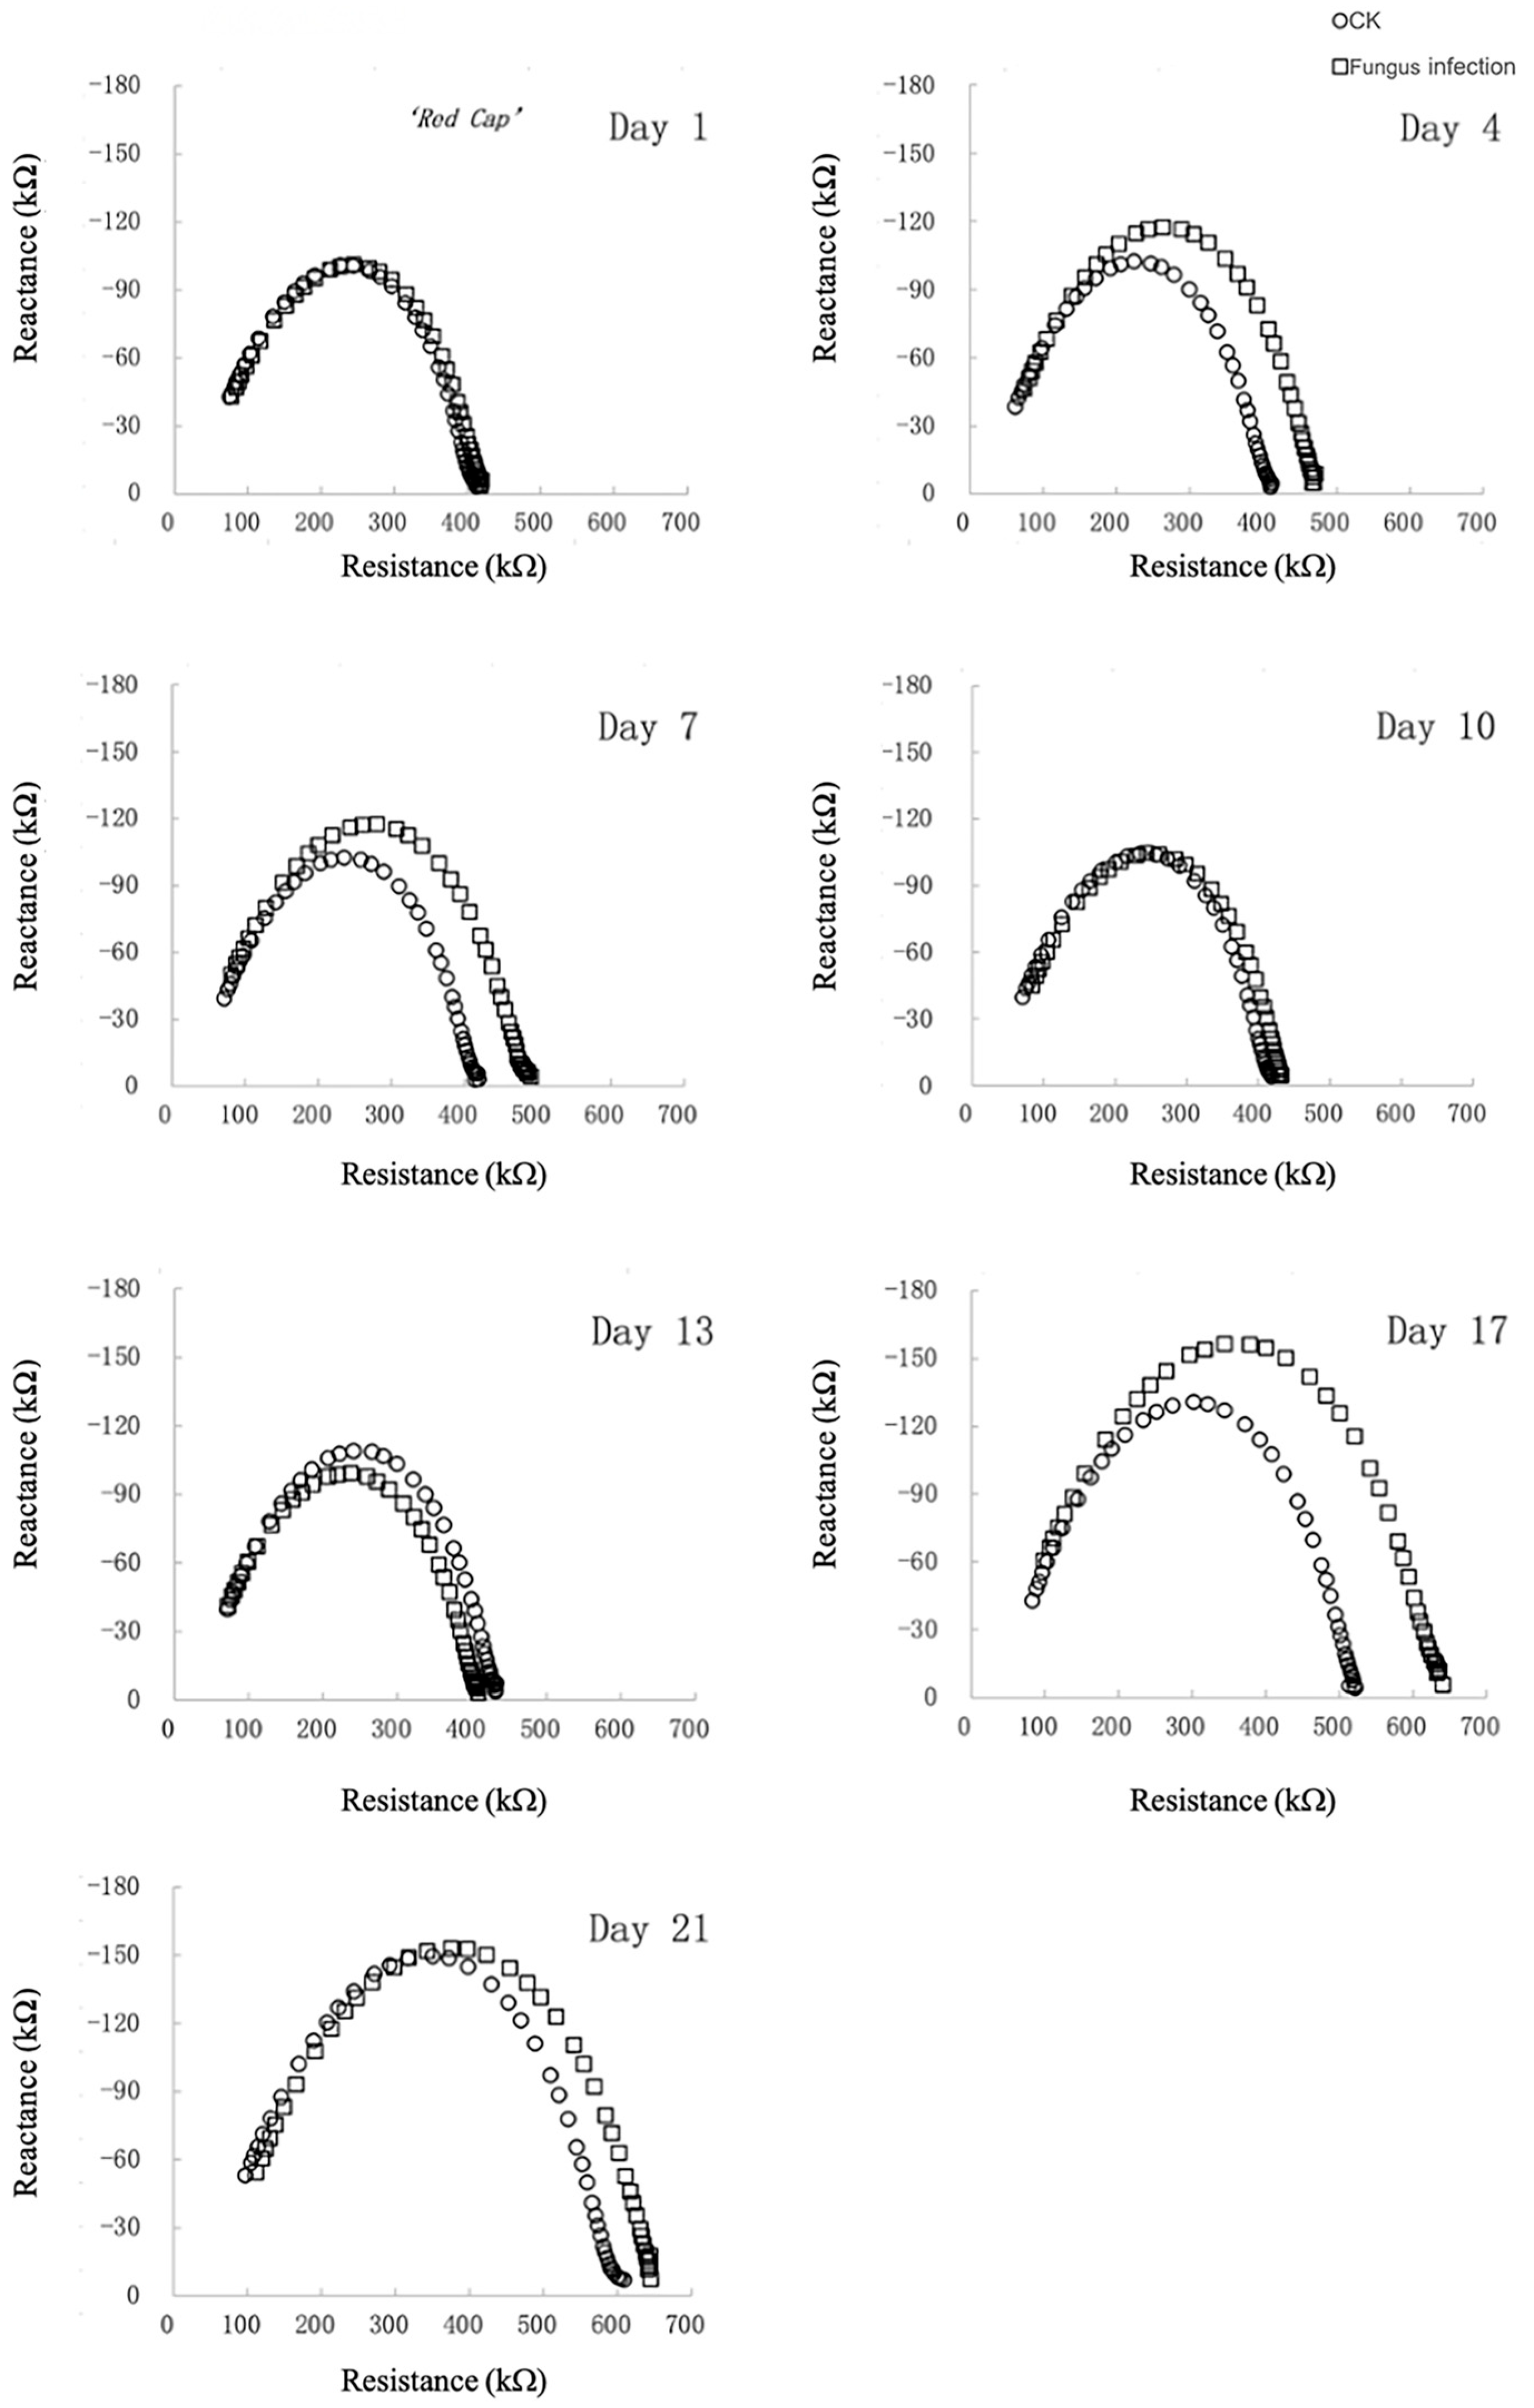
3.1.1. Electrical Impedance Spectroscopy

After inoculation, both cultivars showed a general increasing trend in arc magnitude over time. For ‘Carefree Wonder’, a sharp increase in arc magnitude was observed on day 7 post-inoculation, with a significant difference compared to the control (Figure 1). In contrast, ‘Red Cap’ exhibited a rapid increase in arc magnitude as early as day 4 post-inoculation, also showing a significant difference from the control (Figure 2). Throughout the entire treatment period, the arc magnitude of ‘Carefree Wonder’ remained consistently higher than that of ‘Red Cap’.

3.1.2. Changes in Electrical Impedance Parameters

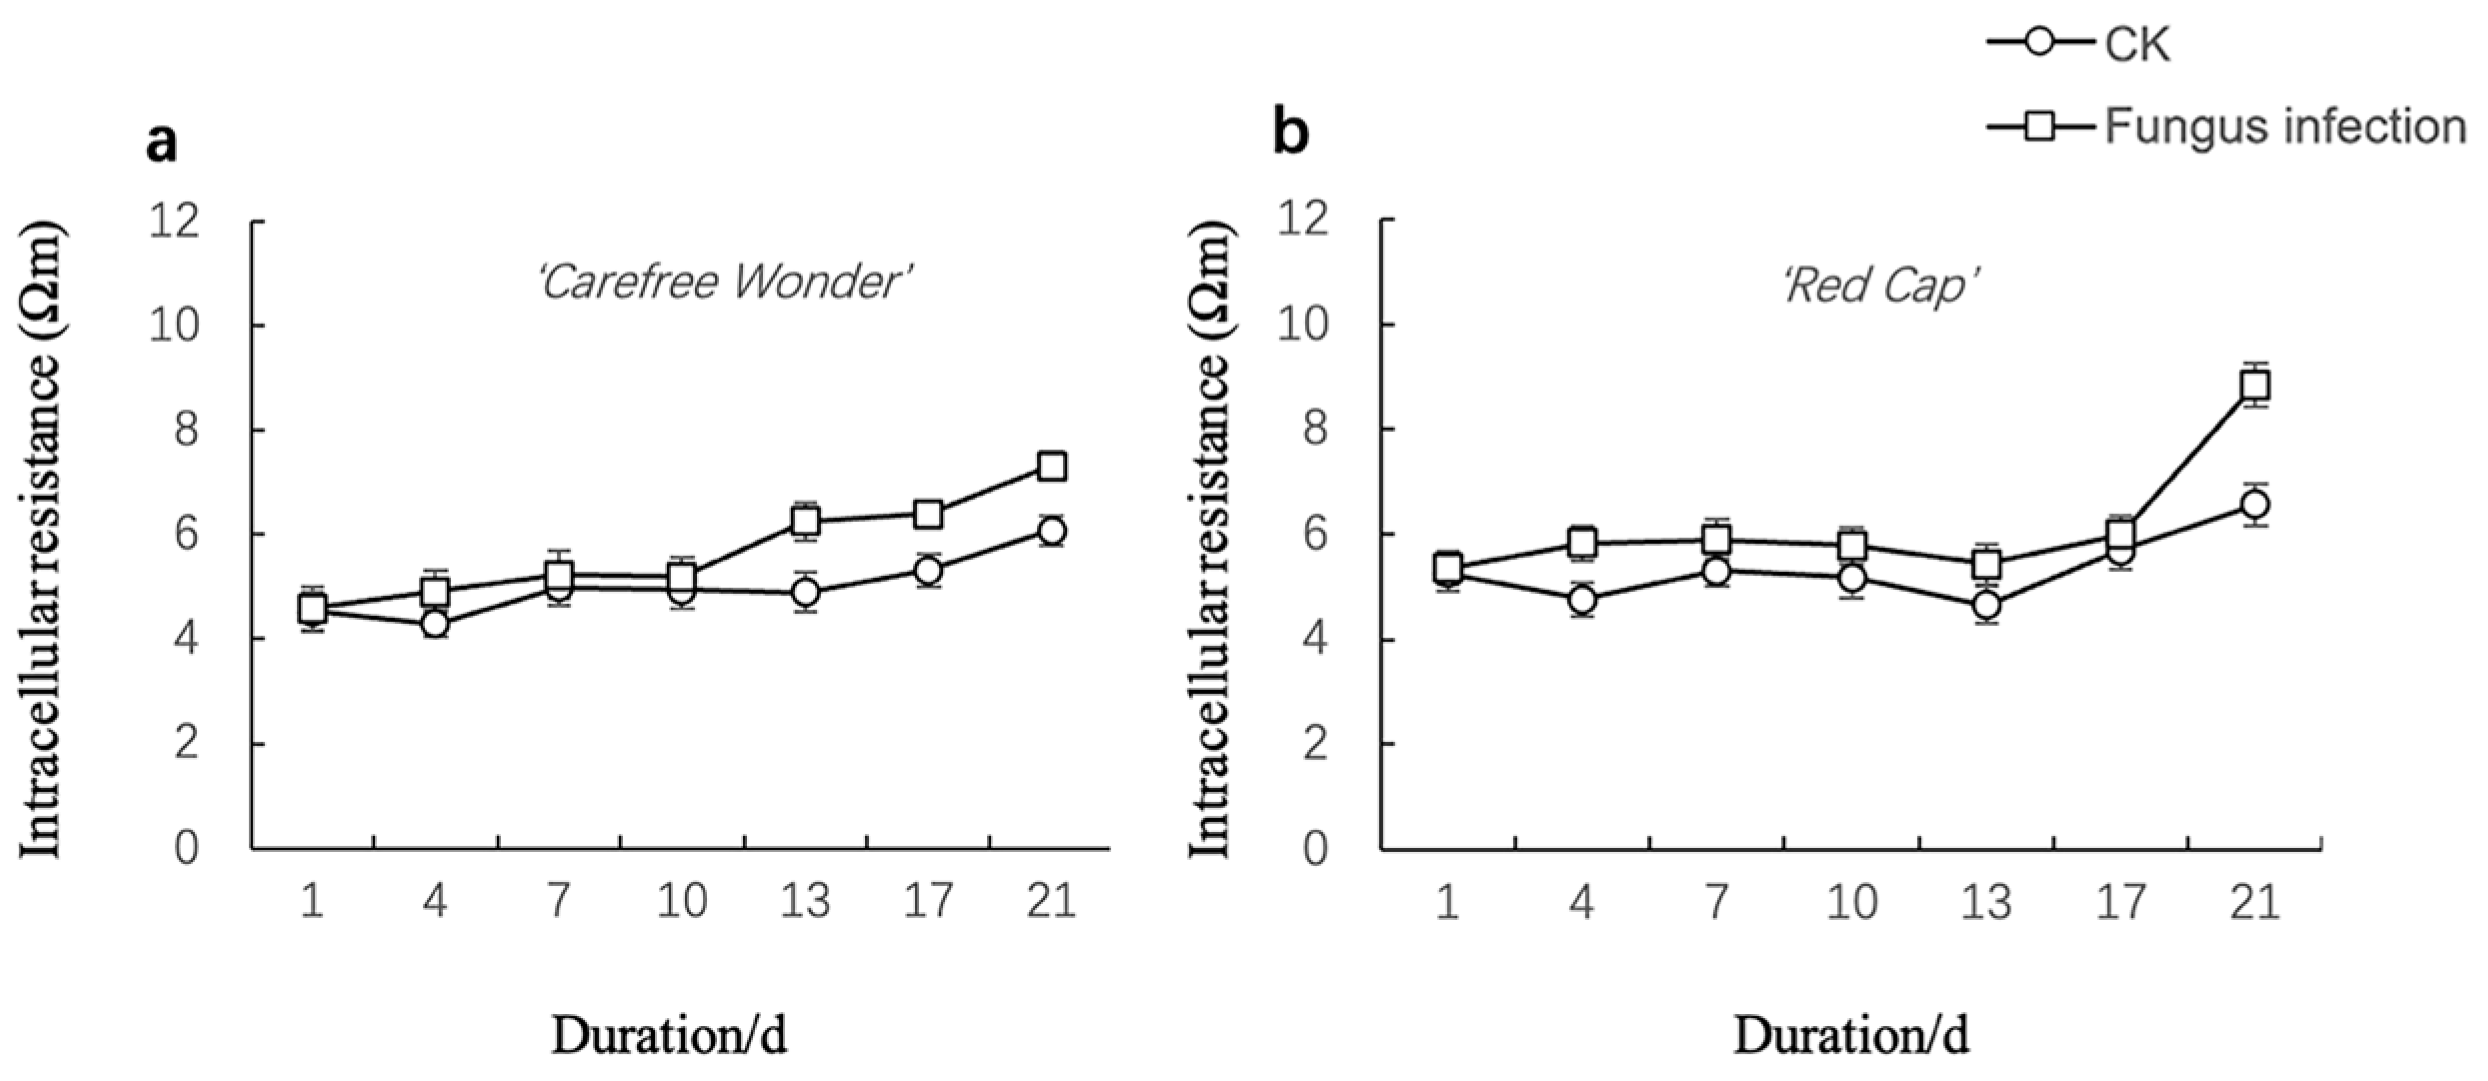
Intracellular Resistivity (ri)
The ri of the ‘Carefree Wonder’ cultivar significantly increased on day 13 after inoculation and was higher than that of the control group (p < 0.05), reaching its peak on day 21 (Figure 3a). In contrast, the ‘Red Cap’ cultivar exhibited a significant increase in ri as early as day 4 post-inoculation, with the maximum value also observed on day 21 (p < 0.05) (Figure 3b). During the inoculation period, the ri of ‘Carefree Wonder’ surpassed that of ‘Red Cap’ starting from day 13.
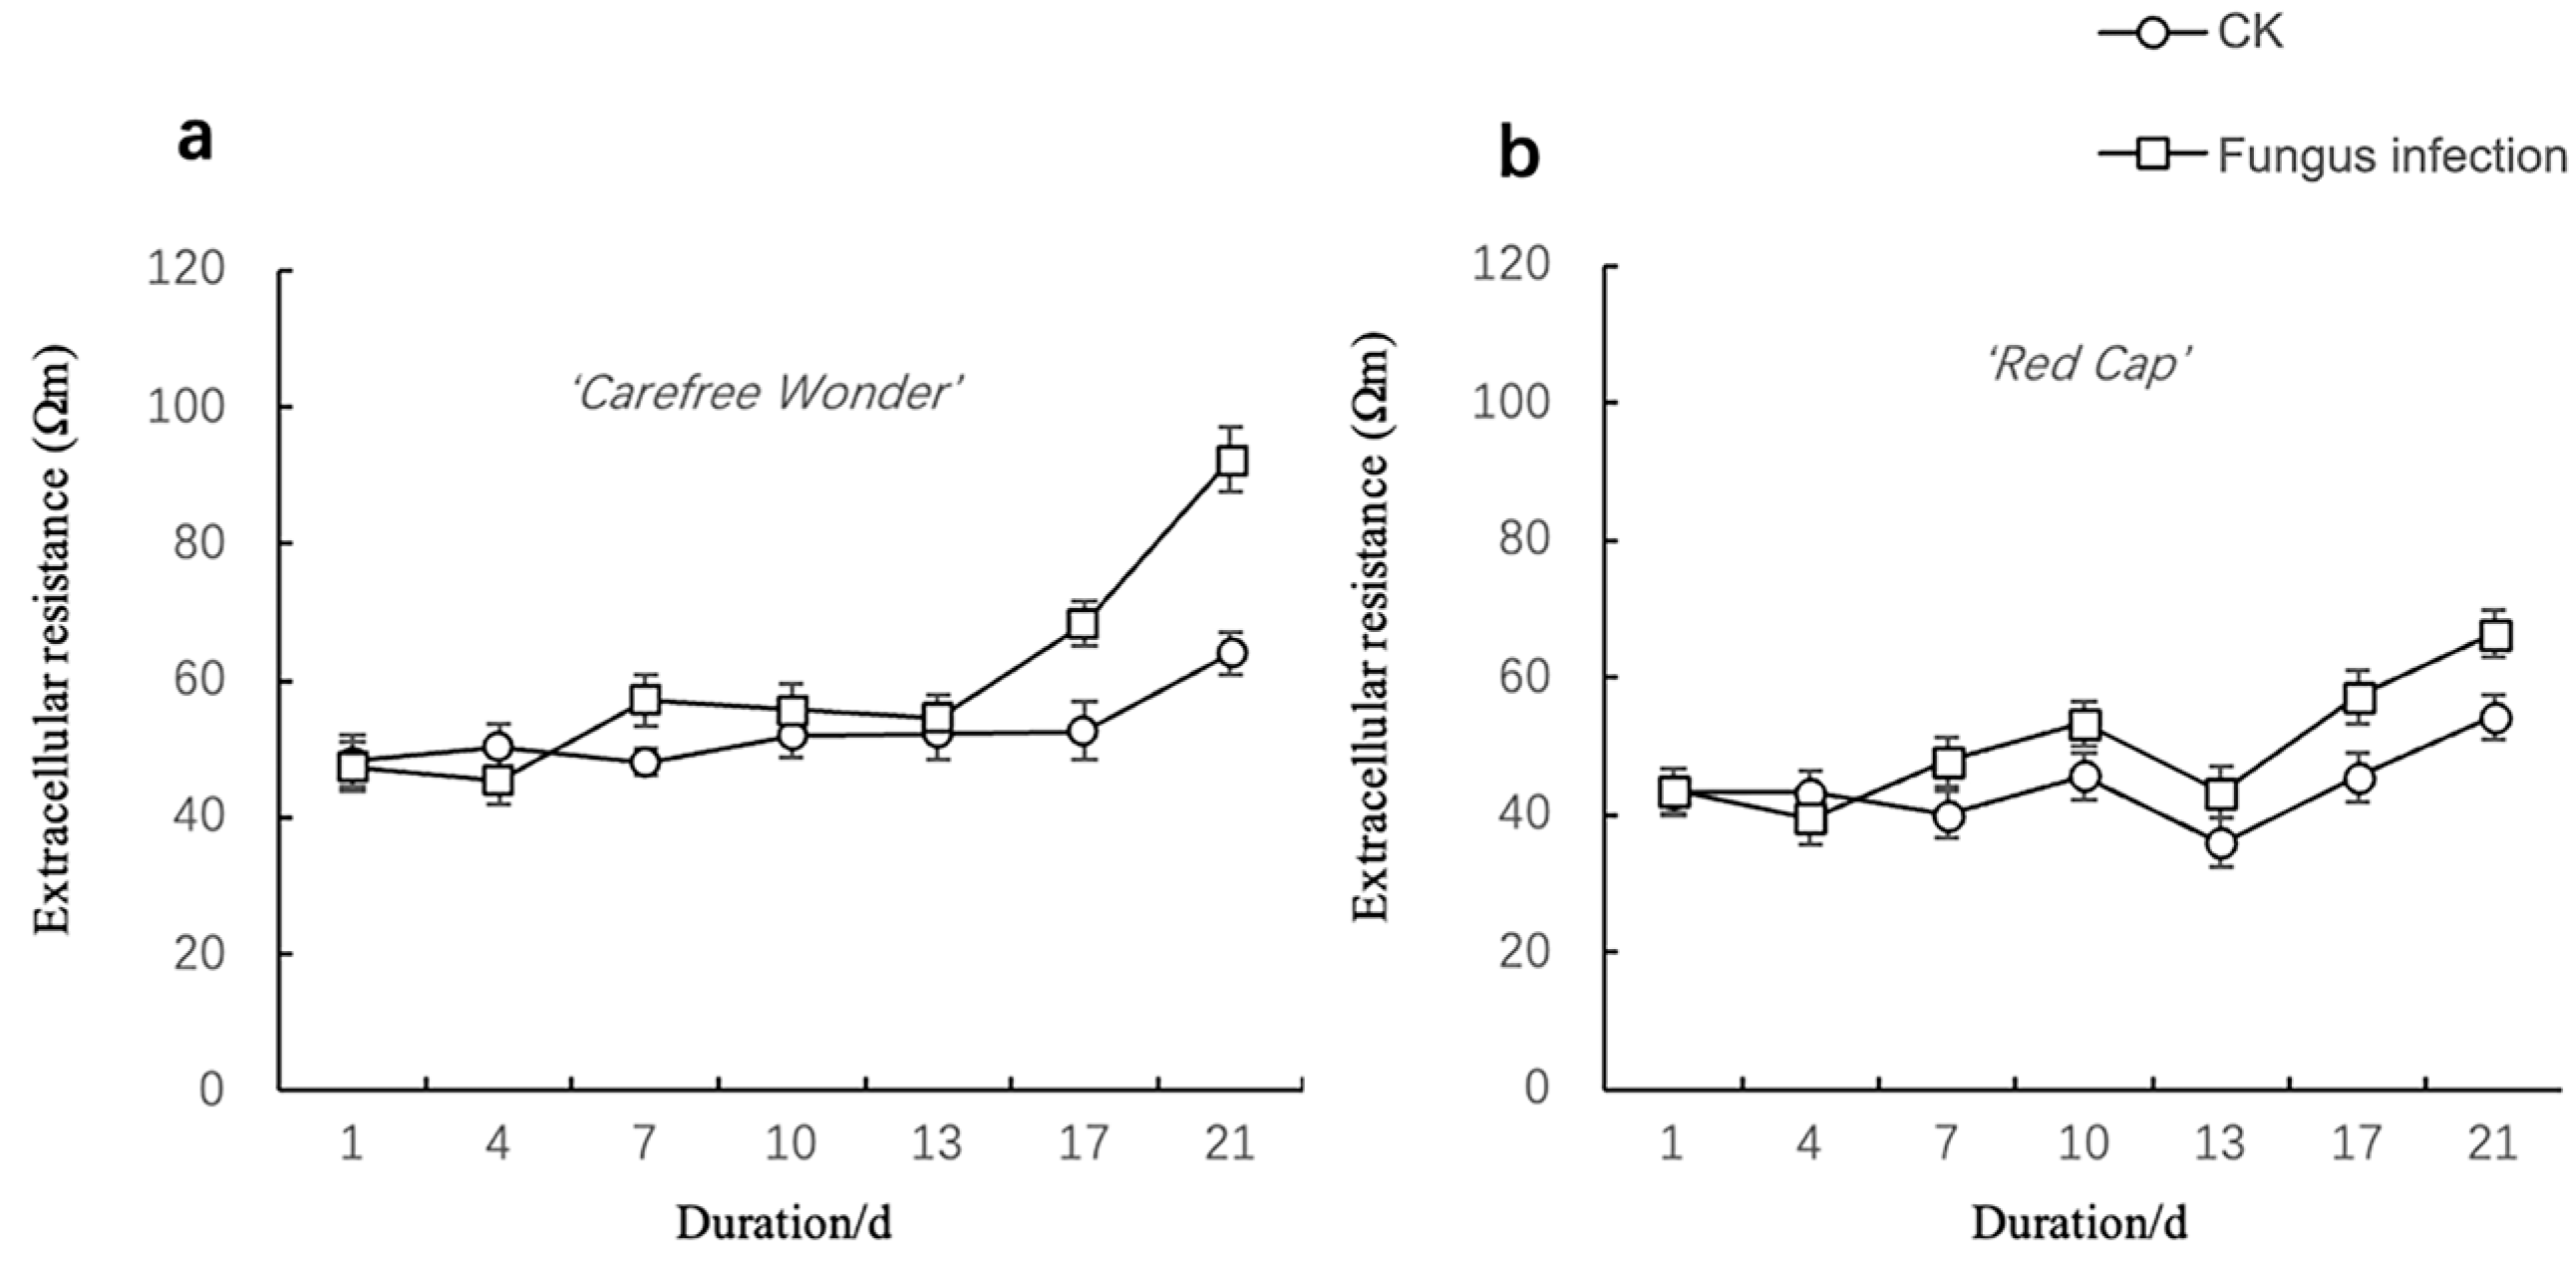
Extracellular Resistivity (re)
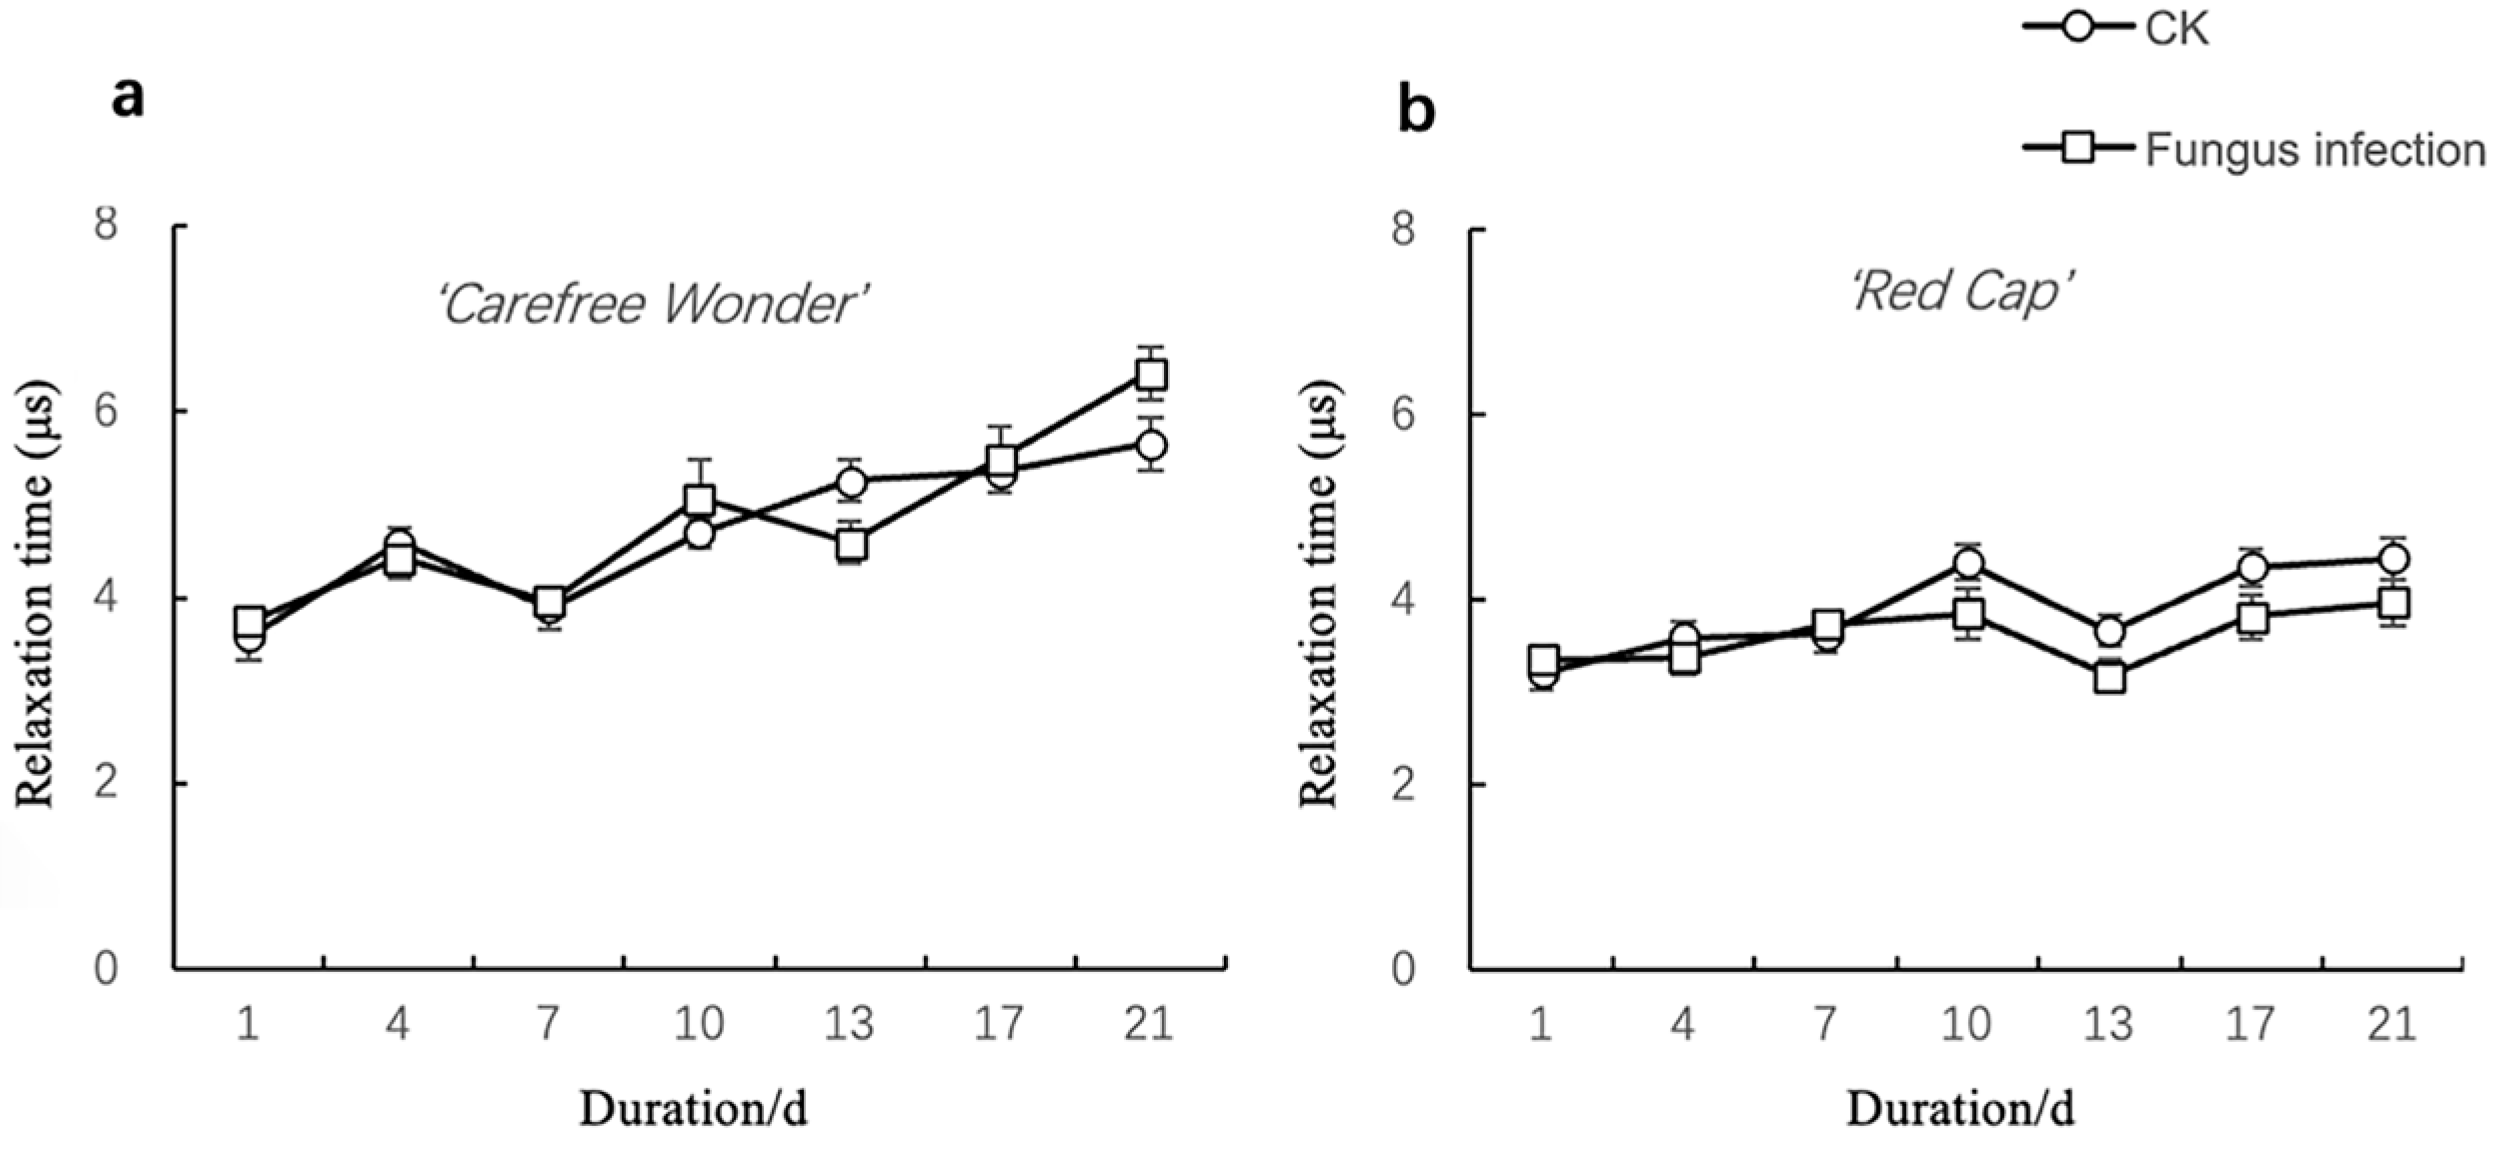
As shown in Figure 4, the re of both ‘Carefree Wonder’ and ‘Red Cap’ significantly increased on day 7 after inoculation, showing significant differences compared to the control group (p < 0.05). Both cultivars also exhibited a marked increase in re on day 17 (p < 0.05). Throughout the inoculation period, the re of ‘Carefree Wonder’ remained consistently higher than that of ‘Red Cap’.
Relaxation Time (τ)
The τ of the ‘Carefree Wonder’ cultivar showed a significant increase only on day 21 post-inoculation, with a value significantly higher than that of the control (p < 0.05) (Figure 5a). In contrast, the τ of the ‘Red Cap’ cultivar exhibited no significant changes throughout the inoculation period and did not differ significantly from its control (Figure 5b).
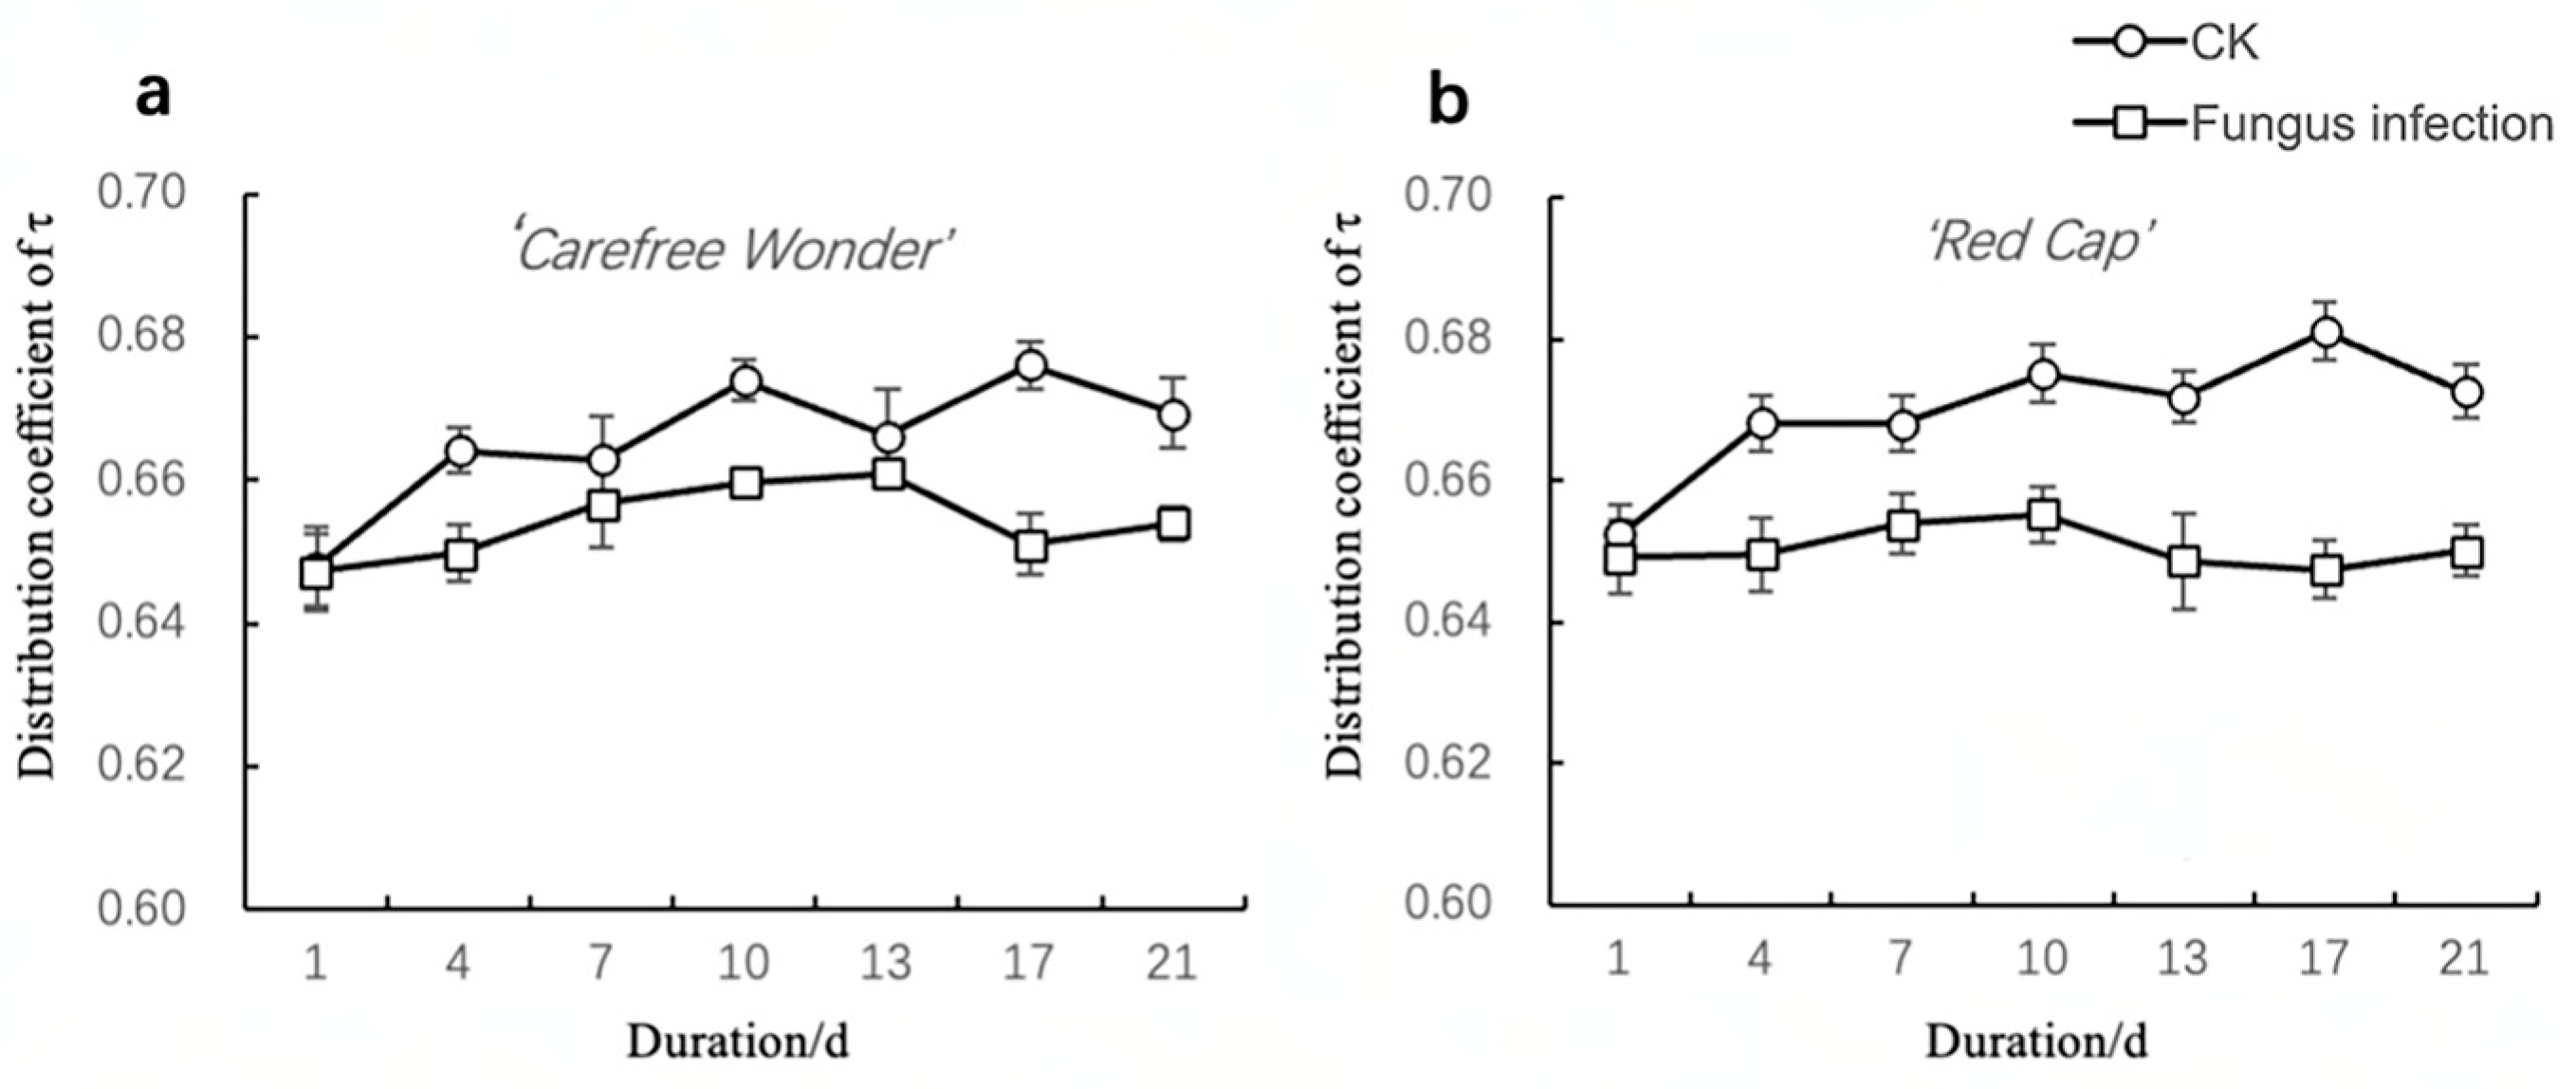
Dispersion Coefficient of Relaxation Time (ψ)
The ψ in ‘Carefree Wonder’ showed a significant difference from the control on day 17 post-inoculation (p < 0.05), reaching its maximum value on day 13 (Figure 6a). For ‘Red Cap’, a significant difference from the control was observed as early as day 4 (p < 0.05), with a peak value on day 10. In both cultivars, ψ exhibited a significant decrease on day 4 post-inoculation compared to the control (p < 0.05) (Figure 6b). ψ in ‘Carefree Wonder’ surpassed that of ‘Red Cap’ starting from day 7.

3.2. Changes in Osmotic Adjustment Substance Content

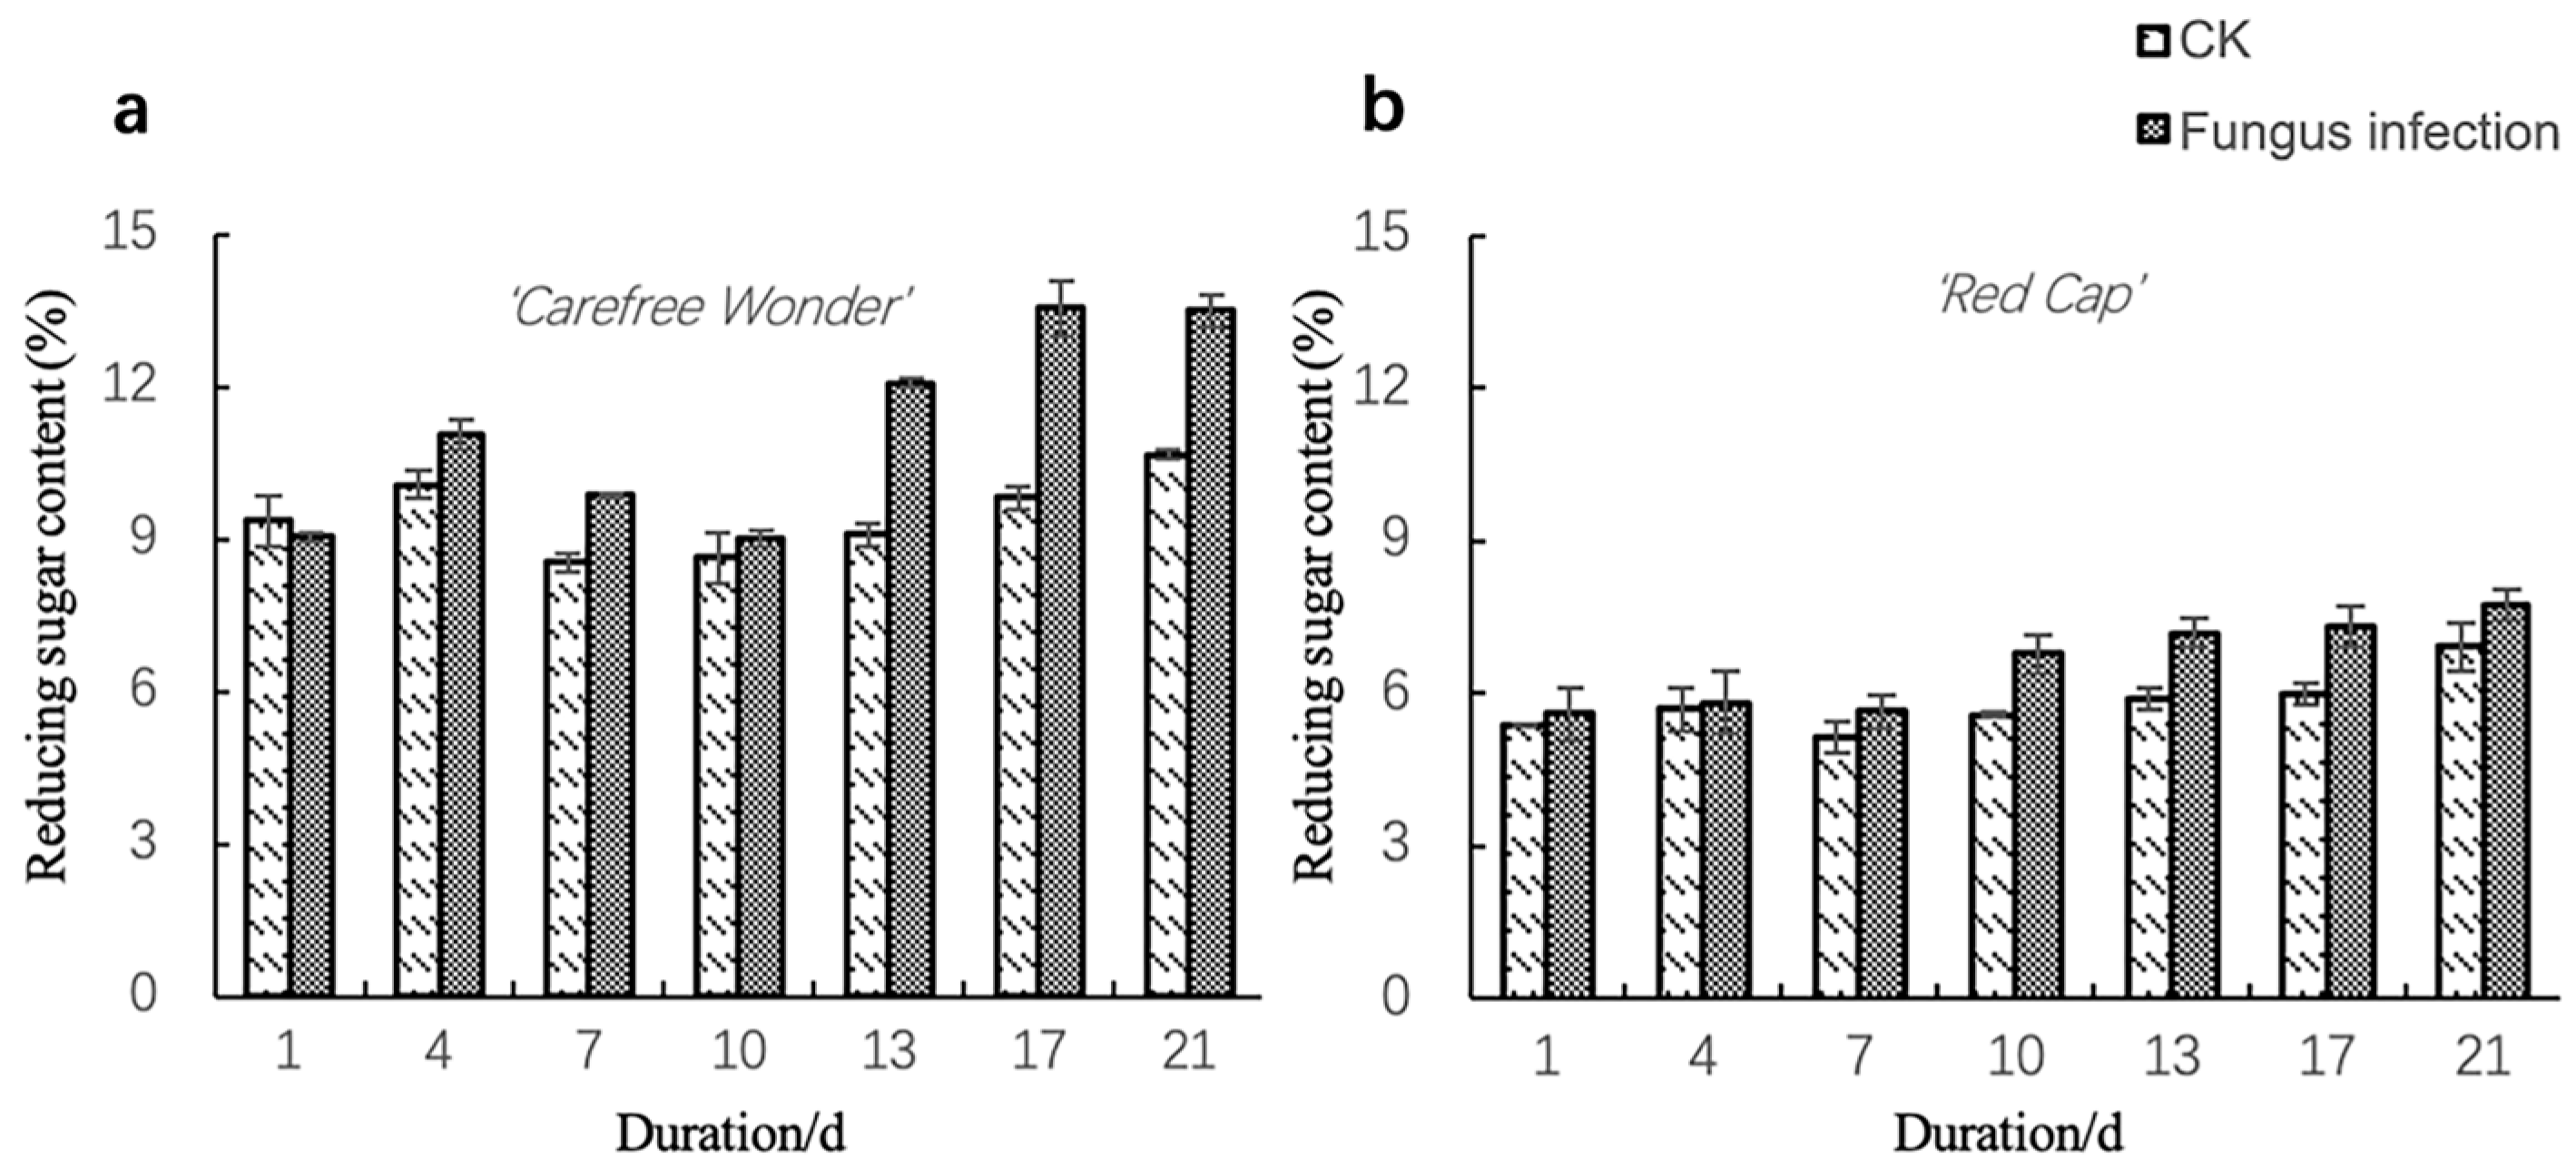
3.2.1. Reducing Sugar

As shown in Figure 7, after inoculation, the reducing sugar content of ‘Carefree Wonder’ and ‘Red Cap’ significantly increased on day 4 and day 10, respectively, with both showing significant differences compared to their corresponding controls (p < 0.05). Under both control and inoculated conditions, the reducing sugar content in ‘Carefree Wonder’ was consistently higher than that in ‘Red Cap’.

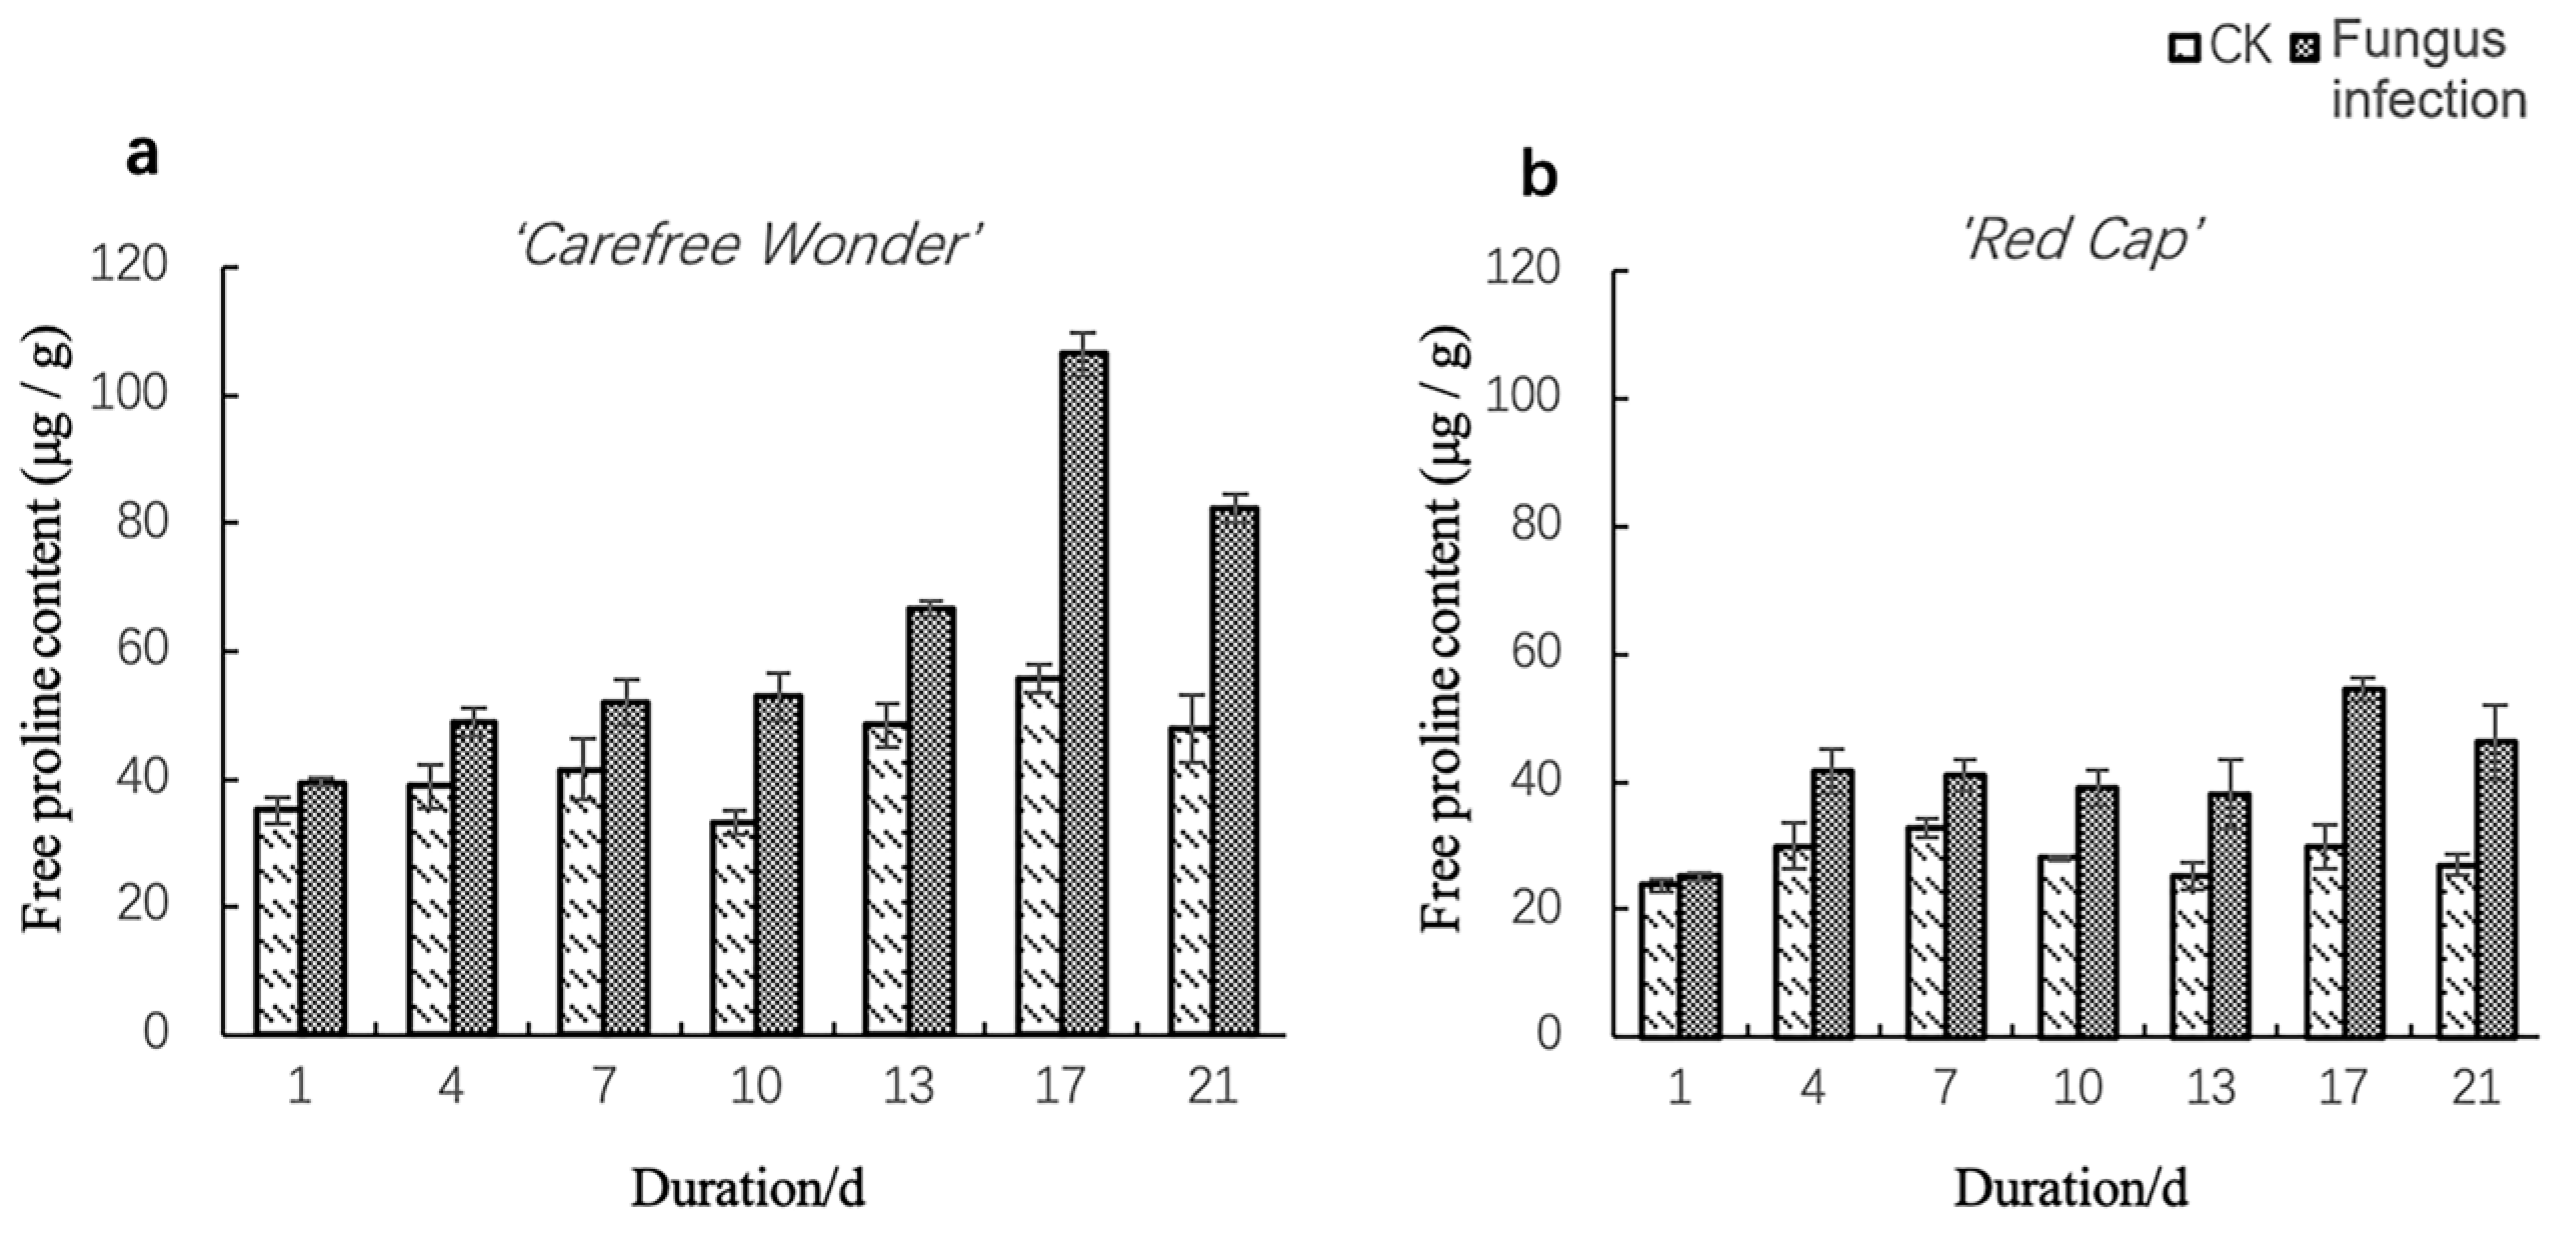
3.2.2. Free Proline Content

As shown in Figure 8, after inoculation, the free proline content of both ‘Carefree Wonder’ and ‘Red Cap’ increased significantly on day 4, with values significantly higher than those of the respective controls (p < 0.05). A further significant increase was observed on day 17, at which point both cultivars reached their maximum levels (p < 0.05). Under both control and inoculated conditions, the free proline content of ‘Carefree Wonder’ was consistently and markedly higher than that of ‘Red Cap’.

3.3. Changes in the Activity of Pathogenesis-Related Proteases

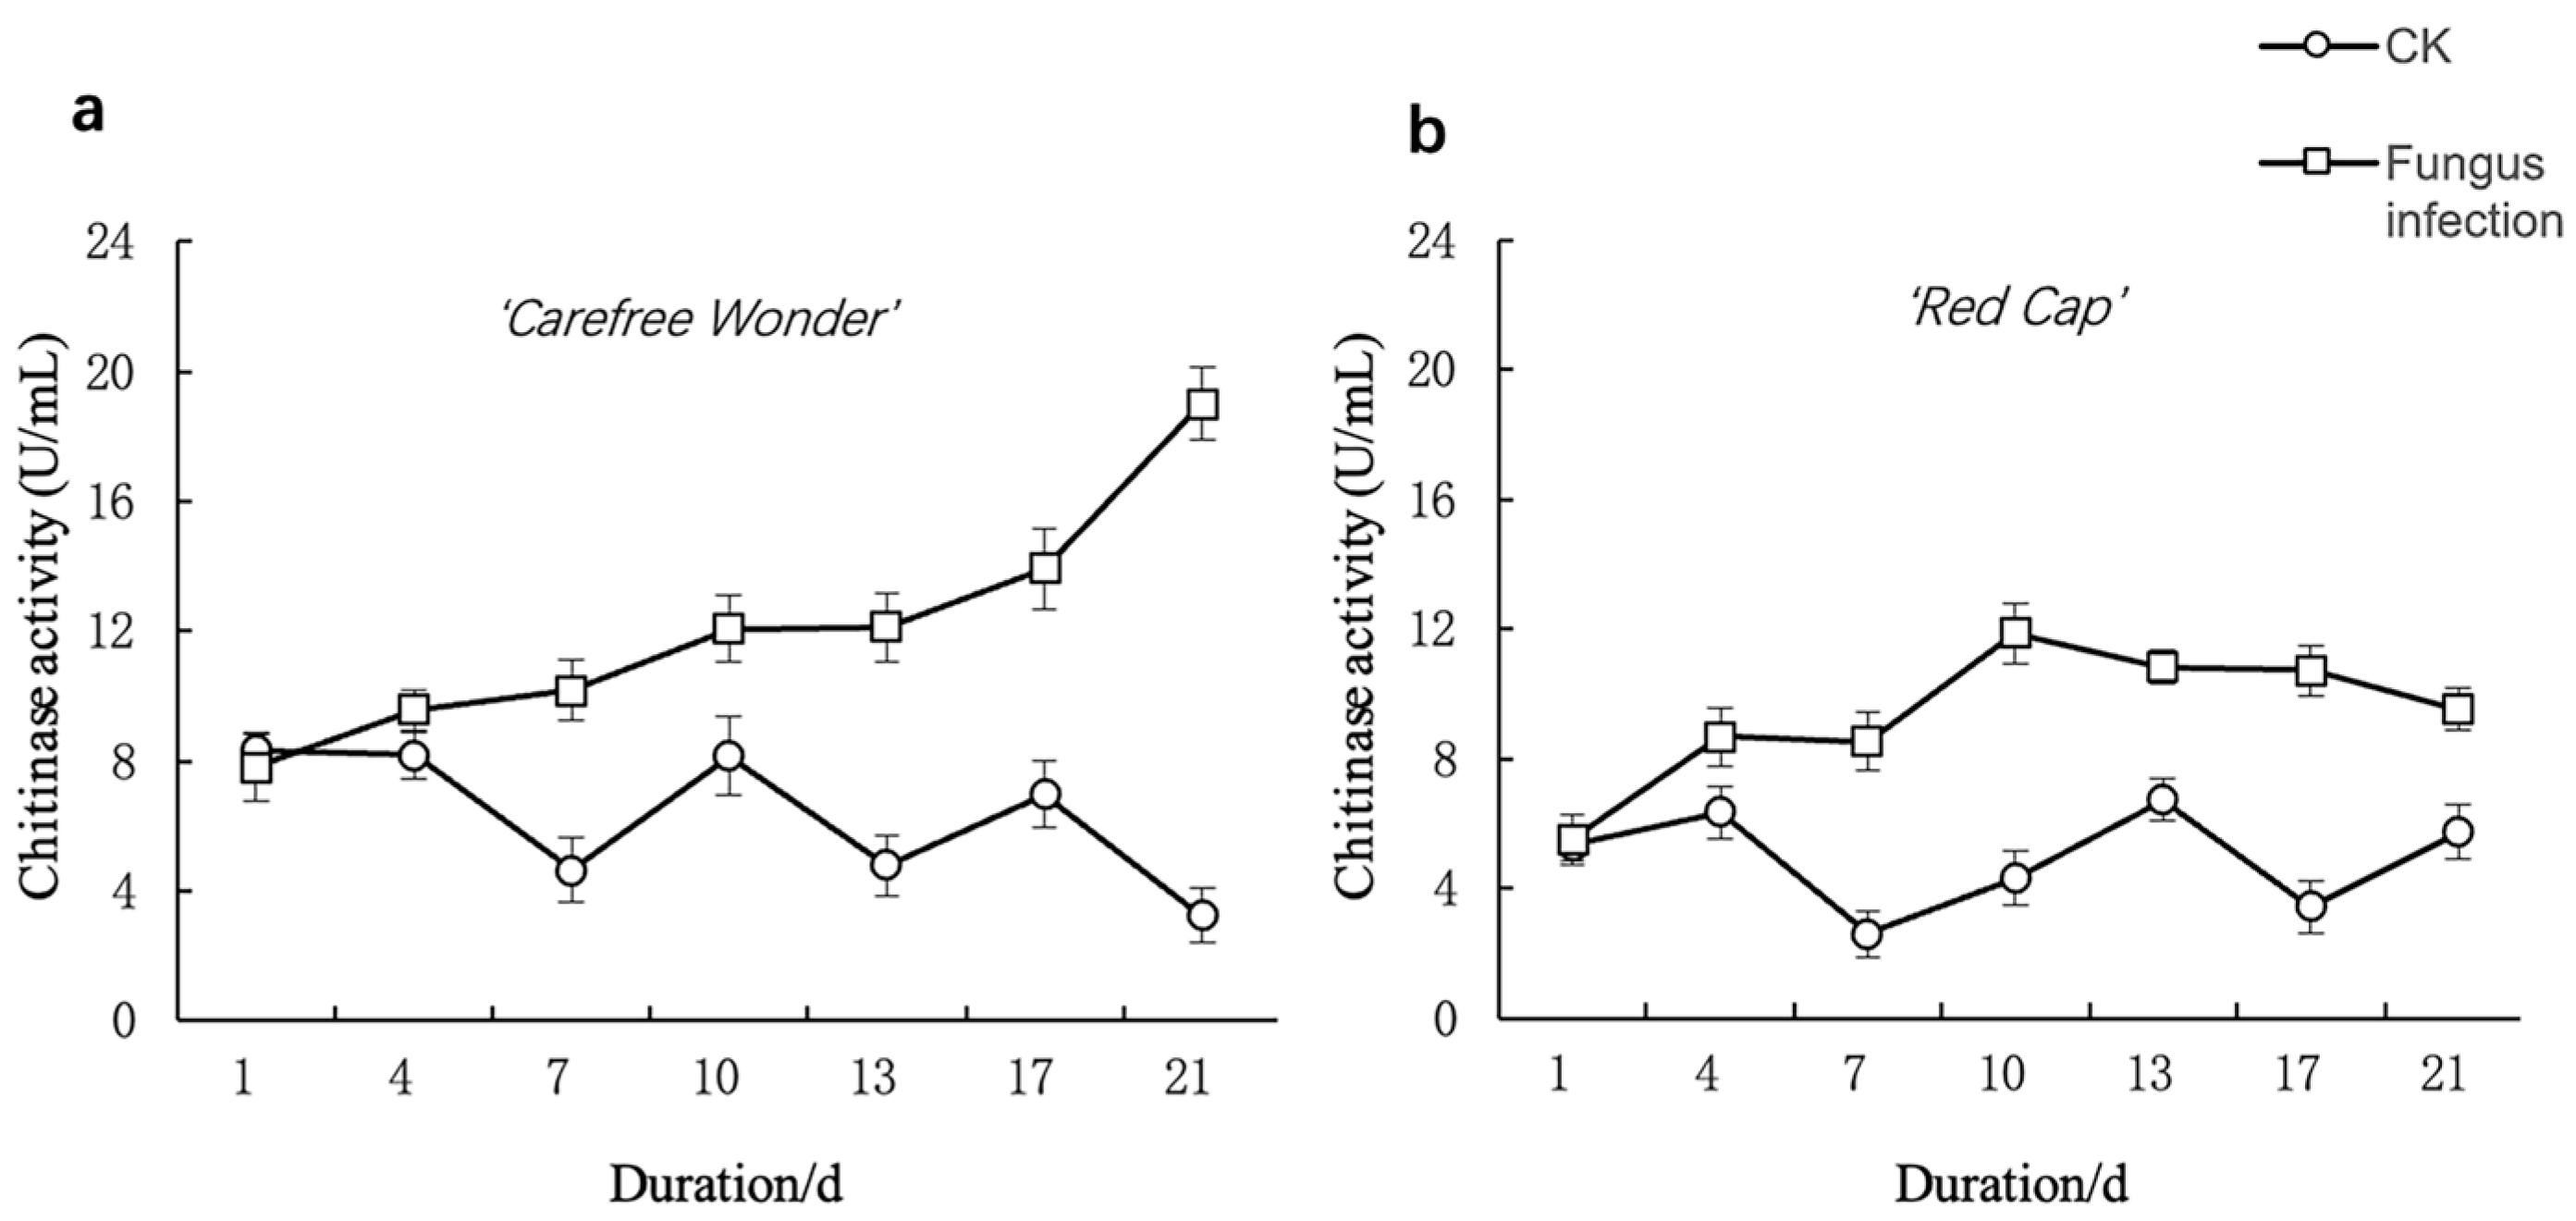
3.3.1. Chitinase Asctivity

Following inoculation, chitinase activity in the ‘Carefree Wonder’ cultivar became significantly higher than that of the control starting from day 7, reaching its peak on day 21 (p < 0.05) (Figure 9a). In the ‘Red Cap’ cultivar, the chitinase activity was significantly higher than the control beginning on day 4 and peaked on day 10 (p < 0.05) (Figure 9b). Under both control and inoculated conditions, the chitinase activity of ‘Carefree Wonder’ was consistently and markedly higher than that of ‘Red Cap’.

3.3.2. β-1,3-Glucanase Activity

Following inoculation, the β-1,3-glucanase activity in the ‘Carefree Wonder’ cultivar significantly increased on day 7 and reached its peak on the same day (p < 0.05) (Figure 10a). In the ‘Red Cap’ cultivar, the β-1,3-glucanase activity was significantly higher than the control on both days 7 and 17, with a marked increase and peak observed on day 17 (p < 0.05) (Figure 10b). Under both control and inoculated conditions, the β-1,3-glucanase activity in ‘Carefree Wonder’ remained consistently higher than that in ‘Red Cap’.

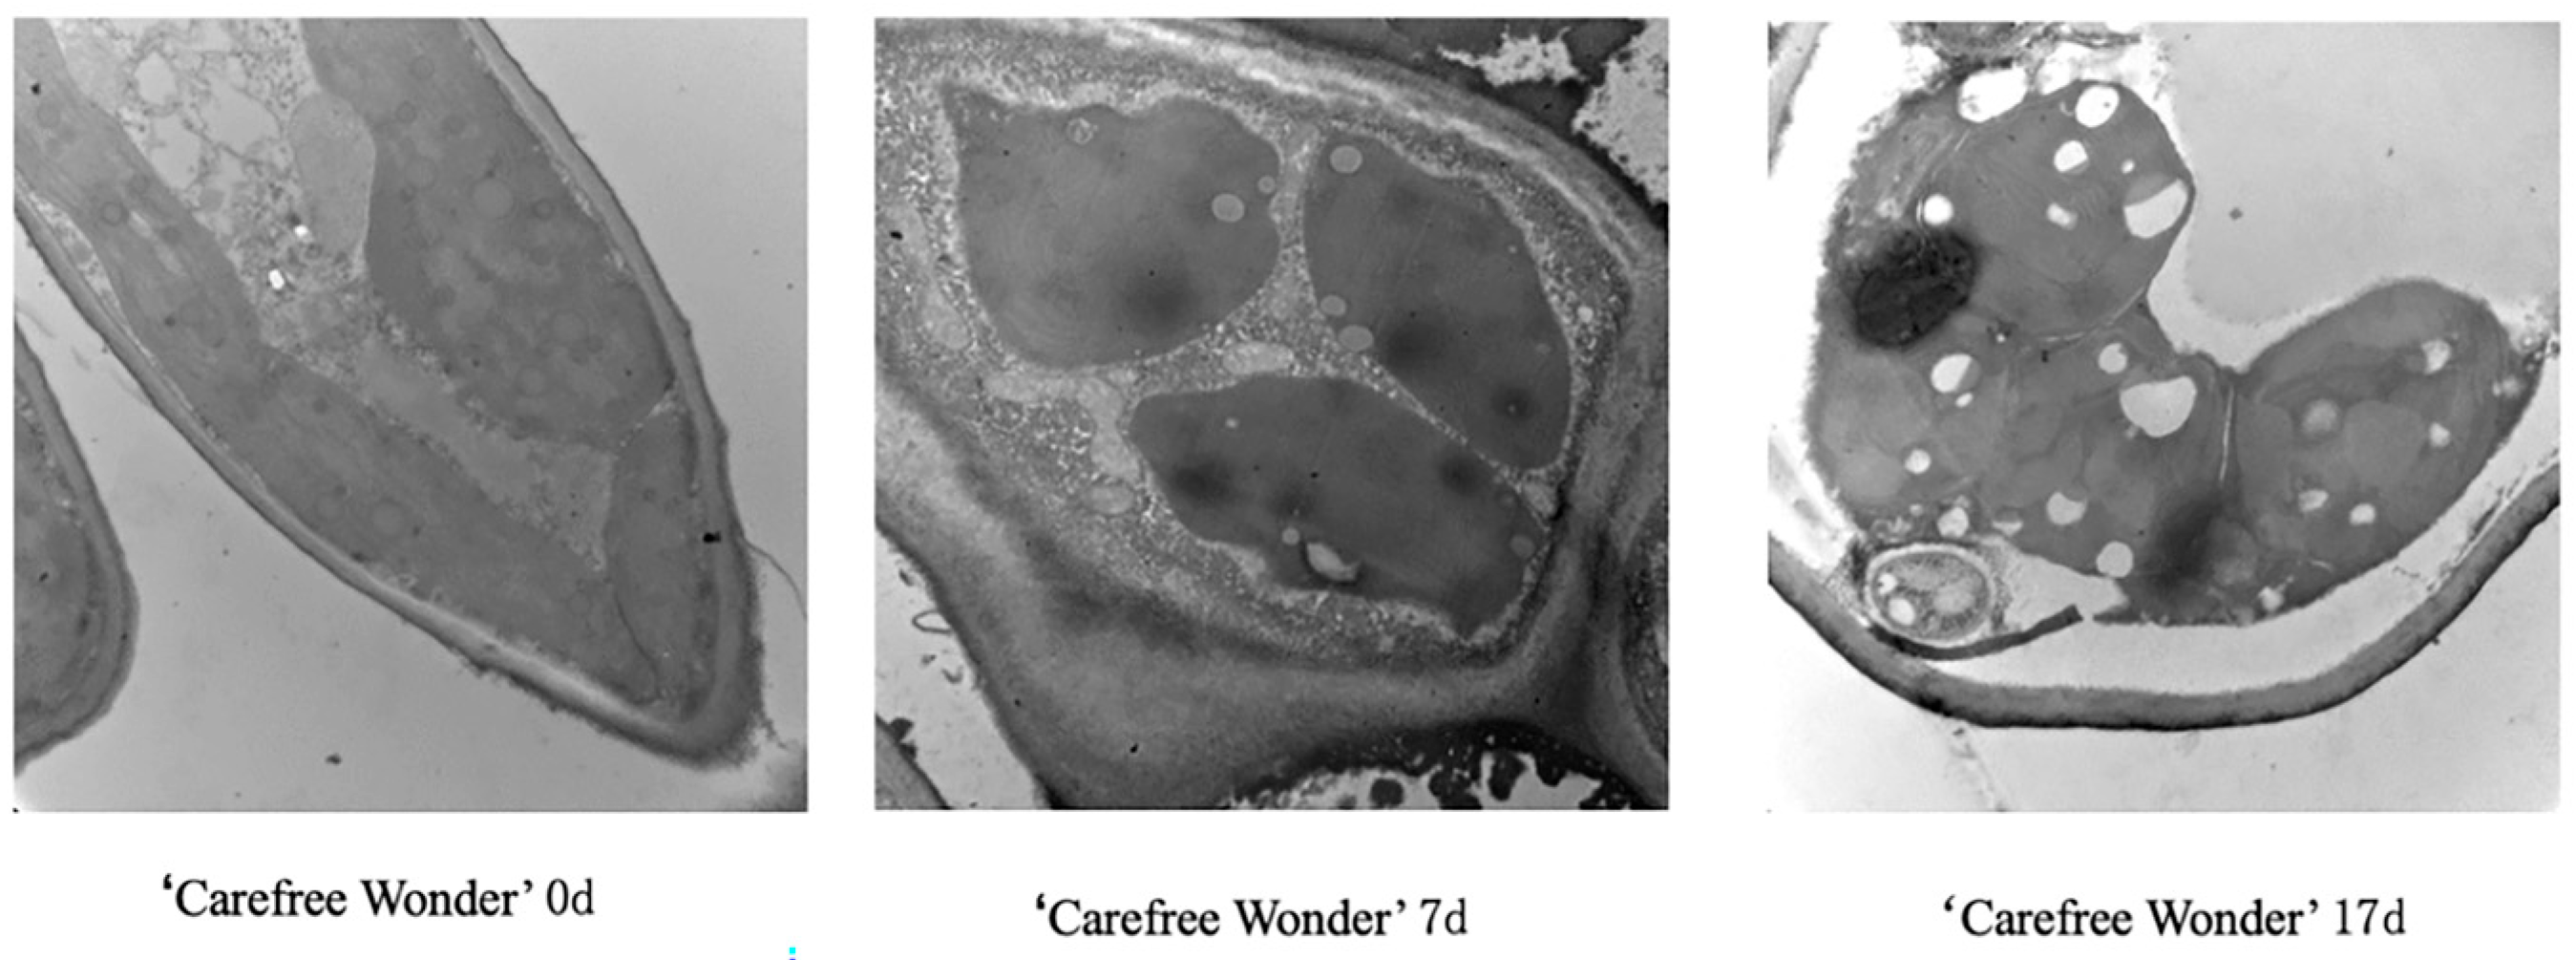
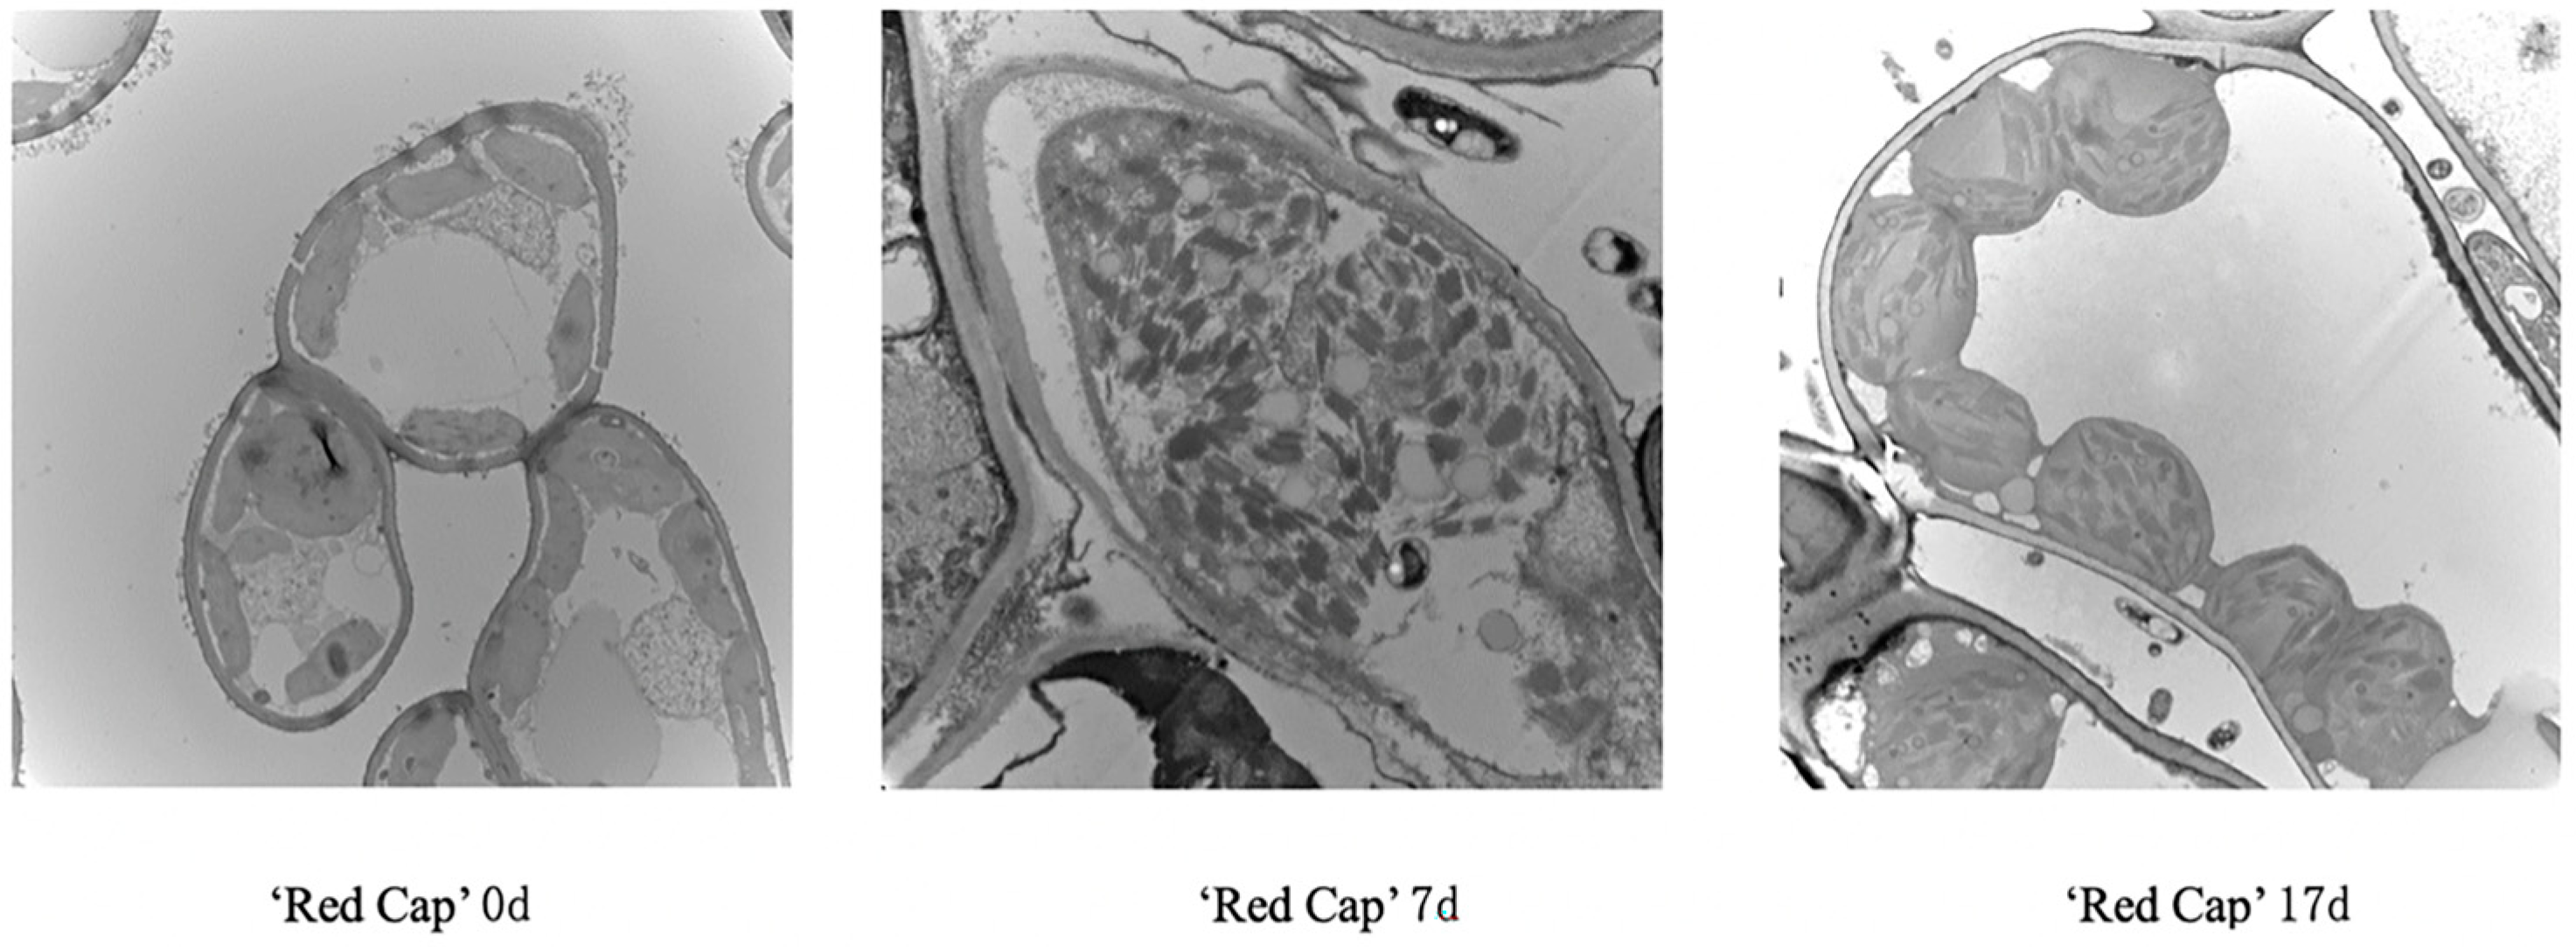
3.4. Ultrastructural Changes in Leaf Tissues

As shown in Figure 11 and Figure 12, on day 1 post-inoculation, mesophyll cells of both cultivars appeared healthy and intact. The intercellular spaces were clear and free of impurities.
By day 7 post-inoculation, mesophyll cells in ‘Carefree Wonder’ exhibited cell wall thickening with an uneven distribution, and chloroplasts became swollen, deformed, and shifted toward the center of the cell, with aggregation observed. Grana and stroma thylakoid structures became blurred and indistinct. In contrast, ‘Red Cap’ showed signs of plasmolysis and disorganized cytoplasm, chloroplast membranes were disrupted, and internal structures, such as grana and stroma thylakoids, leaked out. Both the nuclear and vacuolar membranes were damaged, and many impurities were present in the intercellular spaces.
By day 17 post-inoculation, chloroplasts in ‘Carefree Wonder’ mesophyll cells were nearly spherical with severe internal structural damage. The plasma membrane was compromised, and grana and stroma thylakoids were nearly absent. In ‘Red Cap’, chloroplasts became highly swollen and almost spherical, with extensive destruction of grana and stroma thylakoids. Intracellular contents leaked out, the cytoplasmic matrix was largely lost, vacuolization occurred, and the intercellular space appeared chaotic.

3.5. Correlation Analysis Between EIS Parameters and Physiological Indicators

During the infection process of rose black spot disease, the electrical impedance parameters re and τ exhibited highly significant positive correlations with reducing sugar and free proline contents (p < 0.01), with the highest correlation coefficient (r) reaching 0.774 (Table 1). The parameter re showed a highly significant correlation with chitinase activity (p < 0.01) and a significant correlation with β-1,3-glucanase activity (p < 0.05). Meanwhile, τ was highly significantly and positively correlated with both chitinase and β-1,3-glucanase activities (p < 0.01), with correlation coefficients r of 0.605 and 0.710, respectively.
As shown in Table 2, when reducing sugar and free proline contents were used as independent variables in the regression analysis, re showed the highest coefficient of determination with reducing sugar (R2 = 0.479), and the regression equation reached a significant level (p = 0.003 *). τ exhibited the highest coefficient of determination with β-1,3-glucanase activity (R2 = 0.725), and the regression equation reached a highly significant level (p = 0.000 **).

4. Discussion

4.1. Changes in Plant Physiological Characteristics in Relation to Rose Black Spot Disease

Free proline is an important osmotic regulator that accumulates in plants under abiotic or biotic stress. Amino acid levels often change in response to pathogen infection [31]. Xu [32] suggested that pathogens may use proline as a nutrient source for their growth and reproduction, leading to a reduction in amino acid levels. Xu and Meng [33] further proposed that free proline not only serves as a nutrient for pathogens but also functions as an antimicrobial compound that can be induced by pathogens to enhance plant disease resistance. They also found that variants showing a decrease in proline content were the most susceptible ones, which they attributed to a poor capacity for proline biosynthesis.
The results of the present study are consistent with those of Xu and Meng [33]. Following pathogen inoculation, free proline levels in both the resistant cultivar ‘Carefree Wonder’ and the susceptible cultivar ‘Red Cap’ showed an overall increasing trend. This suggests that, upon initial pathogen perception, proline biosynthesis may be induced to enhance resistance. However, in the susceptible cultivar, resistance is weaker, and proline might later be consumed by the pathogen, resulting in a temporary decline before being re-induced. This dynamic adjustment results in a consistently higher proline level in the resistant cultivar, indicating that the internal proline content can, to some extent, reflect disease resistance in roses.
Carbohydrates are vital structural and metabolic substrates in plants, and their levels are closely associated with disease development [34,35] The findings of this study are consistent with those of Wang [36] and Song [37] showing an increasing trend in the reducing sugar content in both rose variants after inoculation. This suggests that sugar metabolism is activated as part of the plant’s defense response against pathogen invasion. In this study, the resistant cultivar Rosa hybrida ‘Carefree Wonder’ exhibited a higher reducing sugar content than the susceptible cultivar Rosa hybrida ‘Red Cap’, and the significant increase in the reducing sugar content occurred earlier in ‘Carefree Wonder’ than in ‘Red Cap’. This higher and earlier sugar accumulation may indicate stronger disease resistance.
Chitinase and β-1,3-glucanase play cooperative roles in defending against fungal infections by degrading components of fungal cell walls and enhancing plant resistance [38,39,40,41,42]. Chitinase is a key pathogenesis-related protein involved in defense against both fungal and insect pests [43]. In this study, the chitinase activity in Rosa hybrida ‘Carefree Wonder’ continuously increased over time, whereas in Rosa hybrida ‘Red Cap’, it showed a decline during the later stages. This suggests that the resistant cultivar maintains a more robust and sustained defense response, while the susceptible one cannot sustain high enzyme activity levels, reflecting weaker resistance. Both cultivars showed a rapid and significant increase in chitinase activity on day 4 post-inoculation, indicating an early response to pathogen invasion. However, the enzyme activity was consistently higher in the resistant cultivar, implying that it can more effectively degrade fungal cell walls, releasing wall fragments that act as elicitors to trigger additional defense mechanisms.
After inoculation, the increase in β-1,3-glucanase activity in both cultivars occurred later than that of chitinase, indicating that β-1,3-glucanase plays a defensive role at a later stage compared to chitinase. Upon pathogen attack, the enzyme hydrolyzes the β-1,3-glucans in the outer fungal cell wall, thus degrading the pathogen structure and protecting the plant. These results are consistent with the findings of Van Loon et al. [44] and Li et al. [45]. The β-1,3-glucanase activity in ‘Red Cap’ was significantly lower than in ‘Carefree Wonder’, indicating that a higher β-1,3-glucanase activity is associated with stronger resistance in rose cultivars. Moreover, the rate of increase in enzyme activity post-inoculation was faster in the resistant cultivar, aligning with findings by Song et al. [46] in their study of sugarcane resistance to smut disease.

4.2. Changes in Electrical Impedance Spectroscopy (EIS) and Rose Black Spot Disease

In this study, as disease severity increased during infection by the pathogen, both rose cultivars, i.e., ‘Carefree Wonder’ and ‘Red Cap’, exhibited a gradual increase in the arc magnitude of their impedance spectra. Notably, the arc magnitude in ‘Red Cap’ increased significantly earlier than in ‘Carefree Wonder’, indicating that the plants had activated their defense mechanisms in response to the infection. One of the first responses was enhancing membrane stability. On day 7, mesophyll cells in ‘Carefree Wonder’ showed uneven thickening of the cell wall, while those in ‘Red Cap’ displayed plasmolysis and cytoplasmic disorganization. In both variants, damage was observed in chloroplast membranes, grana, and stroma thylakoids; nuclear and vacuolar membranes were also disrupted, and numerous impurities were seen in the intercellular spaces.
As osmotic regulatory substances, such as soluble sugars and free proline, increased within the cells, the concentration of cell sap rose. When an electric current passes through the intercellular space—where ionic concentration is relatively low—resistive components dominate over capacitive components. However, as current frequency increases, extracellular ions become activated, increasing capacitive reactance. When the current passes through the intracellular environment, which contains more ions, the capacitive component continues to increase, resulting in a higher peak in the EIS curve. These observations indicate that the impedance spectrum is closely associated with both plant resistance and disease severity.
Our results showed that with increasing disease severity, both reducing sugar and free proline contents increased, leading to a rise in cell sap concentration and consequently an increase in impedance values. This was reflected by the upward trends in both extracellular (re) and intracellular (ri) resistivity, which were highly significantly positively correlated with reducing sugar and free proline levels (p < 0.01). The increase in ri was more pronounced and occurred earlier in the resistant cultivar compared to the susceptible one. Notably, ‘Carefree Wonder’ reached its peak earlier than ‘Red Cap’, suggesting that the resistant cultivar activated its defense responses earlier by enhancing membrane fluidity and increasing sugar levels to counteract the infection.
Therefore, we conclude that EIS is a promising and effective method for identifying rose resistance to black spot disease. It allows for accurate and non-destructive early prediction of disease progression and plant resistance levels. Although controllable factors were strictly regulated during the experiment, some uncontrollable factors, particularly soil moisture, may still have introduced variability and affected the results. Nevertheless, the findings obtained in this study provide a theoretical basis and data support for future research. In the next phase, we plan to conduct broader testing across a wider range of rose cultivars to further advance the monitoring of black spot disease in roses.

5. Conclusions

In the absence of inoculation, the resistant rose cultivar exhibited a significantly higher baseline level of reducing sugars compared to the susceptible rose. Following infection, the reducing sugar content in the resistant cultivar increased at a much faster rate, indicating a strong correlation between reducing sugar levels and disease progression. Therefore, the reducing sugar content may serve as an important selection indicator for black spot resistance in rose breeding programs. After inoculation, the electrical impedance spectroscopy (EIS) curves of both rose types showed arc-shaped features that were closely associated with disease development. The resistant cultivar consistently exhibited higher impedance values than the susceptible one. These spectral differences suggest that EIS can serve as a qualitative diagnostic tool for identifying rose black spot disease and enable real-time monitoring to help control the spread and progression of the disease. Notably, correlation analysis of extracellular resistivity (re) with the reducing sugar content, free proline content, chitinase activity, and β-1,3-glucanase activity revealed that re is the most effective EIS parameter for evaluating the infection status of rose black spot disease. By analyzing changes in re, it is possible to assess the severity of infection in a timely manner, thereby providing a novel parameter and approach for the development of rose black spot detection methods.

Author Contributions

Conceptualization, B.D. and J.Q.; methodology, G.S.; software, T.M.; validation, T.M. and D.T.; formal analysis, R.W. and T.L.; investigation, Y.W.; resources, G.S., J.Q. and B.D.; data curation, T.M.; writing—original draft preparation, T.M.; writing—review and editing, T.M.; visualization, T.M. All authors have read and agreed to the published version of the manuscript.

Funding

This research was supported by Hebei Province key research and development plan project tasks (22326510D) and Hebei Agriculture Research System (HBCT2024200404).

Data Availability Statement

The original findings presented in this study are included in the article. For further inquiries, please contact the corresponding authors.

Conflicts of Interest

The authors declare no conflicts of interest.

References

  1. Bai, J.R.; Zhang, Q.X.; Luo, L.; Pan, H.T.; Yu, C. Pollen morphology of some Chinese traditional roses. Bull. Bot. Res. 2011, 31, 15. [Google Scholar]
  2. Li, C.; Li, Y.; Chu, P.; Hao-Hao, Z.; Wei, Z.; Cheng, Y.; Liu, X.; Zhao, F.; Li, Y.J.; Zhang, Z.; et al. Effects of salt stress on sucrose metabolism and growth in Chinese rose (Rosa chinensis). Biotechnol. Biotechnol. Equip. 2022, 36, 706–716. [Google Scholar] [CrossRef]
  3. Debener, T.; Byrne, D.H. Disease resistance breeding in rose: Current status and potential of biotechnological tools. Plant Sci. 2014, 228, 107–117. [Google Scholar]
  4. Drewes-Alvarez, R. Black Spot. In Encyclopedia of RoseScience; Roberts, A., Debener, T., Gudin, S., Eds.; Elsevier Science: Oxford, UK, 2003; pp. 148–153. [Google Scholar]
  5. Horst, R.K. Compendium of Rose Diseases; APS Press: St Paul, MN, USA, 2007. [Google Scholar]
  6. Dovas, C.I.; Katis, N.I. A spot nested RT-PCR methods for the simultaneous detection of members of the Vitivirus and F-oveavirus genera in grapevine. J. Virol. Methods 2003, 170, 99–106. [Google Scholar] [CrossRef]
  7. Shen, S.; Xu, W.; Lu, J.; Wang, S.; Huang, Y.; Zeng, X.; Xiao, W.; Yin, J. Recent progress on fluorescent probes for viruses. Chin. Chem. Lett. 2024, 35, 108360. [Google Scholar] [CrossRef]
  8. Chaerle, L.; Caeneghem, W.V.; Messens, E.; Lambers, H.; Van Montagu, M.; Van Der Straeten, D. Presymptomatic visualization of plant–virus interactions by thermography. Nat. Biotechnol. 1999, 17, 813–816. [Google Scholar] [CrossRef]
  9. Staskawicz, B.J. Genetics of plant-pathogen interactions specifying plant disease resistance. Plant Physiol. 2001, 125, 73–76. [Google Scholar] [CrossRef]
  10. Wang, L.M.; Zhang, Q.X. A Review of the Research on the Genetic Engineering of Rose Black-spot (Diplocarpon rosae Wolf) Fungus Disease. J. Cent. South Univ. For. Technol. 2003, 5, 92–95. [Google Scholar]
  11. Santi, S.; De Marco, F.; Polizzotto, R.; Grisan, S.; Musetti, R. Recovery from stolbur disease in grapevine involves changes in sugar transport and metabolism. Front. Plant Sci. 2013, 4, 171. [Google Scholar] [CrossRef]
  12. Molano, J.; Polacheck, I.; Duran, A.; Cabib, E. An endochitinase from wheat germ. Activity on nascent and preformed chitin. J. Biol. Chem. 1979, 254, 4901–4907. [Google Scholar]
  13. Chandra, S.; Dutta, A.K.; Chandrashekara, K.N.; Acharya, K. In silico Characterization, Homology Modeling of Camellia sinensis Chitinase and its Evolutionary Analyses with Other Plant Chitinases. Proc. Natl. Acad. Sci. India Sect. B Biol. Sci. 2017, 87, 685–695. [Google Scholar] [CrossRef]
  14. Balasubramanian, V.; Vashisht, D.; Cletus, J.; Sakthivel, N. Plant β-1,3-glucanases: Their biological functions and transgenic expression against phytopathogenic fungi. Biotechnol. Lett. 2012, 34, 1983–1990. [Google Scholar] [CrossRef]
  15. Liu, Y.; Li, D.M.; Qian, J.; Di, B.; Zhang, G.; Ren, Z.H. Electrical impedance spectroscopy (EIS) in plant roots research: Are view. Plant Methods 2021, 17, 118. [Google Scholar] [CrossRef]
  16. Di, B.; Luoranen, J.; Lehto, T.; Himanen, K.; Silvennoinen, M.; Silvennoinen, R.; Repo, T. Biophysical changes in the roots of Scots pine seedlings during cold acclimation and after frost damage. For. Ecol. Manag. 2019, 431, 63–72. [Google Scholar] [CrossRef]
  17. Astashev, M.E.; Konchekov, E.M.; Kolik, L.V.; Gudkov, S.V. Electric impedance spectroscopy in trees condition analysis: Theory and experiment. Sensors 2022, 22, 8310. [Google Scholar] [CrossRef] [PubMed]
  18. Wang, A.F.; Di, B.; Repo, T.; Roitto, M.; Zhang, G. Responses of parameters for electrical impedance spectroscopy and pressure-volume curves to drought stress in Pinus bungeana seedlings. Forests 2020, 11, 359. [Google Scholar] [CrossRef]
  19. Zhang, G.; Li, Y.-Q.; Dong, S.-H. Assessing frost hardiness of Pinus bungeana shoots and needles by electrical impedance spectroscopy with and without freezing tests. J. Plant Ecol. 2010, 3, 285–293. [Google Scholar] [CrossRef]
  20. Repo, T.; Korhonen, A.; Lehto, T.; Silvennoinen, R. Assessment of frost damage in mycorrhizal and non-mycorrhizal roots of Scots pine seedlings using classification analysis of their electrical impedance spectra. Trees 2016, 30, 483–495. [Google Scholar] [CrossRef]
  21. Xiang, D.; Zhang, G.; Gong, R.; Di, B.; Tian, Y. Effect of Cadmium Stress on Growth and Electrical Impedance Spectroscopy Parameters of Cotinus coggygria Roots. Water Air Soil Pollut. 2018, 229, 279. [Google Scholar] [CrossRef]
  22. Ryyppö, A.; Repo, T.; Vapaavuori, E. Development of freezing tolerance in roots and shoots of Scots pine seedlings at nonfreezing temperatures. Can. J. For. Res. 1998, 28, 557–565. [Google Scholar] [CrossRef]
  23. Väinölä, A.; Repo, T. Impedance spectroscopy in frost hardiness evaluation of Rhododendron leaves. Ann. Bot. 2000, 86, 799–805. [Google Scholar] [CrossRef]
  24. Sharma, S.R.; Kolte, S.J. Effect of soil-applied NPK fertilizers on severity of black spot disease (Alternaria brassicae) and yield of oilseed rape. Plant Soil 1994, 167, 313–320. [Google Scholar] [CrossRef]
  25. Allum, J.F.; Bringloe, D.H.; Roberts, A.V. Interac tions of four pathotypes of Diplocarpon rosae with species and hybrids of Rosa. Plant Pathol. 2010, 59, 516. [Google Scholar] [CrossRef]
  26. Zhang, G.; Ryyppö, A.; Repo, T. The electrical impedance spectroscopy of Scots pine needles during cold acclimation. Physiol. Plant. 2002, 115, 385–392. [Google Scholar]
  27. Miller, G.L. Use of Dinitrosalicylic Acid Reagent for Determination of Reducing Sugar. Anal. Chem. 1959, 31, 426–428. [Google Scholar] [CrossRef]
  28. Troll, W.; Lindsley, J. A photometric method for the determination of proline. J. Biol. Chem. 1955, 215, 655–660. [Google Scholar] [CrossRef] [PubMed]
  29. Boller, T.; Mauch, F. Colorimetric Assay for Chitinase. Methods in Enzymology; Academic Press: Cambridge, MA, USA, 1988; pp. 430–435. [Google Scholar]
  30. Ramada, M.H.S.; Lopes, F.Á.C.; Ulhoa, C.J.; do Nascimento Silva, R. Optimized microplate β-1,3-glucanase assay system for Trichoderma spp. screening. J. Microbiol. Methods 2010, 81, 6–10. [Google Scholar] [CrossRef]
  31. Gaveliene, V.; Pakalniskyte, L.; Novickiene, L. Regulation of proline and ethylene levels in rape seedlings for freezing tolerance. Cent. Eur. J. Biol. 2014, 9, 1099–1107. [Google Scholar] [CrossRef]
  32. Xu, M. Effect of eose pigment and amino acids by rose black spot. Acta Hortic. Sin. 1985, 1, 61–64. [Google Scholar]
  33. Xu, D.; Meng, Z. Researchonthe Resistant Mechanism of the Rose Black Spot. J. Anhui Agri. Sci. 2007, 27, 8532–8533. [Google Scholar]
  34. Albrecht, U.; Bowman, K.D. Gene expression in Citrus sinensis (L.) Osbeck following infection with the bacterial pathogen Candidatus liberibacter asiaticus causing Huanglongbing in Florida. Plant Sci. 2008, 175, 291–306. [Google Scholar] [CrossRef]
  35. Martinelli, F.; Uratsu, S.L.; Albrecht, U.; Reagan, R.L.; Phu, M.L.; Britton, M.; Buffalo, V.; Fass, J.; Leicht, E.; Zhao, W.; et al. Transcriptome profiling of citrus fruit response to huanglongbing disease. PloS ONE 2012, 7, e38039. [Google Scholar] [CrossRef] [PubMed]
  36. Wang, L. Path-Physiology Research of Jujube Fruit Shrink Disease; Hebei Agricultural University: Baoding, China, 2011. [Google Scholar]
  37. Song, F.; Zheng, Z.; Ge, X. Changes in contents of sugars and invertase activity in cotton seedings after infection by Fusarium oxysporum. Acta Agric. Zhejiangensis 1996, 2, 29–33. [Google Scholar]
  38. Fang, W.; Sanz, A.B.; Bartual, S.G.; Wang, B.; Ferenbach, A.T.; Farkaš, V.; Hurtado-Guerrero, R.; Arroyo, J.; Van Aalten, D.M. Mechanisms of redundancy and specificity of the Aspergillus fumigatus Crh transglycosylases. Nat. Commun. 2019, 10, 1669. [Google Scholar] [CrossRef]
  39. Toufiq, N.; Tabassum, B.; Bhatti, M.U.; Khan, A.; Tariq, M.; Shahid, N.; Nasir, I.A.; Husnain, T. Improved antifungal activity of barley derived chitinase I gene that overexpress a 32 kDa recombinant chitinase in Escherichia coli host. Braz. J. Microbiol. 2018, 49, 414–421. [Google Scholar] [CrossRef]
  40. Sharma, P.; Dubey, R.S. Involvement of oxidative stress and role of antioxidative defense system in growing rice seedlings exposed to toxic concentrations of aluminum. Plant Cell Rep. 2007, 26, 2027–2038. [Google Scholar] [CrossRef] [PubMed]
  41. Mauch, F.; Mauch-Mani, B.; Boller, T. Antifungal Hydrolases in Pea Tissue 1: II. Inhibition of Fungal Growth by Combinations of Chitinase and β-1,3-Glucanase. Plant Physiol. 1988, 88, 936–942. [Google Scholar] [CrossRef]
  42. Brogue, K.; Chet, I.; Holliday, M.; Cressman, R.; Biddle, P.; Knowlton, S.; Mauvais, C.J.; Broglie, R. Transgenic Plants with Enhanced Resistance to the Fungal Pathogen Rhizoctonia solani. Science 1991, 254, 1194–1197. [Google Scholar] [CrossRef]
  43. Grover, A. Plant Chitinases: Genetic Diversity and Physiological Roles. Crit. Rev. Plant Sci. 2012, 31, 57–73. [Google Scholar] [CrossRef]
  44. van Loon, L.C. Pathogenesis-related proteins. Plant Mol. Biol. 1985, 4, 111–116. [Google Scholar] [CrossRef]
  45. Li, S.; Du, C. Effects of lipopeptide on chitinase and glucanase of Magnaporthe grisea. Acta Phytopathol. Sin. 2021, 51, 789–795. [Google Scholar]
  46. Song, Q.; Pratishka, S.; Rajesh, K.S.; Wang, L.; Nong, Y.; Yang, L.; Li, Y. Changes of related enzyme activity and endogenous hormone content in sugarcane response to smut fungus infection. J. South. Agric. 2018, 49, 650–655. [Google Scholar]
Figure 1. Changes in electrical impedance spectra of Rosa hybrida ‘Carefree Wonder’ at 1, 4, 7, 10, 13, 17, and 21 days after fungal inoculation.
Agronomy 15 01800 g001
Figure 2. Changes in electrical impedance spectra of Rosa hybrida ‘Red Cap’ at 1, 4, 7, 10, 13, 17, and 21 days after fungal inoculation.
Agronomy 15 01800 g002
Figure 3. Changes in intracellular resistivity (ri) of leaves in Rosa hybrida ‘Carefree Wonder’ (a) and Rosa hybrida ‘Red Cap’ (b) at 1, 4, 7, 10, 13, 17, and 21 days after fungal inoculation. Error bars indicate standard error (n = 36). Setting the threshold p < 0.05 indicates a significant correlation.
Agronomy 15 01800 g003
Figure 4. Changes in extracellular resistivity (re) of leaves in Rosa hybrida ‘Carefree Wonder’ (a) and Rosa hybrida ‘Red Cap’ (b) at 1, 4, 7, 10, 13, 17, and 21 days after fungal inoculation. Error bars indicate standard error (n = 36). Setting the threshold p < 0.05 indicates a significant correlation.
Agronomy 15 01800 g004
Figure 5. Changes in relaxation time (τ) of leaves in Rosa hybrida ‘Carefree Wonder’ (a) and Rosa hybrida ‘Red Cap’ (b) at 1, 4, 7, 10, 13, 17, and 21 days after fungal inoculation. Error bars indicate standard error (n = 36). Setting the threshold p < 0.05 indicates a significant correlation.
Agronomy 15 01800 g005
Figure 6. Changes in relaxation time (τ) and relaxation time distribution coefficient (ψ) of leaves in Rosa hybrida ‘Carefree Wonder’ (a) and Rosa hybrida ‘Red Cap’ (b) at 1, 4, 7, 10, 13, 17, and 21 days after fungal inoculation. Error bars indicate standard error (n = 36). Setting the threshold p < 0.05 indicates a significant correlation.
Agronomy 15 01800 g006
Figure 7. Changes in reducing sugar content in leaves of Rosa hybrida ‘Carefree Wonder’ (a) and Rosa hybrida ‘Red Cap’ (b) at 1, 4, 7, 10, 13, 17, and 21 days after fungal inoculation. Error bars indicate standard error (n = 36). Setting the threshold p < 0.05 indicates a significant correlation.
Agronomy 15 01800 g007
Figure 8. Changes in free proline content in leaves of Rosa hybrida ‘Carefree Wonder’ (a) and Rosa hybrida ‘Red Cap’ (b) at 1, 4, 7, 10, 13, 17, and 21 days after fungal inoculation. Error bars indicate standard error (n = 36). Setting the threshold p < 0.05 indicates a significant correlation.
Agronomy 15 01800 g008
Figure 9. Changes in chitinase activity in leaves of Rosa hybrida ‘Carefree Wonder’ (a) and Rosa hybrida ‘Red Cap’ (b) at 1, 4, 7, 10, 13, 17, and 21 days after fungal inoculation. Error bars indicate standard error (n = 36). Setting the threshold p < 0.05 indicates a significant correlation.
Agronomy 15 01800 g009
Figure 10. Changes in β-1,3-glucanase activity in leaves of Rosa hybrida ‘Carefree Wonder’ (a) and Rosa hybrida ‘Red Cap’ (b) at 1, 4, 7, 10, 13, 17, and 21 days after fungal inoculation. Error bars indicate standard error (n = 36). Setting the threshold p < 0.05 indicates a significant correlation.
Agronomy 15 01800 g010
Figure 11. Ultrastructure of leaf cells at days 0, 7, and 17 in ‘Carefree Wonder’ after inoculation with the fungus.
Agronomy 15 01800 g011
Figure 12. Ultrastructure of leaf cells at days 0, 7, and 17 in ‘Red Cap’ after inoculation with the fungus.
Agronomy 15 01800 g012
Table 1. Correlation coefficient (r) between EIS parameters of rose leaves and physiological indicators.
EIS ParametersReducing SugarFree ProlineChitinaseβ-1,3-Glucanase
re0.678 **0.627 **0.631 **0.513 *
τ0.774 **0.607 **0.605 **0.710 **
* indicates a significant difference (p < 0.05); ** indicates a highly significant difference (p < 0.01). re represents extracellular resistivity, and τ represents relaxation time.
Table 2. Regression model of physiological indexes and EIS parameters of rose leaves after bacterial infection treatment.
EIS
Parameter
Physiological ParametersRegression ModelR2Significance
reReducing sugar
Free proline
y = −1.819 + 0.259x − 0.001x2
y = −16.541 + 1.476x − 0.005x2
0.479
0.399
0.003 **
0.009 **
Chitinasey = 3.934 + 0.095x0.3990.009 **
β-1,3-glucanasey = −6.214 + 0.381x − 0.002x20.4010.009 **
τReducing sugar
Free proline
y = −8.539 + 5.888x − 0.42x2
y = 11.458 + 6.359x + 0.468x2
0.637
0.369
0.000 **
0.016 *
Chitinase
β-1,3-glucanase
Y = 17.749 − 4.895x − 0.686x2
y = −16.05 + 8.895x − 0.78x2
0.419
0.725
0.007 **
0.000 **
re represents extracellular resistivity, and τ represents relaxation time. R2 is the coefficient of determination of the regression equation. * indicates a significant difference (p < 0.05); ** indicates a highly significant difference (p < 0.01), n = 36.
Disclaimer/Publisher’s Note: The statements, opinions and data contained in all publications are solely those of the individual author(s) and contributor(s) and not of MDPI and/or the editor(s). MDPI and/or the editor(s) disclaim responsibility for any injury to people or property resulting from any ideas, methods, instructions or products referred to in the content.

