Abstract
Verticillium wilt is characterized by chlorosis in leaves and is a devastating disease in eggplant. Early diagnosis, prior to the manifestation of symptoms, enables targeted management of the disease. In this study, we aim to detect early leaf wilt in eggplant leaves caused by Verticillium dahliae by integrating multispectral imaging with machine learning and deep learning techniques. Multispectral and chlorophyll fluorescence images were collected from leaves of the inbred eggplant line 11-435, including data on image texture, spectral reflectance, and chlorophyll fluorescence. Subsequently, we established a multispectral data model, fusion information model, and multispectral image–information fusion model. The multispectral image–information fusion model, integrated with a two-dimensional convolutional neural network (2D-CNN), demonstrated optimal performance in classifying early-stage Verticillium wilt infection, achieving a test accuracy of 99.37%. Additionally, transfer learning enabled us to diagnose early leaf wilt in another eggplant variety, the inbred line 14-345, with an accuracy of 84.54 ± 1.82%. Compared to traditional methods that rely on visible symptom observation and typically require about 10 days to confirm infection, this study achieved early detection of Verticillium wilt as soon as the third day post-inoculation. These findings underscore the potential of the fusion model as a valuable tool for the early detection of pre-symptomatic states in infected plants, thereby offering theoretical support for in-field detection of eggplant health.
1. Introduction
According to statistics reported by the Food and Agriculture Organization, eggplant ranks as the world’s fifth-largest economic crop, with a global production of approximately 50 million tons and a net worth exceeding USD 10 billion [1]. It is a globally important, nutrient-rich vegetable crop [2]. Despite its immense economic value, eggplant production is greatly affected by Verticillium wilt, a soil-borne fungal disease characterized by rapid spread, substantial losses, and considerable challenges in prevention and control [3,4]. Verticillium wilt, caused by Verticillium infection, affects more than 200 plant species, including most vegetables [5], flowers [6], and field crops [7]. The pathogen exhibits features such as a broad host range, morphologic and pathogenic variations, and noticeable physiological differentiation, and controlling Verticillium wilt is challenging because of artificial and natural selection pressures [8]. The conventional breeding methods alone face difficulties in meeting the disease-resistance requirements of eggplant production due to the limited availability of germplasm [9]. At present, chemical, physical, and agricultural measures are employed to manage leaf wilt in eggplant; however, these strategies are largely ineffective against soil-borne fungal pathogens. Therefore, early detection and timely intervention are critical to safeguard eggplant yield and quality.
The conventional diagnostic approaches mainly rely on visual inspection of eggplant leaves by plant protection personnel, based on experience or combined with laboratory testing methods [10]. Currently, these methods form the basis of disease monitoring; however, their long diagnostic times and inefficiencies hinder timely detection and treatment of Verticillium wilt [11]. In contrast, spectroscopic technologies offer real-time, non-destructive, and information-rich capabilities for monitoring the external traits, internal structures, and physiological conditions of plants [12]. Researchers have utilized hyperspectral, multispectral, and remote sensing imaging technologies for diagnosing Verticillium wilt. For instance, Gu et al. employed hyperspectral imaging technology to diagnose tomato spotted wilt virus, with an accuracy of 85.2%, which involved the use of a successive projections algorithm (SPA) combined with an enhanced random forest (RF) model [13]. Moreover, near-infrared spectral technology has proven crucial for early disease detection, demonstrating its advantages in early diagnosis [14,15,16]. Similarly, Kang et al. used drones to collect images and spectral data of cotton canopies, which were then analyzed with convolutional neural networks (CNNs) to estimate the severity of Verticillium wilt disease [17].
Leaves serve as indicators of plant health. Conrad et al. combined machine learning with near-infrared spectroscopy to diagnose rice blight at an early stage. Classification methods, including RF models and support vector machines (SVMs), have proven useful, with a classification accuracy of 86.1% [18], highlighting the potential of machine learning models combined with spectral technologies for detecting infected but asymptomatic plants in the early stages of disease. In another study, Sinha et al. studied grape leaf roll by measuring the spectral reflectance of leaves in the 350–2500 nm range under field conditions, and they identified characteristic wavelengths that differentiated healthy leaves from infected leaves, with a classification accuracy of 99% [19]. Zhang et al. achieved early non-destructive detection of Verticillium wilt in eggplant by combining a low-cost multispectral camera with deep learning, building a five-channel image fusion model. The optimized VGG16-triplet attention model reached an accuracy of 86.73% on the test set and identified disease on day 3 post-inoculation with 84.00% accuracy [20]. These results demonstrate the promise of multispectral imaging for early detection of Verticillium wilt in eggplant.
However, most existing studies have focused on spectral reflectance features while paying less attention to plant physiological responses during early infection. Chlorophyll fluorescence (CHIF) images, by reflecting photosynthetic efficiency and stress responses, can identify changes in plant physiological status before visible disease symptoms appear [21]. Since Verticillium wilt interferes with photosynthetic metabolism [22], CHIF data are expected to detect physiological abnormalities prior to visible symptoms. Thus, the fusion of multispectral images with CHIF images holds promise for improving the accuracy of early disease detection and enhancing the robustness of diagnostic models.
Transfer learning is the practice of applying a model trained in one domain to another domain. It also involves leveraging related tasks, datasets, or models from similar domains. This approach has found extensive application in spectral image categorization and computer vision. For instance, transfer learning using a self-designed CNN, combined with first-derivative and SNV spectral preprocessing, outperformed SVR and PLSR in estimating chlorophyll content across various cotton cultivars, demonstrating strong potential for field nutrient assessment [23]. In another study, deep learning was combined with transfer learning to enhance the generalization ability of near-infrared spectroscopy in detecting wheat scab, providing a theoretical basis for the practical application of this model [24].
In this study, multispectral and CHIF images, along with spectral reflectance, image texture features, and CHIF data, are utilized as inputs for machine learning and deep learning models to classify eggplant leaves within a 0–11-day observation window. The objective is to explore a strategy for early detection of Verticillium wilt in eggplant, including across different cultivars. Transfer learning and fine-tuning are introduced to improve model adaptability. This study aims to provide a methodological basis for pre-symptomatic disease identification, supporting early intervention and management of Verticillium wilt in eggplant.
2. Materials and Methods
2.1. Research Procedures
The experiment was divided into two parts: the main experiment and the transfer learning experiment. The research process is illustrated in Figure 1. In the main experiment, a two-stage modeling strategy was employed. In the first stage, one-dimensional features—including spectral reflectance from multispectral data, CHIF data, and texture features extracted using gray-level co-occurrence matrices (GLCMs) and local binary patterns (LBPs)—were used as inputs to train traditional machine learning models and shallow neural networks. In the second stage, two-dimensional multispectral images and CHIF images were directly input into CNNs to enable end-to-end feature learning and classification. This approach aimed to comprehensively exploit the physiological and spatial–spectral information for early detection of Verticillium wilt.
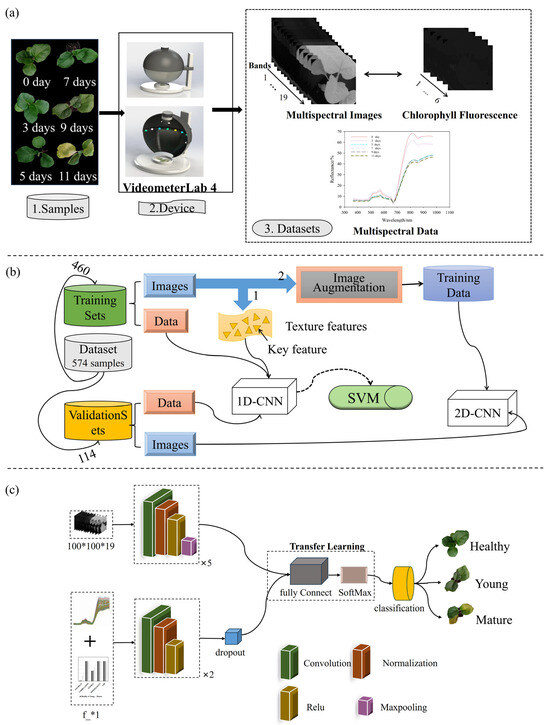
Figure 1.
Block diagram of the entire study, along with data collection, data preprocessing, and model training steps. (a) Shows the types and sources of test data. (b) Shows the overall workflow of the research. (c) Shows the structure of the CNN model used in the study.
The transfer learning experiment was designed to evaluate the generalization capability of the trained model by applying it to a different eggplant cultivar. This step was intended to assess the model’s robustness and potential for broader application in practical scenarios.
2.2. Plant Materials
This study employed two high-generation inbred eggplant lines, “11-435” and “14-345”, both independently developed and provided by the Key Laboratory for Vegetable Germplasm Enhancement and Utilization of Hebei. The inbred line “11-435” was used for model development and training, while the inbred line “14-345” was employed for transfer learning and validation of the model’s generalization capability. These lines are part of the laboratory’s long-term breeding program and were selected through multiple generations of selfing from elite local germplasm. Both lines belong to the Asian cultivar group of Solanum melongena L., and their numbering follows the internal breeding system of the laboratory. These materials are maintained in the laboratory’s germplasm collection. Both lines produce round dark purple fruits and are highly susceptible to Verticillium wilt, making them suitable materials for studying early-stage disease responses and detection.
The seedlings were cultivated on 1 March 2023, in a controlled climate chamber at Hebei Agricultural University, under standard horticultural practices as described by Wang et al. [25]. The chamber was maintained at 28 °C, with a 16/8 h light/dark photoperiod and approximately 60% relative humidity. Once the seedlings had developed 2 to 4 true leaves, they were carefully removed from the nursery trays. The roots were gently washed with sterile distilled water and longitudinally split to facilitate pathogen entry.
Inoculation was conducted using a Verticillium dahliae spore suspension at a concentration of 1 × 10⁷ spores/mL. Seedlings were immersed in the suspension for 10 min following the root-dip method. After inoculation, the seedlings were transferred to a growth chamber and maintained at 25 °C with a 16 h light/8 h dark photoperiod and relative humidity of 60–70%. Plants were allowed to recover for one day under these conditions before imaging and data collection.
2.3. Multispectral Imaging Equipment
The study employed the Videometer Lab 4 multispectral imaging system (Videometer A/S, Hørsholm, Denmark) for high-resolution imaging of eggplant leaf surfaces. This system enables rapid non-destructive acquisition of data on surface color, texture, and biochemical composition. It has a scanning area of 90 mm × 90 mm and is equipped with 19 light-emitting diodes (LEDs) at discrete wavelengths—365, 405, 430, 450, 470, 490, 515, 540, 570, 590, 630, 645, 660, 690, 780, 850, 880, 940, and 970 nm—covering ultraviolet (UV), visible (VIS), and near-infrared (NIR) spectral regions [26].
CHIF images were acquired by exciting chlorophyll using LED illumination at 630, 645, and 660 nm. Fluorescence emission was captured using a 700 nm long-pass filter to isolate chlorophyll-specific signals. This fluorescence signal provides an indirect measure of photosynthetic performance and plant stress status.
Multispectral and CHIF images were acquired in a closed integrating sphere to eliminate ambient light interference. Imaging sessions were conducted at six time points: before inoculation (0 day) and at 3, 5, 7, 9, and 11 days post-inoculation (dpi). At each time point, leaf images were captured from both healthy (control) and infected samples across the two eggplant cultivars.
2.4. Plant Disease Confirmation
After disinfection with 75% ethanol, followed by an additional minute of disinfection with 5% sodium hypochlorite, the leaf surface was cleaned three times with sterile water. The samples were placed on potato glucose agar plates and incubated for 5 days at 25 °C. The growing mycelium and the presence of V. dahliae were observed under an optical microscope (Zeiss Image Z2, Oberkochen, Germany).
2.5. Labeling Strategy
A total of 110 eggplant plants of the inbred line “11-435” were used in the main experiment, all of which were inoculated with a spore suspension of Verticillium dahliae. Leaf samples collected on day 0 served as healthy controls. Following inoculation, plants were allowed one day for recovery (no imaging conducted). To monitor disease progression, multispectral imaging was then performed every other day, specifically on days 3, 5, 7, 9, and 11 post-inoculation. By day 9, some plants began to exhibit typical symptoms such as leaf yellowing, wilting, and pale lesions, and most showed clear visual symptoms by day 11. Imaging was discontinued once visible symptoms appeared, and pathogen identification was carried out to confirm infection.
As all inoculated plants eventually developed symptoms, it was not feasible to directly label samples as “healthy” or “infected” based solely on final disease outcome. Therefore, principal component analysis (PCA) was applied to the spectral data to reduce dimensionality and explore patterns of variation among samples. This approach aided in developing a rational labeling strategy for training the classification model by distinguishing pre-symptomatic stages from healthy and symptomatic samples based on their spectral characteristics.
To further validate this labeling strategy and assess model generalization, a transfer learning experiment was conducted using a different eggplant inbred line, “14-345.” In this validation experiment, both inoculated and non-inoculated groups were included, each consisting of 120 plants.
2.6. Classification Models
2.6.1. Multispectral Image Information Extraction and Selection
The analysis of multispectral and CHIF images involved the extraction of spectral reflectance, image texture, and features derived from CHIF data. CHIF data, widely used to assess stress-induced changes in photosynthesis, were particularly valuable in this study for detecting physiological responses to Verticillium dahliae infection [27]. In contrast, image texture captures structural and morphological changes in plant tissues, which are often linked to growth status and underlying metabolic processes [28]. Texture features were extracted using two complementary methods: the GLCM and LBP. GLCM provided four statistical features—contrast, correlation, energy, and homogeneity—where contrast describes local grayscale variations, correlation reflects pixel intensity dependencies, energy indicates grayscale uniformity, and homogeneity measures local smoothness in the image. LBP features were computed from LBP1 to LBP59, and features with zero frequency were excluded, resulting in 16 valid LBP descriptors for further analysis.
2.6.2. Data Outlier Detection
In the main experiment, each of the 110 plants was intended to be imaged six times (on days 0, 3, 5, 7, 9, and 11). However, due to disease progression, some plants died or showed severe leaf damage by day 9 or 11, resulting in missing data at later time points. A total of 589 images were collected across all dates. The Mahalanobis distance was used to assess the deviation of individual sample points from the dataset center. Samples with excessively large distances were identified as outliers and removed, yielding 574 valid samples for further analysis.
In the transfer learning experiment, which included both inoculated and non-inoculated groups (120 plants each), disease progression similarly led to sample loss at later time points. A total of 1162 images were collected, and, after Mahalanobis distance-based outlier detection, 1143 valid samples remained for model evaluation. Due to the presence of a control group, image acquisition began on day 3 post-inoculation, following one day of recovery after pathogen exposure.
2.6.3. Dataset Division
The eggplant leaf images were randomly divided into training and test sets at an 8:2 ratio to evaluate the model’s performance.
2.6.4. Data Preprocessing
To account for the differences in spectral reflectance, image texture, and CHIF data, normalization (Equation (1)) was applied as a preprocessing step. This method converts raw data into dimensionless values that are standardized to the same order of magnitude, which facilitates precise and comprehensive analysis and evaluation of all the data [29].
where μ is the mean of all the sample data and is the standard deviation of all the sample data.
2.6.5. Feature-Band Extraction
Feature-band extraction aims to reduce calculation parameters, improve calculation speed, and mitigate the model’s overfitting probability. In this study, SPA was employed for feature-band extraction. SPA involves a mathematical transformation in which band information is projected onto other wavelength information. Subsequently, the feature bands are selected based on the band information with the greatest projection amount [30]. A detailed description of the SPA procedure can be found in the study [31].
2.6.6. Model Architecture and Optimization Strategy
Due to the impact of Verticillium wilt on the physiological features of eggplant leaves, this study investigated the efficacy of combining multispectral images, spectral reflectance features, image texture features, and CHIF data as inputs to detect leaf wilt at an early stage. This study established a diagnostic model to detect early leaf wilt using 2D-CNN sparrow search algorithms: SSA–CNN–SVM, SSA–CNN–SVM, CNN–SVM, and SSA–CNN.
The SSA, originally proposed by Xue and Shen and inspired by the foraging and anti-predatory behavior of sparrows [32], was employed in this study to optimize the hyperparameters of the CNN models. Specifically, SSA was used to tune the learning rate, batch size, and L2 regularization coefficient based solely on the training and validation sets, with the test set strictly excluded to prevent data leakage and ensure unbiased model evaluation. The hyperparameter search space was defined as follows: learning rate [1 × 10⁻³, 5 × 10⁻²], batch size [32, 128], and L2 regularization coefficient [1 × 10⁻⁵, 1 × 10⁻²]. SSA was executed using 20 individuals over 5 iterations, and the optimal combination of hyperparameters was determined based on validation accuracy. The final optimized values were a learning rate of 6.3 × 10⁻³, batch size of 32, and L2 regularization coefficient of 1 × 10⁻⁵. The CNN–SVM involves using a CNN-trained model for high-dimensional feature extraction, resulting in three-dimensional data. To enhance accuracy, the extracted three-dimensional feature data were fed into an SVM for classification model [33]. The schematic diagram is illustrated in Figure 2.
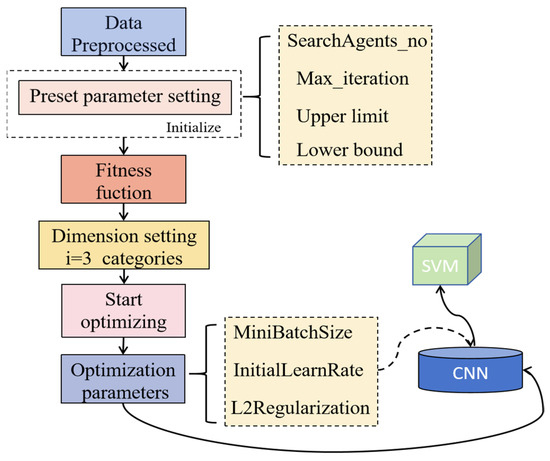
Figure 2.
Flowchart of the SSA.
The 2D-CNN model used for inputs such as multispectral and CHIF images was trained using fixed hyperparameter settings. The training configuration included a mini-batch size of 30, a maximum of 50 epochs, and an initial learning rate of 0.001. A piecewise learning rate schedule was applied, with the rate reduced by a factor of 0.1 every 50 epochs. The L2 regularization coefficient was set to 1 × 10⁻⁶. The schematic diagram is illustrated in Figure 1c.
2.6.7. Transfer Learning Models
Transfer learning enhances performance on a related task by leveraging knowledge acquired from a previously learned task [34]. To enable the pre-trained CNN model to adapt to the characteristics of different eggplant genotypes, a transfer learning strategy was employed for model fine-tuning. The data used for transfer learning were collected from the inbred line “14-345” and included both inoculated and non-inoculated control groups. During fine-tuning, all five convolutional layers of the pre-trained model were frozen to preserve their ability to extract low-level generalizable features learned from the source task. To accommodate the new binary classification task (healthy vs. infected), the original fully connected layer designed for three-class classification was replaced with a new fully connected layer containing two output nodes. Additionally, a Dropout layer was inserted before the classifier to reduce the risk of overfitting. Throughout the fine-tuning phase, only the newly added Dropout and fully connected layers were trained, while the rest of the network architecture and parameters remained unchanged.
To assess the model’s generalization ability, five-fold cross-validation was adopted. Unlike the conventional method of dividing the dataset into fixed training and validation sets, five-fold cross-validation randomly partitions the entire dataset into five equal subsets. In each iteration, four subsets were used for training and the remaining one for validation. This process was repeated five times, ensuring that each subset served as the validation set once. The final performance was evaluated based on the average of the results obtained from all five folds. The overall fine-tuning strategy is illustrated in Figure 3.
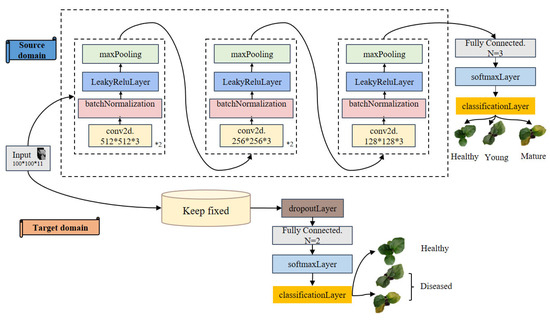
Figure 3.
Flowchart of fine-tuning transfer.
2.6.8. Model Evaluation
To verify the accuracy of the model, a confusion matrix was used to calculate the performance indicators of the model, as shown below:
where TP is the true positive, TN is the true negative, FP is the false positive, and FN is the false negative.
3. Results
3.1. Spectral Data Analysis
Figure 4 shows the average spectral reflectance of eggplant leaves from healthy (0 day) to infected (11 days). The healthy and infected leaves had similar overall patterns. However, differences appeared in the visible (515–660 nm) and near-infrared (780–970 nm) regions. Clear changes were seen at 0 day, 3 day, and after day 5.
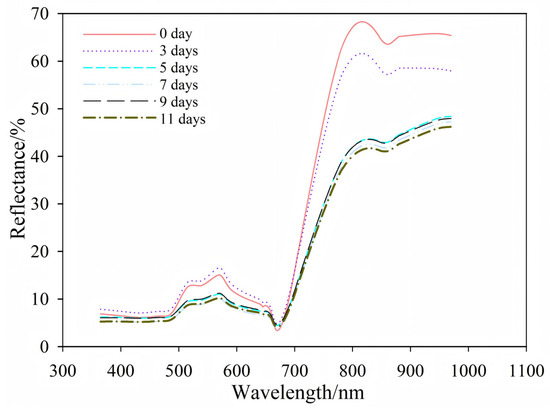
Figure 4.
Spectral reflectance patterns of eggplant leaves after inoculation.
3.2. Differentiating at Various Stages of Infection
PCA was employed to examine the spectral reflectance of both healthy and infected leaves. The fractional scatter plots of PC1 and PC2 are presented in Figure 5. PC1 and PC2 collectively encompassed most spectral information, contributing to 95.6% of the total variance. Specifically, PC1 accounted for 83.4% of the explained variance, while PC2 accounted for 12.2%. As shown in Figure 5, the PCA score plot revealed a clear temporal progression among the samples. The leaves sampled on day 0 were distinctly distributed in the upper-right quadrant, while those samples from day 3 began to shift along the PC1 axis, indicating early spectral changes associated with infection. From day 5 onward, samples corresponding to later time points increasingly overlapped, suggesting progressive but spectrally similar physiological responses as disease symptoms developed. Based on the distribution of the PCA scores and their 95% confidence ellipses, the samples were categorized into three stages reflecting disease progression: healthy (day 0), pre-symptomatic (days 3 and 5), and symptomatic (days 7, 9, and 11). This PCA-based classification was subsequently used to generate training labels for model development and evaluation in early detection of Verticillium wilt.
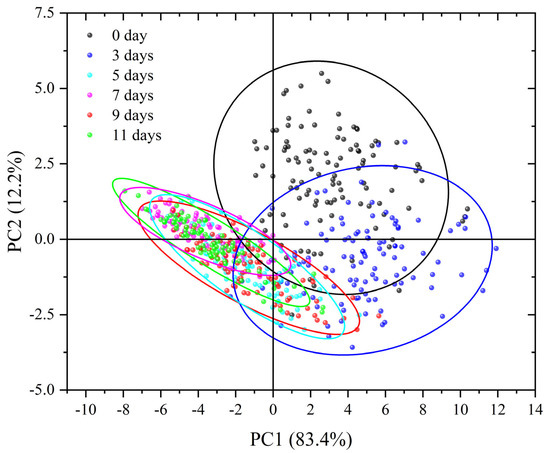
Figure 5.
Scatter plot of scores of healthy and infected eggplant leaves.
3.3. Early Diagnostic Models Using One-Dimensional Data
3.3.1. Spectral Features
To improve the model accuracy and reduce computational time, this study employed SPA for data dimensionality reduction, focusing on the seven most influential bands (430, 570, 645, 660, 780, 850, and 970 nm). The feature bands selected by the successive projection algorithm are illustrated in Figure 6.
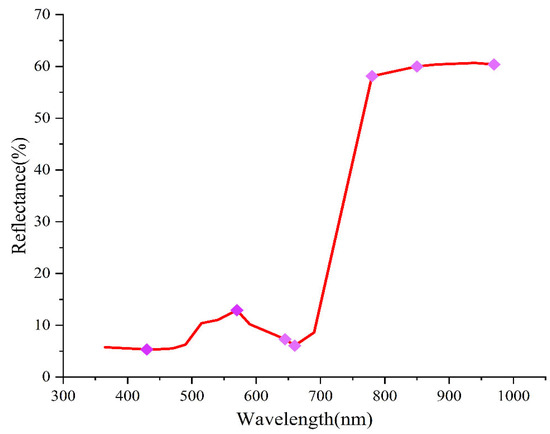
Figure 6.
Distribution of feature bands.
Various types of data, including full-band, preprocessed full-band, feature-band, and preprocessed feature-band reflectance, were used as inputs for these models. These models aimed to predict the status of healthy, pre-symptomatic, and infected leaves. The models employed machine learning methods, such as 1D-CNN, CNN–SVM, SSA–CNN, and SSA–CNN–SVM. The modeling results are summarized in Figure 7a,c,e. The results indicate that, after preprocessing and feature-band extraction, the SSA–CNN–SVM model achieved the highest classification accuracy. The test set accuracy was 99.12%. This approach not only enhanced classification accuracy but also improved the computational efficiency of the model by reducing the number of input bands. The results underscore the feasibility of using spectral data for the early diagnosis of wilt in eggplant leaves.
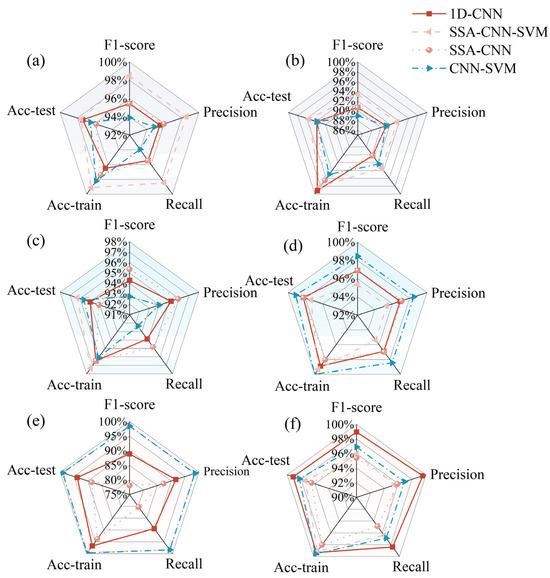
Figure 7.
Radar charts compare model performance across six input feature types: (a) raw spectra; (b) fused spectra, and texture and CHIF data; (c) SPA + spectral features; (d) SPA + information fusion; (e) normalized + SPA + spectral features; (f) normalized + SPA + information fusion. Abbreviations: SPA: successive projections algorithm; NOR: normalization; 1D-CNN: one-dimensional convolutional neural network; SSA: sparrow search algorithm; CNN: convolutional neural network; SVM: support vector machine; Acc-train: Accuracy-train; Acc-test: Accuracy-test. F1-score, precision, and recall are the test set results.
3.3.2. Information Fusion
Spectral features, image texture features, and CHIF data were combined as model inputs to enable early diagnosis of Verticillium wilt in eggplant leaves. The feature bands (430, 490, 515, 540, 570, 645, 660, 780, 850, 970 nm, C6, and LBP56) were extracted using a continuous projection approach, and 12 machine learning models were constructed using the combined features. The performance of the model based on these features is presented in Figure 7b,d,f.
Overall, the models incorporating fused texture features outperformed those based solely on spectral data. Notably, the CNN–SVM model combined with SPA yielded the most promising results, achieving 100% accuracy in the training set and 99.13% accuracy in the test set. Therefore, the integration of spectral data with image texture features and CHIF data is useful in accurately discerning changes in the internal and external properties of leaves during infection, facilitating the early diagnosis of Verticillium wilt in eggplant.
3.4. Early Diagnostic Model Using Multi-Modal Image Fusion
To compare with models built on one-dimensional data, multispectral and CHIF images were used as inputs to the 2D-CNN model, as shown in Figure 1c. The 11-band fusion model incorporated wavelengths at 430, 490, 515, 540, 570, 645, 660, 780, 850, and 970 nm, along with the C6 component from the CHIF data. Each sample in the multispectral image model consisted of 19 bands, while the fusion model used 25-band images (Figure 8).
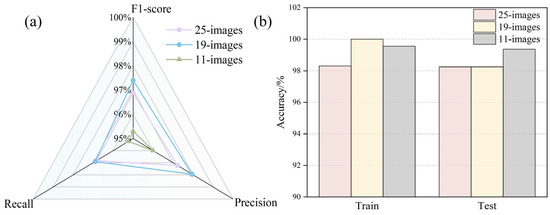
Figure 8.
Comparative analysis of multi-source information fusion image model performance: (a) model recall, F1-score, and precision; (b) training set and test set accuracy.
After feature-band extraction using the successive projection algorithm (SPA), the fused multispectral and CHIF images achieved superior performance, with a validation accuracy of 99.37%. These results suggest that image models based on fused features outperform those relying on single-feature inputs or non-image-fused feature data alone.
3.5. Transfer Learning-Based Verification of Model Generalization
The optimal model from the main experiment—the 2D-CNN model based on 11 fused images—was selected for transfer learning. The fine-tuned 2D-CNN model was then applied for early disease detection (as shown in Figure 9). To enhance the model robustness and reduce the impact of sample variability, a five-fold cross-validation strategy was adopted. The results show that the model achieved an average accuracy of 86.08 ± 2.39% on the training set, 84.13 ± 2.30% on the validation set, and 84.54 ± 1.82% on the test set. The macro-average precision reached 87.61 ± 1.28% (training), 85.95 ± 2.43% (validation), and 85.86 ± 2.54% (test). The macro-average recall was 85.43 ± 1.69% (training), 83.96 ± 2.43% (validation), and 83.86 ± 2.43% (test). The macro-average F1-score was 86.07 ± 1.44% (training), 84.26 ± 1.90% (validation), and 84.28 ± 1.96% (test). These results indicate that the model performs well in the early detection of Verticillium wilt in eggplants and maintains strong consistency and generalization capability across different eggplant genotypes.
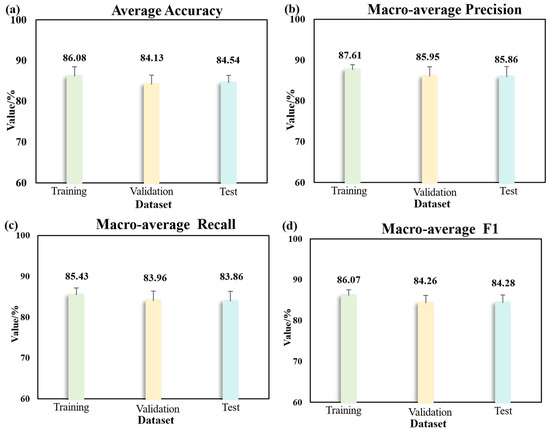
Figure 9.
Classification results of early diagnosis based on transfer learning using five-fold cross-validation. (a) Average accuracy on training, validation, and test datasets; (b) macro-average precision on training, validation, and test datasets; (c) macro-average recall on training, validation, and test datasets; (d) macro-average F1 score on training, validation, and test datasets.
4. Discussion
Multispectral and CHIF images of eggplant leaves were acquired, starting before inoculation and ending after symptoms of Verticillium wilt appeared. The results indicate that systemic changes occur within plants after pathogen infection, which can be detected by spectral reflectance, image texture, and CHIF data. Texture features represent numerical values extracted from an image that quantify variations within a specific region. Texture analysis involves the extraction of texture features through specific image processing techniques to offer a quantitative or qualitative description of texture. Texture features, which can reflect dynamic changes in leaf structure, have been widely used to estimate plant diseases and pests [35,36,37]. Following infection with Verticillium wilt, changes in photosynthetic parameters and chlorophyll content are often observed. CHIF data typically reflect changes in plant photosynthetic efficiency and pigments, manifesting as variations in both the frequency and time domains [38]. Therefore, CHIF data are frequently employed to assess the impact of stress in plants. In conclusion, multispectral imaging has emerged as a valuable and effective tool for the early detection of plant diseases.
Based on the results shown in Figure 3, there is a clear difference in spectral reflectance between the visible (515–660 nm) and near-infrared (780–970 nm) regions. This difference is likely influenced by the green and yellow wavelengths within the 515–660 nm range. Eggplant leaves affected by Verticillium wilt eventually transition from green to yellow, leading to changes in their spectral reflectance. This shift was correlated with the physiological alterations induced by the disease, with leaf water content showing a correlation with the near-infrared bands [39]. Consequently, the differences in spectral reflectance between healthy and infected leaves highlight the impact of physiological changes caused by the disease.
Based on spectral reflectance, features were further extracted using the SPA algorithm, resulting in the selection of seven characteristic bands at 430, 570, 645, 660, 780, 850, and 970 nm. Among these bands, 430 nm and 570 nm correlate with chlorophyll content [40], while 645 nm and 660 nm are associated with leaf nitrogen content [41]. Additionally, 780 nm is linked to leaf dry matter content [42], 850 nm is related to protein and lipid content [43], and 970 nm is associated with water content [44]. This is likely due to Verticillium wilt being a root disease, which impairs the absorption of water and nutrients and consequently disrupts the synthesis of chlorophyll, proteins, and other substances. For the data fusion model, the feature bands were 430, 490, 515, 540, 570, 645, 660, 780, 850, 970 nm, C6, and LBP56, which have the best modeling effect. The results of using the characteristic band as the model input were better than the full-band model, and the results are consistent with [45]. This demonstrates that the method can achieve high classification accuracy while reducing the number of wavelengths, which is of great significance for practical production and industrialization.
To the best of our knowledge, this study represents the first attempt to use multispectral image–information fusion to classify plant leaves infected with Verticillium wilt prior to symptom onset. While the conventional methods require 10 days for testing, the results of this study show that verticillium wilt can be tested on the third day of inoculation. Zhang et al. utilized a five-channel multispectral camera to scan eggplant leaves for early diagnosis of Verticillium wilt. Their results demonstrated an accuracy of 84.00% on the third day post-inoculation, which may be attributed to the reliance on multispectral images alone without incorporating CHIF data [20]. While Shin et al. conducted a study involving hyperspectral imaging for the early diagnosis of Verticillium wilt in potato, their model exhibited lower accuracy, possibly due to the exclusive use of hyperspectral data and inputs with limited information [46]. Nevertheless, their research revealed notable variations in spectral reflectance in bands related to water content between healthy and infected leaves, consistent with our findings. Therefore, the early fluctuations in the water content of infected plants may offer insights for distinguishing pre-symptomatic plants from healthy plants.
In another study, Wu et al. studied spectral reflectance, image texture features, and vegetation indices as model inputs for early diagnosis of strawberry gray mold, and the accuracy of the data fusion model was 96.67%, while the accuracy of the model based on spectral reflectance was 95% [47]. The results show that the model based on fusion data is more suitable for the early diagnosis of plant leaf diseases. These findings align with the results of our study, where model accuracy was improved by using multiple fused information images as inputs.
Transfer learning can be used to fine-tune a model developed on one dataset, thereby improving its adaptability to new tasks. This study utilized deep learning and transfer learning techniques to detect Verticillium wilt in two eggplant varieties, revealing that fine-tuning CNNs enables accurate predictions across diverse samples. Therefore, transfer learning combined with multispectral imaging shows great potential for the early detection of pre-symptomatic states in infected plants.
To further enhance the model’s robustness and assess its generalization capability, five-fold cross-validation was employed. This approach effectively mitigates overfitting risks caused by limited sample size and ensures consistent performance across subsets. This study successfully detected Verticillium wilt in eggplant leaves as early as 3 days post-inoculation, prior to symptom onset. By incorporating healthy and inoculated samples from different genotypes, the established model demonstrated strong adaptability and diagnostic capability.
Despite the promising results, this study has certain limitations. First, all the experiments were conducted under controlled conditions in a greenhouse, where environmental variables such as temperature, humidity, and drought stress were kept constant. In real-world agricultural settings, however, healthy plants under biotic or abiotic stress may exhibit spectral or fluorescence patterns similar to diseased plants, which could reduce the model’s diagnostic specificity. Additionally, while transfer learning was applied across different eggplant genotypes, further validation on more diverse cultivars and under field conditions is needed to ensure broader applicability. In future work, we plan to expand the dataset to include plants subjected to various abiotic stresses, and to incorporate field-collected samples. This will help to refine the model’s robustness and improve its ability to distinguish between disease-induced and stress-induced symptoms. Furthermore, integrating time-series analysis and real-time monitoring could provide deeper insights into disease progression dynamics.
5. Conclusions
This study employed multispectral imaging combined with spectral reflectance features, image texture features, and chlorophyll fluorescence (CHIF) data, utilizing deep learning models to achieve early and accurate detection of Verticillium wilt in eggplant leaves. Early diagnosis of Verticillium wilt in eggplant was achieved using multispectral images and CHIF images that underwent feature-band extraction and continuous projection technique processing. The accuracy of the verification set reached 99.37%, which illustrated an ideal outcome. To evaluate generalization across different eggplant genotypes, transfer learning was applied to the inbred line “14-345”, with five-fold cross-validation used for robust assessment. On the test set, the model achieved an average accuracy of 84.54 ± 1.82%, macro-average precision of 85.86 ± 2.54%, recall of 83.86 ± 2.43%, and F1-score of 84.28 ± 1.96%. These results confirm the effectiveness and robustness of the proposed method for the early and accurate detection of Verticillium wilt in different eggplant varieties. This approach shows great potential for early warning systems and timely disease management in agricultural production.
Author Contributions
Conceptualization, S.S.; data curation, S.L. and M.L.; formal analysis, J.Z. and S.S.; funding acquisition, S.L., X.F., X.C. and S.S.; investigation, S.L., X.F., X.C. and S.S.; methodology, D.Z., S.L., J.Z., M.L., X.F. and X.C.; resources, D.Z., S.L., M.L. and X.F.; software, D.Z.; supervision, X.F. and S.S.; validation, X.C. and S.S.; visualization, J.Z. and M.L.; writing—original draft, D.Z. and J.Z.; writing—review and editing, D.Z., S.L., J.Z., M.L., X.F. and X.C. All authors have read and agreed to the published version of the manuscript.
Funding
This research was supported by the Hebei Agriculture Research System (HBCT2023100207), the earmarked fund for CARS (CARS-23), the National Natural Science Foundation of China (32072572), the Innovative Research Group Project of Hebei Natural Science Foundation (C2020204111), the Hebei Province Graduate Innovation Ability Cultivation Funding Project (CXZZBS2024069), and the S&T Program of Hebei (24466301D and 21326309D).
Data Availability Statement
The data can be obtained upon reasonable request from the corresponding author.
Acknowledgments
We thank the three anonymous reviewers for their valuable comments and suggestions, which have significantly improved the quality of this manuscript.
Conflicts of Interest
The authors declare that the research was conducted in the absence of any commercial or financial relationships that could be construed as potential conflicts of interest.
References
- FAO. Statistical Database. 2022. Available online: http://faostat.fao.org/ (accessed on 15 February 2024).
- You, Q.; Li, H.; Wu, J.; Li, T.; Wang, Y.; Sun, G.; Li, Z.; Sun, B. Mapping and validation of the epistatic D and P genes controlling anthocyanin biosynthesis in the peel of eggplant (Solanum melongena L.) fruit. Hortic. Res. 2023, 10, uhac268. [Google Scholar] [CrossRef] [PubMed]
- Yang, X.; Zhang, Y.; Cheng, Y.; Chen, X. Transcriptome analysis reveals multiple signal network contributing to the Verticillium wilt resistance in eggplant. Sci. Hortic. 2019, 256, 108576. [Google Scholar] [CrossRef]
- Nakahara, H.; Mori, T.; Matsuzoe, N. Screening of phenotypic conversion mutant strains of Ralstonia solanacearum for effective biological control of Verticillium wilt in eggplant. Crop Prot. 2021, 142, 105530. [Google Scholar] [CrossRef]
- Ogundeji, A.O.; Li, Y.; Liu, X.; Meng, L.; Sang, P.; Mu, Y.; Wu, H.; Ma, Z.; Hou, J.; Li, S. Eggplant by grafting enhanced with biochar recruits specific microbes for disease suppression of Verticillium wilt. Appl. Soil Ecol. 2021, 163, 103912. [Google Scholar] [CrossRef]
- Quiroz, F.; Corro Molas, A.; Rojo, R.; Pérez Fernández, J.; Escande, A. Effects of no tillage and genetic resistance on sunflower wilt by Verticillium dahliae. Soil Tillage Res. 2008, 99, 66–75. [Google Scholar] [CrossRef]
- Snelders, N.C.; Rovenich, H.; Petti, G.C.; Rocafort, M.; van den Berg, G.C.M.; Vorholt, J.A.; Mesters, J.R.; Seidl, M.F.; Nijland, R.; Thomma, B.P.H.J. Microbiome manipulation by a soil-borne fungal plant pathogen using effector proteins. Nat. Plants 2020, 6, 1365–1374. [Google Scholar] [CrossRef] [PubMed]
- Su, T.; Wang, W.; Wang, Z.; Li, P.; Xin, X.; Yu, Y.; Zhang, D.; Zhao, X.; Wang, J.; Sun, L.; et al. BrMYB108 confers resistance to Verticillium wilt by activating ROS generation in Brassica rapa. Cell Rep. 2023, 42, 112938. [Google Scholar] [CrossRef] [PubMed]
- Serrano, A.; León, L.; Belaj, A.; Román, B. Nucleotide diversity analysis of candidate genes for Verticillium wilt resistance in olive. Sci. Hortic. 2020, 274, 109653. [Google Scholar] [CrossRef]
- Furbank, R.T.; Tester, M. Phenomics—Technologies to relieve the phenotyping bottleneck. Trends Plant Sci. 2011, 16, 635–644. [Google Scholar] [CrossRef] [PubMed]
- Zahir, S.A.D.M.; Omar, A.F.; Jamlos, M.F.; Azmi, M.A.M.; Muncan, J. A review of visible and near-infrared (Vis-NIR) spectroscopy application in plant stress detection. Sens. Actuators A Phys. 2022, 338, 113468. [Google Scholar] [CrossRef]
- Jing, X.; Du, K.; Duan, W.; Zou, Q.; Zhao, T.; Li, B.; Ye, Q.; Yan, L. Quantifying the effects of stripe rust disease on wheat canopy spectrum based on eliminating non-physiological stresses. Crop J. 2022, 10, 1284–1291. [Google Scholar] [CrossRef]
- Gu, Q.; Sheng, L.; Zhang, T.; Lu, Y.; Zhang, Z.; Zheng, K.; Hu, H.; Zhou, H. Early detection of tomato spotted wilt virus infection in tobacco using the hyperspectral imaging technique and machine learning algorithms. Comput. Electron. Agric. 2019, 167, 105066. [Google Scholar] [CrossRef]
- Ou, Y.; Yan, J.; Liang, Z.; Zhang, B. Hyperspectral Imaging Combined with Deep Learning for the Early Detection of Strawberry Leaf Gray Mold Disease. Agronomy 2024, 14, 2694. [Google Scholar] [CrossRef]
- Tan, F.; Gao, X.; Cang, H.; Wu, N.; Di, R.; Yan, J.; Li, C.; Gao, P.; Lv, X. Early Detection of Verticillium Wilt in Cotton by Using Hyperspectral Imaging Combined with Recurrence Plots. Agronomy 2025, 15, 213. [Google Scholar] [CrossRef]
- Anand, R.; Parray, R.A.; Mani, I.; Khura, T.K.; Kushwaha, H.; Sharma, B.B.; Sarkar, S.; Godara, S. Spectral data driven machine learning classification models for real time leaf spot disease detection in brinjal crops. Eur. J. Agron. 2024, 161, 127384. [Google Scholar] [CrossRef]
- Kang, X.; Huang, C.; Zhang, L.; Yang, M.; Zhang, Z.; Lyu, X. Assessing the severity of cotton Verticillium wilt disease from in situ canopy images and spectra using convolutional neural networks. Crop J. 2023, 11, 933–940. [Google Scholar] [CrossRef]
- Conrad, A.O.; Li, W.; Lee, D.Y.; Wang, G.L.; Rodriguez-Saona, L.; Bonello, P. Machine learning-based presymptomatic detection of rice sheath blight using spectral profiles. Plant Phenomics 2020, 2020, 8954085. [Google Scholar] [CrossRef] [PubMed]
- Sinha, R.; Khot, L.R.; Rathnayake, A.P.; Gao, Z.; Naidu, R.A. Visible-near infrared spectroradiometry-based detection of grapevine leafroll-associated virus 3 in a red-fruited wine grape cultivar. Comput. Electron. Agric. 2019, 162, 165–173. [Google Scholar] [CrossRef]
- Zhang, Y.; Zhang, D.; Zhang, Y.; Cheng, F.; Zhao, X.; Wang, M.; Fan, X. Early detection of verticillium wilt in eggplant leaves by fusing five image channels: A deep learning approach. Plant Methods 2024, 20, 173. [Google Scholar] [CrossRef] [PubMed]
- Yang, H.; Wang, L.; Zhang, X.; Shi, Y.; Wu, Y.; Jiang, Y.; Wang, X. Exploring optimal soil moisture for seedling tomatoes using thermal infrared imaging and chlorophyll fluorescence techniques. Sci. Hortic. 2025, 339, 113846. [Google Scholar] [CrossRef]
- Pascual, I.; Azcona, I.; Morales, F.; Aguirreolea, J.; Sánchez-Díaz, M. Photosynthetic response of pepper plants to wilt induced by Verticillium dahliae and soil water deficit. J. Plant Physiol. 2010, 167, 701–708. [Google Scholar] [CrossRef] [PubMed]
- Xiao, Q.; Tang, W.; Zhang, C.; Zhou, L.; Feng, L.; Shen, J.; Yan, T.; Gao, P.; He, Y.; Wu, N. Spectral Preprocessing Combined with Deep Transfer Learning to Evaluate Chlorophyll Content in Cotton Leaves. Plant Phenomics 2024, 2022, 9813841. [Google Scholar] [CrossRef] [PubMed]
- Jin, X.; Xiong, J.; Rao, Y.; Zhang, T.; Ba, W.; Gu, S.; Zhang, X.; Lu, J. TranNas-NirCR: A method for improving the diagnosis of asymptomatic wheat scab with transfer learning and neural architecture search. Comput. Electron. Agric. 2023, 213, 108271. [Google Scholar] [CrossRef]
- Wang, F.; Zhao, C.; Yang, H.; Jiang, H.; Li, L.; Yang, G. Non-destructive and in-site estimation of apple quality and maturity by hyperspectral imaging. Comput. Electron. Agric. 2022, 195, 106843. [Google Scholar] [CrossRef]
- Wei, J.; Dai, Z.; Zhang, Q.; Yang, L.; Zeng, Z.; Zhou, Y.; Liu, J.; Chen, B. Seed multispectral imaging combined with machine learning algorithms for distinguishing different varieties of lettuce (Lactuca sativa L.). Food Chem. X 2025, 27, 102399. [Google Scholar] [CrossRef] [PubMed]
- Xia, Q.; Tang, H.; Fu, L.; Tan, J.; Guo, Y. A drought stress-sensing technique based on wavelet entropy of chlorophyll fluorescence excited with pseudo-random binary sequence. Comput. Electron. Agric. 2023, 210, 107933. [Google Scholar] [CrossRef]
- Xuan, G.; Li, Q.; Shao, Y.; Shi, Y. Early diagnosis and pathogenesis monitoring of wheat powdery mildew caused by blumeria graminis using hyperspectral imaging. Comput. Electron. Agric. 2022, 197, 106921. [Google Scholar] [CrossRef]
- Yan, C. A review on spectral data preprocessing techniques for machine learning and quantitative analysis. IScience 2025, 28, 112759. [Google Scholar] [CrossRef] [PubMed]
- Cao, C.; Wang, T.; Gao, M.; Li, Y.; Li, D.; Zhang, H. Hyperspectral inversion of nitrogen content in maize leaves based on different dimensionality reduction algorithms. Comput. Electron. Agric. 2021, 190, 106461. [Google Scholar] [CrossRef]
- Araújo, M.C.U.; Saldanha, T.C.B.; Galvão, R.K.H.; Yoneyama, T.; Chame, H.C.; Visani, V. The successive projections algorithm for variable selection in spectroscopic multicomponent analysis. Chemom. Intell. Lab. Syst. 2001, 57, 65–73. [Google Scholar] [CrossRef]
- Xue, J.; Shen, B. A novel swarm intelligence optimization approach: Sparrow search algorithm. Syst. Sci. Control Eng. 2020, 8, 22–34. [Google Scholar] [CrossRef]
- Xu, J.; Zhou, S.; Xu, A.; Ye, J.; Zhao, A. Automatic scoring of postures in grouped pigs using depth image and CNN-SVM. Comput. Electron. Agric. 2022, 194, 106746. [Google Scholar] [CrossRef]
- Zhao, Z.; Alzubaidi, L.; Zhang, J.; Duan, Y.; Gu, Y. A comparison review of transfer learning and self-supervised learning: Definitions, applications, advantages and limitations. Expert Syst. Appl. 2024, 242, 122807. [Google Scholar] [CrossRef]
- Liu, C.; Cao, Y.; Wu, E.; Yang, R.; Xu, H.; Qiao, Y. A Discriminative Model for Early Detection of Anthracnose in Strawberry Plants Based on Hyperspectral Imaging Technology. Remote Sens. 2023, 15, 4640. [Google Scholar] [CrossRef]
- Gao, C.; Ji, X.; He, Q.; Gong, Z.; Sun, H.; Wen, T.; Guo, W. Monitoring of Wheat Fusarium Head Blight on Spectral and Textural Analysis of UAV Multispectral Imagery. Agriculture 2023, 13, 293. [Google Scholar] [CrossRef]
- Chodey, M.D.; Shariff, C.N. Pest detection via hybrid classification model with fuzzy C-means segmentation and proposed texture feature. Biomed. Signal Process. Control. 2023, 84, 104710. [Google Scholar] [CrossRef]
- Wang, K.; Zhu, J.; Xu, X.; Li, T.; Wang, X.; Warner, T.A.; Cheng, T.; Zhu, Y.; Cao, W.; Yao, X.; et al. Quantitative monitoring of salt stress in rice with solar-induced chlorophyll fluorescence. Eur. J. Agron. 2023, 150, 126954. [Google Scholar] [CrossRef]
- Azadnia, R.; Rajabipour, A.; Jamshidi, B.; Omid, M. New approach for rapid estimation of leaf nitrogen, phosphorus, and potassium contents in apple-trees using Vis/NIR spectroscopy based on wavelength selection coupled with machine learning. Comput. Electron. Agric. 2023, 207, 107746. [Google Scholar] [CrossRef]
- Yang, M.; Ma, Y.; Ren, H.; Wang, J.; Zhou, J.; Gui, Y.; Bai, W.; Huang, C.; Zhang, Z.; Lv, X. Monitoring of spatial heterogeneity of chlorophyll fluorescence of cotton leaves at the early stage of Verticillium wilt based on spectral imaging. Ind. Crops Prod. 2025, 226, 120663. [Google Scholar] [CrossRef]
- Abulaiti, Y.; Sawut, M.; Maimaitiaili, B.; Chunyue, M. A possible fractional order derivative and optimized spectral indices for assessing total nitrogen content in cotton. Comput. Electron. Agric. 2020, 171, 105275. [Google Scholar] [CrossRef]
- Polder, G.; Dieleman, J.A.; Hageraats, S.; Meinen, E. Imaging spectroscopy for monitoring the crop status of tomato plants. Comput. Electron. Agric. 2024, 216, 108504. [Google Scholar] [CrossRef]
- Wang, Z.; Huang, W.; Li, J.; Liu, S.; Fan, S. Assessment of protein content and insect infestation of maize seeds based on on-line near-infrared spectroscopy and machine learning. Comput. Electron. Agric. 2023, 211, 107969. [Google Scholar] [CrossRef]
- Wei, Y.; He, Y.; Li, X. Tea moisture content detection with multispectral and depth images. Comput. Electron. Agric. 2021, 183, 106082. [Google Scholar] [CrossRef]
- Tang, Y.; Yang, J.; Zhuang, J.; Hou, C.; Miao, A.; Ren, J.; Huang, H.; Tan, Z.; Paliwal, J. Early detection of citrus anthracnose caused by Colletotrichum gloeosporioides using hyperspectral imaging. Comput. Electron. Agric. 2023, 214, 108348. [Google Scholar] [CrossRef]
- Shin, M.Y.; Gonzalez Viejo, C.; Tongson, E.; Wiechel, T.; Taylor, P.W.J.; Fuentes, S. Early detection of Verticillium wilt of potatoes using near-infrared spectroscopy and machine learning modeling. Comput. Electron. Agric. 2023, 204, 107567. [Google Scholar] [CrossRef]
- Wu, G.; Fang, Y.; Jiang, Q.; Cui, M.; Li, N.; Ou, Y.; Diao, Z.; Zhang, B. Early identification of strawberry leaves disease utilizing hyperspectral imaging combing with spectral features, multiple vegetation indices and textural features. Comput. Electron. Agric. 2023, 204, 107553. [Google Scholar] [CrossRef]
Disclaimer/Publisher’s Note: The statements, opinions and data contained in all publications are solely those of the individual author(s) and contributor(s) and not of MDPI and/or the editor(s). MDPI and/or the editor(s) disclaim responsibility for any injury to people or property resulting from any ideas, methods, instructions or products referred to in the content. |
© 2025 by the authors. Licensee MDPI, Basel, Switzerland. This article is an open access article distributed under the terms and conditions of the Creative Commons Attribution (CC BY) license (https://creativecommons.org/licenses/by/4.0/).