Article

Impact of Basalt Rock Powder on Ryegrass Growth and Nutrition on Sandy and Loamy Acid Soils

1
AS Développement 6 Chemin du Solarium, 33170 Gradignan, France
2
Interactions Sol Plante Atmosphère, UMR 1391, Bordeaux Sciences Agro, INRAE, 1 Cours du Général de Gaulle, 33175 Gradignan, CS40201, France
3
Sustainable Soils and Crops, Rothamsted Research, Harpenden, Hertfordshire AL5 2JQ, UK
4
National Oceanography Centre, European Way, Southampton SO14 3ZH, UK
*
Author to whom correspondence should be addressed.
Agronomy 2025, 15(8), 1791; https://doi.org/10.3390/agronomy15081791
Submission received: 10 June 2025 / Revised: 11 July 2025 / Accepted: 21 July 2025 / Published: 25 July 2025
(This article belongs to the Section Grassland and Pasture Science)

Abstract

Enhanced weathering of silicate rocks in agriculture is an option for atmospheric CO2 removal and fertility improvement. The objective of our work is to characterise some of the agricultural consequences of a basaltic powder amendment on soil-crop systems. Two doses of basalt (80 and 160 t ha−1) were applied to two types of slightly acid soils (sandy or silty clayey), derived from long-term trials at Bordeaux (INRAE, France) and Rothamsted Research (England), respectively. For each soil, half of the pots were planted with ryegrass; the other half were left bare. Thus, the experiment had twelve treatments with four replications per treatment. Soil pH increased with the addition of basalt (+0.8 unit), with a 5% equivalence of that of reactive chalk. The basalt contained macro- and micronutrients. Some cations extractable in the basalt before being mixed to the soil became more extractable with increased weathering, independent of plant cover. Plant uptake generally increased for macronutrients and decreased for micronutrients, due to increased stock (macro) and reduced availability (micronutrients and P), related to pH increases. K supplied in the basalt was responsible for a significant increase in plant yield on the sandy soil, linked to an average basalt K utilisation efficiency of 33%. Our general conclusion is that rock dust applications have to be re-evaluated at each site with differing soil characteristics.

1. Introduction

Natural weathering of silicate rocks was first identified as the main driver of atmospheric carbon removal at the geological scale by Ebelmen in 1845 [1]. The order of magnitude of the global removal of CO2 from the atmosphere by this natural process is 0.25 Gt C y−1 [2]. Advancing the understanding and management of the global carbon cycle has been a constant research interest for geochemists since the end of the 20th century [3,4]. This natural process is often summarised as two simplified steps for silicate rocks. The first one consists of the production of exchangeable cations, bicarbonate and clays through the mineral weathering, which represent a significant part of soil genesis. The second step is the transfer of bicarbonate to water compartments where carbonates are precipitated (e.g., groundwater, water bodies and oceans [1,5]).
CO2 removal on agricultural land focuses on the first step. For example, weathering of plagioclase, which is a common Si-mineral in mafic igneous rocks, results in the production of exchangeable calcium, kaolinite (clay) and bicarbonate. In this reaction, bicarbonate is the key product carbon.
CaAl2Si2O8 + 2CO2 + 3H2O → Ca2+ + 2HCO3 + Al2Si2O5(OH)4
The use of rock powder as a soil amendment has a long history in agriculture [6]. Notably, ground silicate rock has been of interest since the 1980s to improve the potential of highly weathered soils (e.g., in Brazil and Africa), where classical soluble fertilisers did not perform very well [7,8]. Research questions related to this soil improvement technology were formed to assess a good balance between grain size and energy costs, resource availability, transport issues, mineral combinations, and potential adverse effects [6,9]. The issue of soil mineral improvement in the agricultural context has notably been pursued in Brazil, through regulation dating back to 2013, on the requirements and use of these so-called “re-mineralizers” [10]. In parallel, with the perspective of shortages of mineral fertiliser resources for agriculture, the research community has progressively investigated this potential solution at a global scale with the objective to improve food production [11,12].
In the last twenty years, a second major issue has been the research interest around the idea of amending agricultural soils with silicate rock powder [13] as one of the potential Negative Emission Technologies (NET). This solution, named enhanced rock weathering (ERW), could help mitigate the current global climate change [14] through carbon dioxide removal (CDR). The most recent Intergovernmental Panel on Climate Change considers ERW as a potential efficient tool for climate change mitigation [15,16]. At a global scale, the latest estimations of the potential carbon removal by ERW provide values in the same order of magnitude as other well-known NET, such as afforestation or soil C sequestration [14,17,18]. Some countries have already modelled and assessed deployment of enhanced silicate weathering at national scale on arable land [19]. For the UK, a range of 6 to 30 Mt CO2 y−1 CDR has been estimated, which could represent up to 45% of the national requirement to meet net zero emissions by 2050 [20]. The models used for these estimates include the latest results from weathering trials of varied materials, of soil type effects, energy needs to grind and transport the rock powder, and some of the environmental feedback expected, all gathered in integrated and prioritised deployment scenarios [20].
Both laboratory results from geochemistry experiments and crop trials under specific conditions (tropical climate or highly weathered soils), notably reviewed by [21] for large-scale deployment perspective, offer a weathering model directly dependent on basic chemical variables. Notably, pH, temperature and soil moisture are expected to be the main key drivers [19,21]. It has been hypothesised that productive croplands exhibit physico-chemical conditions favourable for enhanced weathering (humid soils, proton positive mass balances) and thus crop productivity is proposed as a good proxy to identify appropriate areas for ERW deployment. However, geochemists are still intensively working to integrate laboratory condition results in a unified model for rock dissolution [22]. Their focus is that weathering data could be modelled at the scale of similar chemical species (i.e., alkaline earth metals). For these, the models represent a powerful tool to describe both far-from-equilibrium laboratory results as well as near-to-equilibrium typical of natural conditions [23].
As far as agricultural benefits are concerned, forty trials, with half of them performed in the field, reviewed by Swoboda [24], show varied results for the agricultural benefits of enhanced silicate weathering. The results reviewed range from significant benefits for cation supply, especially potassium (two thirds were significant positive effects), pH increases and some yield improvements, to potentially adverse increases in heavy metals in soils, and a large proportion of non-significant results. This variation is likely to be related to a lack of consideration of the context of each experiment (i.e., mineralogy, soil, and environmental conditions). More recently, yield gains have been described even in short duration trials. Kelland [25] showed a 21% grain yield gain in sorghum, using a mesocosm trial. Skov et al. [26] obtained up to 21% higher yields in spring oats, and Gunnarsen et al. [27] described maize yield gains of 59 kg ha−1 per ton of rock powder and of 95 kg ha−1 per ton of rock powder for potatoes. These gains were all associated with significantly increased potassium uptake. Uptake gains of other macro- and micronutrients were also described in these trials.
To further investigate these different results reported, the objective of the current study was to evaluate the effects of basalt rock powder on soil–plant mineral transfers and soil pH in two very different soils. The study hypothesised that (1) the effect of basalt would be soil-dependent, even within 2 acid soils, (2) even a small pH effect would be enough to modify the soils chemical balances and geo-chemistry, and (3) the different elements provided by the basalt would not be released in the same proportions.

2. Materials and Methods

This study is connected to an ERW field trial that was implemented at Rothamsted Research (2021–2025): the basalt powder used and the soil type in this trial is the same as one of those used in the pot trial. The field trial is part of the ‘UK Enhanced Rock Weathering Greenhouse Gas Removal Demonstrator programme’. The other soil was from a long-term trial at Bordeaux. The pot experiment was conducted in greenhouses at Rothamsted Research (Harpenden, UK) and at Bordeaux Sciences Agro Institute of Agricultural Sciences (Bordeaux, France).

2.1. Soil Characteristics

The ‘Bordeaux’ soil is from the top horizon (0–30 cm) of a Eutric Podzol of the ‘Landes de Gascogne’ [28]. The sampling site is part of a former long-term potassium trial in Pierroton (20 km south-west from Bordeaux, 44.742108 N, −0.783676 W), and it is sampled on subplot without K fertiliser application. It is a sandy soil (95.5% sand, 2.2% silt, 2.3% clay) with a slightly acidic pH of 5.8. The soil organic carbon concentration is relatively high (2.8%) with a high C/N ratio (19.3), typical of this kind of soil (Table 1). The cation exchange capacity (CEC) is 5.7 cmol+ kg−1, base saturation to 87%, and Ca2+ 70% of the CEC. The soil is depleted in exchangeable K (52 mg kg−1 < Kcrit = 83 [29]) and considered to be adequate for P (35 mg kg−1 > Pcrit = 31 [30]). The mineralogy of Eutric Podzols of the sampled area ([30] and personal communication) is mainly composed of quartz (85%), K-Feldpars (7.6%), plagioclases (5.2%) and 1% of ferrous minerals (goethite, ilmenite, magnetite).
The ‘Harpenden’ soil is sampled from the surface horizon (0–30 cm) of Sawyers field at the Rothamsted Research farm, Harpenden, Hertfordshire UK (51.8157 N, 0.3752 W). This field is dedicated to a long-term liming trial, and the sampling was performed on a subplot without P fertiliser application. The soil has a silty clay loam texture (52% silt, 20% clay and 28% sand) and is classified as a Profundic Chromic Endostagnic Luvisol [28]. The initial pH (Table 1) is 5.5. The soil organic carbon concentration is 1.37% and the nitrogen concentration is 0.12% (C/N ratio 11.6). The CEC is 9.2 cmolc kg−1, base saturation 65%, and Ca2+ saturation 57% of the CEC. The content of calcite is below 1%. The soil is slightly depleted in exchangeable K (109 mg kg−1 and low in extractable P (5.5 mg Olsen P kg−1), compared with threshold values of 240 and 16–25 mg kg−1 for K and P, respectively [31], while main micronutrients are near or below (Cu) adequate concentrations [32]. The mineralogy of the soils in Harpenden is extensively described by Avery and Catt [33]: the sand and coarse silt fractions are mainly composed of quartz (95%), and, in decreasing order, flint, feldspar, iron oxides, zircon, tourmaline, rutile, staurolite and kyanite. Fine silt and clay fractions are composed of smectite, mica, kaolinite, feldspar, chlorite, goethite and amorphous ferric oxides.

2.2. Basalt Dust Origin and Chemical Characteristics Compared with the Soils

The basalt rock powder was collected from a quarry in Middleton-in-Teesdale (54.648 N, −2.194 W, County Durham, UK), where basalt rock is mined to produce construction materials. The basalt dust is composed of around 80% of particles passing a 1050 µm sieve (Figure S1) and thus considered a coarse rock powder, as the literature on enhanced rock weathering usually describes particles less than 100 µ diameter as a fraction of particular interest [13]. The mineralogy of the basalt (Figure S2) shows a majority of labradorite (44.4%), augite 13.5%, chlorite (11.2%) and smectite (9.2%). These minerals are known to weather rapidly, according to the Goldich series [22]. An extensive mineral survey in the neighbourhood of Middleton quarry provides additional information about the mineral context of basalts in the area [34]. The main chemical elements in the basalt dust likely to appear in the soil solution are Ca, K, Mg, Na, and Si.
These mineralogical properties are in line with the pseudo-total element measurements (aqua regia digestion, upper part of Table 1). Pseudo-total elements show two-to-ten times higher concentrations in the rock dust than in the richest of both soils (Harpenden), except Mn. As far as extractable (i.e., not total) nutrients are concerned (Table 1, lower part), the basalt dust is characterised with the same methods used for agricultural soils, (described in Section 2.4). Exchangeable Ca is two-fold higher in basalt compared to the richest of both soils, and exchangeable Na is five time higher. In the basalt, extractable P is very low, whereas K and Mg extractabilities have the same order of magnitude as the soils.

2.3. Experimental Design and Monitoring

2.3.1. General Variables Studied

The same experimental design was applied in both pot trials at Bordeaux and Harpenden. Three variables were tested: (1) soil type (sandy vs. loamy), (2) basalt treatment (0, 80 and 160 t ha−1 equivalent) and (3) crop presence (with or without Italian ryegrass, Lolium multiflorum Lam.). Basalt was added at the equivalent of 80 and 160 t ha−1, as these are half and full amounts applied in the corresponding field trial (40 t ha−1 yr−1), planned to last four years. Both doses are considered as high amounts compared to the literature on enhanced weathering experiments, which usually consider 100 t ha−1 as an upper value for amendments on arable land [24]. However, many pot and mesocosm experiments use higher amounts [12,35]. Finally, the experiment was conducted under glasshouse conditions to favour higher mean temperatures compared to natural climate (2023) throughout the trial duration and to control the water supply. Indeed, temperature is a common driver of the weathering rate [22], while water supply can greatly influence weathering rates through the alternation of dry and wet periods.

2.3.2. Trial Set-Up, Monitoring and Maintenance of the Crop

At both sites, topsoil (0–30 cm) was collected from a small area in the field, air dried and homogenised by sieving through a 5 mm sieve. At each location, 24 plastic pots of 4 litres volume were filled with 3.25 kg and 2.50 kg of air-dried soil–basalt mixtures for Bordeaux and Harpenden, respectively. Basalt dust was added to the soil and carefully mixed, mimicking the tilled top horizon in the field. The calculations for corresponding rock dust rates in pots were based on the assumption that mainly the top 25 centimetres were under the direct influence of this amendment in the field. The corresponding mass of soil was calculated considering a bulk density of 1.3 g mL−1, leading to a soil mass of 3250 t ha−1. Field-doses of 80 t ha−1 and 160 t ha−1 of basalt would, therefore, correspond to 2.5 and 5% (by weight), respectively, which were also used for the soil–rock dust mixtures in pots. Control pots consisted of soil without basalt amendment.
At the trial start, soil and basalt dust were brought to 80% of field capacity (deionised water) to equilibrate. Fifteen days later, half of the pots of each basalt treatment were sown at the density of 15 g m−2 (approximately 120 seeds per pot). Pots were organised in four replicated blocks and moved at each watering date to avoid edge effects. Each pot was maintained at about 80% of field capacity using regular weighing (two to three times a week depending on weather conditions). Mean daily temperature was measured with a standard electronic probe for continuous monitoring.
The duration from start to the final plant sampling was 135 and 160 days for Bordeaux and Harpenden, respectively, which approximately corresponded to 1900 degree-days (base 3 °C). This duration allowed the crop to fully mature, and a very significant decrease in plant growth vigour occurred at the end. Four and six successive grass cuts were scheduled at Harpenden and Bordeaux, respectively, through daily visual assessment of the growth. Five centimetres shoots were left at the end of each cut except for the final cut where all above ground biomass was collected. After each cut, the nitrogen requirement was assessed with a rough budget calculation and replenished with the same mean dose on every pot using an ammonium-nitrate solution (doses of 220 mL applied on two successive days, of a 571 mg L−1 NH4NO3 solution). For the entire duration of the experiment, the cumulative quantity applied corresponded to 1320 mL of the NH4NO3 solution, which was equivalent to 263 kg N ha−1 at field scale. The pots without plants were maintained at the same field capacity and the same nitrogen inputs.

2.4. Soil, Basalt and Plant Measurements

Five soil core samples (20 g each) per pot were taken and were analysed (i) in their initial state without basalt, (ii) approximately 20 days after the mixing with basalt dust (achievement of a pseudo-equilibrium before sowing the seeds of ryegrass) and (iii) at the end of the experiments. Each pot was analysed individually. At the end of the trial, soils and soil–basalt mixtures were air-dried and sieved to <2 mm. A sub-sample of the soil was ground to powder in a PM400 all-agate planetary ball mill (Retsch GmbH, Haan, Germany). Soil reaction (pH) was determined in 1:2.5 soil: water suspension [36]. Total carbon and nitrogen content were determined by combustion (LECO, Michigan, USA). Pseudo-total concentrations of Ca, Cu, Fe, K, Mg, Mn, Na, Ni, P, and Zn were based on aqua regia digestion [37]. Soil exchangeable cationic macro-nutrients (Ca, K, Mg) and micronutrients (Cu, Fe, Mn, Ni, Zn), were extracted with 1M ammonium nitrate (NH4NO3; [38]). Extractable P was determined by the Olsen method [39]. Effective cation exchange capacity (eCEC) was determined using the cobalthexamine method of extraction [40]. All analytical determinations were performed using ICP-OES (Inductively Coupled Plasma Optical Emission Spectrometer, Optima 7300 DV, Perkin Elmer, CT, USA). The detection limits for micronutrients were 0.08, 0.04, 0.04, 0.06 and 0.01 for Cu, Fe, Mn, Zn and Ni, respectively. Their quantification limits were 0.28, 0.15, 0.12, 0.19 and 0.02, respectively.
Mineralogical characterisation of the basalt was performed via X-ray Diffraction. An internal standard of 25% by weight of corundum was added to the bulk samples, before grinding under isopropanol in a McCrone mill (Retsch, Haan, Germany) for 8 min. Samples were run at University of Southampton on a PANalytical X’Pert pro diffractometer machine (Malvern PANalytical, Malvern, UK) fitted with a Cu X-ray tube. Operating conditions were: 35 kV, 40 mA, automatic slits and a step size of 0.02º 2ø at 1 s/step. Mineral identification was undertaken using HighScore5.2© software (PANalytical) and the International Centre for Diffraction Data (ICDD) PDF-4 mineral database. Semi-quantitative analysis was undertaken using Siroquant© V5.0 (Sietronics Pty Ltd., Mitchell, ACT, Australia). Results were normalised to remove the corundum component.
Successive cuts of stems and leaves of ryegrass were collected individually from each pot and cut, oven dried, and weighed. Dry samples were milled with a stainless-steel grinder. Fine ground plant samples were digested using a mixture of nitric acid and perchloric acid (85:15 V/V) in open tube digestion blocks [41], and the concentrations of elements in plant samples were determined using ICP-OES. All samples from both sites were analysed in the laboratory at Rothamsted Research.

2.5. Calculation Formulas

2.5.1. Theoretical Concentrations of Extractable Nutrients Between Soil and Basalt Mixes

Theoretical mineral concentrations of the mix of soil and basalt dust depict a simple mass-based average concentration, excluding any interaction between both materials. The calculation relies on a simple passive addition of extractable masses:
[X]theoretical mix = (([X]soil × Msoil) + ([X]basalt. × Mbasalt))/(Msoil + Mbasalt)
with X standing for mass of any of the ten elements. For example, for Ca, mixing 3.25 kg of soil (550 mg Ca2+exch kg−1) with 160 g of basalt dust (equivalent to 160 tonnes ha−1 on Bordeaux soil, 1832 mg Ca2+exch kg−1) theoretically leads to ((3.25 × 550) + (0.16 × 1832))/(3.25 + 0.16) = 608 mg Ca2+exch xch kg−1, if no reaction occurs between soil and basalt.

2.5.2. Apparent Quantity of Minerals Weathered and Released from the Basalt + Soil Mixes

For all selected elements, we assessed the quantity released from the soil + basalt mixture during the duration of the experiment, through an estimated mass balance including the plant uptake and the initial and final soil extractable pools (Equation (2)). This quantity is accounted for by basalt weathering and soil desorption, which cannot be distinguished.
(Weathering + Release) = (Plant Uptake) end + end-init (Extractable soil mix)
with each term expressed in grams of mineral per pot. “End” and “Init” indicate the end and the start of the pot experiment. ‘Soil Mix’ refers to the mixture constituted by the addition of basalt to the soil.

2.5.3. Nutrient Use Efficiencies

Nutrient Use Efficiencies of macro nutrients (X) were calculated as follows:
XUE (%) = [(X_uptake treatment x − X_uptake control)/(X_amended)] × 100
with X_uptake being the accumulated crop mass (mg) of X (major element) at the final harvest; the difference between crop uptake of a treatment and of the control represents the yield gain caused by the treatment. X_amended represents the total mass (mg) of nutrient X brought to the soil through the basalt.

2.5.4. Acid Neutralising Capacity of the Basalt

The acid neutralising capacity (ANC) of a basic amendment equals its potential capacity to neutralise the acidity of the soil. It is expressed as the mass (in kg) of lime (CaO) which has the same neutralisation capacity as 100 kg of the amendment. For unconventional basic amendments, it should be measured under incubated laboratory-controlled conditions [42]. ANC depends on the environmental conditions, fineness and hardness of the amendment particles. In the case of our study, ANC was based on the positive variation in pH resulting from the basalt mixing, and the quantity of basalt used (equivalent to 80 or 160 tonnes ha−1), compared to the theoretical quantity of lime that would have led to the same increase, estimated with Equation (4), adapted from AFNOR [42], and Rémy & Marin-Laflèche [43].
ANC = [0.055 × (Clay + 5 × OM) × (exp(pHbasalt)/1.5 − exp(pHcontrol)/1.5)] × Soilmass
with Clay and OM the fractions of clay and organic matter in g kg−1, pHbasalt and pHcontrol the values of pH obtained at the end of the experimental with or without basalt, and Soilmass the mass of soil (tonnes ha−1) calculated from the soil’s density, depth and fraction below 2 mm. We considered a mixing depth of 25 cm for the ANC calculation.

2.6. Statistical Analysis

Analysis of variance (ANOVA) was used to qualify differences between treatments in the pot trials. Successive ANOVAs were performed. The first, gathering both pot trials, allowed for the assessment of the interaction between soil and basalt. Then, analyses on the individualised trials gave more acute descriptions of basalt and crop influences on the mineral fluxes and soil acidity. The conditions required for its validity were performed using a Shapiro–Wilk test for normality of the residues and a Levene test for homoscedasticity. When requirements were not fulfilled for the ANOVA, even after classical transformation for variables, the non-parametric test of Kruskal–Wallis was used. Post hoc tests used to analyse pair differences between treatments were Tukey’s HSD test and pairwise comparisons using the Wilcoxon rank sum test, after ANOVA and Kruskal–Wallis test, respectively. Mean conformity tests were performed using Student’s tests when a particular focus on one or two variables was of interest, notably to compare its initial and final harvest (for example, to explore relationship between exchangeable cations and pH). Linear regression models were used to analyse results for some of the variables, for example, to explore the relationship between exchangeable cations and pH. All statistical analysis was performed using R 4.2.1 and RStudio® 2023.12.1 software. No generative artificial intelligence (GenAI) has been used in this paper.

3. Results

3.1. Impact of Basalt Dust on Soil Chemical Properties

3.1.1. General Trends in Short-Terms Reactions

Three to four days after mixing the basalt to both soils, measurements on the soil + basalt mixes were compared with theoretical values obtained on a simple passive mass-weighted average calculation (Equation (1)). This mix could, therefore, express either a dilution (e.g., P, K), an enrichment (Ca, Na), or both (e.g., Mg, Mn), depending on whether the basalt was higher or lower concentrated in a given element compared to the soil (Table 1).
Soil + basalt measurements showed contrasting results according to the soil type and between trace or major elements. On the sandy soil from Bordeaux, the measured concentrations for major extractable elements (Table 2) were consistent with the expected concentrations. However, they deviated positively from the theoretical initial concentrations for the loamy soil from Harpenden: 2% for K, 8% for P (for the 80 t ha−1 treatment, only), 10% for Ca and up to 15% for Na. As far as micronutrients were concerned, even larger gap occurred in both soils. These trends, however, differed between soils, with manganese (Mn) exhibiting such a contrasted pattern: in the Bordeaux soil, there was a 30% positive gap whereas in the Harpenden soil, there was a 20% deficit.

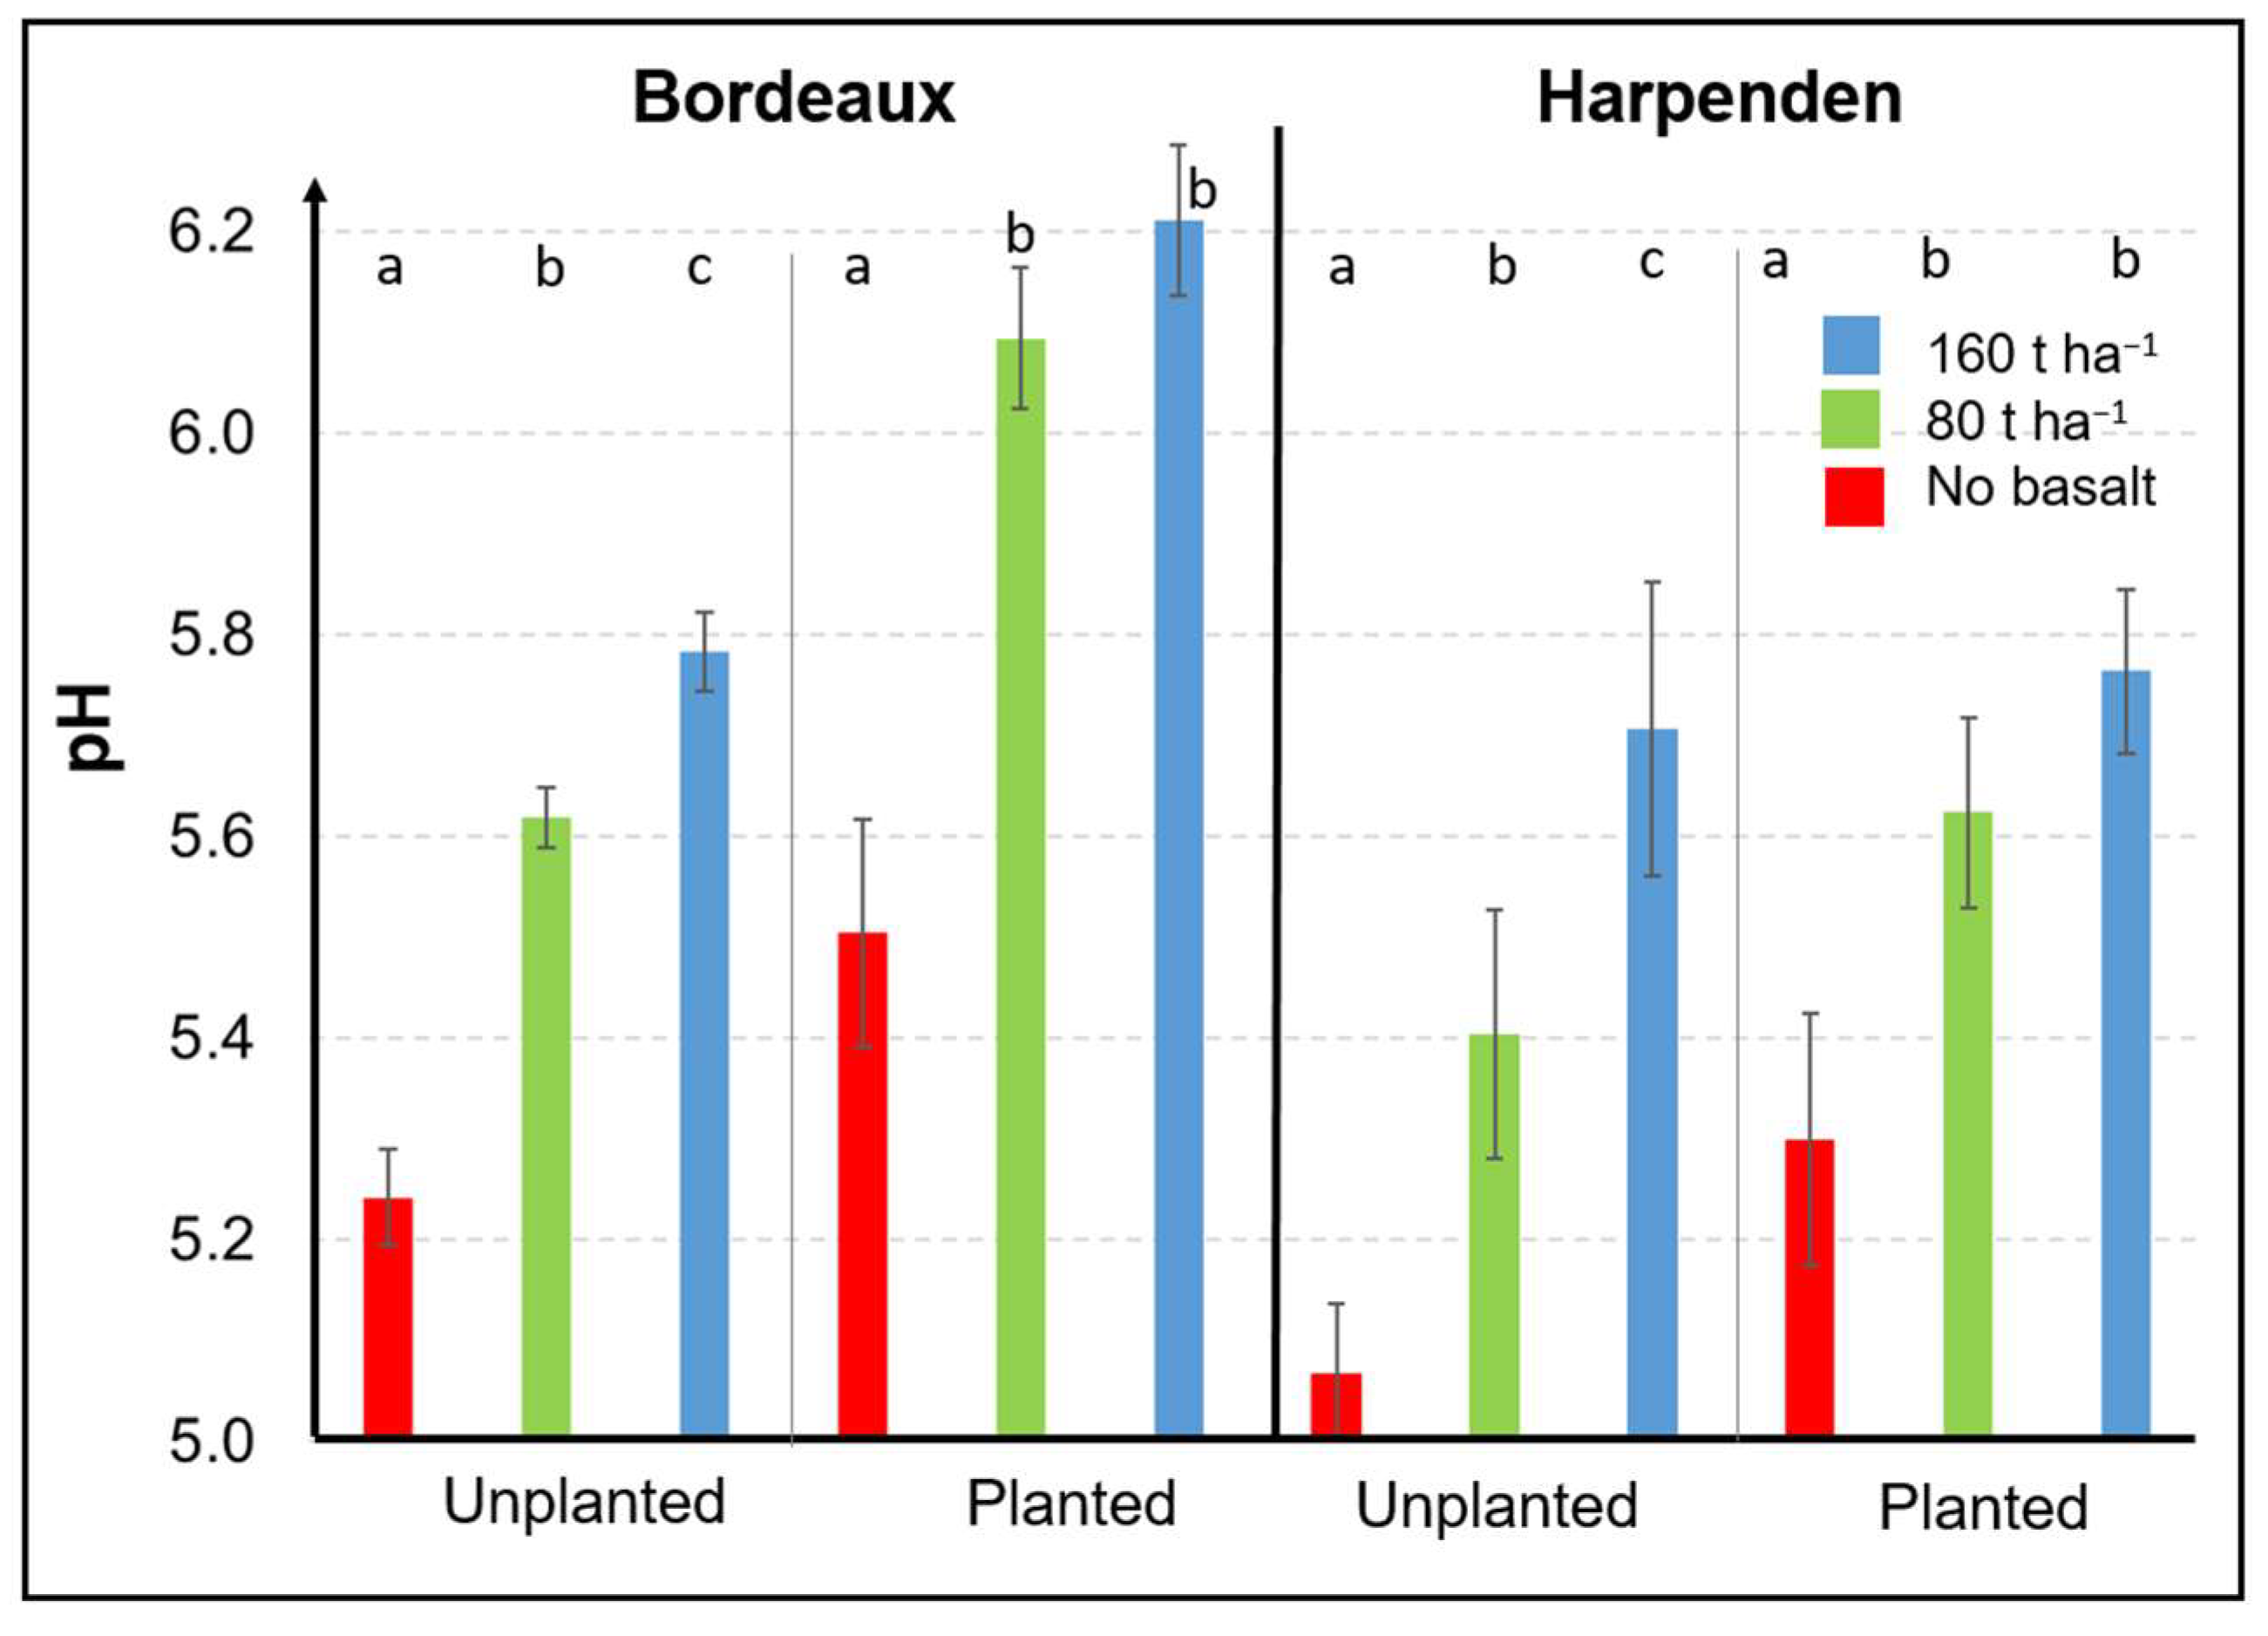
3.1.2. Effects of Basalt on the Soil pH at the End of the Experiment

Independent of the soil and plant treatment, the addition of basalt resulted in an increase in soil pH from control to full amount of basalt of between 0.5 and 1 pH unit (Figure 1). The ANOVA comparisons of soil pH values in individual trials (Harpenden or Bordeaux) showed that all three basalt treatments in unplanted soils were significantly different, whereas in planted soils the rise in pH was only significant between control and both basalt treatments.
We estimated that the same pH effect would have been obtained with only 4 and 3.5 t ha−1 CaO in Harpenden and Bordeaux, respectively, according to Equation (4) and COMIFER [44]. Therefore, considering the quantities of basalt used (80 or 160 t ha−1), we conclude that the acid neutralising capacity (ANC) of basalt is very low, close to 5% of a conventional lime amendment.

3.1.3. Effect of Basalt on Extractable Elements at the End of the Experiment

At the end of the experimentation, highly significant effects (p-values < 0.01) on most of the nutrients were observed at both sites. As with short-term reactions, these effects were soil-dependant (Table 3a,b). In the Bordeaux soil, the basalt dust had a highly significant effect on extractable Ca, K, P, Mn and Zn. Thus, five of ten soil elements measured significantly changed with the basalt treatment, three of them being major elements for plant nutrition (Table 3a). Considering the planted soil treatment, exchangeable Ca showed the greatest increase (28%) between the control and 160 t ha−1 basalt treatment. K increased by 6%, and P decreased by 15%. For exchangeable micronutrients, Mn and Zn decreased by 47% and 57%, respectively. In the Harpenden soil, the basalt dust had a strongly significant effect on Ca, K, Mg, Mn, Zn, and Ni soil concentrations, which represents six of ten elements measured (Table 3b). Considering the planted soil treatment, the increases between the control and the 160 t ha−1 basalt treatment represented 10%, 16% and 26% of the initial exchangeable concentration for K, Ca and Mg, respectively. The decreases in micronutrients were 85%, 223%, and 416% for Mn, Zn, and Ni, respectively.

3.2. Impact of Basalt Dust on Plant Response
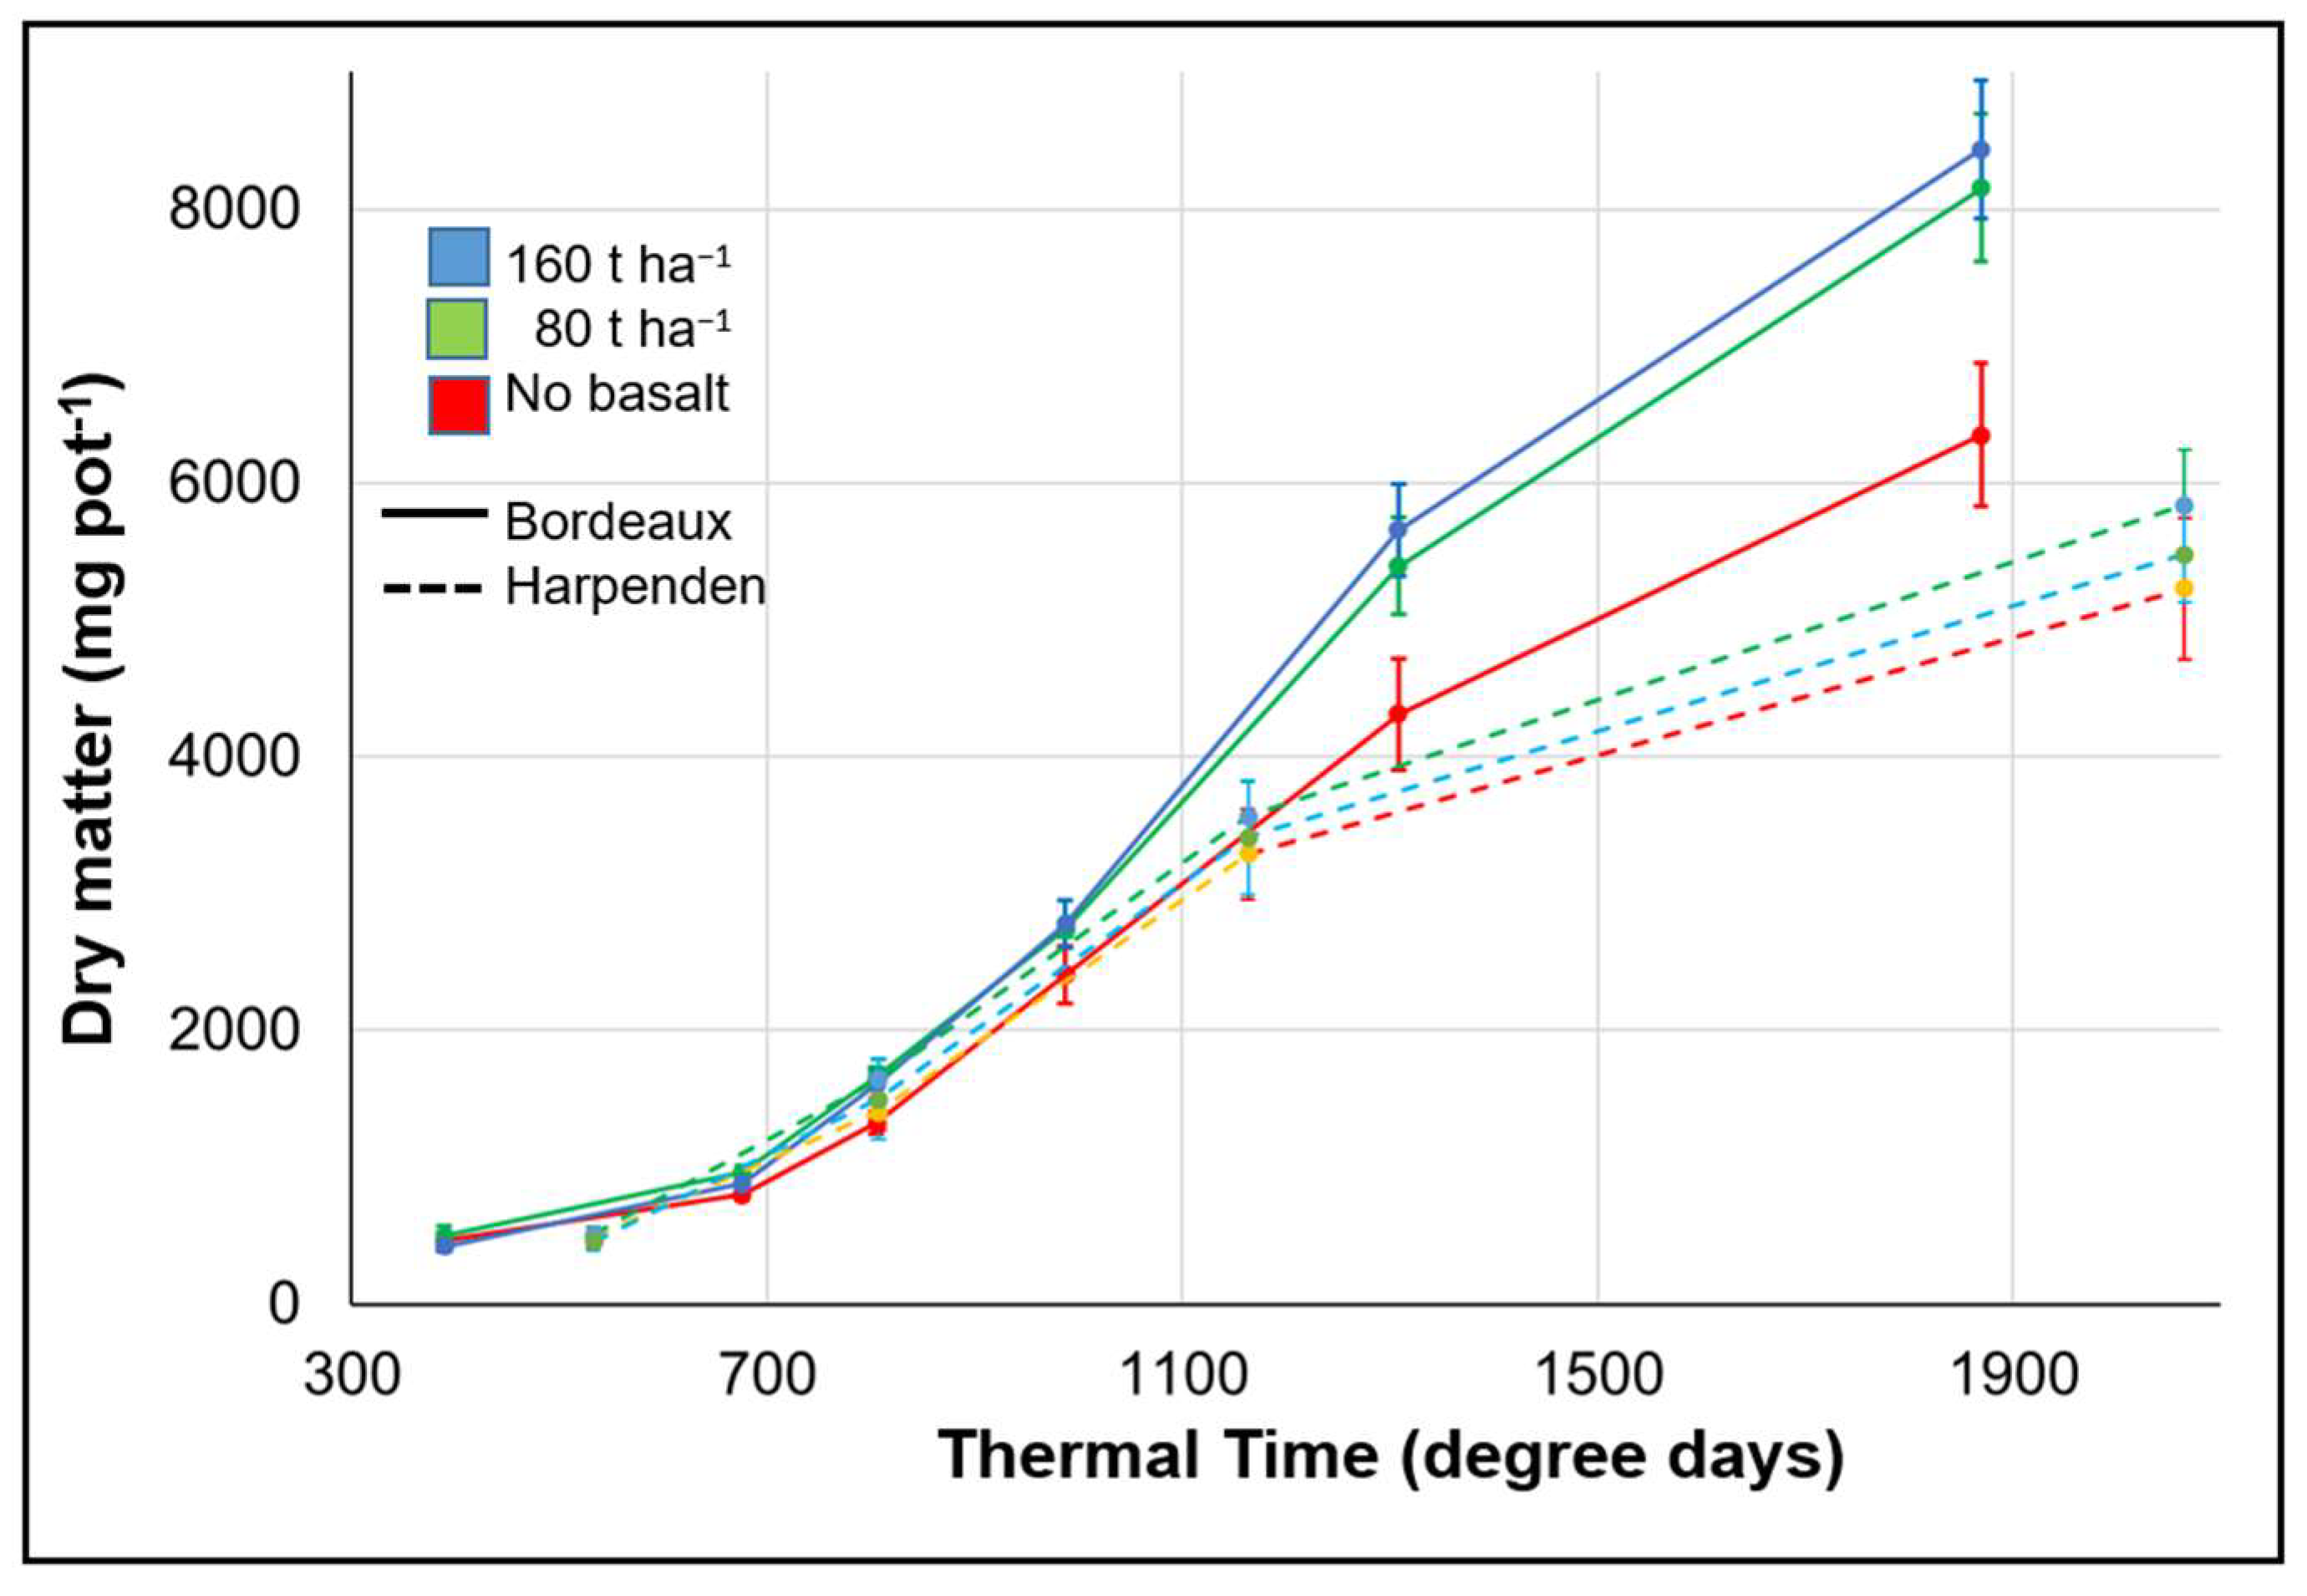
3.2.1. Yield Effect

For Bordeaux, significant yield gains were observable between control and basalt treated pots, reaching 28% and 33% at the end of the experiment for 80 and 160 t ha−1 basalt addition, respectively (Figure 2). The differences between the control and both basalt treatments were strongly significant (p < 0.01). The biomass yield differences between the two rates of basalt were not significant. For Harpenden soil and the whole trial duration, there were no significant differences in biomass, in spite of a trend in the following order: control < 160 t ha−1 basalt < 80 t ha−1 basalt.

3.2.2. Concentration and Uptake of Elements in Plants

Considering the two different soils separately, plant mineral concentrations and total uptakes were significantly different between the basalt treatments for seven and three of ten elements at Bordeaux and Harpenden, respectively (Table 4a,b). In Harpenden soil, the pattern of differences (p-values) was the same for plant elemental concentration and total uptake, and none of the major elements was affected by the basalt treatments. On the contrary, in Bordeaux, the effect of basalt was different depending on whether concentrations or uptakes were considered, notably for Na, P, Cu, and Zn. A possible reason for the consistent results between concentration and uptake in Harpenden plants might have been that yield showed only a small trend, but was significantly different in Bordeaux.
Among the major elements, K exhibited the highest use efficiency values. The basalt application had an average K efficiency of 33 and 16% in Bordeaux and Harpenden, respectively (Table 5). P had the second highest use efficiency, but was much smaller. Ca and Mg use efficiencies were negligible. The nutrients use efficiencies decreased with the dose of basalt employed.

3.3. Focus on Two Macro- and Two Micronutrients

3.3.1. Effects of Basalt on the Soil–Plant P and K Transfer

It is worth noting that initial exchangeable K was higher in Harpenden than in Bordeaux (109 mg kg−1 and 52 mg kg−1, respectively), whereas it was the opposite for extractable P (Olsen-P [39]) with 31 mg kg−1 and 5.5 mg kg−1 for Bordeaux and Harpenden, respectively.
The differences between initial extractable P and K measures on mixtures and their theoretical values are negligible (Table 2), thus showing no immediate soil–basalt chemical reactions. At the end of the experiments (Figure 3), the extractable K concentrations in the mixture significantly increased between the control and 160 t ha−1 basalt treatment (25 to 50% for planted soils of Harpenden and Bordeaux, respectively). Simultaneously, there was a decrease in extractable P with addition of basalt, both in unplanted and planted soils, after the final harvest (Figure 3, Table 2), far below what had already been measured after only a few days of mixing (Table 2). This decrease was only significant on Bordeaux soil. Across the whole experiment (considering starting and ending values), soil extractable P was partially driven by pH (r2 = 0.5), with an inverse linear relationship, but in Bordeaux soil only (Figure S3).
As far as plant nutrient status is concerned, it is worth underlining the remarkable increase in plant K concentration (+26%) and uptake (+66%) in the 160 t ha−1 basalt treatment in the Bordeaux soil compared to the reference treatment (Table 4a). The increase in yield (Figure 2) suggests that K might have been an initially limiting factor only in Bordeaux soil. No similar effect was observed in the Harpenden trial for plants (Table 4b, Figure S4) in spite of a significant increase in soil extractable K (Figure 3, Table 3b). The initially elevated level of exchangeable K in Harpenden and its large total reserve in soil is consistent with the absence of effect on uptake and yield.
The P soil–plant transfers during the experiment were different in the two soils, mirroring the extractable soil P concentrations measured at the end of the experiment (Figure 3, Table 3). In Bordeaux, the highly significant decrease in extractable P with increasing basalt rate in unplanted and planted treatments reduced the plant concentration significantly (Table 4a), while the uptake remained constant (i.e., a dilution process, Table 4b). In Harpenden, there was no significant influence of basalt additions on plant P concentration or uptake, although the initial state was depleted. Finally, it should be highlighted that all P concentrations in plants were above the threshold range for adequate nutrition (between 3 and 4 g kg−1) in Bordeaux soil, while they were deficient (between 1 and 2 g kg−1) in Harpenden soil [32].
Rough P and K budgets were based on the variations (final minus initial states) of soil extractable P and K and plant uptake (Equation (2), Table 6), with a resulting gap being interpreted as basalt and soil weathering (K release from clay interlayers and P desorbed or dissolved form P-bound minerals) during the 5-month experiment. The mass balance showed that the contribution of release and weathering to the plant uptake and the final soil exchangeable K pool represented a low proportion of total K in Harpenden (<2%) but was higher in Bordeaux (up to 10%).
The P mass balances indicated very little weathering (Table 6), which needs to be considered along with the lower concentrations measured in plants (Table 4a). Estimated P release from the added basalt was still lower in Harpenden soils but seemed to remain constant across the three basalt treatments. These results are consistent again with the nutrient use efficiencies (Table 5) where only the Bordeaux 80 t ha−1 eq. treatment showed a substantial value for this indicator.

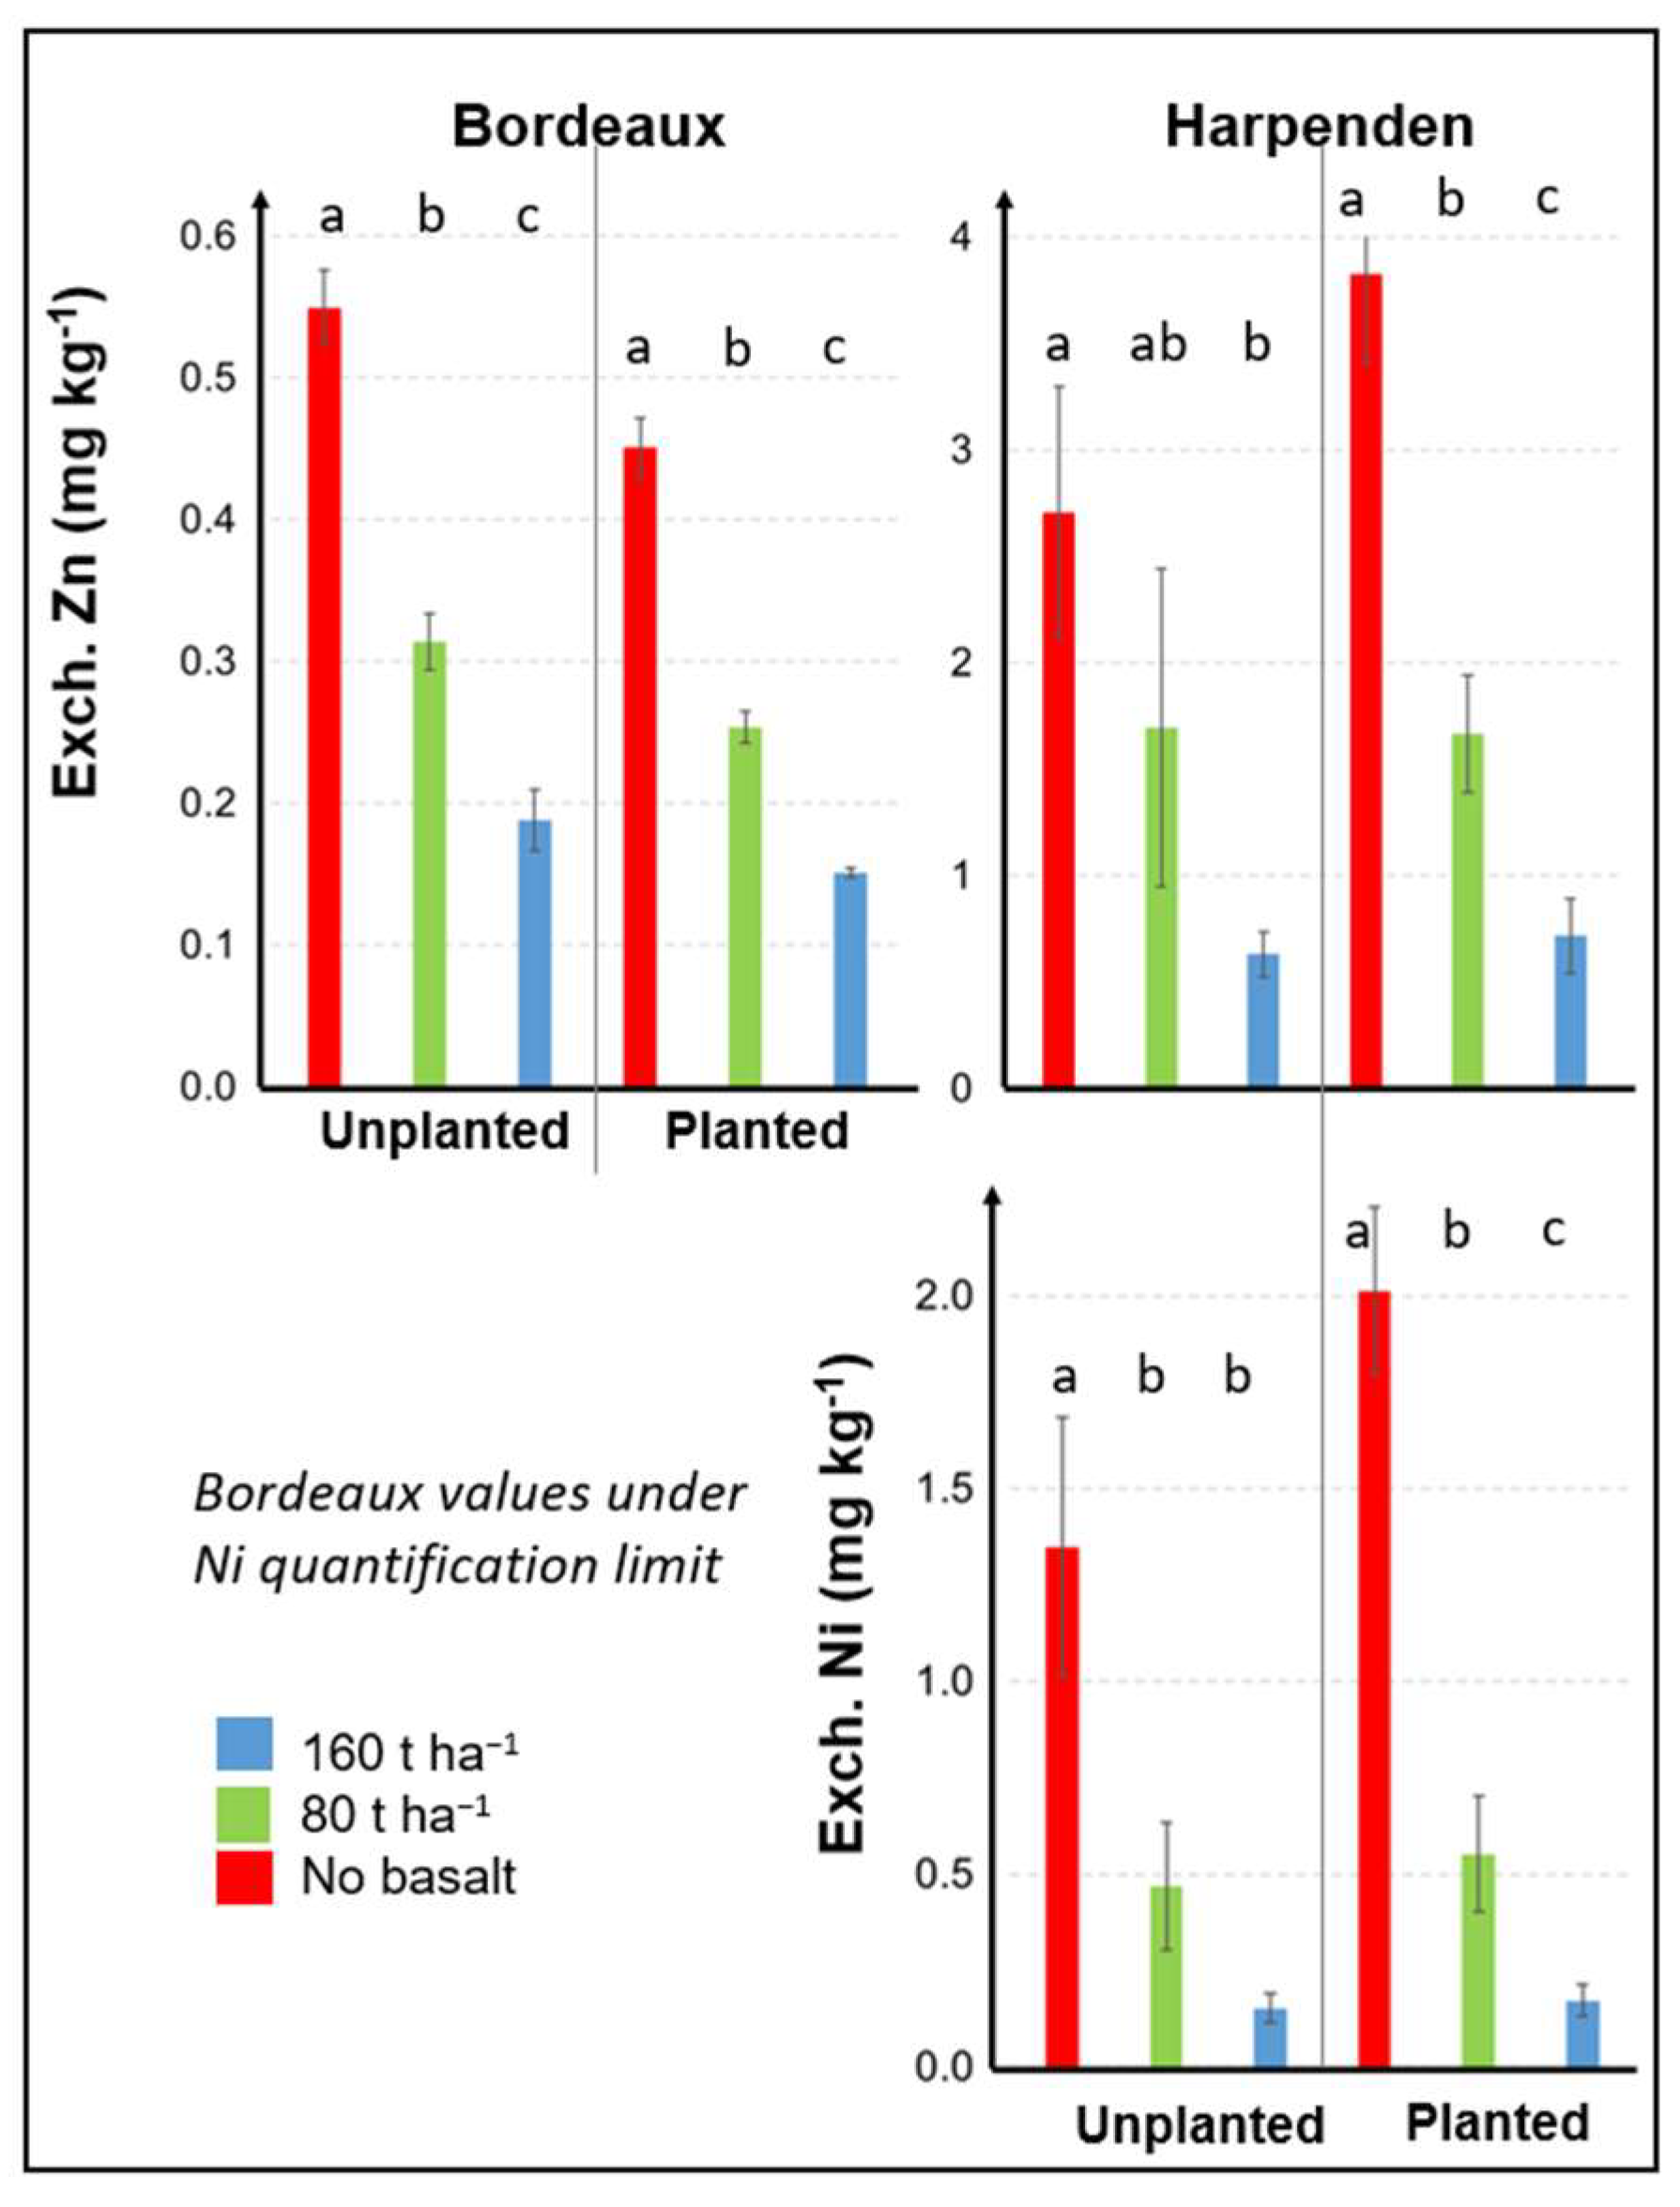
3.3.2. Effects of Basalt on the Soil–Plant Zn and Ni Transfer

The initial concentration in total Zn differed between both soils (6 and 54 mg kg−1 for Bordeaux and Harpenden soils, respectively). In terms of Zn extractability, the Bordeaux soil was considered to be depleted (threshold below 1 mg kg−1 [45], while the Harpenden soil (1.39 mg kg−1, Table 1) had an adequate extractability. Interestingly, there was no detectable exchangeable Zn in basalt dust. Due to its higher total Zn concentration (68 mg kg−1), the addition of basalt led to a 1200% increase compared to the initial total amount in the Bordeaux soil, and by 30% in the Harpenden soil. This addition of Zn through the basalt mixing resulted, however, in lower extractable concentrations than expected in the theoretical initial mix (Table 2), with a 16 and 50% decrease in Bordeaux for the 80 and 160 t ha−1 basalt treatments, respectively. The decrease was even greater in Harpenden soil, causing a 40 and 62% drop in the two treatments. We observed that same pattern in the final Zn status for both soils and both plant treatments of significant negative response for extractable Zn with increasing basalt amendments (Figure 4, Table 3).
As pH is known to influence trace element extractability, especially in Harpenden soil [46], we studied the relationship between extractable Zn and pH changes in the experiments. This relationship (Figure S5) showed a negative exponential function, with R2 values of 0.52 and 0.56 for Bordeaux and Harpenden soils, respectively.
The pattern of extractable Ni was quite similar to that described for Zn: the Bordeaux soil had a low total concentration compared to basalt (0.7 and 25.7 mg kg−1, respectively, Table 1). Extractable Ni was below the detection limit for Bordeaux. In Harpenden soil, the initial total element concentration of Ni (17.1 mg kg−1) was similar to that in basalt while the extractable concentration was 0.44 mg kg−1 (Table 1). At harvest, no extractable Ni could be detected in Bordeaux soil while highly significant decreases were detected in Harpenden soil in both unplanted and planted soils (Figure 4, Table 3).
As for the plants, the total Zn uptake on Bordeaux soil increased by 15 and 23% for 80 and 160 t ha−1 eq basalt treatments, mirroring the yield gain (Table 4b, Figure S6). Conversely, in Harpenden soil, plant Zn concentration and uptake decreased by 16% for 160 t ha−1 eq. treatment, in line with the soil extractable Zn response to basalt additions (Table 3). These opposite variations in plant Zn concentration and total uptake occurred within or above adequate tissue concentrations for crops, according to the 20 to 60 mg kg−1 threshold defined by Reuter and Robinson [47].
Concentrations of Ni in the plant and total uptake mirrored the observed Zn pattern (Table 4a,b, Figure S6). Concentration and uptake showed opposite patterns for the two trials: basalt increase was associated with a Ni increase in Bordeaux plants and a decrease in Harpenden plants. All these differences were significant, and all the average values of plant concentrations remained within the normal and non-toxic range, 0.1–5 mg kg−1 as defined by Mengel et al. [32].

3.4. Overview of Soil–Plant Responses to Basalt Use for the Two Experiments

The responses of soil–plant systems to basalt for the whole set of measured nutrients are synthesised in Table 7. The table is built by groups of columns to visualise elements classified by type (macro-, micronutrients), and group of rows relating to offsets of data from the experiments (initial mixture, final concentrations in soils and plants). The intersection of horizontal and vertical groups leads to blocks that are expected to have homogeneous reactions based on geochemical and biological processes.
At first sight, there is no block with homogeneous responses. The basalt dust gave contrasting effects on plant nutrition, depending on the elements, the soils, and their interactions. The most stable block was soils at the final harvest (second horizontal group) with two emerging trends: (i) all extractable macro elements, except P, showed increases with basalt rate, and (ii) micronutrients were mainly subjected to a decrease with the increase in basalt (6 cases out of 10 for unplanted soils). These effects are similar whether the treatments were planted or not.
These observations lead us to suggest the following general processes: (1) Adding macro- and micronutrients in basalt particularly marked effects on plants nutrients that are of low status in the soils. (2) Macronutrients may originally be extractable in the basalt before mixing to the soil, and become more extractable over time with increased weathering, especially in soils deficient in those elements. (3) Uptake in plants generally increases for macronutrients and decreases for micronutrients, due to increased or decreased extractability, respectively, partially related to pH increase.

4. Discussion

4.1. pH Responses in the Short Term, Compared to Conventional Liming Products and Literature on Agricultural ERW

Among the multiple soil–plant parameters measured after the use of basalt, pH is the one exhibiting the steadiest response, increasing with increasing basalt dose, in both soils and with or without grass. The average difference here between control and strong basalt treatment is 0.6 pH unit (±0.1). Indeed, basalt amendment was expected to have an alkalinising effect on acidic soils [1]. Swoboda [24] described a range between 0.2 and 0.4 pH unit increase for average amendment doses below 100 t ha−1 eq. on trials ranging from 2 months to 3 years duration. These trends and order of magnitude are common in recent ERW literature [12,48]. The significant 0.6 pH increase obtained in our pot experiments is modest but probably sufficient to alter the extractability of pH-sensitive nutrients like P or micronutrients, as shown on the Ni results and confirmed in the literature [28]. For divalent micronutrients cations, Verma and Minhas [49] and Rengel et al. [50] underlined that solubility was decreased by one hundred-fold for every unit increase in pH. There are, however, some exceptions, with uptake of cationic micronutrients increasing with the doses of basalt in some tropical contexts [51].
The pH values for both soils ranged within the usual zone where buffer capacity is described as the weakest (i.e., no carbonate effect nor alumino-silicate one). This may explain why the sandy soil, which was expected to be more sensitive to this 8.79 pH basalt effect because of its weakest buffer capacity, behaved like the clayey one, at least for the trial duration.
It should be underlined that in spite of a significant rise in pH, the acid neutralising capacity of the basalt dust appeared weak (5%). The comparison should, however, be taken with caution, as the ANC is theoretically measured under incubation laboratory-controlled conditions [42]. Moreover, basalt weathering and its effects on soil pH should be considered over a longer period; the results obtained represent a partial effect. Basalt addition could buffer soil acidity for a long time.

4.2. High K Weathering

The K content of the basalt amended in this experiment, i.e., 0.17% extracted with aqua regia (Table 1), was lower than other K-bearing minerals studied for the nutritional value of ERW. For example, Hinsinger and Jaillard [52] andHervé et al. [53,54] used rocks containing 8.2%, and 4.7 to 11% K, respectively. Despite this low content and the short duration of the experiments, the exchangeable K increased strongly significantly in both soils (initially both K-deficient) at the final harvest, coarsely estimated at 6 and 10% of the soil initial exchangeable contents, for Bordeaux and Harpenden soils, respectively. This fertilisation effect was also supported by the ‘Apparent K released and weathered’ (Table 6) and, eventually, resulted in 16 and 33% of K Use Efficiencies (KUE) for Harpenden and Bordeaux soils, respectively (Table 5). Compared to published equivalent indicators, these amounts are considered to be in the upper range. Indeed, Hervé et al. [54] described KUE from 0 up to 38%, analysing the fertilising potential of sixteen silicate rocks amended in comparable experimental conditions as our pot trials (i.e., pot trial using slightly acidic soil, ryegrass for a crop cycle duration). The range of efficiencies they obtained is due both to rock type and processing these rocks before spreading. While they theorised that hydrothermal treatment was necessary to obtain a substantial fertiliser effect, we found the same KUE without pre-treatment, and coarse dust.
The response of the soil–plant system to the addition of basalt was expected to be stronger in the Bordeaux soil and, hence, plants, in such initially K-depleted soil. Indeed, one of our assumptions was that low content of K in the soil compared with the basalt content should foster its release [24]. In this soil, the basalt amendment supplied 44% of total K of the initial soil + basalt mixture content compared to a 4% supply in Harpenden. Given the sandy texture of the soil of Bordeaux, it is likely that the excess of K measured in the soil–plant system at the end of the experiment was probably accounted for by the weathering of basalt, which probably started before its mixing with soil, as shown by the exchangeable K content of the basalt shown in Table 1 (47 mg K kg−1). This response was consistent with other published results on ERW. Indeed, Hervé et al. [54] assumed, through a similar elemental budget approach and a comparable pot trial (i.e., clayey soil, 4-month duration), that basalt represented the only supplementary supply for K and thus indicated K release from the rock powder.
The net value of the gap calculated in Bordeaux (when subtracting the quantity released from the “No basalt” treatment, Table 6) is, however, of the same order of magnitude as the one found in Harpenden (30–40 mg K per pot), although this amount seemed relatively low compared to the initial exchangeable K, and even less with regard to the total content of K in the initial mix (2%). We can hypothesise that these responses were not driven by the same chemical processes. More precisely, in the silty clayey soil, we assume that the effects of basalt on pH or other chemical equilibria changed the repartition in K pools of the soil, enhanced the release from the soil stock, notably the K bound into the clays, without direct release from the basalt.

4.3. Attenuated Effect on Plant P Nutrition, in Contrast to Literature

The initial status of the soil content of extractable P was different between the two trials. Considering a critical threshold value for fertilisation of 35 mg kg−1 [29], Bordeaux soil was close to the adequate content with 31 mg kg−1, whereas Harpenden was to be considered as strongly depleted with 5.5 mg kg−1. With a total P content in the basalt of 0.09%, relative amount of total P provided by the basalt amendment varied from 5% (Harpenden 80 t ha−1 eq.) to 22% (Bordeaux 160 t ha−1 eq.) in the mixtures.
Despite this net P contribution, no change and even decrease in extractable P were measured at final sampling, on unplanted and planted soils (Table 3, Figure 3) of Harpenden and Bordeaux, respectively. This might be explained by the short duration of the trials and the low extractable P in basalt dust (Table 1). Such adverse effect of basalt on extractable P in Bordeaux pots is consistent with Barrow. [55] who theorised an optimum for P availability in soil and for plant uptake at pH below 6. In both experiments, the basalt amendment increased values at final harvest of pH around 6, therefore leading to no or decreased P extractability. Also, basalt added other extractable mineral elements (Table 3), notably Ca, which could foster P precipitation as one potential cause for decreasing extractability in Bordeaux trial. But it is worth mentioning that pH explained a maximum of roughly 50% of the variability of extractable P (Supp. Mat. 3). This last assessment is consistent again with the several effects of basalt on soil functioning, as, for example, with micronutrients.
Concerning the comparison with other ERW results, the basalt used in the two pot trials had similar orders of magnitude for P content compared with other silicate materials used for ERW field trials. Notably Lewis et al. [56] analysed six basalt dusts ranging from 0.05% to 0.6% of total P content and used on large scale ERW field trials. Their modelling results of P supply by ERW of basalt predicted an extractable P supply with a single basalt amendment ranging from 26% of a conventional fertilisation to a full fertilisation amount for spring wheat, within the first year (P Use Efficiency). They even assumed partial replacement of P-fertilisers through repeated applications according to model projections for 5 years. The model used by these authors, derived from Kelland et al. [25], was based on a comparable soil to the one used in the Harpenden pot trial. We found contradictory results compared to their model. If we assume that (i) optimum extractability for P is effectively below pH 6, (ii) management usually targets soil pH above 6.0 for grassland and 6.5 for arable agriculture [31], and (iii) successive basalt amendment will have a cumulative alkalinising effect, questioning the potential of P supply obtained mainly through modelled weathering seems reasonable. Furthermore, it is worth mentioning that the dissolution models of agricultural ERW use geochemical equations for silicate dissolution rates which are mainly built for metal cations and protons [22,23] whereas P is present in anionic form in soil.

4.4. To Which Extent Can a Weathering Result for a Given Element Be Extended to Other Elements, and to Other Soil Contexts?

It is interesting to compare results obtained in this multi-site and multi-elements study with the usual assumption found in the agricultural ERW literature. They often state that far-from-equilibrium conditions between basalt and soil solution foster the dissolution of minerals from the rock dust. With this hypothesis, an element is expected to be released relatively to its proportion in the rock dust [1,24]. This simple ‘disequilibrium’ model applied to our synthesis (Table 7) would consist of assessing the predictability of the plant element concentrations and uptake (last row) by the differences between basalt and soil mineral concentrations (first row). Applying this to our data, the model would be validated in 7 cases out of 20 and would be refuted in 3 cases (Mn, Ni, Zn). Using the extractable forms of the elements (second row) rather than the total contents would worsen the predictability, with 5 cases out of 20 consistent with the model. However, when combined with the pH effect on P and micronutrients in the basalt, the ‘disequilibrium’ model improves the general understanding of the minerals weathered and their effects on plants.

5. Conclusions

The general conclusion of our trials is that a simplified but realistic agricultural plant–soil system replicated in two environments with the same basalt amendments for short duration experiments (relative to the weathering processes) resulted in contrasting nutrition effects within each trial and between them. This apparent absence of similar patterns of the influence of basalt dust on plant mineral nutrition is explained by Soil x Basalt interactions, especially driven by the pH modifications and the initial mineral status of the soils. Regarding this argument, it is worth recalling the clear pH influence on P and micronutrients (r2 > 0.5). Thus, measuring a high weathering rate for a specific element in a given basalt + soil mix (e.g., K) does not necessarily mean that all the other elements will be released in the same proportions, contrary to the results of Lewis et al. [56]. This also explains why the same basalt, mixed with two contrasting soil textures (clayey vs. sandy) but very similar pH, led to considerable differences in the percentage of elements released (e.g., P, K) and related use efficiencies. These contrasting responses explain the variation in results in the literature. Our results support an alternate view from the simplified, but common, prediction of rock dust dissolution releasing all its elements and consequently increasing the uptake of all the nutrients by plants. Therefore, rock dust application has to be re-evaluated at each site with differing soil characteristics.

Supplementary Materials

The following supporting information can be downloaded at: https://www.mdpi.com/article/10.3390/agronomy15081791/s1. Figure S1: Particle size repartition of the basalt dust used in the pot experiments; Figure S2: Mineral composition of the basalt dust; Figure S3. Relationship between Olsen-P and soil pH in water in Bordeaux pot trial through linear regression model. Both final and initial measurements are considered. Harpenden soil was not considered for this model as Olsen-P apparently did not respond to experimental conditions in that strongly P depleted soil; Figure S4. Potassium (above) and phosphorus (below) responses of plants (i.e., concentration and uptake) to basalt treatments at the final harvest or the two trials. Different letters by site and plant treatment indicate significant difference; Figure S5. Negative exponential relationship between available zinc and pH in the two soils (extractable zinc determined with the 1M ammonium nitrate extraction). Shown are values from individual pots and all treatments; Figure S6. Zinc and nickel responses to basalt treatments at final harvest for plants from the two trials. Different letters by site and plant treatment indicate significant differences.

Author Contributions

Conceptualisation, C.D., L.J.-M. and S.M.H.; methodology, C.D., L.J.-M., S.M.H. and J.H.; validation, C.D., L.J.-M., J.H., C.L.T., S.D. and F.D.; formal analysis, C.D., L.J.-M. and F.D.; resources, C.D., L.J.-M. and S.M.H.; data curation, C.D. and F.D.; writing—original draft preparation, C.D. and L.J.-M.; writing—review and editing, L.J.-M., S.P.M. and S.M.H.; supervision, L.J.-M. and S.M.H.; project administration, L.J.-M. and S.M.H.; funding acquisition, L.J.-M. and S.M.H. All authors have read and agreed to the published version of the manuscript.

Funding

Rothamsted Research received funding under the UK Enhanced Rock Weathering GGR Demonstrator grant BB/V011359/1. S.M.H., J.H., C.L.T. and S.D. acknowledge support from the Growing Health (BBS/E/RH/230003B; BBS/E/RH/230003C) Institute Strategic Programme.

Data Availability Statement

The data is available on request from the leading author, a data publication is in preparation.

Conflicts of Interest

The authors declare no conflicts of interest. The funders had no role in the design of the study; in the collection, analyses, or interpretation of data; in the writing of the manuscript; or in the decision to publish the results.

References

  1. Hartmann, J.; West, J.; Renforth, P.; Kölher, P.; De La Rocha, C.L.; Wolf-Gladrow, D.A.; Dürr, H.H.; Scheffran, J. Enhanced chemical weathering as a geoengineering strategy to reduce atmospheric carbon dioxide, supply nutrients, and mitigate ocean acidification. Rev. Geophys. 2013, 51, 113–149. [Google Scholar] [CrossRef]
  2. Renforth, P.; Henderson, G. Assessing ocean alkalinity for carbon sequestration. Rev. Geophys. 2017, 55, 636–674. [Google Scholar] [CrossRef]
  3. Gaillardet, J.; Dupré, B.; Louvat, P.; Allègre, C.J. Global silicate weathering and CO2 consumption rates deduced from the chemistry of large rivers. Chem. Geol. 1999, 159, 3–30. [Google Scholar] [CrossRef]
  4. Raymond, P.A.; Cole, J.J. Increase in the Export of Alkalinity from North Americas Largest River. Science 2003, 301, 88–91. [Google Scholar] [CrossRef] [PubMed]
  5. Gastmans, D.; Hutcheon, I.; Menegario, A.; Kiang Chang, H. Geochemical evolution of groundwater in a basaltic aquifer based on chemical and stable isotopic data: Case study from the Northeastern portion of Serra Geral Aquifer, Sao Paulo state (Brazil). J. Hydrol. 2016, 535, 598–611. [Google Scholar] [CrossRef]
  6. Leonardos, O.H.; Fyfe, W.S.; Kronberg, B.I. The use of ground rocks in laterite systems: An improvement to the use of conventional soluble fertilizers? Chem. Geol. 1987, 60, 361–370. [Google Scholar] [CrossRef]
  7. Gillman, G.P. The Effect of Crushed Basalt Scoria on the Cation Exchange Properties of a Highly Weathered Soil. Soil Sci. Soc. Am. J. 1980, 44, 465–468. [Google Scholar] [CrossRef]
  8. Holden, F.J.; Davies, K.; Bird, M.I.; Hume, R.; Green, H.; Beerling, D.J.; Nelson, P.N. In-field carbon dioxide removal via weathering of crushed basalt applied to acidic tropical agricultural soil. Sci. Total Environ. 2024, 955, 176568. [Google Scholar] [CrossRef] [PubMed]
  9. Harley, A.D.; Gilkes, R.J. Factors influencing the release of plant nutrient elements from silicate rock powders: A geochemical overview. Nutr. Cycl. Agroecosystems 2000, 56, 11–36. [Google Scholar] [CrossRef]
  10. Manning, D.A.C.; Theodoro, S.H. Enabling food security through use of local rocks and minerals. Extr. Ind. Soc. 2020, 7, 480–487. [Google Scholar] [CrossRef]
  11. Manning, D.A.C. How will minerals feed the world in 2050? Proc. Geol. Assoc. 2015, 126, 14–17. [Google Scholar] [CrossRef]
  12. Vandeginste, V.; Lim, C.; Ji, Y. Exploratory Review on Environmental Aspects of Enhanced Weathering as a Carbon Dioxide Removal Method. Minerals 2024, 14, 75. [Google Scholar] [CrossRef]
  13. Almaraz, M.; Bingham, N.L.; Holzer, I.O.; Geohegan, E.K.; Goertzen, H.; Sohng, J.; Houlton, B.Z. Methods for determining the CO2 removal capacity of enhanced weathering in agronomic settings. Front. Clim. 2022, 4, 970429. [Google Scholar] [CrossRef]
  14. Fuss, S.; Lamb, W.F.; Callaghan, M.W.; Hilaire, J.; Creutzig, F.; Amann, T.; Beringer, T.; Garcia, W.O.; Hartmann, J.; Khanna, T.; et al. Negative emissions—Part 2: Costs, potentials and side effects. Environ. Res. Lett. 2018, 13, 063002. [Google Scholar] [CrossRef]
  15. IPCC. Summary for Policymakers. In Global Warming of 1.5 °C; An IPCC Special Report on the impacts of global warming of 1.5 °C above pre-industrial levels and related global greenhouse gas emission pathways, in the context of strengthening the global response to the threat of climate change, sustainable development, and efforts to eradicate poverty; Cambridge University Press: Cambridge, UK; New York, NY, USA, 2018; pp. 3–24. [Google Scholar] [CrossRef]
  16. IPCC. IPCC Climate Change 2023: Synthesis Report Contribution of Working Groups, I, II and III to the Sixth Assessment Report of the Intergovernmental Panel on Climate Change; Core Writing Team, Lee, H., Romero, J., Eds.; IPCC: Geneva, Switzerland, 2023. [Google Scholar] [CrossRef]
  17. Andrews, M.G.; Taylor, L.L. Combating Climate Change Through Enhanced Weathering of Agricultural Soils. Elements 2019, 15, 253–258. [Google Scholar] [CrossRef]
  18. Beerling, D.J.; Kantzaz, E.; Lomas, M.R.; Wade, P.; Eufrasio, R.M.; Renforth, P.; Sarkar, B.; Andrews, M.G.; James, R.J.; Pearce, C.R.; et al. Potential for large-scale CO2 removal via enhanced rock weathering with croplands. Nature 2020, 583, 242–248. [Google Scholar] [CrossRef] [PubMed]
  19. Beerling, D.J.; Kantzaz, E.; Lomas, M.R.; Taylor, L.L.; Zhang, S.; Kanzaki, Y.; Eufrasio, R.M.; Renforth, P.; Mercure, J.-F.; Politt, H.; et al. Transforming US agriculture for carbon removal with enhanced weathering. Nature 2024, 638, 425–434. [Google Scholar] [CrossRef] [PubMed]
  20. Kantzas, E.P.; Martin, M.V.; Lomas, M.R.; Eufrasio, R.M.; Renforth, P.; Lewis, A.L.; Taylor, L.L.; Mercure, J.-F.; Politt, H.; Vercoulen, P.V.; et al. Substantial carbon drawdown potential from enhanced rock weathering in the United Kingdom. Nat. Geosci. 2022, 15, 382–389. [Google Scholar] [CrossRef]
  21. Beerling, D.J.; Leake, J.R.; Long, S.P.; Scholes, J.D.; Ton, J.; Nelson, P.N.; Bird, M.; Kantzas, E.; Taylor, L.L.; Sarkar, B.; et al. Farming with crops and rocks to address global climate, food and soil security. Nat. Plants 2018, 4, 138–147. [Google Scholar] [CrossRef] [PubMed]
  22. Brantley, S.L.; Kubicki, J.D.; White, A.F. Kinetics of Water-Rock Interaction; Springer: New York, NY, USA, 2008. [Google Scholar] [CrossRef]
  23. Oelkers, E.H. General kinetic description of multioxide silicate mineral and glass dissolution. Geochim. Cosmochim. Acta 2001, 65, 3703–3719. [Google Scholar] [CrossRef]
  24. Swoboda, P.; Döring, T.F.; Hamer, M. Remineralising soils? The agricultural usage of silicate rock powders: A review. Sci. Total. Environ. 2022, 807, 150976. [Google Scholar] [CrossRef] [PubMed]
  25. Kelland, M.E.; Wade, P.W.; Lewis, A.L.; Taylor, L.L.; Sarkar, B.; Andrews, M.G.; Lomas, M.R.; Cotton, T.E.A.; Kemp, S.J.; James, R.H.; et al. Increased yield and CO2 sequestration potential with the C4 cereal Sorghum bicolor cultivated in basaltic rock dust-amended agricultural soil. Glob. Change Biol. 2020, 26, 3658–3676. [Google Scholar] [CrossRef] [PubMed]
  26. Skov, K.; Wardman, J.; Healey, M.; McBride, A.; Bierowiec, T.; Cooper, J.; Edeh, I.; George, D.; Kelland, M.E.; Mann, J.; et al. Initial agronomic benefits of enhanced weathering using basalt: A study of spring oat in a temperate climate. PLoS ONE 2024, 19, e0295031. [Google Scholar] [CrossRef] [PubMed]
  27. Gunnarsen, K.C.; Jensen, L.S.; Rosing, M.T.; Dietzen, C. Greenlandic glacial rock flour improves crop yield in organic agricultural production. Nutr. Cycl. Agroecosystems 2023, 126, 51–66. [Google Scholar] [CrossRef]
  28. WRB IUSS Working Group. World Reference Base for Soil Resources 2014, update 2015. In International Soil Classification System for Naming Soils and Creating Legends for Soil Maps. World Soil Resources Reports; FAO: Rome, Italy, 2015; p. 106. [Google Scholar]
  29. COMIFER. La Fertilisation P-K-Mg: Les Bases du Raisonnement; French Association for Fertilisation Research and Development: Paris, France, 2019; Available online: https://comifer.asso.fr/les-brochures (accessed on 9 July 2025).
  30. Augusto, L.; Bakker, M.; Morel, C.; Meredieu, C.; Trichet, P.; Badeau, V.; Arrouays, D.; Plassard, C.; Achat, D.; Gallet-Budynec, A.; et al. Is ‘grey literature’ a reliable source of data to characterize soils at the scale of a region? A case study in a maritime pine forest in southwestern France. Eur. J. Soil Sci. 2010, 61, 807–822. [Google Scholar] [CrossRef]
  31. Agriculture and Horticulture Development Board. RB209 Section 4, Arable Crops in Nutrient Management Guide; Agriculture and Horticulture Development Board: Warwickshire, UK, 2021; p. 52. Available online: https://ahdb.org.uk/knowledge-library/rb209-section-4-arable-crops (accessed on 9 July 2025).
  32. Mengel, K.; Kirkby, E.A.; Kosearten, H.; Appel, T. Principles of Plant Nutrition; Springer: Dodrecht, The Netherlands, 2001. [Google Scholar] [CrossRef]
  33. Avery, B.W.; Catt, J.A. The Soil at Rothamsted; Lawes Agricultural Trust: Harpenden, UK, 1995. [Google Scholar] [CrossRef]
  34. Randal, B.A.O. Dolerite-pegmatites from the Whin Sill near Barrasford, Northumberland. Proc. Yorks. Geol. Soc. 1989, 47, 249–265. [Google Scholar] [CrossRef]
  35. Wood, C.; Harrison, A.L.; Power, I.M. Impacts of dissolved phosphorus and soil-mineral-fluid interactions on CO2 removal through enhanced weathering of wollastonite in soils. Appl. Geochem. 2023, 148, 105511. [Google Scholar] [CrossRef]
  36. ISO10390; Soil Quality—Determination of pH. International Organisation for Standardisation: Geneva, Switzerland, 2005.
  37. McGrath, S.P.; Cunliffe, C.H. A simplified method for the extraction of the metals Fe, Zn, Cu, Ni, Cd, Pb, Cr, Co and Mn from soils and sewage sludges. J. Sci. Food Agric. 1985, 36, 794–798. [Google Scholar] [CrossRef]
  38. Zeien, H.; Brümmer, G.W. Chemische Extraktionen Zur Bestimmung von chwermetallbindungsformen in Böden. Mitt. Dtsch. Bodenk. Gesell. 1989, 59, 505–510. [Google Scholar]
  39. Olsen, S.R.; Cole, C.V.; Watanabe, F.S. Estimation of Available Phosphorus in Soils by Extraction With Sodium Bicarbonate; USDA Circular No. 939; US Government Printing Office: Washington, DC, USA, 1954. [Google Scholar]
  40. ISO 23470; Soil Quality—Determination of Effective Cation Exchange Capacity and Exchangeable Cations Using A Hexamminecobalt(III) Chloride Solution. International Organisation for Standardisation: Geneva, Switzerland, 2008.
  41. Zhao, F.; McGrath, S.P.; Crosland, A.R. Comparison of three wet digestion methods for the determination of plant sulphur by inductively coupled plasma atomic emission spectroscopy (ICP-AES). Commun. Soil Sci. Plant Anal. 1994, 25, 407–418. [Google Scholar] [CrossRef]
  42. AFNOR. NF 14984: Amendements Minéraux Basiques—Détermination de L’Effet d’un Produit sur le pH d’un Sol—Méthode par Incubation du Sol; Association Française de Normalisation: La Plaine Saint-Denis, France, 2016; Available online: https://www.boutique.afnor.org/fr-fr/norme/nf-en-14984/amendements-mineraux-basiques-determination-de-leffet-dun-produit-sur-le-ph/fa186574/58036 (accessed on 9 July 2025).
  43. Rémy, J.C.; Marin-Laflèche, A. L’analyse de terre: Réalisation d’un programme automatique. Ann. Agron. 1974, 25, 607–632. [Google Scholar]
  44. COMIFER. Le Chaulage, Des Bases Pour Le Raisonner; French Association for Fertilisation Research and Development: Paris, France, 2009; Available online: https://comifer.asso.fr/les-brochures (accessed on 9 July 2025).
  45. Cakmak, I.; Kalayci, M.; Kaya, Y.; Torun, A.A.; Aydin, N.; Wang, Y.; Arisoy, Z.; Erdem, H.; Yazici, A.; Gokmen, O.; et al. Biofortification and localisation of zinc in wheat grain. J. Agric. Food Chem. 2010, 58, 9092–9102. [Google Scholar] [CrossRef] [PubMed]
  46. Jordan-Meille, L.; Holland, J.E.; McGrath, S.P.; Glendining, M.J.; Thomas, C.L.; Haefele, S.M. The grain mineral composition of barley, oat and wheat on soils with pH and soil phosphorus gradients. Eur. J. Agron. 2021, 126, 126281. [Google Scholar] [CrossRef]
  47. Reuter, D.; Robinson, J.B. Plant Analysis: An Interpretation Manual; CSIRO Publishing: Canberra, Australia, 1997. [Google Scholar] [CrossRef]
  48. Richardson, J.B. Basalt Rock Dust Amendment on Soil Health Properties and Inorganic Nutrients—Laboratory and Field Study at Two Organic Farm Soils in New England, USA. Agriculture 2025, 15, 52. [Google Scholar] [CrossRef]
  49. Verma, T.S.; Minhas, R.S. Zinc and phosphorus interaction in a wheat-maize cropping system. Fertil. Res. 1987, 13, 77–86. [Google Scholar] [CrossRef]
  50. Rengel, Z.; Batten, G.D.; Crowley, D.E. Agronomic approaches for improving the micronutrient density in edible portions of field crops. Field Crops Res. 1999, 60, 27–40. [Google Scholar] [CrossRef]
  51. Conceição, L.T.; Silva, G.N.; Silva Holsback, H.M.; de Figueire do Oliveira, C.; Chaves Marcante, N.; de Souza Martins, E.; de Souza Santos, F.L.; Ferreira Santos, E. Potential of basalt dust to improve soil fertility and crop nutrition. J. Agric. Food Res. 2022, 10, 100443. [Google Scholar] [CrossRef]
  52. Hinsinger, P.; Jaillard, B. Root-induced release of interlayer potassium and vermiculitisation of phlogopite as related to potassium depletion in the rhizosphere of ryegrass. Eur. J. Soil Sci. 1993, 44, 525–553. [Google Scholar] [CrossRef]
  53. Hervé, A.; Elghali, A.; Ouabid, M.; Raji, O.; Bodinier, J.-L.; El Messbahi, H. Alkali-Hydrothermal Treatment of K-Rich Igneous Rocks for Their Direct Use as Potassic Fertilizers. Minerals 2021, 11, 140. [Google Scholar] [CrossRef]
  54. Hervé, A.; Khiari, L.; Raji, O.; Elghali, A.; Lajili, A.; Ouabid, M.; Jemo, M.; Bodinier, J.-L. Potassium Fertilizer Value of Raw and Hydrothermally Treated Igneous Rocks. J. Soil Sci. Plant Nutr. 2023, 23, 1030–1045. [Google Scholar] [CrossRef] [PubMed]
  55. Barrow, N.J. The effects of pH on phosphate uptake from the soil. Plant Soil 2017, 410, 401–410. [Google Scholar] [CrossRef]
  56. Lewis, A.L.; Sarkar, B.; Wade, P.W.; Kemp, S.J.; Hodson, M.E.; Taylor, L.L.; Yeong, K.L.; Davies, K.; Nelson, P.N.; Bird, M.I.; et al. Effects of mineralogy, chemistry and physical properties of basalts on carbon capture potential and plant-nutrient element release via enhanced weathering. Appl. Geochem. 2021, 132, 105023. [Google Scholar] [CrossRef]
Figure 1. Influence of basalt treatments on final soil pH measurements, separated for site and plant treatments. Different letters by site and plant treatment indicate significant difference (Table 3).
Agronomy 15 01791 g001
Figure 2. Cumulative above ground plant dry matter along the experimental duration, based on successive cuts from Bordeaux and Harpenden soils. Error bars represent standard deviation.
Agronomy 15 01791 g002
Figure 3. Influence of basalt treatments on final soil exchangeable K and extractable P (Olsen-P) for unplanted and planted soils at both sites. Y-axis scales are different between both soils. Different letters by site and plant treatment indicate significant difference (Table 3).
Agronomy 15 01791 g003
Figure 4. Influence of basalt treatments on final soil extractable Zn and Ni, for unplanted and planted soils, on both sites. Y-axis scales are different between Bordeaux and Harpenden. Different letters by site and plant treatment indicate significant difference (Table 3).
Agronomy 15 01791 g004
Table 1. Chemical composition of topsoils and basalt dust (see M&M Section 2.4. for the methods used to characterise total and extractable species). eCEC: effective cation exchange capacity measured at the soil pH. <DL: below Detection Limit (Cu: 0.08 mg kg−1, Fe: 0.04 mg kg−1, Ni: 0.01 mg kg−1). Values in brackets stand for results comprised between determination and quantification limits.
UnitsSoilsBasalt Dust
BordeauxHarpenden
pH 5.795.538.79
CaCO3%0.0010.010.16
Ntot.%0.110.120.002
Corg.%2.181.370.19
eCECcmolc kg−15.79.25.9
Total elementsPmg kg−1168452952
Ca821138827,021
K15320361672
Mg143144611,411
Na541115070
Cu21845
Fe62722,88947,831
Mn111127419
Ni0.71726
Zn65468
Extractable elementsPmg kg−1315.50.7
Ca55010641832
K5210947
Mg744956
Na8.57.849
Cu<DL<DL<DL
Fe0.20.2<DL
Mn0.722.92.8
Ni(0.01–0.02)0.44<DL
Zn0.51.4(0.06–0.19)
Table 2. Comparison between the composition of the estimated “theoretical initial mix” and the measured composition of the Soil + Basalt mix, based on extractable elements measured three to four days after the mixing. Green cells indicate concentrations of the mix at least 5% higher than expected and vice versa with yellow cells. <DL: below Detection Limit (Cu: 0.08 mg kg−1, Fe: 0.04 mg kg−1, Ni: 0.01 mg kg−1).
Theoretical Initial MixMeasurement for Initial Mix
BordeauxHarpendenBordeauxHarpenden
80 t ha−1160 t ha−180 t ha−1160 t ha−180 t ha−1160 t ha−180 t ha−1160 t ha−1
Extractable elements (mg kg−1)P30.529.85.45.329.129.95.95.1
Ca5826141083110259262511691226
K52511071065251110108
Mg73.272.849.649.772.469.350.850.4
Na9.510.58.89.89.610.210.110.9
Cu<DL<DL<DL<DL
Fe0.200.200.200.200.220.220.23<DL
Mn0.750.8022.4321.930.921.0420.0317.25
Ni<DL<DL<DL0.290.20
Zn0.510.501.361.320.430.250.820.50
Table 3. Average concentrations of extractable nutrients at the end of the experiment for Bordeaux (a) and Harpenden (b) soils of all treatments. Extractable nutrients were determined with the Olsen P method and ammonium nitrate for all cations. Bold characters: significant for p < 0.05. Codes for p-values: p ≤ 0.05 = *, p ≤ 0.01 = **, p ≤ 0.001 = ***. Identical letters in a row and the same plant treatment indicate no significant difference. <DL: below Detection Limit (Cu: 0.08 mg kg−1, Fe: 0.04 mg kg−1, Ni: 0.01 mg kg−1). NA: Not Applicable.
a Bordeaux Soil UnplantedBordeaux Soil Planted
p Average Final Concentration pAverage Final Concentration
No Basalt 80 t ha−1160 t ha−1 No Basalt 80 t ha−1 160 t ha−1
Major elementsmg kg−1P**35.0 a30.0 b27.6 b**27.1 a25.5 ab22.4 b
Ca***613 a699 b744 b***553 a656 b709 b
KNS444741***5.85 a6.28 a8.73 b
MgNS758272*63.2 a69.5 b65.5 ab
NaNS8.512.412.2*2.24 a2.24 a3.89 b
Trace elementsmg kg−1CuNA<DLNA<DL
Fe*0.30 a0.25 ab0.23 bNS0.2140.2080.190
Mn*0.92 a0.60 b0.55 b***0.651 a0.419 b0.321 b
Zn***0.55 a0.31 b0.19 c**0.451 a0.254 b0.151 c
NiNA<DLNA<DL
b Harpenden Soil UnplantedHarpenden Soil Planted
pAverage final concentrationpAverage final concentration
No basalt80 t ha−1160 t ha−1No basalt80 t ha−1160 t ha−1
Major elementsmg kg−1PNS5.344.844.93NS4.514.404.48
Ca***1072 a1210 b1297 c***1136 a1239 b1308 c
K**105 a112 ab117 b**58.5 a62.0 ab68.9 b
Mg***46 a58 b61 c***47.3 a56.4 b60.1 b
NaNS283334NS41.145.946.0
Trace elementsmg kg−1CuNA<DLNA<DL
FeNA<DLNA<DL
Mn***26 a12 b7 b***30.0 a16.2 b10.4 c
Zn**2.71 a1.70 ab0.63 b***3.83 a1.67 b0.72 c
Ni**1.35 a0.47 b0.15 b***2.013 a0.553 b0.173 c
Table 4. Summary of p-values and average elements in plant concentrations (a) and uptake (b) for the two pot experiments. Bold characters: significant for p < 0.05. Codes for p-values: p ≤ 0.05 = *, p ≤ 0.01 = **, p ≤ 0.001 = ***. Identical letters in the cells of a row and the same soil indicate no significant difference.
a BordeauxHarpenden
pAverage ConcentrationpAverage Concentration
No Basalt80 t ha−1160 t ha−1No Basalt80 t ha−1160 t ha−1
Major elementsmg kg−1CaNS890093008200NS570059006400
K*19,300 a20,900 ab24,000 bNS35,50036,50036,500
Mg***4600 a4000 b3700 bNS200021002100
NaNS350042004300NS400400400
P***5340 a4670 b4180 bNS147014801310
Trace elementsmg kg−1Cu**7.86 a7.09 b7.04 bNS8.548.298.48
Fe**64.0 a74.7 b81.7 cNS59.359.678.1
Mn*84.7 a69.2 ab55.6 b**177 a133 b98 b
Ni*0.78 a0.91 ab0.95 b***3.26 a2.27 b1.89 c
ZnNS83.274.76.7***53.5 a50.0 a42.6 b
b BordeauxHarpenden
pAverage uptakepAverage uptake
No basalt80 t ha−1160 t ha−1No basalt80 t ha−1160 t ha−1
Major elementsmgCa**57 a76 b69 bNS303535
K***122 a169 b203 cNS187214200
MgNS303331NS111211
Na*22 a34 b37 bNS232
PNS343835NS7.787.07.2
Trace elementsmgCuNS0.050.060.06NS0.0450.0490.046
Fe***0.41 a0.61 b0.69 bNS0.3110.3490.421
Mn*0.53 a0.56 ab0.47 b*0.94 a0.78 a0.54 b
Ni**0.005 a0.007 b0.008 b*0.017 a0.013 ab0.01 b
Zn**0.52 a0.6 b0.65 b*0.28 a0.29 a0.23 b
Table 5. Nutrient use efficiencies for selected macro elements at both trial sites.
Nutrient Use Efficiency (%)
CaKMgP
Bordeaux 80 t ha−10.935.70.45.5
Bordeaux 160 t ha−10.330.20.10.9
Harpenden 80 t ha−10.326.40.21.7
Harpenden 160 t ha−10.26.20.1−0.5
Table 6. Estimated potassium (a) and phosphorus (b) budgets for the two pot experiments. All values are expressed in mg per pot. ‘released’ and ‘weathered’ refer to the basalt and the soil, respectively. Light grey lines contributed to calculate the dark grey ones.
a BordeauxHarpenden
No Basalt 80 t ha−1160 t ha−1No Basalt80 t ha−1160 t ha−1
All values are in mg per pot
Initial stateExchangeable K in soil mix169173174273282283
Exchangeable K in basalt03.87.502.95.9
Total K in soil mix344437601509652025395
Total K in basalt01342680105209
Final stateK uptake by plant122169203187214200
Exchangeable K in soil mix192130146159181
Plant uptake + exchangeable in soil141190232333373381
Apparent K released and weathered01758609298
(K released + weathered) / (tot K in soil mix)0%4%10%1%2%2%
b BordeauxHarpenden
No basalt80 t ha−1160 t ha−1No basalt80 t ha−1160 t ha−1
All values are in mg per pot
Initial stateExtractable P in soil mix10297102141513
Extractable P in basalt00.050.1100.040.08
Total P in soil mix547619676112912411222
Total P in basalt076152060119
Final stateP uptake by plant343835897
Extractable P in soil mix888576111112
Plant uptake + Extractable in soil122123111192019
Apparent P released or weathered202610556
(P released + weathered)/(tot P in soil mix)4%4%1%0.5%0.4%0.5%
Table 7. Summary of the significant influences of basalt in mineral elements in soil and plant compartments of the pot trials in Bordeaux (BDX) and Harpenden (Harp). Only significant effects (p-values < 0.05) are considered. Concerning the differences between theoretical and measured initial soil + basalt mixes, we arbitrarily chose a 5% difference threshold for significance. The colours represent beneficial (green), negative (red) or neutral (black) agricultural effects. Superiority (>) and inferiority (<) symbols for the three lines of the initial status describe the comparison between the contents of minerals in basalt and soil for their total or available pools (lines 1 and 2, respectively) and the difference between theoretical expected values in the mixes and real measurements of the available pools (line 3). The doubled symbols (‘<<’ and ‘>>’) describe at least a five-fold factor between the two values compared. For example, the total P in Bordeaux is 5.7 time more concentrated in the basalt dust than in the initial soil (lower left cell). Rising and descending arrows for the final status of characteristics stand for an increase and decrease with increasing basalt dose, respectively, while the equivalence symbol indicates the absence of a significant response to the basalt treatment. NA: Not Applicable; ≈: not significant.
PCaKMgNaCuFeMnNiZn
BdxHarpBdxHarpBdxHarpBdxHarpBdxHarpBdxHarpBdxHarpBdxHarpBdxHarpBdxHarp
Basalt VS Soil
Total elements
>>>>>>>>><>>>>>>>>>>>>>>>>><>>>>>>
Basalt VS Soil
Extractable elements
<<<>>><<>> NANA<<<<><< NA<<<<<<
Theoreticalmeasurement VS Initial measurement>NANA> NA>< NANA<<
Final soil concentration UnplantedNANANANA
Final soil concentration PlantedNANANANA
Plant Concentration
Plant uptake
Disclaimer/Publisher’s Note: The statements, opinions and data contained in all publications are solely those of the individual author(s) and contributor(s) and not of MDPI and/or the editor(s). MDPI and/or the editor(s) disclaim responsibility for any injury to people or property resulting from any ideas, methods, instructions or products referred to in the content.

