Article

MaizeStar-YOLO: Precise Detection and Localization of Seedling-Stage Maize

1
School of Computer and Information, Anqing Normal University, Anqing 246011, China
2
Anhui Province Key Laboratory of Smart Monitoring of Cultivated Land Quality and Soil Fertility Improvement, Anqing 246133, China
3
College of Mechanical and Electronic Engineering, Fujian Agriculture and Forestry University, Fuzhou 350002, China
4
Anhui Eagle Information Technology Co., Ltd., Anqing 246003, China
*
Authors to whom correspondence should be addressed.
Agronomy 2025, 15(8), 1788; https://doi.org/10.3390/agronomy15081788
Submission received: 24 June 2025 / Revised: 17 July 2025 / Accepted: 22 July 2025 / Published: 25 July 2025
(This article belongs to the Section Precision and Digital Agriculture)

Abstract

Efficient detection and localization of maize seedlings in complex field environments is essential for accurate plant segmentation and subsequent three-dimensional morphological reconstruction. To overcome the limited accuracy and high computational cost of existing models, we propose an enhanced architecture named MaizeStar-YOLO. The redesigned backbone integrates a novel C2F_StarsBlock to improve multi-scale feature fusion, while a PKIStage module is introduced to enhance feature representation under challenging field conditions. Evaluations on a diverse dataset of maize seedlings show that our model achieves a mean average precision (mAP) of 92.8%, surpassing the YOLOv8 baseline by 3.6 percentage points, while reducing computational complexity to 3.0 GFLOPs, representing a 63% decrease. This efficient and high-performing framework enables precise plant–background segmentation and robust three-dimensional feature extraction for morphological analysis. Additionally, it supports downstream applications such as pest and disease diagnosis and targeted agricultural interventions.

1. Introduction

Maize is a major global crop, serving as a primary source of human food, animal feed, and a vital industrial raw material [1]. It also makes a significant contribution to the global economy through its broad applications in agriculture, food production, and industrial sectors. These diverse uses underscore the strategic importance of maize beyond conventional agriculture. Therefore, comprehensive research into food production systems is essential, with a particular focus on the central role of maize [2]. Studying maize seedling growth is especially important for tackling the global food crisis and advancing the development of sustainable and clean energy solutions [3].
Accurate phenotyping and spatial localization of maize plants are critical for effective field management and crop breeding [4]. With recent advances in crop phenotyping technologies, plant detection methods have also achieved significant progress [5,6,7,8]. In this context, crop phenotypic parameters can be categorized into intrinsic physiological traits and extrinsic morphological traits, the latter of which are typically derived from 3D reconstructions [9,10]. In the realm of plant phenotyping and the development of 3D reconstruction–based analysis platforms, ElManawy et al. [11] introduced a specialized platform for complex plant 3D reconstruction. Their system leverages multi-view imagery and implements a unified evaluation metric to assess both reconstruction algorithms and overall platform performance. Feng et al. [12] proposed an innovative registration technique that fuses UAV-mounted LiDAR scans with ground-based LiDAR data, achieving superior alignment accuracy compared to existing approaches. On the imaging and data-processing front, Guo et al. [13] assessed the efficacy of combining UAV imagery with machine learning models to estimate maize plant height. Accurate plant detection enables complete segmentation of target regions, laying a solid foundation for plant reconstruction [14]. Moreover, detection technologies facilitate the rapid and precise localization of plants, which is essential for pest and disease monitoring and for the targeted application of agrochemicals. Early studies on plant detection primarily relied on hand-crafted features such as texture, color, and shape to distinguish crops from their backgrounds [15]. While traditional machine vision techniques could infer plant location and growth status to some extent, they often suffered from limited generalizability and high labor costs due to species diversity and intra-species variability. Recent developments in deep learning, particularly image-based detection models such as YOLO, have emerged as promising solutions, offering substantial improvements in both accuracy and efficiency [16,17,18].
Target detection algorithms are widely employed in image analysis to identify object categories and locations with high accuracy [19,20,21,22]. These algorithms are typically classified into two types: one-stage and two-stage detectors. One-stage methods, such as YOLO (You Only Look Once) and SSD (Single-Shot Multibox Detector), use a single convolutional neural network (CNN) to simultaneously predict object categories and bounding box coordinates, streamlining the detection process [23]. In contrast, two-stage approaches—such as R-CNN, Fast R-CNN, and Faster R-CNN—first generate region proposals, followed by separate stages for classification and bounding box regression [24,25,26,27]. The one-stage detection paradigm was pioneered by YOLOv1, introduced by Joseph Redmon in 2016 [28]. Since then, the YOLO series has undergone continuous evolution. YOLOv2 and YOLOv3 improved multi-scale feature fusion and incorporated residual connections [29,30]. YOLOv4 further enhanced performance by integrating multiple optimization strategies [31], while YOLOv5 improved detection accuracy and deployment efficiency within the PyTorch framework [32]. Subsequent versions such as YOLOv6 [33] and YOLOv7 [34] emphasized lightweight architectures and speed optimization. YOLOv8, released by Ultralytics in 2023, introduced multi-task learning and demonstrated superior performance in small-object detection, providing a strong foundation for this study [35]. The core idea of YOLO is to formulate object detection as a single regression problem. The input image is divided into an S×S grid, with each cell responsible for detecting objects using predefined anchor boxes. This approach has led to widespread adoption of YOLO-based models in agricultural applications. For instance, Liu et al. [36] enhanced the YOLOv5 model by incorporating a multi-head attention mechanism, enabling real-time detection of maize kernel damage and mold with significantly improved performance. Similarly, Guan et al. [37] proposed an optimized DBi-YOLOv8 model for the precise, non-destructive, and rapid detection of maize canopy organs, such as crown leaves, ears, and tassels, as well as for tassel branch enumeration. These improvements offer robust technical support for quantitative trait analysis, crop growth monitoring, and elite variety selection.
To address the challenges of maize seedling positioning and identification in complex farmland environments, researchers have developed a range of technical solutions aimed at improving fertilization accuracy and streamlining field management. For example, Li et al. [38] proposed an optimized sprinkler irrigation system based on root coordinate positioning, integrating machine vision with maize growth characteristics. Liu et al. [39] employed UAV-based RGB imagery to develop three models—corner detection (C), linear regression (L), and deep learning (D)—enabling high-throughput, automated maize seedling counting under field conditions. Yang et al. [40] introduced a UAV-based weed segmentation approach (TS) that leverages shape features and skeleton-based threshold clustering. This method effectively removes weed interference, achieves 99.2% segmentation accuracy for maize seedlings, and significantly enhances counting robustness in complex field environments. By combining multi-scale positioning with intelligent recognition technologies, these methods collectively establish a comprehensive technical framework that improves fertilizer utilization efficiency, conserves agricultural resources, and provides theoretical support for precision operations in smart farming. To further improve the accuracy and robustness of detection models within this framework—particularly under conditions involving variable object scales and complex visual backgrounds—we propose the integration of two advanced modules inspired by recent developments in computer vision. The first, C2F_StarsBlock, utilizes high-dimensional nonlinear feature mapping via star operations, as introduced by Ma et al. [41]. The second, PKIStage, is designed for robust multi-scale feature extraction and contextual modeling, as presented by Cai et al. [42]. The combination of these two modules significantly enhances the model’s capability to handle complex visual scenarios and capture both fine-grained details and large-scale structural features.
In summary, the YOLO-based maize detection framework proposed in this study effectively integrates deep learning techniques with traditional agricultural practices, offering a new paradigm for improving maize productivity under complex field conditions. (1) The MaizeStar-YOLO model incorporates two advanced modules—C2F_StarsBlock and PKIStage—to enhance feature representation, capture multi-scale texture information, and reduce computational redundancy. These improvements significantly boost recognition accuracy and model performance in challenging agricultural environments. (2) By enabling precise detection and localization of maize seedlings, the method facilitates early pest and disease diagnosis, supports targeted pesticide application, and enables comprehensive crop phenotyping, thereby advancing intelligent and precision-driven maize cultivation [43]. (3) The model also enables accurate background segmentation and three-dimensional feature extraction, providing robust data support for the acquisition of phenotypic parameters [44]. Overall, this study presents a reliable, efficient, and scalable technical framework for intelligent maize production management in real-world farmland environments.

2. Materials and Methods

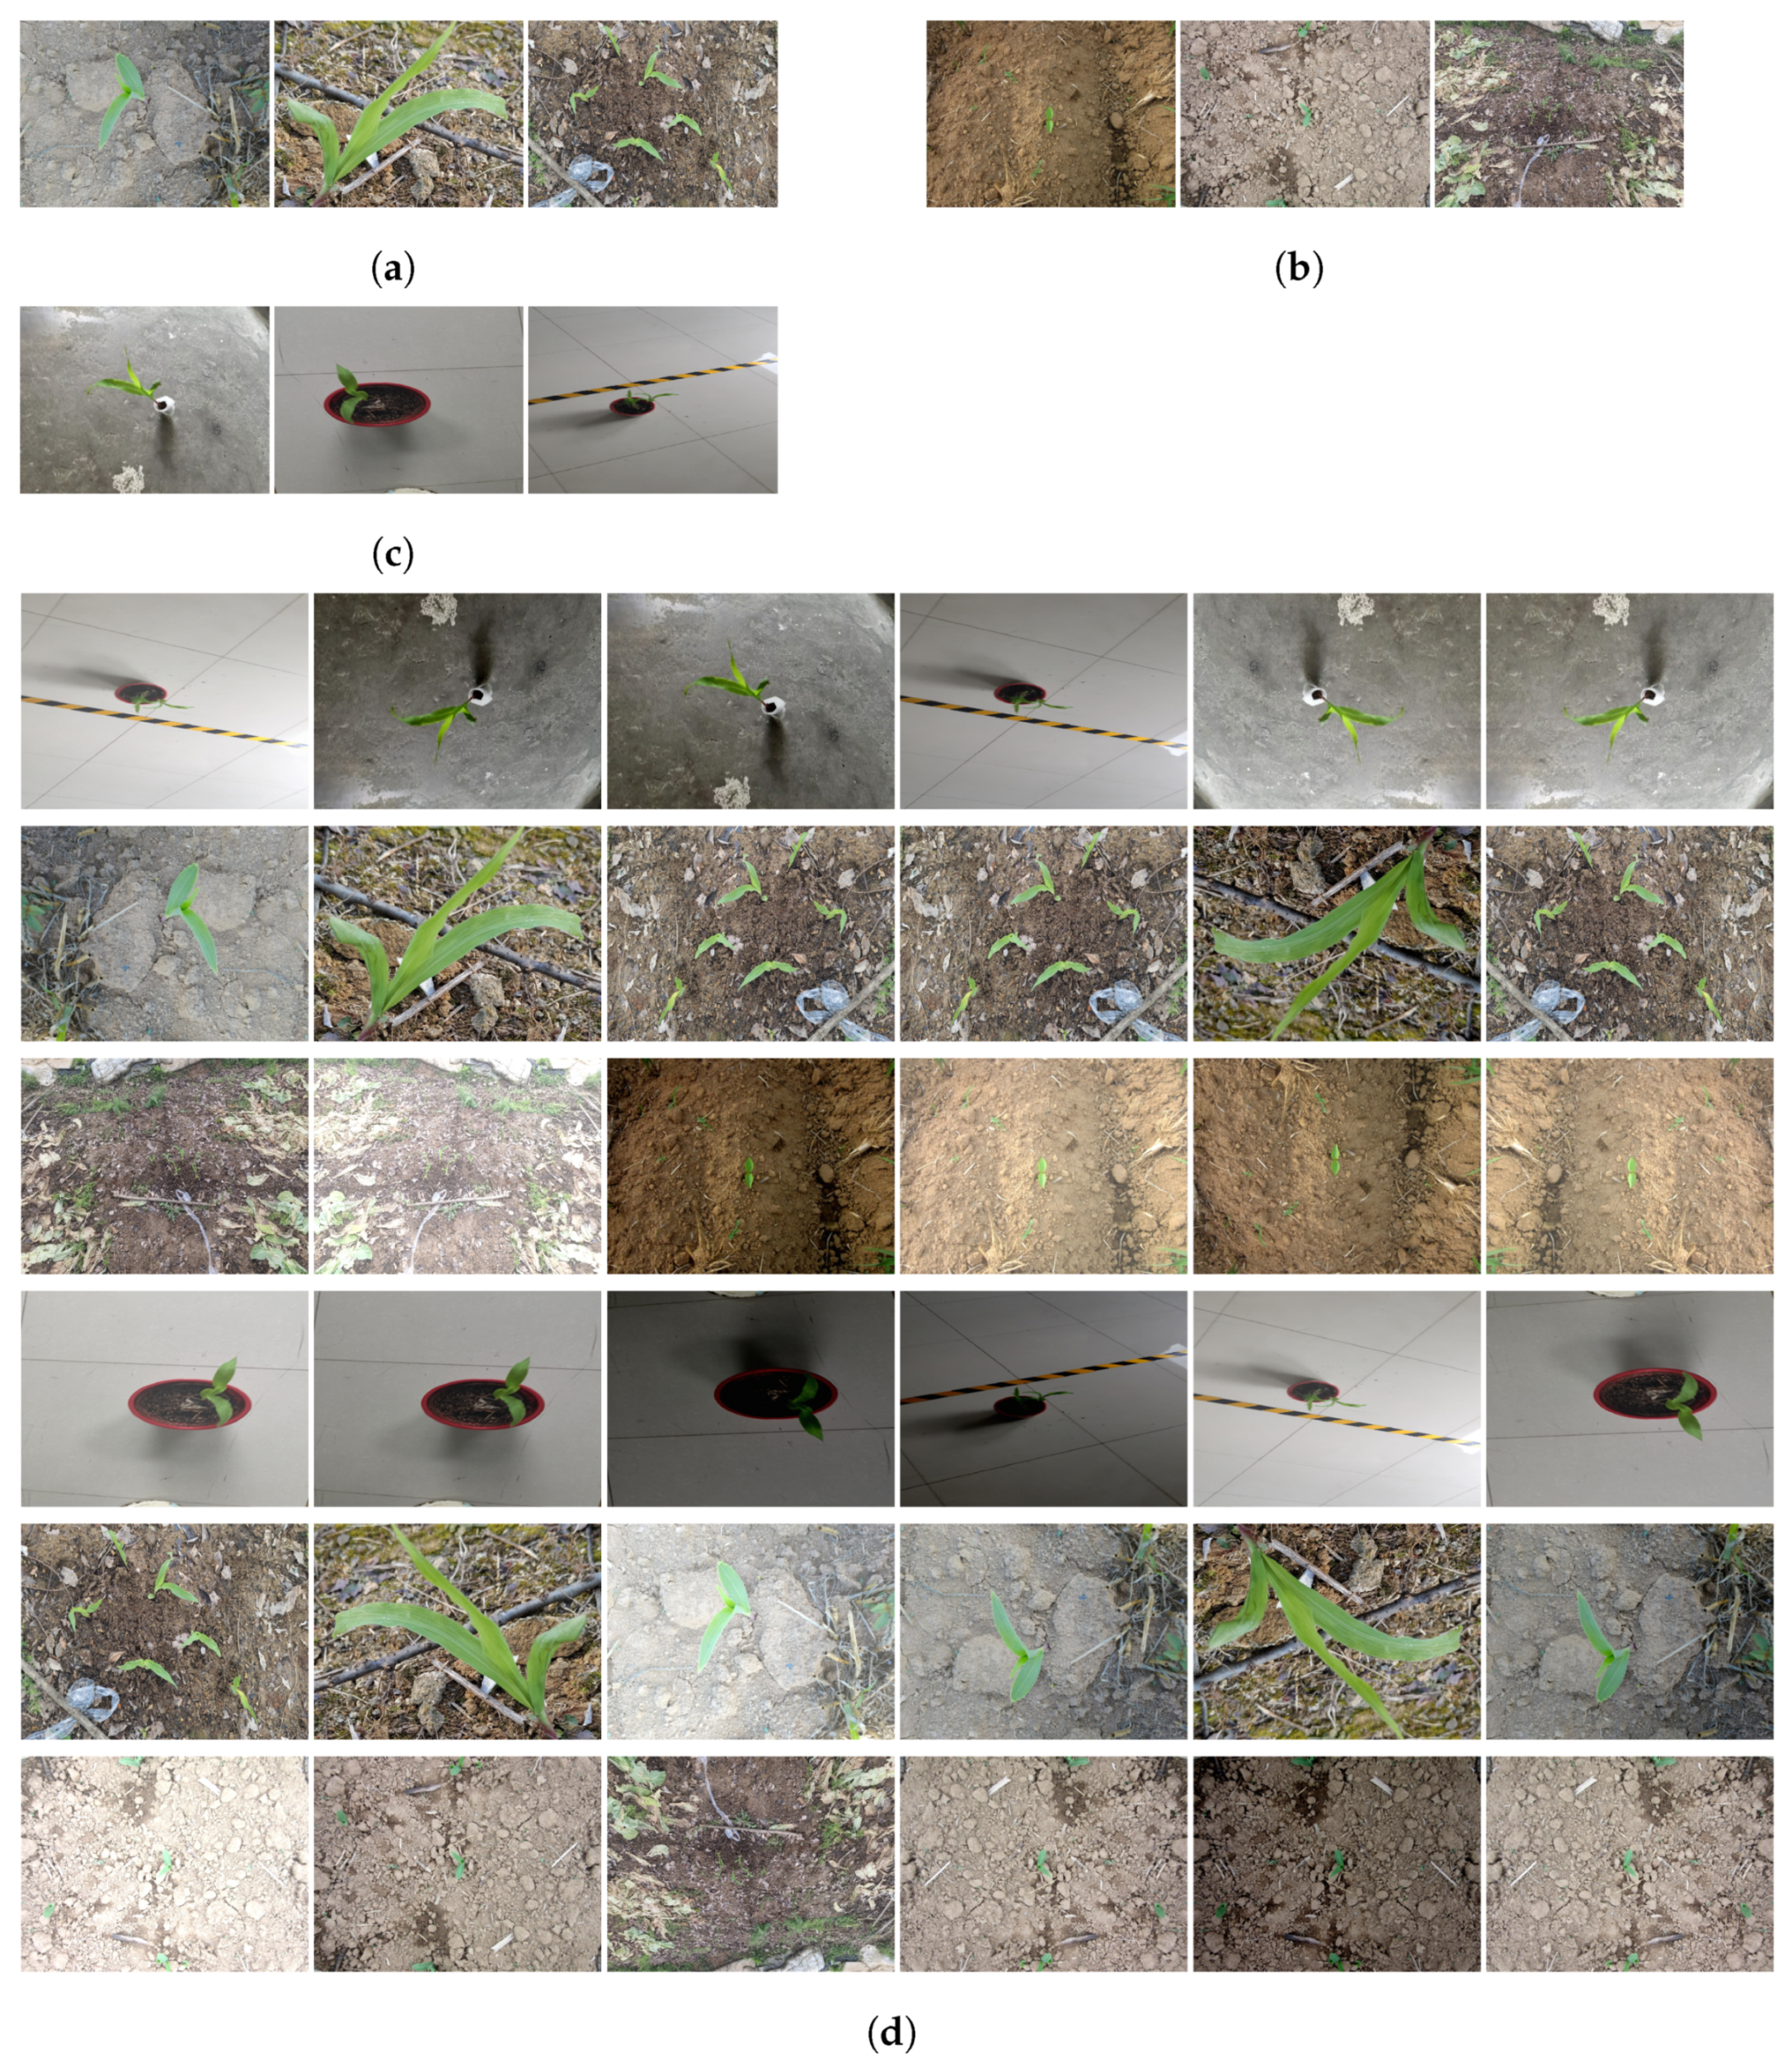
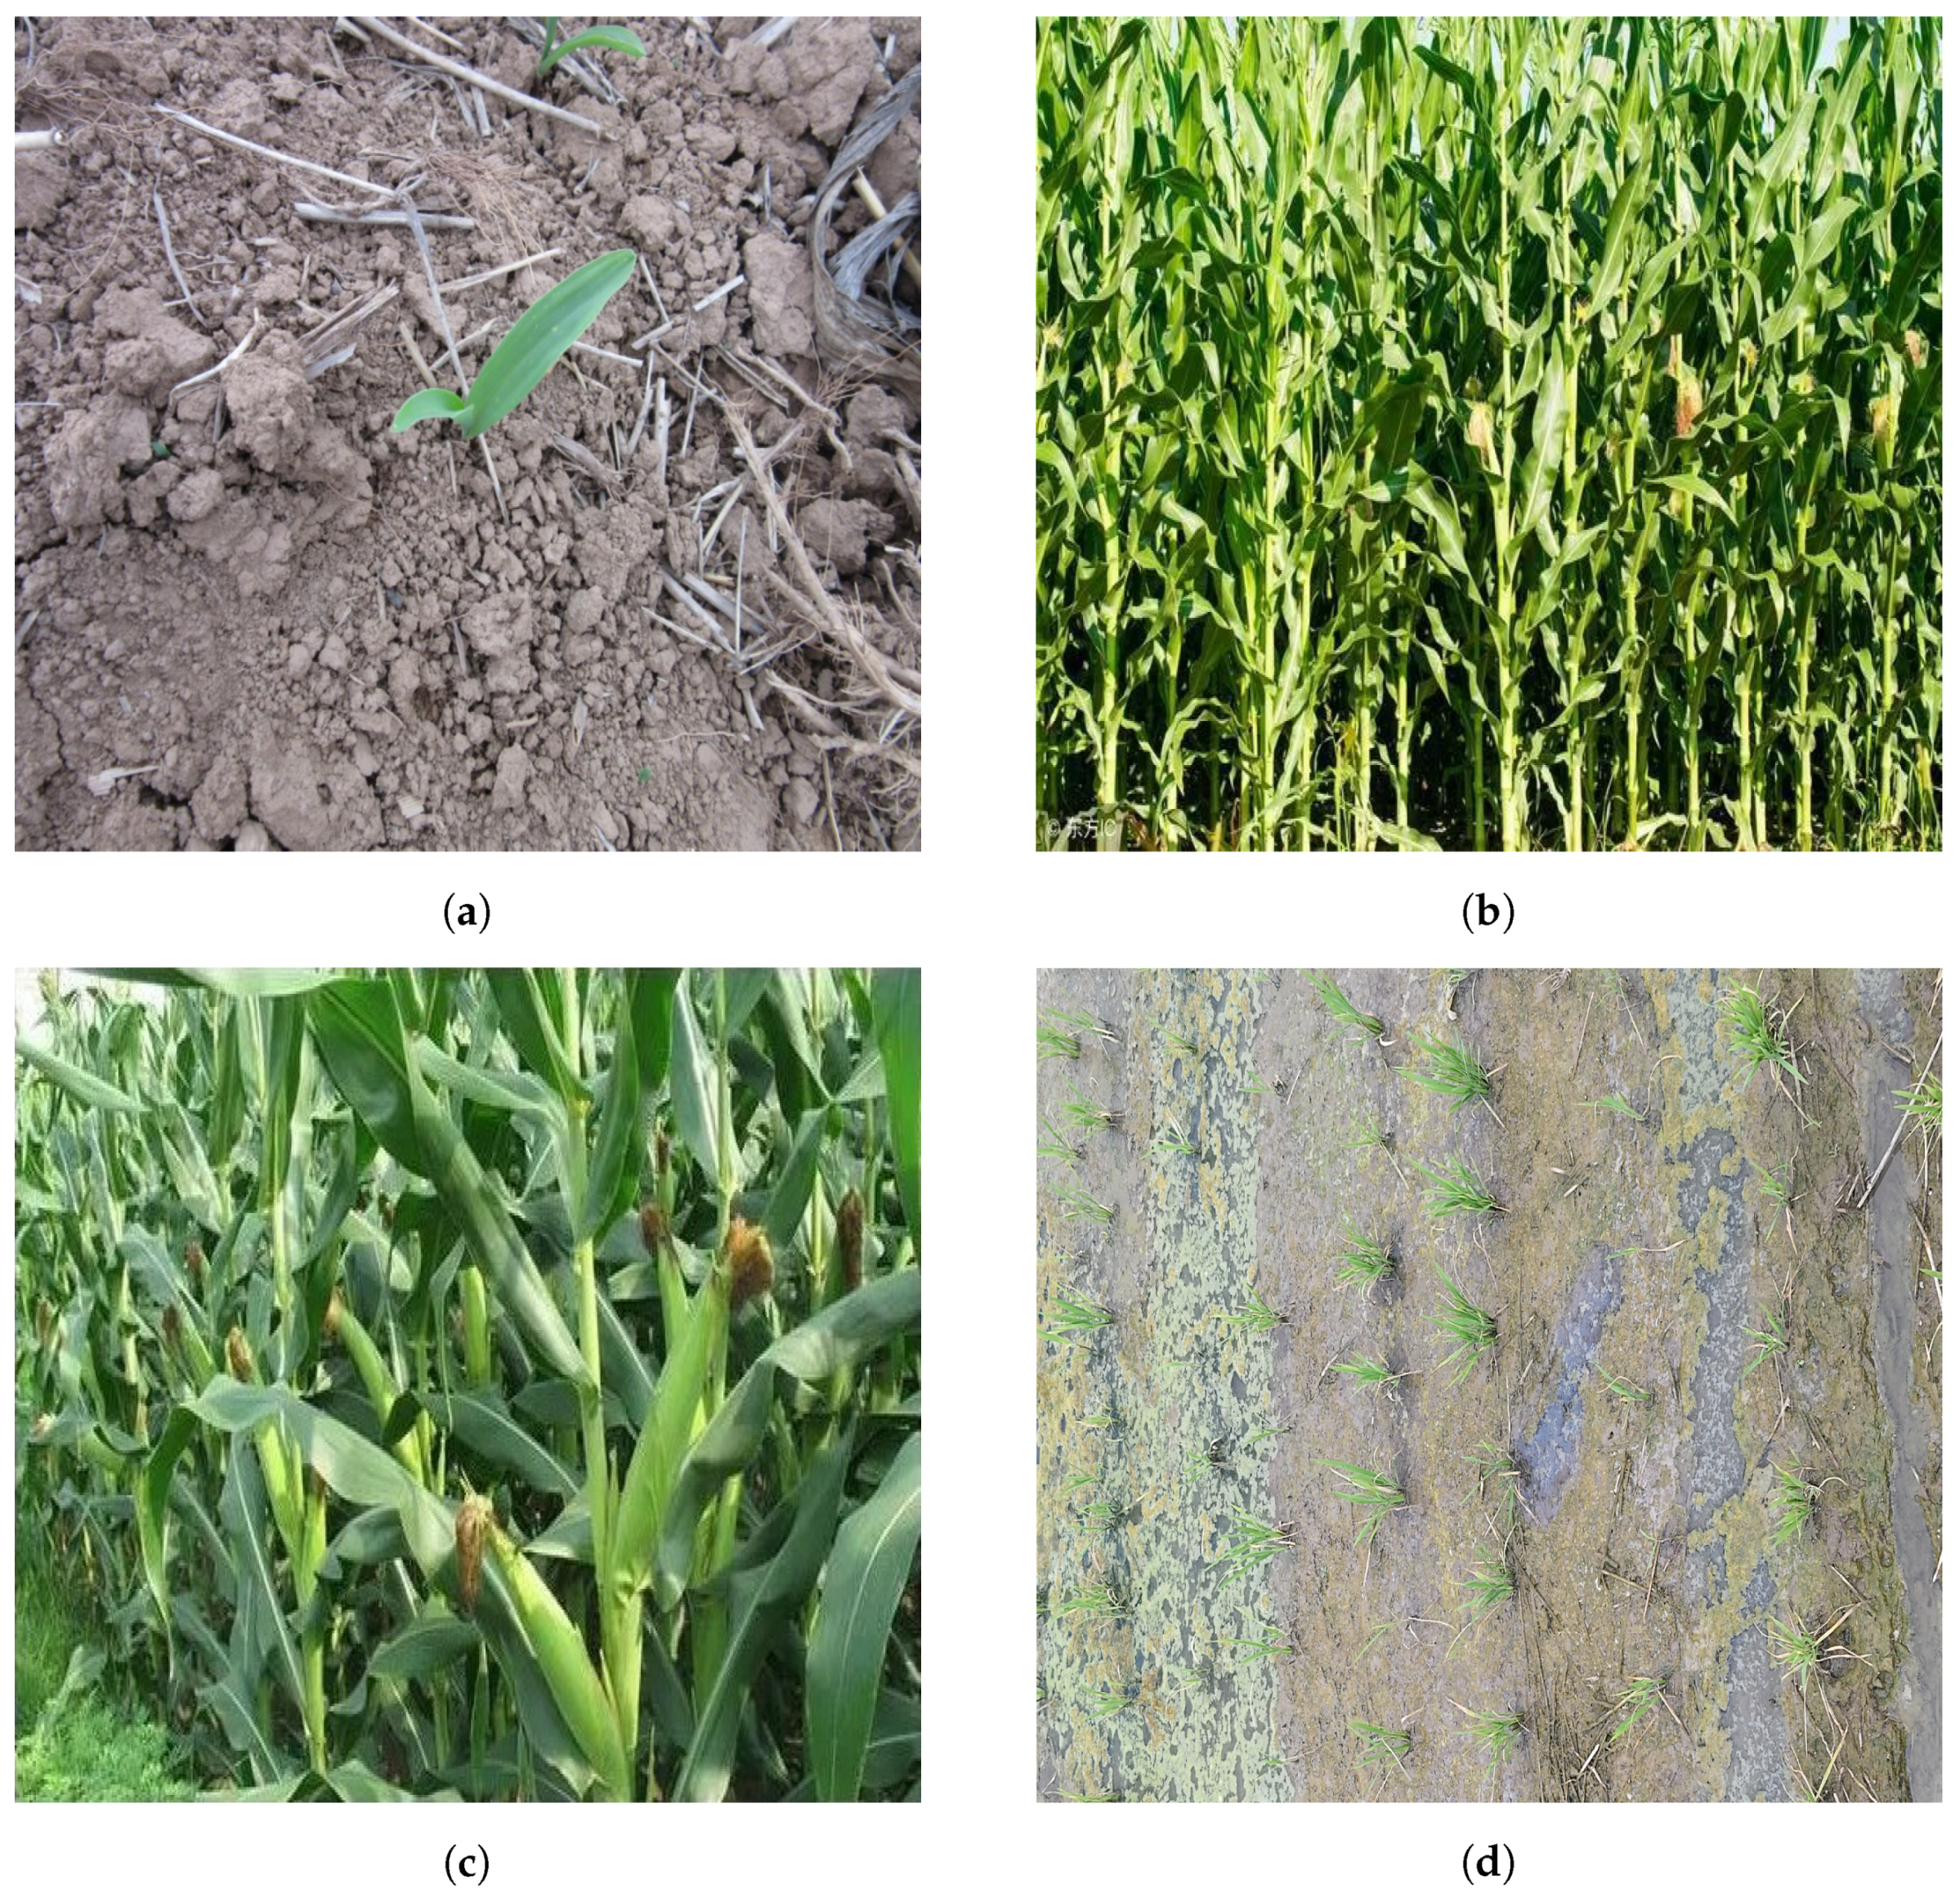
2.1. Image Acquisition and Data Construction

The seedling-stage maize planting experiment was conducted at Juwang Farm, located in Daguang District, Anqing City, Anhui Province, China (30°28′ N, 116°52′ E), with image data collected in August 2024. The subjects of this study were maize plants at the V2 to V6 growth stages, corresponding to critical management periods in the seedling phase, such as weed control, growth regulation, and nutrient supplementation. Images were captured using an iQOO Neo8 smartphone (ViVO Communication Technology Co., Ltd., Dongguan, Guangdong, China), equipped with a 50 MP main camera and a V1+ imaging chip. The camera was operated in automatic mode, and the image resolution was set to 3840 × 2160 pixels. The experimental design sought to balance environmental control with real-world applicability. In indoor trials, temperature and relative humidity (RH) were maintained within ±2 °C and ±5%, respectively, to ensure consistency in data quality. For outdoor data collection, the emphasis was placed on evaluating the model’s performance under complex weather conditions, including cloudy and rainy environments, and on mitigating point cloud noise induced by such conditions.

2.2. Image Preprocessing

2.2.1. Data Annotation and Standardization

Maize seedling images were annotated using the LabelImg tool, with all annotations saved in XML format according to the PASCAL VOC standard. To ensure the high quality and accuracy of the annotation data, a set of strict annotation guidelines was implemented. Specifically, the intersection over union (IoU) between the bounding box and the actual plant region was required to exceed 0.9, and the allowable manual verification error was limited to within 2%. To reduce background interference in both indoor and outdoor images—including close-range and distant views—contrast enhancement was applied. This preprocessing step improved the visual distinction between maize seedlings and their backgrounds. All processed images were uniformly saved in JPEG format for downstream analysis.

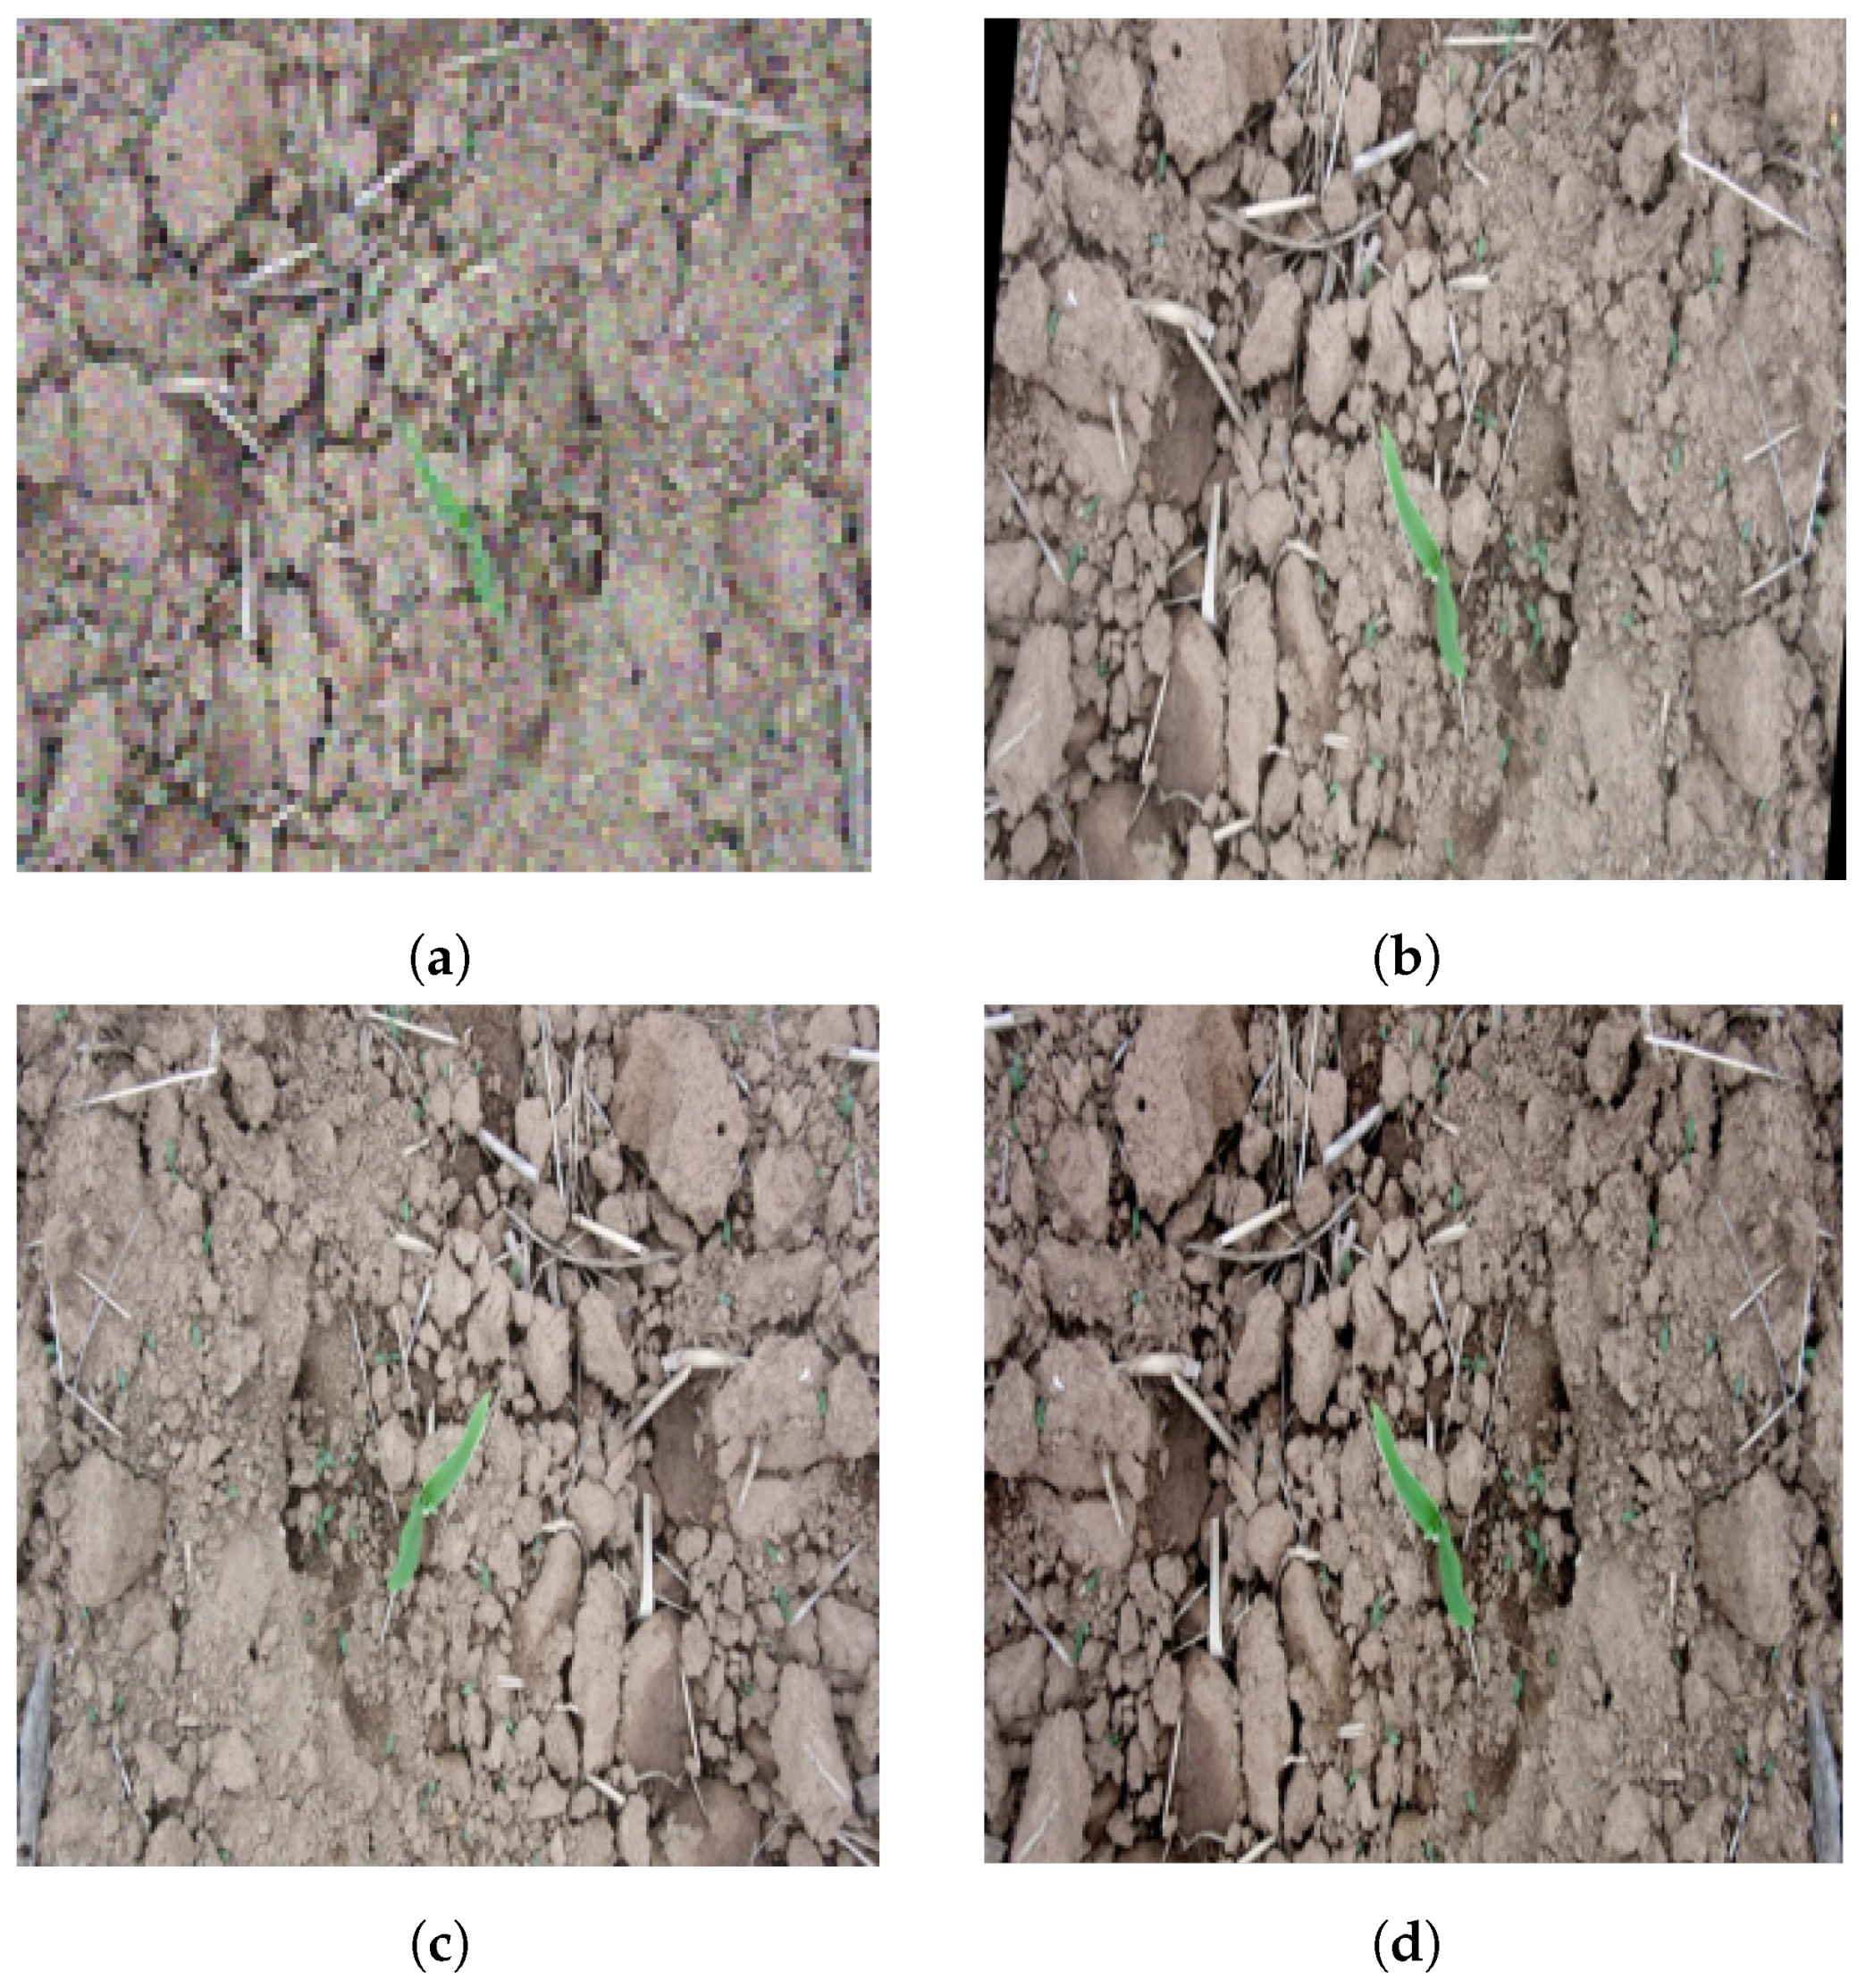
2.2.2. Data Augmentation

To improve the model’s generalization capability and reduce the risk of overfitting, a variety of data augmentation techniques were applied to the original dataset. Specifically, Gaussian noise was added, and transformations such as random rotations (±10°, ±15°, ±30°), horizontal flipping, and brightness adjustments were employed. These augmentation strategies were designed to enhance the model’s robustness against image noise, orientation variability, and lighting fluctuations, thereby improving its adaptability to real-world field conditions.
Representative examples of the data augmentation techniques used in this study are shown in Figure 1.

2.2.3. Dataset Partitioning

A total of 1487 maize seedling images were systematically partitioned into training, validation, and test sets using a 7:2:1 ratio, resulting in 1039 images for training, 298 for validation, and 150 for testing. To further expand the training data and enhance model generalization, the training set was augmented to 3500 images through the application of data augmentation techniques described previously. The specific composition of the augmented training images is illustrated in Figure 2.

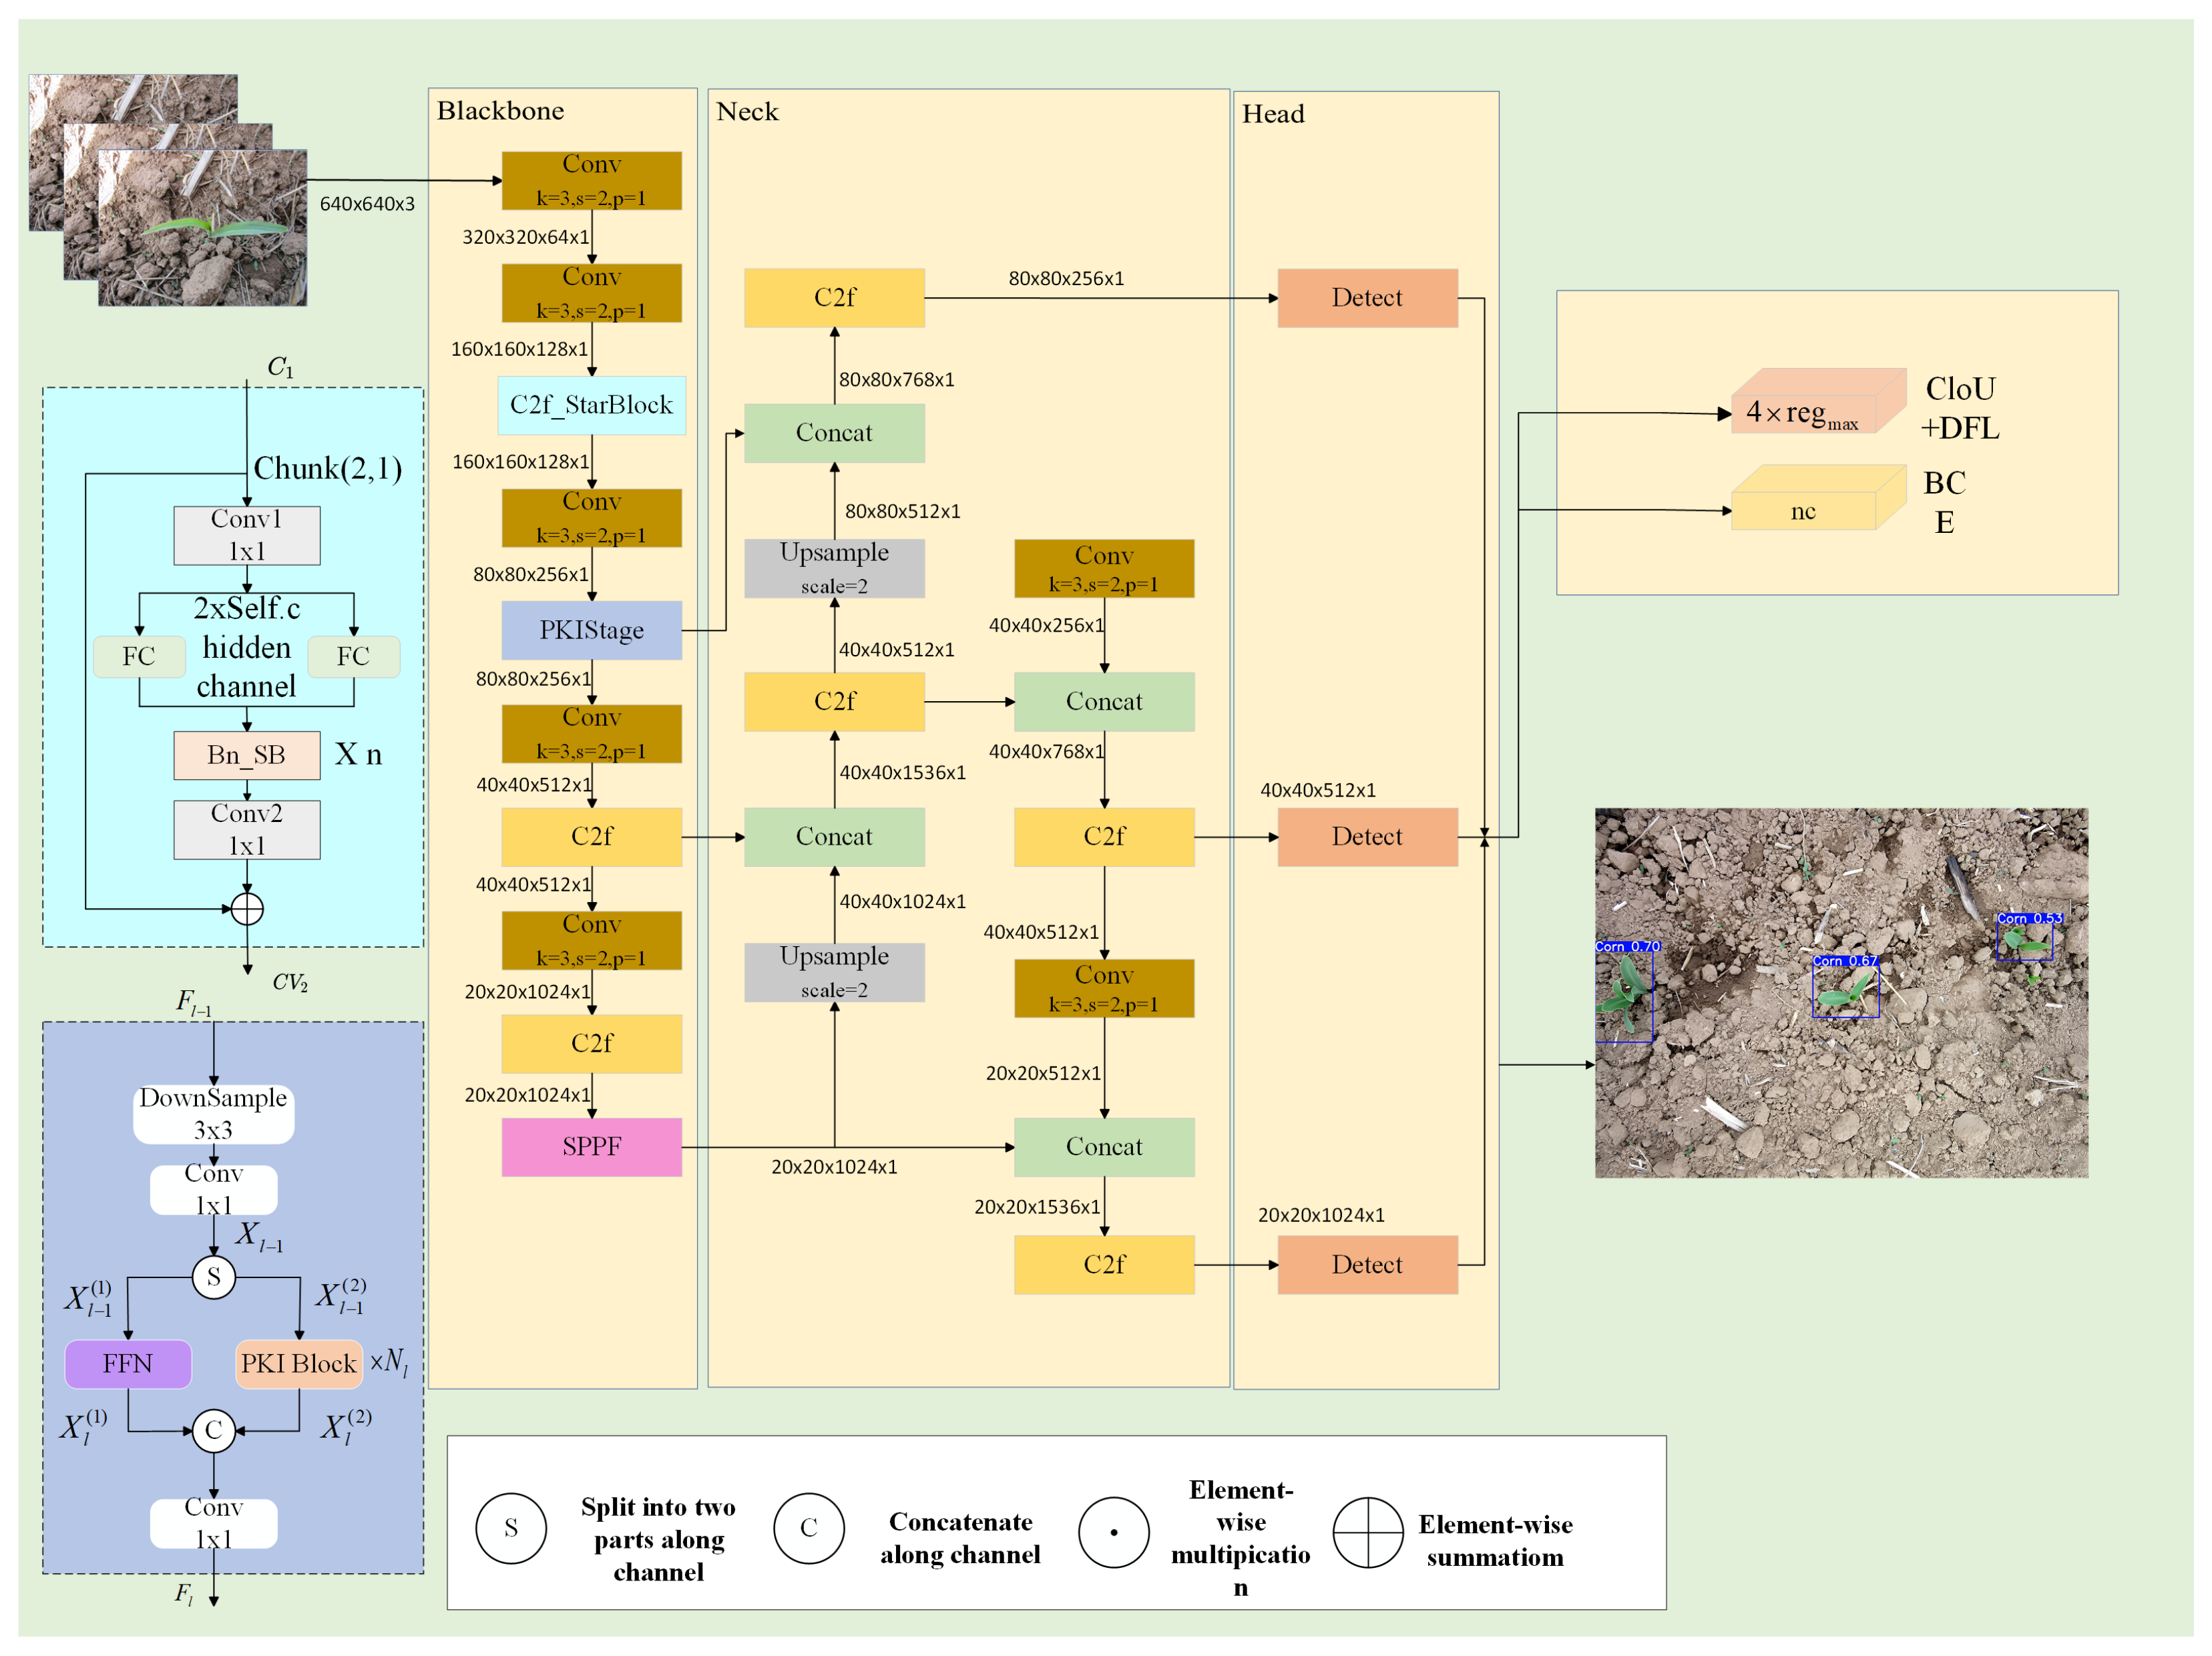
2.3. The Improved YOLOv8 Model

This study is based on the YOLOv8n architecture and introduces an enhanced model, termed MaizeStar-YOLO, for the precise detection and localization of maize seedlings. To overcome the limited feature extraction capacity of the original backbone network, two novel modules were designed and integrated: the C2F_StarsBlock, inspired by the star-shaped topology of StarNet, and the PKIStage module, derived from the cross-scale interaction mechanism of PKInet.
The specific improvement scheme is illustrated in Figure 3. First, a star-shaped topology is introduced into the initial C2f layer to establish bidirectional radiating paths for feature propagation. This modification forms the C2F_StarsBlock, which replaces the original module. It significantly enhances cross-channel information interaction in the shallow network, thereby improving texture representation and edge localization accuracy. Second, in a subsequent C2f layer, the original structure is replaced with the PKIStage module, which incorporates a cross-scale interaction mechanism and dynamic weight allocation. This module is specifically designed to optimize multi-scale feature fusion through adaptive adjustment of the feature pyramid, improving the network’s capacity to capture spatially diverse information. Together, these two modules operate synergistically within the backbone network, enhancing the model’s detection accuracy and robustness under complex field conditions.

2.3.1. C2F_StarsBlock Module—Coarse-to-Fine Feature Fusion Module

This study introduces a hierarchical feature fusion architecture designed to build an efficient recognition framework through a progressive, coarse-to-fine approach. The proposed C2F_StarsBlock comprises four key components: (1) a base convolutional layer for initial feature extraction; (2) a dual-branch feature interaction structure to enhance channel-wise and spatial information exchange; (3) an iterative optimization module to refine intermediate features; and (4) a cross-layer residual fusion mechanism that strengthens multi-level feature integration.
This study incorporates the StarNet architecture proposed by Ma et al. [41] at CVPR 2024, and adopts the corresponding C2F_StarsBlock module, as illustrated in Figure 4. The figure presents the architectural design of the neural module, which integrates residual connections and facilitates progressive feature processing and fusion through hierarchical collaboration among its internal components.
The C2F_StarsBlock module differs from standard C2f layers primarily through its enhanced feature interaction mechanisms. While standard C2f layers rely on basic channel splitting followed by convolutional operations, the C2F_StarsBlock adopts a more sophisticated strategy by integrating depthwise separable convolutions and element-wise multiplication operations. Specifically, after the Chunk(2,1) operation, the resulting feature maps are processed through two parallel branches. The first branch applies depthwise convolutions (dwconv) to capture spatial information, while the second branch utilizes fully connected (FC) layers to perform linear transformations in the channel dimension. The outputs of the two branches are then fused via element-wise multiplication, and subsequently passed through additional convolutional layers for refinement. By incorporating these operations, the C2F_StarsBlock is able to capture richer spatial and channel-wise feature interactions, thereby improving feature learning capacity. In contrast, standard C2f layers only perform basic convolution and concatenation operations, lacking the advanced interaction mechanisms introduced in C2F_StarsBlock.
According to the architectural design and data flow, the input feature map C1 first undergoes a Chunk(2,1) operation, which splits the input into two parts. One part is then passed through the Conv1 layer for initial feature extraction and transformation. The output is subsequently divided into two parallel branches, each processed by two fully connected (FC) layers configured with a 2 × self.c channel structure to perform linear transformations. The outputs from both branches are then fused and passed into the C2F_StarsBlock, which captures more complex feature interactions and facilitates deeper feature learning before advancing to the next stage of the network.
The output features from the C2F_StarsBlock are passed through the Bn_SB module group (Bottleneck_StarsBlock), which consists of N repeated units. Each unit performs feature normalization and nonlinear transformation through batch normalization, while interacting with embedded StarsBlock sub-modules to further enhance feature representation. The processed features are then forwarded to the Conv2 layer for secondary feature extraction and spatial information integration. Finally, a residual connection is applied by performing element-wise addition between the original input C1 and the features obtained from the multi-stage processing, producing the final output feature map CV2.

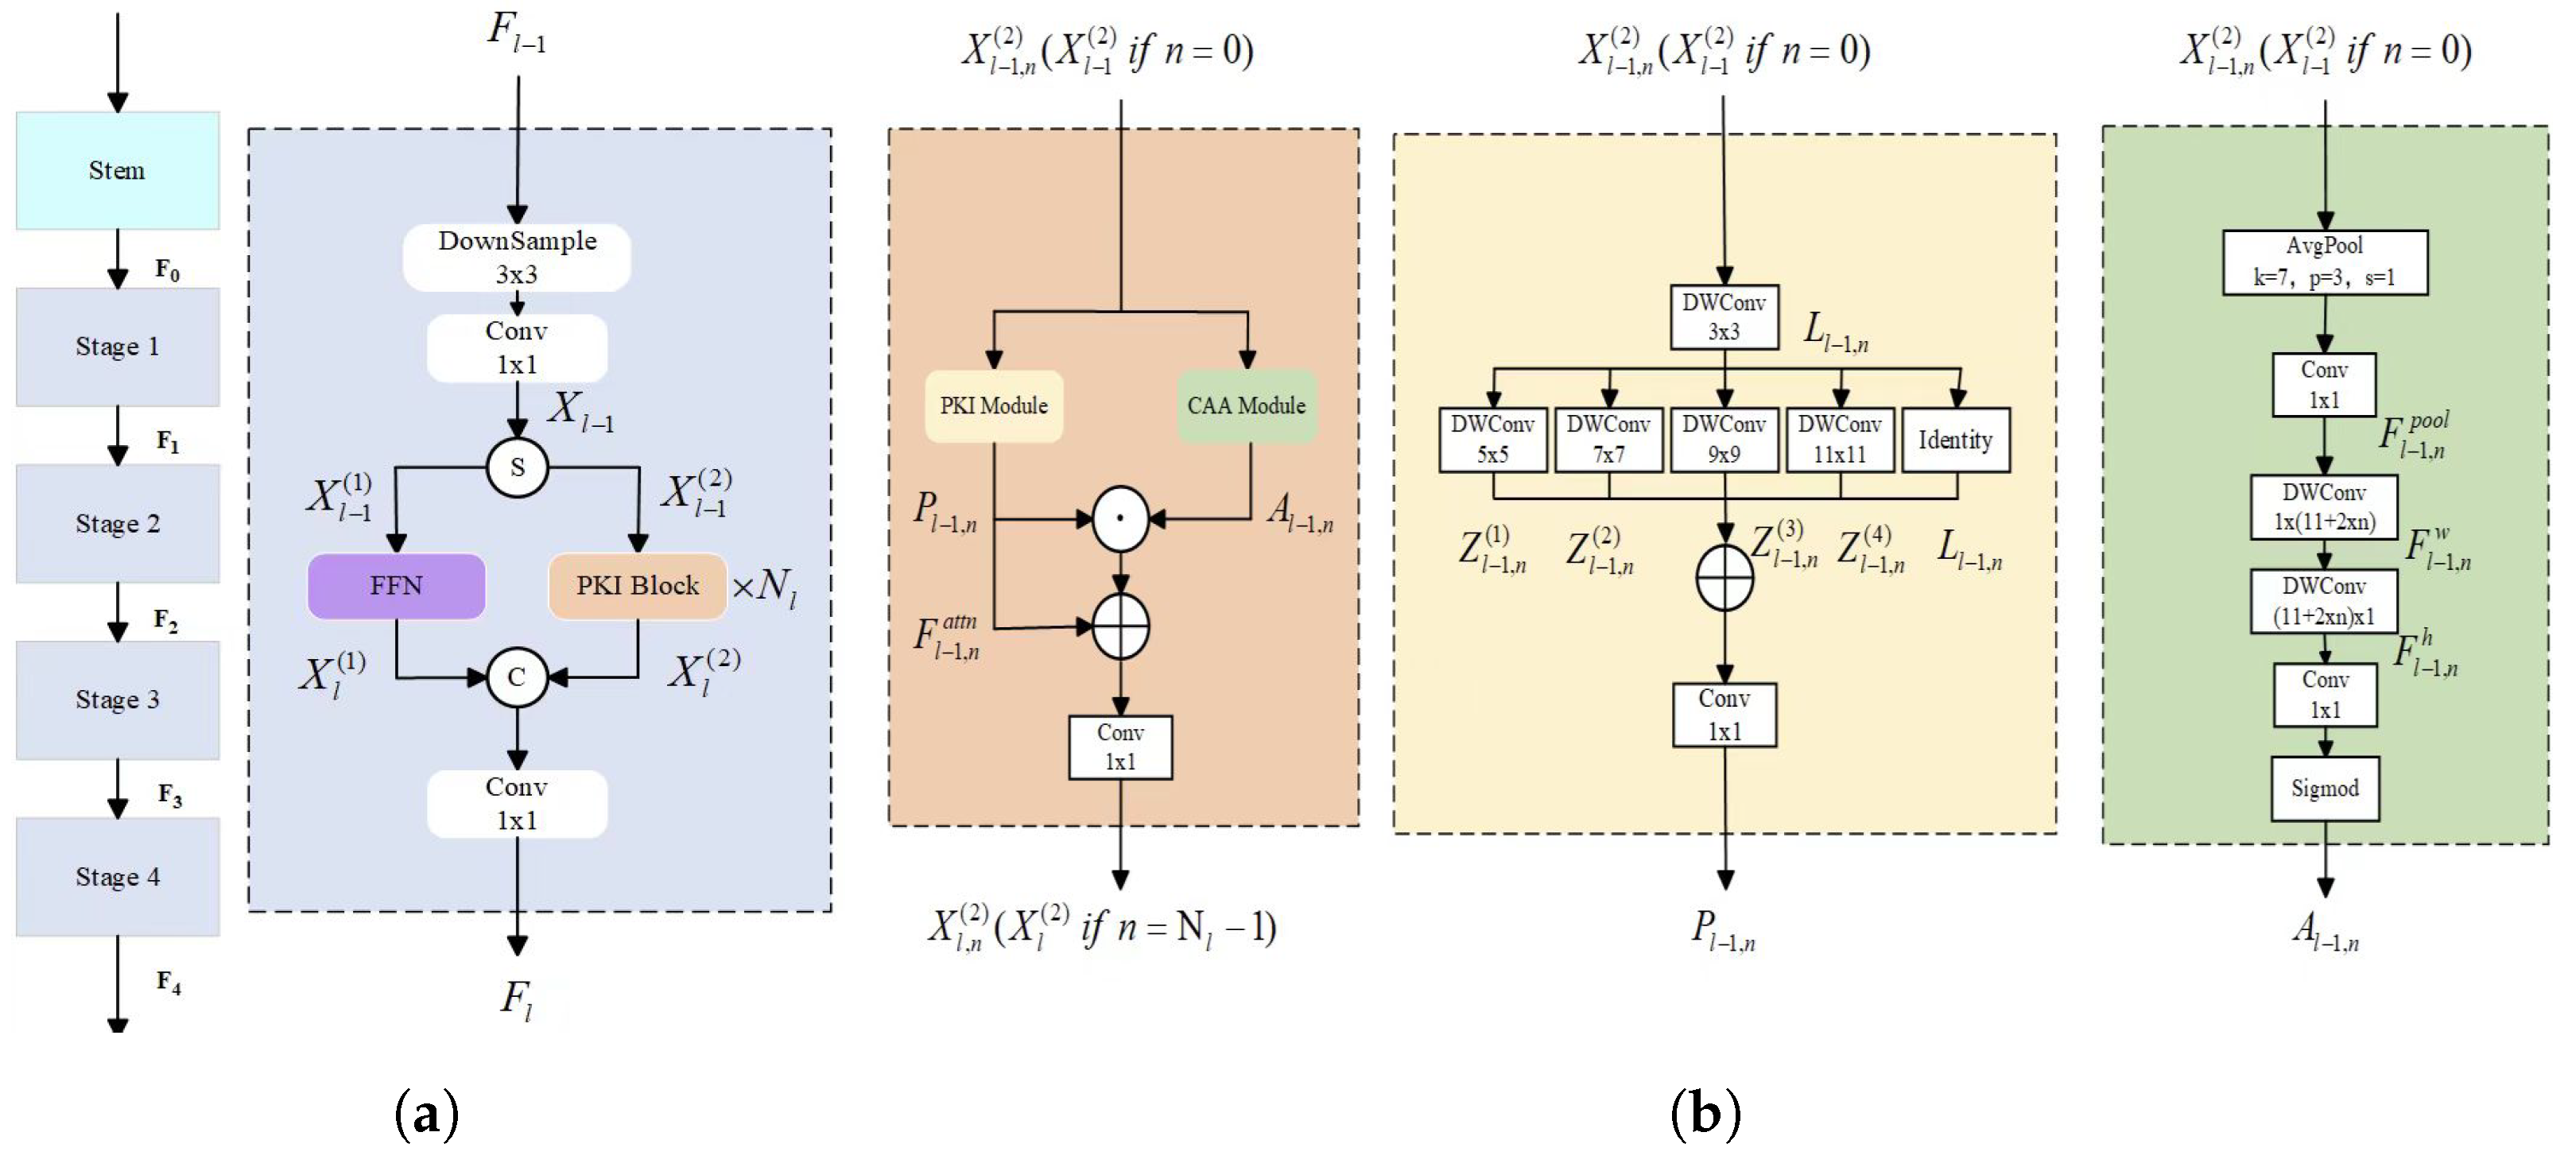
2.3.2. PKIStage Module—Pyramid Kernel Interaction Module

In maize target detection tasks, image data collected from real-world field environments present several technical challenges. First, variations in illumination and deviations in camera angles often lead to unstable target features, reducing detection reliability. Second, low-resolution imaging frequently results in the loss of fine-grained details, especially in small or partially occluded plant structures. Moreover, complex background interference—such as overlapping vegetation, exposed soil, and non-crop elements—further complicates accurate feature extraction. To address these challenges, this study replaces the second C2f module in the YOLOv8 backbone with the proposed PKIStage module. This modification is designed to improve both the recognition accuracy and detection robustness of the model when applied to complex maize field scenarios.
The PKIStage module adopts a three-stage processing pipeline: (1) preprocessing, (2) dual-branch collaborative processing, and (3) multimodal feature fusion. This architecture implements a hierarchical and progressive processing mechanism for effective multi-scale feature extraction, enabling the suppression of noise interference from complex field backgrounds. Leveraging the feature complementarity of the dual-branch design, the module integrates enhancements across both spatial and semantic dimensions through adaptive fusion strategies, thereby constructing a hierarchical feature enhancement system that improves both representation quality and robustness.
As illustrated in Figure 5, the PKIStage module operates as follows: The input feature map F l 1 first undergoes local information aggregation via a DownSample operation, followed by basic feature extraction through the Conv1 layer to generate intermediate features X l 1 . Next, X l 1 is split into two branches via the S-node. One branch performs feature transformation and integration using a feed-forward network (FFN), while the other enhances multi-scale and interference-resistant feature extraction through N 1 iterations of the PKI Block (PB) module. The resulting branch outputs, x 1 and x 2 , are then fused via the C-node, and further refined by a second convolutional layer (Conv2), producing the final output feature map F 1 .

3. Results

3.1. Training Environment and Evaluation System

All experiments were conducted on a Linux-based system using the PyTorch 1.7.0 deep learning framework. The hardware configuration included an Intel Xeon Platinum 8352V processor (2.10 GHz), 24 GB RAM, and an NVIDIA GeForce RTX 4090 GPU with CUDA support. Computational acceleration was enabled via the cuDNN (CUDA Deep Neural Network) library. The hyperparameter settings used in the experiments are summarized in Table 1.
This experiment adopts precision (P), recall (R), and mean average precision (mAP) as evaluation metrics to quantitatively assess the detection performance of the model. Based on these metrics, the performance of the proposed improved YOLOv8 model is compared against several baseline models. The evaluation formulas are defined as follows:
Precision = T P T P + F P
Recall = T P T P + F N
mAP = 1 N i = 1 N 0 1 P ( R ) d R
In these equations, TP (true positive) refers to the number of maize seedlings correctly detected. FP (false positive) denotes the number of background objects incorrectly identified as maize seedlings. FN (false negative) indicates the number of maize seedlings missed by the detection model. TP (true positive) refers to the number of maize seedlings correctly detected. FP (false positive) denotes the number of background objects incorrectly identified as maize seedlings. FN (false negative) indicates the number of maize seedlings that were missed by the detection model.
In these formulas, the variable n denotes the total number of maize seedlings detected by the model. AP (average precision) refers to the area under the precision–recall (P–R) curve. mAP (mean average precision) is defined as the mean AP across all object classes in the test dataset. The variable N represents the total number of object classes. Since this experiment focuses solely on the maize seedling category, N is set to 1.

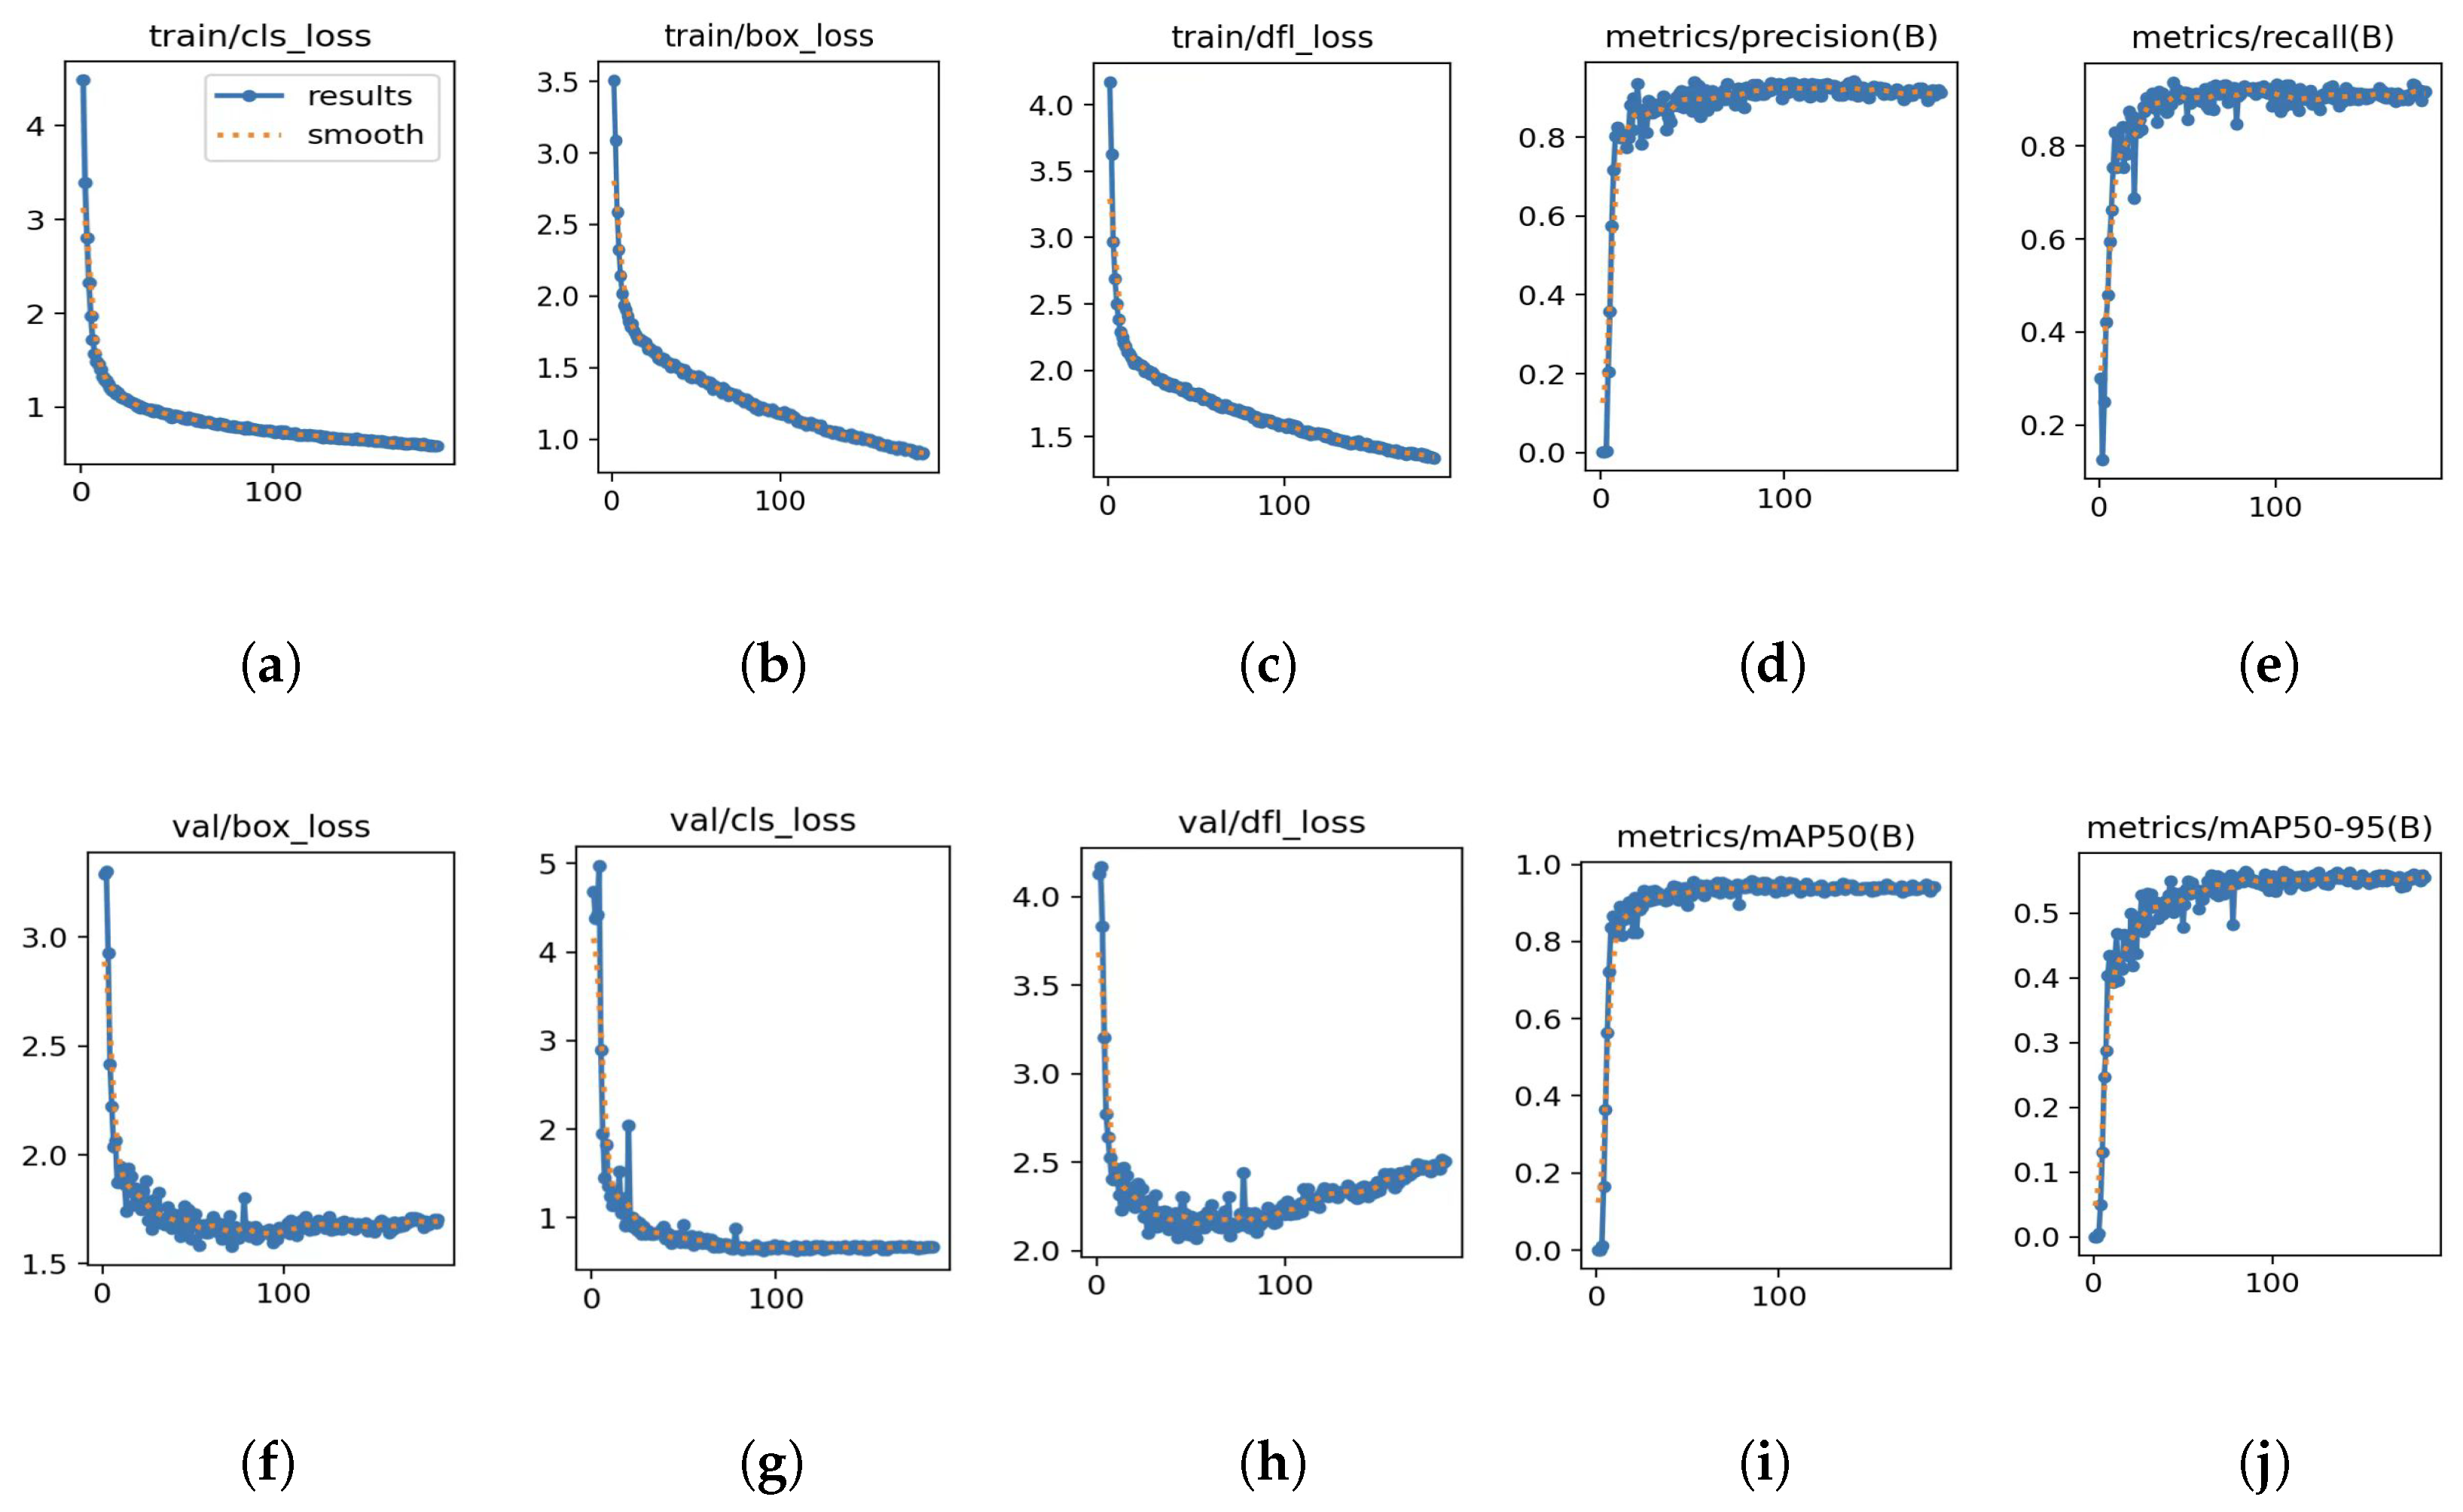
3.2. Performance Analysis of the Original YOLOv8 Model

The performance evaluation results in Table 2 demonstrate a clear trade-off between detection accuracy and computational efficiency across the YOLOv8 model variants. Among them, YOLOv8n shows the most favorable lightweight performance, with a model size of 6.3 MB and a computational complexity of 8.1 GFLOPs. In contrast, other variants exhibit substantial increases in both model size and complexity: YOLOv8s (22.5 MB/28.4 GFLOPs), YOLOv8m (52.0 MB/78.9 GFLOPs), YOLOv8l (87.7 MB/165.2 GFLOPs), and YOLOv8x (136.7 MB/257.4 GFLOPs).
Furthermore, as model complexity increases from YOLOv8m to YOLOv8x, a decline in detection accuracy is observed—mAP@0.5 drops from 93.7% to 92.0%, representing a 1.7% decrease. In contrast, the model size and computational load increase sharply by 162.9% and 225.7%, respectively. This nonlinear growth underscores the phenomenon of diminishing returns, indicating that further increasing model depth and complexity does not necessarily lead to proportional improvements in detection performance.
Although YOLOv8n achieves an mAP@0.5 of 89.2%, which is 2.8% lower than that of YOLOv8s (92.0%), its model size and computational complexity are reduced by 71.9% and 71.5%, respectively. These substantial reductions highlight YOLOv8n’s strong potential for deployment in real-world engineering applications. Therefore, based on a comprehensive analysis of the accuracy–efficiency trade-off, YOLOv8n is selected as the baseline detection network for this study.
As shown in Figure 6, the YOLOv8n model exhibits a clear performance bottleneck in maize seedling detection tasks. The training results show that the validation mAP@0.5 remains consistently stable at 0.50 ± 0.02, while both precision and recall plateau at 0.80 after epoch 100, indicating a limitation in the model’s generalization capability.
Moreover, the validation losses—val/box_loss = 0.6 and val/cls_loss = 0.4—fluctuate by less than 1% during the later stages of training, further indicating that the model lacks sufficient capacity to capture fine-grained features of maize seedlings under complex field conditions.

3.3. Contrast Experiment

To evaluate detection performance on maize seedling targets, several representative object detection algorithms were selected for comparison. The results are summarized in Table 3.
The analysis shows that the two-stage detector Faster R-CNN achieves a relatively high recall of 87.83% and a precision of 71.72%, resulting in an mAP@0.5 of 87.60%. In contrast, the single-stage detector SSD exhibits more limited performance, with a precision of 67.60%, recall of 70.60%, and mAP@0.5 of 68.40%. NanoDet, a lightweight model, achieves a precision of 67.76%, a recall of 44.00%, and an mAP@0.5 of 67.70%. Although its detection accuracy is lower compared to the other models, it maintains a low computational complexity of only 1.35 GFLOPs, making it suitable for resource-constrained environments.
The YOLO series models demonstrate overall superior performance in maize seedling detection. Among them, the proposed MaizeStar-YOLO achieves an optimal trade-off between detection accuracy and computational efficiency, with a model complexity of only 3.0 GFLOPs—substantially lower than that of YOLOv5s (7.1 GFLOPs), YOLOv6n (11.8 GFLOPs), YOLOv7-tiny (6.52 GFLOPs), and YOLOv8n (8.1 GFLOPs).
In terms of detection accuracy, MaizeStar-YOLO outperforms several mainstream models, achieving an mAP@0.5 of 92.8%, which surpasses that of YOLOv5s (90.1%), YOLOv6n (88.0%), and YOLOv7-tiny (86.1%), and also exceeds YOLOv8n (89.2%) and YOLOv11n (90.5%). Notably, MaizeStar-YOLO achieves the highest mAP@[0.5:0.95] score of 62.3% among all evaluated models, highlighting its effectiveness in handling complex real-world scenarios.
The proposed MaizeStar-YOLO model is built upon the YOLOv8n framework, incorporating the C2F_StarsBlock and PKIStage modules to enhance feature extraction and multi-scale representation capabilities.

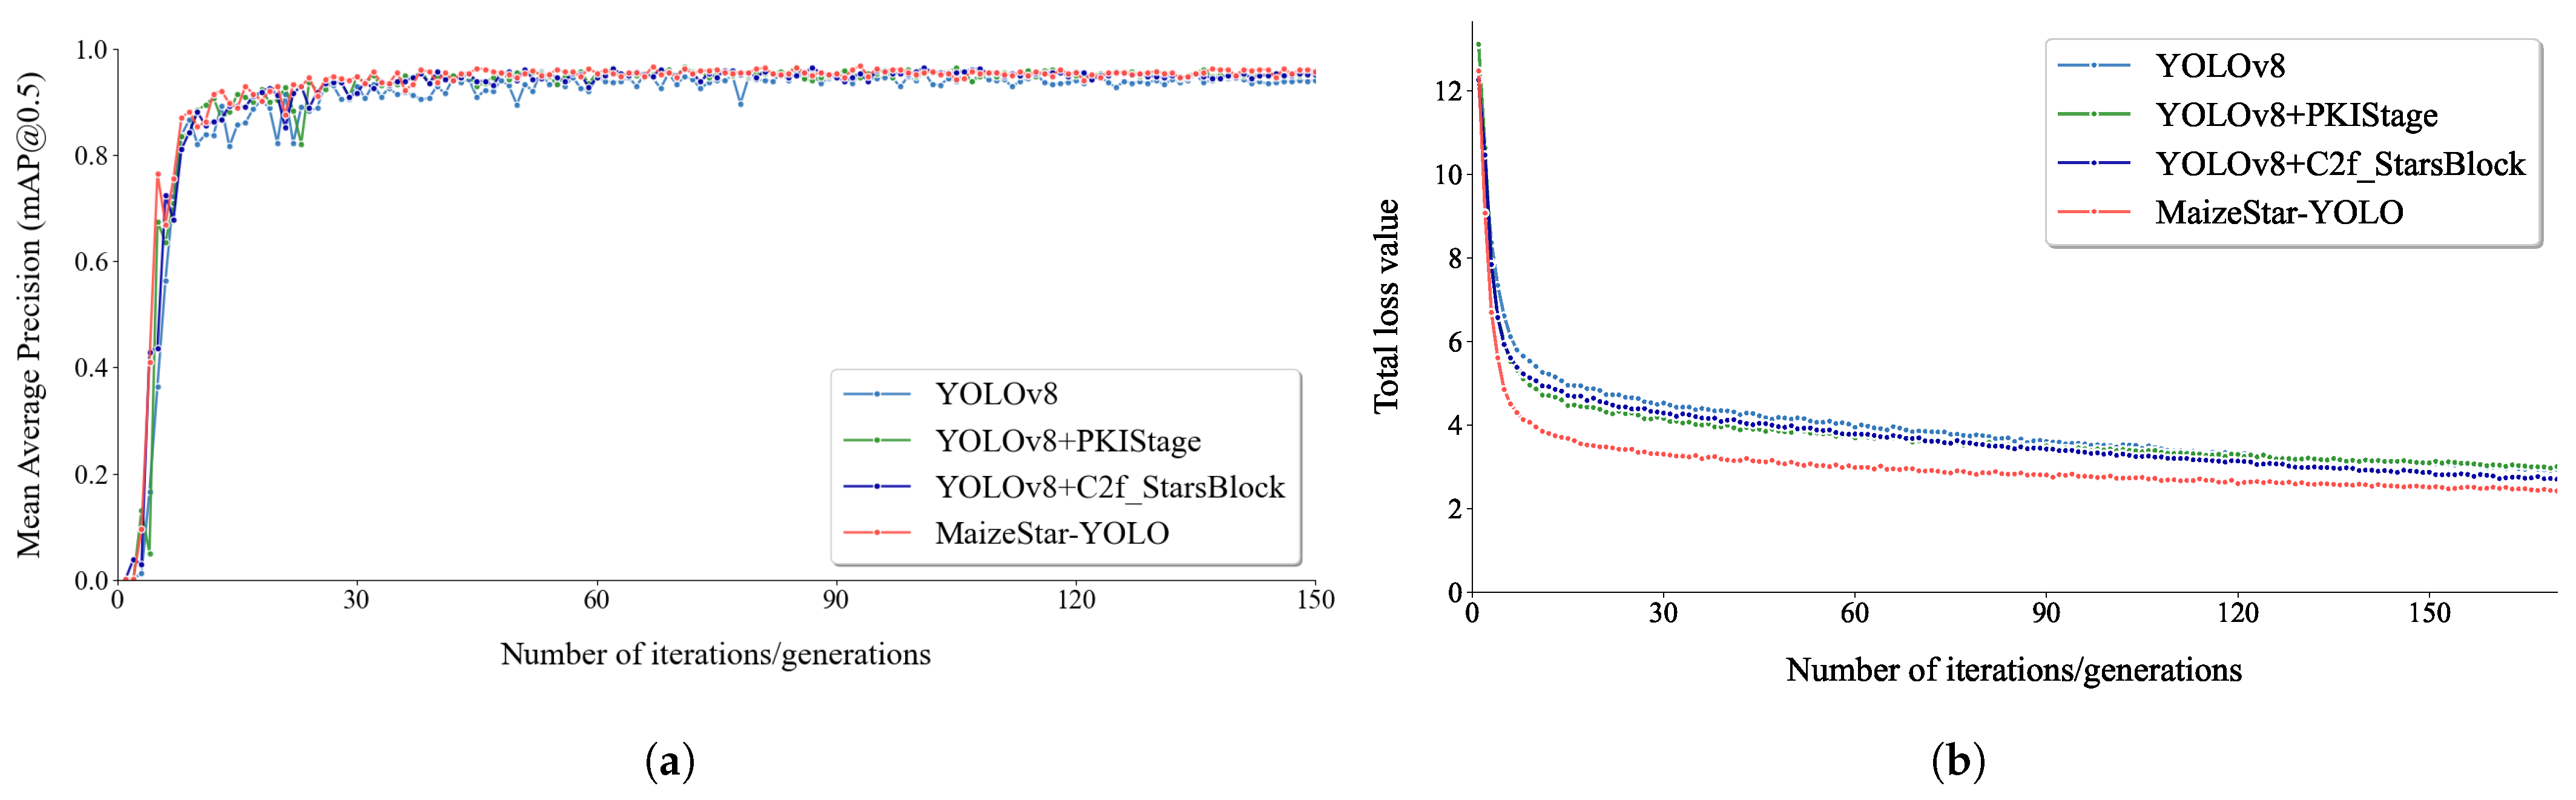
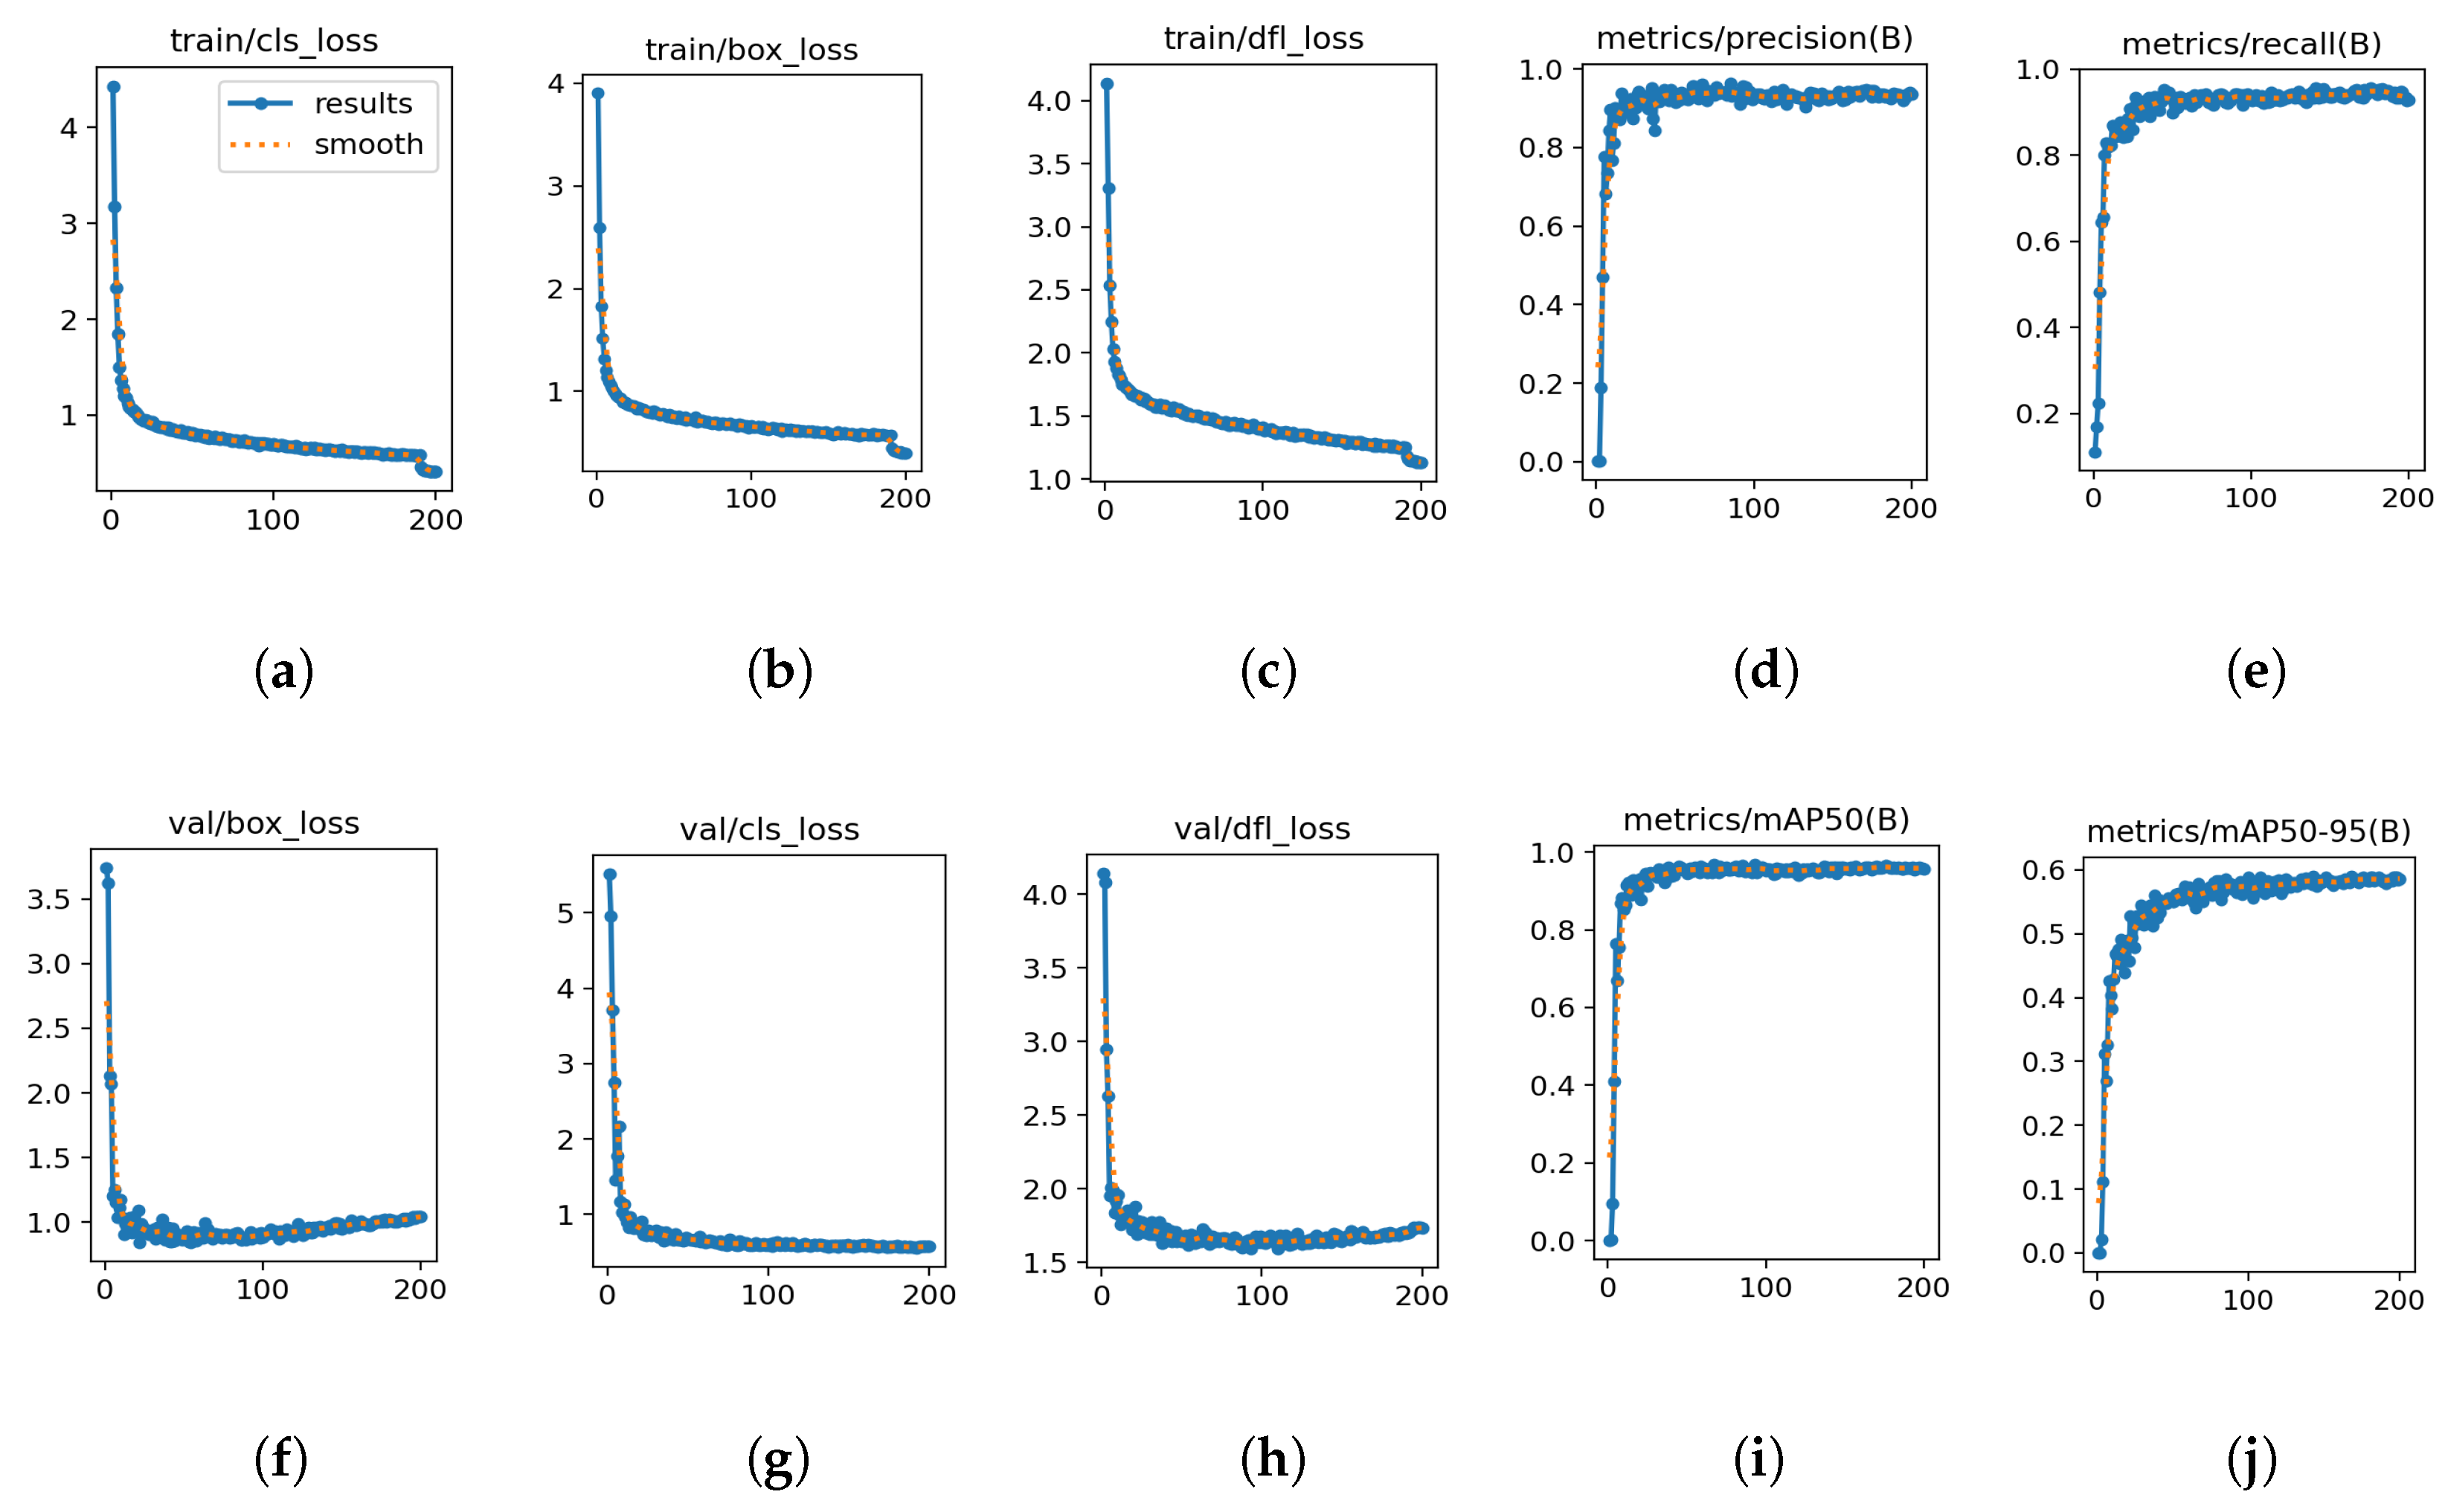
3.4. Ablation Experiment

To validate the effectiveness of the proposed approach, a series of ablation experiments were conducted. YOLOv8n was used as the baseline model, and the two proposed modules—C2F_StarsBlock and PKIStage—were progressively integrated to assess their individual and combined contributions to overall model performance. The quantitative results are summarized in Table 4.
Baseline Model Analysis. The original YOLOv8n model exhibited a relatively high false negative rate in dense maize seedling detection scenarios, with a recall of 78.9%, mAP@0.5 of 89.2%, mAP@[0.5:0.95] of 60.0%, and a computational complexity of 8.1 GFLOPs.
Effectiveness of the C2F_StarsBlock Module. C2F_StarsBlock, a cross-scale feature reuse module, was introduced to enhance the model’s feature extraction capability. As shown in Table 4, its integration led to a significant increase in recall, which rose to 83.9% (+5.0%), along with improvements in mAP@0.5 to 91.6% (+2.4%) and mAP@[0.5:0.95] to 61.4% (+1.4%). Although precision slightly declined to 98.1% (–0.5%), the computational complexity increased only marginally to 8.2 GFLOPs (+1.2%). These results demonstrate the module’s effectiveness in reducing false negatives and improving detection performance in dense scenes.
Effectiveness of the PKIStage Module. To reduce computational complexity, the structured sparse module PKIStage (also referred to as PRIStage) was introduced, supporting both dynamic pruning and parallel computation. As shown in Table 4, this module significantly reduced computational complexity to 2.9 GFLOPs (–64.2%), while further improving recall to 85.0% (+6.1%), mAP@0.5 to 91.8% (+2.6%), and mAP@[0.5:0.95] to 61.5% (+1.5%). Although precision slightly decreased to 97.5% (–1.1%), it remained at a high level, indicating that the module achieves substantial gains in model efficiency with minimal impact on detection accuracy.
Overall Performance of MaizeStar-YOLO. By integrating the feature enhancement capability of the C2F_StarsBlock with the lightweight design of the PKIStage module, the final model—MaizeStar-YOLO—was developed. As shown in Table 4, the integrated model achieved a recall of 86.5% (+7.6%), mAP@0.5 of 92.8% (+3.6%), and mAP@[0.5:0.95] of 62.3% (+2.3%), while reducing computational complexity to just 3.0 GFLOPs (–63%). The precision remained high at 98.1%, with only a minor drop of 0.5% compared to the baseline. These results confirm that MaizeStar-YOLO achieves an optimal balance between detection performance and model efficiency.
As illustrated in Figure 7a,b, the enhanced MaizeStar-YOLO model demonstrates three key advantages in terms of detection performance and training stability: First, the mean average precision (mAP) achieved by MaizeStar-YOLO is significantly higher than that of YOLOv8 + C2F_StarsBlock, YOLOv8 + PKIStage, and the original YOLOv8 baseline, indicating superior detection accuracy. Second, the magnitude of performance fluctuations in the later training stages is notably reduced, reflecting enhanced model robustness and improved training stability. Finally, the loss curve of the enhanced model exhibits a more rapid and stable decline compared to the baseline, suggesting faster convergence during training and more efficient optimization.
These experimental results confirm the collaborative effectiveness of the C2F_StarsBlock and PKIStage modules in enhancing feature stability and preserving the model’s learning dynamics. In conclusion, the improved YOLOv8-based MaizeStar-YOLO model achieves the highest detection performance and demonstrates superior recognition capability in maize seedling detection tasks.
The enhanced model effectively overcomes the limitations of the baseline through architectural refinements and training strategy optimization. As illustrated in Figure 8, the training loss functions—train/box_loss and train/cls_loss—were reduced by approximately 75% during the initial phase of training, indicating a significantly improved convergence rate.
Moreover, the mAP@[0.5:0.95] on the validation set increased to 0.70, while precision (0.83) and recall (0.82) demonstrated a well-balanced performance. These results reflect a substantial improvement in the model’s adaptability to complex farmland environments, highlighting its robustness and generalization capability under real-world conditions.

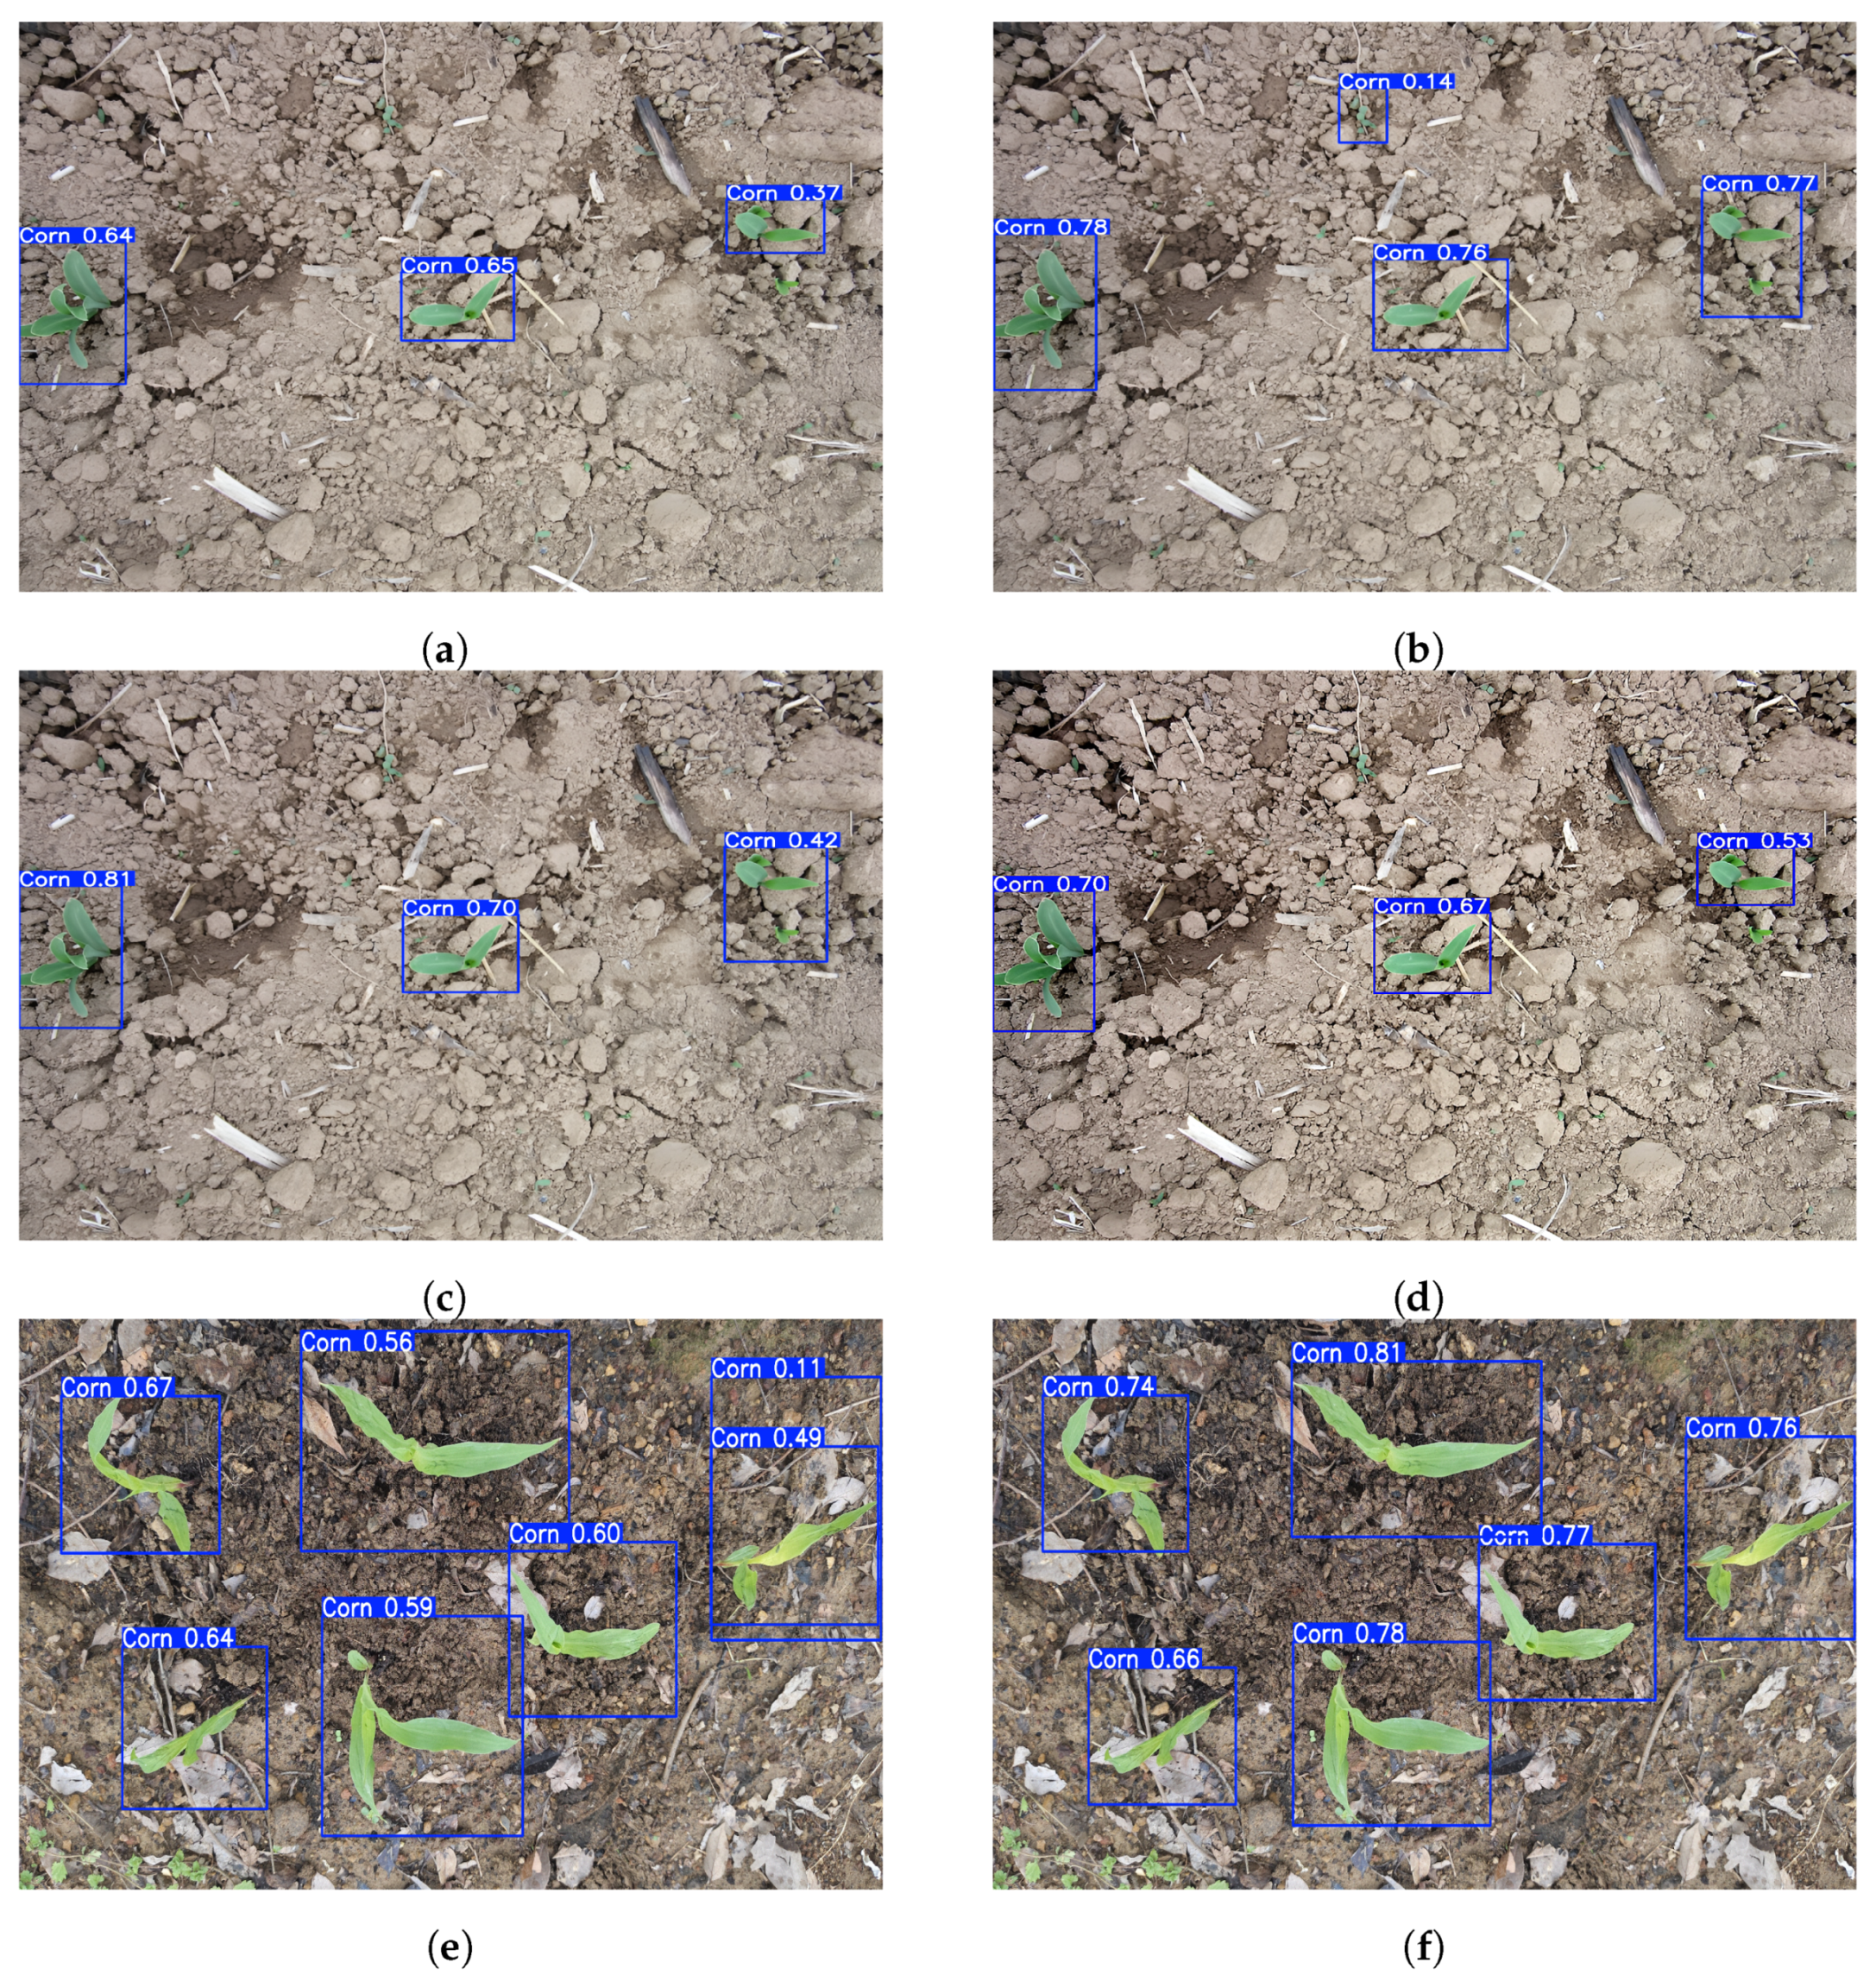
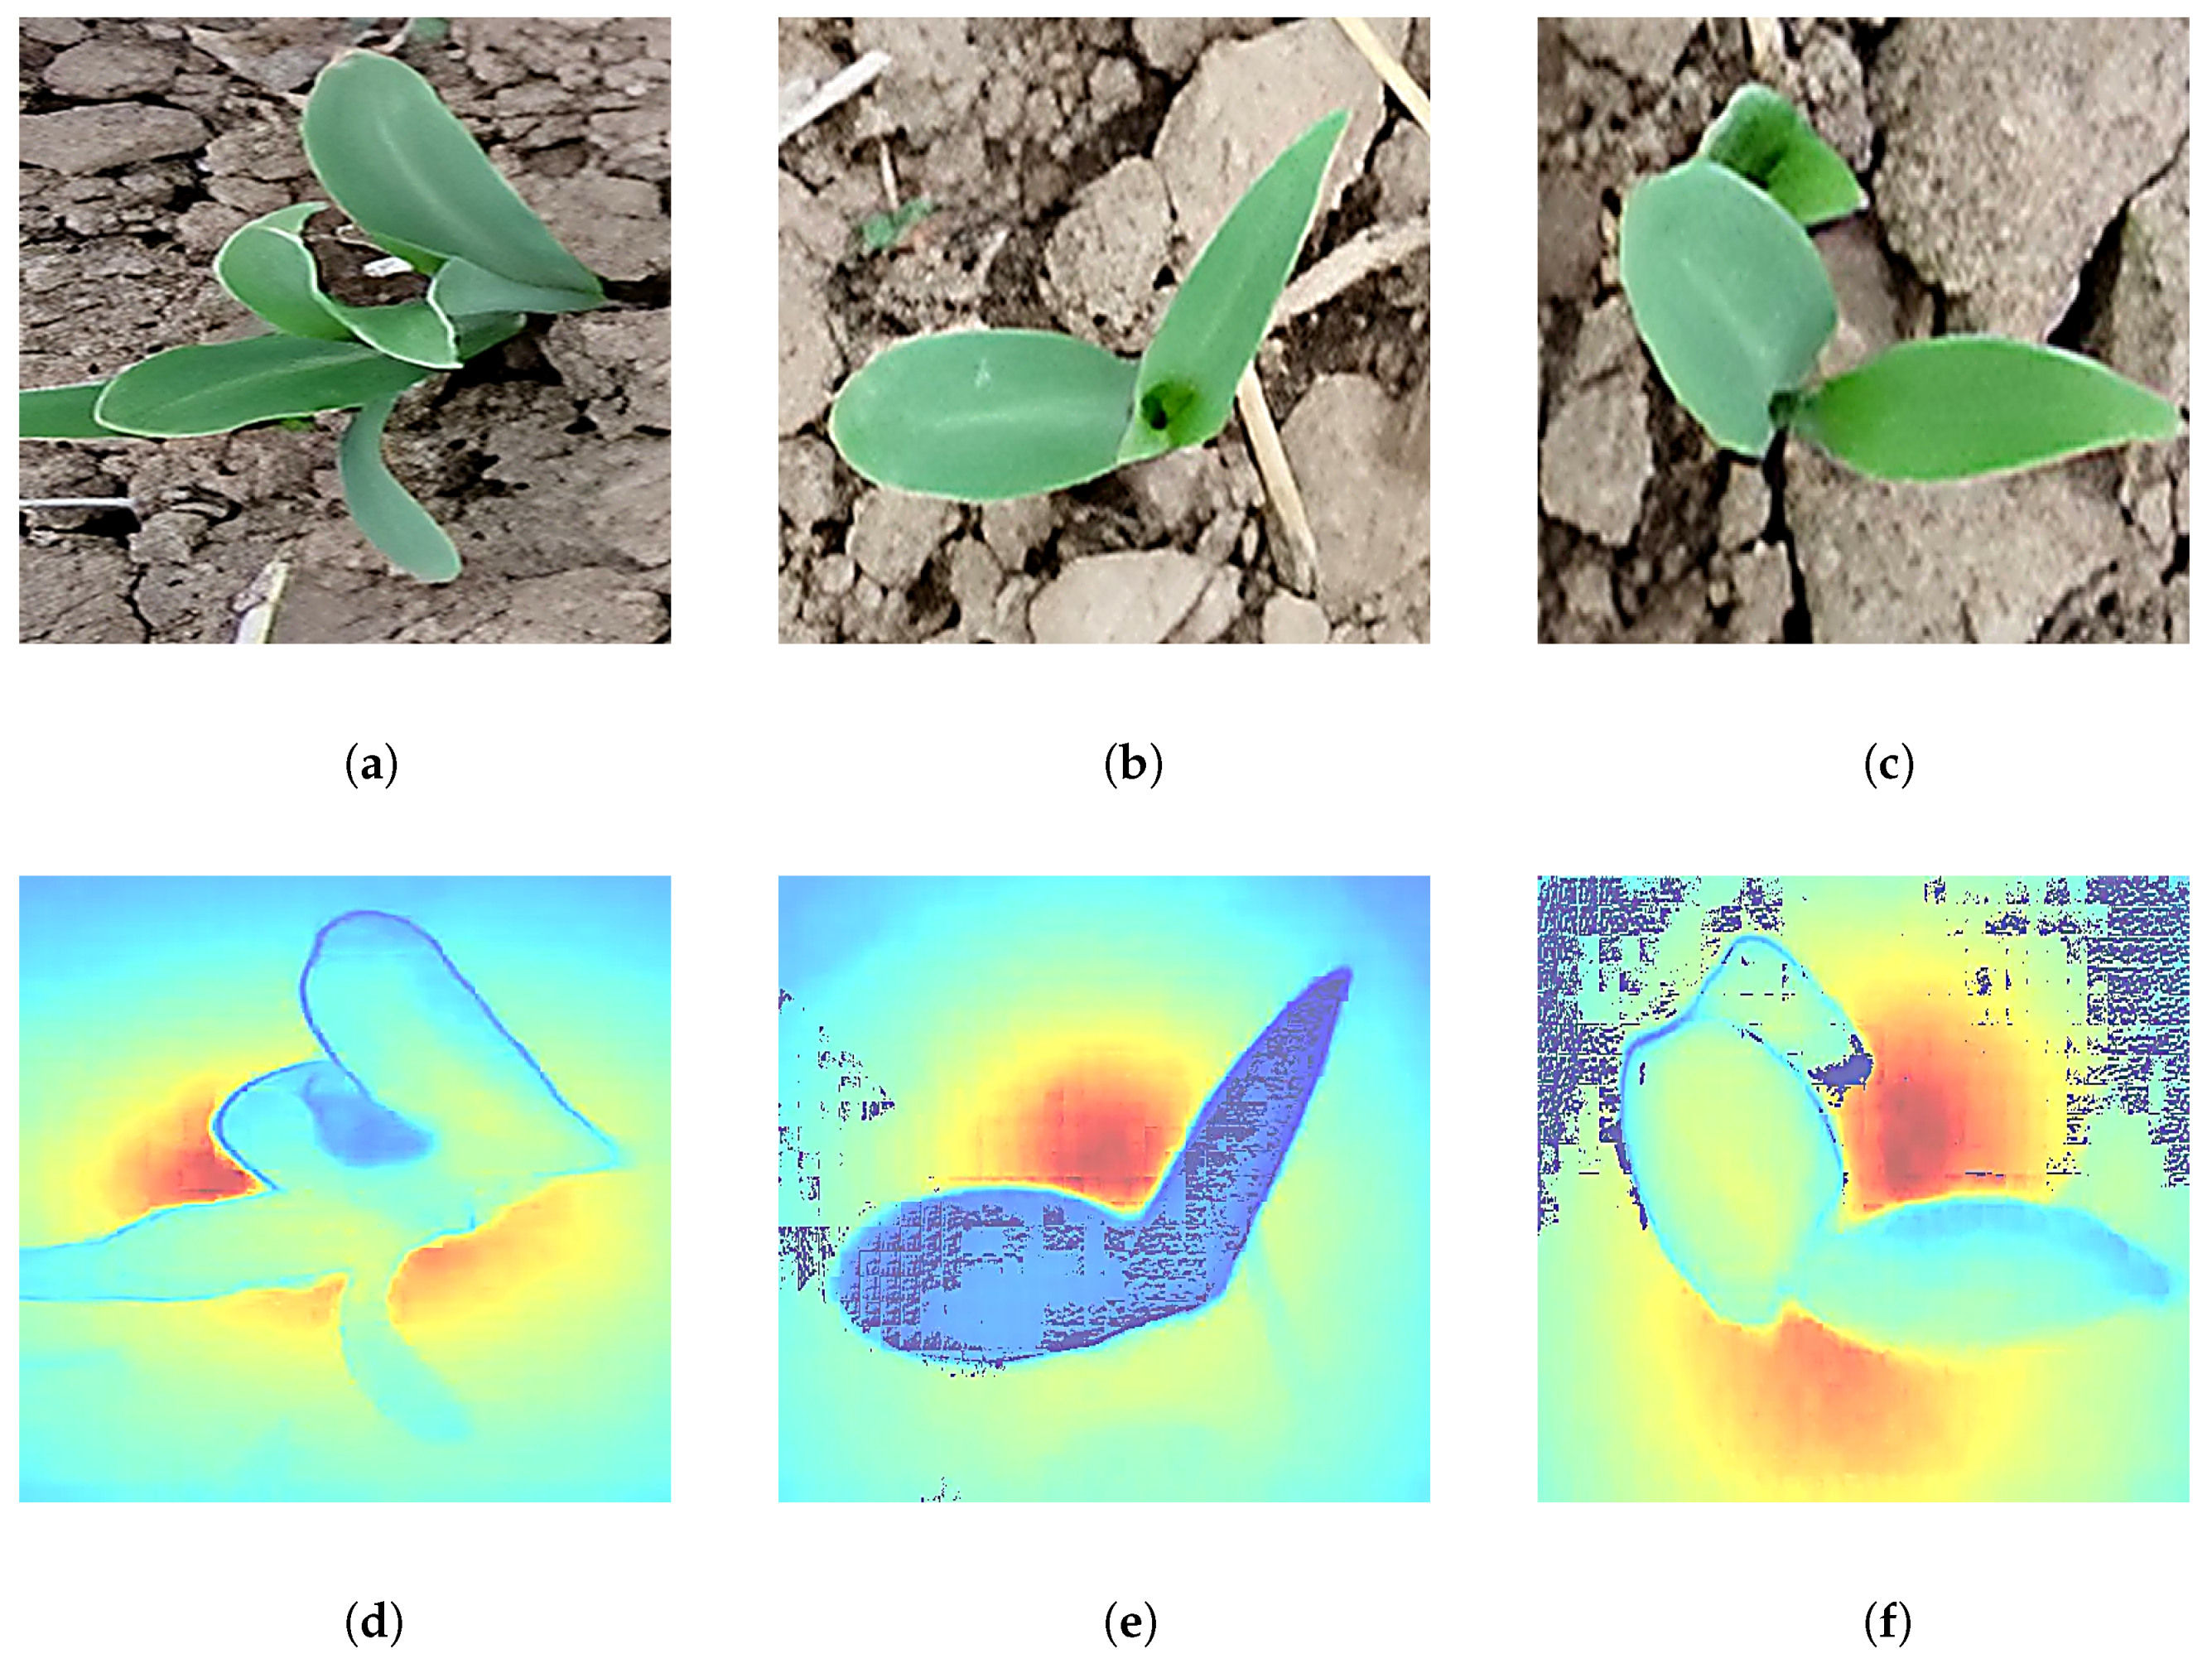
3.5. Model Checking and Application Visualization

Figure 9 presents a qualitative comparison of the baseline models—YOLOv8n, YOLOv5s, and YOLOv11n—against the proposed MaizeStar-YOLO method for corn seedling detection. While YOLOv5s and YOLOv11n often produce high confidence scores, they also suffer from a relatively high false positive rate. In contrast, MaizeStar-YOLO provides more accurate seedling localization and demonstrates greater robustness under real-world field conditions. Specifically, the baseline models frequently generate low-confidence or incorrect bounding boxes, particularly when detecting individual seedlings, thereby reducing overall detection reliability. In comparison, MaizeStar-YOLO consistently produces cleaner, more accurately placed bounding boxes with higher confidence scores, enabling more precise delineation of each plant’s true spatial extent.

4. Discussion

Accurate detection of maize seedlings under complex field conditions is a critical prerequisite for high-throughput phenotyping. However, conventional object detection models often exhibit limited precision and high computational costs, restricting their applicability in downstream tasks such as plant segmentation and 3D morphological reconstruction. To address these challenges, we propose MaizeStar-YOLO—a lightweight and high-precision detection framework that jointly optimizes feature representation and model efficiency. Experimental results on the maize seedling dataset demonstrate that MaizeStar-YOLO achieves an mAP@0.5 of 92.8%, representing a 3.6% absolute improvement over the YOLOv8 baseline. Meanwhile, its computational complexity is reduced from 8.1 to 3.0 GFLOPs, a 63% reduction. As shown in Table 4, the recall also improves to 86.1%, a 7.2% gain compared to the baseline, underscoring the model’s effectiveness in reducing missed detections and its strong potential as a foundation for subsequent segmentation and 3D reconstruction tasks.
To further analyze the contributions of each module, ablation experiments were conducted to isolate the effects of the C2F_StarsBlock and PKIStage components. The C2F_StarsBlock module, designed to enhance spatial feature interaction through multi-branch axial decomposition, improved the recall to 83.9%, representing a 5.0% increase over the baseline. This result underscores its effectiveness in enhancing small-object perception under complex backgrounds. The design aligns with approaches such as MMF-YOLO, which leverages adaptive multi-branch fusion to reduce false negatives in dense and cluttered environments [45], as well as convolutional attention-based fusion strategies that preserve spatial features across scales to improve small-target detection [46]. However, the PKIStage module, which introduces structural optimization via gradient-guided channel pruning, achieved an even higher recall of 85.0% while reducing computational complexity by 64.2% (from 8.1 to 2.9 GFLOPs). This confirms the module’s strength in balancing detection accuracy and computational efficiency. Similar structural compression techniques have demonstrated promising results in lightweight detection models—for instance, Wang et al. applied pruning and batch normalization to compress a modified FSSD model, enabling faster small-object detection with minimal accuracy loss [47], while Zhao et al. proposed a cross-scale attention fusion framework that enhances relevant features and suppresses background noise for improved small-object detection in cluttered scenes [48]. When integrated into the unified MaizeStar-YOLO architecture, the two modules exhibited complementary strengths. The final model achieved the highest recall of 86.1%, mAP@0.5 of 92.8%, and mAP@[0.5:0.95] of 62.3%, with a computational cost of only 3.0 GFLOPs. These results validate the proposed dual-optimization framework, in which feature representation and structural simplification work in tandem to enable robust, lightweight, and real-time maize seedling detection. The design is well-suited for deployment in dynamic agricultural environments and is consistent with attention-guided spatial–context fusion strategies widely adopted in small-object detection research [49].
Recent advances in lightweight object detection frameworks—such as EfficientDet and YOLOv7-Tiny—have highlighted the trade-offs between accuracy and computational efficiency in field-based agricultural tasks. For example, EfficientDet achieves an mAP@0.5 of approximately 88.3% with 4.5 GFLOPs in comparable plant detection scenarios, as reported by Tan et al. [50]. In contrast, MaizeStar-YOLO delivers a higher mAP@0.5 of 92.8% with significantly fewer FLOPs, demonstrating a superior efficiency–accuracy balance. Compared to anchor-free models like CenterNet, which offer real-time performance but often struggle in cluttered or occluded environments, MaizeStar-YOLO achieves a higher recall of 86.1% and exhibits enhanced robustness to occlusion. This improvement stems from its multi-branch spatial feature fusion mechanism. These results indicate that the proposed architecture effectively balances detection robustness and computational efficiency, even under complex field conditions. In practical applications—such as real-time monitoring of seedling establishment or pre-emergence stress diagnosis—reduced computational load and improved recall enhance field usability, making the model suitable for deployment on mobile platforms, including UAVs and handheld devices. In contrast, more computationally intensive models such as DETR or Swin Transformer-based architectures typically require GPU acceleration and are less viable for embedded systems, as noted by Zhu et al. [51]. The dual-optimization strategy employed in MaizeStar-YOLO bridges the gap between benchmark-level accuracy and real-world deployment feasibility—two often conflicting goals in agricultural computer vision—echoing insights from Lin et al. [52].
In addition to the observed quantitative improvements, the qualitative results presented in Figure 10 further validate that emphasizing seedling morphology substantially enhances foreground–background separation—a critical prerequisite for accurate plant segmentation and subsequent 3D phenotypic reconstruction. Nonetheless, several limitations remain, which warrant further discussion to guide future research and inform practical deployment strategies.
(1)
Inadequate Coverage of Later Maize Growth Stages in Model Validation
The current model validation primarily focuses on the early growth stage (seedling stage) of maize and lacks sufficient coverage of the full growth cycle. Although we attempted to expand the dataset to include additional stages—seedling, R1 Silking stage, and VT Tasseling stage—and increased the training set to 800 images through data augmentation, as illustrated in Figure 11, the model’s accuracy (mAP) remains suboptimal, as shown in Table 5. This limitation is largely attributed to the increased occlusion, lighting variability, and structural complexity encountered under real field conditions as plants mature, which complicate both data acquisition and high-quality annotation. In addition, the significant morphological changes during later growth stages challenge the model’s generalization capability. Specifically, greater leaf overlap and canopy complexity in the ear and flowering stages reduce segmentation accuracy, thereby compromising the precision of downstream phenotyping analyses.
To preliminarily explore the model’s applicability to other crops and growth stages, we supplemented the dataset with a small number of rice seedling images collected from real production environments. After data augmentation, the training set was expanded to 200 images, as illustrated in Figure 11, As shown in Table 5, the model performs better on this dataset than on the full-period maize dataset. Although rice seedlings in the field still present challenges such as occlusion, lighting variation, and structural complexity, the model’s performance remains acceptable, especially considering the current limited sample size.
To systematically enhance the model’s robustness and generalization capability across complex field environments and the full crop growth cycle, future research will focus on the following directions: Expanding dataset coverage by incorporating a wider range of crop development stages and diverse canopy structure samples to improve representation of real-world variability. Exploring staged modeling strategies, such as developing independent models for specific growth stages or applying population-based analysis methods for crops like maize, which exhibit dense shading and structural complexity in later stages. Adopting advanced learning paradigms, including semi-supervised learning, domain adaptation, and the integration of publicly available datasets. These approaches aim to reduce manual annotation costs while effectively enhancing model performance, thereby facilitating the translation of 3D phenotyping technologies from controlled research environments to real-world field applications.
(2)
Lack of Deployment and Evaluation on Edge Devices
The absence of model deployment and evaluation on edge devices currently limits the practical applicability of the proposed method in agricultural monitoring systems, which are often implemented on embedded platforms with constrained computational resources. This limitation directly affects the scalability and feasibility of large-scale, low-cost, and high-throughput phenotypic analysis.
During the initial development phase, the focus was placed on maximizing algorithmic performance and architectural robustness, while deployment efficiency on embedded systems was considered secondary. However, as research goals shift toward real-world application, this issue has become increasingly prominent.
Future work will prioritize the development of lightweight model variants through model compression techniques, including quantization, pruning, and knowledge distillation. In addition, performance benchmarking on embedded platforms—such as NVIDIA Jetson and ARM-based processors—will inform further architectural optimization, helping to strike a better balance between computational efficiency and model accuracy.
(3)
Broader Scientific and Practical Implications
Despite the aforementioned limitations, the proposed framework highlights the critical role of early-stage morphological features in improving plant–soil separation and enhancing phenotypic interpretation. These capabilities are particularly relevant for time-sensitive agricultural tasks such as seedling vigor assessment and early stress detection, which are key components of precision agriculture. Furthermore, the modular design of the architecture facilitates seamless integration into more comprehensive phenotyping pipelines, especially as richer datasets and edge-deployable solutions become increasingly available. This flexibility enhances the model’s long-term value for both scientific research and practical field applications.

5. Conclusions

This study proposes a dual-module collaborative optimization strategy that achieves technical advancements in maize seedling detection while maintaining a lightweight architecture of only 6.3 MB. The proposed C2F_StarsBlock module introduces a dual-branch fully connected structure to enhance nonlinear cross-channel attention, achieving an mAP@0.5 of 91.6% on the YOLOv8n backbone. In parallel, the PKIStage module employs an FFN–PB hybrid architecture for local–global feature extraction, further improving performance to an mAP@0.5 of 92.8% and an mAP@[0.5:0.95] of 62.3%, and reducing computational complexity to 3.0 GFLOPs. Ablation experiments confirm the complementary effectiveness of the two modules. Compared with the baseline YOLOv8n, the enhanced model achieves a 3.6% gain in mAP@0.5, a 2.3% improvement in mAP@[0.5:0.95], and a 63% reduction in computational cost. The technical advantages of the proposed framework are twofold: (1) high-precision detection, which provides reliable point cloud data for 3D maize phenotyping, and (2) a lightweight architecture, enabling practical deployment in resource-constrained agricultural environments. In summary, this work delivers a scalable, deployable, and efficient solution for high-throughput phenotyping detection, establishing a robust foundation for 3D phenotypic digitization and precision agriculture applications.

Author Contributions

Conceptualization, H.Z. and T.C.; methodology, H.Z., Y.W. and Z.Y.; software, H.Z. and Y.W.; validation, T.C. and X.W.; formal analysis, H.Z., Y.W. and C.W.; investigation, H.Z., T.C. and J.L.; resources, H.Z. and X.W.; data curation, H.Z., Y.W. and Z.Y.; writing—original draft, H.Z. and Y.W.; writing—review and editing, H.Z., T.C., Y.W., Z.Y., X.W., C.W. and J.L.; visualization, H.Z. and C.W.; supervision, H.Z. and J.L.; project administration, H.Z. and X.W.; funding acquisition, H.Z. and J.L. All authors have read and agreed to the published version of the manuscript.

Funding

This research was funded by the Anhui Provincial University Innovation Team Project, Digital Agriculture Innovation Team (2023AH010039), and the Anhui Provincial Department of Education University Collaborative Innovation Project, Research and Application of Multi-source Data Coupling Driven Variable Fertilization Technology (GXXT-2023-102).

Data Availability Statement

The original contributions presented in this study are included in the article. Further inquiries can be directed to the corresponding author.

Acknowledgments

The authors gratefully acknowledge the High-Performance Computing Cluster at Anqing Normal University for providing the computational resources used in this work. They also sincerely thank Pengcheng Ding, Junming Jiang, and Huoyuan Wang for their valuable contributions and assistance during the experimental procedures.

Conflicts of Interest

Author Jianfeng Liao was employed by the company Anhui Eagle Information Technology Co., Ltd. The remaining authors declare that the research was conducted in the absence of any commercial or financial relationships that could be construed as a potential conflict of interest.

References

  1. Jafari, F.; Wang, B.; Wang, H.; Zou, J. Breeding Maize of Ideal Plant Architecture for High-Density Planting Tolerance through Modulating Shade Avoidance Response and Beyond. J. Integr. Plant Biol. 2023, 66, 849–864. [Google Scholar] [CrossRef] [PubMed]
  2. Campos, H.; Cooper, M.; Habben, J.E.; Edmeades, G.O.; Schussler, J.R. Improving Drought Tolerance in Maize: A View from Industry. Field Crops Res. 2004, 90, 19–34. [Google Scholar] [CrossRef]
  3. Shi, M.; Zhang, S.; Lu, H.; Zhao, X.; Wang, X.; Cao, Z. Phenotyping Multiple Maize Ear Traits from a Single Image: Kernels per Ear, Rows per Ear, and Kernels per Row. Comput. Electron. Agric. 2022, 193, 106681. [Google Scholar] [CrossRef]
  4. Zhang, R.; Ma, S.; Li, L.; Zhang, M.; Tian, S.; Wang, D.; Liu, K.; Liu, H.; Zhu, W.; Wang, X. Comprehensive Utilization of Corn Starch Processing By-Products: A Review. Grain Oil Sci. Technol. 2021, 4, 89–107. [Google Scholar] [CrossRef]
  5. Ratna, A.S.; Ghosh, A.; Mukhopadhyay, S. Advances and Prospects of Corn Husk as a Sustainable Material in Composites and Other Technical Applications. J. Clean. Prod. 2022, 371, 133563. [Google Scholar] [CrossRef]
  6. Saragih, S.A.; Munar, A.; Hasibuan, W.R. Forescating the Amount of Corn Production in North Sumatra Based on 2017–2021 Data Using the Single and Double Exponential Smoothing Method (Case Study of Central Bureau of Statistics of North Sumatra). J. Artif. Intell. Eng. Appl. (JAIEA) 2024, 3, 614–617. [Google Scholar] [CrossRef]
  7. Luo, J.; He, C.; Yan, S.; Jiang, C.; Chen, A.; Li, K.; Zhu, Y.; Gui, S.; Yang, N.; Xiao, Y.; et al. A metabolic roadmap of waxy corn flavor. Mol. Plant 2024, 17, 1883–1898. [Google Scholar] [CrossRef] [PubMed]
  8. Ashwini, C.; Sellam, V. An optimal model for identification and classification of corn leaf disease using hybrid 3D-CNN and LSTM. Biomed. Signal Process. Control 2024, 92, 106089. [Google Scholar] [CrossRef]
  9. Cardellicchio, A.; Solimani, F.; Dimauro, G.; Petrozza, A.; Summerer, S.; Cellini, F.; Reno, V. Detection of Tomato Plant Phenotyping Traits Using YOLOv5-Based Single Stage Detectors. Comput. Electron. Agric. 2023, 207, 107757. [Google Scholar] [CrossRef]
  10. Chen, J.; Zhao, D.; Zheng, Z.; Xu, C.; Pang, Y.; Zeng, Y. A Clustering-Based Automatic Registration of UAV and Terrestrial LiDAR Forest Point Clouds. Comput. Electron. Agric. 2024, 217, 108648. [Google Scholar] [CrossRef]
  11. ElManawy, A.I.; Sun, D.; Abdalla, A.; Zhu, Y.; Cen, H. HSI-PP: A Flexible Open-Source Software for Hyperspectral Imaging-Based Plant Phenotyping. Comput. Electron. Agric. 2022, 200, 107248. [Google Scholar] [CrossRef]
  12. Feng, J.; Saadati, M.; Jubery, T.; Jignasu, A.; Balu, A.; Li, Y.; Attigala, L.; Schnable, P.S.; Sarkar, S.; Ganapathysubramanian, B. 3D Reconstruction of Plants Using Probabilistic Voxel Carving. Comput. Electron. Agric. 2023, 213, 108248. [Google Scholar] [CrossRef]
  13. Guo, R.; Xie, J.; Zhu, J.; Cheng, R.; Zhang, Y.; Zhang, X.; Gong, X.; Zhang, R.; Wang, H.; Meng, F. Improved 3D Point Cloud Segmentation for Accurate Phenotypic Analysis of Cabbage Plants Using Deep Learning and Clustering Algorithms. Comput. Electron. Agric. 2023, 211, 108014. [Google Scholar] [CrossRef]
  14. Sohan, M.; Ram, T.S.; Reddy, C.V.R. A review on YOLOv8 and its advancements. In Cryptology and Network Security with Machine Learning; Springer: Berlin/Heidelberg, Germany, 2024; pp. 529–545. [Google Scholar] [CrossRef]
  15. Varghese, R.; Sambath, M. YOLOv8: A novel object detection algorithm with enhanced performance and robustness. In Proceedings of the 2024 International Conference on Advances in Data Engineering and Intelligent Computing Systems (ADICS), Chennai, India, 18–19 April 2024; pp. 1–6. [Google Scholar] [CrossRef]
  16. Wang, Y.; Zhang, K.; Wang, L.; Wu, L. An improved YOLOv8 algorithm for rail surface defect detection. IEEE Access 2024, 12, 44984–44997. [Google Scholar] [CrossRef]
  17. Bao, Z. The UAV Target Detection Algorithm Based on Improved YOLO V8. In Proceedings of the International Conference on Image Processing, Machine Learning and Pattern Recognition, Guangzhou, China, 13–15 September 2024; pp. 264–269. [Google Scholar] [CrossRef]
  18. Moussaoui, H.; Akkad, N.E.; Benslimane, M.; El-Shafai, W.; Baihan, A.; Hewage, C.; Rathore, R.S. Enhancing automated vehicle identification by integrating YOLO v8 and OCR techniques for high-precision license plate detection and recognition. Sci. Rep. 2024, 14, 14389. [Google Scholar] [CrossRef] [PubMed]
  19. Zhang, X.; Zhang, S.; Sun, Z.; Liu, C.; Sun, Y.; Ji, K.; Kuang, G. Cross-Sensor SAR Image Target Detection Based on Dynamic Feature Discrimination and Center-Aware Calibration. IEEE Trans. Geosci. Remote Sens. 2025, 63, 5209417. [Google Scholar] [CrossRef]
  20. Du, S.; Pan, W.; Li, N.; Dai, S.; Xu, B.; Liu, H.; Xu, C.; Li, X. TSD-YOLO: Small traffic sign detection based on improved YOLO v8. IET Image Process. 2024, 18, 2884–2898. [Google Scholar] [CrossRef]
  21. Ma, C.; Chi, G.; Ju, X.; Zhang, J.; Yan, C. YOLO-CWD: A novel model for crop and weed detection based on improved YOLOv8. Crop Prot. 2025, 192, 107169. [Google Scholar] [CrossRef]
  22. Sun, S.; Mo, B.; Xu, J.; Li, D.; Zhao, J.; Han, S. Multi-YOLOv8: An infrared moving small object detection model based on YOLOv8 for air vehicle. Neurocomputing 2024, 588, 127685. [Google Scholar] [CrossRef]
  23. Wei, L.; Tong, Y. Enhanced-YOLOv8: A new small target detection model. Digit. Signal Process. 2024, 153, 104611. [Google Scholar] [CrossRef]
  24. Liu, W.; Anguelov, D.; Erhan, D.; Szegedy, C.; Reed, S.; Fu, C.-Y.; Berg, A.C. SSD: Single Shot MultiBox Detector. In Proceedings of the European Conference on Computer Vision (ECCV), Amsterdam, The Netherlands, 11–14 October 2016; pp. 21–37. [Google Scholar] [CrossRef]
  25. Girshick, R.; Donahue, J.; Darrell, T.; Malik, J. Rich Feature Hierarchies for Accurate Object Detection and Semantic Segmentation. In Proceedings of the IEEE Conference on Computer Vision and Pattern Recognition, Columbus, OH, USA, 23–28 June 2014; pp. 580–587. [Google Scholar] [CrossRef]
  26. Girshick, R. Fast R-CNN. In Proceedings of the IEEE International Conference on Computer Vision (ICCV), Santiago, Chile, 7–13 December 2015; pp. 1440–1448. [Google Scholar] [CrossRef]
  27. Ren, S.; He, K.; Girshick, R.; Sun, J. Faster R-CNN: Towards Real-Time Object Detection with Region Proposal Networks. Adv. Neural Inf. Process. Syst. 2015, 28, 91–99. Available online: https://papers.nips.cc/paper/5638-faster-r-cnn-towards-real-time-object-detection-with-region-proposal-networks (accessed on 23 July 2025). [CrossRef] [PubMed]
  28. Redmon, J.; Divvala, S.; Girshick, R.; Farhadi, A. You Only Look Once: Unified, Real-Time Object Detection. In Proceedings of the IEEE Conference on Computer Vision and Pattern Recognition (CVPR), Las Vegas, NV, USA, 27–30 June 2016. [Google Scholar] [CrossRef]
  29. Redmon, J.; Farhadi, A. YOLO9000: Better, Faster, Stronger. In Proceedings of the IEEE Conference on Computer Vision and Pattern Recognition (CVPR), Honolulu, HI, USA, 21–26 July 2017. [Google Scholar] [CrossRef]
  30. Redmon, J.; Farhadi, A. YOLOv3: An Incremental Improvement. arXiv 2018, arXiv:1804.02767. [Google Scholar] [CrossRef]
  31. Bochkovskiy, A.; Wang, C.Y.; Liao, H.Y.M. YOLOv4: Optimal Speed and Accuracy of Object Detection. arXiv 2020, arXiv:2004.10934. [Google Scholar] [CrossRef]
  32. Ultralytics. YOLOv5. GitHub. 2020. Available online: https://github.com/ultralytics/yolov5 (accessed on 23 July 2025).
  33. Vision, M. YOLOv6: A Single-Stage Object Detection Framework for Industrial Applications. Available online: https://github.com/meituan/YOLOv6 (accessed on 23 July 2025).
  34. Wang, C.Y.; Bochkovskiy, A.; Liao, H.Y.M. YOLOv7: Trainable Bag-of-Freebies Sets New State-of-the-Art for Real-Time Object Detectors. arXiv 2022, arXiv:2207.02696. [Google Scholar]
  35. Ultralytics. YOLOv8: Cutting-Edge Object Detection & Segmentation Model. GitHub. 2023. Available online: https://github.com/ultralytics/ultralytics (accessed on 23 July 2025).
  36. Liu, M.; Liu, Y.; Wang, Q.; He, Q.; Geng, D. Real-Time Detection Technology of Corn Kernel Breakage and Mildew Based on Improved YOLOv5s. Agriculture 2024, 14, 725. [Google Scholar] [CrossRef]
  37. Guan, H.; Deng, H.; Ma, X.; Zhang, T.; Zhang, Y.; Zhu, T.; Zhou, H.; Gu, Z.; Lu, Y. A Corn Canopy Organs Detection Method Based on Improved DBi-YOLOv8 Network. Eur. J. Agron. 2024, 150, 127076. [Google Scholar] [CrossRef]
  38. Li-Jun, C.; Xue-Wei, B.; Wen-Tao, R. Identification and location of corn seedling based on computer vision. In Proceedings of the IEEE 10th International Conference on Signal Processing (ICSP), Beijing, China, 24–28 October 2010; pp. 1240–1243. [Google Scholar]
  39. Liu, S.; Yin, D.; Xu, X.; Shi, L.; Jin, X.; Feng, H.; Li, Z. Estimating Maize Seedling Number with UAV RGB Images and Advanced Image Processing Methods. Precis. Agric. 2022, 23, 1301–1322. [Google Scholar] [CrossRef]
  40. Yang, T.; Zhu, S.; Zhang, W.; Zhao, Y.; Song, X.; Yang, G.; Yao, Z.; Wu, W.; Liu, T.; Sun, C.; et al. Unmanned Aerial Vehicle-Scale Weed Segmentation Method Based on Image Analysis Technology for Enhanced Accuracy of Maize Seedling Counting. Agriculture 2024, 14, 175. [Google Scholar] [CrossRef]
  41. Ma, X.; Dai, X.; Bai, Y.; Wang, Y.; Fu, Y. Rewrite the Stars. In Proceedings of the IEEE/CVF Conference on Computer Vision and Pattern Recognition (CVPR), Seattle, WA, USA, 16–22 June 2024; pp. 5694–5703. [Google Scholar]
  42. Cai, X.; Lai, Q.; Wang, Y.; Wang, W.; Sun, Z.; Yao, Y. Poly Kernel Inception Network for Remote Sensing Detection. In Proceedings of the IEEE/CVF Conference on Computer Vision and Pattern Recognition (CVPR), Seattle, WA, USA, 16–22 June 2024; pp. 27706–27716. [Google Scholar]
  43. Wan, H.-P.; Zhang, W.-J.; Chen, Y.; Luo, Y.; Todd, M.D. An Efficient Three-Dimensional Point Cloud Segmentation Method for the Dimensional Quality Assessment of Precast Concrete Components Utilizing Multiview Information Fusion. J. Comput. Civ. Eng. 2025, 39, 04025028. [Google Scholar] [CrossRef]
  44. Ravichandran, A.; Mahajan, V.; Van de Kemp, T.; Taubenberger, A.; Bray, L.J. Phenotypic Analysis of Complex Bioengineered 3D Models. Trends Cell Biol. 2025, 35, 470–482. [Google Scholar] [CrossRef] [PubMed]
  45. Zhang, Q.; Zhang, H.; Lu, X. Adaptive Feature Fusion for Small Object Detection. Appl. Sci. 2022, 12, 11854. [Google Scholar] [CrossRef]
  46. Li, X.; Yang, K.; Huang, R.; Zhou, B.; Xiao, J.; Gao, Z. Detecting Small Objects Using Multi-Scale Feature Fusion Mechanism with Convolutional Block Attention. In Proceedings of the 2024 IEEE International Conference on Systems, Man, and Cybernetics (SMC), Kuching, Malaysia, 6–10 October 2024; pp. 4620–4625. [Google Scholar] [CrossRef]
  47. Wang, Q.; Zhang, H.; Hong, X.; Zhou, Q. Small Object Detection Based on Modified FSSD and Model Compression. In Proceedings of the 2021 IEEE 6th International Conference on Signal and Image Processing (ICSIP), Nanjing, China, 22–24 October 2021; pp. 88–92. [Google Scholar] [CrossRef]
  48. Zhao, F.; Zhang, J.; Zhang, G. FFEDet: Fine-Grained Feature Enhancement for Small Object Detection. Remote Sens. 2024, 16, 2003. [Google Scholar] [CrossRef]
  49. Yang, J.; Liu, X.; Liu, Z. Attention-Guided Feature Fusion for Small Object Detection. In Proceedings of the 2023 IEEE International Conference on Imaging Systems and Techniques (IST), Copenhagen, Denmark, 7–19 October 2023; pp. 1–6. [Google Scholar] [CrossRef]
  50. Tan, M.; Pang, R.; Le, Q.V. EfficientDet: Scalable and Efficient Object Detection. In Proceedings of the IEEE/CVF Conference on Computer Vision and Pattern Recognition (CVPR), Seattle, WA, USA, 13–19 June 2020; pp. 10778–10787. [Google Scholar] [CrossRef]
  51. Zhu, X.; Su, W.; Lu, L.; Li, B.; Wang, X.; Dai, J. Deformable DETR: Deformable Transformers for End-to-End Object Detection. In Proceedings of the International Conference on Learning Representations (ICLR), Vienna, Austria, 3–7 May 2021. [Google Scholar] [CrossRef]
  52. Lin, I.-A.; Cheng, Y.-W.; Lee, T.-Y. Enhancing Smart Agriculture With Lightweight Object Detection: MobileNetv3-YOLOv4 and Adaptive Width Multipliers. IEEE Sens. J. 2024, 24, 40017–40028. [Google Scholar] [CrossRef]
Figure 1. Examples of data augmentation techniques: (a) Gaussian noise addition; (b) brightness adjustment; (c) horizontal flipping; (d) vertical flipping.
Agronomy 15 01788 g001
Figure 2. Data types and augmentation conditions: (a) Close-up outdoor image of maize. (b) Long-range outdoor image of maize. (c) Indoor image of maize. (d) Augmented data under enhanced conditions.
Agronomy 15 01788 g002
Figure 3. Architecture of the proposed improved model (MaizeStar-YOLO), incorporating the C2F_StarsBlock and PKIStage modules into the YOLOv8n backbone for enhanced feature interaction and computational efficiency.
Agronomy 15 01788 g003
Figure 4. Comparison of components in the C2F_StarsBlock architecture: (a) illustrates the overall system structure, and (b) presents the detailed implementation modules.
Agronomy 15 01788 g004
Figure 5. Comparison of PKIStage architecture components: (a) shows the overall system structure, while (b) provides detailed implementation blocks.
Agronomy 15 01788 g005
Figure 6. Training and validation curves of the YOLOv8n model. The blue line represents the raw results, while the yellow line shows the smoothed values. (a) Training/class loss, (b) training/box loss, (c) training/distribution focal loss, (d) metrics/precision, (e) metrics/recall, (f) validation/box loss, (g) validation/class loss, (h) validation/distribution focal loss, (i) metrics/mAP50, (j) metrics/mAP50-95.
Agronomy 15 01788 g006
Figure 7. Comparison of model performance and training losses. (a) Mean average precision (mAP) comparison among different models. (b) Training loss comparison across different architectures.
Agronomy 15 01788 g007
Figure 8. Training and validation curves of the MaizeStar-YOLO model. The blue line indicates the raw values, while the yellow line represents the smoothed trends. Subfigures: (a) training/class loss, (b) training/box loss, (c) training/distribution focal loss, (d) metrics/precision, (e) metrics/recall, (f) validation/box loss, (g) validation/class loss, (h) validation/distribution focal loss, (i) metrics/mAP@0.5, (j) metrics/mAP@[0.5:0.95].
Agronomy 15 01788 g008
Figure 9. Comparative prediction visualizations for early maize seedling stages. (a) YOLOv8n results for fewer targets. (b) YOLOv5s results for fewer targets. (c) YOLOv11n results for fewer targets. (d) MaizeStar-YOLO results for fewer targets. (e) YOLOv8n results for more targets. (f) MaizeStar-YOLO results for more targets, highlighting prediction accuracy and robustness.
Agronomy 15 01788 g009
Figure 10. Three-dimensional visualization of maize seedlings. (ac) show images after background segmentation; (df) present the corresponding feature maps generated by the Dust3r 3D reconstruction algorithm.
Agronomy 15 01788 g010
Figure 11. Representative images of maize and rice at different growth stages: (a) maize—seedling stage, (b) R1 silking stage, (c) VT tasseling stage, and (d) rice—seedling stage. These images were used for data augmentation to improve model training and validation across varying plant structures and field conditions.
Agronomy 15 01788 g011
Table 1. Hyperparameter settings used in the experiments.
ParameterValue
Epochs200
OptimizerSGD
Initial Learning Rate0.01
Momentum0.9
Weight Decay 5 × 10 4
Image Size640
Number of Workers8
Table 2. Model detection result comparison.
ModelmAP@0.5 (%)Model Size (MB)GFLOPs
YOLOv8n89.26.38.1
YOLOv8s92.022.528.4
YOLOv8m93.752.078.7
YOLOv8l93.587.7164.8
YOLOv8x92.0136.7257.4
Table 3. Performance metrics of six object detection models, including precision (P), recall (R), mAP@0.5, mAP@[0.5:0.95], and computational complexity (GFLOPs).
ModelP (%)R (%)mAP@0.5 (%)mAP@[0.5:0.95] (%)GFLOPs
FasterRCNN71.7287.8387.60470.46
SSD67.670.668.430.53
NanoDet67.764467.740.271.35
YOLOv5s99.380.690.1617.1
YOLOv6n97.278.38859.911.8
YOLOv7-tiny95.186.786.150.16.52
YOLOv8n98.678.989.2608.1
YOLOv11n98.781.790.561.76.3
MaizeStar–YOLO98.186.192.862.33.0
Table 4. Performance metrics of the evaluated models, including precision (P), recall (R), mAP@0.5, mAP@[0.5:0.95], and computational complexity (GFLOPs).
ModelP (%)R (%)mAP@0.5 (%)mAP@[0.5:0.95] (%)GFLOPs
YOLOv898.678.989.2608.1
+C2F_StarsBlock98.183.991.661.48.2
+PKIStage97.58591.861.52.9
MaizeStar–YOLO98.186.192.862.33.0
Table 5. Performance metrics of models for detecting and localizing maize and rice seedlings across multiple growth stages: precision (P), recall (R), mAP@0.5, mAP@[0.5:0.95], and GFLOPs.
Crop/StageP (%)R (%)mAP@0.5 (%)mAP@[0.5:0.95] (%)GFLOPs
maize78.352.97037.63.0
Rice (Seedling Stage)90.759.675.839.43.0
Disclaimer/Publisher’s Note: The statements, opinions and data contained in all publications are solely those of the individual author(s) and contributor(s) and not of MDPI and/or the editor(s). MDPI and/or the editor(s) disclaim responsibility for any injury to people or property resulting from any ideas, methods, instructions or products referred to in the content.

