Article

Molecular Elucidation of Anthocyanin Accumulation Mechanisms in Hippeastrum hybridum Cultivars

1
Institute of Grassland, Flowers and Ecology, Beijing Academy of Agriculture and Forestry Sciences, Beijing 100097, China
2
Bioengineering College, Chongqing University, Chongqing 400044, China
3
College of Resources and Environment, Xizang Agriculture and Animal Husbandry College, Linzhi 860000, China
4
The Institute of Biological, Environmental and Rural Sciences, Aberystwyth University, Ceredigion SY23 3DA, UK
5
College of Horticulture, Hebei Agriculture University, Baoding 071000, China
*
Author to whom correspondence should be addressed.
Agronomy 2025, 15(7), 1722; https://doi.org/10.3390/agronomy15071722
Submission received: 9 June 2025 / Revised: 5 July 2025 / Accepted: 14 July 2025 / Published: 17 July 2025
(This article belongs to the Section Grassland and Pasture Science)

Abstract

Hippeastrum, a perennial herbaceous plant belonging to the Amaryllidaceae family, is widely cultivated for its large, vibrant flowers with diverse petal colors, which have significant ornamental and economic value. However, the mechanisms underlying anthocyanin accumulation in Hippeastrum petals remain poorly understood. To fully explore the involved regulation mechanism was significant for the breeding of Hippeastrum and other Amaryllidaceae family plants. In this study, we selected six Hippeastrum cultivars with distinctly different petal colors. We used metabolomic profiling and high-throughput transcriptomic sequencing to assess varied anthocyanin profiles and associated expression of genes in their biosynthetic pathways. Four key anthocyanins were identified: cyanidin, cyanidin-3-O-rutinoside, delphinidin-3-glucoside, and delphinidin-3-rutinoside. Weighted gene co-expression network analysis (WGCNA) correlated the abundance of these four anthocyanins with transcriptomic data, to suggest three regulatory modules. Nine transcription factors families in these modules were identified and some of them were validated using qRT-PCR. Y2H assay isolated some transcription factors interacted with TTG1 (WD40 protein), including MYB3/39/44/306 and bHLH13/34/110, illustrating the possibility of forming MBW complexes. Our study provides a comprehensive characterization of anthocyanin composition. These findings laid a theoretical foundation for future research on the regulatory mechanisms of pigment accumulation and the breeding of Hippeastrum cultivars with novel petal colors.

1. Introduction

Hippeastrum is a genus of perennial plants that produce bulbous flowers. Wild species of Hippeastrum are primarily distributed across tropical and subtropical regions of Central and South America, from northern Argentina to Mexico and the Caribbean, with a concentration in Bolivia, Peru, and Brazil [1]. Hippeastrum flowers are large and vibrant, making them very valuable for ornamental and economic purposes.
Previous studies have shown that petal coloration arises from a combination of selective light absorption by internal pigments at specific wavelengths and light scattering within the petal tissues [2,3]. Among all pigment components contributing to petal coloration, flavonoid compounds play a pivotal role in petal coloration [4]. Anthocyanins, a subclass of flavonoids, are water-soluble pigments widely distributed in vascular plants. They can confer blue, purple, or red coloration to petals, with their exact color influenced by factors such as pH, temperature, light, co-pigments, and metal ions [5]. Anthocyanins not only attract pollinators such as birds and insects but also provide photoprotection and mitigate oxidative damage, thereby enhancing the plant’s stress tolerance [6].
The anthocyanin biosynthetic pathway has been well elucidated, and this is highly conserved among seed plants. Phenylalanine is converted into cinnamic acid under the catalytic action of phenylalanine ammonia-lyase (PAL), which is further catalyzed by cinnamate-4-hydroxylase (C4H) to form 4-coumaric acid. 4-coumarate-CoA ligase (4CL) converts of 4-coumaric acid into 4-coumaroyl-CoA, marking the beginning of the phenylpropanoid biosynthetic pathway. 4-Coumaroyl-CoA reacts with three molecules of malonyl-CoA under the action of chalcone synthase (CHS) to form naringenin chalcone. Chalcone isomerase (CHI) then catalyzes the conversion of naringenin chalcone to naringenin, which is subsequently converted into dihydrokaempferol by flavonoid 3-hydroxylase (F3H). This represents the beginning of the flavonoid biosynthetic subpathway. The enzyme flavonoid 3′-hydroxylase (F3′H) converts dihydrokaempferol into dihydroquercetin, while flavonol synthase (FLS) catalyzes the formation of flavonols from dihydrokaempferol. Dihydroquercetin is then catalyzed by dihydroflavonol reductase (DFR) to form leucocyanidin, which is further converted into anthocyanidins by the continued action of DFR. Finally, anthocyanins are synthesized by enzymes such as UDP-flavonoid glucosyltransferase (UFGT) [7].
With the continuous advancement of plant genome sequencing technologies, there is a growing demand to link variation to metabolic products, given the improvement in metabolomic techniques [8,9]. Numerous studies have used integrative multi-omics approaches, including genomics, transcriptomics, and metabolomics, to unravel various biological phenomena. For instance, 368 DAMs (differentially accumulating metabolites) were identified when comparing wild and cultivated Ophiocordyceps sinensis and were linked to genes in the purine nucleotide and nucleoside biosynthesis pathway, including inosine 5′-monophosphate dehydrogenase (IMPDH), adenylate kinase (AK), adenylosuccinate synthase (ADSS), guanosine monophosphate synthetase (guaA), and guanylate kinase (GUK) [10]. Integrated transcriptomic and metabolomic analysis of cold-sensitive (ZQ) and cold-tolerant (XL) Qingke cultivars (Hordeum vulgare var. coeleste L.), identified HvCBF10A (C-repeat (CRT) binding factor 10A) and HvGDSL (Gly-Asp-Ser-Leu-motif lipase) as being associated with the accumulation of various lipids [11]. Such relationships can be targeted through the use of weighted gene co-expression network analysis (WGCNA), which describes modules of highly correlated genes [12]. For example, WGCNA revealed four sugar transporter proteins (SLC35B3, SLC32A, SLC2A8, and SLC2A13) and three genes involved in sugar and acid metabolism (MUR3, E3.2.1.67, and CSLD) during apricot (Prunus armeniaca) maturation [13]. Integrative transcriptomic and targeted metabolomic analyses of five sea buckthorn (Hippophae rhamnoides L.) cultivars with distinct color differences using WGCNA identified genes associated with the accumulation of chlorophyll and carotenoids (SGR, SGRL, PPH, NYC1, and HCAR). These changes were linked to sea buckthorn maturation [14].
During anthocyanin biosynthesis, transcription factors (TFs) play a crucial regulatory role in the petals of bulbous ornamental plants. Silencing of the MYB-type transcription factor LhMYB114 via virus-induced gene silencing (VIGS) technology significantly reduced anthocyanin accumulation in the lily cultivar Lilium ‘Siberia’ [15]. In Asiatic hybrid lilies, the LhWRKY44 TF interacted with LhMYBSPLATTER and targeted the promoter region of the LhMYBSPLATTER gene. This enhanced the function of the LhMYBSPLATTER-LhbHLH2 MBW complex to promote anthocyanin accumulation [15]. The overexpression of HpMYB1 (Hippeastrum × hybridum, ‘Royal Velvet’) in tobacco exhibited an increased accumulation of anthocyanin, along with the up-regulation of endogenous genes involved in anthocyanin, suggesting metabolite-transcriptional regulatory relationships [16]. The overexpression of MYB3 (Chinese narcissus, Narcissus tazetta L. var. chinensis) in potato inhibited the accumulation of red pigment and altered content of proanthocyanin, and this was linked to the down-regulation of genes involved in anthocyanin and flavonol biosynthesis [17]. Heterologous expression of the TF MaBBX20 (Grape hyacinth, Muscari spp.) increased the accumulation of anthocyanin, but MaBBX51 exhibited an opposite phenotype. The complex formed by BBX20-HY5 was found to activate the expression of MybA and DFR, whilst BBX51 obstructed the formation of the complex [18]. In Lycoris radiata (red spider lily) petals, ERF16 was shown to play a crucial regulatory role in the accumulation of pelargonidin [19]. These studies demonstrate how TFs played a critical regulatory role in the biosynthesis of anthocyanin.
Hippeastrum is currently increasingly gaining attention due to its considerable ornamental and economic value, but the control of the production of its flower pigments has not been established. To further analyze the anthocyanin composition in Hippeastrum petals and the expression and regulatory mechanisms of associated genes, we selected six cultivars with markedly different petal colors. Following quantification of total anthocyanin and flavonoid contents, we employed high-throughput transcriptome and metabolome sequencing. Then, Weighted Gene Co-expression Network Analysis (WGCNA) was performed to identify genes potentially involved in anthocyanin accumulation based on anthocyanin and RNA-seq data. This study provided a theoretical foundation for further exploration of pigment accumulation in bulbous flower petals and may offer insights to support Hippeastrum breeding for color enhancement.

2. Material and Method

2.1. Materials

Six varieties of Hippeastrum with different petal colors were used: ‘Apricot Parfait’, ‘Grand Diva’, ‘Luna’, ‘Pink Rival’, ‘Souvenir’, and ‘Wedding Dance’, and hereinafter referred to as A, G, L, P, S, and W, respectively. Fresh petal materials were collected during the full bloom stage and quickly frozen in liquid nitrogen, then stored at −80 °C for subsequent experiments. The Hippeastrum materials were provided by the Hippeastrum Germplasm Resource Center of the Beijing Academy of Agriculture and Forestry Sciences.

2.2. Content Determination of Total Anthocyanins and Flavonoids

Total anthocyanin content was determined using the following method [20], with some modifications. Briefly, the fresh petal materials were collected and quickly frozen in liquid nitrogen and ground into powder using a mortar and pestle. Extraction was performed in a water bath at 60 °C for one hour. After brief centrifugation, the supernatant was transferred to a new 15 mL centrifuge tube, and the absorbance values of the supernatant were measured at 530, 620, and 650 nm on a microplate reader. Anthocyanin content was estimated based on the following formulae: ODλ (Optical density of anthocyanins at 530 nm) = (OD530 − OD620) − 0.1 × (OD650 − OD620). Anthocyanin content (nmol/g FW) = (ODλ × V)/(ε × M × 106), where V means represents the volume of the extract and ε is the molar extinction coefficient of anthocyanins (4.62 × 10⁶). M indicated the sample mass and 106 the calculated result converted into nanomoles. Total flavonoid measurements used the “Plant Flavonoids Content Assay Kit” (Solarbio, Beijing, China). This measures flavonoid based on their formation of a red complex with aluminum in an alkaline nitrite solution. Measuring the absorbance at 470 nm allows flavonoid content to be calculated.

2.3. Total RNA Extraction and Quality Control

Total RNA was extracted using Trizol reagent (Thermo Fisher, Beijing, China, 15596018) in accordance with the manufacturer’s instructions. The quantity and purity of the extracted RNA were assessed using a Bioanalyzer 2100 along with the RNA 6000 Nano LabChip Kit (Agilent, Santa Clara, CA, USA, 5067-1511). High-quality RNA samples, with an RNA Integrity Number (RIN) greater than 7.0, were selected for sequencing library construction. Following RNA extraction, messenger RNA (mRNA) was purified from 5 µg of total RNA utilizing Dynabeads Oligo(dT) (Thermo Fisher, Carlsbad, CA, USA), which involved two rounds of purification.

2.4. cDNA Synthesis and Library Construction

Following purification, mRNA was fragmented into short segments using the Magnesium RNA Fragmentation Module (NEB, cat. e6150, Ipswich, MA, USA) at 94 °C for 5–7 min. RNA fragments were then reverse-transcribed into complementary DNA (cDNA) using SuperScript™ II Reverse Transcriptase (Invitrogen, cat. 1896649, Carlsbad, CA, USA). cDNA was used to synthesize U-labeled second-stranded DNAs with E. coli DNA polymerase I (NEB, cat. m0209, USA), RNase H (NEB, cat. m0297, USA) in a dUTP Solution (Thermo Fisher, cat. R0133, USA). An adenine base was added to the blunt ends of each strand to facilitate ligation with indexed adapters, each containing a T-base overhang for efficient attachment to the A-tailed fragmented DNA. Dual-index adapters were ligated to the fragments, followed by size selection using AMPure XP beads. After treatment with the heat-labile UDG enzyme (NEB, cat. m0280, USA) on the U-labeled second-stranded DNAs, the ligated products underwent PCR amplification under the following conditions: initial denaturation at 95 °C for 3 min; 8 cycles of denaturation at 98 °C for 15 s, annealing at 60 °C for 15 s, and extension at 72 °C for 30 s; concluded by a final extension at 72 °C for 5 min. The average insert size of the final cDNA libraries was approximately 300 ± 50 bp. Finally, 2 × 150 bp paired-end sequencing (PE150) was performed on an Illumina Novaseq™ 6000 (LC-Bio Technology Co., Ltd., Hangzhou, China).

2.5. The Analyzes of DEGs

In the present research, Salmon (1.9.0) was used to perform the expression level for Unigenes by calculating TPM (Transcripts Per Kilobase of exon model per Million mapped reads). Gene differential expression analysis was performed by edgeR (3.40.2) software between two different groups and two different samples. The genes with the parameter of false discovery rate (FDR) < 0.05 and fold change > 2 or fold change < 0.5 were considered differentially expressed genes.

2.6. qRT-PCR (Quantitative Real-Time Polymerase Chain Reaction) Assay

The CFX connect real-time system (Bio-Rad, Hercules, CA, USA) was used to perform quantitative reverse transcription PCR (qRT-PCR). The relative gene expression levels were analyzed with the 2−ΔΔCT method [21], and the gene expression was normalized with the SCE1, a housekeeping gene characterized based on the RNA-Seq data. Three independent biological replicates were performed for each sample. All primer sequences used in this experiment are listed in Table S1.

2.7. Extraction of Metabolites

Samples were thawed on ice, and 50 mg of each sample was combined with 0.5 mL of pre-chilled 80% methanol to extract the metabolites. Extractions were incubated at −20 °C for 30 min. Following this, the extractions were centrifuged at 20,000× g for 15 min, and the supernatants were carefully transferred to new tubes and vacuum-dried. The dried samples were subsequently reconstituted in 100 μL of 80% methanol and stored at −80 °C until analysis via liquid chromatography–mass spectrometry (LC-MS). Additionally, pooled quality control (QC) samples were prepared by combining 10 μL of each individual extraction mixture.

2.8. LC-MS Parameter Description

Chromatographic separations were conducted on an UltiMate 3000 UPLC System (Thermo Fisher Scientific, Bremen, Germany) employing an ACQUITY UPLC T3 column (100 mm × 2.1 mm, 1.8 µm, Waters, Milford, MA, USA) for reversed-phase separation. The column was maintained at a temperature of 40 °C throughout the analysis. The mobile phase consisted of solvent A (5 mM ammonium acetate and 5 mM acetic acid) and solvent B (acetonitrile), delivered at a flow rate of 0.3 mL/min. Gradient elution was performed according to the following conditions: 0 to 0.8 min at 2% B; 0.8 to 2.8 min, increasing from 2% to 70% B; 2.8 to 5.6 min, increasing from 70% to 90% B; 5.6 to 6.4 min at 90% B; 6.4 to 8.0 min at 100% B; 8.0 to 8.1 min, decreasing from 100% to 2% B; and finally, 8.1 to 10 min at 2% B.

2.9. Mass Spectrometry Parameter Description

A high-resolution tandem mass spectrometer, Q-Exactive (Thermo Scientific), was employed to analyze metabolites eluted from the column. The instrument was operated in both positive and negative ion modes. Precursor ion spectra were acquired over a mass range of 70–1050 m/z at a resolution of 70,000, targeting an Automatic Gain Control (AGC) value of 3 × 10⁶, with a maximum injection time of 100 ms. Data were collected in a top 3 configuration using data-dependent acquisition (DDA) mode. Fragment ion spectra were obtained at a resolution of 17,500, targeting an AGC of 1 × 10⁵ and a maximum injection time of 80 ms. To assess the stability of the LC-MS system throughout the acquisition process, a QC sample, consisting of a pool of all samples, was analyzed after every 10 samples.

2.10. Metabolite Data Analyses

The acquired mass spectrometry (MS) data underwent a series of preprocessing steps, including peak picking, peak grouping, retention time correction, secondary peak grouping, and annotation of isotopes and adducts, all conducted using XCMS 3.22.0 software. In addition, the low-quality peaks were removed by applying stringent filtering criteria (eliminating features with >50% missing values in QC samples or >80% missing values in experimental samples). Median normalization was performed to adjust for systematic variations across samples and missing values were imputed using the minimum imputation method to ensure data completeness for downstream analyses. The raw data files from liquid chromatography–mass spectrometry (LC-MS) were converted to mzXML format and subsequently processed using the XCMS, CAMERA, and metaX toolboxes integrated within R 4.0.0 software. Each ion was identified by correlating retention time (RT) with mass-to-charge ratio (m/z) data. The intensities of each peak were recorded, resulting in the generation of a three-dimensional matrix that comprised arbitrarily assigned peak indices (retention time-m/z pairs), sample identifiers (observations), and ion intensity values (variables).
Metabolite annotation was performed using the online KEGG and HMDB databases, where the exact molecular m/z of the samples were matched against those in the databases (with a 10 ppm tolerance). The molecular formula of the identified metabolites was further verified through isotopic distribution measurements. Additionally, an in-house fragment spectrum library was employed to enhance the validation of metabolite identification.
Statistical analysis was performed in R (version 4.0.0). The raw metabolite intensity was normalized with the method “medium”, while hierarchical clustering was performed using the pheatmap package. Principal component analysis (PCA) was performed using metaX package. The PLSDA analysis was performed by the R package ropls and the VIP values of each variable were calculated. Correlation analysis was performed with the Pearson correlation coefficient of the cor package. The three conditions of p value < 0.05, difference multiple > 1.2 obtained by t test and VIP calculated by PLSDA analysis simultaneously met the screening of the final metabolites with significant differences.

2.11. Co-Expression Analysis

Co-expression analysis was performed using the weighted gene correlation network analysis (WGCNA) package in R under the guidelines of the published tutorials [12]. Genes with FPKM < 1 in 9 samples were filtered. Hierarchical clustering of the samples was conducted based on Euclidean distances between gene expression data and integrated with the MS2 m/z of cyanidin-3-O-rutinoside, cyanidin, delphinidin-3-rutinoside, and delphinidin 3-glucoside. Outlier samples were removed. Network topology analysis ensured a scale-free topology network with the defined soft-thresholding power of 6, based on the scale-free network principle, where gene co-expression networks follow a power-law distribution characteristic of scale-free networks. A total of 46 modules were identified based on the dynamic tree cutting algorithm with the parameters of min Module Size at 30 and merge Cut Height at 0.25.

2.12. Y2H Assay

The Y2H experiment was conducted with reference to Lim et al. [22]. In the present research, we aimed to identify the possible component of the MBW complex. Considering the relative conservation of the WD40 protein in the complex, WD40 protein TTG1 was determined as bait. In brief, the CDS of TTG1 was cloned into pGBKT7 to generate pGBKT7-TTG1, while the CDS of other candidate genes were cloned into pGADT7 used as prey. The bait and prey were transformed into Y2H Gold yeast strain by CH3COOLi. Transformants were grown on SD/-Leu/-Trp plates and SD/-Ade/-His/-Leu/-Trp plates (containing 5-bromo-4-chloro-3indolyl-α-D-galactopyranoside, X-α-gal (20 μg/mL)). The plates were incubated at 30 °C for 3 days to detect the protein–protein interaction.

2.13. Heatmap Generation and Statistical Analysis

Heatmaps were using TBtools-II V2.127 [23]. The values were obtained using three biological repeats and the scale was normalized to between zero and one. Statistical analyses were performed using SPSS 26.0 software. The significance level was determined using Student’s t-tests at * p < 0.05, ** p < 0.01, and *** p < 0.001.

3. Results

3.1. Phenotypic Characterization and Determination of Total Anthocyanins and Total Flavonoids

To further understand the composition of pigment in petals of Hippeastrum and the expression field of related genes, in the present research, we employed six varieties with distinct color differences in petals, as shown in Figure 1A,B, including ‘Apricot Parfait’, ‘Grand Diva’, ‘Luna’, ‘Pink Rival’, ‘Souvenir’, and ‘Wedding Dance’ (referred to as A, G, L, P, S, and W, respectively, in the figures). The ‘Wedding Dance’, which was colorless and therefore without the obvious anthocyanin accumulation, was considered to be the control group.
Anthocyanin content in the petals of the six varieties ranked from highest to lowest as follows: ‘Grand Diva’, ‘Souvenir’, ‘Pink Rival’, and ‘Apricot Parfait’ (15.36 ± 1.29 nmol/g FW, 4.01 ± 0.28 nmol/g FW, 1.67 ± 0.20 nmol/g FW, 0.45 ± 0.01 nmol/g FW), all of which were significantly higher than ‘Wedding Dance’. In contrast, anthocyanin concentrations in ‘Luna’ and ‘Wedding Dance’ (0.043 ± 0.016 nmol/g FW, 0.074 ± 0.017 nmol/g FW, respectively) showed no significant difference (Figure 1C). Considering flavonoid contents, ‘Grand Diva’ harvested the highest accumulation (3.89 ± 0.45 mg/g FW), followed by ‘Pink Rival’ (1.54 ± 0.25 mg/g FW), ‘Luna’ (0.95 ± 0.05 mg/g FW), and ‘Apricot Parfait’ (0.74 ± 0.03 mg/g FW). ‘Souvenir’ and ‘Wedding Dance’ had the lowest levels of flavonoid (0.32 ± 0.11 mg/g FW, 0.53 ± 0.07 mg/g FW) (Figure 1D).

3.2. Metabolomics Data Analysis

Metabolomics approaches were employed to characterize color variation in Hippeastrum. PLS-DA showed that each variety formed a distinct cluster except for ‘Apricot Parfait’ and ‘Grand Diva’, which were similar (Figure 2A). The predictive power of the PLS-DA was indicated by R2/Q2 values of 0.8727/−0.7515, respectively (Figure 2B). The major sources of variation were defined through comparison with ‘Wedding Dance’ (Figure 2C). This indicated 30 metabolites that were common to every comparison with other varieties. Considering the differentially accumulating metabolites (DAMs), 54, 46, 36, 23, and 26 were uniquely present in ‘Apricot Parfait’, ‘Grand Diva’, ‘Luna’, ‘Pink Rival’, and ‘Souvenir’, respectively, compared with ‘Wedding Dance’ (Figure 2C). Bar chart comparisons with ‘Wedding Dance’ suggested 115, 114, 114, 87, and 78 compounds showed increased levels in ‘Apricot Parfait’, ‘Grand Diva’, ‘Luna’, ‘Pink Rival’, and ‘Souvenir’, respectively, while 157, 175, 144, 89, and 174 compounds showed decreased levels (Figure 2D). KEGG enrichment analysis revealed that DAMs were enriched in the phenylpropanoid biosynthesis pathway in the ‘Apricot Parfait’ vs. ‘Wedding Dance’, ‘Grand Diva’ vs. ‘Wedding Dance’, and ‘Luna’ vs. ‘Wedding Dance’ comparisons (Figure S1). DAMs in all five comparison groups showed enrichment in the flavone and flavonol biosynthesis pathway. In the ‘Pink Rival’, ‘Souvenir’ vs. ‘Wedding Dance’ comparison group, DAMs were enriched in degradation of flavonoids pathway, consistent with the lower total flavonoid content observed in the petals of ‘Pink Rival’ and ‘Souvenir’ (Figure S1).
Focusing on the anthocyanin profiles, these consisted of cyanidin, cyanidin-3-O-rutinoside, delphinidin 3-glucoside, and delphinidin 3-rutinoside. ‘Grand Diva’ possessed a higher accumulation of cyanidin-3-O-rutinoside, delphinidin 3-glucoside, and delphinidin 3-rutinoside but less cyanidin compared to other varieties. ‘Souvenir’ accumulated more cyanidin and delphinidin 3-glucoside while ‘Pink Rival’ contained more delphinidin 3-rutinoside than other varieties (Figure 2E–H). Flavonoids detected in the metabolomics data included quercetin-3-O-bata-glucopyranoside, kaempferol 3-O-[2″-O-(glucopyranoside)]-rhamnopyranoside, isorhamnetion-3-O-rutinoside, quercetin 3-O-rutinoside, and kaempferol 3-rhamno-glucoside (Figure S2).

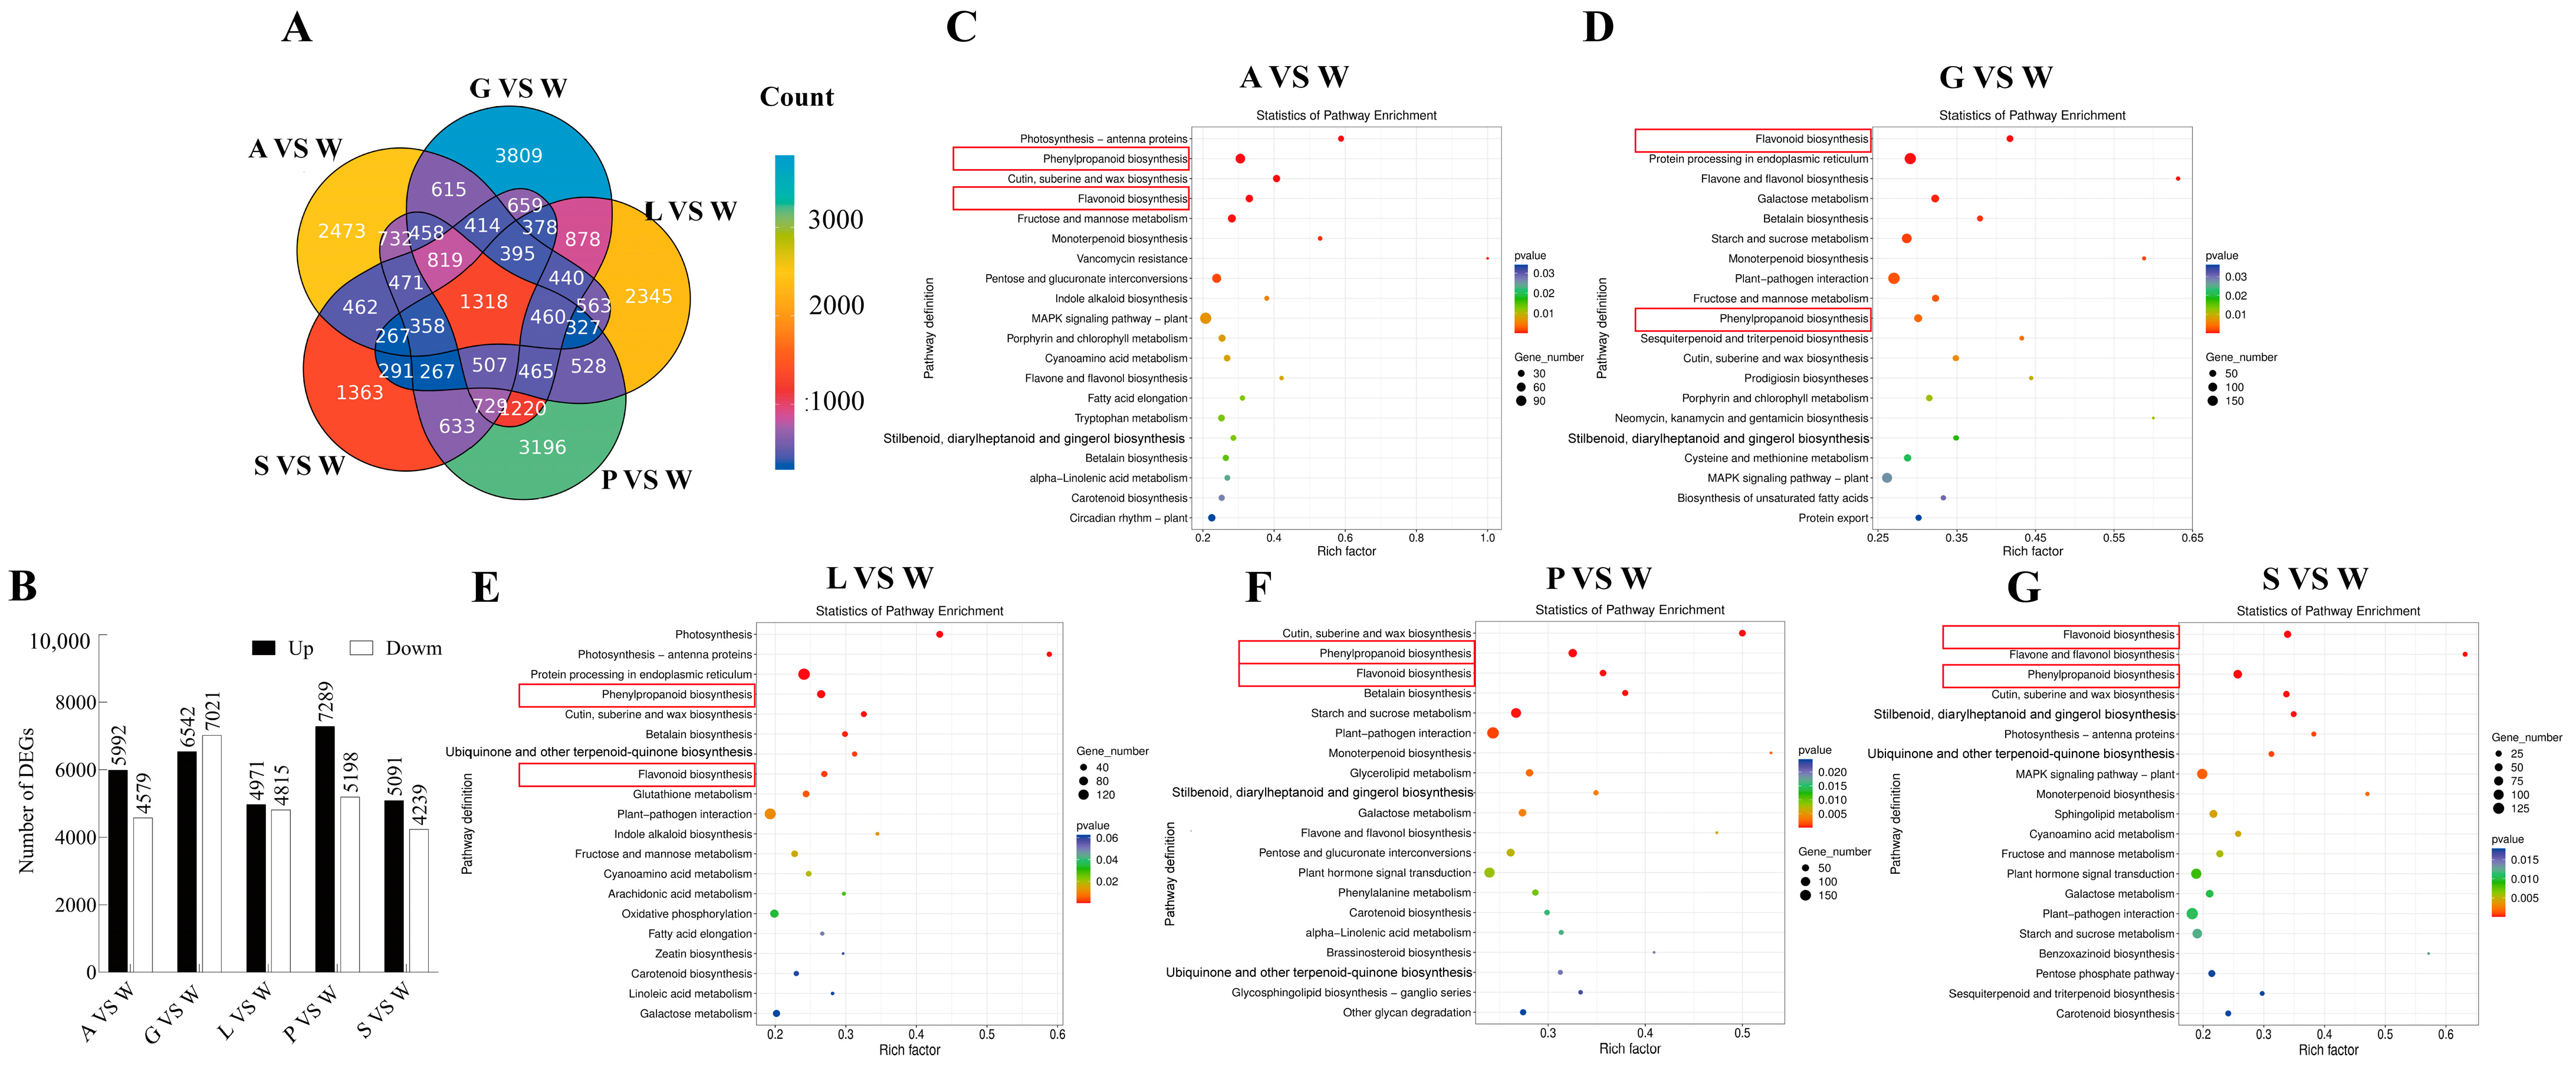
3.3. RNA High-Throughput Sequencing Data Analysis

Subsequently, RNA-Seq technology was employed to further analyze the relationship between anthocyanin accumulation and transcriptional control. When compared to ‘Wedding Dance’, a total of 1318 differentially expressed genes (DEGs) were common to all comparison groups, whereas 2473, 3809, 2345, 3196, and 1363 DEGs were unique to ‘Apricot Parfait’, ‘Grand Diva’, ‘Luna’, ‘Pink Rival’, and ‘Souvenir’ comparisons (Figure 3A). Bar plots of comparisons to ‘Wedding Dance’ suggested 5992, 6542, 4971, 7289, and 5910 up-regulated DEGs with ‘Apricot Parfait’, ‘Grand Diva’, ‘Luna’, ‘Pink Rival’, and ‘Souvenir’, respectively, and the number of down-regulated DEGs were 4579, 7021, 4815, 5198, and 4239, respectively (Figure 3B). KEGG enrichment analysis of DEGs revealed enrichment in flavonoids biosynthesis, phenylpropanoid biosynthesis, and flavone and flavonol biosynthesis pathways across all comparison groups, except for the ‘Luna’ vs. ‘Wedding Dance’ group, where there was no enrichment in the flavone and flavonol biosynthesis pathway (Figure 3C–G).

3.4. Analysis of the Expression Profiles of Genes Involved in the Anthocyanin Biosynthesis Pathway

Previous research has established that PAL, C4H, 4CL are involved in core phenylpropanoid biosynthesis whilst CHI, F3H, F3′H, FLS control flavonoid biosynthesis and are EBGs (early biosynthesis genes) in the anthocyanin biosynthesis pathway. DFR, ANS, UFGT, OMT are LBGs (later biosynthesis genes), involved in the accumulation of anthocyanin (Figure 4A). FPKM values for these genes were isolated from RNA-Seq data and used to generate a heatmap (Figure 4B) and also by qRT-PCR assessment of gene expression in the petals of six Hippeastrum cultivars (Figure 4C–N). The qRT-PCR results were basically consistent with the transcriptome sequencing results.

3.5. Integrated Analysis of Transcriptomics and Metabolomics

DEGs and DAMs were integrated to identify events occurring within the same pathway. DEGs and DAMs were co-enriched in 63, 61, 54, 32, and 48 KEGG pathways, respectively (Figure S3). Bubble chart based on the KEGG pathway enrichments targeted anthocyanin, flavonoids, phenylpropanoid, and flavone and flavonol biosynthesis (Figure S3). The importance of these pathways was further highlighted in network plots based on the DEGs and DAMs (Figure S3).
We next conducted a weighted gene co-expression network analysis (WGCNA), based on the levels of four anthocyanins and transcriptome data (Figure 5A), where the plateau threshold was set to 0.85, and the soft threshold (β value) was set to 6 (Figure 5B). Figure 5C,D shows the clustering relationships among genes based on topological overlap matrix whilst Figure 5E considered module–trait relationships based on targeted anthocyanin abundance and gene expression (correlation coefficient > 0.5, p ≤ 0.01). Modules 3, 1, 4, and 2 significantly positively correlated the anthocyanins while 3, 1, 2, and 5 modules showed negative correlations. A total of 47 meaningful modules were identified. When screening using an absolute correlation metric > 0.5 and statistical test p-value ≤ 0.01, modules 4, 2, 8, 5, 5, and 3 showed a significant positive correlation with the varieties data (Figure 5E). Additionally, the 1, 2, and 2 modules showed significant negative correlations with ‘Apricot Parfait’, ‘Grand Diva’, and ‘Wedding Dance’ data, while no modules exhibited a significant negative correlation with ‘Luna’, ‘Pink Rival’, and ‘Souvenir’ data.
KEGG enrichment analysis identified three modules enriched in the flavonoid biosynthesis pathway: the blue, dark olive green, and orange modules (Figure 6A–C). Subsequently, we selected the modules with the strongest positive and negative correlations with discrete anthocyanins and gene expression levels in the petals of different flower varieties. The gene expression patterns were indicated by heatmaps (Figure 6D–I).
The strongest positive correlation in the blue module were with cyanidin-3-O-rutinoside and delphinidin-3-O-glucoside (Figure 6D), the midnight blue module with cyanidin (Figure 6E), and the magenta module with delphinidin-3-O-rutinoside abundance (Figure 6F). Considering negative correlations, the steel blue module was related to the abundance of cyanidin-3-O-rutinoside and delphinidin-3-O-glucoside (Figure 6G), the dark turquoise module with cyanidin (Figure 6H), and the dark olive green with delphinidin-3-O-rutinoside abundance (Figure 6I).

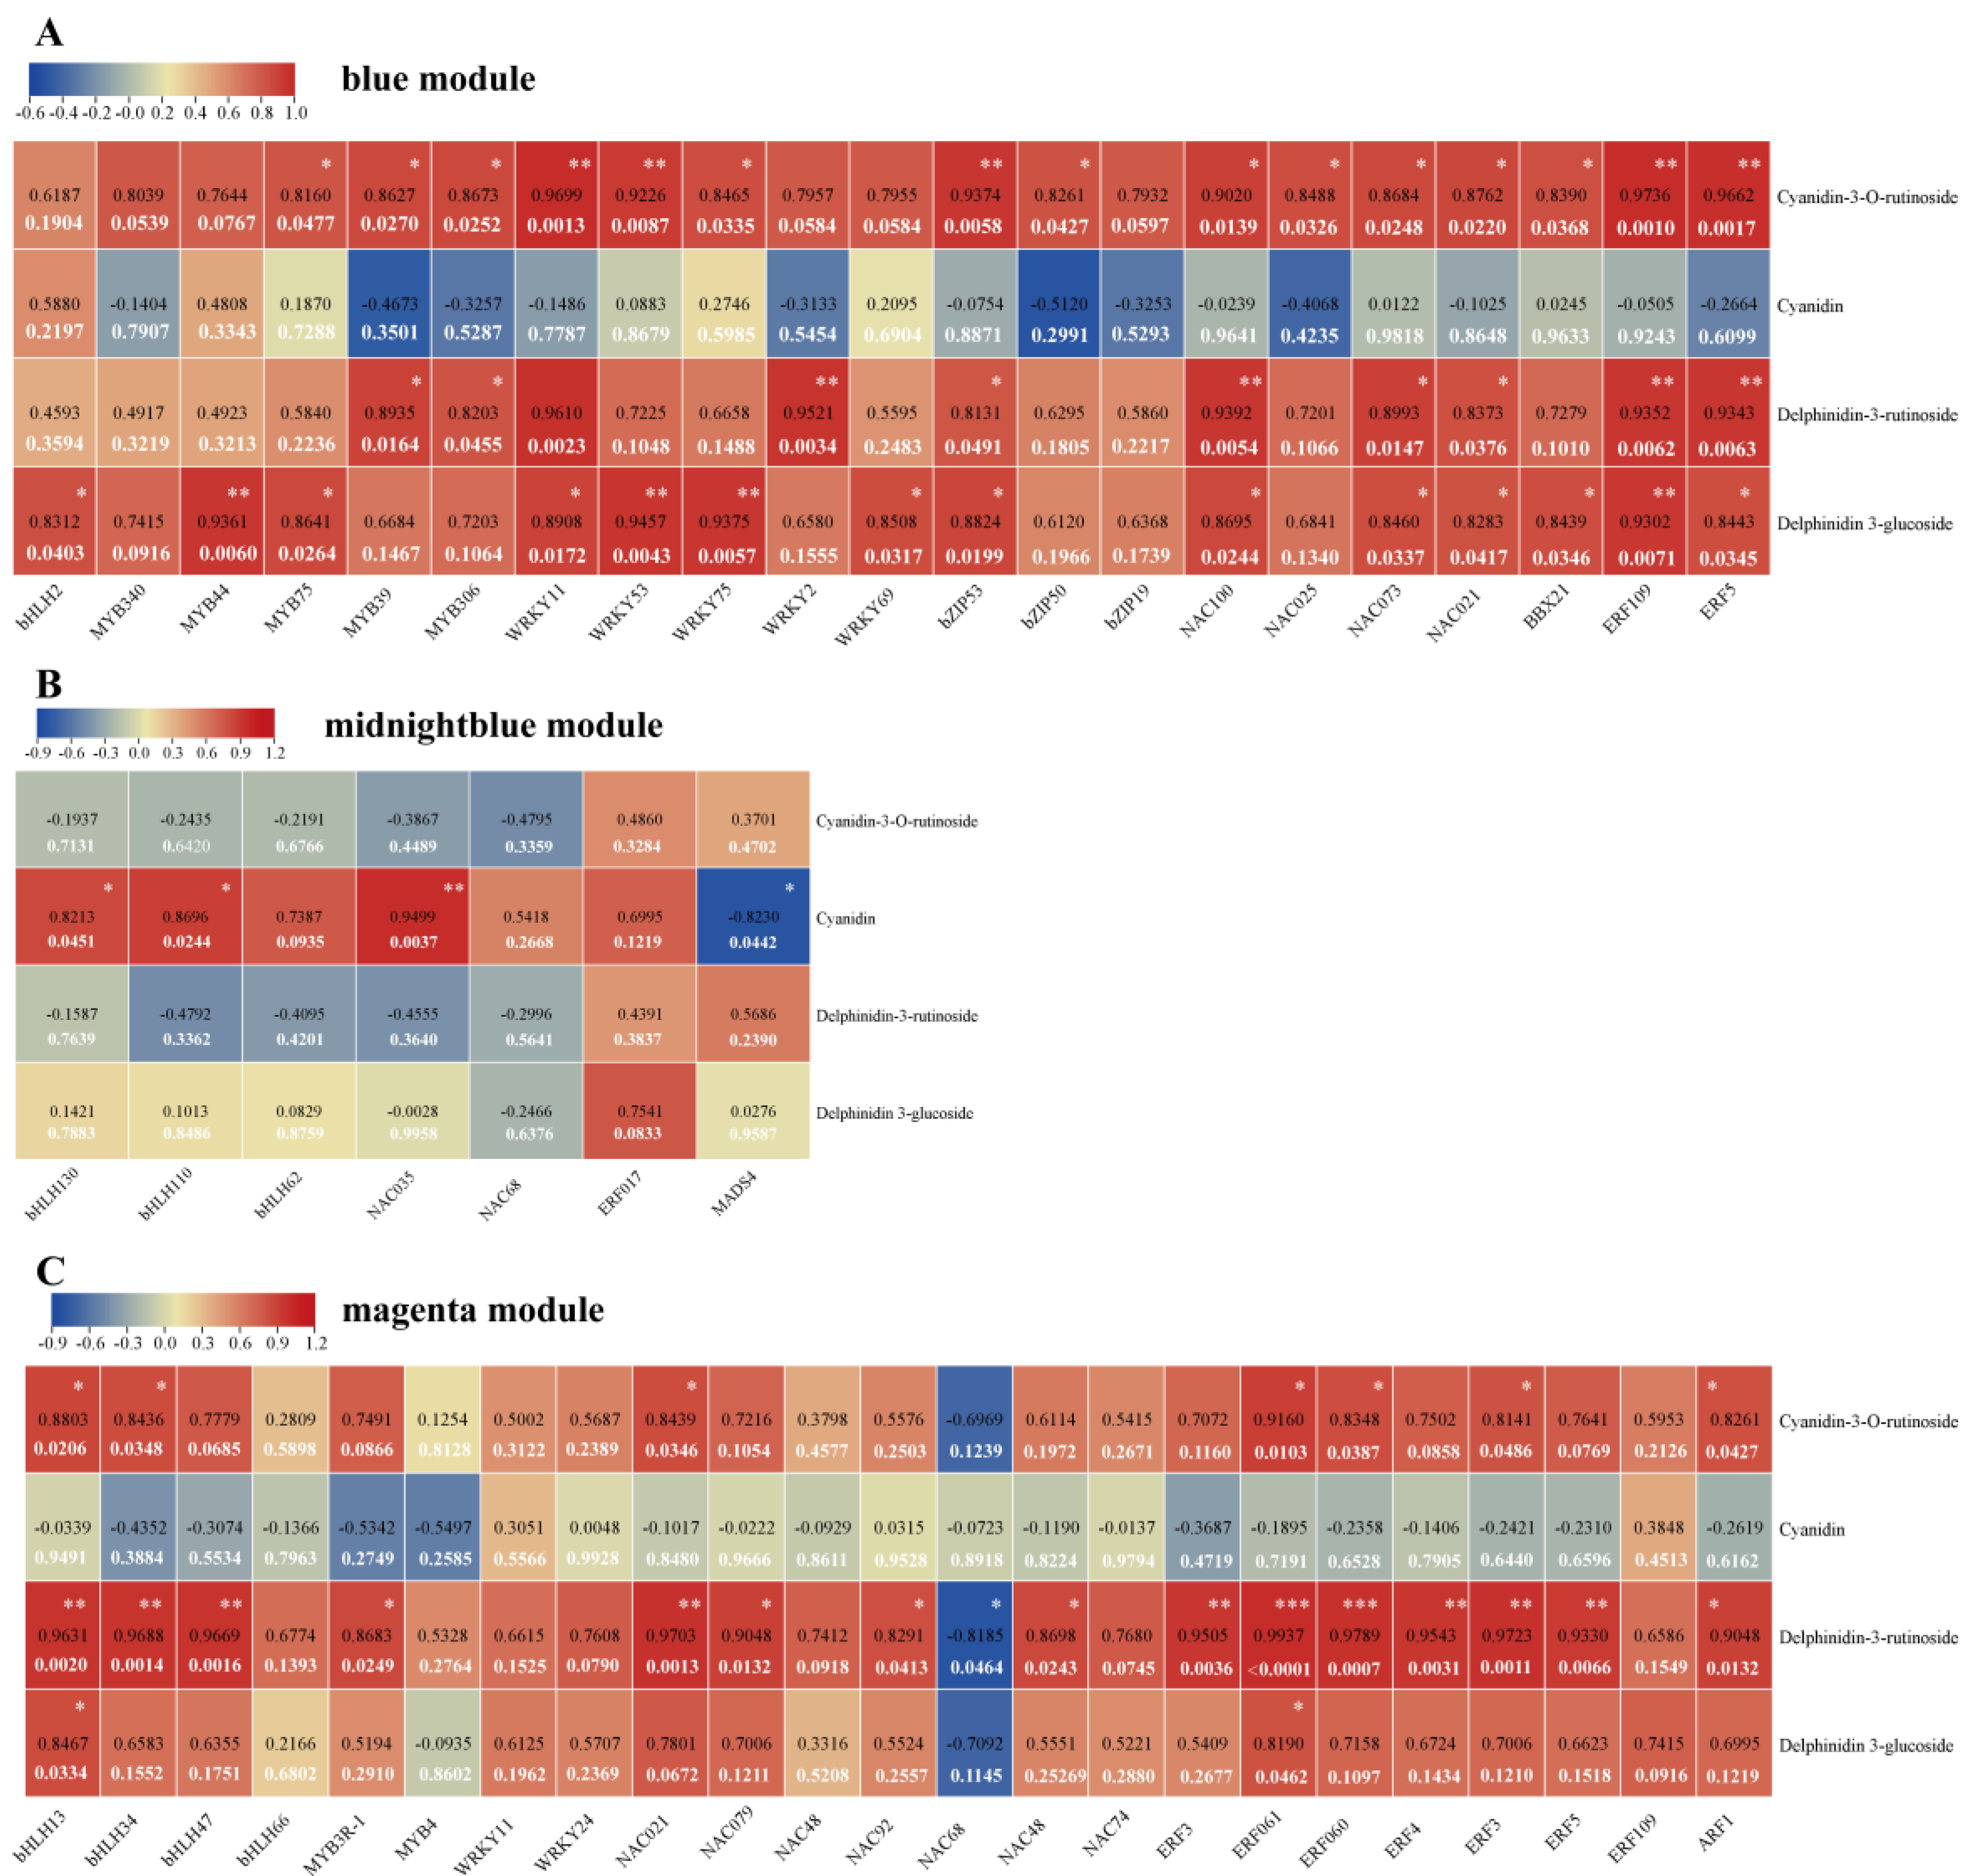
3.6. Targeting of Transcription Factors Involved in Biosynthesis of Flavonoids and Anthocyanins

The targeting of key regulatory transcription factors (TFs) will allow for an understanding of the regulation of flavonoid and anthocyanin biosynthesis in Hippeastrum hybridum. Based on the module–trait relationship heatmap (Figure 7E), we selected transcription factors from the three modules most positively correlated with the abundances of the four anthocyanins. Their expression in the different varieties is shown in Figure 7A–C (blue module, midnight module, and magenta modules, respectively) as indicated from the transcriptome data. In the blue module, all of the TFs were highly expressed in ‘Grand Diva’, but all other TFs were relatively poorly expressed (Figure 7A). With the midnight blue module, TF expression was highest in ‘Souvenir’, except for MADS4. With the magenta module, most of the TF was highly expressed in ‘Grand Diva’, and also ‘Pink Rival’ (Figure 7C).
To validate these observations, qRT-PCR assessments of the expression patterns of eight TFs were undertaken based on RNA extracted from the petals of six varieties (Figure 7D–K). The expression patterns of these TF genes were largely consistent with the transcriptome data.
Based on the accumulation of four metabolites and the transcript level of genes, the correlation analysis was performed between the accumulation of four metabolites and genes clustered in three modules involved in Figure 7, including the blue module (Figure 8A), midnight blue module (Figure 8B), and magenta module (Figure 8C).
In the blue module, it was shown that 3 MYBs, 3 WRKYs, 2 bZIPs, 4 NACs, 1 BBX, and 2 ERFs were (significantly) correlated with the content of cyanidin-3-O-rutinoside. It was seen that 2 MYBs, 1 WRKY, 1 bZIP, 3 NACs, and 2 ERFs have remarkable relevance with the content of delphinidin-3-rutinoside. In addition, 1 bHLH, 2 MYBs, 4 WRKYs, 1 bZIP, 3 NACs, 1 BBX, and 2 ERFs were (significantly) related to the accumulation of delphinidin 3-glucoside. Among all these TFs, MYB75, MYB39, bZIP53, NAC100, NAC073, NAC21, BBX21, ERF109, and ERF5 possessed the evident correlation with at least two metabolites, indicating that these TFs possibly participated in the regulation of biosynthesis of these metabolites. Similarly, in the midnight blue module, bHLH110, bHLH130, NAC035, and MADS4 governed a dramatical relationship with the accumulation of cyanidin. It is worth noting that MADS4 exhibited significant negative relationship with the content of cyanidin. Furthermore, in the magenta module, 2 bHLHs, 1 NAC, 3 ERFs, and 1 ARF were significantly involved in the accumulation of cyanidin-3-O-rutinoside. 3 bHLHs, 1 MYB, 5 NACs, 6 ERFs and 1 ARF were sensibly involved in the accumulation of delphinidin-3-rutinoside, while only 1 bHLH and 1 ERF were memorably related to the content of delphinidin 3-glucoside. Among all these TFs, bHLH13, bHLH34, NAC021, ERF3/060/061, and ARF1 were engaged in the accumulation of at least two metabolites. It should be noted that NAC68 was evidently negatively related to the content of delphinidin-3-rutinoside.

3.7. Identification of Potential Component of MBW Complex

In the present research, the TTG1, WD40 protein of the MBW (MYB-bHLH-WD40) complex, was employed as bait protein and the Y2H was performed to isolate the possible interacted transcription factor, which had the ability to form the MBW complex. The Y2H assay illustrated that TTG1 has the ability to interact with the MYB transcription factors MYB39, MYB44, MYB306, and MYB3, and the bHLH transcription factors bHLH13, bHLH110, and bHLH34 (Figure 9). These results suggest that these transcription factors have the potential to form the MBW complex. In addition, we identified that BBX21, which has been identified as the positive regulator involved in the biosynthesis of anthocyanin, enabled the interaction with TTG1 (Figure 9).

4. Discussion

Petal color is a key trait of flowering plants and also provides an economic and ornamental value to flowers, particularly ornamental varieties [24]. Whilst chlorophyll [25] and carotenoids [26] are significant in defining colors, anthocyanins play a key role and can confer purple, red, and pink coloration [27].
Hippeastrum plays a significant role in ornamental horticulture, cut flowers, and landscape design. Of the six commercially relevant varieties selected for this study, the total anthocyanin content in the petals of the control group, ‘Wedding Dance’, was only 0.074 ± 0.017 nmol/g FW. In contrast, the total anthocyanin content in ‘Grand Diva’ was significantly higher than in the other five varieties, reaching 15.36 ± 1.29 nmol/g FW, over 200 times that of the control. The total anthocyanin content in the petals of ‘Souvenir’, although second only to ‘Grand Diva’, was only about one-tenth of that in ‘Grand Diva’. Furthermore, the measurement of total flavonoid content showed that the total flavonoid content in the petals of ‘Grand Diva’ (3.89 ± 0.45 mg/g FW) was significantly higher than in the other five varieties, approximately 7.3 times that of the petals of ‘Wedding Dance’ (0.53 ± 0.07 mg/g FW). Additionally, the total flavonoid content in the petals of ‘Apricot Parfait’, ‘Grand Diva’, and ‘Pink Rival’ was also higher than that in the control group. Subsequently, we explored two cyanidins, cyanidin and cyanidin-3-O-rutinoside, and two delphinidins, delphinidin 3-glucoside and delphinidin 3-rutinoside, from the metabolomic data. These results indicate that the anthocyanins in the petals of Hippeastrum were mainly cyanidins and delphinidin.
The analysis of DAMs can be achieved through metabolomics techniques [28], while differences in gene expression levels can be assessed using high-throughput transcriptome sequencing [29]. Researchers are now increasingly adopting an integrated approach by combining multiple omics technologies, such as transcriptomics, metabolomics, proteomics, and phosphoproteomics. This integration has played a crucial role in advancing the depth of our understanding of a particular phenomenon [30]. Several studies have reported the use of integrated transcriptomics and metabolomics analyses to elucidate the regulatory mechanisms underlying the accumulation of flavonoids, anthocyanins, and other related compounds. For example, integrated transcriptomic and metabolomic analyses have shown that potassium (K) treatment can alleviate the inhibitory effect of nitrogen (N) treatment on genes regulating the anthocyanin biosynthesis pathway [31]. In rabbit eye blueberry (Vaccinium ashei Reade), combined transcriptomic and metabolomic analyses identified VcF3′5′H4 as a key gene associated with anthocyanin accumulation, and revealed the regulatory role of bHLH004 in the anthocyanin biosynthesis process [32]. Integrated transcriptomic and metabolomic analysis also revealed that anthocyanins played a dominant role in color changes during plum maturation, whereas carotenoids do not play a significant role [33]. In this study, we performed a WGCNA analysis based on the abundance of four anthocyanin compounds selected from the metabolomic data and the transcriptome sequencing results. The results of the WGCNA analysis revealed a total of 47 meaningful modules. Among them, the genes enriched in the blue module showed the strongest positive correlation with the content of cyanidin-3-O-rutinoside and delphinidin-3-glucoside. Additionally, the genes enriched in the midnight blue and magenta modules exhibited a significant positive correlation with the accumulation of cyanidin and delphinidin-3-rutinoside. These results suggest that the genes within these modules may have a significant positive correlation with the synthesis and accumulation of the four anthocyanin compounds, making them potential target gene sets for further research. Furthermore, KEGG pathway enrichment analysis based on the WGCNA results revealed that genes within the blue, dark olive green, and orange modules were enriched in the flavonoid biosynthesis pathway. This finding suggests that genes in these modules may be associated with the accumulation of flavonoids and anthocyanins.
TF regulation of the biosynthesis of flavonoids and anthocyanins has been extensively characterized as indicated in the following exemplar studies. In cultivated strawberries (Fragaria × ananassa), MYB5 induced the expression of F3′H and LAR, and interacted with EGL3 and FaLWD1t to form an MBW (MYB-bHLH-WDR) complex, positively regulating the biosynthesis of anthocyanin and proanthocyanidin [34]. In Dendrobium candidum, the bHLH TF TT8 binds to promoters of F3′H and UFGT, to influence the accumulation of anthocyanin [35]. Overexpression of Malus domestica WRKY75 enhanced the biosynthesis of anthocyanins through interaction with the MdMYB1 promoter [36]. Heterologous expression of GbbZIP08 (Ginkgo biloba) in tobacco exhibited the increased levels of total flavonoids, kaempferol, and anthocyanin [37]. IbBBX29 interacted with IbMYB308L and IbBBX29 to target the promoters of IbCHS and IbCHI to drive flavonoid biosynthesis in sweet potato (Ipomoea batatas) [38]. Silencing of TDR4 mediated by VIGS in bilberry (Vaccinium myrtillus) repressed the accumulation of anthocyanin via reduced expression of CHS and MYB2 [39]. AtARF2 functioned as a positive regulator in flavonol and proanthocyanidin levels by targeting MYB12 and FLS on the flavonoid biosynthesis pathway and interacted with TT2 on the proanthocyanidin pathway [40]. Overexpression of ERF003 (from Citrus sinensis) in ‘Micro-Tom’ tomato led the obvious enhanced accumulation of naringeninchalcone and kaempferolrutinoside [41]. Over-expression of NAC52 in apple calli led to the accumulation of more anthocyanin. NAC52 is targeted directly by HY5 (ELONGATED HYPOCOTYLS TF) and binds to the promoters of MdMYB9 and MdMYB11 as well as those of leucoanthocyanidin reductase (LAR) to influence the proanthocyanidin metabolism [42].
Such observations highlight the importance of defining Hippeastrum TFs that control the patterns of anthocyanin accumulation that we saw in the six varieties. To do this, we used WGCNA analysis, to integrate metabolite and gene expression data to describe distinct co-regulatory modules. Then, TFs were targeted within blue, midnight blue, and magenta modules, identifying members from nine transcription factor families, including MYB and bHLH. The modules broadly reflected discrete TF driving had higher expression levels in the petals of ‘Grand Diva’ (blue module), ‘Souvenir’ (midnight blue module), or ‘Grand Diva’ and ‘Pink Rival’ (magenta module). The targeted TFs included MYB44, bHLH2 [43], MYB39 [44], MYB3 [45], WRKY75 [46], MYB75 [47], BBX21 [48], ERF109 [49], ERF5 [50], and WRKY11 [51], which have been shown to influence the biosynthesis of flavonoids and anthocyanins. In addition, it has been illustrated that the MBW complex played a positive role in the accumulation of anthocyanin [52,53,54]. In the present research, the WD40 protein TTG1 was used as bait protein to perform the Y2H assay. The clustered transcription factors including MYBs, bHLHs, and other TFs identified the protein–protein interaction. The results show that the physical interaction between TTG1 and MYB39, MYB44, MYB306, MYB3 and bHLH13, bHLH110, bHLH34, illustrate that these transcription factors processed the possibility to form the MBW complex. It is worth noting that TTG1 had the ability to interact with BBX transcription factor BBX21, which was identified as the positive regulator involved in the biosynthesis of anthocyanin [48], demonstrating the potential relationship between the MBW complex and the BBX transcription factor. Up to now, we identified four MYB and three bHLH transcription factors which have the ability to interact with TTG1, illustrating the possibility to form the MBW complex presumably involved in the regulation of anthocyanin. However, it is particularly important to emphasize that the functional characterization of these transcription factors was necessary and we will perform the related experiments for the functional identification.
Moreover, the correlation analyses between the accumulation of four metabolites and the transcript level of genes clustered in three modules were also performed. The results show that some TFs were significantly correlated with the accumulation of these four metabolites. WRKY11/53, bZIP53, and ERF109/5 were extremely significantly related to the accumulation of cyanidin-3-O-rutinoside (p < 0.01). NAC35 was exceedingly positively involved in the accumulation of cyanidin while MADS4 was remarkably negatively related to cyanidin. WRKY2, NAC100, ERF109/5, bHLH13/34/47, NAC21, and ERF3/4/5/60/61 were strikingly involved in the accumulation of delphinidin-3-rutinoside, while MYB44, WRKY53/75, and ERF109 exhibited an exceptionally significant relationship with the content of delphinidin 3-glucoside. In previous research, it was identified that WRKY11, WRKY53, WRKY75, bZIP53, bHLH34, ERF5, ERF4, ERF3, and ERF109 were involved in the biosynthesis of anthocyanin, indicating that these TFs were significantly correlated to the accumulation of anthocyanin and appearance of the petals’ color. In further research, we will explore the biological function of these TFs and analyze whether these TFs enable the marker genes for color breeding.

5. Conclusions

Collectively, at present, we collected six Hippeastrum hybridum cultivars including ‘Apricot Parfait’, ‘Grand Diva’, ‘Luna’, ‘Pink Rival’, ‘Souvenir’, and ‘Wedding Dance’, and transcriptome sequencing technology and metabolome sequencing technology were employed to clarify the accumulation of anthocyanin. Four key anthocyanins were identified: cyanidin, cyanidin-3-O-rutinoside, delphinidin-3-glucoside, and delphinidin-3-rutinoside. Weighted gene co-expression network analysis (WGCNA) correlated the abundance of these four anthocyanins with transcriptomic data, to suggest three regulatory modules. Nine transcription factors families in these modules were identified and some of them were validated using qRT-PCR. The Y2H assay isolated some transcription factors interacted with TTG1 (WD40 protein), including MYB3/39/44/306 and bHLH13/34/110, illustrating the possibility of forming MBW complexes. Moreover, we also performed the correlation analysis between the abundance of four metabolites and transcript level TFs in three modules clustered by WGCNA analyses, isolating some TFs which exhibited evidently positive correlation with the accumulation of four metabolites. Our study provides a preliminary characterization of anthocyanin composition. These findings laid a theoretical foundation for future research on the regulatory mechanisms of pigment accumulation and the breeding of Hippeastrum cultivars with novel petal colors.

Supplementary Materials

The following supporting information can be downloaded at: https://www.mdpi.com/article/10.3390/agronomy15071722/s1, Supplementary Table S1. DAMs. Supplementary Table S2. DEGs. Supplementary Table S3. KEGG enrichment of DAMs. Supplementary Table S4. KEGG enrichment of DEGs. Figure S1. The KEGG enrichment targeted by comparisons of, respectively, ‘Apricot Parfait’, ‘Grand Diva’, ‘Luna’, ‘Pink Rival’, and ‘Souvenir’ vs. ‘Wedding Dance’. Figure S2. The levels of metabolites (based on m/z abundance) from metabolomic data. Figure S3. Integrative analysis of transcriptomic and metabolomic data of pathways linked to anthocyanin biosynthesis in Hippeastrum. Figure S4. The correlation analysis between accumualtion of 4 metabolites and 12 structural genes.

Author Contributions

X.C. and P.G. designed the project. P.G., C.X., J.Y., J.X., B.D., Z.H., G.C. and X.Z. performed the experiments. P.G. wrote the manuscript and L.A.J.M. modified the manuscript. All authors have read and agreed to the published version of the manuscript.

Funding

This work was supported by Platform Development and Scientific & Technological Capability Enhancement for Beijing Bulb Flowers Industrial Technology Research Institute (CYJS202502) and Science and Technology innovation capacity building project of BAAFS (KJCX20240316).

Data Availability Statement

All relevant data are included within the article and its Supplemental Files.

Conflicts of Interest

All authors have read and approved this version of the article, and due care has been taken to ensure the integrity of this work. All the authors have declared no conflicts of interest.

References

  1. Read, V.M. Hippeastrum: The Gardener’s Amaryllis; Timber Press: Portland, OR, USA, 2004. [Google Scholar]
  2. van der Kooi, C.J.; Wilts, B.D.; Leertouwer, H.L.; Staal, M.; Elzenga, J.T.M.; Stavenga, D.G. Iridescent flowers? Contribution of surface structures to optical signaling. New Phytol. 2014, 203, 667–673. [Google Scholar] [CrossRef] [PubMed]
  3. Kay, Q.; Daoud, H.; Stirton, C. Pigment distribution, light reflection and cell structure in petals. Bot. J. Linn. Soc. 1981, 83, 57–83. [Google Scholar] [CrossRef]
  4. Delgado-Vargas, F.; Jiménez, A.R.; Paredes-López, O. Natural pigments: Carotenoids, anthocyanins, and betalains–characteristics, biosynthesis, processing, and stability. Crit. Rev. Food Sci. Nutr. 2000, 40, 173–289. [Google Scholar] [CrossRef]
  5. Yan, H.; Pei, X.; Zhang, H.; Li, X.; Zhang, X.; Zhao, M.; Chiang, V.L.; Sederoff, R.R.; Zhao, X. MYB-mediated regulation of anthocyanin biosynthesis. Int. J. Mol. Sci. 2021, 22, 3103. [Google Scholar] [CrossRef]
  6. Alexandersson, R.; Johnson, S.D. Pollinator-mediated selection on flower-tube length in a hawkmoth-pollinated Gladiolus (Iridaceae). Proc. Biol. Sci. 2002, 269, 631–636. [Google Scholar] [CrossRef]
  7. Sunil, L.; Shetty, N.P. Biosynthesis and regulation of anthocyanin pathway genes. Appl. Microbiol. Biotechnol. 2022, 106, 1783–1798. [Google Scholar] [CrossRef]
  8. Hong, J.; Yang, L.; Zhang, D.; Shi, J. Plant metabolomics: An indispensable system biology tool for plant science. Int. J. Mol. Sci. 2016, 17, 767. [Google Scholar] [CrossRef]
  9. Li-Beisson, Y.; Hirai, M.Y.; Nakamura, Y. Plant metabolomics. J. Exp. Bot. 2024, 75, 1651–1653. [Google Scholar] [CrossRef]
  10. Zhang, J.; Wang, N.; Chen, W.; Zhang, W.; Zhang, H.; Yu, H.; Yi, Y. Integrated metabolomics and transcriptomics reveal metabolites difference between wild and cultivated Ophiocordyceps sinensis. Food Res. Int. 2023, 163, 112275. [Google Scholar] [CrossRef]
  11. Xu, C.; Gui, Z.; Huang, Y.; Yang, H.; Luo, J.; Zeng, X. Integrated transcriptomics and metabolomics analyses provide insights into Qingke in response to cold stress. J. Agric. Food Chem. 2023, 71, 18345–18358. [Google Scholar] [CrossRef]
  12. Langfelder, P.; Horvath, S. WGCNA: An R package for weighted correlation network analysis. BMC Bioinform. 2008, 9, 559. [Google Scholar] [CrossRef]
  13. Gou, N.; Chen, C.; Huang, M.; Zhang, Y.; Bai, H.; Li, H.; Wang, L.; Wuyun, T. Transcriptome and metabolome analyses reveal sugar and acid accumulation during Apricot fruit development. Int. J. Mol. Sci. 2023, 24, 16992. [Google Scholar] [CrossRef]
  14. Liang, J.; Zhang, G.; Song, Y.; He, C.; Zhang, J. Targeted metabolome and transcriptome analyses reveal the pigmentation mechanism of Hippophae (Sea Buckthorn) Fruit. Foods 2022, 11, 3278. [Google Scholar] [CrossRef] [PubMed]
  15. Fang, S.; Lin, M.; Ali, M.M.; Zheng, Y.; Yi, X.; Wang, S.; Chen, F.; Lin, Z. LhANS-rr1, LhDFR, and LhMYB114 regulate anthocyanin biosynthesis in flower buds of Lilium ‘Siberia’. Genes 2023, 14, 559. [Google Scholar] [CrossRef] [PubMed]
  16. Li, J.; Wu, K.; Li, L.; Ma, G.; Fang, L.; Zeng, S. Identification of HpMYB1 inducing anthocyanin accumulation in Hippeastrum hybridum tepals by RNA-seq. BMC Plant Biol. 2023, 23, 594. [Google Scholar] [CrossRef] [PubMed]
  17. Anwar, M.; Yu, W.; Yao, H.; Zhou, P.; Allan, A.C.; Zeng, L. NtMYB3, an R2R3-MYB from Narcissus, regulates flavonoid biosynthesis. Int. J. Mol. Sci. 2019, 20, 5456. [Google Scholar] [CrossRef]
  18. Zhang, H.; Wang, J.; Tian, S.; Hao, W.; Du, L. Two B-Box proteins, MaBBX20 and MaBBX51, coordinate light-induced anthocyanin biosynthesis in grape Hyacinth. Int. J. Mol. Sci. 2022, 23, 5678. [Google Scholar] [CrossRef]
  19. Koyama, T.; Sato, F. The function of ETHYLENE RESPONSE FACTOR genes in the light-induced anthocyanin production of Arabidopsis thaliana leaves. Plant Biotechnol. 2018, 35, 87–91. [Google Scholar] [CrossRef]
  20. Salas, E.; Dueñas, M.; Schwarz, M.; Winterhalter, P.; Cheynier, V.; Fulcrand, H. Characterization of pigments from different high speed countercurrent chromatography wine fractions. J. Agric. Food Chem. 2005, 53, 4536–4546. [Google Scholar] [CrossRef]
  21. Livak, K.J.; Schmittgen, T.D. Analysis of relative gene expression data using real-time quantitative PCR and the 2(-Delta Delta C(T)) method. Methods 2001, 25, 402–408. [Google Scholar] [CrossRef]
  22. Lim, S.H.; Kim, D.H.; Lee, J.Y. RsTTG1, a WD40 protein, interacts with the bHLH transcription factor RsTT8 to regulate anthocyanin and proanthocyanidin biosynthesis in Raphanus sativus. Int. J. Mol. Sci. 2022, 23, 11973. [Google Scholar] [CrossRef] [PubMed]
  23. Chen, C.; Wu, Y.; Li, J.; Wang, X.; Zeng, Z.; Xu, J.; Liu, Y.; Feng, J.; Chen, H.; He, Y.; et al. TBtools-II: A “one for all, all for one” bioinformatics platform for biological big-data mining. Mol. Plant 2023, 16, 1733–1742. [Google Scholar] [CrossRef] [PubMed]
  24. Parrish, S.B.; Paudel, D.; Deng, Z. Transcriptome analysis of Lantana camara flower petals reveals candidate anthocyanin biosynthesis genes mediating red flower color development. G3 Genes Genomes Genet. 2023, 14, jkad259. [Google Scholar] [CrossRef]
  25. Ohmiya, A.; Hirashima, M.; Yagi, M.; Tanase, K.; Yamamizo, C. Identification of genes associated with chlorophyll accumulation in flower petals. PLoS ONE 2014, 9, e113738. [Google Scholar] [CrossRef]
  26. Iglesias-Sanchez, A.; Navarro-Carcelen, J.; Morelli, L.; Rodriguez-Concepcion, M. Arabidopsis FIBRILLIN6 influences carotenoid biosynthesis by directly promoting phytoene synthase activity. Plant Physiol. 2024, 194, 1662–1673. [Google Scholar] [CrossRef]
  27. van der Kooi, C.J.; Stavenga, D.G. Vividly coloured poppy flowers due to dense pigmentation and strong scattering in thin petals. J. Comp. Physiol. A Neuroethol. Sens. Neural Behav. Physiol. 2019, 205, 363–372. [Google Scholar] [CrossRef]
  28. de Moraes Pontes, J.G.; da Silva Pinheiro, M.S.; Fill, T.P. Unveiling chemical interactions between plants and fungi using metabolomics approaches. Adv. Exp. Med. Biol. 2023, 1439, 1–20. [Google Scholar]
  29. Hrdlickova, R.; Toloue, M.; Tian, B. RNA-Seq methods for transcriptome analysis. Wiley Interdiscip. Rev. RNA 2017, 8, e1364. [Google Scholar] [CrossRef]
  30. Singh, K.S.; van der Hooft, J.J.J.; van Wees, S.C.M.; Medema, M.H. Integrative omics approaches for biosynthetic pathway discovery in plants. Nat. Prod. Rep. 2022, 39, 1876–1896. [Google Scholar] [CrossRef]
  31. Sharma, S.; Kumar, A.; Singh, D.; Kumari, A.; Kapoor, P.; Kaur, S.; Shreon, B.; Garg, M. Integrated transcriptional and metabolomics signature pattern of pigmented wheat to insight the seed pigmentation and other associated features. Plant Physiol. Biochem. 2022, 189, 59–70. [Google Scholar] [CrossRef]
  32. Guo, X.; Shakeel, M.; Wang, D.; Qu, C.; Yang, S.; Ahmad, S.; Song, Z. Metabolome and transcriptome profiling unveil the mechanisms of light-induced anthocyanin synthesis in rabbiteye blueberry (vaccinium ashei: Reade). BMC Plant Biol. 2022, 22, 223. [Google Scholar] [CrossRef]
  33. Rodríguez-Lorenzo, M.; Mauri, N.; Royo, C.; Rambla, J.L.; Diretto, G.; Demurtas, O.; Hilbert, G.; Renaud, C.; Tobar, V.; Huete, J.; et al. The flavour of grape colour: Anthocyanin content tunes aroma precursor composition by altering the berry microenvironment. J. Exp. Bot. 2023, 74, 6369–6390. [Google Scholar] [CrossRef] [PubMed]
  34. Naik, J.; Rajput, R.; Pucker, B.; Stracke, R.; Pandey, A. The R2R3-MYB transcription factor MtMYB134 orchestrates flavonol biosynthesis in Medicago truncatula. Plant Mol. Biol. 2021, 106, 157–172. [Google Scholar] [CrossRef] [PubMed]
  35. Jia, N.; Wang, J.J.; Liu, J.; Jiang, J.; Sun, J.; Yan, P.; Sun, Y.; Wan, P.; Ye, W.; Fan, B. DcTT8, a bHLH transcription factor, regulates anthocyanin biosynthesis in Dendrobium candidum. Plant Physiol. Biochem. 2021, 162, 603–612. [Google Scholar] [CrossRef] [PubMed]
  36. Alabd, A.; Ahmad, M.; Zhang, X.; Gao, Y.; Peng, L.; Zhang, L.; Ni, J.; Bai, S.; Teng, Y. Light-responsive transcription factor PpWRKY44 induces anthocyanin accumulation by regulating PpMYB10 expression in pear. Hortic Res. 2022, 9, uhac199. [Google Scholar] [CrossRef]
  37. Han, H.; Dong, L.; Zhang, W.; Liao, Y.; Wang, L.; Wang, Q.; Ye, J.; Xu, F. Ginkgo biloba GbbZIP08 transcription factor is involved in the regulation of flavonoid biosynthesis. J. Plant Physiol. 2023, 287, 154054. [Google Scholar] [CrossRef]
  38. Plunkett, B.J.; Henry-Kirk, R.; Friend, A.; Diack, R.; Helbig, S.; Mouhu, K.; Tomes, S.; Dare, A.P.; Espley, R.V.; Putterill, J.; et al. Apple B-box factors regulate light-responsive anthocyanin biosynthesis genes. Sci. Rep. 2019, 9, 17762. [Google Scholar] [CrossRef]
  39. Jaakola, L.; Poole, M.; Jones, M.O.; Kämäräinen-Karppinen, T.; Koskimäki, J.J.; Hohtola, A.; Häggman, H.; Fraser, P.D.; Manning, K.; King, G.J.; et al. A SQUAMOSA MADS box gene involved in the regulation of anthocyanin accumulation in bilberry fruits. Plant Physiol. 2010, 153, 1619–1629. [Google Scholar] [CrossRef]
  40. Jiang, W.; Xia, Y.; Su, X.; Pang, Y. ARF2 positively regulates flavonols and proanthocyanidins biosynthesis in Arabidopsis thaliana. Planta 2022, 256, 44. [Google Scholar] [CrossRef]
  41. Wan, H.; Liu, Y.; Wang, T.; Jiang, P.; Wen, W.; Nie, J. Combined transcriptomic and metabolomic analyses identifies CsERF003, a citrus ERF transcription factor, as flavonoid activator. Plant Sci. 2023, 334, 111762. [Google Scholar] [CrossRef]
  42. Mahmood, K.; Xu, Z.; El-Kereamy, A.; Casaretto, J.A.; Rothstein, S.J. The Arabidopsis transcription factor ANAC032 represses anthocyanin biosynthesis in response to high sucrose and oxidative and abiotic stresses. Front. Plant Sci. 2016, 7, 1548. [Google Scholar] [CrossRef]
  43. Wei, Z.Z.; Hu, K.D.; Zhao, D.L.; Tang, J.; Huang, Z.Q.; Jin, P.; Li, Y.H.; Han, Z.; Hu, L.Y.; Yao, G.F.; et al. MYB44 competitively inhibits the formation of the MYB340-bHLH2-NAC56 complex to regulate anthocyanin biosynthesis in purple-fleshed sweet potato. BMC Plant Biol. 2020, 20, 258. [Google Scholar] [CrossRef] [PubMed]
  44. Zhang, Y.; Li, W.; Dou, Y.; Zhang, J.; Jiang, G.; Miao, L.; Han, G.; Liu, Y.; Li, H.; Zhang, Z. Transcript quantification by RNA-Seq reveals differentially expressed genes in the red and yellow fruits of Fragaria vesca. PLoS ONE 2015, 10, e0144356. [Google Scholar] [CrossRef] [PubMed]
  45. Kim, D.; Jeon, S.J.; Yanders, S.; Park, S.C.; Kim, H.S.; Kim, S. MYB3 plays an important role in lignin and anthocyanin biosynthesis under salt stress condition in Arabidopsis. Plant Cell Rep. 2022, 41, 1549–1560. [Google Scholar] [CrossRef] [PubMed]
  46. Cong, L.; Qu, Y.; Sha, G.; Zhang, S.; Ma, Y.; Chen, M.; Zhai, R.; Yang, C.; Xu, L.; Wang, Z. PbWRKY75 promotes anthocyanin synthesis by activating PbDFR, PbUFGT, and PbMYB10b in pear. Physiol. Plant 2021, 173, 1841–1849. [Google Scholar] [CrossRef]
  47. Zuluaga, D.L.; Gonzali, S.; Loreti, E.; Pucciariello, C.; Degl’Innocenti, E.; Guidi, L.; Alpi, A.; Perata, P. Arabidopsis thaliana MYB75/PAP1 transcription factor induces anthocyanin production in transgenic tomato plants. Funct. Plant Biol. 2008, 35, 606–618. [Google Scholar] [CrossRef]
  48. Zhang, B.; Zhu, Z.Z.; Qu, D.; Wang, B.C.; Hao, N.N.; Yang, Y.Z.; Yang, H.J.; Zhao, Z.Y. MdBBX21, a B-Box protein, positively regulates light-induced anthocyanin accumulation in apple peel. Front. Plant Sci. 2021, 12, 774446. [Google Scholar] [CrossRef]
  49. Ma, H.; Yang, T.; Li, Y.; Zhang, J.; Wu, T.; Song, T.; Yao, Y.; Tian, J. The long noncoding RNA MdLNC499 bridges MdWRKY1 and MdERF109 function to regulate early-stage light-induced anthocyanin accumulation in apple fruit. Plant Cell 2021, 33, 3309–3330. [Google Scholar] [CrossRef]
  50. Mo, R.; Han, G.; Zhu, Z.; Essemine, J.; Dong, Z.; Li, Y.; Deng, W.; Qu, M.; Zhang, C.; Yu, C. The ethylene response factor ERF5 regulates anthocyanin biosynthesis in ‘Zijin’ mulberry fruits by interacting with MYBA and F3H genes. Int. J. Mol. Sci. 2022, 23, 7615. [Google Scholar] [CrossRef]
  51. Wang, Z.; Luo, Z.; Liu, Y.; Li, Z.; Liu, P.; Bai, G.; Zhou, Z.; Xie, H.; Yang, J. Molecular cloning and functional characterization of NtWRKY11b in promoting the biosynthesis of flavonols in Nicotiana tabacum. Plant Sci. 2021, 304, 110799. [Google Scholar] [CrossRef]
  52. Busche, M.; Pucker, B.; Weisshaar, B.; Stracke, R. Three R2R3-MYB transcription factors from banana (Musa acuminata) activate structural anthocyanin biosynthesis genes as part of an MBW complex. BMC Res. Notes 2023, 16, 103. [Google Scholar] [CrossRef]
  53. Moglia, A.; Florio, F.E.; Iacopino, S.; Guerrieri, A.; Milani, A.M.; Comino, C.; Barchi, L.; Marengo, A.; Cagliero, C.; Rubiolo, P.; et al. Identification of a new R3 MYB type repressor and functional characterization of the members of the MBW transcriptional complex involved in anthocyanin biosynthesis in eggplant (S. melongena L.). PLoS ONE 2020, 15, e0232986. [Google Scholar]
  54. Lloyd, A.; Brockman, A.; Aguirre, L.; Campbell, A.; Bean, A.; Cantero, A.; Gonzalez, A. Advances in the MYB-bHLH-WD repeat (MBW) pigment regulatory model: Addition of a WRKY factor and co-option of an anthocyanin MYB for betalain regulation. Plant Cell Physiol. 2017, 58, 1431–1441. [Google Scholar] [CrossRef]
Figure 1. Whole flowers (A) and single sepals (B) in six experimental cultivars. A, ‘Apricot Parfait’, G, ‘Grand Diva’, L, ‘Luna’, P, ‘Pink Rival’, S, ‘Souvenir’, and W, ‘Wedding Dance’. Scale bar represents 5 cm. (C,D). Total anthocyanin and total flavonoid content in the petals of six cultivars. ‘Wedding Dance’ used as the common comparator. All data were means (±SE) of three independent biological replicates (* p < 0.05, ** p < 0.01, *** p < 0.001).
Agronomy 15 01722 g001
Figure 2. Metabolomic assessments of flowers from Hippeastrum varieties. (A,B) PLS-DA analysis (Partial Least Squares Discriminant Analysis) of the derived data of Apricot Parfait (“A”), Grand Diva (“G”), Luna (“L”), Pink Rival (“P”), Souvenir (“S”) vs. Wedding Dance (“W”). (C) Venn diagram of differentially accumulating metabolites (DAMs) in the following comparisons A, G, L, P, S vs. W. (D) Bar chart showing the differentially accumulating metabolites (DAMs) targeted by comparisons of, respectively, ‘Apricot Parfait’, ‘Grand Diva’, ‘Luna’, ‘Pink Rival’, and ‘Souvenir’ vs. ‘Wedding Dance’. (EH) The levels of metabolites (based on m/z abundance) from metabolomic data, cyanidin (E), cyanidin-3-O-rutinoside (F), delphinidin 3-glucoside (G), delphinidin 3-rutinoside (H). ‘Wedding Dance’ used as the common comparator. All data were means (±SE) of three independent biological replicates (* p < 0.05, ** p < 0.01, *** p < 0.001).
Agronomy 15 01722 g002
Figure 3. Transcriptomic assessments of flowers from Hippeastrum varieties. (A) Venn diagram of differentially expressed genes (DEGs) arising following comparison of ‘Apricot Parfait’ (“A”), ‘Grand Diva’ (“G”), ‘Luna’ (“L”), ‘Pink Rival’ (“P”), ‘Souvenir’ (“S”) vs. ‘Wedding Dance’ (“W”). (B) showed DEGs following pairwise the comparisons of ‘A’, ‘G’, ‘L’, ‘P’, ‘R’, and ‘S’ vs. ‘W’. (CG) The KEGG enrichment analysis of DEGs. The KEGG pathways associated with phenotypic traits were marked with red boxes. Phenylpropanoid biosynthesis, flavonoid biosynthesis, flavone and flavonol biosynthesis.
Agronomy 15 01722 g003
Figure 4. Anthocyanin biosynthesis in Hippeastrum. (A) The anthocyanin biosynthesis pathway (B) heatmap showing anthocyanin biosynthesis gene expression in the petals of six Hippeastrum cultivars (FPKM values). The data was the average of the three biological replicates (CN) qRT-PCR confirmation of the transcript levels of anthocyanin biosynthesis gene expression in the petals of six Hippeastrum cultivars. ‘Wedding Dance’ used as the common comparator. All data were means (±SE) of three independent biological replicates (* p < 0.05, ** p < 0.01).
Agronomy 15 01722 g004
Figure 5. WGCNA analysis (Weighted Gene Co-expression Network Analysis) based on the RNA-Seq data and the m/z abundance of 4 compounds, cyanidin, cyanidin-3-O-rutinoside, delphinidin 3-glucoside, and delphinidin 3-rutinoside. (A) Sample dendrogram and trait heatmap. (B) Setting of the plateau threshold line and determination of soft threshold. (C,D) The detection of modules: (C) showed the gene hierarchical clustering tree based on TOM (Topological Overlap Matrix), illustrating the clustering relationships of each gene, while (D) presented the final module classification obtained by applying the dynamic tree cut algorithm, where genes were divided into modules and optimized for merging. Different colors represent distinct modules, and the gray color indicates genes that are not assigned to any other modules, with the gray module being meaningless. The vertical distance between nodes represents the distance between genes, while the horizontal distance has no significance. (E) Module–trait correlation analyses. By analyzing the correlation between traits and modules, and visualizing this relationship through a heatmap, the strength of the correlation between each module and the given trait could be clearly shown. A correlation value closer to 1 (in absolute value) suggested that the trait is likely functionally related to the genes in the module. The x-axis represents different traits, the y-axis represents different modules, and the values in the heatmap indicate the correlation strength along with the statistical significance (p-values). A correlation value closer to 1 indicates a stronger positive correlation between the module and the sample, while a value closer to −1 indicates a stronger negative correlation. Smaller p-values in parentheses indicate stronger statistical significance.
Agronomy 15 01722 g005
Figure 6. (AC) Modules which enriched in the flavonoid biosynthesis pathway, including blue, dark olive green, and orange modules. The red frame was the ‘map00941 Flavonoid biosynthesis’. (DF) Analysis of genes in the three modules most strongly positively correlated with the target trait. (GI) Analysis of genes in the three modules most strongly negatively correlated with the target trait. The results are divided into two parts. The upper part is a heatmap, where each row represents a gene and each column represents a sample, displaying the gene expression within the module. The lower part shows a bar plot of the expression of module characteristic genes in each sample.
Agronomy 15 01722 g006
Figure 7. Screening of transcription factors in the three modules and validation by qRT-PCR. (AC) The heatmap of TF genes in blue, midnight blue, and magenta modules. The color key indicates the normalized expression values of individual genes, ranging between 0 and 1. (DK) qRT-PCR results of selected genes from three modules. ‘Wedding Dance’ used as the common comparator. All data were means (±SE) of three independent biological replicates (* p < 0.05, ** p < 0.01).
Agronomy 15 01722 g007
Figure 8. The correlation analysis between accumulation of 4 metabolites and TFs involved in blue module (A), midnight blue module (B), and magenta module (C). The black font represents the correlation coefficient, and the white font represents the p-value, in which * means p < 0.05, ** p < 0.01 and *** p < 0.001.
Agronomy 15 01722 g008
Figure 9. The results of the yeast two-hybrid (Y2H) experiment are presented. TTG1 did not exhibit self-activation and showed interactions with MYB transcription factors MYB39, MYB44, MYB306, and MYB3 and bHLH transcription factors bHLH13, bHLH110, and bHLH34. Moreover, the interaction was also identified between TTG1 and BBX transcription factor BBX21. Protein interactions were assessed using synthetic defined double dropout (SD DDO) medium (left) and SD quadruple dropout (SD QDO) medium with X-α-gal (right). The SD QDO medium lacks His, Leu, Ade, and Trp, while the SD DDO medium lacks Trp and Leu. The negative control consisted of pGADT7-T and pGBKT7-Lam, while the positive control involved pGADT7-T and pGBKT7-53. The three columns (from left to right) correspond to three concentration gradients (1, 0.1, and 0.01).
Agronomy 15 01722 g009
Disclaimer/Publisher’s Note: The statements, opinions and data contained in all publications are solely those of the individual author(s) and contributor(s) and not of MDPI and/or the editor(s). MDPI and/or the editor(s) disclaim responsibility for any injury to people or property resulting from any ideas, methods, instructions or products referred to in the content.

