Article

Plant Traits in Spring and Winter Canola Genotypes Under Salinity

by
Rajan Shrestha
1,*,
Qingwu Xue
1,
Andrea Leiva Soto
1,
Girisha Ganjegunte
2,
Santosh Subhash Palmate
2,
Vijayasatya N. Chaganti
3,
Saurav Kumar
4,
April L. Ulery
5 and
Samuel Zapata
6
1
Texas A&M AgriLife Research and Extension Center at Amarillo, 6500 W. Amarillo Blvd., Amarillo, TX 79106, USA
2
Texas A&M AgriLife Research and Extension Center at El Paso, 1380 A&M Circle, El Paso, TX 79927, USA
3
School of Plant and Environmental Sciences, Virginia Polytechnic Institute and State University, Blacksburg, VA 24061, USA
4
School of Sustainable Engineering and the Built Environment, Arizona State University, E University Dr, Tempe, AZ 85281, USA
5
Department of Plant and Environmental Sciences, New Mexico State University, 1780 E University Ave, Las Cruces, NM 88003, USA
6
Texas A&M AgriLife Research and Extension Center at Weslaco, 2415 E Hwy 83, Weslaco, TX 78596, USA
*
Author to whom correspondence should be addressed.
Agronomy 2025, 15(7), 1657; https://doi.org/10.3390/agronomy15071657
Submission received: 27 May 2025 / Revised: 29 June 2025 / Accepted: 2 July 2025 / Published: 8 July 2025
(This article belongs to the Section Crop Breeding and Genetics)

Abstract

Concerning rising salinity and declining freshwater supply in the U.S. Southern Great Plains, alternative crop production choices using marginal saline irrigation water are irresistible. The study investigated plant traits related to salt tolerance in greenhouse canola (Brassica napus L.) in 2022 and 2023. Spring and winter canola, including ten genotypes each, were evaluated at six salinity levels (0; control, 2, 4, 6, 8, and 8 dS m−1 EC). Plant height, stem mass, leaf area, and specific leaf area (SLA) showed a negative linear response, while quadratic relationships were observed in biomass and leaf mass with increased salinity levels. Substantial negative salinity impacts on plant traits occurred at ≥6 dS m−1 EC (p ≤ 0.01) except for SLA. Overall, winter canola genotypes: Athena, Ericka, CP320WRR, CP115W, and CP225WRR, and spring genotypes: Empire, Monarch, Profit, and Westar, were relatively more salt-tolerant than others. Spring canola showed greater salinity tolerance than winter canola. Salinity stress resulted in differential responses of greater leaf mass in winter canola but more efficient leaf area production in spring canola. SLA and stem mass were highly correlated with most parameters. Findings indicate SLA and stem mass are potential salt tolerance traits in canola and warrant further investigations and validation.

1. Introduction

Salinity stress is among the major abiotic stressors that adversely affect crop growth and production, including canola (Brassica napus L.). Salinity issues are associated with primary “natural” and/or secondary “anthropogenic” factors. These factors, including climate change, use of poor-quality irrigation water, overuse of groundwater, impaired soil leaching, and poor soil water drainage, exacerbate agricultural salinization [1,2,3,4]. Of the 73% of global land that has been mapped, about 424 million hectares of 0–30 cm topsoil and 833 million hectares of 30–100 cm subsoil are affected by salinity [5]. Moreover, over two-thirds of global salt-affected soil is distributed in arid and semi-arid regions. Salinity presents major concerns in irrigated crop production systems and risks to sustainable land use, particularly in hot and dry environments. An estimated 20% of the world’s irrigated cropland is affected by soil salinity [6]. World agriculture uses more than two-thirds of the freshwater supply; however, increasing water scarcity is a growing challenge as the growing population demands compete for the limited freshwater availability [7]. Inevitably, irrigation water availability will be truncated, and the need for alternative crop production choices using marginal quality saline irrigation water is irresistible. Increases in the salinization of irrigation water sources, along with declining freshwater withdrawals, have aggravated the salinity issues [5,7,8,9]. In addition, the recent climate change trends of an increase in temperature, the frequency and severity of drought events, and the expansion of drylands, including desertification, have exacerbated soil salinity problems. Such a salinity outlook warrants a critical need to better manage the marginal or limited irrigation water applications and saline croplands with potential salt-tolerant species, including canola [10].
Mechanisms of salt tolerance, including plant feedback, have been researched in several crops, including canola [11,12,13,14,15,16]. Commonly, salinity tolerance has been associated with high photosynthesis, regulation of ion transport, differential uptake of selective ions such as increased uptake of K and Ca ions [high K+/Na+, Ca2+/Na+ ratios], ion homeostasis, low relative cell membrane permeability, high relative leaf water content, toxic ion exclusion, and antioxidative defense mechanisms [12,13,15,16,17]. Besides intrinsic plant mechanisms against salinity stress, researchers have explored extrinsic management approaches to alleviate salinity impacts on canola. For instance, reduced effects of salinity stress were reported through exogenous applications of osmoregulatory compounds like proline and glycine betaine [18]; application of potassium and foliar spray of antioxidants [11,19]; inoculation of plant growth-promoting rhizobacteria Azotobacter chroococcum, Alcaligenes faecalis, and Enterobacter cloacae [20,21]; adoption of transgenic cultivars [22]; and seed priming techniques [16,23,24]. Nevertheless, genetic improvement of salt tolerance is a more economical and competitive measure than other approaches against salinity stress impacts in many crops, including canola.
Studies have documented genotypic variations in canola salinity stress responses in diverse environments, including varying salt types and salinity levels, genotype pools, developmental stages, and growing conditions in regions [13,15,25,26,27,28]. However, the genetic variation in the salinity responses is still largely unknown in the US Southern Great Plains region. Conjecturing with our field study observations, this study evaluates salinity tolerance in spring and winter canola genotypes to identify key adaptive traits under semi-controlled greenhouse conditions. The objective is to evaluate canola salinity tolerance and potential plant traits related to salinity tolerance. To our knowledge, this is the first study to systematically compare salinity tolerance between spring and winter canola genotypes, addressing a critical gap in understanding their differential responses under salinity stress.

2. Materials and Methods

Two greenhouse pot experiments were conducted in the spring of 2022 and 2023 at Bushland, Texas, USA. The study was conducted in a split-plot randomized block design with four replications per salinity treatment for each test genotype. Treatments included: (1) canola genotypes (a total of 20, including 10 winter and spring types each) and (2) five salinity stress levels of 2, 4, 6, 8, and 10 dS m−1 electrical conductivities (EC), including a non-salinity stress control (0 dS m−1). The main plot factor was salinity level, and the canola genotype was a subplot factor with a total of 480 experimental pots. For each experiment, canola seedlings were transplanted in the 3rd and 4th week of March in 2022 and 2023, respectively. The final harvest was performed 28 days after transplanting (DAT) in 2022 and 43 DAT in 2023. The greenhouse environment was controlled at 25/20 °C for 12/12 h day/night temperatures, and other climate variables were driven by atmospheric conditions. Climatic conditions during the canola study in 2023 are presented in Figure 1, but data for 2022 is unavailable.
Seedlings (1–2 leaf stage) from the emergence study [29] were grown at each salinity level in a controlled growth chamber for this study. Canola seedlings were grown in plastic pots (12 cm × 12 cm × 15 cm in size) using a commercial nutrient-holding potting mix (Series BM-1, Berger, Saint-Modeste, QC, Canada) as the growth medium, which was composed of sphagnum peat moss (78–84%), perlite (12–16%), and vermiculite (3–7%) with pH (dolomitic and calcitic limestone) buffer and wetting (ethoxylated alkylphenol) agents. Seedlings were transplanted into pots with a pre-soaked potting mix using saline irrigation water corresponding to each treatment salinity level. Each pot was transplanted with five seedlings of each genotype. After seedling establishment, each pot was thinned to three plants in 2022 and four plants in 2023. Genetic information, including the origins of canola genotypes, is provided in Table 1. The studied canola genotypes were mostly (12) developed by the University of Idaho, USA, and an additional five genotypes with three different country origins and three CROPLAN winter types (Table 1).
Salinity treatments were imposed using saline irrigation water applications prepared using sodium chloride (NaCl; Assay ≥ 99.5%, Thermo Fisher Scientific Inc., Waltham, MA, USA). The amount of salt required to achieve the target concentrations corresponding to each salinity treatment EC level was determined by a pH/conductivity meter (Accumet AB200, Fisher Scientific International Inc., Hampton, NH, USA) at room temperature (Table 2). The EC meter was calibrated using a standard conductivity solution (Fisher Scientific International Inc., Hampton, NH, USA). The ECs of prepared saline irrigation water treatments were measured with the Accumet AB200 pH/conductivity meter (Table 2).
During the growing periods, canola plants were managed through irrigation applications using water with salt concentrations respective to each salinity level. Irrigation was performed by surface application of about 400 mL of saline irrigation water per pot 2–3 times per week, depending on the plant water demand. The amount of irrigation was slightly over the amount required to maintain the field capacity level. The excess irrigation water was normally drained through the holes on the bottom of each pot. Plant nutrients were supplemented using a Miracle-Gro fertilizer (The Scotts Company LLC., Marysville, OH, USA) in the solution form at 1.1 g L−1 of saline irrigation water for each salinity level. The nutrient composition of the fertilizer included 24% total nitrogen (N) [Ammoniacal—N 3.5%; Urea—N 20.5%], 0.0005% Molybdenum, 0.06% water-soluble zinc, 8% available phosphate, 16% soluble potash, 0.02% boron, 0.07% water-soluble copper, 0.15% chelated iron, and 0.05% chelated manganese. A 250 mL prepared nutrient solution was applied per pot each week.
Data on several morpho-physiological and developmental traits were collected and averaged on a per-plant basis per experimental pot. Aboveground biomass, biomass partitioning, leaf area, and specific leaf area (SLA) were assessed through destructive sampling measurements following the final harvest. The plants were cut above the surface of the growing medium and subsequently partitioned into leaves and stems. Simultaneously, the leaves were processed for leaf area determination using a Li-Cor-3200 Leaf Area Meter (LI-COR Environmental, Lincoln, NE, USA). The samples were then dried in a hot-air oven at 65 °C until a constant weight was achieved. Additionally, non-destructive data were collected on plant height, leaf number, and relative chlorophyll content (SPAD) using the SPAD-502 Plus Chlorophyll meter (Konica Minolta, Inc., Tokyo, Japan).
Broad-sense heritability (H2) was calculated by the entry means unit method using a formula in Equation (1). In the formula, variance components: σ g 2 is the total genetic variance, σ gy 2 is the variance due to the year × genotype interaction, and σ e 2 is the residual variance, r is the number of replications, and t is the number of years. Using ANOVA results, estimates of variance components ( σ g 2 = MSGenotype - Var   Residual / r ;   σ gy 2 = [ MS Year   × Genotype - Var   ( Residual ) ] / r ; and σ e   2 = Var   ( Residual ) ) were calculated [30].
H 2 =   σ g 2   σ e 2 / rt +   σ gy 2 / t +   σ g 2
Data were analyzed in SAS 9.4 statistical software (2020, SAS Institute Inc., Cary, NC, USA). A combined year split-plot design ANOVA was performed using the PROC GLM procedure to test the main factors (genotype, year, and salinity level) and the interaction effects. Individual year-wise analysis was performed using the PROC GLM procedure. In the ANOVA statistical models, the fixed effect terms were genotypes and salinity levels, while the random effect terms were replication and year, as applicable. For the statistical analysis, appropriate error terms were subjected to the ANOVA model procedures based on the treatment factors laid out in the split-plot design. Moreover, focused contrast analyses were performed for comparisons between canola types (spring and winter canola) and salinity conditions (non-stress control; CT: 0 dS m−1 EC and salinity stress; ST: 2–10 dS m−1 EC) using the PROC GLM procedure. All treatment means comparisons were assessed using Fisher’s protected LSD method at a probability threshold level of α = 5% or 10% for statistical differences. A test of polynomial regression analysis of the measured parameters was performed using the PROC REG procedure for each genotype against salinity treatments.

3. Results

Preliminary combined year ANOVA analysis showed a significant year effect on the measured morpho-physiological parameters except for plant height. As such, year-wise data analysis results were rationalized hereafter (Table 3). Negative salinity effects were observed on all parameters in both study years, except for a positive impact on SPAD-Chlorophyll in 2023 (p ≤ 0.10; Figure 2). Differences among genotypes (p ≤ 0.10) were largely observed except for leaf mass for winter types in both years and plant height, biomass, and SPAD-Chlorophyll for both canola types in 2023.
Importantly, significant salinity × genotype interaction effects were noted on selective parameters among canola types and years (Table 3). Such interactions are attributed to variability in parameter values, largely at low salinity range from 0 to 4 dS m−1 and high range from 6 to 10 dS m−1 (Figure 3 and Figure 4). Thus, results are focused on the overall salinity and genotype effects for the two canola types, highlighting the trends and overview of key findings hereafter. Plant traits, such as leaf number, had low variations in the observed value range, and SPAD-Chlorophyll showed inconsistent results among salinity levels and years for each canola type. Thus, data results on ANOVA and regression analysis for these parameters were not presented, and only meaningful results were highlighted.

3.1. Contrast Between Canola Types

Between types of canola (spring vs. winter), a contrast analysis showed differential detrimental effects on all plant parameters under salinity-imposed conditions (Table 4). In both years, the parameters, including biomass, leaf mass, stem mass, leaf area, leaf number, plant height, SPAD-Chlorophyll, and SLA, were notably high under control treatments compared to those under saline conditions for both canola types overall (p ≤ 0.05; Table 4). Between the two canola types, biomass was relatively greater for spring canola than winter canola, particularly in 2023. In 2022, however, a difference was observed with high biomass for winter-type canola under non-saline control; however, there was no difference between canola types under salinity stress. Meanwhile, an explicit contrasting relationship was found between canola types for biomass components relating to high leaf mass in winter canola and high stem mass in spring types. Correspondingly, leaf area measured significantly higher in winter canola than the spring type under both control and saline conditions in 2023. In 2022, however, no such difference was found under control conditions, but a higher leaf area value was observed for the spring canola under saline conditions. Meanwhile, SLA and stem mass (p ≤ 0.05) showed a distinct trend with greater values for spring canola than the winter type in all growing conditions. Such a trend was also observed for plant height at a significance level of p ≤ 0.10. Overall, leaf production, measured as the number of leaves per plant, showed no difference between the canola types under the salinity stress. Additionally, except for salinity in 2022 (p ≤ 0.10), there was largely no difference in SPAD-Chlorophyll between the canola types.

3.2. Salinity Impacts and Biometrics Relationships

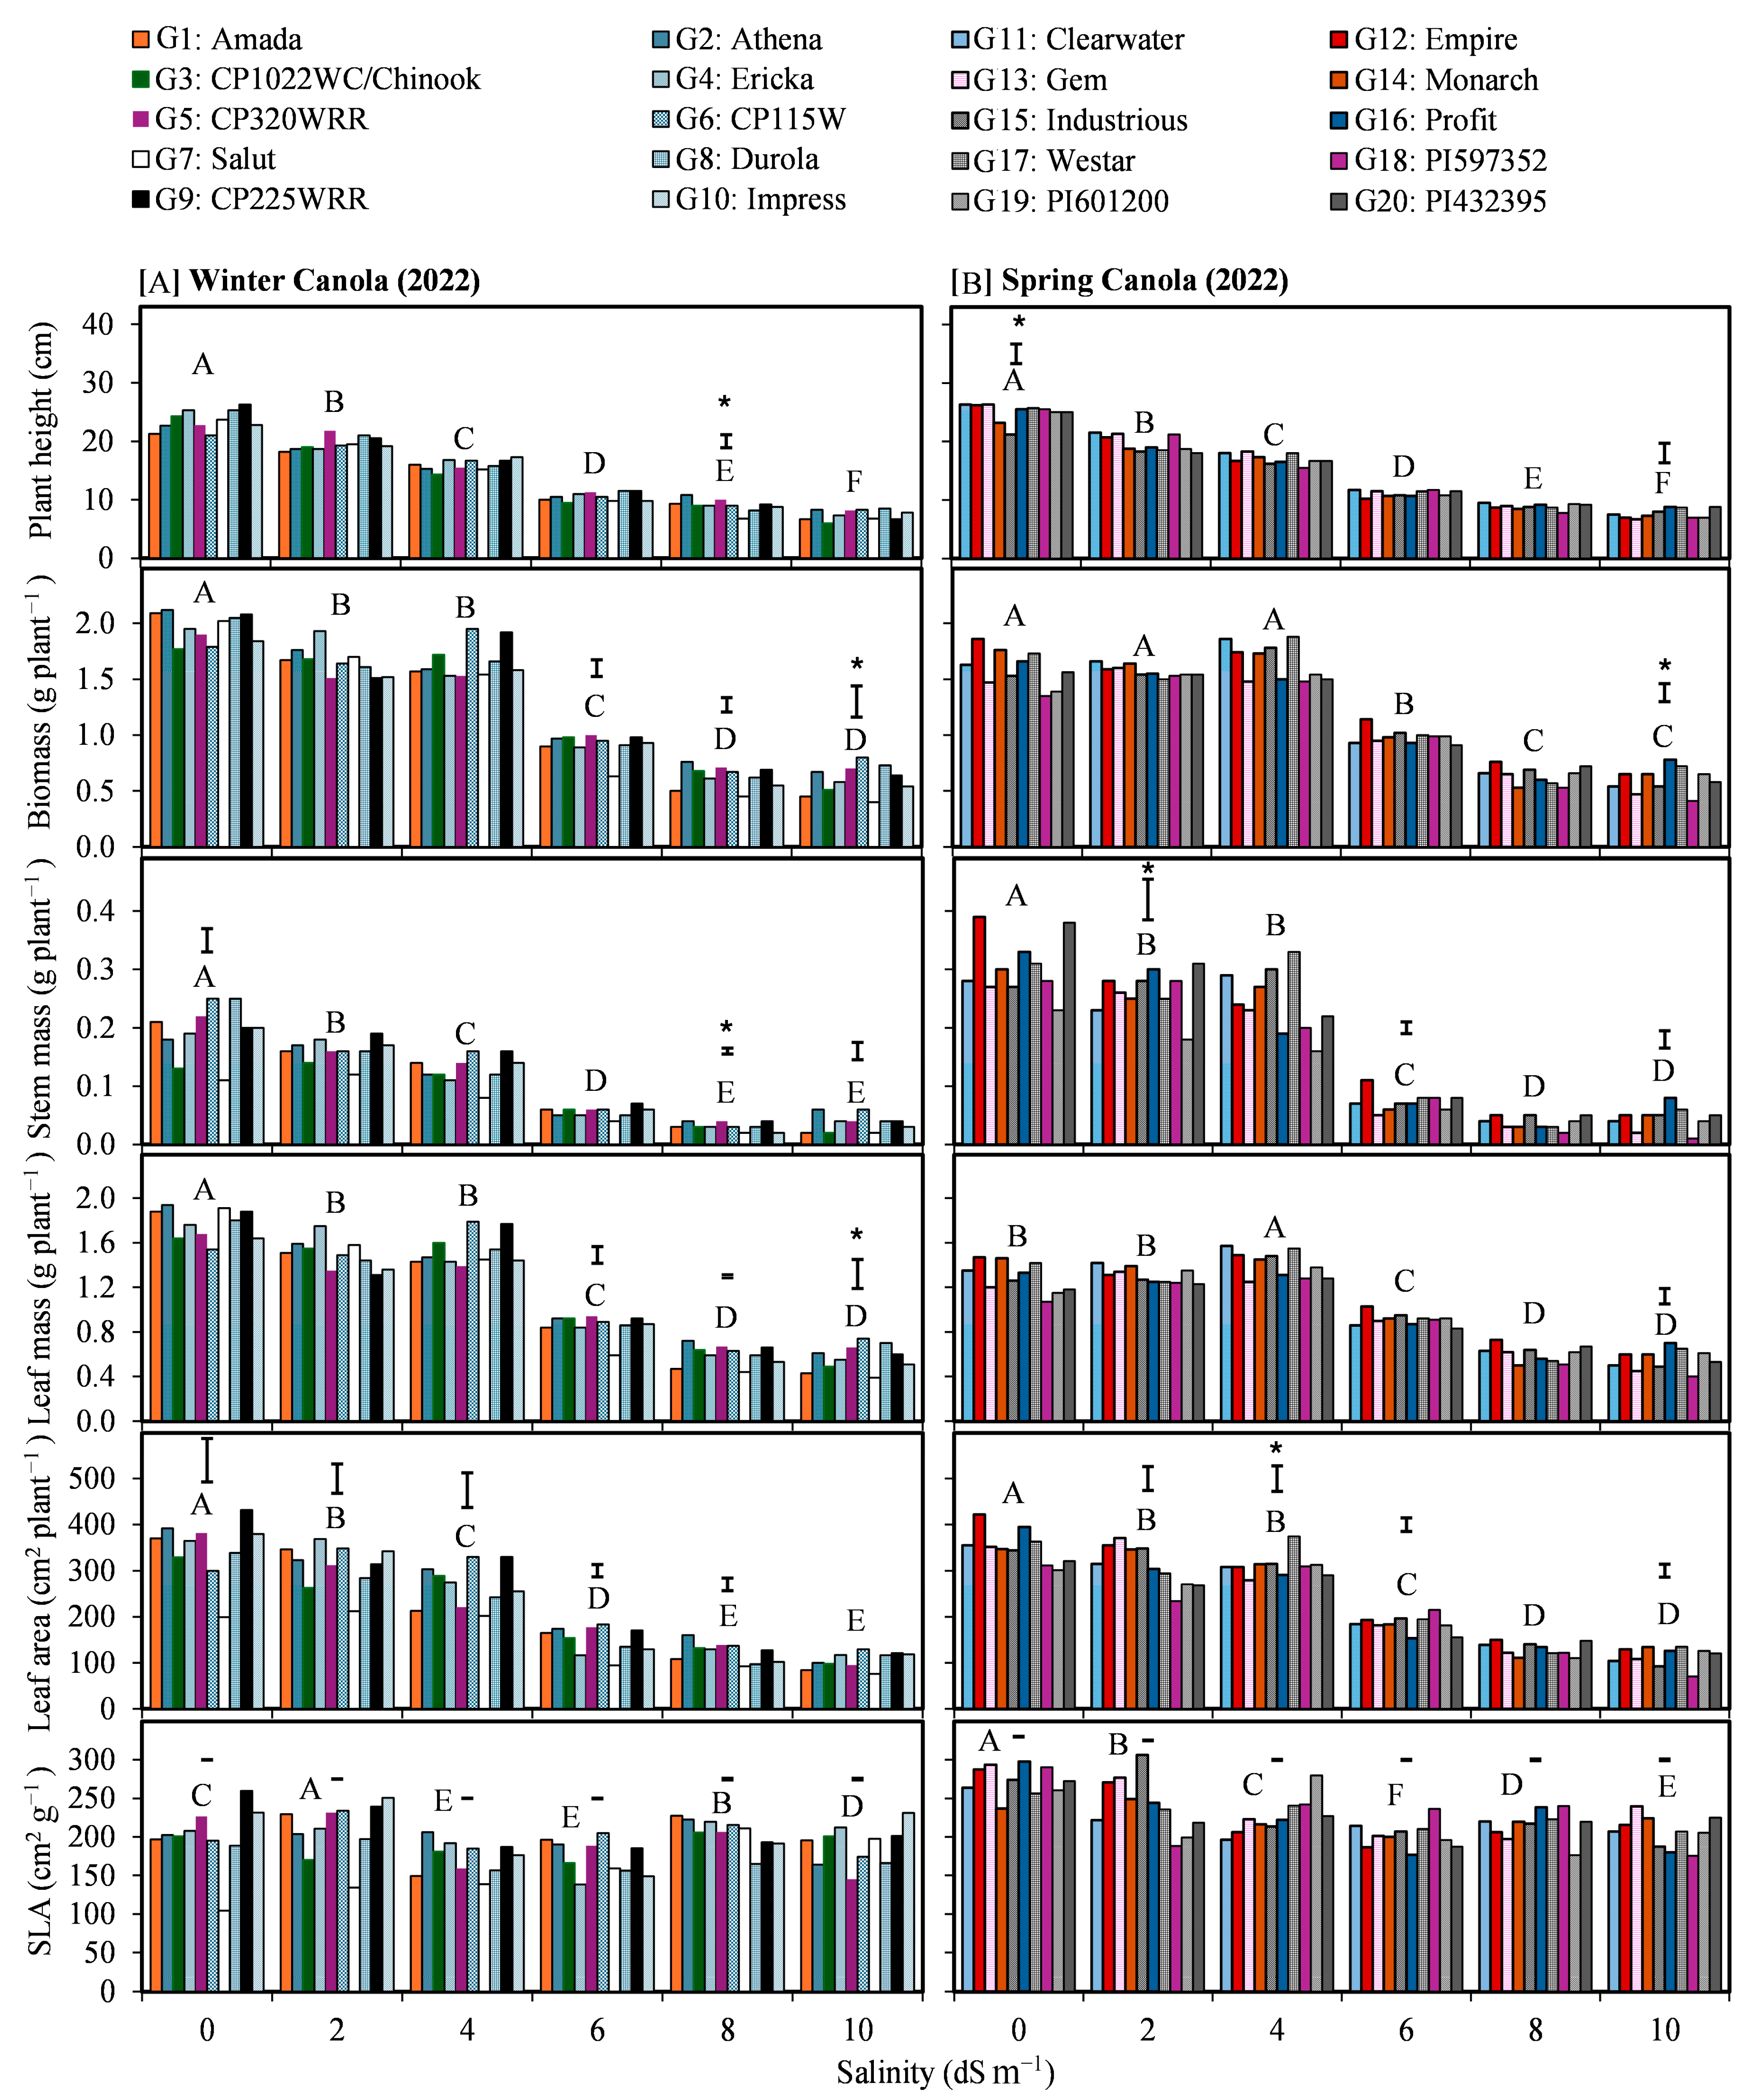
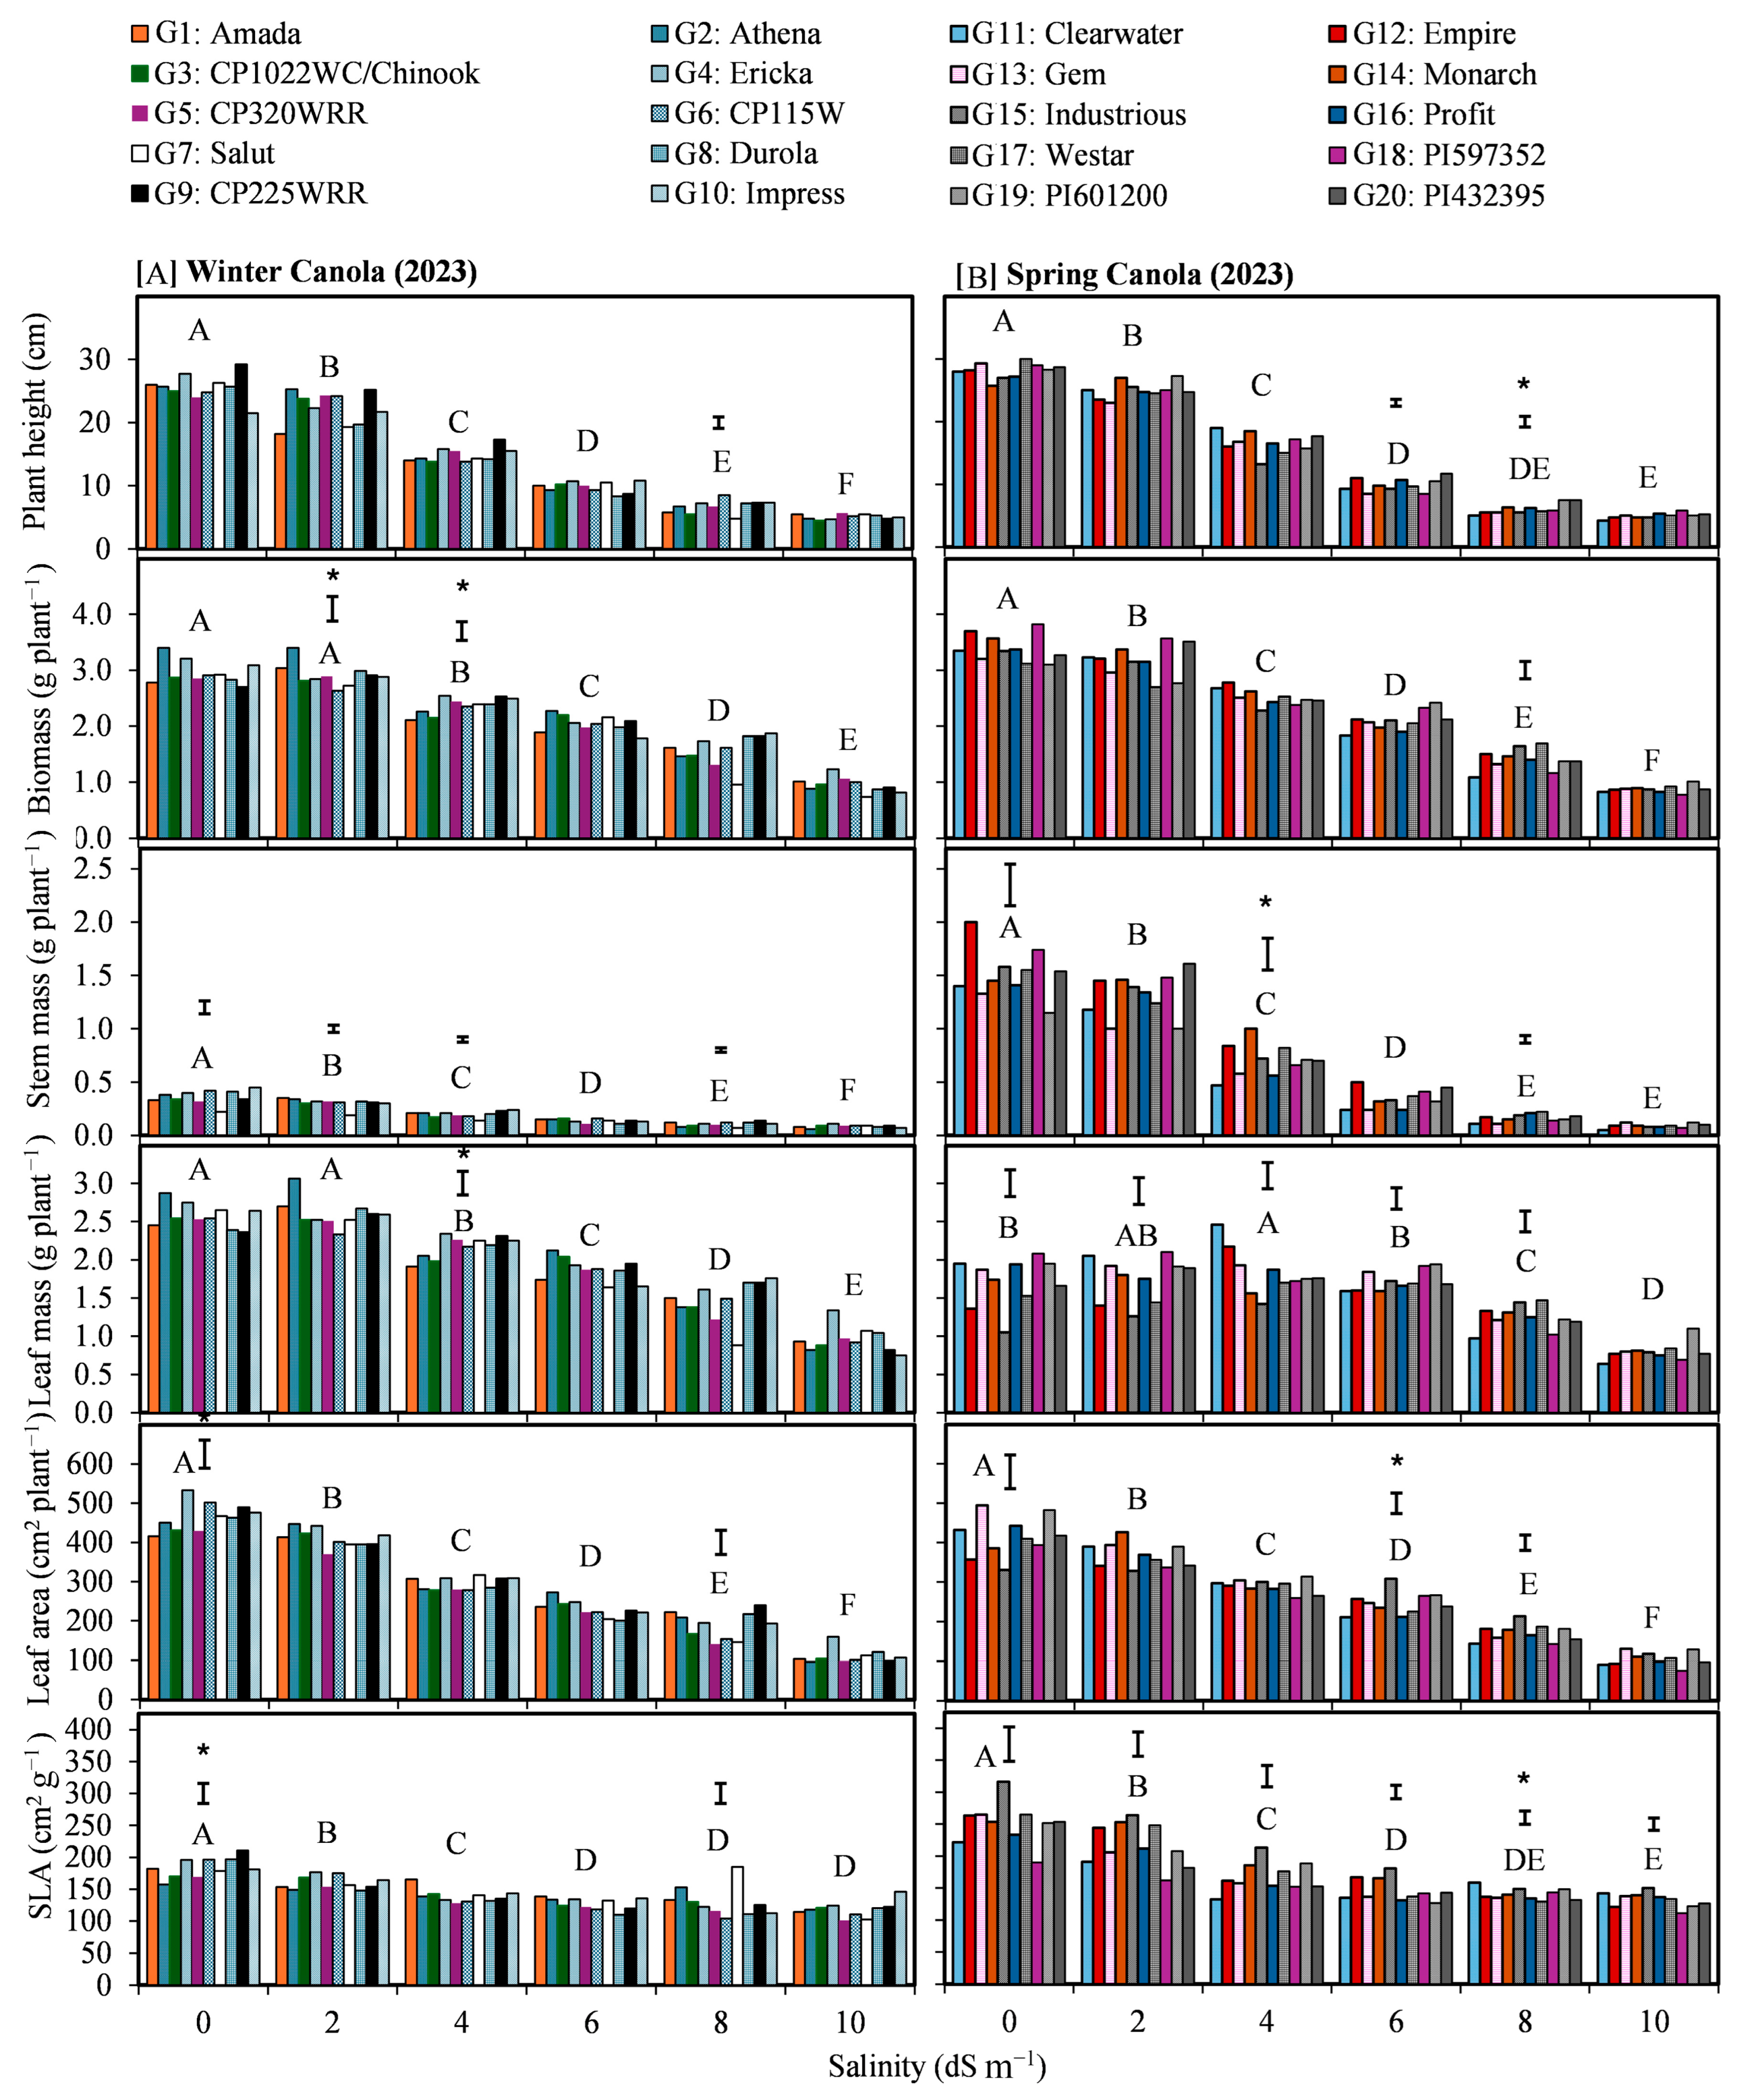
Increasing salinity levels reduced plant parameters for each canola type in both years (Figure 3 and Figure 4). The polynomial regression analyses showcased a significant negative effect (p ≤ 0.05) on all plant parameters (including plant height, biomass, stem mass, leaf mass, leaf area, and SLA) (Table 5 and Table 6). As salinity levels increased, plant height, stem mass, and leaf area decreased linearly. Biomass and leaf mass largely had a quadratic response to increased salinity, except for genotypes G6 and G17, which showed a linear relationship in 2022. Interestingly, exceptionally low stem mass values were observed among winter canola genotypes compared to the spring type in 2023, while a similar trend of low parameter values for winter canola was also noted in 2022 (Table 5 and Table 6).

3.3. Genotypic Variations Under Salinity

Differences in plant parameters were variable among canola genotypes for each type, depending on salinity levels and year (Figure 3 and Figure 4). Genotypic differences in biomass were limited, generally at greater salinity conditions, but inconsistent among salinity levels and years. Although characterized by inconsistent genotypic differences among the salinity treatments, all parameters, including biomass, were largely similar at low salinity of 0–4 dS m−1 with low negative effects and at high salinity of 6–10 dS m−1 with high impacts. These response patterns resulted in a few salinity and genotype interaction effects but lacked meaningful implications. Among the higher salinity levels (8–10 dS m−1), biomass differed among genotypes for winter type in 2022 only, and for spring type at 8 and 10 dS m−1 in 2023 and 2022, respectively (p ≤ 0.10).
Winter canola genotypes generally had relatively similar or low biomass productivity in 2022 and 2023, respectively. Particularly, genotypes: G2, G4, G5, G6, and G9 had relatively higher biomass production. Contrarily, genotypes G1 and G7 consistently had low biomass production with the observed poor crop establishment. Meanwhile, spring canola showed relatively greater variations but comparable or high biomass productivity in 2022 and 2023, respectively. Spring canola genotypes G11, G13, and G18 largely showed low biomass productivity, while high values were observed for genotypes G12, G14, G16, and G17. Similarly to the trend on total biomass, at elevated salinity levels (8–10 dS m−1), biomass partitions (stem and leaf mass) differed among genotypes for both canola types in 2022 (Figure 3 and Figure 4). Contrastingly, in 2023, biomass partitions differed among genotypes for both canola types at a wide range of salinity levels, including non-saline control except for leaf mass for the winter canola types. However, such differences among the genotypes were lacking at the highest salinity of 10 dS m−1 EC level. Generally, the biomass partitions for the above-described genotypes for both canola types largely followed similar previous trends to that of biomass productivity, with high parameter values for the superior genotypes and low values for the salt-susceptible genotypes.
Differences among genotypes were variable among salinity levels for the morpho-physiological parameters, including plant height, SLA, and leaf area characters (Figure 3 and Figure 4). Both leaf area and SLA differed greatly among genotypes for both spring and winter canola types at almost all salinity levels in 2022. In 2023, however, only limited genotypic differences were observed for the same parameters, except for a similar trend to that in 2022 for SLA among the spring-type genotypes. Salinity negatively affected SLA as salinity levels increased, with a declining trend in SLA except for the winter canola type in 2022 (Figure 3 and Figure 4; Table 5 and Table 6). In 2023, only a few winter canola genotypes, including G2 and G7, lacked negative salinity impacts on SLA. Meanwhile, spring canola genotypes showed generally reduced SLA at increased salinity levels in both years, except for G11, G13–14, and G18–20 in 2022. Observed salinity effects on SLA highlighted negative linear relationships with increasing salinity stress (Figure 3 and Figure 4; Table 5 and Table 6). Overall, winter canola genotypes had low SLA compared to the spring type, while the magnitude of decline (regression slopes) was low with increased salinity. Contrarily, spring canola genotypes attributed relatively high SLA values but a greater decline against increased salinity.

3.4. Correlations and Heritability

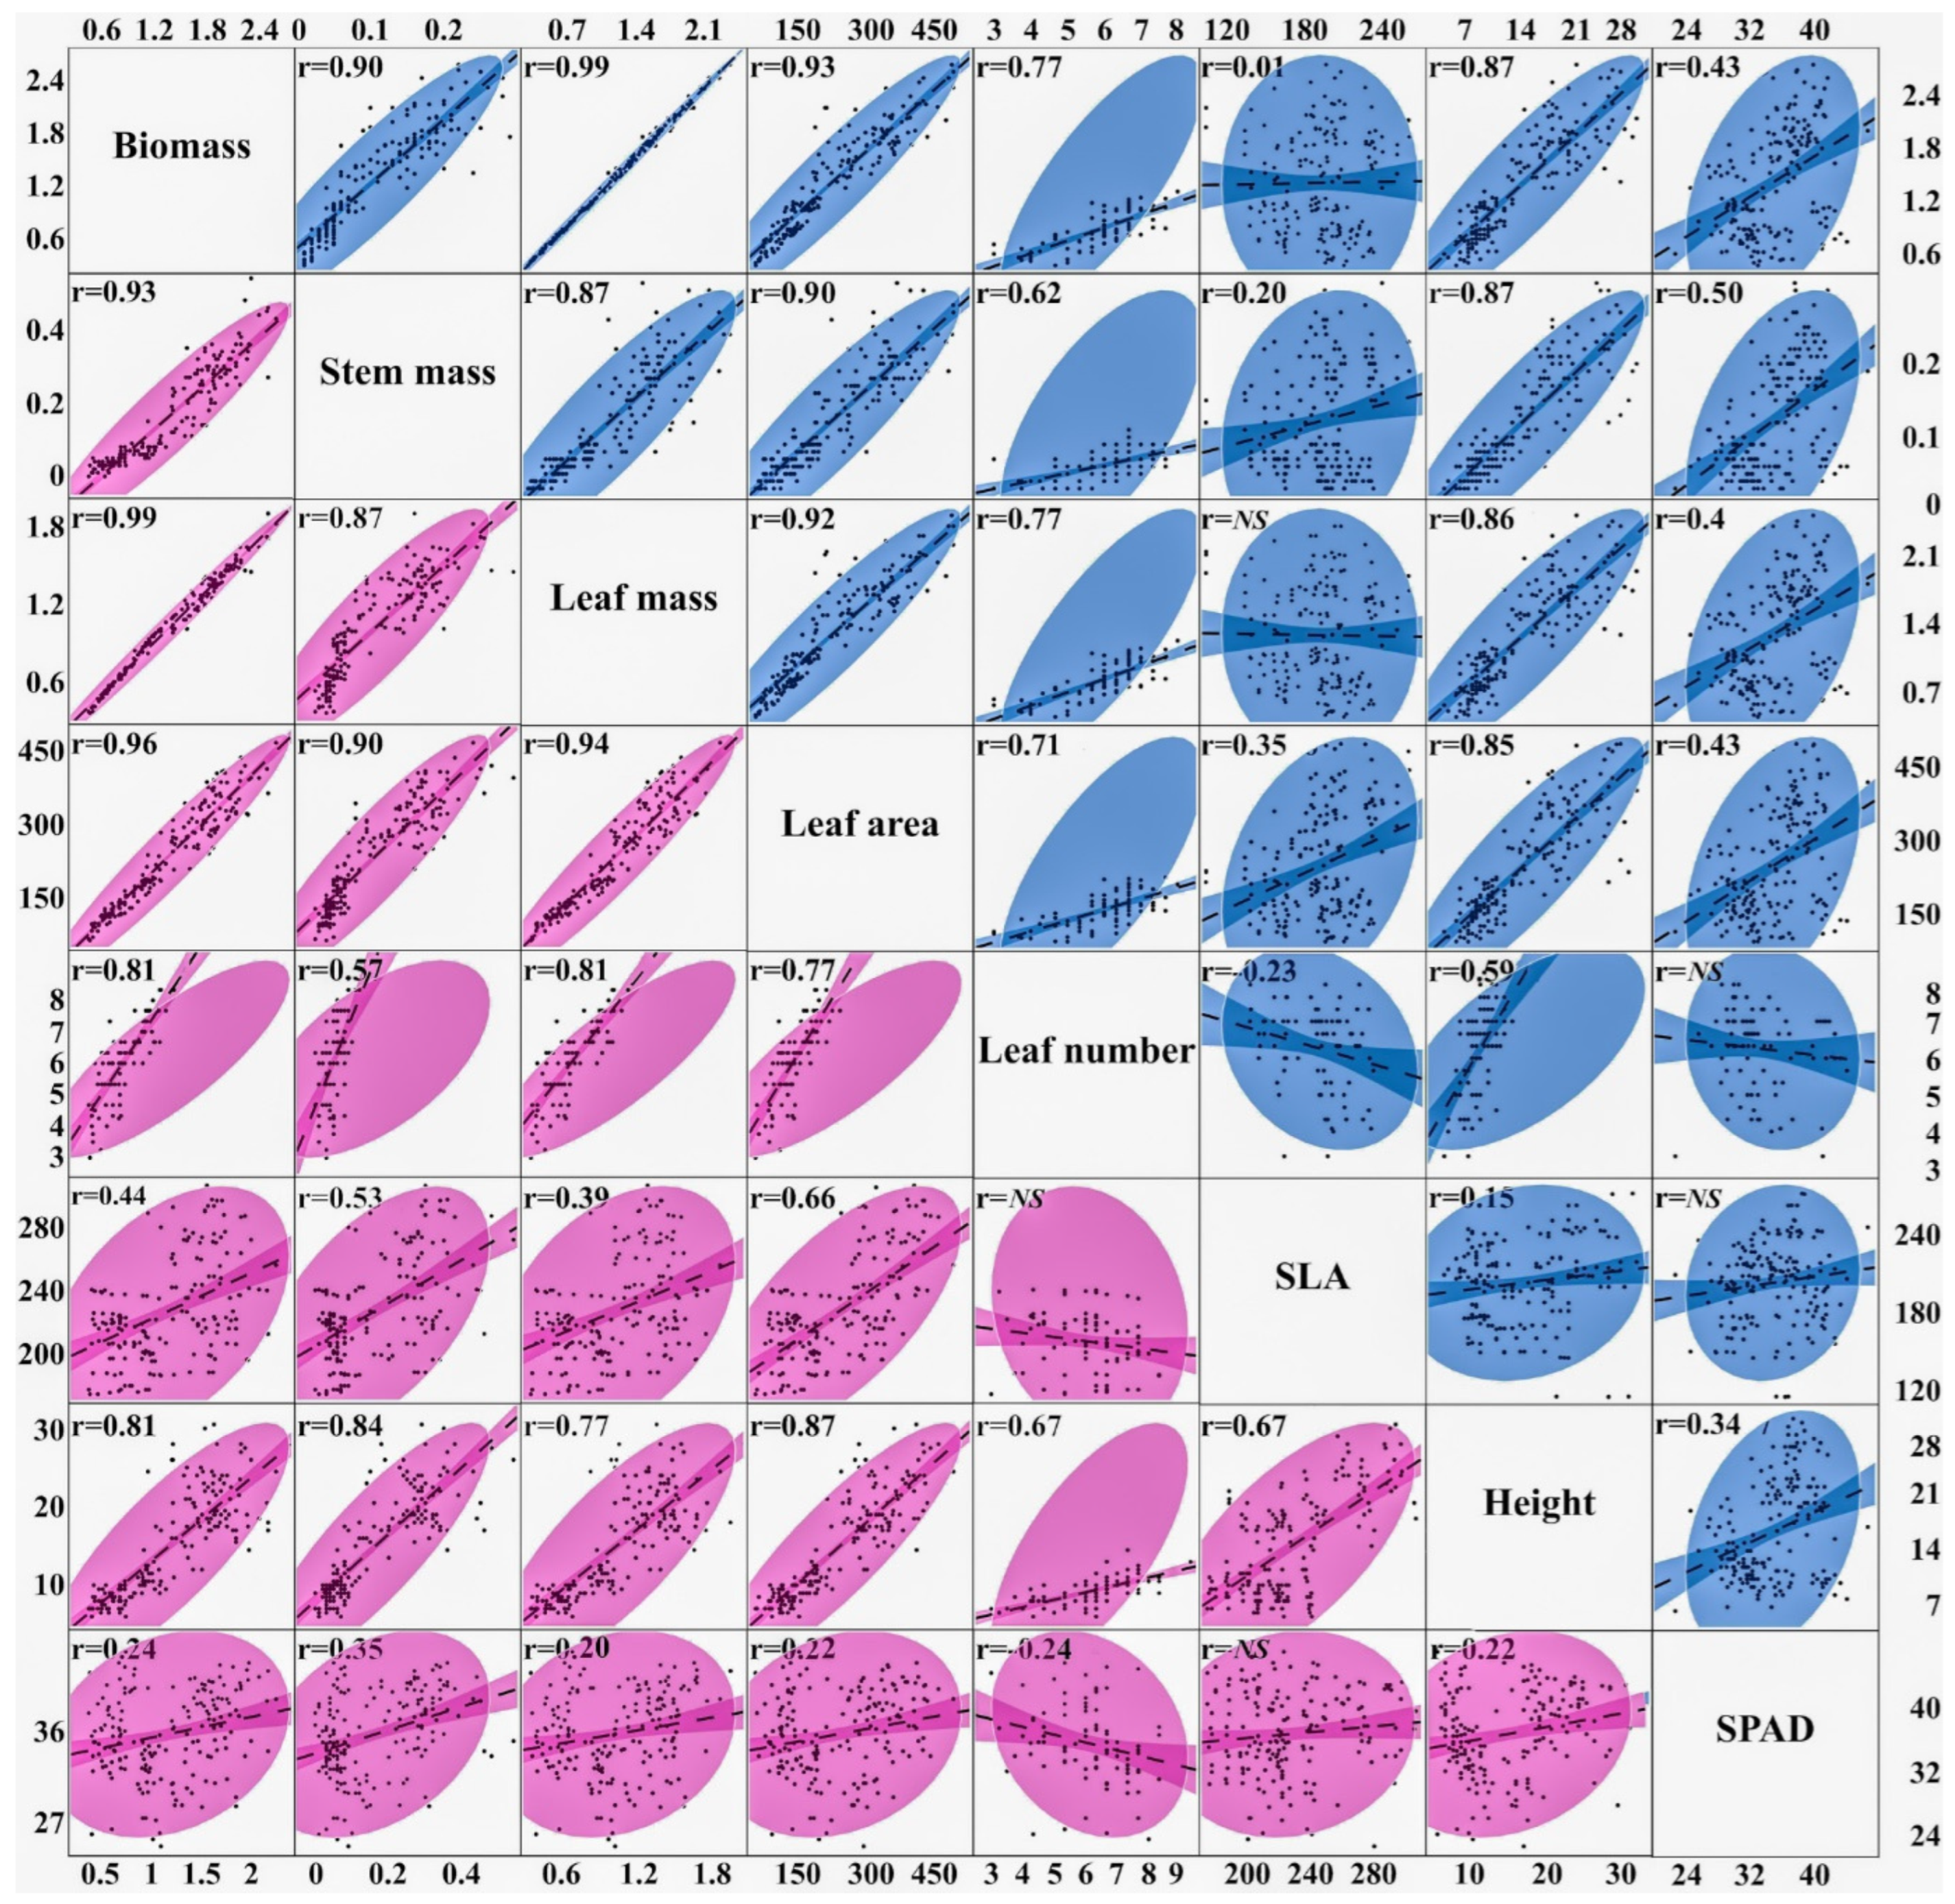
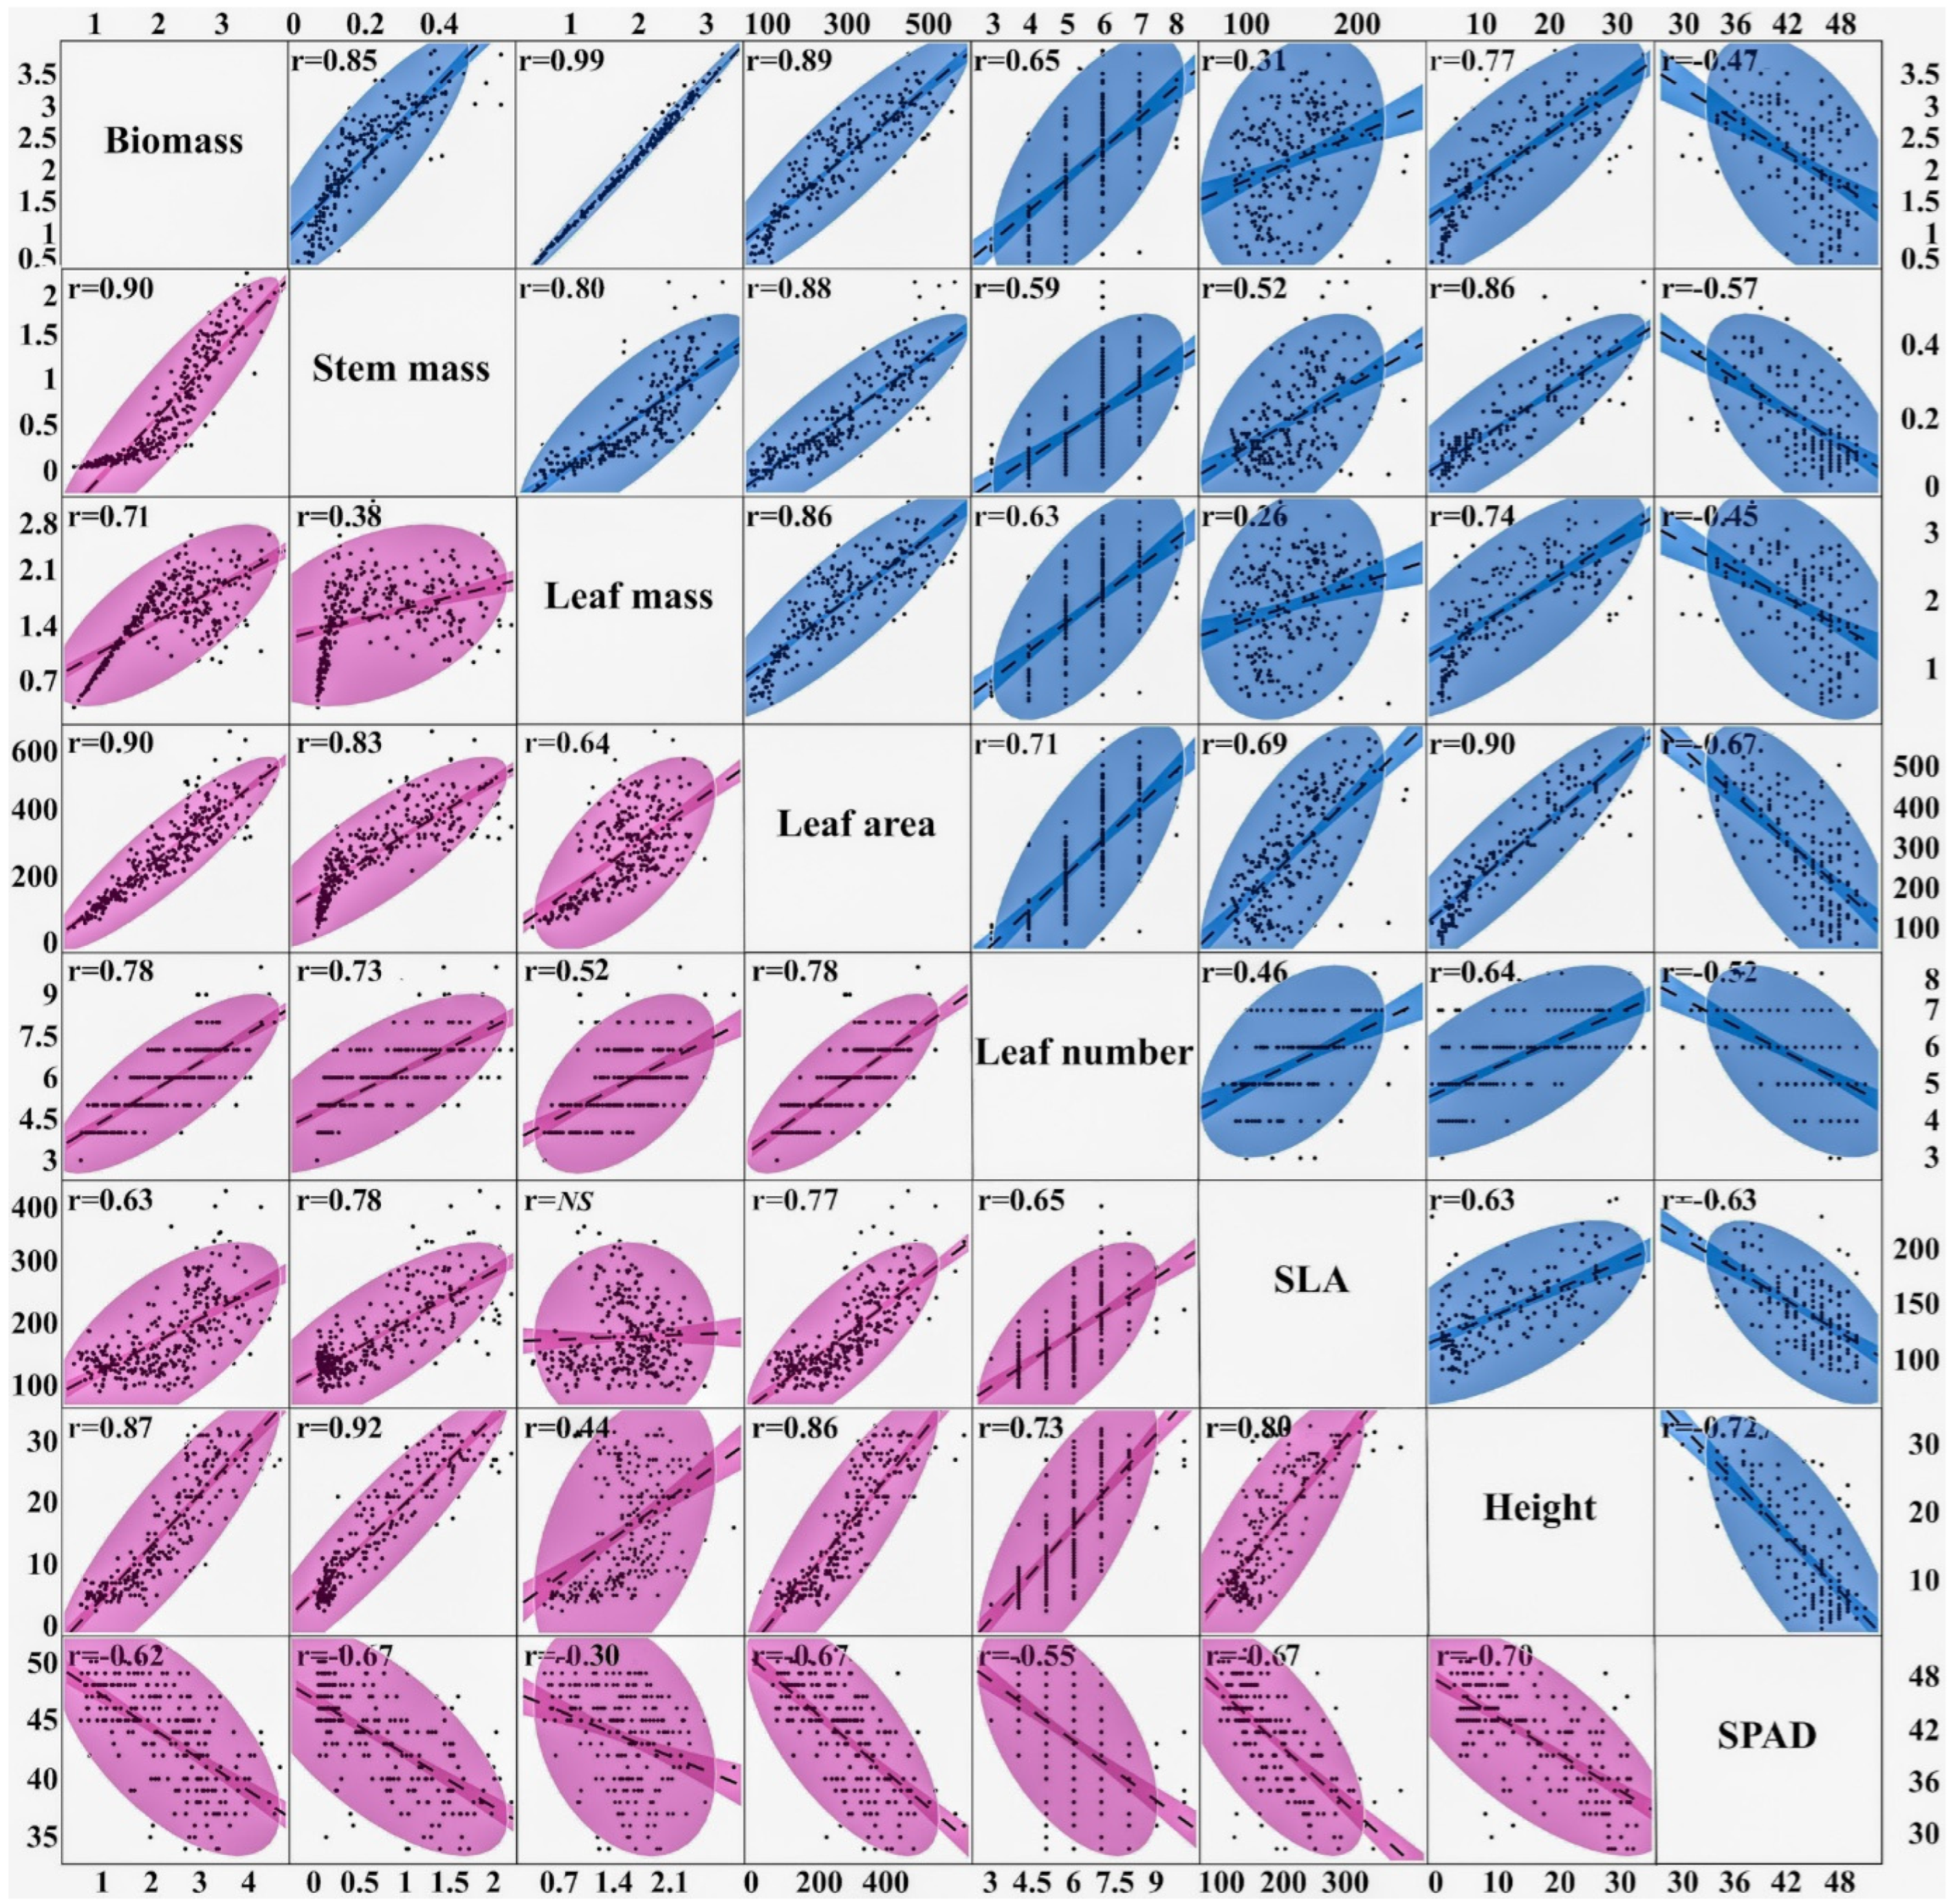
Generally, all measured parameters showcased strong positive relationships among each other, with few exceptions, including for SPAD-Chlorophyll and SLA among years (Figure 5 and Figure 6). Among biomass parameters, including total biomass, stem mass, leaf mass, leaf area, leaf number, and height, strong positive relationships were observed (0.59 ≥ r ≤ 0.99, across 2022 and 2023) for winter canola. Similar findings (0.52 ≥ r ≤ 0.92) were observed for spring-type canola in both years, except for a comparatively low correlation of leaf mass with stem mass (r = 0.38) and height (r = 0.45) in 2023. For winter canola, SLA largely showed a relatively low correlation with other measured parameters (0.01 ≥ |r| ≤ 0.24 in 2022; 0.31 ≥ |r| ≤ 0.52 in 2023). The exceptions include a relatively high correlation for SLA with leaf area in both years, including with height (r = 0.63) and SPAD-Chlorophyll (r = −0.63) in 2023. Comparatively, spring canola had relatively significantly high correlations between SLA and other measured parameters (0.39 ≥ r ≤ 0.67 in 2022; 0.63 ≥ |r| ≤ 0.81 in 2023), except for those with leaf number and SPAD-Chlorophyll in 2022 and leaf mass in 2023. Interestingly, SPAD-Chlorophyll for both canola types largely showed positive relationships among other parameters with relatively low correlations (0.20 ≥ |r| ≤ 0.50, excluding leaf number and SLA for winter-type canola) in 2022. However, largely high correlations with negative relationships (−0.73 ≥ r ≤ −0.30) were observed between SPAD-Chlorophyll and other measured parameters in 2023.
Broad-sense genotypic heritability (H2) for the measured plant parameters ranged low to medium from 0.12 to 0.67 for winter canola and 0.28–0.45 for spring canola across the years (Table 4). Overall, among both canola types, relatively similar H2 with medium values were observed for biomass, leaf mass, and leaf area (0.38 ≥ H2 ≤ 0.45), while stem mass consistently showed the least H2 ≤ 0.28. Comparatively, except for SLA for spring canola, most morpho-physiological parameters, including height, leaf number, SLA, and SPAD-Chlorophyll, showed relatively high medium heritability (0.44 ≥ H2 ≤ 0.67).

4. Discussion

In a non-saline control condition, all parameters were higher than the values under the salinity stress conditions except for SPAD-Chlorophyll in 2023 (Table 4). Salinity impacts differed in response and magnitude among plant traits depending on canola type, genotype, salinity level, and year. However, the limitations of imposed salinity stress based on NaCl should be noted for implications to field conditions. Often, complex salinity issues are observed in the field associated with several ions such as Ca2+, Mg2+, and SO42−. Nevertheless, in the study, increased salinity had deleterious impacts with linear or quadratic responses on the morphophysiological parameters. On rankings from high to low salinity impacts, significant negative effects were found on stem mass, height, leaf area, biomass, leaf mass, SLA, and leaf number overall (Table 4). Similar detrimental effects of salinity on canola growth have been found in previous studies [31,32,33]. These authors reported similar findings of reduced biomass, plant height, leaf area, leaf number, chlorophyll content, and yield of canola under saline environments. Such negative impacts of salinity on canola growth were linked to physiochemical responses, including ion toxicity, oxidative stress caused by reactive oxygen species, altered nutrient uptake balance, reduced osmotic/water potential, and impaired photosynthetic processes [11,13,18,34,35,36,37].
At a high salinity level of ≥6 dS m−1 EC levels, significant negative effects were particularly found on the plant parameters. For instance, except for a few linear relationships, canola genotypes of both types presented quadratic responses with a declining trend for biomass production, including leaf mass (Table 5 and Table 6). Such trends revealed a low to moderate reduction in the parameter values up to 4 dS m−1 EC but followed a sharp decline at high salinity levels. Additionally, canola establishment, growth, and biomass were exceptionally reduced at the highest salinity level at 10 dS m−1 (Figure 3 and Figure 4). This holds agronomic and economic implications, rendering such highly saline conditions unfavorable for canola cultivation. The salinity threshold limit of 6 dS m−1 aligns with a threshold range of 6–8 dS m−1 during the emergence stage, including the same canola genotypes under the same saline conditions [29]. Similarly, in laboratory conditions [38], a similar salinity threshold of 5.6 dS m−1 was reported, resulting in reduced vegetative growth and yield in canola. Likewise, a recent field study [39] evaluating seven canola genotypes revealed a significant negative effect at 6.2–7.8 dS m−1, while a past canola study [40] reported a threshold up to 10 dS m−1 salinity. Overall, the findings corroborate an upper threshold salinity limit of 6 dS m−1 for canola growth and development. Such a threshold salinity limit has implications for salinity management and canola production feasibility in saline environments.
SPAD-Chlorophyll is an important photosynthetic parameter widely assessed in previous studies investigating salinity tolerance [3,18,27,28,41]. The authors reported a decreased chlorophyll content under saline conditions. In this study, SPAD-Chlorophyll values across salinity stress declined by 6.9–9.6% of the control among canola types in 2022 (Table 4). A similar finding relating to increased chlorophyll accumulation under salinity was found in transgenic canola [22]. In contrast, an inverse relationship was found with a linear increase (+15.2–17.7%) in SPAD-Chlorophyll compared to non-saline control in 2023 (Table 4). This may likely be associated with a comparatively high reduction in leaf area at elevated salinity levels in 2023 compared to 2022 (Figure 3 and Figure 4). For instance, a study [42] cited reduced chlorophyll effect by salinity; however, increased parameter values were noted with increasingly high salinity levels corresponding to decreases in leaf area character. This previous finding provides added insights, lending support to the increased Chlorophyll content in 2023. Nevertheless, the SPAD-Chlorophyll tended towards high values at elevated salinity levels, particularly at 10 dS m−1 in both study years overall (data not presented). This may likely be associated with an exceptional decrease in leaf area, including SLA, characterizing the salinity effect in canola.
Previous studies have suggested a potential for salt tolerance in canola among other crop species [10,16,34,43]. In this study, genotypic differences were noted, although the differences were variable among the salinity levels. Such inconsistencies may be associated with the above-discussed differential regression responses among genotypes at different salinity levels (Table 5 and Table 6). Intra-species variations in salt tolerance have been previously documented in canola [15,17,35,44,45]. The authors linked salinity tolerance potential with high relative leaf water content, differential uptake of selective ions, toxic ion exclusion, antioxidative defense system, and sustained photosynthesis. These previous findings extend support to the observed genotype differences under salinity stress in the study. Overall, genotypes G2, G4, G5, G6, and G9 among winter canola and G12, G14, G16, and G17 among spring canola types were identified as relatively salt-tolerant. Generally, these genotypes also exhibited relatively high or moderate emergence rates and salt tolerance index under similar salinity stresses in another study [29]. Although the studies suggest genotypic merits during the emergence and vegetative stages, implications may be limited concerning salinity tolerance abilities during the grain yield period. Nonetheless, identified genotypes were largely characterized by high values for the measured parameters. The findings underscore a future scope of canola breeding for salt tolerance and a validation extended out to a complete growth cycle under field conditions.
Between the canola types, relatively greater biomass productivity and other morpho-physiological parameters were found for spring canola than winter canola under saline conditions (Table 4). Such focused analysis comparing winter and spring canola is unavailable from previous research works investigating salinity impacts on canola production. The finding suggests a relatively higher salt tolerance potential in spring canola than in winter canola. In our other study [29] testing the same genotypes and salinity stress during the emergence stage, we also showed higher salinity tolerance in spring canola compared to winter type, further corroborating findings in this study. Further, a contrasting relationship was found between canola types, with differential growth responses of significantly high leaf mass in winter canola, while high stem mass and SLA in more salt-tolerant spring canola in both years (Table 4). Studies have associated increased leaf thickness or low SLA with higher salinity impacts in canola [46,47]. Both SLA and stem mass had high positive correlations (Figure 5 and Figure 6) with the examined growth and morpho-physiological parameters. Results highlight SLA, including stem mass, as potential plant traits for salinity tolerance in canola. From a physiological standpoint, high SLA implies more efficient leaf area production, leading to better use of resources, limited for plant uptake under saline conditions. Likewise, high stem mass may link to mechanical abilities to better support and transport plant resources under a salt-restricted environment. However, the merits of these parameters as salt-tolerant indicators warrant further research investigation and validation.

5. Conclusions

Substantial negative impacts of salinity were observed in this study, and salinity > 6 dS m−1 EC significantly reduced canola growth and development. Genotypic differences were variable among salinity levels; nevertheless, results indicate a salt tolerance potential for further improvement by breeding. Generally, genotypes Athena, Ericka, CP320WRR, CP115W, and CP225WRR among winter canola and Empire, Monarch, Profit, and Westar among spring canola types were more salt-tolerant. Meanwhile, spring canola showed high salinity tolerance compared to the winter type, with high biomass productivity. Additionally, differential salinity impact revealed high leaf mass with greater leaf thickness in winter canola but more efficient leaf area production in spring canola. Both SLA and stem mass were highly correlated with most plant traits, with significantly high values for spring canola types. Findings suggest spring canola genotypes (e.g., Empire, Monarch) are more suitable for saline regions, while SLA and stem mass serve as potential proxies for breeding programs targeting salt tolerance. However, the conclusions warrant further validation through future canola investigations.

Author Contributions

R.S.: Conceptualization, Data curation, Methodology, Validation, Formal analysis, Investigation, Software, Writing—original draft, Writing—review and editing, Visualization, Supervision. Q.X.: Conceptualization, Data curation, Methodology, Validation, Formal analysis, Investigation, Resources, Writing—original draft, Writing—review and editing, Supervision, Project administration, Funding Acquisition. A.L.S.: Data curation, Investigation, Validation, Writing—review and editing. G.G.: Conceptualization, Investigation, Funding Acquisition, Writing—review and editing. S.S.P.: Investigation, Methodology, Writing—review and editing. V.N.C.: Methodology, Investigation; Writing—review and editing. S.K.: Conceptualization, Investigation, Funding Acquisition, Writing—review and editing. A.L.U.: Conceptualization, Investigation, Funding Acquisition, Writing—review and editing. S.Z.: Conceptualization, Investigation, Funding Acquisition, Writing—review and editing. All authors have read and agreed to the published version of the manuscript.

Funding

This project was supported by the USDA National Institute of Food and Agriculture (NIFA), Supplemental and Alternative Crops Competitive (SAC) Program Award #2021-38624-35737.

Data Availability Statement

Data will be made available on request.

Acknowledgments

We thank Chengci Chen, Montana State University, for providing canola seeds, Jack Brown, formerly of the University of Idaho, for providing support on canola genetic information, and Robert P. Flynn, retiree of New Mexico State University, for providing support on funding acquisition. We also thank Patrica Monk and the staff of the New Mexico State University Artesia Agricultural Science Center for their support of this project.

Conflicts of Interest

The authors declare that there are no conflicts of interest.

Abbreviations

The following abbreviations are used in this manuscript:
CTControl treatment
DATDays after transplanting
ECElectrical conductivity
LSDLeast Significant Difference
SLASpecific leaf area
STSalinity treatment

References

  1. Cox, C.; Jin, L.; Ganjegunte, G.; Borrok, D.; Lougheed, V.; Ma, L. Soil quality changes due to flood irrigation in agricultural fields along the Rio Grande in western Texas. Appl. Geochem. 2018, 90, 87–100. [Google Scholar] [CrossRef]
  2. Flynn, R.; Ulery, A. An Introduction to Soil Salinity and Sodium Issues in New Mexico; Circular 656; New Mexico State University: Las Cruces, NM, USA, 2011; pp. 1–12. [Google Scholar]
  3. Sabagh, A.E.; Hossain, A.; Barutçular, C.; Islam, M.S.; Ratnasekera, D.; Kumar, N.; Meena, R.S.; Gharib, H.S.; Saneoka, H.; Silva, J.A.T.D. Drought and salinity stress management for higher and sustainable canola (Brassica napus L.) production: A critical review. Aust. J. Crop Sci. 2019, 13, 88–97. [Google Scholar] [CrossRef]
  4. Stavi, I.; Thevs, N.; Priori, S. Soil salinity and sodicity in drylands: A review of causes, effects, monitoring, and restoration measures. Front. Environ. Sci. 2021, 9, 712831. [Google Scholar] [CrossRef]
  5. FAO. Global Symposium on Salt-Affected Soils: Outcome Document; FAO: Geneva, Switzerland, 2022. [Google Scholar] [CrossRef]
  6. Negacz, K.; Malek, Ž.; De Vos, A.; Vellinga, P. Saline soils worldwide: Identifying the most promising areas for saline agriculture. J. Arid Environ. 2022, 203, 104775. [Google Scholar] [CrossRef]
  7. Musie, W.; Gonfa, G. Fresh water resource, scarcity, water salinity challenges and possible remedies: A review. Heliyon 2023, 9, e18685. [Google Scholar] [CrossRef]
  8. Mehta, S.; Fryar, A.E.; Brady, R.M.; Morin, R.H. Modeling regional salinization of the Ogallala aquifer, Southern High Plains, TX, USA. J. Hydrol. 2000, 238, 44–64. [Google Scholar] [CrossRef]
  9. Miyamoto, S. Salinization of Irrigated Urban Soils: A Case Study of El Paso, TX. 2012. Available online: https://oaktrust.library.tamu.edu/server/api/core/bitstreams/bc0c192b-3d26-4853-9dba-40eeba7c5a0e/content (accessed on 28 June 2025).
  10. Miyamoto, S.; Foster, M.; Trostle, C.; Glenn, E. Salt tolerance of oilseed crops during establishment. J. Arid Land Stud. 2012, 22, 147–151. [Google Scholar]
  11. Abbasi, H.; Jamil, M.; Haq, A.; Ali, S.; Ahmad, R.; Malik, Z.; Parveen. Salt stress manifestation on plants, mechanism of salt tolerance and potassium role in alleviating it: A review. Zemdirb. Agric. 2016, 103, 229–238. [Google Scholar] [CrossRef]
  12. Ashraf, M.; Ali, Q. Relative membrane permeability and activities of some antioxidant enzymes as the key determinants of salt tolerance in canola (Brassica napus L.). Environ. Exp. Bot. 2008, 63, 266–273. [Google Scholar] [CrossRef]
  13. Fehr, W.; Suza, W. Principles of Cultivar Development; Iowa State University Digital Press: Ames, IA, USA, 2025. [Google Scholar] [CrossRef]
  14. Ashraf, M.; McNeilly, T. Salinity tolerance in Brassica oilseeds. Crit. Rev. Plant Sci. 2004, 23, 157–174. [Google Scholar] [CrossRef]
  15. Bandehagh, A.; Dehghanian, Z.; Henry, R.; Anwar Hossain, M. Salinity tolerance in canola: Insights from proteomic studies. In Brassica Breeding and Biotechnology; Aminul Islam, A.K.M., Anwar Hossain, M., Mominul Islam, A.K.M., Eds.; IntechOpen: London, UK, 2021. [Google Scholar] [CrossRef]
  16. Iqbal, M.; Athar, H.-U.-R.; Ibrahim, M.; Javed, M.; Zafar, Z.U.; Ashraf, A. Leaf proteome analysis signified that photosynthesis and antioxidants are key indicators of salinity tolerance in canola (Brassica napus L.). Pak. J. Bot. 2019, 51, 1955–1968. [Google Scholar] [CrossRef] [PubMed]
  17. Shah, A.N.; Tanveer, M.; Abbas, A.; Fahad, S.; Baloch, M.S.; Ahmad, M.I.; Saud, S.; Song, Y. Targeting salt stress coping mechanisms for stress tolerance in Brassica: A research perspective. Plant Physiol. Biochem. 2021, 158, 53–64. [Google Scholar] [CrossRef] [PubMed]
  18. Ulfat, M.; Athar, H.-R.; Khan, Z.; Kalaji, H.M. RNAseq analysis reveals altered expression of key ion transporters causing differential uptake of selective ions in Canola (Brassica napus L.) grown under NaCl stress. Plants 2020, 9, 891. [Google Scholar] [CrossRef] [PubMed]
  19. Sakr, M.T.; El-Sarkassy, N.M.; Fuller, M.P. Osmoregulators proline and glycine betaine counteract salinity stress in canola. Agron. Sustain. Dev. 2012, 32, 747–754. [Google Scholar] [CrossRef]
  20. Ali, E.A.; Galal, A.H.; Abou-Elwafa, S.F.; Abd El-Monem, A.M.A.; Saker, D.S.S. Study the response of five canola cultivars to foliar spraying by some antioxidants. J. Plant Prod. 2020, 11, 419–424. [Google Scholar] [CrossRef]
  21. Abdel Latef, A.A.H.; Omer, A.M.; Badawy, A.A.; Osman, M.S.; Ragaey, M.M. Strategy of salt tolerance and interactive impact of Azotobacter chroococcum and/or Alcaligenes faecalis inoculation on Canola (Brassica napus L.) plants grown in saline soil. Plants 2021, 10, 110. [Google Scholar] [CrossRef]
  22. Li, H.; Lei, P.; Pang, X.; Li, S.; Xu, H.; Xu, Z.; Feng, X. Enhanced tolerance to salt stress in canola (Brassica napus L.) seedlings inoculated with the halotolerant Enterobacter cloacae HSNJ4. Appl. Soil Ecol. 2017, 119, 26–34. [Google Scholar] [CrossRef]
  23. Sun, X.; Feng, X.; Li, C.; Zhang, Z.; Wang, L. Study on salt tolerance with YHem1 transgenic canola (Brassica napus). Physiol. Plant. 2015, 154, 223–242. [Google Scholar] [CrossRef]
  24. Kandil, A.; Sharief, A.; Abido, W.; Ibrahim, M. Response of some canola cultivars (Brassica napus L.) to salinity stress and its effect on germination and seedling properties. J. Crop Sci. 2012, 3, 98–103. [Google Scholar]
  25. Mousavi, M.; Omidi, H. Seed priming with bio-priming improves stand establishment, seed germination and salinity tolerance in canola cultivar (Hayola 401). Iran. J. Plant Physiol. 2019, 9, 2807–2817. [Google Scholar]
  26. Ahmadi, S.H.; Ardekani, J.N. The effect of water salinity on growth and physiological stages of eight Canola (Brassica napus) cultivars. Irrig. Sci. 2006, 25, 11–20. [Google Scholar] [CrossRef]
  27. Anagholi, A.; Tabatabaee, S.A. Salinity tolerance indices of Barley, Cotton, Canola, and Forage sorghum cultivars. Iran. J. Soil Res. 2019, 33, 45–59. [Google Scholar] [CrossRef]
  28. Jan, S.; Shinwari, Z.; Rabbani, M. Morpho-biochemical evaluation of Brassica rapa sub-species for salt tolerance. Genetika 2016, 48, 323–338. [Google Scholar] [CrossRef]
  29. Kholghi, M.; Toorchi, M.; Bandeh-Hagh, A.; Shakiba, M.R. An evaluation of canola genotypes under salinity stress at vegetative stage via morphological and physiological traits. Pak. J. Bot. 2018, 50, 447–455. [Google Scholar]
  30. Shrestha, R.; Xue, Q.; Leiva Soto, A.; Ganjegunte, G.; Palmate, S.S.; Chaganti, V.N.; Kumar, S.; Ulery, A.L.; Flynn, R.P.; Zapata, S. Seedling emergence in winter and spring canola genotypes under salinity stress. Crop Sci. 2025, 65, e70011. [Google Scholar] [CrossRef]
  31. Bybordi, A. The influence of salt stress on seed germination, growth and yield of canola cultivars. Not. Bot. Horti Agrobot. Cluj-Napoca 2010, 38, 128–133. [Google Scholar]
  32. Kamrani, M.H.; Hosseinniya, H.; Chegeni, A.R. Effect of salinity on the growth characteristics of canola (Brassica napus L.). Tech. J. Eng. App. Sci. 2013, 3, 2327–2333. [Google Scholar]
  33. Steppuhn, H.; Raney, J.P. Emergence, height, and yield of canola and barley grown in saline root zones. Can. J. Plant Sci. 2005, 85, 815–827. [Google Scholar] [CrossRef]
  34. Grewal, H.S. Water uptake, water use efficiency, plant growth and ionic balance of wheat, barley, canola and chickpea plants on a sodic vertosol with variable subsoil NaCl salinity. Agric. Water Manag. 2010, 97, 148–156. [Google Scholar] [CrossRef]
  35. Gul, H.S.; Ulfat, M.; Zafar, Z.U.; Haider, W.; Ali, Z.; Manzoor, H.; Afzal, S.; Ashraf, M.; Athar, H.-R. Photosynthesis and salt exclusion are key physiological processes contributing to salt tolerance of Canola (Brassica napus L.): Evidence from physiology and transcriptome analysis. Genes 2022, 14, 3. [Google Scholar] [CrossRef]
  36. Mukhtar, E.; Siddiqi, E.H.; Bhatti, K.; Nawaz, K.; Hussain, K. Gas exchange attributes can be valuable selection criteria for salinity tolerance in canola cultivars (Brassica napus L.). Pak. J. Bot. 2013, 45, 35–40. [Google Scholar]
  37. Rasheed, R.; Ashraf, M.A.; Parveen, S.; Iqbal, M.; Hussain, I. Effect of salt stress on different growth and biochemical attributes in two canola (Brassica napus L.) cultivars. Commun. Soil Sci. Plant Anal. 2014, 45, 669–679. [Google Scholar] [CrossRef]
  38. Steppuhn, H.; Volkmar, K.M.; Miller, P.R. Comparing Canola, Field Pea, Dry Bean, and Durum Wheat crops grown in saline media. Crop Sci. 2001, 41, 1827–1833. [Google Scholar] [CrossRef]
  39. Alsharari, S.F.; Ibrahim, A.A.; Okasha, S.A. Combining ability for yield, oil content, and physio-biochemical characters of canola (Brassica napus L.) under salt stress conditions. SABRAO J. Breed. Genet. 2023, 55, 1003–1024. [Google Scholar] [CrossRef]
  40. Francois, L.E. Growth, seed yield, and oil content of canola grown under saline conditions. Agron. J. 1994, 86, 233–237. [Google Scholar] [CrossRef]
  41. Sharifi, P.; Seyedsalehi, M.; Paladino, O.; Van Damme, P.; Sillanpää, M.; Sharifi, A. Effect of drought and salinity stresses morphological and physiological characteristics of canola. Int. J. Environ. Sci. Technol. 2017, 15, 1859–1866. [Google Scholar] [CrossRef]
  42. Bandehagh, A.; Motienoparvar, P.; Heidari, A. Chlorophyll content and Chlorophyll Fluorescence in canola cultivars in response to salinity. Int. J. Adv. Sci. Eng. Technol. 2015, 5, 90–93. [Google Scholar]
  43. Huang, J.; Redmann, R.E. Salt tolerance of Hordeum and Brassica species during germination and early seedling growth. Can. J. Plant Sci. 1995, 75, 815–819. [Google Scholar] [CrossRef]
  44. Rameeh, V. Ions uptake, yield and yield attributes of rapeseed exposed to salinity stress. J. Soil Sci. Plant Nutr. 2012, 12, 851–861. [Google Scholar] [CrossRef]
  45. Tahmasebpour, B.; Nojadeh, M.S.; Esmaeilpour, M. Salt stress tolerance of spring canola (Brassica napus L.) cultivars. Int. J. Plant Biol. Res. 2018, 6, 1098. [Google Scholar]
  46. Hosseinifard, M.; Stefaniak, S.; Ghorbani Javid, M.; Soltani, E.; Wojtyla, Ł.; Garnczarska, M. Contribution of exogenous proline to abiotic stresses tolerance in plants: A Review. Int. J. Mol. Sci. 2022, 23, 5186. [Google Scholar] [CrossRef] [PubMed]
  47. Zadeh, H.; Naeini, M. Effects of salinity stress on the morphology and yield of two cultivars of canola (Brassica napus L.). J. Agron. 2007, 6, 409–414. [Google Scholar] [CrossRef]
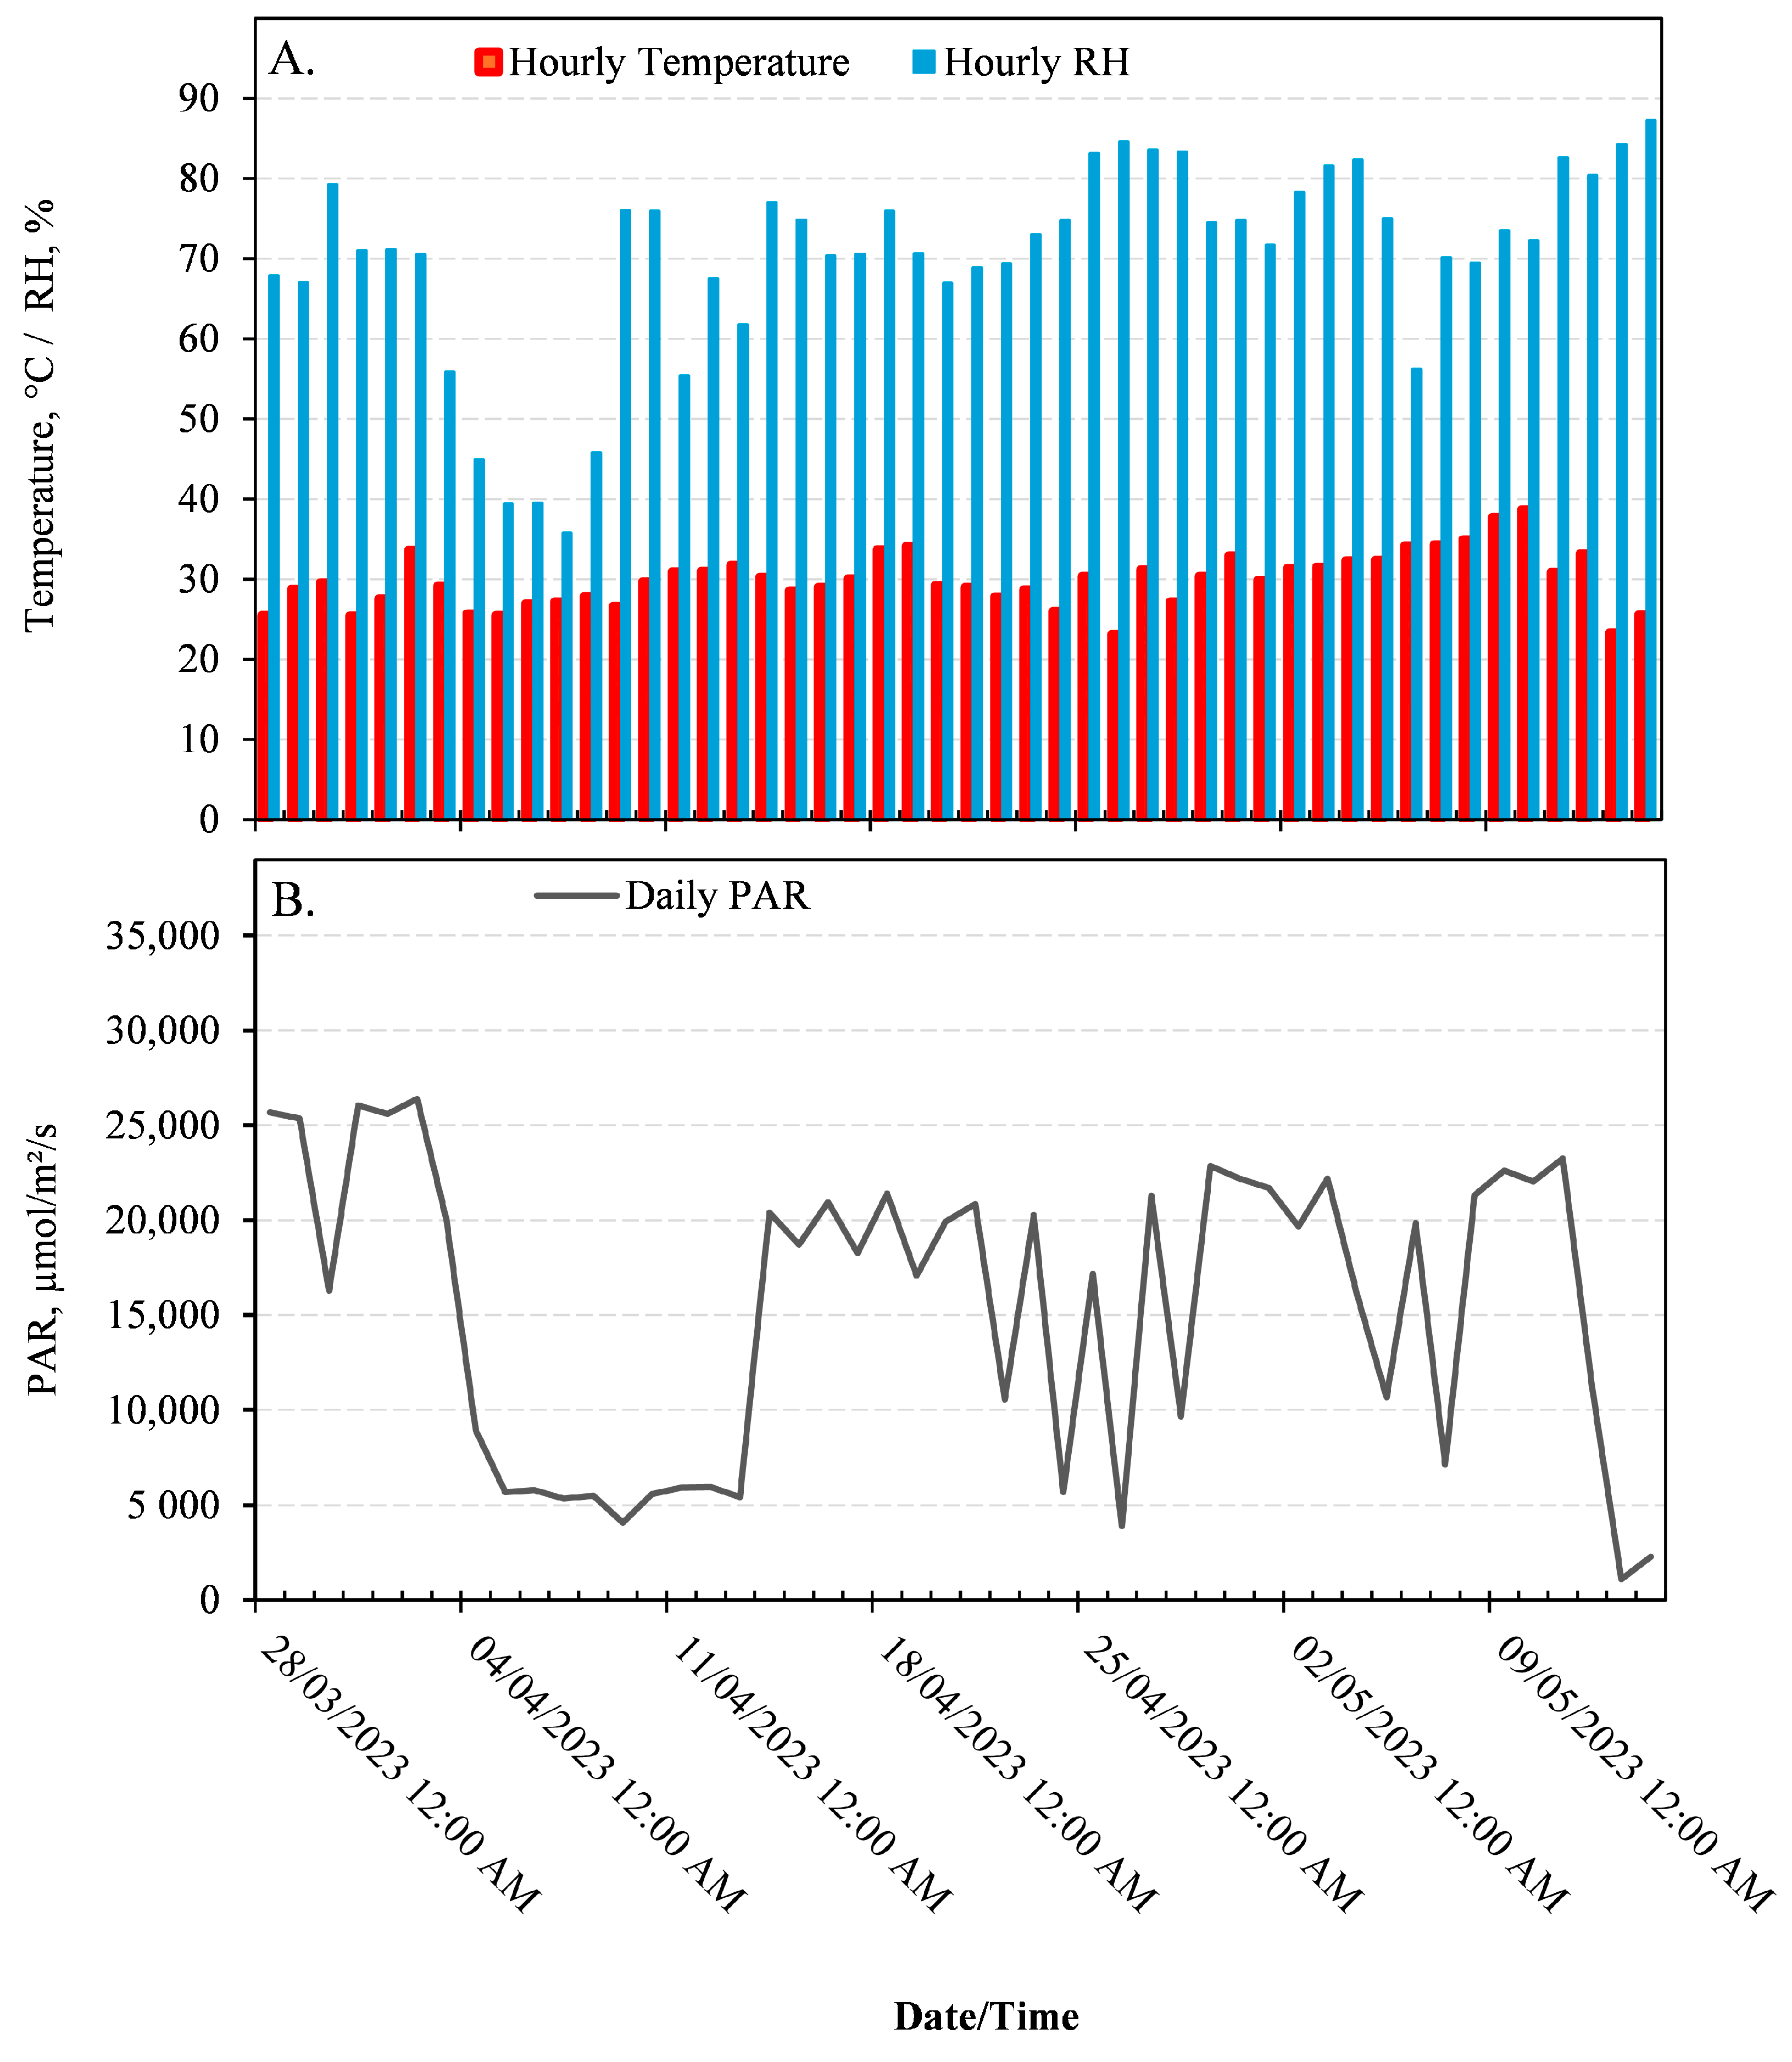
Figure 1. The climatic conditions during the study in 2023: (A) Hourly temperature (°C) and relative humidity (RH, %) and (B) Daily photosynthetically active radiation (PAR, µmol/m2/s).
Agronomy 15 01657 g001
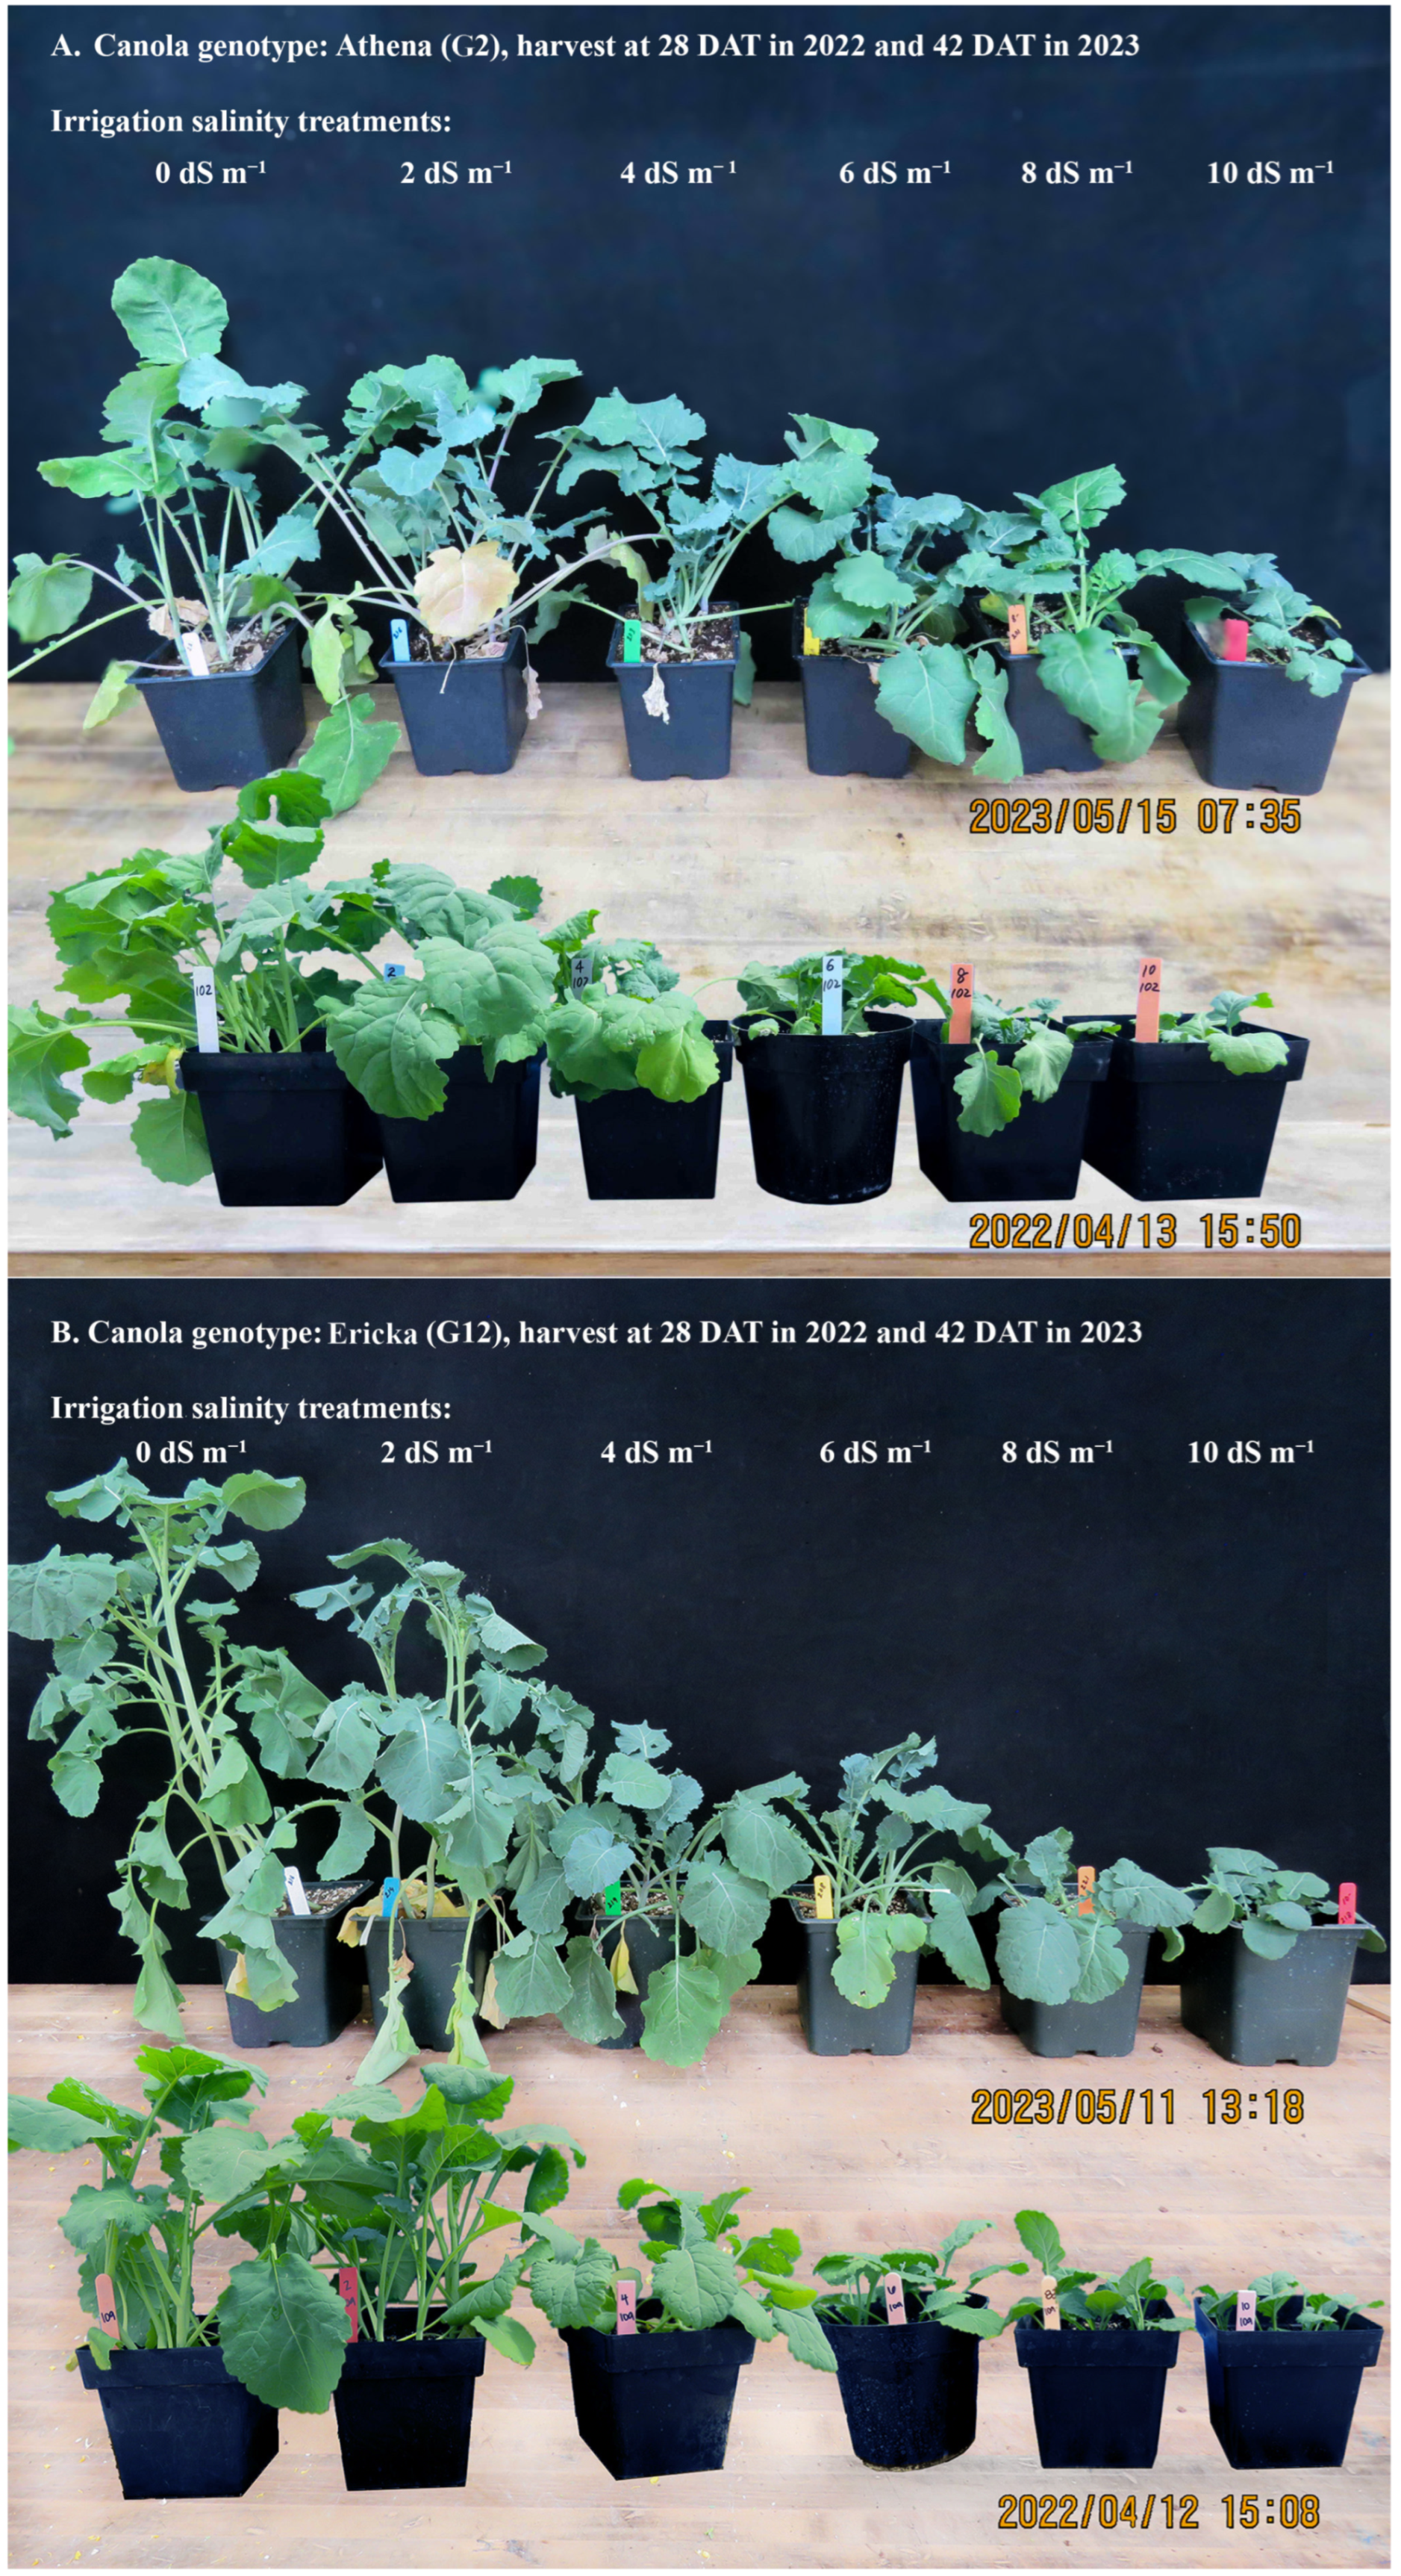
Figure 2. A photograph from the Canola study showing salinity effect under 2, 4, 6, 8, and 10 dS m−1 EC levels (left to right following the control 0 dS m−1) on canola genotypes; (A) winter type: G2 (Athena) and (B) spring type: G12 (Ericka) in 2022 and 2023.
Agronomy 15 01657 g002
Figure 3. Salinity effect on plant traits of ten canola genotypes, each for winter (A) and spring type (B), 28 days after transplanting under controlled greenhouse conditions at Bushland, TX in 2022. The graphical bar (I) above each genotype group at each salinity level denotes the LSD (Least Significant Difference) value for genotypic differences, if significant at p ≤ 0.05 or p ≤ 0.10 *. Different UPPERCASE letters denote statistical difference among salinity treatments across genotypes at p < 0.05.
Agronomy 15 01657 g003
Figure 4. Salinity effect on plant traits of ten canola genotypes, each for winter (A) and spring type (B), 48 days after transplanting under controlled greenhouse conditions at Bushland, TX in 2023. The graphical bar (I) above each genotype group at each salinity level denotes the LSD (Least Significant Difference) value for genotypic differences, if significant at p ≤ 0.05 or p ≤ 0.10 *. Different UPPERCASE letters denote statistical difference among salinity treatments across genotypes at p < 0.05.
Agronomy 15 01657 g004
Figure 5. Pairwise correlations of measured plant morpho-physiological and productivity parameters for each canola type in 2022. The color-coded upper-right and lower-left triangular matrices represent the winter and spring canola types, respectively. Each graph includes a linear fit by a dashed black line, a 95% confidence limit by an oval-shaped region, the correlation coefficient (r), and raw data points by black dots. NS denotes a non-significant (p > 0.05) r-value.
Agronomy 15 01657 g005
Figure 6. Pairwise correlations of measured plant morpho-physiological and productivity parameters for each canola type in 2023. The color-coded upper-right and lower-left triangular matrices represent the winter and spring canola types, respectively. Each graph includes a linear fit by a dashed black line, a 95% confidence limit by an oval-shaped region, a correlation coefficient (r), and raw data points by black dots. NS denotes a non-significant (p > 0.05) r-value.
Agronomy 15 01657 g006
Table 1. Canola study genotypes with genetic information and designated identifiers.
ID.GenotypeTypeSource/Origin
G1AmandaWinterUniversity of Idaho, Moscow, ID, USA
G2AthenaWinterUniversity of Idaho, USA
G3CP1022WC/ChinookWinterUniversity of Idaho, USA
G4Ericka—PI 597353WinterUniversity of Idaho, USA
G5CP320WRRWinterCROPLAN-WinField United, Arden Hills, MN, USA
G6CP115WWinterCROPLAN-WinField United, Minnesota, USA
G7SalutWinterSweden
G8DurolaWinterUniversity of Idaho, USA
G9CP225WRRWinterCROPLAN-WinField United, Minnesota, USA
G10ImpressWinterUniversity of Idaho, USA
G11ClearwaterSpringUniversity of Idaho, USA
G12EmpireSpringUniversity of Idaho, USA
G13GemSpringUniversity of Idaho, USA
G14MonarchSpringUniversity of Idaho, USA
G15IndustriousSpringUniversity of Idaho, USA
G16ProfitSpringCanada
G17Westar—PI 649150SpringCanada
G18Sunrise—PI597352SpringUniversity of Idaho, USA
G19Global—PI601200SpringSweden
G20PI432395SpringBangladesh
Table 2. The measured electrical conductivities (ECs) and chemical (NaCl) constituents of prepared saline irrigation water corresponding to each target salinity treatment level.
Target Salinity Level
(EC, dS m−1)
20222023
NaCl
g/L H2O
Measured EC
(dS m−1)
NaCl
g/L H2O
Measured EC
(dS m−1)
0 (Control)0.00 (tap H2O)0.720.00 (tap H2O)0.66
20.652.270.781.89
41.653.821.953.94
62.656.033.125.78
83.657.714.297.99
104.659.695.4610.3
Table 3. ANOVA summary for split-plot greenhouse pot study on plant traits analyses of Spring and Winter type Canola, including 10 genotypes each under salinity treatments in 2022 and 2023.
SourcePlant HeightBiomassStem MassLeaf MassLeaf AreaLeaves NumberSLASPAD
dfp-Valuedfp-Valuedfp-Valuedfp-Valuedfp-Valuedfp-Valuedfp-Valuedfp-Value
2022
Winter type
Replication
(R)
20.966820.596220.176920.691720.885620.007720.78820.246
Salinity
(S)
5<0.00015<0.00015<0.00015<0.00015<0.000120.00015<0.000150.0061
R × S10<0.000110<0.000110<0.000110<0.000110<0.000140.9643100.905610<0.0001
Genotype
(G)
90.052590.09019<0.000190.20829<0.00019<0.00019<0.000190.0001
G × S450.408450.4371450.0183450.2178450.0004180.615745<0.0001450.658
Spring type
R20.880120.223720.392720.191720.17420.481220.05820.091
S5<0.00015<0.00015<0.00015<0.00015<0.000120.00175<0.000150.011
R × S10<0.0001100.000210<0.0001100.0036100.044140.3167100.7505100.0003
G90.036490.006190.01190.001490.000790.01289<0.000190.003
G × S450.2915450.6273450.3828450.4916450.0018180.284545<0.0001450.391
2023
Winter type
R20.016130.002130.01430.006730.291320.330330.000220.013
S5<0.00015<0.00015<0.00015<0.00015<0.00015<0.00015<0.00015<0.0001
R × S100.0139150.0453150.1158150.0026150.0009100.2437150.0012100.010
G90.320890.208790.000290.225490.00099<0.000190.125590.533
G × S450.5697450.2665450.0061450.1611450.1246450.0292450.0033450.293
Spring type
R20.169830.002830.024830.003830.023820.175130.171820.598
S5<0.00015<0.00015<0.00015<0.00015<0.00015<0.00015<0.00015<0.0001
R × S100.7119150.0149150.2511150.0043150.4567100.6299150.0007100.893
G90.769290.27849<0.00019<0.000190.000590.00259<0.000190.176
G × S450.9704450.0354450.007145<0.0001450.0003450.558345<0.0001450.862
Table 4. Contrast analysis by canola types and salinity treatments (non-stress control; CT: 0 dS m−1 EC and salinity stress; ST: 2–10 dS m−1 EC) for morpho-physiological and biomass productivity parameters in a greenhouse pot study. Additionally, ST Impact (% CT) is the percent change under salinity stress compared to the control conditions.
ParameterCanola
Type
20222023Genotypic
Heritability (H2)
Control (CT)Salinity (ST)ST Impact
(% CT)
CT vs. ST
(p-Value)
CTSTST Impact
(% CT)
CT vs. ST
(p-Value)
Biomass
(g plant−1)
Winter (W)1.96 a1.10 a−43.9<0.00012.96 b2.00 b−32.4<0.00010.43
Spring (S)1.59 b1.09 a−31.4<0.00013.33 a2.09 a−37.2<0.00010.38
Stem mass
(g plant−1)
W0.19 b0.08 b−57.9<0.00010.36 b0.17 b−52.8<0.00010.12
S0.30 a0.13 a−56.7<0.00011.48 a0.52 a−64.9<0.00010.28
Leaf mass
(g plant−1)
W1.77 a1.02 a−42.4<0.00012.57 a1.83 a−28.8<0.00010.45
S1.29 b0.96 b−25.6<0.00011.62 b1.51 b−6.80.00030.39
Leaf area
(cm2 plant−1)
W345.89 a192.31 b−44.4<0.0001466.07 a247.52 a−46.9<0.00010.41
S351.13 a208.10 a−40.7<0.0001420.16 b237.36 b−43.5<0.00010.38
Leaves number
(plant−1)
W-5.93 a--6.57 b5.42 a−17.5<0.00010.46
S-6.13 a--7.05 a5.54 a−21.4<0.00010.45
Height
(cm)
W23.57 b12.55 a *−46.8<0.000125.58 b11.81 b−53.8<0.00010.44
S24.98 a12.85 a *−48.6<0.000127.95 a12.69 a−54.6<0.00010.45
SPAD-Chlorophyll W37.78 a34.16 b−9.6<0.000138.13 a44.87 a17.7<0.00010.54
S37.97 a35.35 a−6.9<0.000138.64 a44.52 a15.2<0.00010.44
SLA
(cm2 g−1)
W199.33 b190.04 b−4.7<0.0001184.35 b134.43 b−27.1<0.00010.67
S273.40 a217.42 a−20.5<0.0001269.37 a158.49 a−41.2<0.00010.29
Note: Different lowercase letters within each column for a measured parameter signify the statistical difference between the canola types at p ≤ 0.05, except for p ≤ 0.10 when denoted with a * sign. SLA: Specific Leaf Area.
Table 5. Parameter estimates and coefficient of determination (R2) showing linear (y = a + bx) and quadratic (y = a + bx + cx2) relationships for plant growth parameters under six salinity levels (0 dS m−1, Control; 2, 4, 6, 8, and 10 dS m−1 EC levels) for each canola genotype (ID) of winter and spring types under greenhouse pot study at Bushland, TX, USA in 2022. Regression coefficients were presented if significant at p ≤ 0.10.
IDPlant HeightBiomass Stem MassLeaf Mass Leaf AreaSpecific Leaf Area
abR2abcR2abR2abcR2abR2abR2
Winter type
G121.1−1.50.972.1−0.210.0030.930.20.00.961.9−0.180.0020.93371−31.30.95---
G221.6−1.40.942.2−0.210.0050.940.20.00.832.0−0.180.0040.95390−29.70.96---
G322.7−1.80.951.8−0.06−0.0080.860.20.00.891.7−0.06−0.0070.85331−24.00.90---
G423.6−1.80.952.1−0.180.0020.880.20.00.891.9−0.150.0010.88380−30.30.85---
G523.0−1.60.941.9−0.160.0030.900.20.00.921.7−0.120.0020.88364−28.50.97---
G621.3−1.40.941.9−0.13-0.720.20.00.841.7−0.11-0.68355−23.40.77---
G722.8−1.80.952.1−0.240.0060.880.10.00.902.0−0.230.0060.88223−15.50.8010610.30.89
G824.1−1.80.942.1−0.210.0060.830.20.00.881.8−0.160.0040.79330−25.50.91---
G924.9−2.00.972.0−0.14−0.0010.710.20.00.911.8−0.12−0.0010.65412−32.50.90242−6.10.54
G1022.4−1.60.931.9−0.13−0.0010.860.20.00.931.7−0.11−0.0020.85375−30.80.89---
Spring type
G1125.5−1.90.971.7−0.02−0.0120.700.30.00.771.40.01−0.0110.72370−27.20.94---
G1224.8−2.00.951.9−0.07−0.0060.850.40.00.941.5−0.01−0.0080.83416−31.40.97270−8.30.58
G1325.6−2.00.981.6−0.02−0.0100.870.30.00.871.30.01−0.0100.89383−29.50.92---
G1422.7−1.70.961.8−0.09−0.0040.740.30.00.811.5−0.06−0.0050.74375−27.20.87---
G1521.0−1.40.961.60.02−0.0140.740.30.00.751.30.04−0.0130.78382−28.60.93285−10.20.68
G1623.4−1.70.921.7−0.130.0010.750.30.00.841.4−0.06−0.0020.68376−28.50.91273−9.40.60
G1723.8−1.70.921.9−0.12-0.730.30.00.731.5−0.09-0.72378−26.30.77252−4.50.79
G1824.5−2.00.971.40.02−0.0140.840.30.00.931.10.06−0.0140.82327−23.40.80---
G1923.4−1.80.961.50.00−0.0090.730.20.00.921.20.03−0.0110.67323−21.20.79---
G2022.9−1.60.921.6−0.06−0.0050.850.40.00.921.20.00−0.0080.81324−21.40.87---
Table 6. Parameter estimates and coefficient of determination (R2) showing linear (y = a + bx) and quadratic (y = a + bx + cx2) relationships for plant growth parameters under six salinity levels (0 dS m−1: Control; 2, 4, 6, 8, and 10 dS m−1: EC levels) for each canola genotype (ID) of spring and winter types under greenhouse pot study at Bushland, TX, USA in 2023. Regression coefficients were presented if significant at p ≤ 0.10.
IDPlant HeightBiomass Stem MassLeaf Mass Leaf AreaSpecific Leaf Area
abR2abcR2abR2abcR2abR2abR2
Winter type
G123.5−2.050.942.9−0.11−0.0080.860.3−0.030.912.6−0.08−0.0080.86441−31.60.95178−6.10.88
G226.2−2.360.923.5−0.19−0.0070.910.4−0.030.963.0−0.10−0.0120.88471−35.60.94---
G325.3−2.300.942.9−0.08−0.0110.930.3−0.030.912.6−0.04−0.0130.93448−34.80.96170−5.40.86
G426.5−2.360.983.2−0.16−0.0031.000.4−0.030.892.8−0.11−0.0030.99505−38.20.95185−7.40.81
G525.1−2.140.933.0−0.10−0.0100.950.3−0.030.882.6−0.05−0.0120.96428−34.30.99165−6.60.95
G625.0−2.140.912.9−0.08−0.0100.990.4−0.030.902.5−0.03−0.0120.99476−40.00.97186−9.30.86
G724.3−2.160.942.9−0.07−0.0160.920.2−0.010.902.8−0.18−0.0020.85462−37.60.98---
G823.8−2.080.942.9−0.03−0.0170.920.4−0.030.902.50.01−0.0150.90447−33.30.94173−7.40.70
G928.6−2.630.952.80.05−0.0230.960.3−0.030.952.40.09−0.0240.96472−35.90.95183−7.80.70
G1022.9−1.860.963.1−0.11−0.0100.900.4−0.040.932.7−0.05−0.0130.88474−37.30.98171−4.80.59
Spring type
G1128.6−2.700.953.5−0.22−0.0070.951.3−0.150.892.00.13−0.0280.80441−36.10.99199−7.10.54
G1227.4−2.520.973.7−0.22−0.0071.001.8−0.200.951.30.27−0.0320.65384−26.20.95256−14.70.89
G1327.7−2.600.943.2−0.14−0.0100.991.2−0.130.911.80.11−0.0220.95473−36.90.98235−12.50.78
G1427.9−2.510.923.7−0.24−0.0040.981.6−0.160.911.70.05−0.0130.92425−31.00.92256−13.30.90
G1526.7−2.510.913.4−0.19−0.0060.951.5−0.160.931.00.26−0.0270.71366−20.00.79299−17.30.93
G1627.3−2.440.963.4−0.22−0.0040.991.4−0.150.881.90.05−0.0160.94433−34.30.99220−10.60.79
G1728.3−2.670.943.1−0.10−0.0110.981.5−0.150.961.40.16−0.0210.72413−29.81.00257−15.10.86
G1828.2−2.600.933.9−0.29−0.0030.931.7−0.180.922.10.03−0.0170.85401−31.00.95183−6.60.90
G1928.7−2.590.933.1−0.07−0.0140.921.2−0.120.951.90.03−0.0120.73469−34.90.99238−12.70.87
G2028.4−2.500.983.5−0.16−0.0110.921.6−0.170.891.70.11−0.0210.97409−31.30.99222−11.40.80
Disclaimer/Publisher’s Note: The statements, opinions and data contained in all publications are solely those of the individual author(s) and contributor(s) and not of MDPI and/or the editor(s). MDPI and/or the editor(s) disclaim responsibility for any injury to people or property resulting from any ideas, methods, instructions or products referred to in the content.