Article

Comparing Chlorophyll Fluorescence and Hyperspectral Indices in Drought-Stressed Young Plants in a Maize Diversity Panel

Agricultural Institute Osijek, 31000 Osijek, Croatia
*
Author to whom correspondence should be addressed.
Agronomy 2025, 15(7), 1604; https://doi.org/10.3390/agronomy15071604
Submission received: 21 May 2025 / Revised: 24 June 2025 / Accepted: 27 June 2025 / Published: 30 June 2025

Abstract

Progressing climate change necessitates the development of drought-tolerant crops, and understanding the temporal dynamics of genotype x environment interactions (GxE) is crucial. This study aimed to test established phenotyping methods (chlorophyll a fluorescence (ChlF) and hyperspectral (HS) imaging) to investigate the variability in 165 inbred maize lines’ responses to progressive drought stress. The inbred maize lines were grown under controlled conditions and were challenged with water withholding. Fifteen ChlF and HS indices were measured at three consecutive time points (M1, M2, and M3). Mixed models were employed to estimate the GxT interaction effects via Best Linear Unbiased Predictors (BLUPs) for each variable. A Principal Component Analysis (PCA) performed on the GxT BLUPs from each time point revealed a highly dynamic interaction structure. While the primary axis of GxT variation (PC1) was consistently associated with HI, which is related to plant vigor, across all measurement times, its importance intensified under severe stress (M3). The secondary axis (PC2) shifted markedly over time: after initial variations at M1, it was dominated by GxT effects in specific ChlF parameters related to photosynthetic regulation under moderate stress (M2), before shifting again under severe stress (M3) to reflect the GxT effects on indices potentially related to pigment degradation and other stress indicators.

1. Introduction

Drought stress is a major environmental constraint impacting global agricultural productivity. Maize is sensitive to drought stress at different growth stages; it can affect germination potential, seedling growth, seedling stand establishment, overall growth, pollen and silk development, pollination, as well as embryo, endosperm, and kernel development [1]. In young plants, the early stages (up to the development of the seventh or eighth leaf) are critical since drought may cause poor crop stand development and under extreme conditions, it can result in complete failure of seedling establishment [2]. As modern agriculture faces challenges in crop production under the changing climate conditions and the stresses that they create, the need for fast, reliable, and accessible measurement methods has arisen. Li et al. (2014) [3] stated that advances in phenotyping are critical to fully leveraging progress in conventional, molecular, and transgenic breeding, which is why, presently, there is a focus on advancing novel phenotyping methods [4,5].
A multitude of optical sensors and methods that capture different electromagnetic responses at different wavelengths have been developed. The key aspects of using such specific types of measurements to obtain useful data about the physiological state of the crops is that they are fast, noninvasive, and are more or less high throughput.
Regarding chlorophyll fluorescence (ChlF), Kautsky and Hirsch (1931) [6] first described ChlF induction kinetics while the detailed ChlF measurements analysis and parameters derived from those measurements were based on the Theory of Energy Fluxes in Biomembranes, which was described in [7]. From that work, the analysis of polyphasic fluorescence transient (O, J, I, P) emerged, called the JIP test [8,9], which refers to translating the original data into biophysical parameters that quantify the PSII behavior [10]. During decades of use, it became a valuable tool in research on plant physiology and stress [11,12,13,14,15]. The most prominent parameters, i.e., indices, are Phi_Po (maximum quantum yield of primary photochemistry), which represents the potential efficiency of energy conversion in PSII when all reaction centers are open; Psi_o, which represents the probability that a trapped exciton moves an electron into the electron transport chain further than QA−; Phi_Eo, which represents the quantum yield of electron transport; Phi_Pav, which gives a measurement of the time to reach the maximum ChlF level (in ms); and Pi_Abs (performance index), which quantifies the general electron flow functionality and efficiency [8].
Utilizing vegetation indices based on hyperspectral (HS) imaging for plant trait estimation is another approach; it uses ratios or linear combinations of reflectance at a few individual wavelengths [16]. These HS indices serve as proxies for physiological and biochemical trait estimation, plant disease detection, biomass and yield estimation, and the identification of drought tolerance traits, allowing for the rapid screening of large germplasm collections under water-limited conditions [17]. HS imaging utilizes materials’ property of absorbing certain wavelengths while reflecting or scattering the others [18]. Ram et al. (2024) [18] provided a comprehensive overview of HS indices and their applications in precision agriculture in the past two decades.
The prominent HS indices using near-infrared (NIR) spectral reflectance are the NDVI, SRI, ZMI, PSNDa, and RDVI. The Normalized Difference Vegetation Index (NDVI) measures vegetation greenness and overall plant health by comparing reflectance in the near-infrared and red light bands [19,20,21]. The Simple Ratio Index (SRI) provides a measure of vegetation vigor by calculating the ratio between near-infrared and red light reflectance [21,22,23]. The Zarco-Tejada and Miller Index (ZMI) assesses the chlorophyll content by focusing on specific wavelengths sensitive to chlorophyll absorption [24,25]. The Plant Senescence Reflectance Index a (PSNDa) detects plant senescence by measuring reflectance changes associated with chlorophyll degradation [26,27]. The Renormalized Difference Vegetation Index (RDVI) is a variation of the NDVI with a normalized equation to reduce the variability of photosynthetically active radiation, leading to more accurate results [28,29,30].
Other often used HS indices based on ultraviolet and visible spectra (UVIS) are the MCARI1, G, MCARI, GM1, and GM2. Modified Chlorophyll Absorption in Reflectance Index 1 (MCARI1) enhances the original MCARI by incorporating additional wavelength bands for improved sensitivity to chlorophyll variations [31,32]. The Greenness Index (G) quantifies the proportion of green reflectance relative to the total visible spectrum as an indicator of vegetation health [33]. The Modified Chlorophyll Absorption in Reflectance Index (MCARI) measures the depth of chlorophyll absorption in plant tissues to assess photosynthetic activity and plant stress [34,35]. Gitelson and Merzlyak Index 1 (GM1) estimates chlorophyll content by analyzing reflectance ratios at specific wavelengths that are sensitive to chlorophyll concentration [36]. Gitelson and Merzlyak Index 2 (GM2) focuses on different wavelength ratios than GM1 to assess chlorophyll concentration, providing complementary information for a more robust analysis [35].
In maize, ChlF has been widely utilized to examine drought stress effects on plant physiology, morphology, and yield [37,38,39]. Although the use of HS indices is prominent in maize drought stress research [16,40,41], the use of the indices mentioned above for this specific use is lacking in the literature. This is particularly true for maize germplasm screening. Galić et al. (2022) [2] investigated the variability in responses of a diversity panel of elite inbred maize lines to water withholding for stress-related traits such as guaiacol peroxidase activity, lipid peroxidation, hydrogen peroxide accumulation, and proline accumulation, but no ChlF or HS measurements were carried out.
To our knowledge, no attempt has been made to evaluate and to compare ChlF and HS indices for drought responses at the early stage using a maize germplasm collection. The objective of this study was to compare fifteen ChlF and HS indices measured in drought-stressed young plants in a maize diversity panel grown in a controlled environment. The aim is to provide insights into the utility of ChlF and HS indices for assessing drought tolerance and contribute to the identification of reliable, high-throughput indicators for differentiating maize genotypes under water-limited conditions.

2. Materials and Methods

2.1. Plant Material

The plant material used in this experiment consisted of 165 inbred maize lines (Zea mays, L.) of different origin that were previously genotyped using the Illumina Infinium Maize50K array (Illumina, Inc., San Diego, CA, USA) [42]. This genotypic panel consisting of elite material was predominantly developed at the Agricultural Institute Osijek. The compiled list of genotypes with their respective genetic structures is given in the Supplementary Material (Table S1). The data was filtered for missing positions (2.5%) and heterozygotes (<5%) and imputed using the LDKNNI method [43]. Admixture analysis was carried out using the Admixture v2 program [44]. According to the Admixture analysis results, inbred lines were grouped in seven well-known maize gene pools (sweet corn, Lancaster, Ohio, flint/pop, B73, B37, and Iodent). The table provided in the Supplementary Materials shows the genotypic structure of the inbred maize line panel consisting of 101 admixed, 20 Iodent, 15 B73, 15 Ohio, and 14 Lancaster lines.

2.2. Preparation and Growing Conditions

Maize seeds were planted in plastic trays with following dimensions: a width of 39 cm, length of 59 cm, and height of 17 cm. The trays were filled with 5.5 kg of universal substrate (Terra Brill TYPical 5, Gebr. Brill Substrate GmbH & Co. KG, Georgsdorf, Germany). Each tray contained seven genotypes with five plants per genotype in order to secure an adequate final number of samples. For each batch of genotypes, three trays were placed for both the control and treatment groups. Watering of the plants was carried out daily and was based on plant demands by determining the field water capacity. The water used for watering was obtained from the filtered water system integrated into the growing chamber. The plants were grown in a double-tier climate chamber (FITOCLIMA 12000 PLH, Aralab, Rio de Mouro, Portugal) in six cycles to complete the whole set of maize inbred linesds. The schematic visualization of the experiment is given in Figure 1.
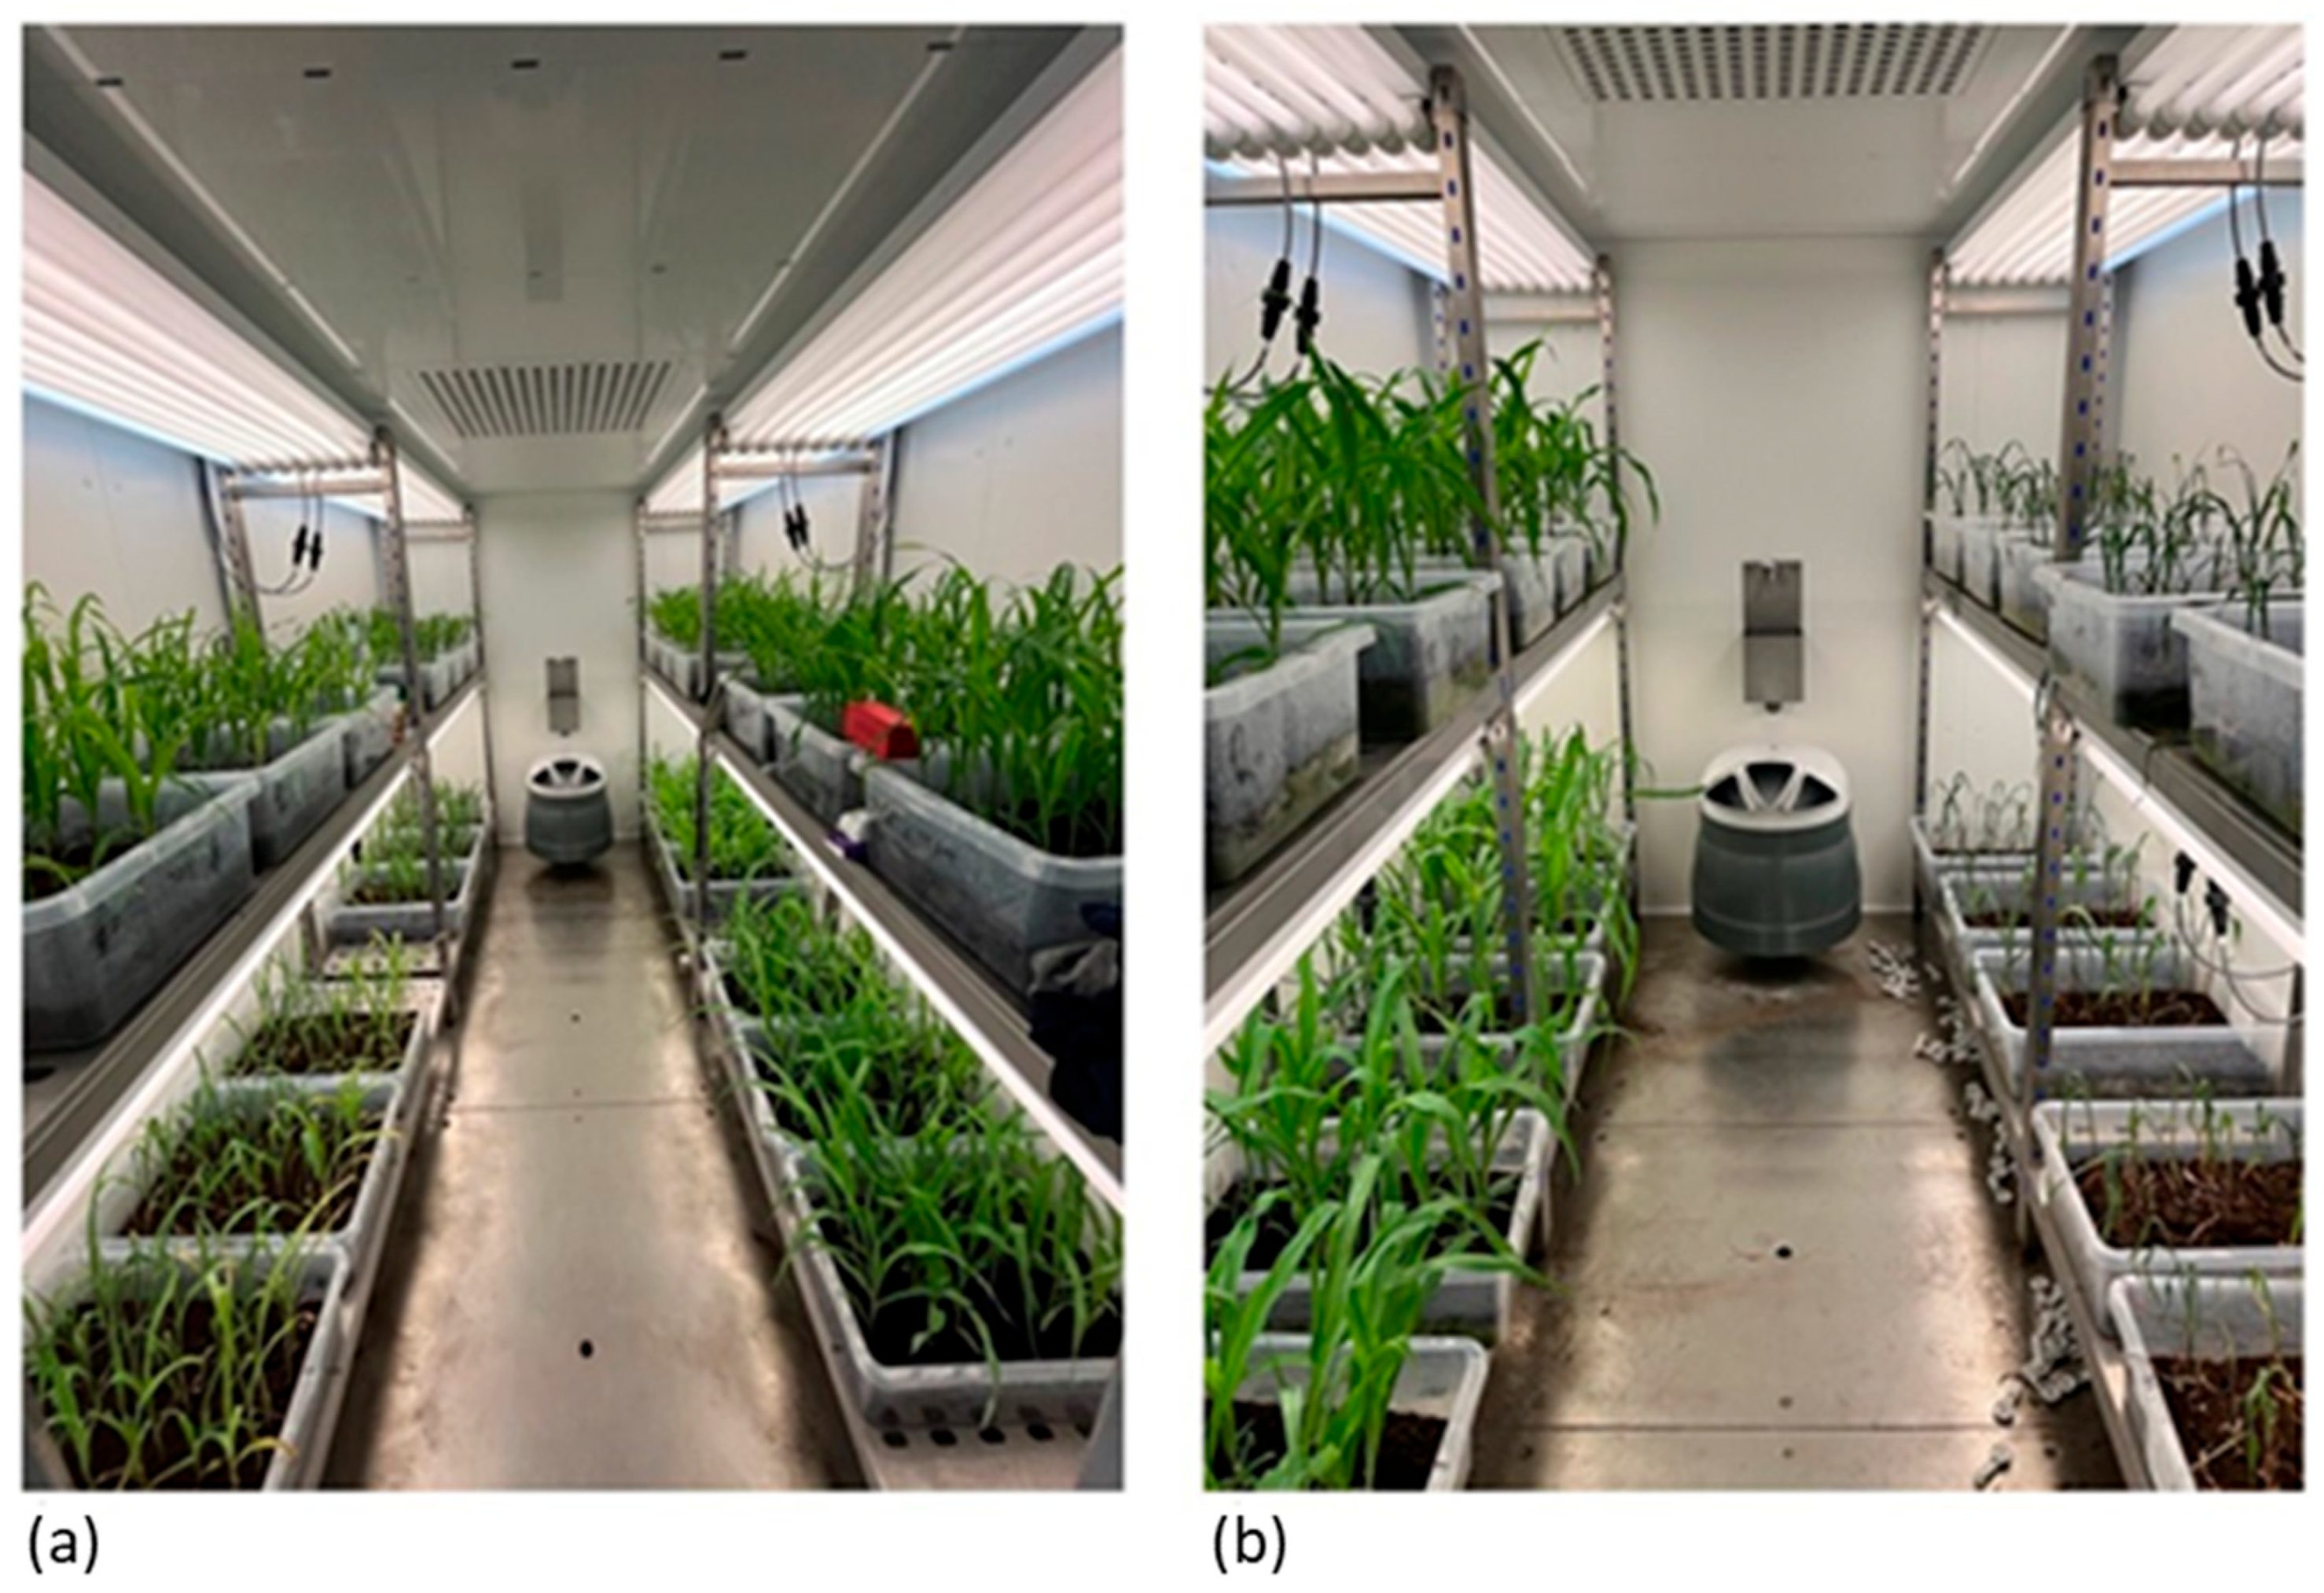
The growing conditions were set as follows: 16 h of daylight with a temperature of 25 °C and relative humidity of 65%; 8 h of darkness (night) with a temperature of 18 °C and relative humidity of 90%. The plants were illuminated with 550 µmol/m2/s light from PHILIPS Master TL-D 58W/865 fluorescent light bulbs (PHILIPS, Amsterdam, Netherlands). Ten days after emergence, the number of plants in the trays was thinned to two plants per genotype. The control group was watered daily and the treatment was conducted by withholding water starting from the 10th day after planting. The plants were grown for 28 days in total, allowing the control group to form 6–7 leaves. Two images from one cycle of the experiment on the 20th and 26th day of growing are shown in Figure 2, which show the visible difference between the control and treatment groups.

2.3. Measurements

The measurements consisted of measurements of ChlF and HS using images of the leaves. Measurements of ChlF and HS were conducted at three stages throughout the growing period using three measurement devices. Parameters for photosynthetic efficiency of chlorophyll a using the JIP-test were acquired using an MP100 device from PhotonSystem Instruments (PSI, Drásov, Czech Republic) after 25 min period of leaf adaptation to darkness using leaf clips from the same manufacturer. For HS imaging of the leaves, two handheld spectrometers from PhotonSystem Instruments were used. The first device, a PolyPen RP 410 UV/VIS instrument (PhotonSystem Instruments (PSI), Drásov, Czech Republic), measures the hyperspectral response in the range of 380–790 nm, while the second device, a PolyPen RP 410 NIR instrument (PhotonSystem Instruments (PSI), Drásov, Czech Republic), measures in the 640–1050 nm range. The devices have a measurement resolution of 8 nm and they have their own light source. Both devices were calibrated using the Spectralon reflectance standard [45].
The measurements were conducted three times during the growing period, with the first set of measurements carried out on the 14th day after planting, the second set on the 20th, and the final set of measurements on the 26th day after planting. Two plants of each genotype per tray were measured, resulting in total number of six technical replicas per genotype per treatment (12 replicates in total for both the control and drought stress treatments for each genotype). In order to minimize potential microenvironment effects, the growing trays were randomized in terms of their placement inside the chamber and their orientation towards the chamber walls/central aisle. Randomization was carried out after each set of measurements was performed, and the growing trays were returned to their previous position on the day that a new set of measurements was conducted. On the 28th day after planting, weighing of the plant biomass was conducted. The weighing was performed using a PS 6100.R2.M precision balance (Radwag, Radom, Poland). The samples were then dried in a drying oven for 48 h at 78 °C and weighed again in order to obtain the dry weight. A list of the ChlF and HS indices is given in Table 1.

2.4. Data Analysis

Data processing and statistical analysis were performed in an integrated development environment Visual Studio Code (VSCode) (1.96.2) using the Python programming language [52,53]. The entire dataset was preprocessed prior to executing further analysis by applying the interquartile range method to detect and remove outliers and the missing values were imputed using IterativeImputer from the scikit-learn library [54]. Log transformation was applied in order to address skewness and finally, the data was standardized using StandardScaler (scikit-learn 1.7) [55] to ensure equal variable contributions. Numeric variables from the dataset selected for the principal component (PC) analysis were then aggregated by genotype and treatment to represent how each genotype x treatment combination aligns with the axes of maximum variance to capture key patterns within the data. Best Linear Unbiased Predictors (BLUPs) were calculated for each variable using a mixed model with fixed effects for genotype and treatment, and a random intercept for their interaction. To define how strongly the interaction effect of each variable aligns with the PCs, the correlation between BLUPs and PCA scores were calculated and visualized.
To compare the relative importance of the variables across the components and keep those that captured significant amounts of the variation, the feature loadings were scaled to values of 0–1 based on the individual principal component. The variables were selected using an adapted Kaiser rule to only include components explaining at least 10% of the variance [56]. The goal of this approach was to maintain the dataset information entropy while reducing the total number of variables.

3. Results

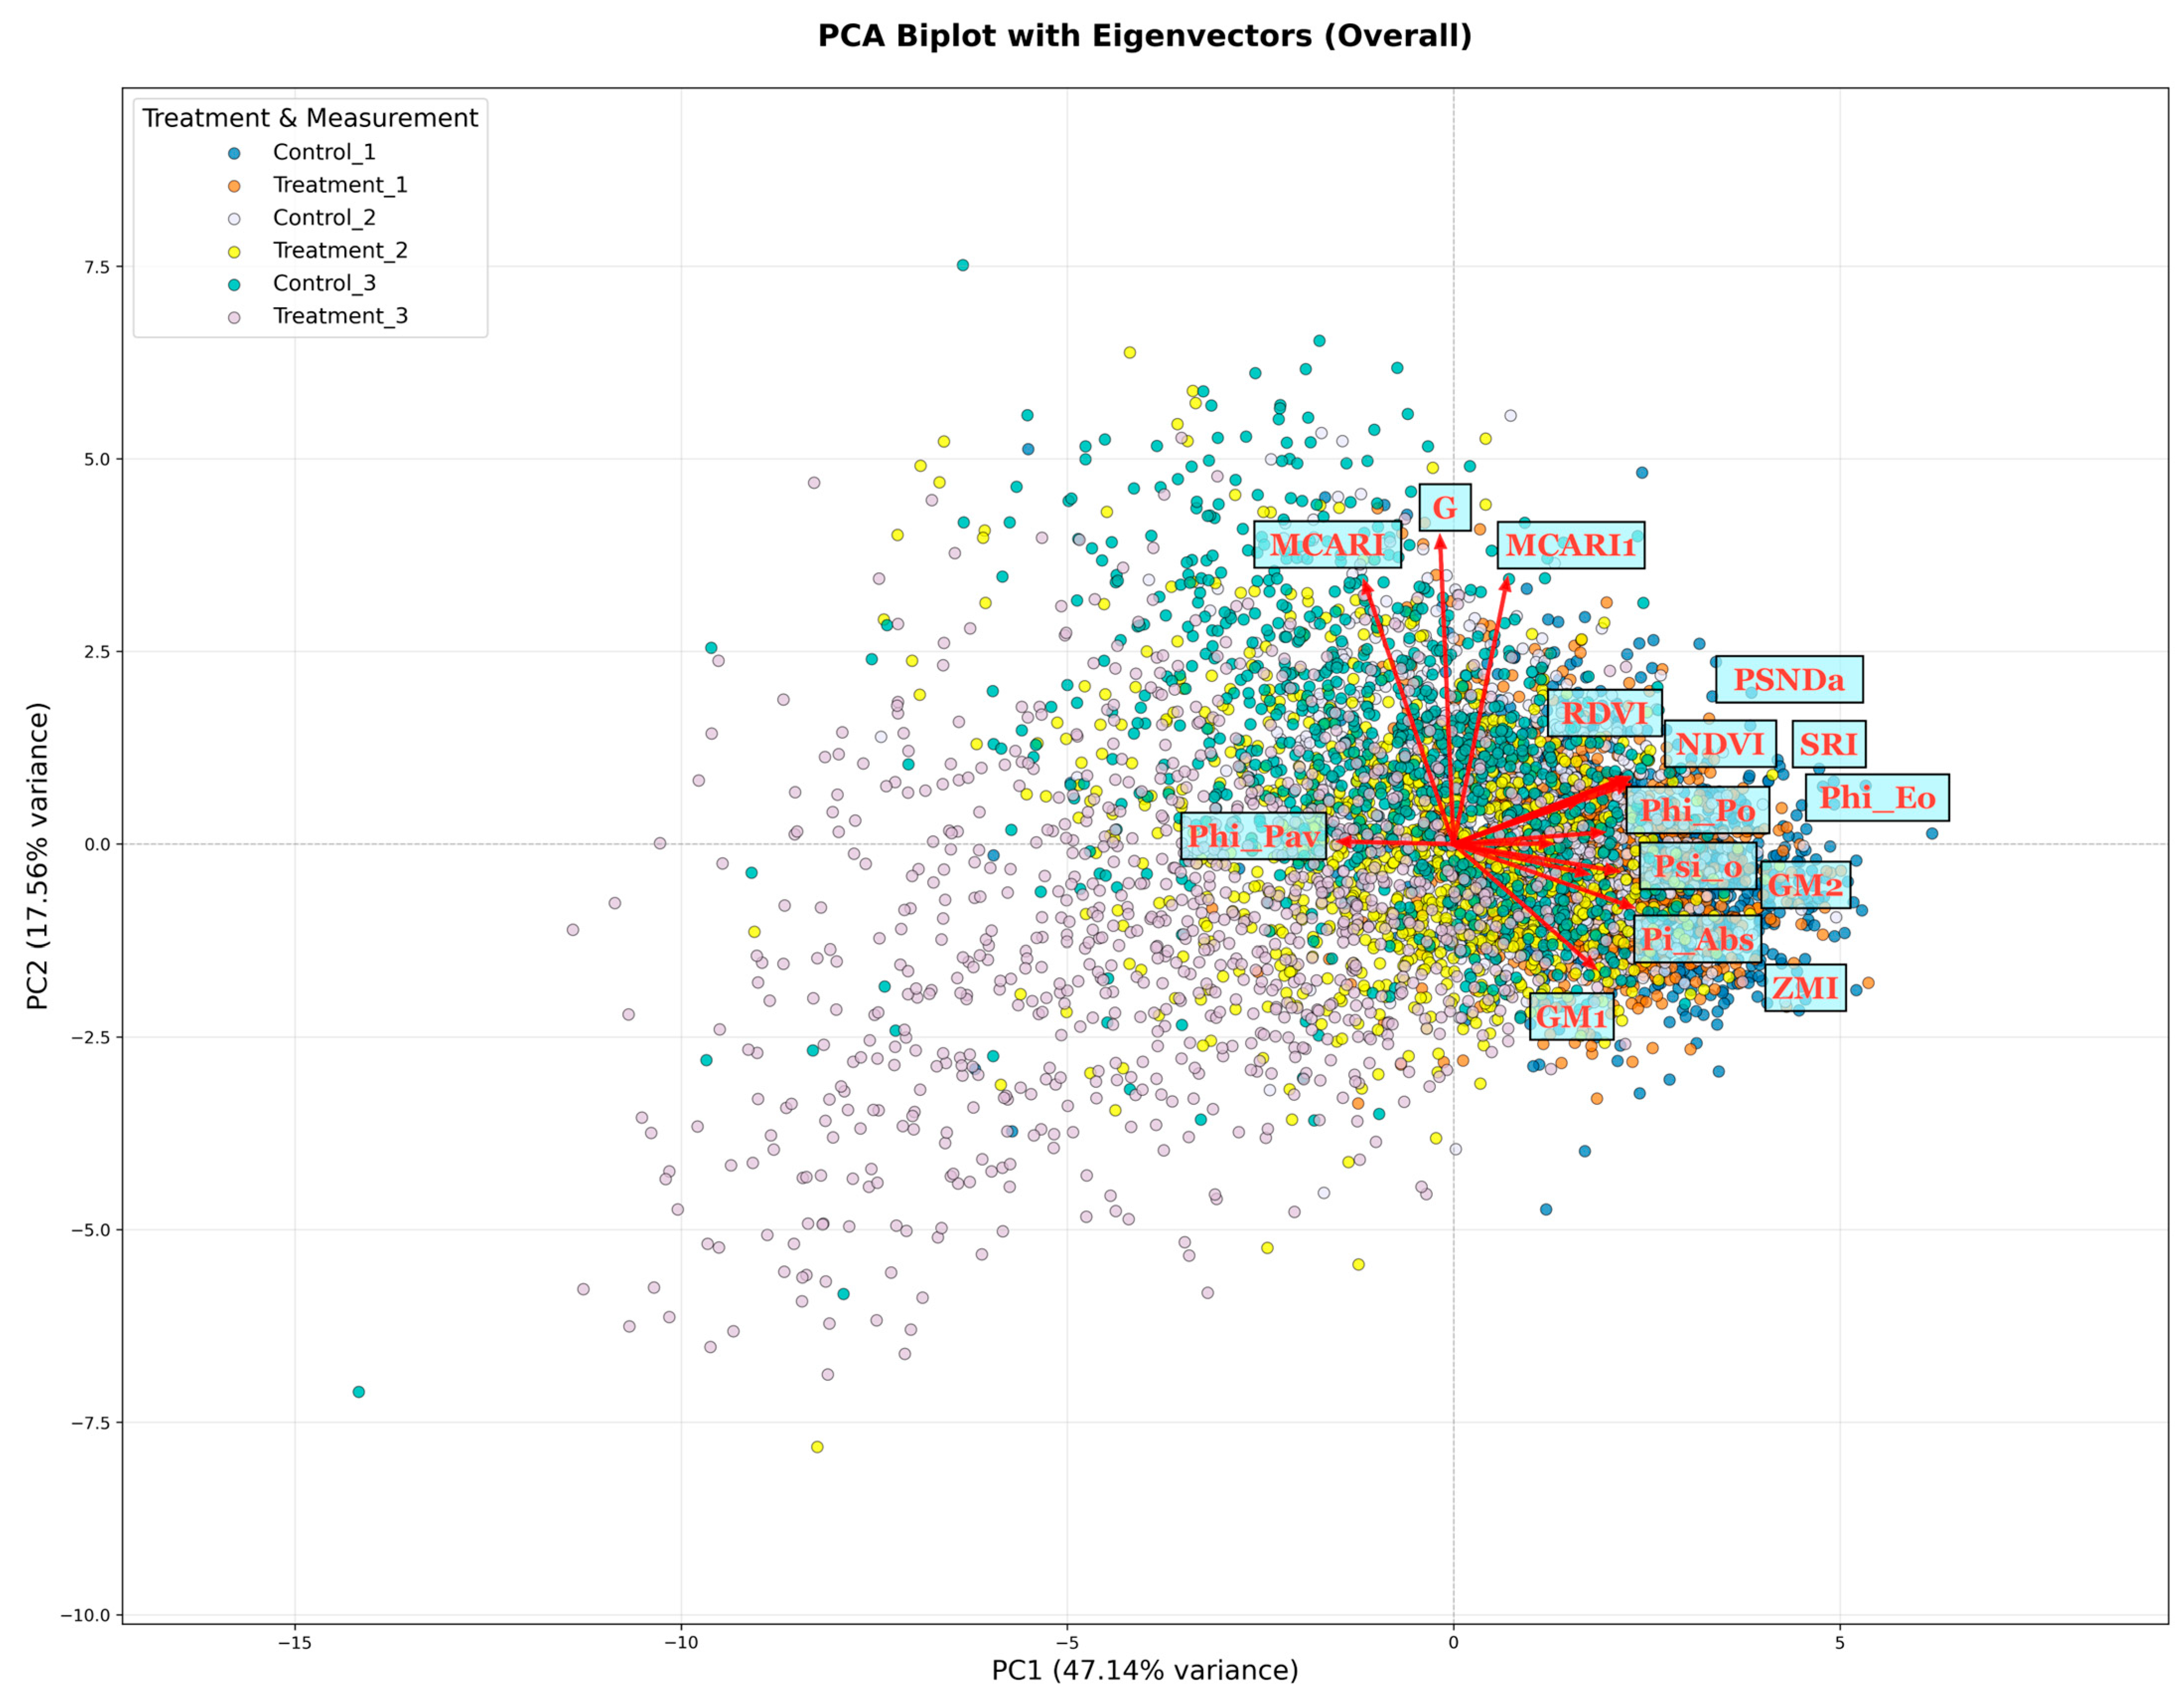
The PC analysis identified two principal components that captured roughly 66% of the overall variance in the dataset, with PC1 accounting for 48.6% of the variance, and PC2 accounting for 17.57% (Figure 3). The data was grouped according to the treatment and measurement combination, with each dot representing the value for a particular genotype. The spread of the values along the x-axis (PC1) corresponded with the progression of the experiment. The values were also dispersed along the y-axis (PC2), separating the data points from Measurement 3. Figure 1 also contains the eigenvectors for each variable from which some collinearity of larger set of variables was observable. Most variables influenced PC1, while few influenced the spread along the y-axis (PC2), primarily the MCARI, MCARI1, and G index.
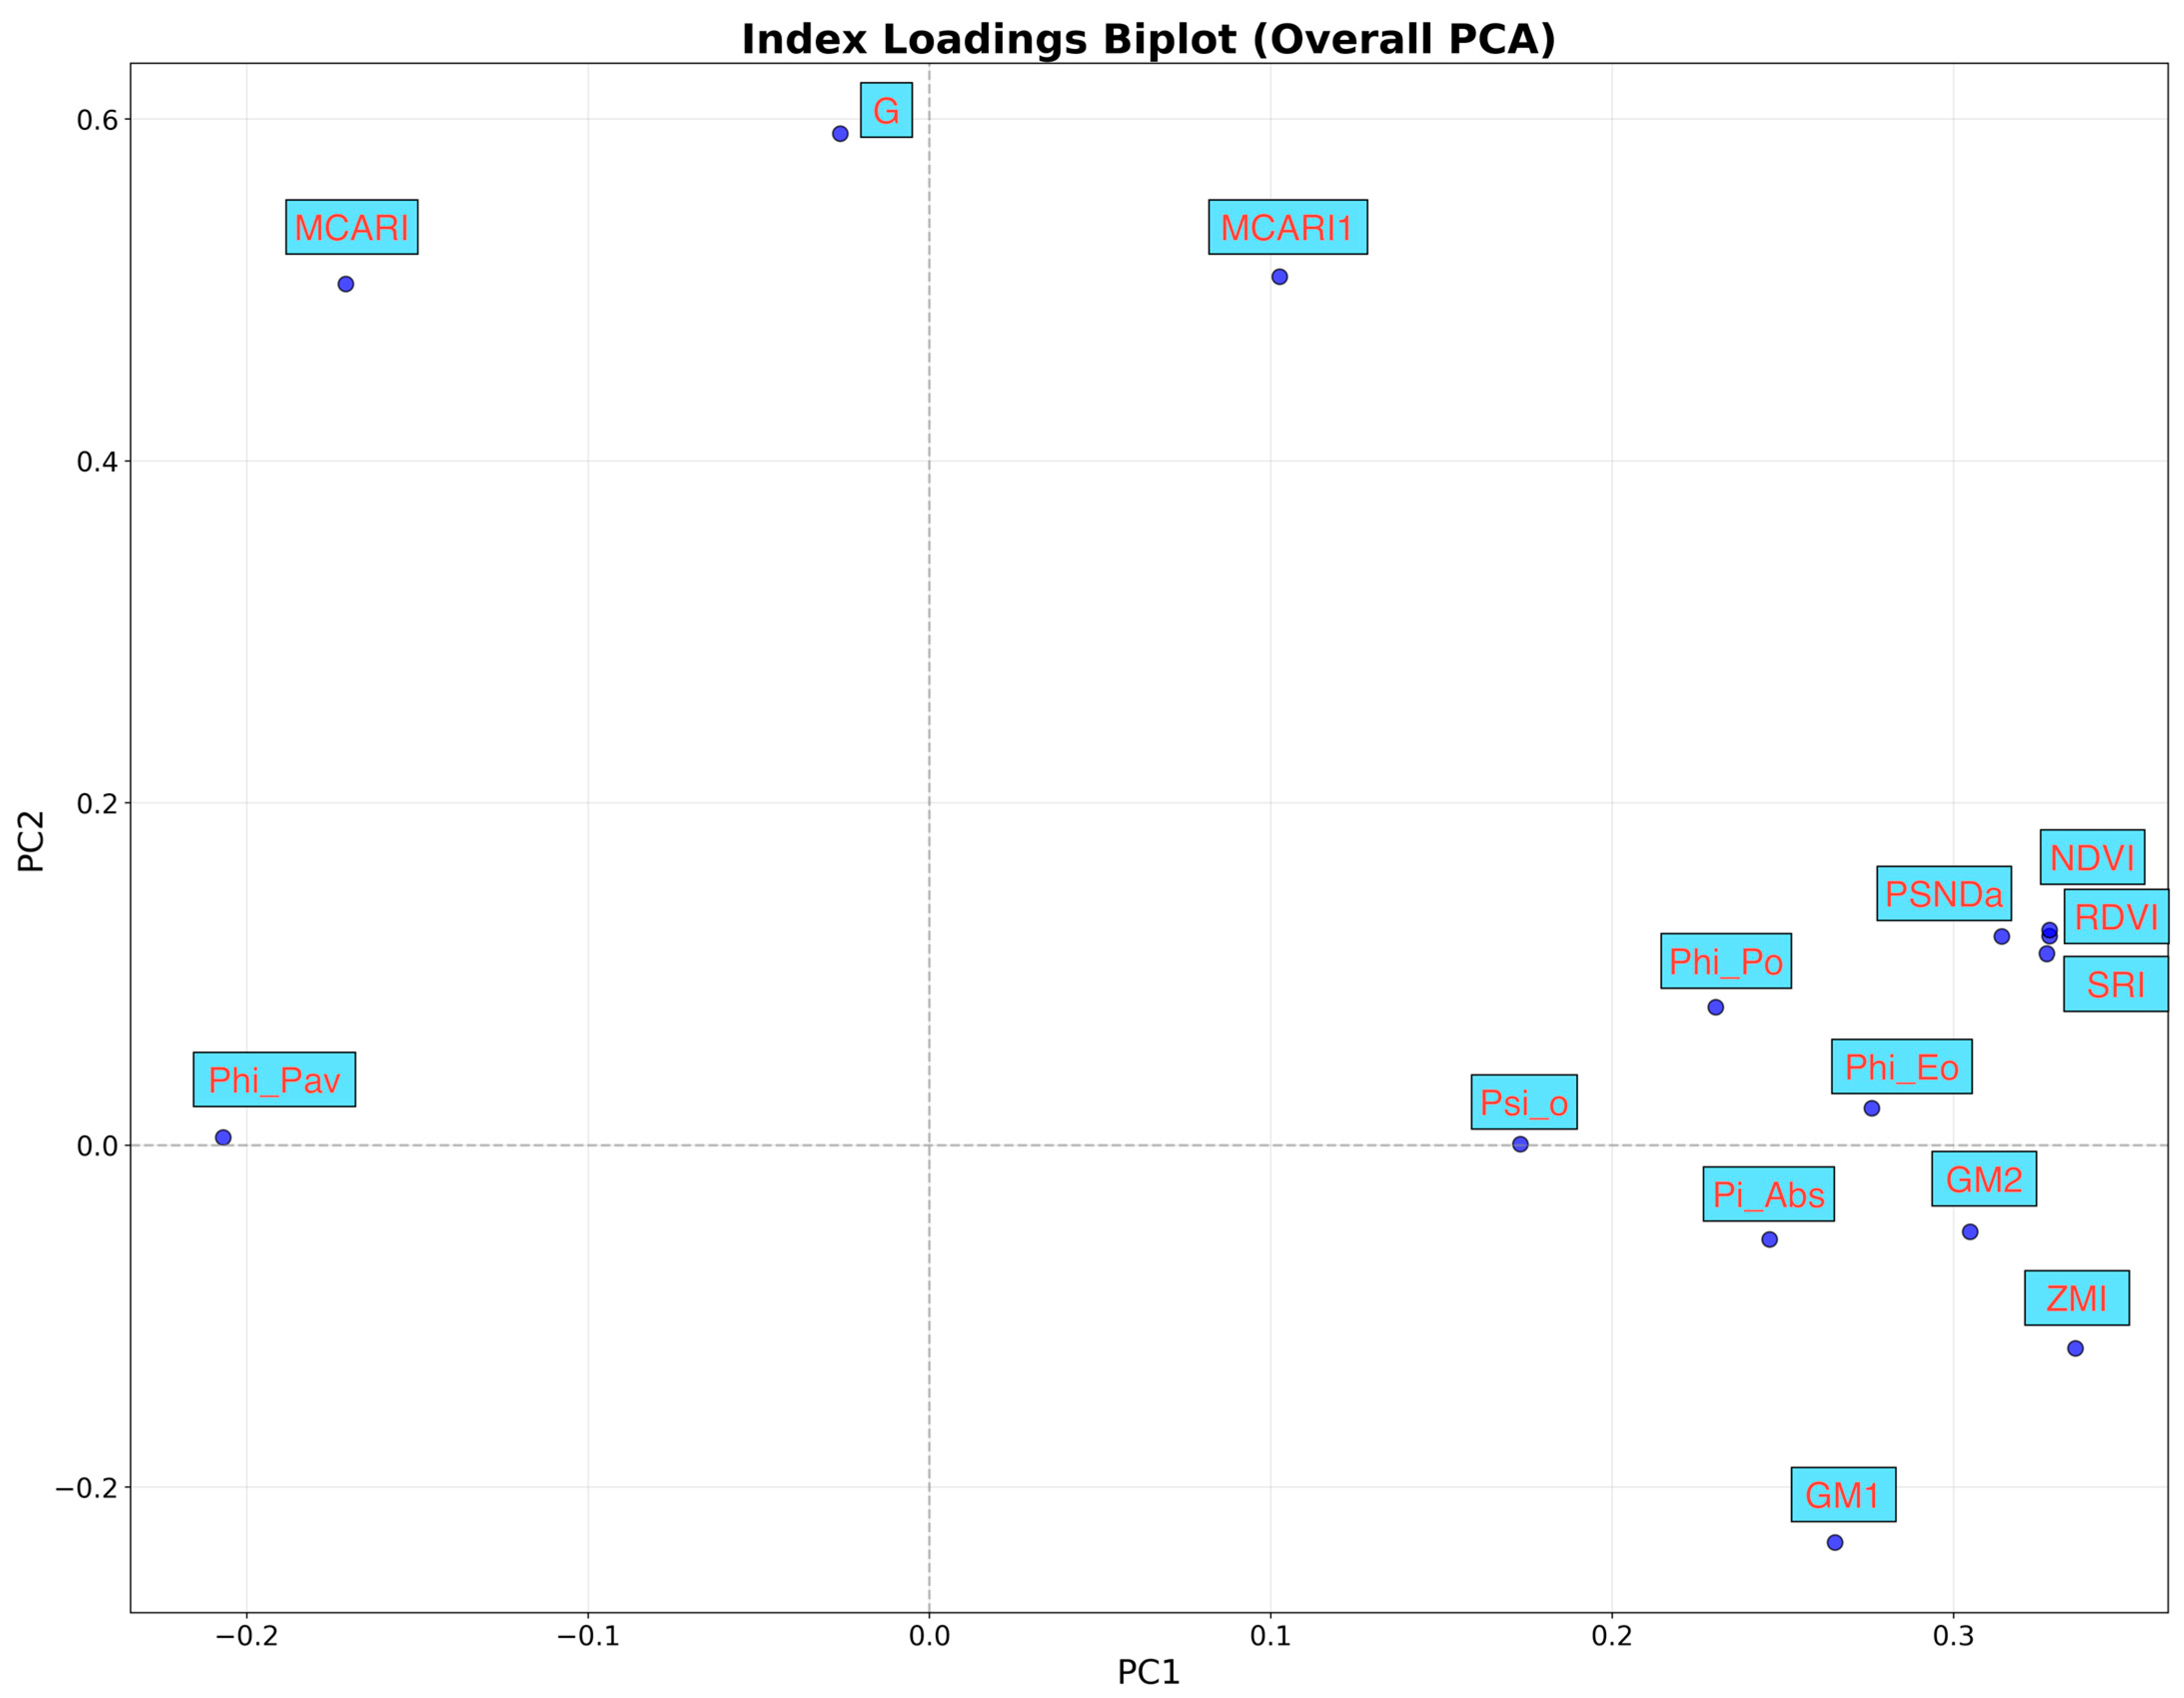
The positioning of the overall PCA variable loadings within a coordinate system, with each point representing a specific variable, is shown in Figure 4. The grouping of most parameters on the right of the graph can be seen. Only Phi_Pav was positioned on the opposite side along the PC1 axis without any significant influence on PC2. The MCARI, MCARI1, and G index were positioned further from the origin along the PC2 axis than any other variable, influencing the separation along that axis.
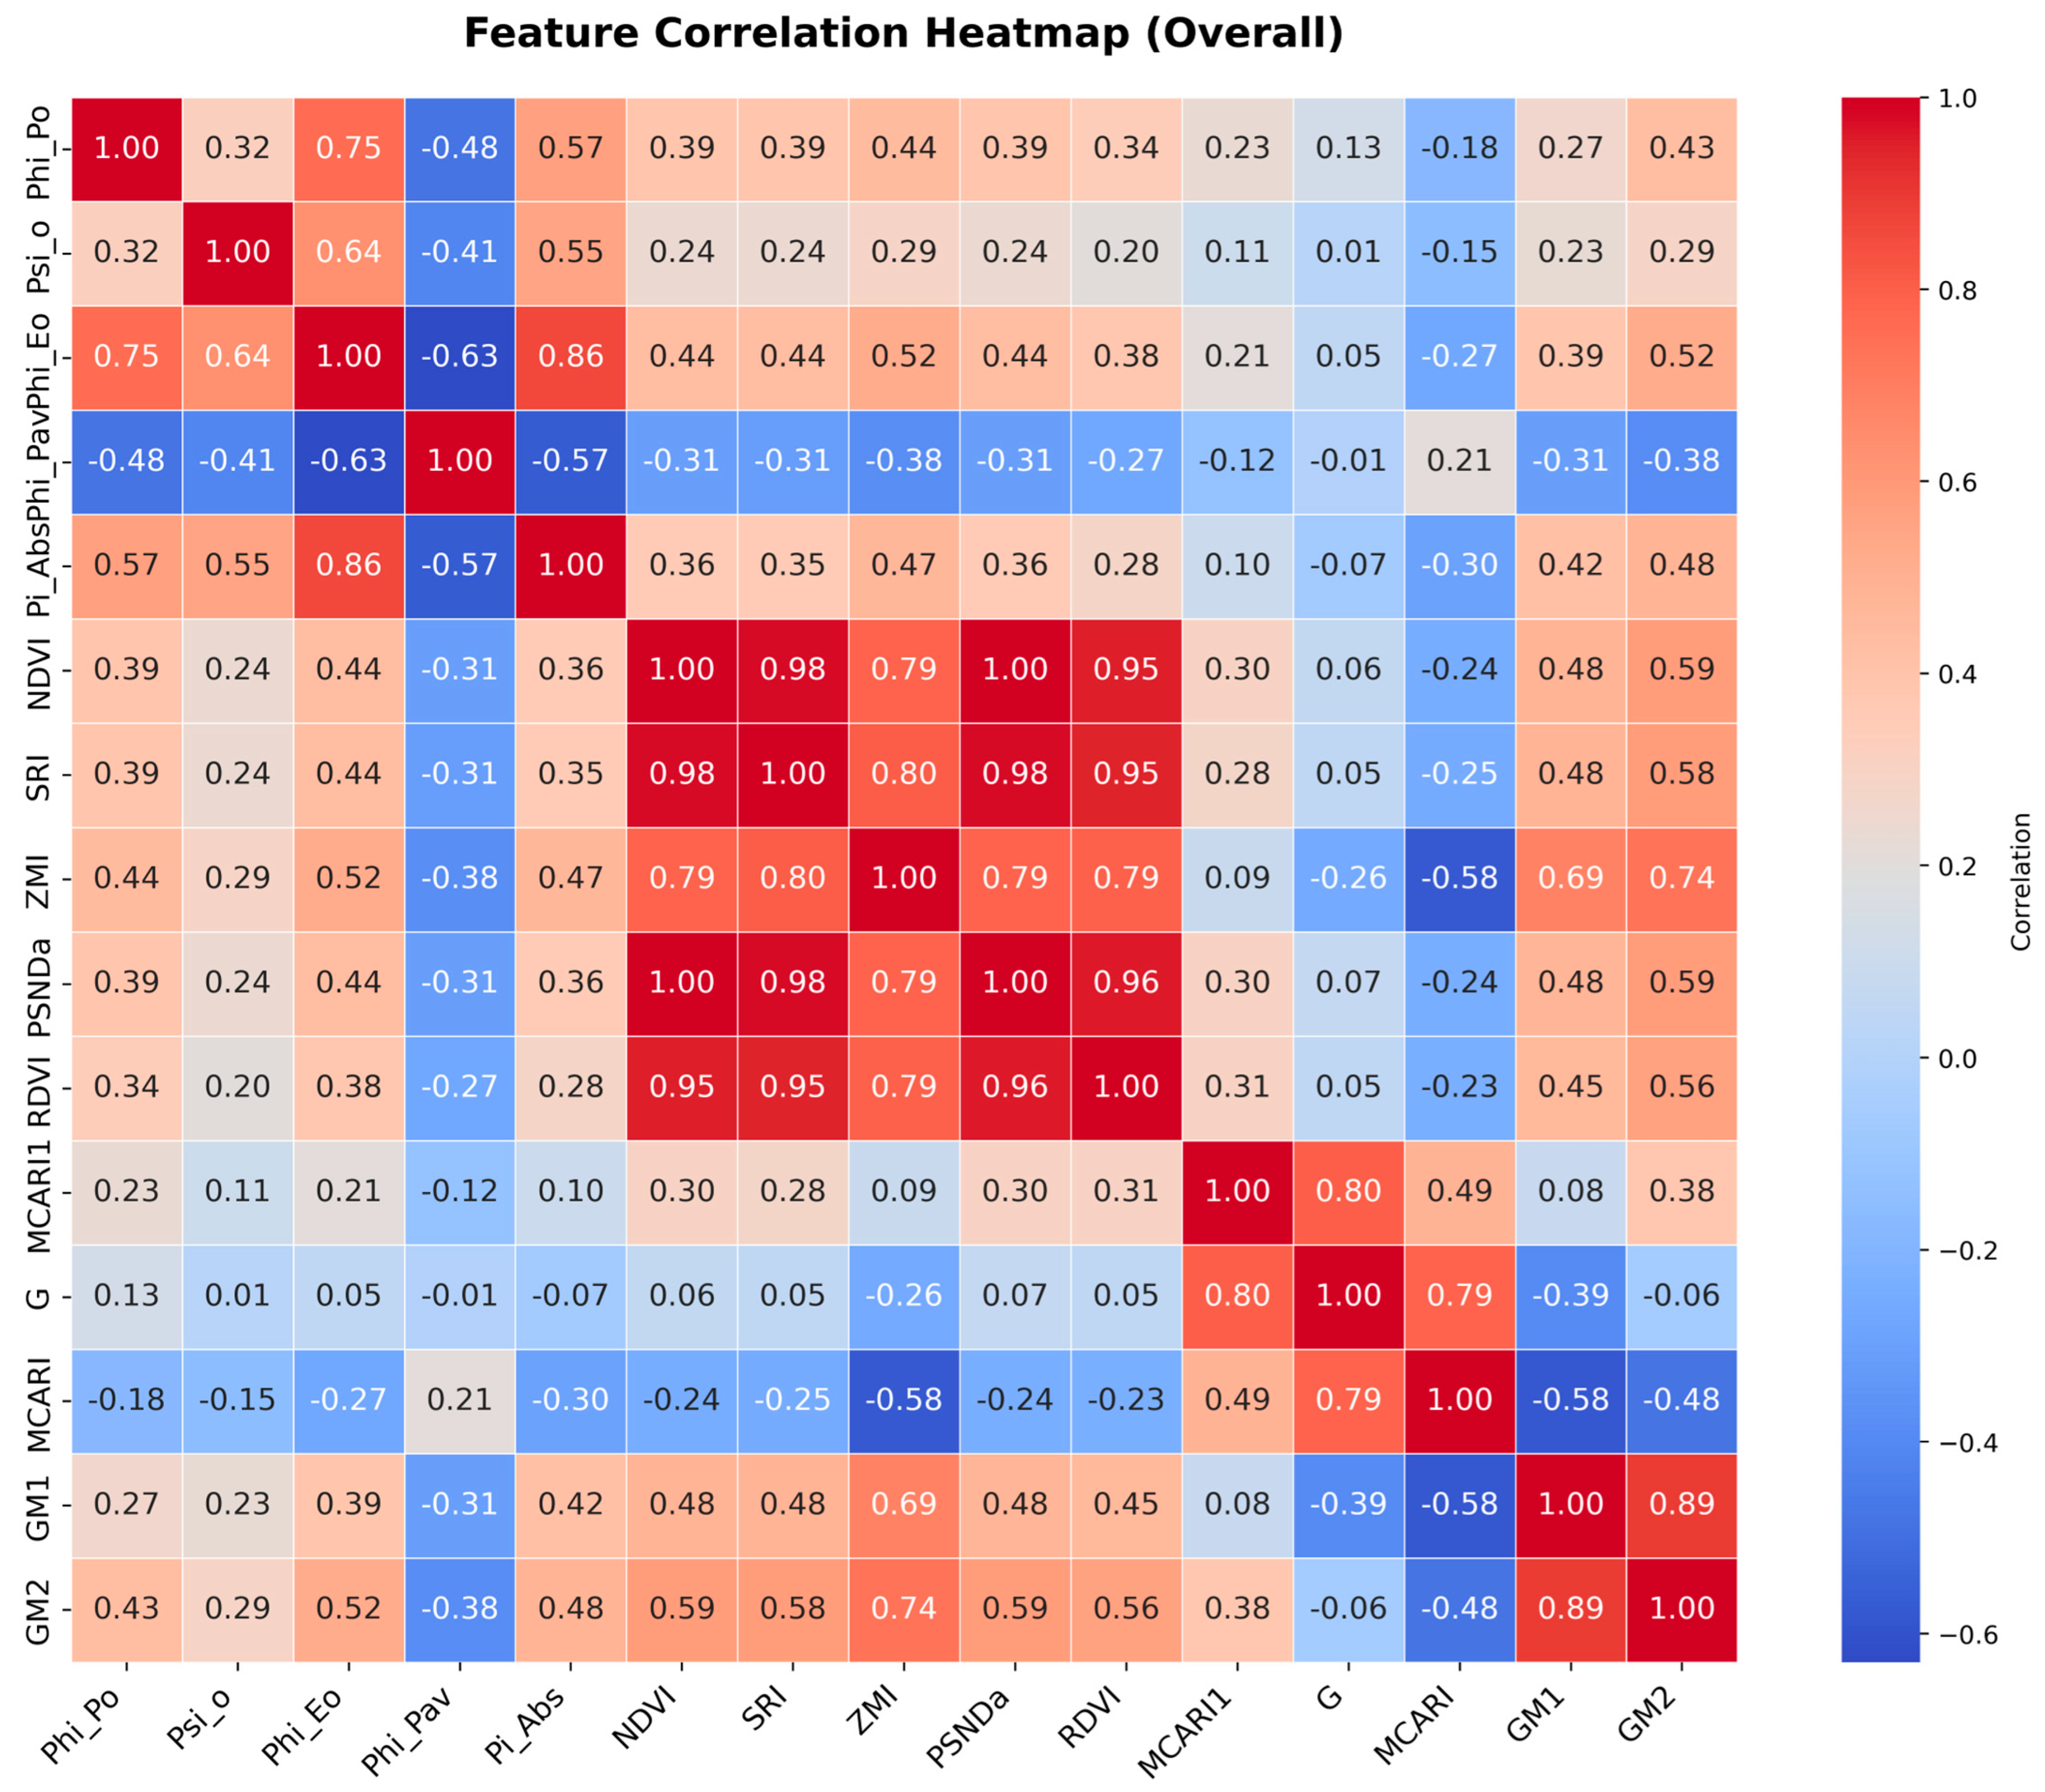
The overall correlations between the variables are presented in Figure 5. The ChlF parameters were mostly strongly mutually correlated, with the exception of Phi_Pav. Roughly, all the ChlF, NIR, and UV/VIS indices were mostly strongly correlated within the three groups. Psi_o, Phi_Eo, and Pi_Abs first formed a group of strongly correlated variables; Phi_Po was also moderately to strongly correlated with this group. The second group consisted of the NIR HS indices (NDVI, SRI, ZMI, PSNDa, and RDVI), which had very high correlations with each other (0.95–1.00). The PSNDa and NDVI appeared to be almost identical, suggesting they capture very similar information. The third correlation group included the MCARI, MCARI1, and G index, with a slightly weaker positive correlation between the MCARI and MCARI1 (0.49). The last two UV/VIS indices, GM1 and GM2, were strongly positively correlated. GM1 and GM2 also show moderate to high correlation with the ZMI from the second correlation group. As for negative correlations, Phi_Pav showed a consistent moderate to strong negative correlation with Phi_Po, Psi_o, Phi_Eo, and Pi_Abs. The MCARI was negatively correlated with the ZMI, GM1, and GM2. The G index showed very weak correlations with most variables outside of its own correlation group, appearing relatively independent.
In order to show the differences and changes in patterns among the indices and genotypes across the three distinct measurements, three biplots were made where the dots represent the sample scores and the red arrows represent eigenvectors (Figure 6, Figure 7 and Figure 8).
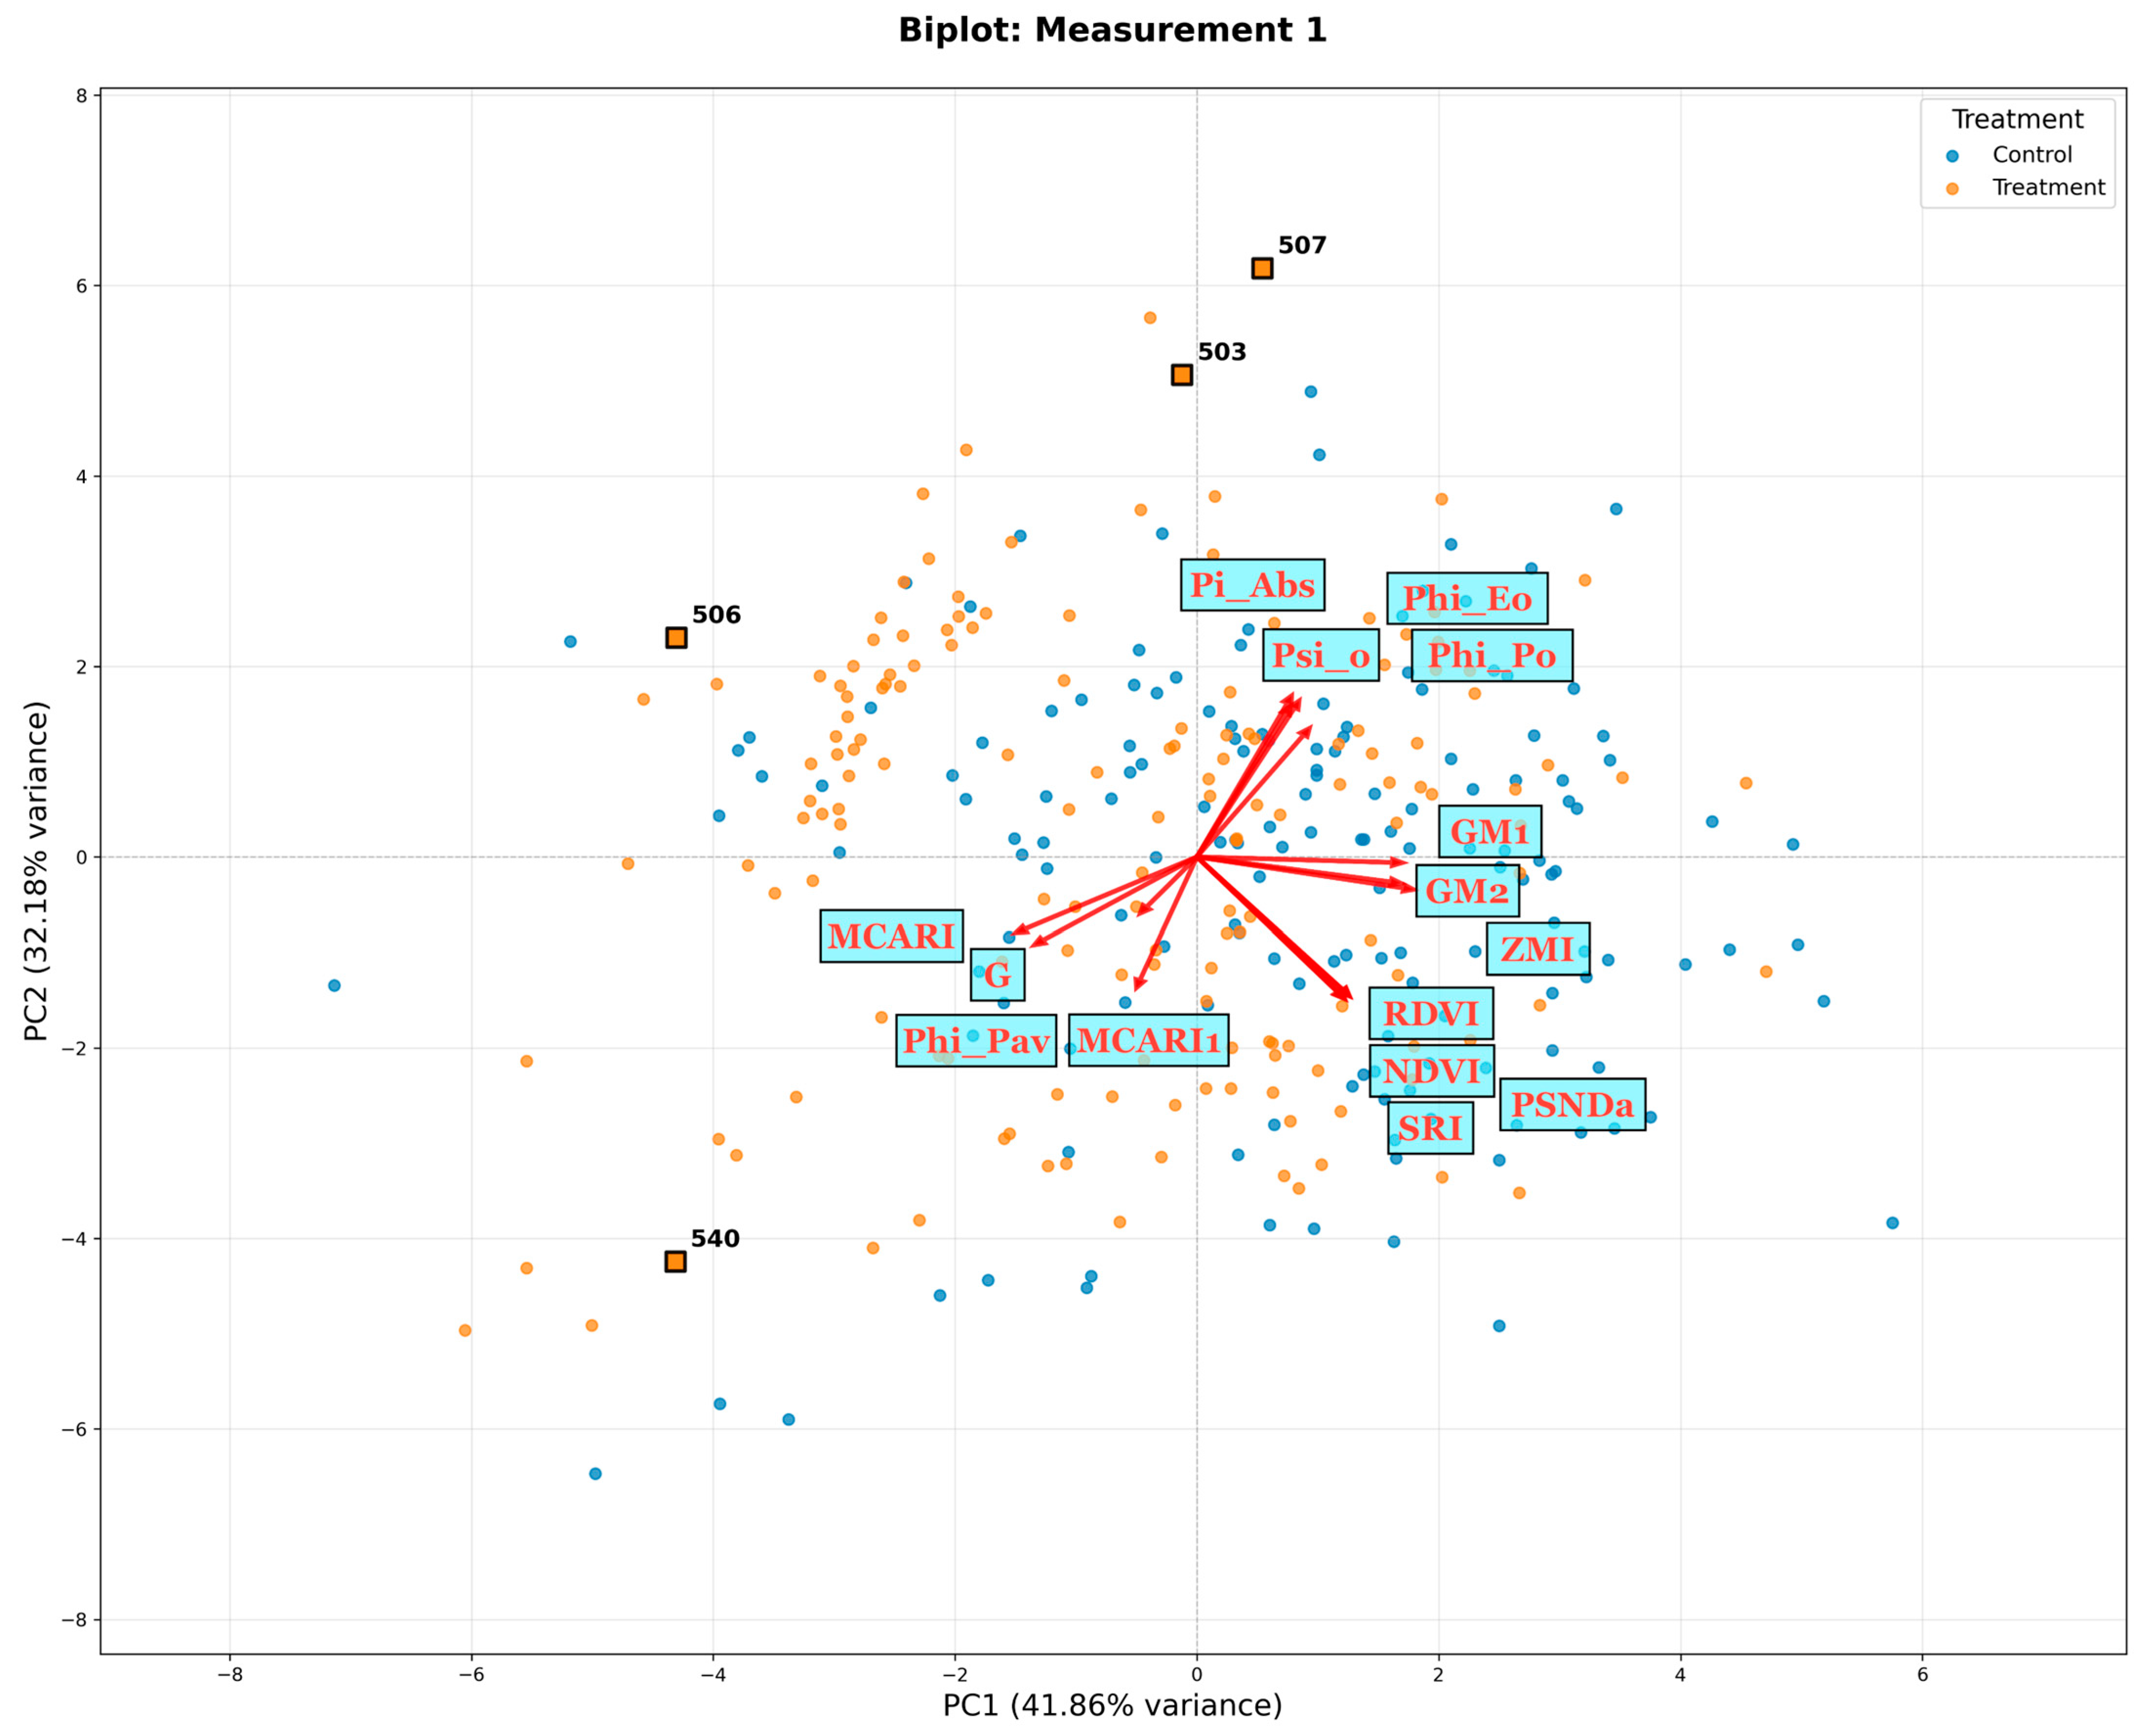
For Measurement 1, PC1 explained 41.9% of the variance while PC2 explained 32.2%. The eigenvectors for the NDVI, SRI, ZMI, PSNDa, RDVI, GM1, and GM2 point rightward, indicating positive correlations with PC1 and negative correlations with PC2. The MCARI and MCARI1 as well as the Greenness index grouped separately from the other HS indices, with negative correlations with both PC1 and PC2, as seen by the downward- and leftward-pointing eigenvectors. Three ChlF parameters, Phi_Po, Psi_o, and Phi_Eo, formed another group with their eigenvectors pointing upward and slightly rightward. There was no discernible difference between the control and treatment groups across the maize genotypes. The score values that were furthest from the origin and from the scores that grouped together more closely (top 10% of points by distance) for Measurement 1 belonged to 24 genotypes, mostly from the admixed population (40.6%), followed by those from the Lancaster population (28.1%), with only a few belonging to the Iodent (18.8%), Ohio (3.1%), and B73 (9.4%) populations.
The data for Measurement 2 become more structured along the primary axis of variation with the progression of drought stress (Figure 7). The photosynthetic parameter (Phi_Po, Phi_Eo, Pi_Abs) eigenvectors now pointed strongly upward and rightward, showing stronger correlations with both PC1 and PC2. This suggests that these photosynthetic efficiency measures became more important in explaining the plant responses. The score values that were furthest from the origin and from the scores that grouped together more closely (top 10% of points by distance) for Measurement 2 belonged to 30 genotypes, mostly from the admixed population (43.8%), followed by those from the Iodent population (37.5%), with only a few belonging to the Lancaster (9.4%), B73 (6.3%), and Ohio (3.1%) populations. Four genotypes in the top 10% of points by distance were the same as those in Measurement 1: one from the admixed population and three from the Iodent population (lines 503 (Iodent), 506 (Iodent), 507 (Iodent), and 540 (admixed); Table S1). Some of the other lines with a notable distance from the origin in Measurement 2 were 502, 501, 505, and 504.
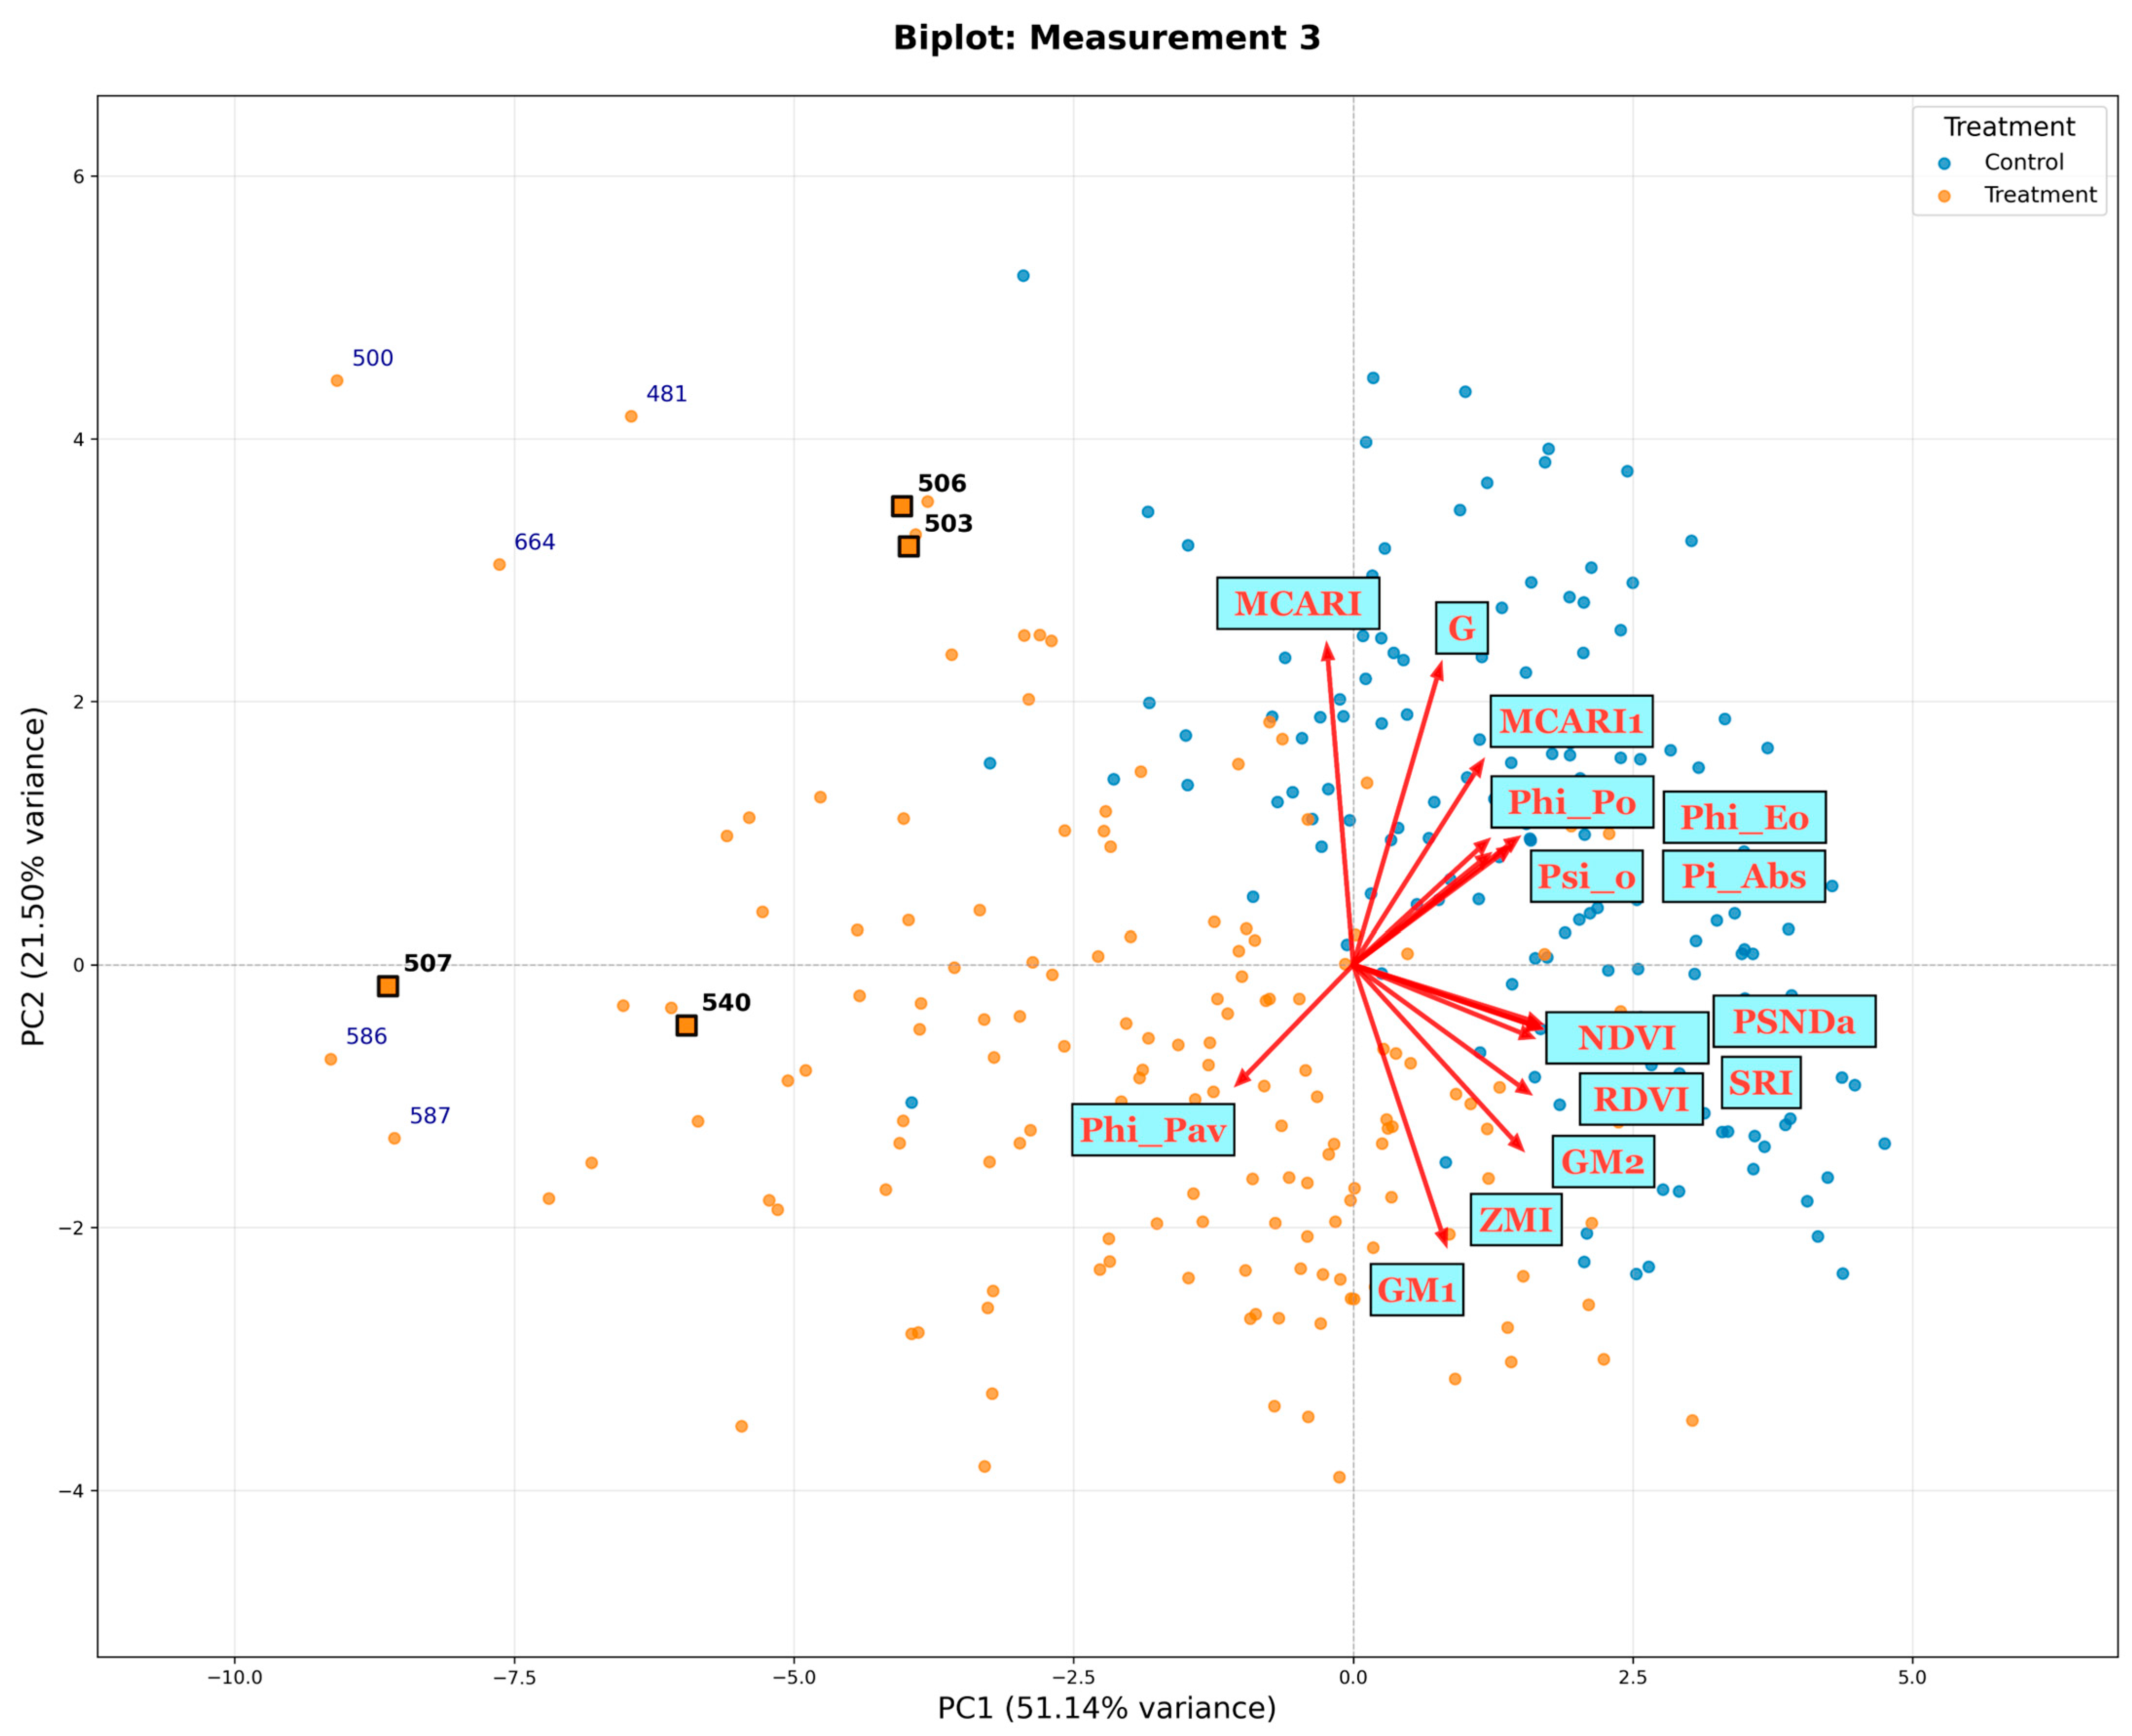
For Measurement 3, the eigenvectors of the HS indices (NDVI, SRI, ZMI, PSNDa, RDVI, GM1, and GM2) pointed strongly rightward again, aligned closely with PC1, indicating that they remained important indicators of overall plant status (Figure 8). The MCARI and G index now pointed strongly upward, showing positive correlations with PC2, while Phi_Pav pointed downward, maintaining its negative correlation with PC2. The ChlF parameters showed more complex patterns, with some parameters pointing upward and rightward and less contribution to PC2, while others had shifted in position. The score values that were furthest from the origin and from the scores that grouped together more closely (top 10% of points by distance) for Measurement 2 belonged to 32 genotypes, mostly from the admixed population (68.8%), followed by those from the Iodent population (28.2%), with only a few belonging to the B73 (3.125%) population. Four genotypes in top 10% of points by distance were the same as those in Measurements 1 and 2: one from the admixed population and three from the Iodent population (lines 503 (Iodent), 506 (Iodent), 507 (Iodent), and 540 (admixed); Table S1). Some of the other lines with a notable distance from the origin in Measurement 3 were 500, 481, 664, 586, and 587.
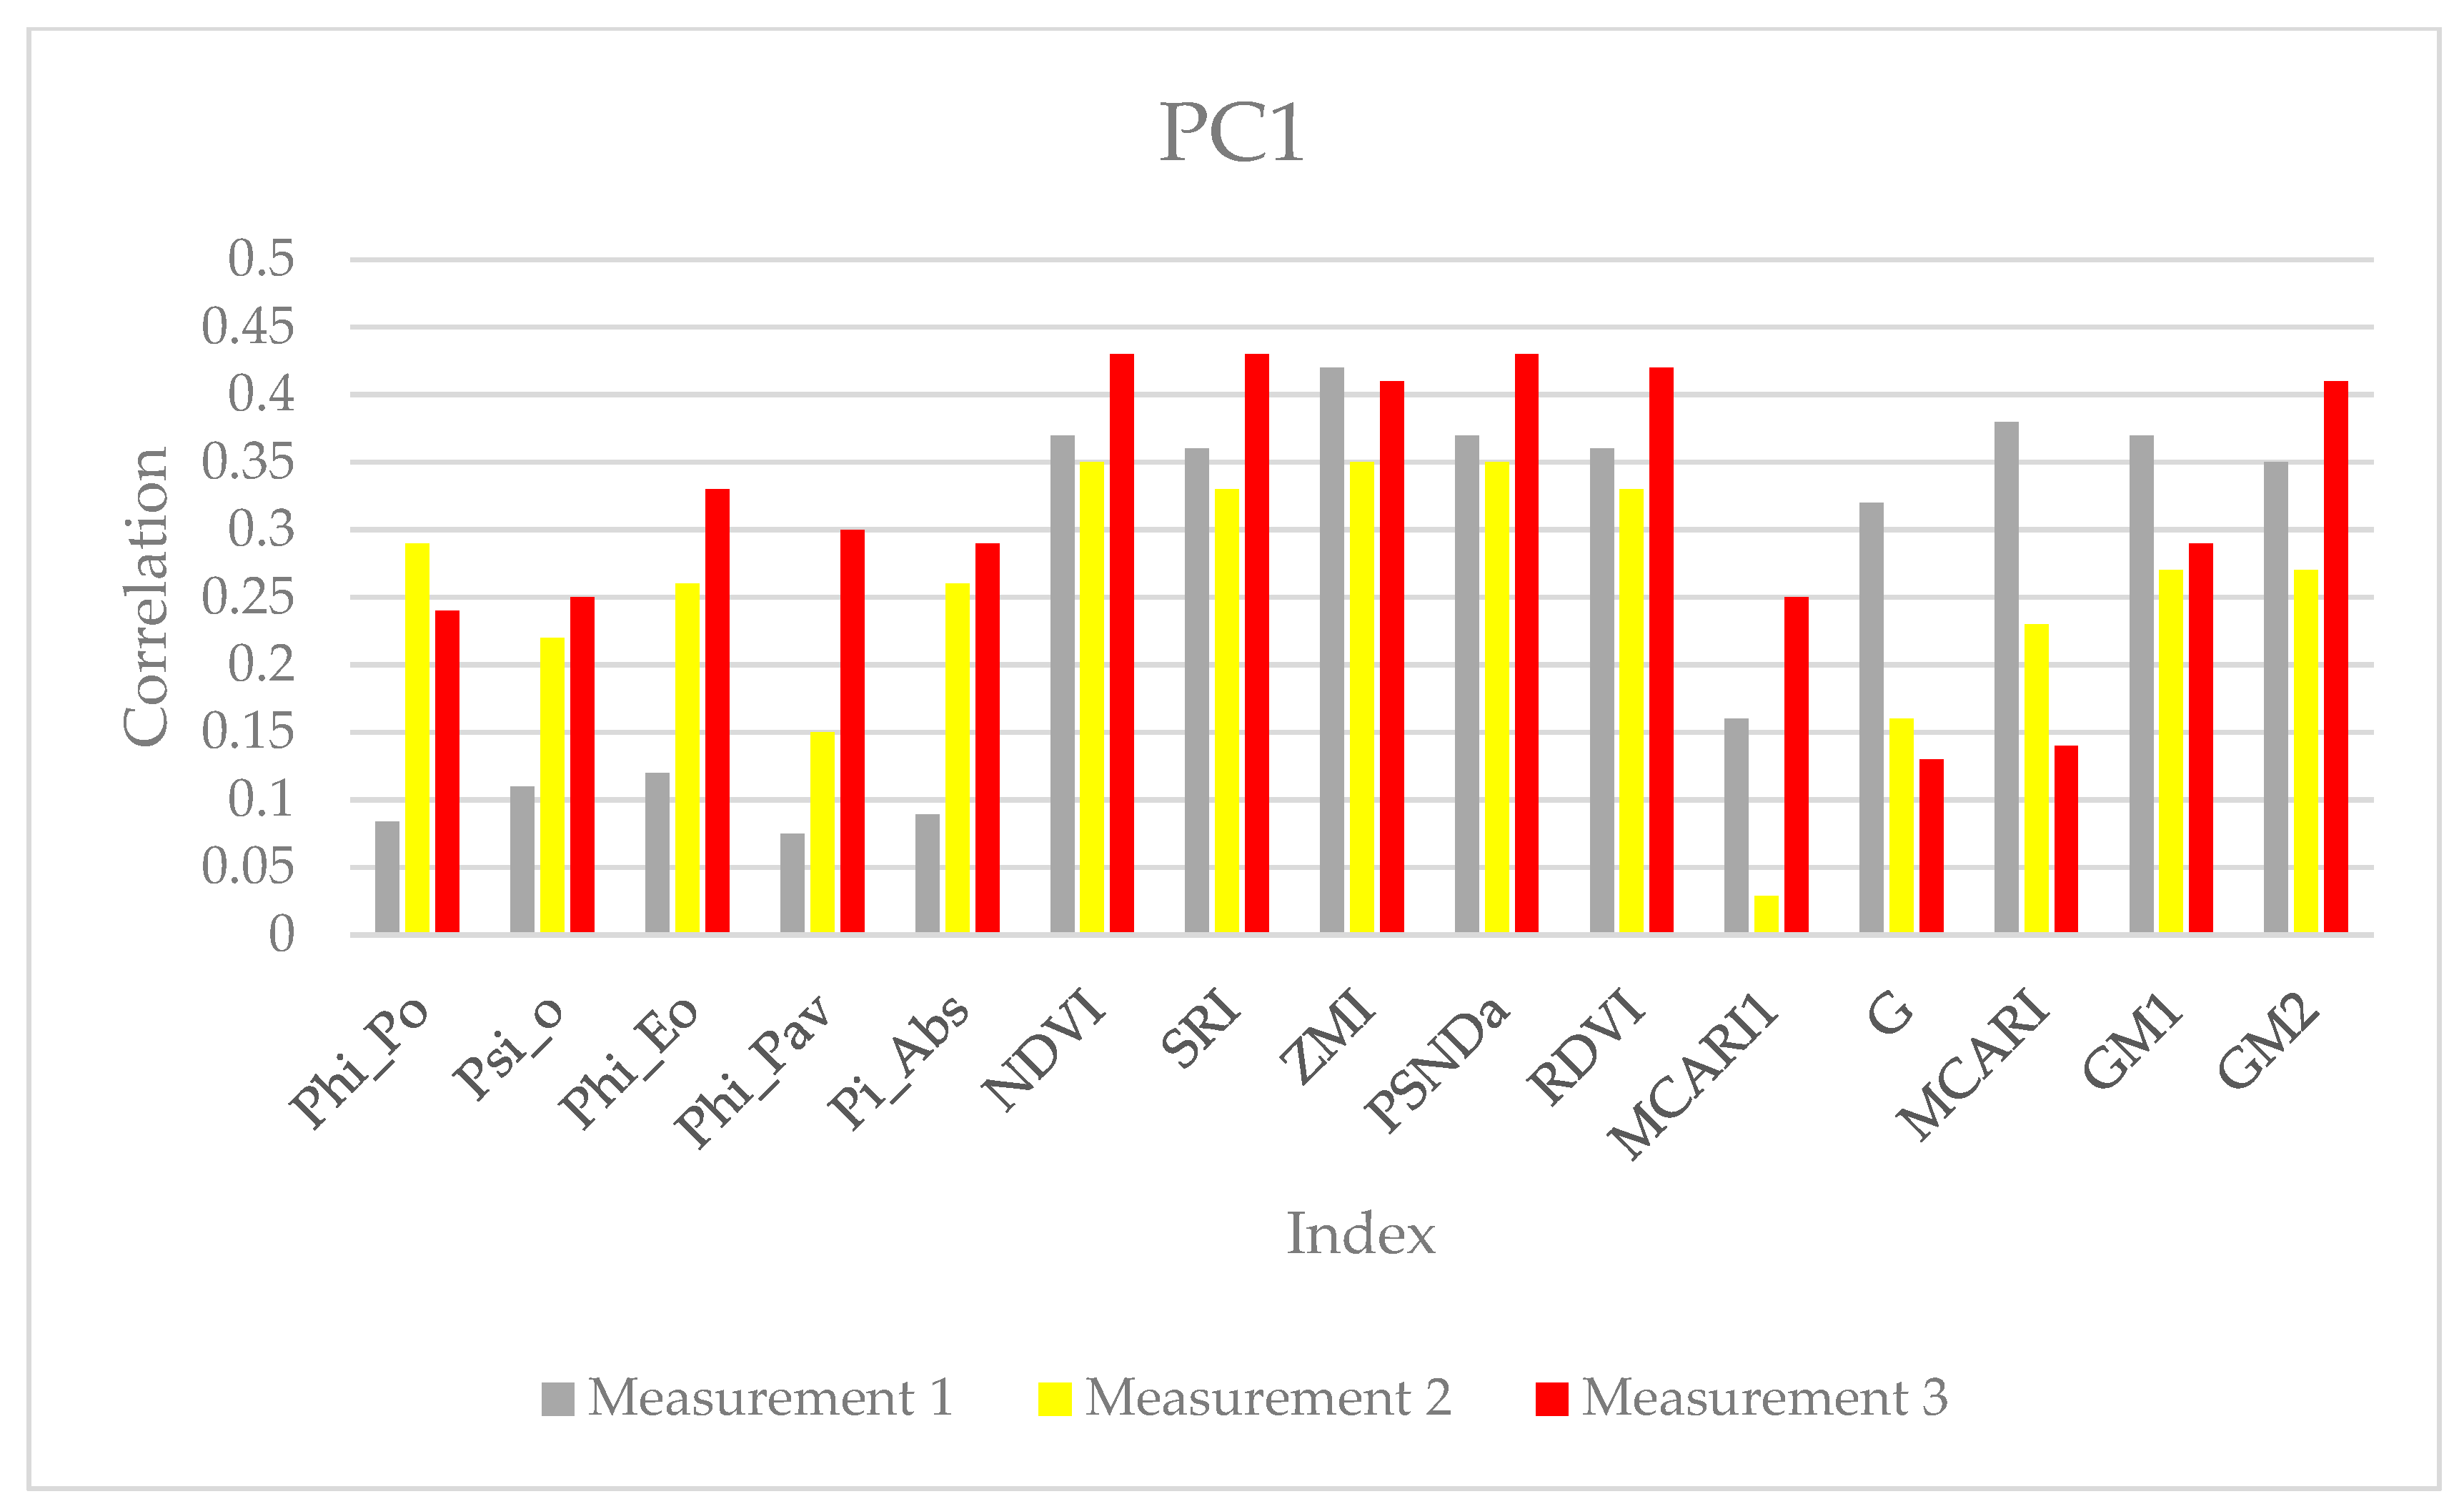
The variance explained by PC1 increased from 41.99% to 51.47% over the three weeks, indicating the plant responses became more structured and aligned along the primary axis of variation as the drought stress intensified. The changing orientation of the vectors across the measurements revealed how different physiological mechanisms gained or lost importance during the drought stress. The HS indices remained consistently important while the photosynthetic parameters showed complex shifts in their relationships. Figure 6, Figure 7 and Figure 8 provide strong evidence that the experimental approach effectively captured both the temporal dynamics of drought stress and the differential responses among genotypes. The correlation coefficients of the BLUPs for all the parameters with PC1 and PC2 across the three measurements are shown in Figure 9 and Figure 10, respectively. For PC1, the RDVI, PSNDa, NDVI, SRI, and ZMI had similar and higher correlations across all measurements (Figure 9). The MCARI and G index showed comparable trends that differed from the other HS indices, with a continuous decrease in the correlation values for PC1 throughout the measurements. As for the ChlF parameters, their correlation increased in Measurement 2 but still contributed relatively little.
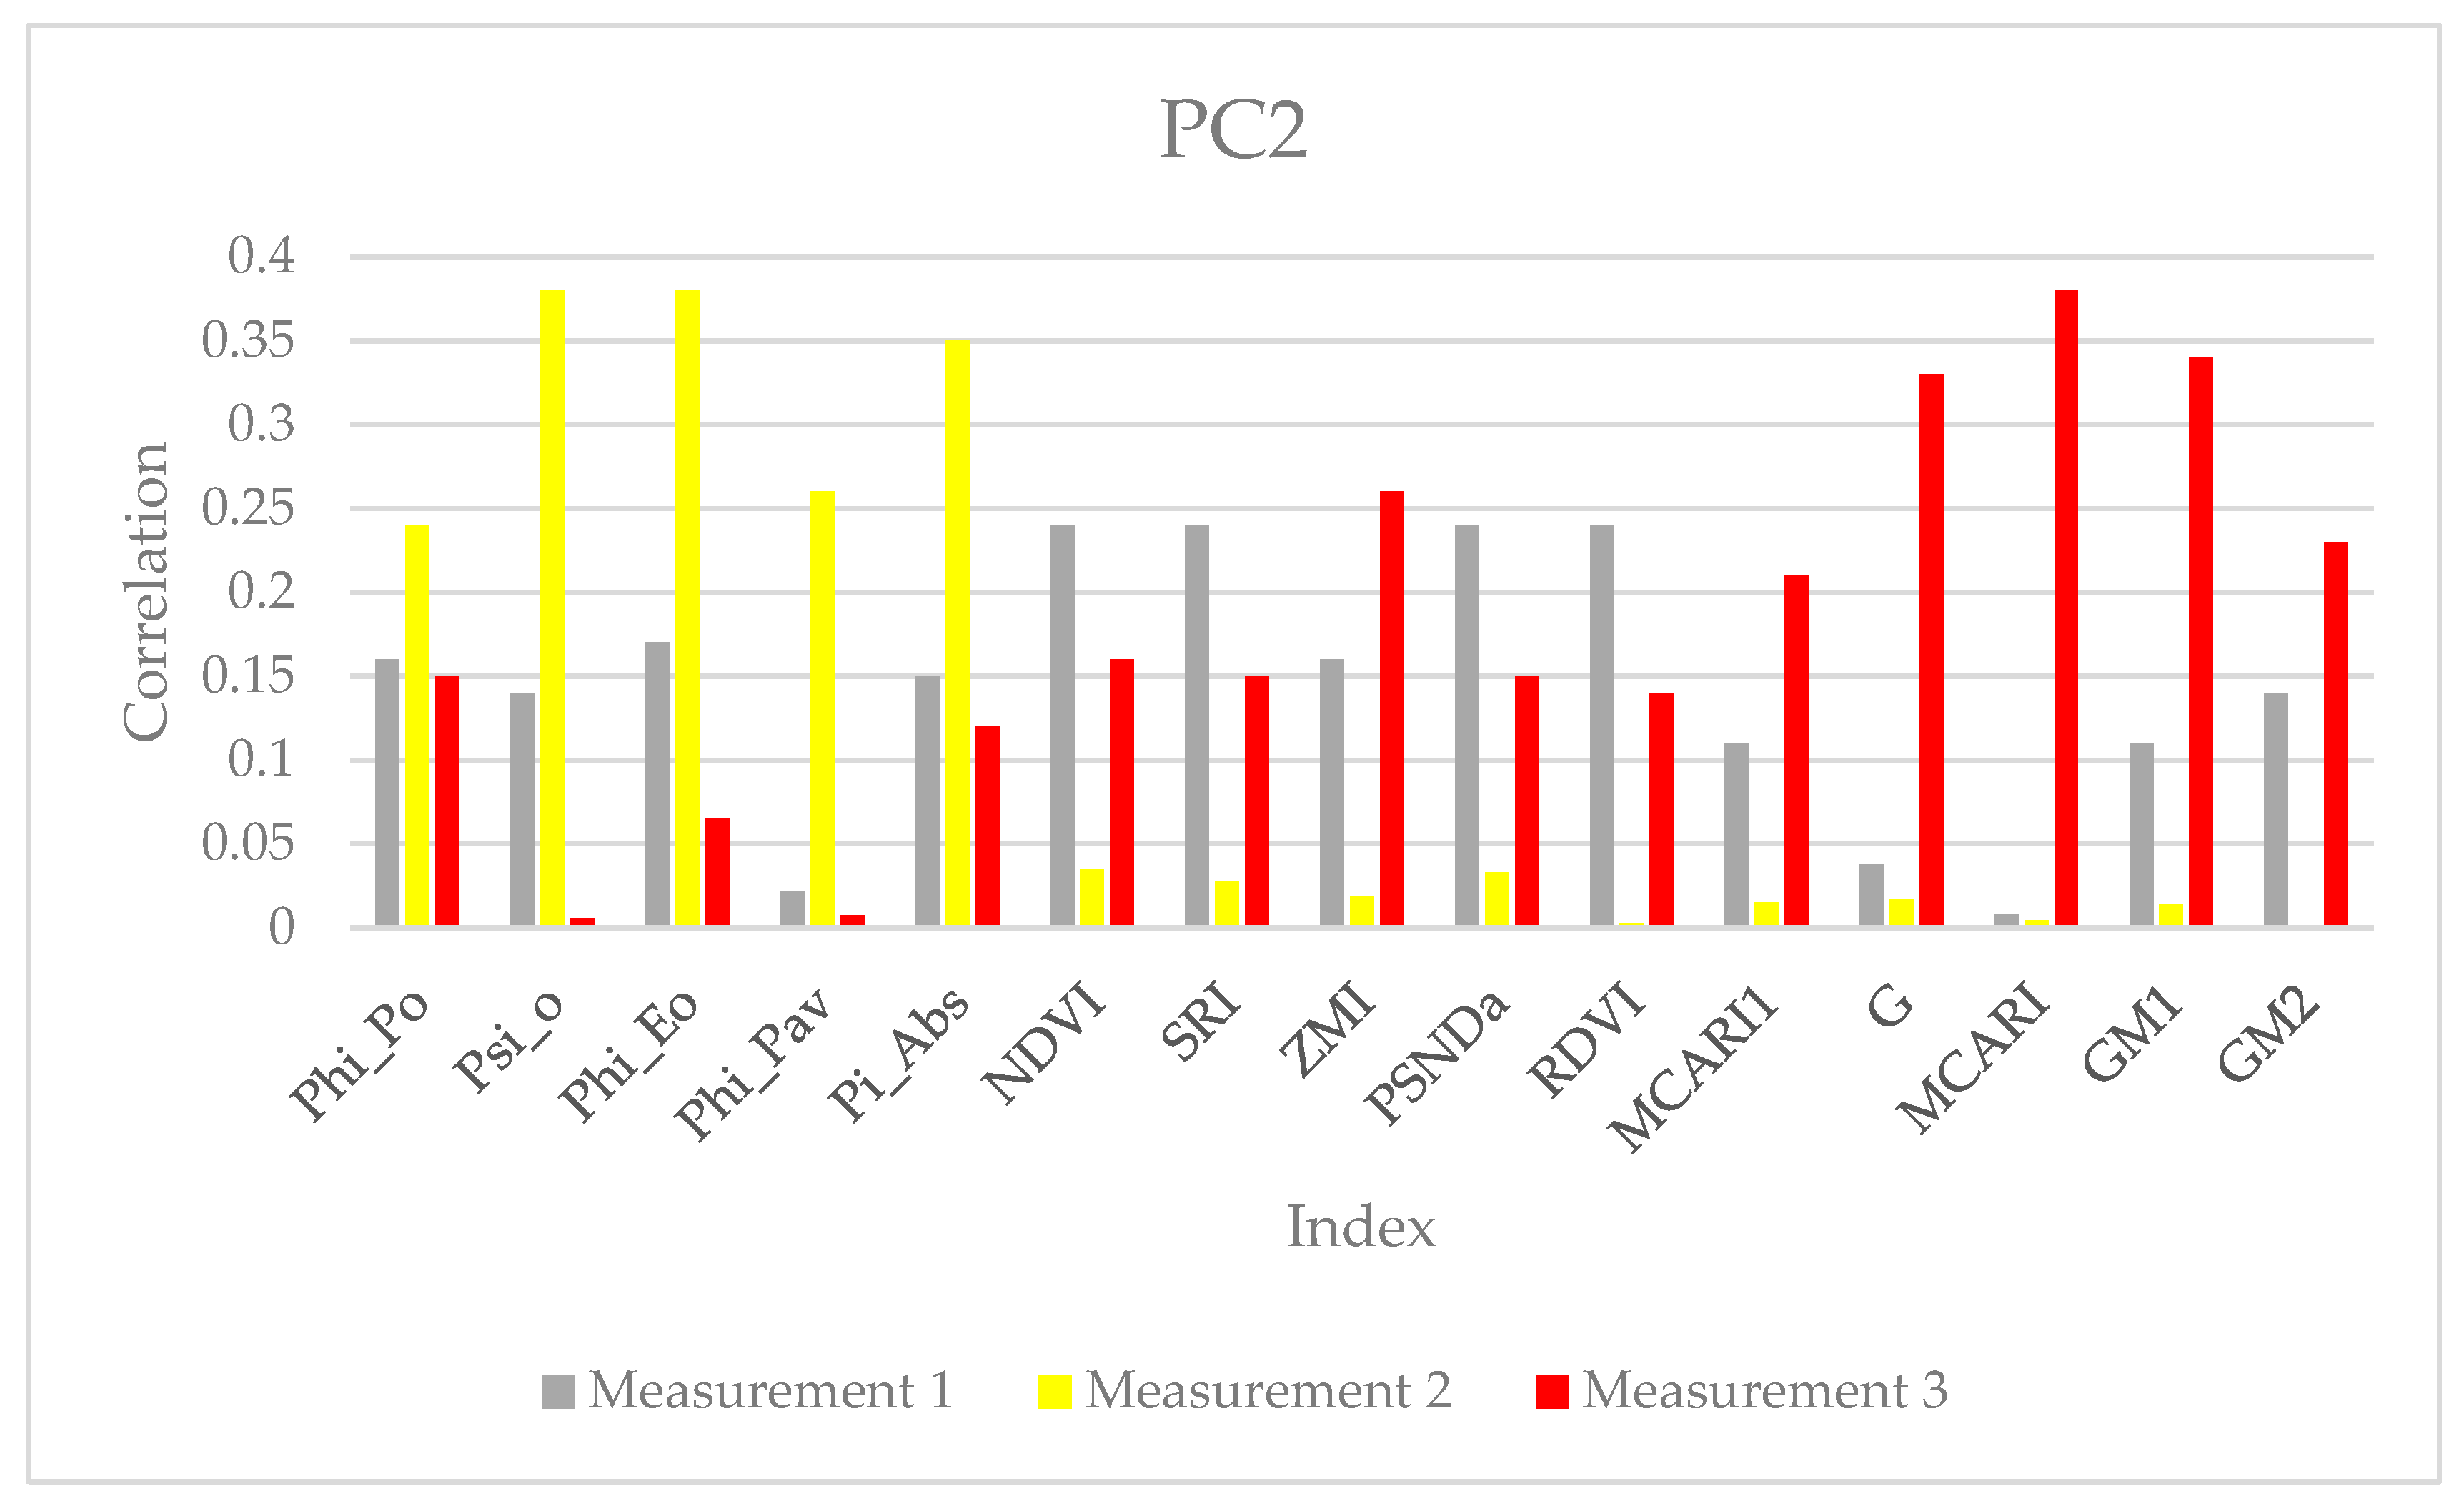
The PC2 correlations showed more prominent changes across the measurements than PC1 (Figure 10). The PC2 correlations for Measurement 2 were strongly dominated by the ChlF a parameters Phi_Eo, Pi_Abs, and Psi_o, which all had very high correlations (Phi_Po and Phi_Pav had slightly lower correlations). In contrast, the main HS indices (RDVI, NDVI, PSNDa, G, SRI, MCARI, ZMI, GM1, and GM2) had near-zero correlations with PC2 at this time point. In the Measurement 3 data, there was another shift in the structure for the HS indices (MCARI, G, GM1, ZMI, GM2, and MCARI1), which showed the highest correlations. In contrast to the correlations with PC1, the correlations with PC2 changed noticeably over time, with subtle differences in the Measurement 1 data, a strong predominance of ChlF parameter correlations in the Measurement 2 data, and a predominance of other indices (MCARI, GM1, G, ZMI, GM2, and MCARI1) under severe stress (Measurement 3).
The variables selected as highly informative (GM2, RDVI, SRI, NDVI, PSNDa, ZMI, and G), as described in Materials and Methods, also had BLUPs that highly correlated with the PCs.

4. Discussion

The maize genotypes did not have a uniform, linear response to drought stress. Different physiological mechanisms were activated and modified at specific time points during stress progression, showing that the structure of genotype x treatment (GxT) interactions is highly dynamic. Many factors such as stress duration, severity, genotype, and developmental stage influence the plant’s response to drought stress [57]. Plant drought adaptation involves complex molecular adjustments including altered gene expression, transient ABA increases, the accumulation of protective compounds (compatible solutes, enzymes, and antioxidants), and energy pathway inhibition [58]. However, differences in stress tolerance between genotypes, despite conserved gene machinery, often stem from variations in the timing of gene expression, constraining the direct applicability of the results [59]. A comprehensive study comparing dent maize (Zea mays indentata), popcorn (Zea mays everta), and sweet corn (Zea mays saccharata) revealed differences in their physiological, biochemical, enzymatic, and molecular drought response mechanisms [60]. These subspecies-specific variations affect both the timing and magnitude of changes in chlorophyll fluorescence parameters, suggesting that genetic background significantly influences when certain stress responses are activated. Our data showed, in most instances, significant changes in the photosynthetic parameters at the second time point for almost all maize populations. The Ohio population, on the other hand, showed significant changes at the third time point. The inbred lines from the admixed group showed the same changes at the third time point, where by over 70% of them had a high proportion of Ohio population. The different responses of individual genotypes will be investigated in detail within ongoing genome-wide association studies (GWASs) using the genotypic data presented in Table S1.
The physiological traits (greenness, vigor, chlorophyll content) that were the best at discriminating between genotype responses changed significantly as the drought stress progresses. This shifting of the importance of traits was visible through the HS indices [61] such as the NDVI, RDVI, ZMI, SRI, PSNDa, and GM2. However, some fluorescence parameters (Phi_Eo, Pi_Abs, and Psi_o) became crucially important for explaining secondary GxT variations during moderate stress (Measurement 2), while the other indices (MCARI and G) became more important for secondary GxT variations under severe stress (Measurement 3). The higher BLUP correlations of photosynthetic parameters with PC2 at the second week suggests the activation of specific photochemical responses and their utility for plant differentiation in the period with increasing stress severity. This indicates that under moderate drought, the way genotypes differ in their response to drought is primarily through the aspects of photosynthetic function captured by these fluorescence parameters, independent of the overall greenness variation captured by PC1.
The shift in variable importance and the index’s ability to discriminate between genotypes within and across measurements as the drought stress progressed suggests that we should focus on a specific set of variables. In addition, the high correlations between certain variables suggest that they capture very similar information and indicate the redundancy using multiple indices from the same correlation group in a model, and that perhaps a couple would suffice. For general differentiation of plant vigor under these conditions, the best pick would the indices that maintained high BLUP correlations throughout the measurements. In our experiment, the HS indices showed greater correlation stability and they would be more useful overall. HS imaging technology has been proven to be valuable for quantifying ChlF parameters and monitoring plant photosynthetic performance through using hyperspectral datasets that capture spectral signatures linked to key plant traits such as photosynthetic activity, leaf water status, internal leaf architecture, and pigment concentrations [62].
This experiment also highlights the importance of longitudinal measurements since measuring only at one time point gives an incomplete picture of the GxT structure. Plant genotype, type, and the duration and severity of stress combined with the timing (during specific plant growth and development stages) of the stress all play a role in the plant’s ability and mechanism used to mitigate the adverse effects of stress, which evolve over time.
Seven HS parameters (GM2, RDVI, SRI, NDVI, PSNDa, ZMI, and G) were shown to be most informative based on the adapted Kaiser rule. Most of the parameters belonged to the NIR group of indices. Due to lack of published data on use of most of these indices, the NDVI remains one of the most widely used index for plant health assessment for various purposes including site specific nutrient management [63], evaluation of crop management practices [64], heterosis effect assessment [65], and yield predictions [66]. In our study, the NDVI showed high informativeness for all the measurements, placing it in the group with the other parameters (including GM2, RDVI, SRI, PSNDa, ZMI, and G) that were also highly informative. Nevertheless, the usefulness and relevancy of ChlF indices [14,67,68,69,70] and HS indices [71,72,73,74] is thoroughly covered in the literature on various plant species (e.g., cereals (maize, wheat, rice, etc.) [75,76,77], woody plants [78,79], fruits and vegetables [80,81,82], etc.) in a variety of stress scenarios (biotic [83,84], abiotic [73,85], and combined stressors [86,87]). The results of our research also demonstrate the utility of fluorescence and hyperspectral imaging for assessing drought tolerance and contribute to the identification of reliable, high-throughput indicators for determining genetic variation under water-limited conditions. Furthermore, it provides insights into the temporal dynamics of the importance of specific ChlF and HS indices.

5. Conclusions

This experiment showed the dynamic nature of the importance and informativeness of selected indices over the progression of drought stress in young maize plants. The HS indices had more stable higher BLUP correlation coefficients with PC1 throughout the experiment compared to the ChlF indices. However, the higher BLUP correlation of photosynthetic efficiency parameters with PC2 in the period of stress intensification highlight the importance of ChlF measurements in differentiating different plant (genotype) responses during this period. According to our results, ChlF and HS indices seem to be complementary rather than redundant. This finding may be important for further phenotypic and GWAS analyses for detecting associations among indices and agronomic traits related to drought tolerance and the genetic factors controlling them.

Supplementary Materials

The following supporting information can be downloaded at: https://www.mdpi.com/article/10.3390/agronomy15071604/s1, Table S1: The list of inbred maize lines used in the study, which were previously genotyped using the Illumina Infinium Maize50K array [42]. Number of genotypic groups and their proportion were determined by Admixture analysis [44], with the highest proportion of the respective group marked in bold.

Author Contributions

Conceptualization, V.G. and D.Š.; methodology, V.G.; software, V.G.; validation, D.Š.; formal analysis, L.V.; investigation, L.V.; resources, A.B. and A.J.; data curation, A.J.; writing—original draft preparation, L.V.; writing—review and editing, V.G. and D.Š.; supervision, D.Š.; funding acquisition, A.J. All authors have read and agreed to the published version of the manuscript.

Funding

This research received no external funding.

Data Availability Statement

Data is available from corresponding author upon request.

Conflicts of Interest

The authors declare no conflicts of interest.

References

  1. Aslam, M.; Maqbool, M.A.; Cengiz, R. Drought Stress in Maize (Zea mays L.); SpringerBriefs in Agriculture; Springer International Publishing: Cham, Switzerland, 2015; ISBN 978-3-319-25440-1. [Google Scholar]
  2. Galić, V.; Mlinarić, S.; Marelja, M.; Zdunić, Z.; Brkić, A.; Mazur, M.; Begović, L.; Šimić, D. Contrasting Water Withholding Responses of Young Maize Plants Reveal Link Between Lipid Peroxidation and Osmotic Regulation Corroborated by Genetic Analysis. Front. Plant Sci. 2022, 13, 804630. [Google Scholar] [CrossRef] [PubMed]
  3. Li, L.; Zhang, Q.; Huang, D. A Review of Imaging Techniques for Plant Phenotyping. Sensors 2014, 14, 20078–20111. [Google Scholar] [CrossRef] [PubMed]
  4. Li, D.; Quan, C.; Song, Z.; Li, X.; Yu, G.; Li, C.; Muhammad, A. High-Throughput Plant Phenotyping Platform (HT3P) as a Novel Tool for Estimating Agronomic Traits from the Lab to the Field. Front. Bioeng. Biotechnol. 2021, 8, 623705. [Google Scholar] [CrossRef] [PubMed]
  5. Solimani, F.; Cardellicchio, A.; Nitti, M.; Lako, A.; Dimauro, G.; Renò, V. A Systematic Review of Effective Hardware and Software Factors Affecting High-Throughput Plant Phenotyping. Information 2023, 14, 214. [Google Scholar] [CrossRef]
  6. Kautsky, H.; Hirsch, A. Neue Versuche zur Kohlensäureassimilation. Naturwissenschaften 1931, 19, 964. [Google Scholar] [CrossRef]
  7. Strasser, R.J. The Grouping Model of Plant Photosynthesis: Heterogeneity of photosynthetic units in thylakoids. In Photosynthesis. Vol. 3: Structure and Molecular Organization of the Photosynthetic Membrane; George, A., Ed.; Balaban International Science Services: Kalithea Kassandra, Halkidiki, Greece; Philadelphia, PA, USA, 1981; pp. 727–737. [Google Scholar]
  8. Strasser, R.J.; Srivastava, A.; Tsimilli-Michael, M. The Fluorescence Transient as a Tool to Characterize and Screen Photosynthetic Samples. In Probing Photosynthesis: Mechanism, Regulation and Adaptation; Taylor & Francis: London, UK, 2000; p. 445. ISBN 978-0-7484-0821-4. [Google Scholar]
  9. Strasser, R.J.; Tsimilli-Michael, M.; Srivastava, A. Analysis of the Chlorophyll a Fluorescence Transient. In Chlorophyll a Fluorescence; Papageorgiou, G.C., Govindjee, Eds.; Advances in Photosynthesis and Respiration; Springer: Dordrecht, The Netherlands, 2004; Volume 19, pp. 321–362. ISBN 978-1-4020-3217-2. [Google Scholar]
  10. Bussotti, F.; Desotgiu, R.; Pollastrini, M.; Cascio, C. The JIP Test: A Tool to Screen the Capacity of Plant Adaptation to Climate Change. Scand. J. For. Res. 2010, 25, 1–8. [Google Scholar] [CrossRef]
  11. Baker, N.R.; Rosenqvist, E. Applications of Chlorophyll Fluorescence Can Improve Crop Production Strategies: An Examination of Future Possibilities. J. Exp. Bot. 2004, 55, 1607–1621. [Google Scholar] [CrossRef]
  12. Matsubara, S.; Chen, Y.-C.; Caliandro, R.; Govindjee; Clegg, R.M. Photosystem II Fluorescence Lifetime Imaging in Avocado Leaves: Contributions of the Lutein-Epoxide and Violaxanthin Cycles to Fluorescence Quenching. J. Photochem. Photobiol. B 2011, 104, 271–284. [Google Scholar] [CrossRef]
  13. Kalaji, H.M.; Schansker, G.; Ladle, R.J.; Goltsev, V.; Bosa, K.; Allakhverdiev, S.I.; Brestic, M.; Bussotti, F.; Calatayud, A.; Dąbrowski, P.; et al. Frequently Asked Questions about in Vivo Chlorophyll Fluorescence: Practical Issues. Photosynth. Res. 2014, 122, 121–158. [Google Scholar] [CrossRef]
  14. Moustaka, J.; Moustakas, M. Early-Stage Detection of Biotic and Abiotic Stress on Plants by Chlorophyll Fluorescence Imaging Analysis. Biosensors 2023, 13, 796. [Google Scholar] [CrossRef]
  15. Arief, M.A.A.; Kim, H.; Kurniawan, H.; Nugroho, A.P.; Kim, T.; Cho, B.-K. Chlorophyll Fluorescence Imaging for Early Detection of Drought and Heat Stress in Strawberry Plants. Plants 2023, 12, 1387. [Google Scholar] [CrossRef] [PubMed]
  16. Asaari, M.S.M.; Mertens, S.; Dhondt, S.; Inzé, D.; Wuyts, N.; Scheunders, P. Analysis of Hyperspectral Images for Detection of Drought Stress and Recovery in Maize Plants in a High-Throughput Phenotyping Platform. Comput. Electron. Agric. 2019, 162, 749–758. [Google Scholar] [CrossRef]
  17. Mohd Asaari, M.S.; Mertens, S.; Verbraeken, L.; Dhondt, S.; Inzé, D.; Bikram, K.; Scheunders, P. Non-Destructive Analysis of Plant Physiological Traits Using Hyperspectral Imaging: A Case Study on Drought Stress. Comput. Electron. Agric. 2022, 195, 106806. [Google Scholar] [CrossRef]
  18. Ram, B.G.; Oduor, P.; Igathinathane, C.; Howatt, K.; Sun, X. A Systematic Review of Hyperspectral Imaging in Precision Agriculture: Analysis of Its Current State and Future Prospects. Comput. Electron. Agric. 2024, 222, 109037. [Google Scholar] [CrossRef]
  19. Lu, Y.; Hao, Z.; Xie, C.; Crossa, J.; Araus, J.-L.; Gao, S.; Vivek, B.S.; Magorokosho, C.; Mugo, S.; Makumbi, D.; et al. Large-Scale Screening for Maize Drought Resistance Using Multiple Selection Criteria Evaluated under Water-Stressed and Well-Watered Environments. Field Crops Res. 2011, 124, 37–45. [Google Scholar] [CrossRef]
  20. Shuaibu, S.M.; Ogbodo, J.A.; Wasige, E.; Mashi, S.A. Assessing the Impact of Agricultural Drought on Maize Prices in Kenya with the Approach of the SPOT-VEGETATION NDVI Remote Sensing. Future Food J. Food Agric. Soc. 2016, 4, 8–18. [Google Scholar]
  21. Verma, B.; Prasad, R.; Srivastava, P.K.; Singh, P. Retrieval of Leaf Area Index Using Inversion Algorithm. In Proceedings of the 2022 12th Workshop on Hyperspectral Imaging and Signal Processing: Evolution in Remote Sensing (WHISPERS), Rome, Italy, 13–16 September 2022; pp. 1–4. [Google Scholar] [CrossRef]
  22. Jordan, C.F. Derivation of Leaf-Area Index from Quality of Light on the Forest Floor. Ecology 1969, 50, 663–666. [Google Scholar] [CrossRef]
  23. Nguy-Robertson, A.; Gitelson, A.; Peng, Y.; Viña, A.; Arkebauer, T.; Rundquist, D. Green Leaf Area Index Estimation in Maize and Soybean: Combining Vegetation Indices to Achieve Maximal Sensitivity. Agron. J. 2012, 104, 1336–1347. [Google Scholar] [CrossRef]
  24. Zarco-Tejada, P.J.; Miller, J.R.; Noland, T.L.; Mohammed, G.H.; Sampson, P.H. Scaling-up and Model Inversion Methods with Narrowband Optical Indices for Chlorophyll Content Estimation in Closed Forest Canopies with Hyperspectral Data. IEEE Trans. Geosci. Remote Sens. 2001, 39, 1491–1507. [Google Scholar] [CrossRef]
  25. Moorthy, I.; Miller, J.R.; Noland, T.L.; Nielsen, U.; Zarco-Tejada, P.J. Chlorophyll Content Estimation of Boreal Conifers Using Hyperspectral Remote Sensing. In Proceedings of the IGARSS 2003, 2003 IEEE International Geoscience and Remote Sensing Symposium, Proceedings (IEEE Cat. No. 03CH37477), Toulouse, France, 21–25 July 2003; Volume 4, pp. 2568–2570. [Google Scholar] [CrossRef]
  26. Blackburn, G.A. Spectral Indices for Estimating Photosynthetic Pigment Concentrations: A Test Using Senescent Tree Leaves. Int. J. Remote Sens. 1998, 19, 657–675. [Google Scholar] [CrossRef]
  27. Adak, S.; Bandyopadhyay, K.K.; Sahoo, R.N.; Mridha, N.; Shrivastava, M.; Purakayastha, T.J. Prediction of Wheat Yield Using Spectral Reflectance Indices under Different Tillage, Residue and Nitrogen Management Practices. Curr. Sci. 2021, 121, 402–413. [Google Scholar] [CrossRef]
  28. Ihuoma, S.O.; Madramootoo, C.A. Recent Advances in Crop Water Stress Detection. Comput. Electron. Agric. 2017, 141, 267–275. [Google Scholar] [CrossRef]
  29. He, J.; Zhang, N.; Su, X.; Lu, J.; Yao, X.; Cheng, T.; Zhu, Y.; Cao, W.; Tian, Y. Estimating Leaf Area Index with a New Vegetation Index Considering the Influence of Rice Panicles. Remote Sens. 2019, 11, 1809. [Google Scholar] [CrossRef]
  30. Zhang, L.; Zhang, H.; Niu, Y.; Han, W. Mapping Maize Water Stress Based on UAV Multispectral Remote Sensing. Remote Sens. 2019, 11, 605. [Google Scholar] [CrossRef]
  31. Eddy, P.R.; Smith, A.M.; Hill, B.D.; Peddle, D.R.; Coburn, C.A.; Blackshaw, R.E. Hybrid Segmentation—Artificial Neural Network Classification of High Resolution Hyperspectral Imagery for Site-Specific Herbicide Management in Agriculture. Photogramm. Eng. Remote Sens. 2008, 74, 1249–1257. [Google Scholar] [CrossRef]
  32. Wu, C.; Niu, Z.; Tang, Q.; Huang, W. Estimating Chlorophyll Content from Hyperspectral Vegetation Indices: Modeling and Validation. Agric. For. Meteorol. 2008, 148, 1230–1241. [Google Scholar] [CrossRef]
  33. Acharya, U.K.; Subedi, P.P.; Walsh, K.B.; McGlasson, W.B. Estimation of Fruit Maturation and Ripening Using Spectral Indices. Acta Hortic. 2016, 1119, 265–272. [Google Scholar] [CrossRef]
  34. Ardıç, M.; Işık, G.; Sezer, O.; Zeybek, Ş.; Gökçen, Ü.; Şahin, M.S.; Erkara, İ.P. Determination of Ecophysiological Responses to Temperature Shock in Different Wheat Genotypes. Int. J. Nat. Eng. Sci. 2021, 15, 36–42. [Google Scholar]
  35. Aliyeva, N.; Rustamova, S.; Huseynova, I. Non-Invasive Phenotyping of Drought Response in Bread Wheat Genotypes Using GM2 and MCARI1 Indices. Trans. Inst. Mol. Biol. Biotechnol. 2024, 8, 3–7. [Google Scholar] [CrossRef]
  36. Zhao, J.; Chen, X.; Japper, G.; Chang, H.; Ma, Z.; Duan, Y. Hyperspectral Indices for Leaf and Pixel Chlorophyll Estimation in Open-Canopy Tree. In Proceedings of the Geoinformatics 2007: Remotely Sensed Data and Information, Nanjing, China, 10 June 2007; p. 675222. [Google Scholar]
  37. Liu, M.; Qi, H.; Zhang, Z.P.; Song, Z.W.; Kou, T.J.; Zhang, W.J.; Yu, J.L. Response of Photosynthesis and Chlorophyll Fluorescence to Drought Stress in Two Maize Cultivars. Afr. J. Agric. Res. 2012, 7, 4751–4760. [Google Scholar] [CrossRef]
  38. Wang, Y.-Q.; Leng, P.; Shang, G.-F.; Zhang, X.; Li, Z.-L. Sun-Induced Chlorophyll Fluorescence Is Superior to Satellite Vegetation Indices for Predicting Summer Maize Yield under Drought Conditions. Comput. Electron. Agric. 2023, 205, 107615. [Google Scholar] [CrossRef]
  39. Jan, M.F.; Li, M.; Liaqat, W.; Altaf, M.T.; Liu, C.; Ahmad, H.; Khan, E.H.; Ali, Z.; Barutçular, C.; Mohamed, H.I. Chlorophyll Fluorescence: A Smart Tool for Maize Improvement. CEREAL Res. Commun. 2024, 53, 617–648. [Google Scholar] [CrossRef]
  40. Römer, C.; Wahabzada, M.; Ballvora, A.; Pinto, F.; Rossini, M.; Panigada, C.; Behmann, J.; Léon, J.; Thurau, C.; Bauckhage, C.; et al. Early Drought Stress Detection in Cereals: Simplex Volume Maximisation for Hyperspectral Image Analysis. Funct. Plant Biol. 2012, 39, 878–890. [Google Scholar] [CrossRef] [PubMed]
  41. Mertens, S.; Verbraeken, L.; Sprenger, H.; Demuynck, K.; Maleux, K.; Cannoot, B.; De Block, J.; Maere, S.; Nelissen, H.; Bonaventure, G.; et al. Proximal Hyperspectral Imaging Detects Diurnal and Drought-Induced Changes in Maize Physiology. Front. Plant Sci. 2021, 12, 640914. [Google Scholar] [CrossRef]
  42. Ganal, M.W.; Durstewitz, G.; Polley, A.; Bérard, A.; Buckler, E.S.; Charcosset, A.; Clarke, J.D.; Graner, E.-M.; Hansen, M.; Joets, J.; et al. A Large Maize (Zea mays L.) SNP Genotyping Array: Development and Germplasm Genotyping, and Genetic Mapping to Compare with the B73 Reference Genome. PLoS ONE 2011, 6, e28334. [Google Scholar] [CrossRef]
  43. Money, D.; Gardner, K.; Migicovsky, Z.; Schwaninger, H.; Zhong, G.-Y.; Myles, S. LinkImpute: Fast and Accurate Genotype Imputation for Nonmodel Organisms. G3 Genes|Genomes|Genet. 2015, 5, 2383–2390. [Google Scholar] [CrossRef]
  44. Alexander, D.H.; Lange, K. Enhancements to the ADMIXTURE Algorithm for Individual Ancestry Estimation. BMC Bioinform. 2011, 12, 246. [Google Scholar] [CrossRef]
  45. PolyPen|Handheld Devices. Available online: https://handheld.psi.cz/products/polypen/#accessories (accessed on 17 April 2025).
  46. Rouse, J.W.; Haas, R.H.; Schell, J.A.; Deering, D.W. Monitoring Vegetation Systems in the Great Plains with ERTS; NASA: Washington, DC, USA, 1974.
  47. Roujean, J.-L.; Breon, F.-M. Estimating PAR Absorbed by Vegetation from Bidirectional Reflectance Measurements. Remote Sens. Environ. 1995, 51, 375–384. [Google Scholar] [CrossRef]
  48. Haboudane, D.; Miller, J.R.; Pattey, E.; Zarco-Tejada, P.J.; Strachan, I.B. Hyperspectral Vegetation Indices and Novel Algorithms for Predicting Green LAI of Crop Canopies: Modeling and Validation in the Context of Precision Agriculture. Remote Sens. Environ. 2004, 90, 337–352. [Google Scholar] [CrossRef]
  49. Kauth, R.; Thomas, G. The Tasselled Cap—A Graphic Description of the Spectral-Temporal Development of Agricultural Crops as Seen by LANDSAT. LARS Symp. 1976, 159. Available online: https://docs.lib.purdue.edu/cgi/viewcontent.cgi?article=1160&context=lars_symp (accessed on 17 April 2025).
  50. Daughtry, C.S.T.; Walthall, C.L.; Kim, M.S.; de Colstoun, E.B.; McMurtrey, J.E. Estimating Corn Leaf Chlorophyll Concentration from Leaf and Canopy Reflectance. Remote Sens. Environ. 2000, 74, 229–239. [Google Scholar] [CrossRef]
  51. Gitelson, A.A.; and Merzlyak, M.N. Remote Estimation of Chlorophyll Content in Higher Plant Leaves. Int. J. Remote Sens. 1997, 18, 2691–2697. [Google Scholar] [CrossRef]
  52. Visual Studio Code-Code Editing. Redefined. Available online: https://code.visualstudio.com/ (accessed on 17 April 2025).
  53. Welcome to Python.Org. Available online: https://www.python.org/ (accessed on 17 April 2025).
  54. IterativeImputer. Available online: https://scikit-learn.org/stable/modules/generated/sklearn.impute.IterativeImputer.html (accessed on 17 April 2025).
  55. StandardScaler. Available online: https://scikit-learn/stable/modules/generated/sklearn.preprocessing.StandardScaler.html (accessed on 17 April 2025).
  56. Kaiser, H.F. The Application of Electronic Computers to Factor Analysis. Educ. Psychol. Meas. 1960, 20, 141–151. [Google Scholar] [CrossRef]
  57. Mansoor, S.; Chung, Y.S. Functional Phenotyping: Understanding the Dynamic Response of Plants to Drought Stress. Curr. Plant Biol. 2024, 38, 100331. [Google Scholar] [CrossRef]
  58. Salekdeh, G.H.; Reynolds, M.; Bennett, J.; Boyer, J. Conceptual Framework for Drought Phenotyping during Molecular Breeding. Trends Plant Sci. 2009, 14, 488–496. [Google Scholar] [CrossRef]
  59. Morari, F.; Meggio, F.; Lunardon, A.; Scudiero, E.; Forestan, C.; Farinati, S.; Varotto, S. Time Course of Biochemical, Physiological, and Molecular Responses to Field-Mimicked Conditions of Drought, Salinity, and Recovery in Two Maize Lines. Front Plant Sci 2015, 6, 314. [Google Scholar] [CrossRef]
  60. Eskikoy, G.; Kutlu, I. Inter-Subspecies Diversity of Maize to Drought Stress with Physio-Biochemical, Enzymatic and Molecular Responses. PeerJ 2024, 12, e17931. [Google Scholar] [CrossRef]
  61. Huete, A. Vegetation Indices. In Encyclopedia of Remote Sensing; Njoku, E.G., Ed.; Springer: New York, NY, USA, 2014; pp. 883–886. ISBN 978-0-387-36699-9. [Google Scholar]
  62. Yang, Y.; Liu, X.; Zhao, Y.; Tang, G.; Nan, R.; Zhang, Y.; Sun, F.; Xi, Y.; Zhang, C. Evaluation of Wheat Drought Resistance Using Hyperspectral and Chlorophyll Fluorescence Imaging. Plant Physiol. Biochem. 2025, 219, 109415. [Google Scholar] [CrossRef]
  63. Gorai, T.; Yadav, P.; Choudhary, G.L.; Kumar, A. Site-Specific Crop Nutrient Management for Precision Agriculture—A Review. Curr. J. Appl. Sci. Technol. 2021, 40, 37–52. [Google Scholar] [CrossRef]
  64. Damian, J.M.; Pias, O.H.D.C.; Cherubin, M.R.; Fonseca, A.Z.D.; Fornari, E.Z.; Santi, A.L. Applying the NDVI from Satellite Images in Delimiting Management Zones for Annual Crops. Sci. Agric. 2019, 77, e20180055. [Google Scholar] [CrossRef]
  65. Gimenez, K.; Blanc, P.; Argillier, O.; Pierre, J.-B.; Le Gouis, J.; Paux, E. Dissecting Bread Wheat Heterosis through the Integration of Agronomic and Physiological Traits. Biology 2021, 10, 907. [Google Scholar] [CrossRef] [PubMed]
  66. Tamás, A.; Kovács, E.; Horváth, É.; Juhász, C.; Radócz, L.; Rátonyi, T.; Ragán, P. Assessment of NDVI Dynamics of Maize (Zea mays L.) and Its Relation to Grain Yield in a Polyfactorial Experiment Based on Remote Sensing. Agriculture 2023, 13, 689. [Google Scholar] [CrossRef]
  67. Lichtenthaler, H.K.; Rinderle, U. The Role of Chlorophyll Fluorescence in The Detection of Stress Conditions in Plants. C R C Crit. Rev. Anal. Chem. 1988, 19, S29–S85. [Google Scholar] [CrossRef]
  68. Kalaji, H.M.; Jajoo, A.; Oukarroum, A.; Brestic, M.; Zivcak, M.; Samborska, I.A.; Cetner, M.D.; Łukasik, I.; Goltsev, V.; Ladle, R.J. Chlorophyll a Fluorescence as a Tool to Monitor Physiological Status of Plants under Abiotic Stress Conditions. Acta Physiol. Plant. 2016, 38, 102. [Google Scholar] [CrossRef]
  69. Legendre, R.; Basinger, N.T.; van Iersel, M.W. Low-Cost Chlorophyll Fluorescence Imaging for Stress Detection. Sensors 2021, 21, 2055. [Google Scholar] [CrossRef]
  70. Swoczyna, T.; Kalaji, H.M.; Bussotti, F.; Mojski, J.; Pollastrini, M. Environmental Stress—What Can We Learn from Chlorophyll a Fluorescence Analysis in Woody Plants? A Review. Front. Plant Sci. 2022, 13, 1048582. [Google Scholar] [CrossRef]
  71. Kim, Y.; Glenn, D.M.; Park, J.; Ngugi, H.K.; Lehman, B.L. Hyperspectral Image Analysis for Plant Stress Detection. In Proceedings of the 2010 ASABE Annual International Meeting, Pittsburgh, PA, USA, 20–23 June 2010. [Google Scholar]
  72. Behmann, J.; Steinrücken, J.; Plümer, L. Detection of Early Plant Stress Responses in Hyperspectral Images. ISPRS J. Photogramm. Remote Sens. 2014, 93, 98–111. [Google Scholar] [CrossRef]
  73. Sytar, O.; Brestic, M.; Zivcak, M.; Olsovska, K.; Kovar, M.; Shao, H.; He, X. Applying Hyperspectral Imaging to Explore Natural Plant Diversity towards Improving Salt Stress Tolerance. Sci. Total Environ. 2017, 578, 90–99. [Google Scholar] [CrossRef] [PubMed]
  74. Williams, D.; Karley, A.; Britten, A.; McCallum, S.; Graham, J. Raspberry Plant Stress Detection Using Hyperspectral Imaging. Plant Direct 2023, 7, e490. [Google Scholar] [CrossRef]
  75. Zhou, J.; Li, F.; Wang, X.; Yin, H.; Zhang, W.; Du, J.; Pu, H. Hyperspectral and Fluorescence Imaging Approaches for Nondestructive Detection of Rice Chlorophyll. Plants 2024, 13, 1270. [Google Scholar] [CrossRef]
  76. Bauriegel, E.; Herppich, W.B. Hyperspectral and Chlorophyll Fluorescence Imaging for Early Detection of Plant Diseases, with Special Reference to Fusarium Spec. Infections on Wheat. Agriculture 2014, 4, 32–57. [Google Scholar] [CrossRef]
  77. Feng, X.; Yu, C.; Chen, Y.; Peng, J.; Ye, L.; Shen, T.; Wen, H.; He, Y. Non-Destructive Determination of Shikimic Acid Concentration in Transgenic Maize Exhibiting Glyphosate Tolerance Using Chlorophyll Fluorescence and Hyperspectral Imaging. Front. Plant Sci. 2018, 9, 468. [Google Scholar] [CrossRef] [PubMed]
  78. Sampson, P.H.; Zarco-Tejada, P.J.; Mohammed, G.H.; Miller, J.R.; Noland, T.L. Hyperspectral Remote Sensing of Forest Condition: Estimating Chlorophyll Content in Tolerant Hardwoods. For. Sci. 2003, 49, 381–391. [Google Scholar] [CrossRef]
  79. Navarro-Cerrillo, R.M.; Trujillo, J.; de la Orden, M.S.; Hernández-Clemente, R. Hyperspectral and Multispectral Satellite Sensors for Mapping Chlorophyll Content in a Mediterranean Pinus sylvestris L. Plantation. Int. J. Appl. Earth Obs. Geoinf. 2014, 26, 88–96. [Google Scholar] [CrossRef]
  80. Noh, H.K.; Lu, R. Hyperspectral Laser-Induced Fluorescence Imaging for Assessing Apple Fruit Quality. Postharvest Biol. Technol. 2007, 43, 193–201. [Google Scholar] [CrossRef]
  81. Pieczywek, P.M.; Cybulska, J.; Szymańska-Chargot, M.; Siedliska, A.; Zdunek, A.; Nosalewicz, A.; Baranowski, P.; Kurenda, A. Early Detection of Fungal Infection of Stored Apple Fruit with Optical Sensors—Comparison of Biospeckle, Hyperspectral Imaging and Chlorophyll Fluorescence. Food Control 2018, 85, 327–338. [Google Scholar] [CrossRef]
  82. Kasampalis, D.S.; Tsouvaltzis, P.; Ntouros, K.; Gertsis, A.; Gitas, I.; Siomos, A.S. The Use of Digital Imaging, Chlorophyll Fluorescence and Vis/NIR Spectroscopy in Assessing the Ripening Stage and Freshness Status of Bell Pepper Fruit. Comput. Electron. Agric. 2021, 187, 106265. [Google Scholar] [CrossRef]
  83. Pérez-Bueno, M.L.; Pineda, M.; Barón, M. Phenotyping Plant Responses to Biotic Stress by Chlorophyll Fluorescence Imaging. Front. Plant Sci. 2019, 10, 1135. [Google Scholar] [CrossRef]
  84. Delalieux, S.; Somers, B.; Verstraeten, W.W.; van Aardt, J.A.N.; Keulemans, W.; Coppin, P. Hyperspectral Indices to Diagnose Leaf Biotic Stress of Apple Plants, Considering Leaf Phenology. Int. J. Remote Sens. 2009, 30, 1887–1912. [Google Scholar] [CrossRef]
  85. Faqeerzada, M.A.; Park, E.; Kim, T.; Kim, M.S.; Baek, I.; Joshi, R.; Kim, J.; Cho, B.-K. Fluorescence Hyperspectral Imaging for Early Diagnosis of Heat-Stressed Ginseng Plants. Appl. Sci. 2023, 13, 31. [Google Scholar] [CrossRef]
  86. Praprotnik, E.; Vončina, A.; Žigon, P.; Knapič, M.; Susič, N.; Širca, S.; Vodnik, D.; Lenarčič, D.; Lapajne, J.; Žibrat, U.; et al. Early Detection of Wireworm (Coleoptera: Elateridae) Infestation and Drought Stress in Maize Using Hyperspectral Imaging. Agronomy 2023, 13, 178. [Google Scholar] [CrossRef]
  87. Ejaz, I.; Li, W.; Naseer, M.A.; Li, Y.; Qin, W.; Farooq, M.; Li, F.; Huang, S.; Zhang, Y.; Wang, Z.; et al. Detection of Combined Frost and Drought Stress in Wheat Using Hyperspectral and Chlorophyll Fluorescence Imaging. Environ. Technol. Innov. 2023, 30, 103051. [Google Scholar] [CrossRef]
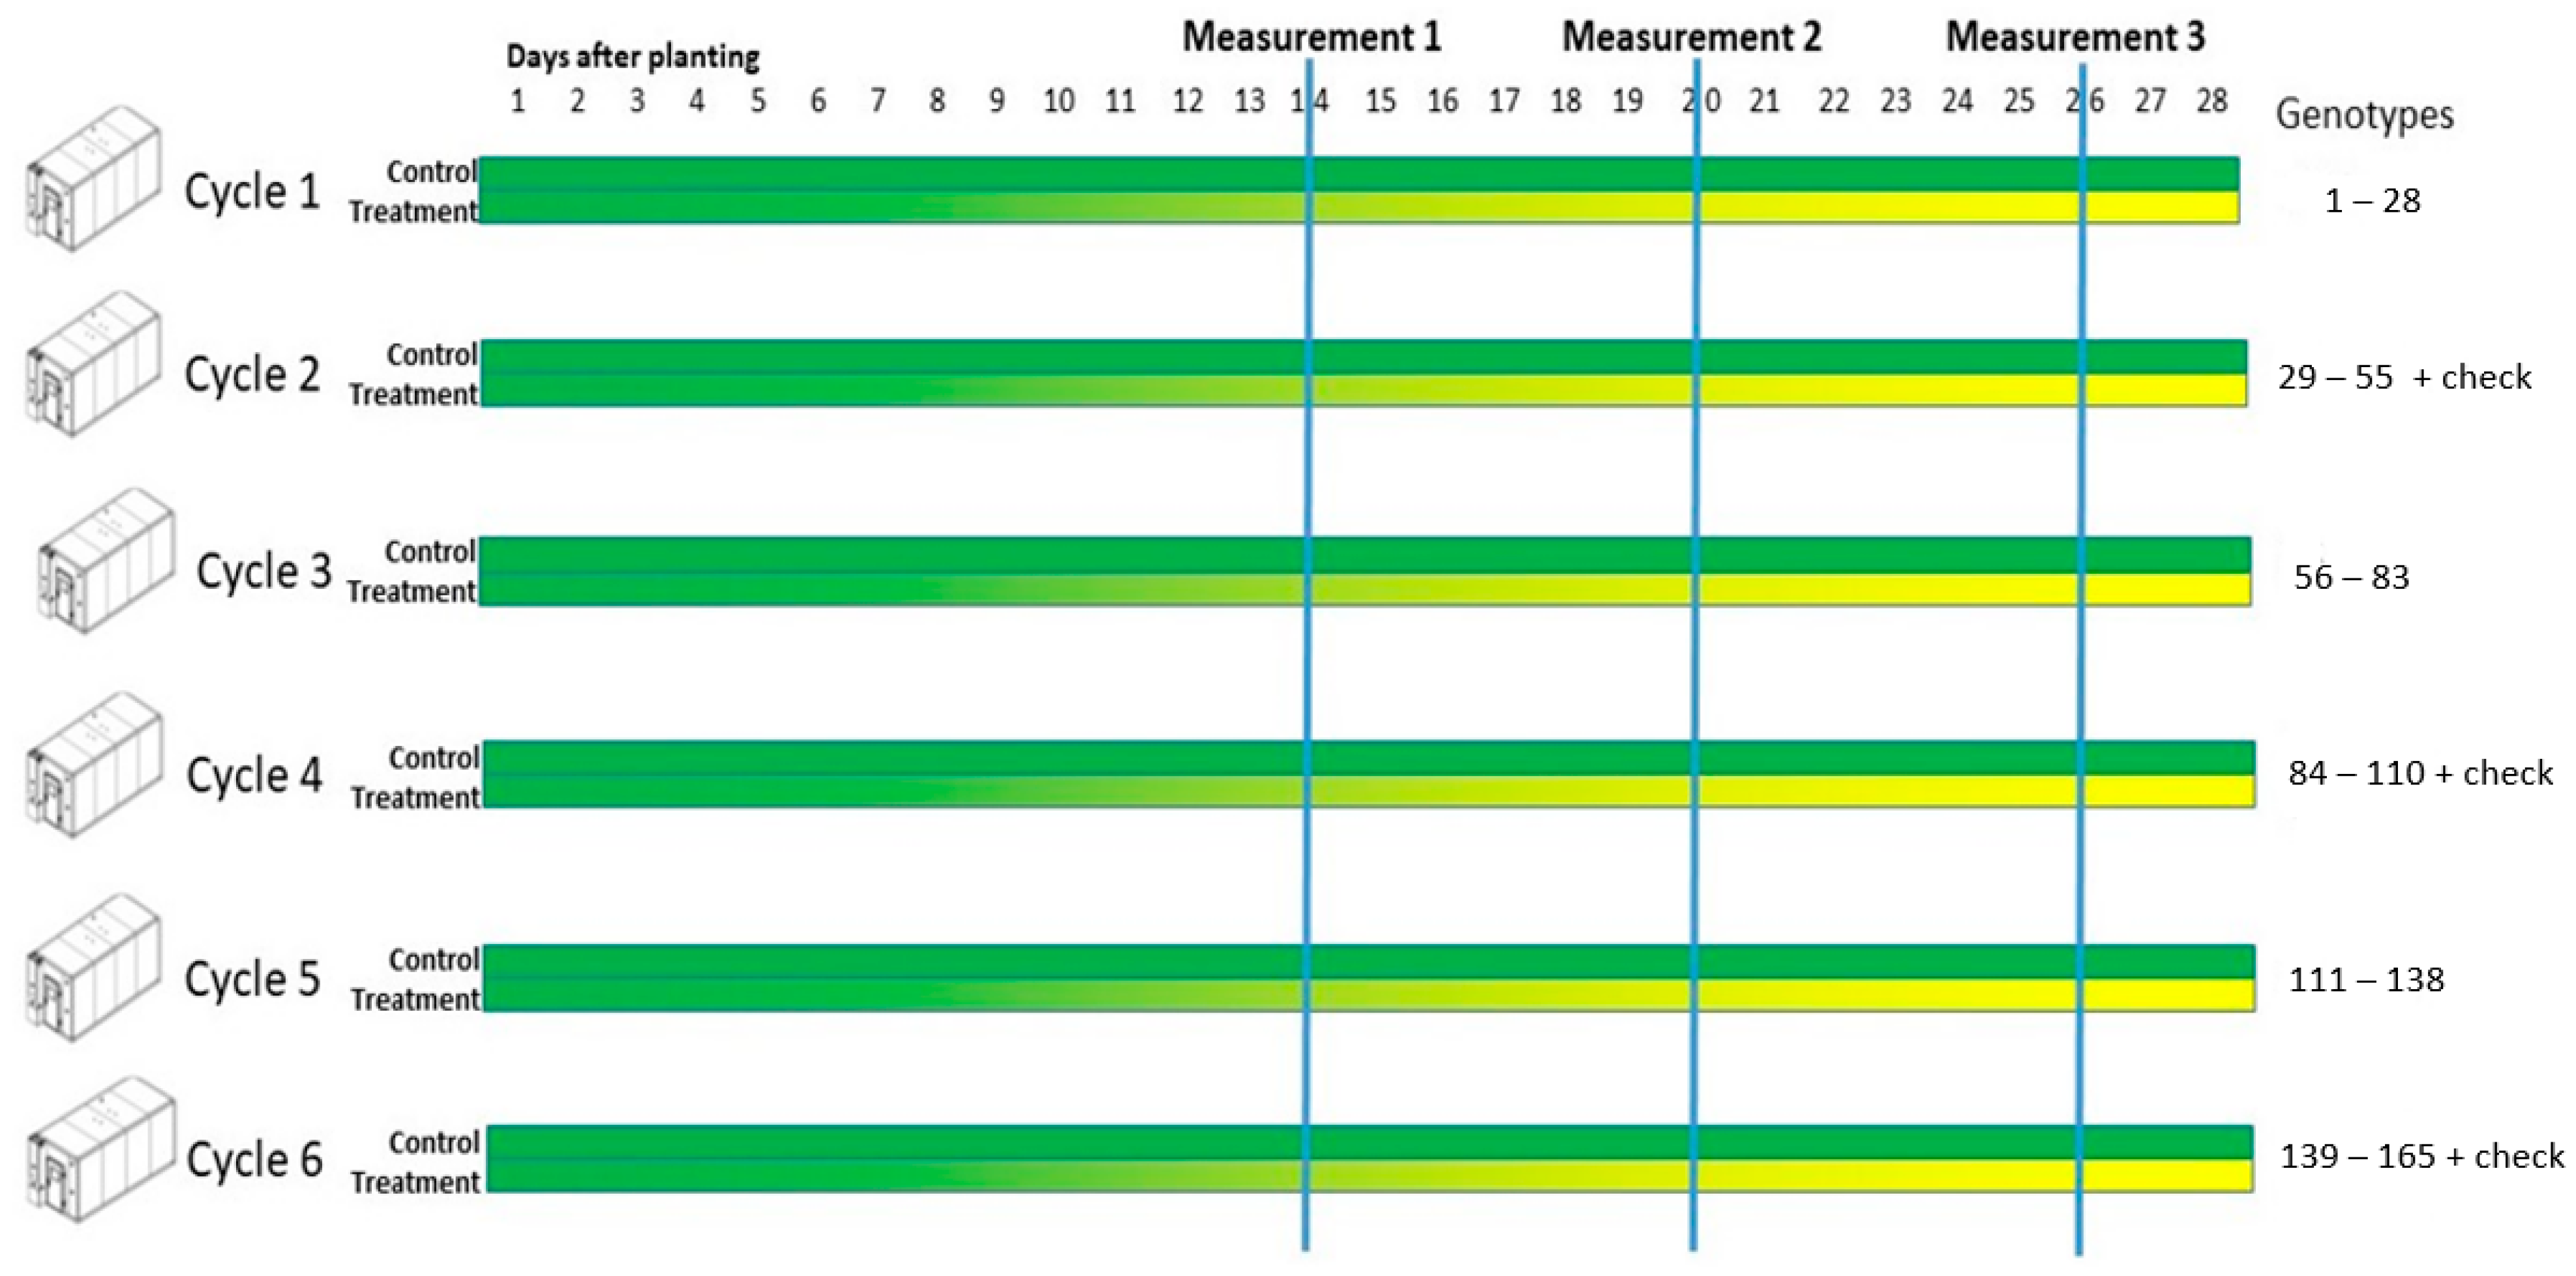
Figure 1. Schematic visualization of the experiment.
Agronomy 15 01604 g001
Figure 2. Images from one cycle of the experiment on the 20th (a) and 26th day (b) of growing showing difference between control and treatment groups.
Agronomy 15 01604 g002
Figure 3. Overall PCA biplot with eigenvectors (red arrows) for each variable sorted by treatment and measurement combination.
Agronomy 15 01604 g003
Figure 4. Overall loadings of each index for the first two principal components.
Agronomy 15 01604 g004
Figure 5. Overall feature correlation heatmap among fifteen ChlF and HS indices.
Agronomy 15 01604 g005
Figure 6. PCA biplot for the Measurement 1 with eigenvectors (red arrows) for each index, numbered points present genotypes furthest from the origin and from the scores that grouped together more closely.
Agronomy 15 01604 g006
Figure 7. PCA biplot for Measurement 2 with eigenvectors (red arrows) for each index, numbered points present genotypes furthest from the origin and from the scores that grouped together more closely.
Agronomy 15 01604 g007
Figure 8. PCA biplot for the Measurement 3 with eigenvectors (red arrows) for each index, numbered points present genotypes furthest from the origin and from the scores that grouped together more closely.
Agronomy 15 01604 g008
Figure 9. Correlation coefficients for all indices with PC1 across the three successive measurements.
Agronomy 15 01604 g009
Figure 10. Correlation coefficients for all indices with PC2 across the three successive measurements.
Agronomy 15 01604 g010
Table 1. List of parameters with their respective equations and literature references. Indices below NIR indices (bold) belong to indices in NIR spectral range and indices below UVIS indices (bold) belong to indices in UVIS spectral range.
IndexDefinitionReference(s)
Maximum quantum yield of primary photochemistry of a dark-adapted leaf (Phi_Po)Phi_Po = 1 − (F0/Fm) (or Fv/Fm)[8]
Probability that a trapped exciton moves an electron into the electron transport chain further than QA (Psi_o)Psi_o = 1 − VJ[8]
Quantum yield of electron transport (Phi_Eo)(1 − (Fo/FM)) × Psi_o[8]
Time to reach maximum chlorophyll fluorescence level (Phi_Pav)Phi_Po (SM/tFm)[8]
Performance index (Pi_Abs)(RC/ABS) [Phi_Po/(1 − Phi_Po)] [Psi_o/(1 − Phi_Po)][8]
NIR indices
Normalized Difference Vegetation (NDVI)(RNIR − RRED)/(RNIR + RRED)[46]
Simple Ratio Index (SRI)RNIR/RRED[22,46]
Zarco-Tejada and Miller Index (ZMI)R750/R710[24]
Plant Senescence Reflectance Index a (PSNDa)(R790 − R680)/(R790 + R680)[26]
Renormalized Difference Vegetation Index (RDVI)(R780 − R670)/((R780 + R670)0.5)[47]
UVIS indices
Modified Chlorophyll Absorption in Reflectance Index 1 (MCARI1)1.2 × [2.5 × (R790 − R670) − 1.3 × (R790 − R550)][48]
Greenness Index (G)R554/R677[49]
Modified Chlorophyll Absorption in Reflectance Index (MCARI)[(R700 − R670) − 0.2 × (R700 − R550)] × (R700/R670)[50]
Gitelson and Merzlyak Index 1 (GM1)R750/R550[51]
Gitelson and Merzlyak Index 2 (GM2)R750/R700[51]
Disclaimer/Publisher’s Note: The statements, opinions and data contained in all publications are solely those of the individual author(s) and contributor(s) and not of MDPI and/or the editor(s). MDPI and/or the editor(s) disclaim responsibility for any injury to people or property resulting from any ideas, methods, instructions or products referred to in the content.