Review

Application of Hyperspectral Imaging for Early Detection of Pathogen-Induced Stress in Cabbage as Case Study

by
Magdalena Szechyńska-Hebda
1,*,
Ryszard Hołownicki
2,
Grzegorz Doruchowski
2,
Konrad Sas
2,
Joanna Puławska
2,
Anna Jarecka-Boncela
2,
Magdalena Ptaszek
2 and
Agnieszka Włodarek
2
1
W. Szafer Institute of Botany Polish Academy of Sciences, Lubicz 46, 31 512 Krakow, Poland
2
The National Institute of Horticultural Research, Konstytucji 3 Maja 1/3, 96-100 Skierniewice, Poland
*
Author to whom correspondence should be addressed.
Agronomy 2025, 15(7), 1516; https://doi.org/10.3390/agronomy15071516
Submission received: 21 May 2025 / Revised: 17 June 2025 / Accepted: 18 June 2025 / Published: 22 June 2025
(This article belongs to the Section Pest and Disease Management)

Abstract

:
Cabbage (Brassica oleracea L.) is a globally significant vegetable crop that faces productivity challenges due to fungal and bacterial pathogens. This review highlights the potential of spectral imaging techniques, specifically multispectral and hyperspectral methods, in detecting biotic stress in cabbage, with a particular emphasis on pathogen-induced responses. These non-invasive approaches enable real-time assessment of plant physiological and biochemical changes, providing detailed spectral data to identify pathogens before visible symptoms appear. Hyperspectral imaging, with its high spectral resolution, allows for distinctions among different pathogens and the evaluation of stress responses, whereas multispectral imaging offers broad-scale monitoring suitable for field-level applications. The work synthesizes research in the existing literature while presenting novel experimental findings that validate and extend current knowledge. Significant spectral changes are reported in cabbage leaves infected by Alternaria brassicae and Botrytis cinerea. Early-stage detection was facilitated by alterations in flavonoids (400–450 nm), chlorophyll (430–450, 680–700 nm), carotenoids (470–520 nm), xanthophyll (520–600 nm), anthocyanin (550–560 nm, 700–710 nm, 780–790 nm), phenols/mycotoxins (700–750 nm, 718–722), water/pigments content (800–900 nm), and polyphenols/lignin (900–1000). The findings underscore the importance of targeting specific spectral ranges for early pathogen detection. By integrating these techniques with machine learning, this research demonstrates their applicability in advancing precision agriculture, improving disease management, and promoting sustainable production systems.

1. Introduction

Cabbage (Brassica oleracea) is a staple vegetable crop cultivated worldwide and valued for its nutritional content and economic importance. However, its growth is severely affected by a diverse range of fungal and bacterial diseases, many of which can devastate crops if unmanaged. Among fungal pathogens, Alternaria alternata, Alternaria brassicicola, and Alternaria brassicae cause Alternaria dark spot [1,2], leading to significant (50–75% reduction) yield losses [3]. Leptosphaeria maculans and Leptosphaeria biglobosa cause black leg disease, posing a major threat to Brassica species globally [4]. Downy mildew, caused by Hyaloperonospora brassicae, and white mould, caused by Sclerotinia sclerotiorum, are prevalent in moist environments [5]; they lead to wilting and crop destruction [6]. Among other essential pathogens affecting cabbage, B. cinerea, as an agent of grey mould, leads to necrotic lesions and tissue decay; in turn, Erysiphe cruciferarum causes powdery mildew and develops a white, powdery fungal cover on leaves. Plasmodiophora brassicae is a soil-borne protist responsible for clubroot, a devastating disease that induces gall formation on roots and can remain viable in the soil for years [7]. Bacterial pathogens also pose substantial threats to cabbage crops. Xanthomonas campestris pv. campestris causes black rot, one of the most destructive diseases, especially in warm and humid climates, with up to 50% crop loss reported [8]. Pectobacterium carotovorum and Pectobacterium atrosepticum are responsible for soft rot, which thrives under wet conditions and can cause total crop failure [9]. Pseudomonas syringae species induce bacterial leaf spot and blight [10].
An integrated disease management approach, including, among others, the use of resistant varieties, crop rotation, biological control agents, and timely applications of plant protection products, is essential to mitigate the impact of these diseases and ensure sustainable cabbage production [11]. However, the growing complexity of plant pathogens requires the development of more precise and rapid monitoring systems, which is the basis for correct decisions on treatments with plant protection products. Climate change and environmental challenges faced by agriculture impact plant diseases, adding another layer of complexity to monitoring systems and necessitating the expansion of models to include more components and identify the most important ones [12]. Timely identification of fungal and bacterial pathogens can significantly reduce the spread of infections and mitigate crop losses. Traditional monitoring methods, such as visual inspections and laboratory tests, are labour-intensive and time-consuming, which often delay the response to disease outbreaks. While these methods may be practical for small-scale fields, their application to large-scale farming operations becomes increasingly challenging due to the significant resources required for comprehensive coverage. Consequently, there is a growing need to implement efficient, real-time monitoring strategies that enable early intervention and effectively reduce the impact of plant diseases, particularly in large agricultural systems.
One promising approach is the application of various imaging techniques, which allow for non-invasive and precise monitoring of plant health [13]. Remote sensing technologies, including satellite imaging and drone-based multispectral and hyperspectral cameras, can provide real-time, high-resolution data on crop conditions. Recently, the most explored is multispectral and hyperspectral imaging. They have emerged as promising non-invasive technologies for the early and precise detection of plant stress and diseases [14] because they offer real-time insights into plant physiological and biochemical changes, enabling proactive management strategies in agriculture [15]. Multispectral imaging is particularly valuable for disease detection in crops like cabbage, where the primary harvestable product is the compact head of edible leaves. The captured data across multiple wavelengths of light allow for the identification of changes in plant stress on leaf surfaces, which may indicate the onset of infection [16]. The changes, such as alterations in chlorophyll content or water stress, can be indicative of disease presence. It makes detection of leaf diseases crucial to protect the overall yield quality and market value. Hyperspectral imaging provides even more detailed spectral analysis across hundreds of narrow bands, which allows for the detection of pathogens with greater specificity and sensitivity [16], often before visible symptoms emerge. This technique can capture information on biochemical changes in cabbage plants (e.g., water, pigments, and nutrient deficiencies caused by pathogen development) and/or the presence specific pathogen (e.g., pathogen toxin production). Therefore, hyperspectral detection provides a particularly valuable tool for distinguishing between the different pathogens that affect the above-ground parts of the plant. By enabling precise disease diagnosis, hyperspectral imaging ensures targeted protection of cabbage crops and minimizes unnecessary inputs, thus supporting both yield quality and sustainability.
The integration of spectral imaging technologies into a comprehensive monitoring system has the potential to revolutionise plant disease management. Capturing detailed light reflections from plants using hyperspectral and multispectral cameras can be complemented by data acquisition and transmission, where the information collected by the cameras is gathered through, e.g., unmanned aerial vehicles (UAVs) or satellite sensors, enabling rapid and widespread monitoring of large agricultural areas. The data can then be directly analysed to inform disease management decisions. Furthermore, these technologies can be integrated with machine learning algorithms to automate disease detection and prediction models, significantly enhancing the efficiency of crop protection efforts [17]. This can optimise the overall management of crop diseases, ensuring higher yields, reducing the use of chemical pesticides, and promoting sustainable production.

2. Principles of Spectral Methods

Spectral imaging (multispectral, hyperspectral) involves capturing and processing information based on the interaction of light with a plant, which results from the combined effects of light reflectance, absorption, and transmission across a range of wavelengths. This method enables the translation of light-material interactions into wavelength-specific signals, providing detailed insights into the structural, chemical, and physiological properties of the analysed plant cells.
Concerning this, reflectance refers to the fraction of light reflected from a plant’s surface. It depends on surface properties (e.g., leaf structure, roughness, and texture), the wavelength of light, and its angle of incidence. Plant tissues reflect light differently in the visible (VIS, 400–700 nm), near-infrared (NIR, 700–900), and short-wave infrared (SWIR, 900–2500 nm) regions due to the presence of cell pigments like chlorophyll (which reflects green light) and the structural properties of cell walls, including their water content. Light reflectance is around 5–20% in the VIS light range, while NIR increases to 40–60% [18]. The estimated forest canopy reflectance agrees well with the reflectance in the chlorophyll absorption-sensitive regions, with discrepancies of 0.06–1.07% and 0.36–1.63%, respectively, in the average reflectance of the red and red-edge regions [19].
Absorption occurs when light energy is absorbed by a plant and converted into other forms, such as heat or chemical energy in photosynthesis [20,21]. The extent of absorption depends on the plant’s molecular composition and the wavelength of the incident light. Each compound within the plant has unique absorption characteristics, known as its absorption spectrum, e.g., 1/chlorophyll absorbs light primarily in the red (650–700 nm) and blue (430–450 nm) region; 2/carotenoids predominantly in the blue region (400–500 nm); 3/anthocyanin in VIS spectrum (400–700 nm); 4/water within SWIR (around 1300–1450 nm and 1850–1950 nm); 5/proteins and lignin in UV (200–400 nm); 6/nitrates and phosphates in VIS (400–700 nm) and NIR (around 600–900 nm); 7/starch and sugars in NIR region (around 1100–1300 nm). Light absorption in the VIS range is about 70–90%, primarily due to chlorophyll and other pigments, whereas in NIR, absorption decreases to around 20–50% [18].
Transmission refers to the passage of light through a plant or plant canopy without being absorbed or reflected. It is influenced by the leaf thickness, composition, and internal structure. Light penetration depths, e.g., in fruits and vegetables, were estimated to range between 0.97 and 6.52 cm over wavelengths of 500–1000 nm. These depths were significantly influenced by the reflectance and absorption properties of pigments such as chlorophyll, anthocyanin, and carotenoids [22]. In the plant canopy, light transmission in the VIS spectrum is 10–15%, and in NIR, it reaches 40–60% [18].
Understanding the relationships between reflectance, absorption, and transmission is crucial in spectral imaging. An increase in the concentration of a specific plant compound leads to higher absorption in its characteristic spectral regions, which reduces both reflectance and transmission in those regions. Conversely, a decrease in the concentration of that compound reduces absorption, increases reflectance, and enhances light transmission in the same spectral regions. An increase in chlorophyll content, for instance, leads to higher absorption in red and blue regions, reducing reflectance and transmission in the corresponding wavelengths, while a decrease in chlorophyll content reduces absorption, increases reflectance in the red and blue regions, and enhances light transmission [23]. On the other hand, plants and canopies exhibit significant reflectance in NIR (particularly 700–900 nm), coupled with absorption in the red and blue regions. These spectral characteristics are commonly utilised to estimate chlorophyll content and evaluate forest canopy health [19]. In plants such as maize, wheat, or coniferous trees, reflectance in NIR is around 50–60%, while absorption decreases to 10–30%, and transmission in NIR can reach up to 30–40%. In the SWIR range, reflectance remains low (5–15%), with high absorption at 70–90% [19]. Furthermore, barley leaves, depending on pathogen infection, exhibit differences in transmission and reflectance. Transmission in VIS light typically ranges from 10 to 20%, with absorption at 70–80%. In NIR, reflectance increases to around 50% [24].
This process leverages the unique spectral fingerprints of chemical compounds and structural features, facilitating the spectral (multispectral and/or hyperspectral) identification and quantification of pigments, water content, cellular structure, and biochemical constituents in plant tissues. Despite sharing similar underlying principles, multi- and hyperspectral imaging methods differ primarily in their capacity for identifying and quantifying biochemical constituents in plant tissues. These differences stem from the technical implementation rather than the fundamental measurement concepts. The number of spectral bands and the resolution of both methods result in distinct advantages and limitations, which significantly affect the precision, resolution, and scope of the data collected, thereby influencing the types of insights they can provide and their suitability for specific applications. Table 1 shows a comparative overview of the two imaging techniques and highlights their respective strengths and limitations.
Multispectral imaging captures data across a limited number of broad spectral bands (3–10). The spectral resolution typically ranges from 20 to 50 nm per band and gives moderate spatial detail (commonly 1–10 m per pixel in satellite applications, 1 cm to 10 cm per pixel in unmanned aerial vehicle applications, and 1 mm to a few centimetres per pixel, depending on the sensor used in ground-level applications). The relatively small number of spectral bands limits the ability to capture fine spectral variations, making multispectral imaging more suitable for general assessments of plant properties, such as overall pigment content or broader physiological states. Alterations in reflectance provide an overview of changes in plant properties, for instance, associated with cellular breakdown, reductions in chlorophyll content, and modifications to leaf surface properties during abiotic and biotic stresses [25,26]. Multispectral detection of reflectance is often applied to detect e.g., 1/indices like the Normalised Difference Vegetation Index (NDVI), and simple Ratio Index (SRI), which uses NIR and red (R) bands to detect stress-related changes and general plant health; 2/Plant Senescence Reflectance Index (PSRI) employing additionally green bands (G) and describing plant stress, the onset of senescence, fruit ripening; as well as 3/other indices calculated from more specific bands like Photochemical Reflectance Index (PRI; 531 nm, 570 nm) or Structure Independent Pigment Index (SIPI; 800, 445, 680) [27]. Multispectral imaging’s limited bands allow for faster processing, making it suitable for real-time field-scale monitoring with drones or satellites, but it lacks the specificity required for detailed biochemical analysis.
Hyperspectral imaging, on the other hand, captures data across hundreds of contiguous narrow bands (1–10 nm resolution) spanning SWIR spectra at the 400 and 700 nm region, NIR spectra between 800 and 1000 nm or SWIR spectra between 1000 and 2500 nm [27,28,29]. Hyperspectral imaging, often used in aerial or laboratory conditions, provides high spatial resolution (sub-metre to millimetre scale) and a broader range of continuous spectral bands, thus enabling the detection of finer variations in material properties. This makes hyperspectral imaging more appropriate for detailed analysis of complex biological and chemical compositions, allowing for more accurate quantification and differentiation of specific biochemical constituents within plant tissues. Among others, it is critical for leaf-level pathogen detection. This fine resolution enables the detection e.g., subtle shifts in pigment composition under pathogen infection, including reductions in chlorophyll a and b, accumulation of stress-related pigments such as anthocyanin, as well as changes in water content or cell structural changes caused by pathogens [28]. Narrow-band analysis is also effective for identifying unique spectral signatures associated with specific pathogen interactions, such as the production of pathogen toxins, secondary metabolites, or localised necrotic responses. This capability not only facilitates the early detection of infections but also characterizes the type and extent of biotic stress, providing valuable insights for precision agriculture. However, this increased spectral resolution comes at the cost of greater computational complexity and longer processing times, which can limit its use in time-sensitive or large-scale applications. Hyperspectral imaging, due to its complex data structure, requires advanced computational resources for data interpretation and thus is slower, even if its integration with AI models like deep learning classifiers improves the detection of specific pathogens [29].
These imaging technologies complement each other in precision agriculture. Multispectral imaging excels in broad-scale monitoring, while hyperspectral imaging provides the depth and specificity needed for pathogen-level analysis and early intervention. Both are essential tools for enhancing crop health diagnostics and reducing yield losses in a cost-effective and sustainable manner. The choice between these techniques is often influenced by the trade-off between the level of detail required and the practical considerations of speed, cost, and scale.

3. Spectral Methods in Plant Trait Analysis

Plant infections by pathogens, including cabbage leaves, can significantly alter their physiological and biochemical properties, leading to measurable changes in optical characteristics (Table 2). These changes are evident in the reflectance, absorbance, and transmission spectra, which can be effectively captured using advanced imaging techniques such as multispectral and hyperspectral imaging. By analyzing these spectral responses, researchers gain insights into the progression and severity of pathogen-induced stress, facilitating early detection and improved management strategies.

3.1. Chlorophyll

Chlorophyll, the primary photosynthetic pigment, exists in two main forms: chlorophyll a and b. The detection of chlorophyll content in plants through spectral imaging techniques, such as multispectral and hyperspectral imaging, plays a crucial role in monitoring plant health and assessing physiological status [20,21].
Reflectance at specific wavelengths is the most widely utilised method in spectral imaging for chlorophyll quantification. By analysing the ratios of reflectance across different wavelengths, the total chlorophyll content can be estimated. For total chlorophyll content as well as chlorophyll a, reflectance measurements in the green spectral range (550–560 nm) and the red-edge region (680–750 nm) have consistently demonstrated their utility due to the strong absorption characteristics of these pigments in these regions [34]. Multispectral imaging employs a limited number of broad spectral bands, which enables a general assessment of chlorophyll content. Commonly analysed regions include the green band (approximately 550 nm) and the red band (approximately 680 nm), where chlorophyll exhibits strong light absorption. This approach provides estimates of total chlorophyll but offers limited capacity to distinguish between chlorophyll a and b due to overlapping absorption spectra. Hyperspectral imaging allows hyperspectral imaging to distinguish between the two chlorophyll types and accurately measure their concentrations. The detection of subtle variations in the absorption spectra, primarily in the blue (430–450 nm) and red-edge (680–700 nm) regions, enables the precise quantification of chlorophyll a, while chlorophyll b requires a broader spectral range, including the red (630–650 nm), red-edge (670–700 nm), and NIR (800–810 nm) regions. This spectral reliance underscores the complexity of light absorption dynamics by chlorophyll b and its interaction with other pigments. Based on the different hyperspectral data, indices can be calculated to predict the total chlorophyll content. In cucumber leaves, particularly useful were wavelength 430, 550, 680, 695, 705, 708, 710, 750, 760, 780, 800, 860 nm to calculate indices such as R710/R760, (R780R710)/(R780R680), (R750R705)/(R750 + R705), (R680R430)/(R680 + R430), R860/(R550 × R708), (R695R705)−1 − (R750R800)−1 [40]. An alternative way to assess the flavonoid content using the hyperspectral reflectance record was proposed based on the correlation with reflectance at 700 and 760 nm, providing a background for the parameter Flavonoid Absorption Vegetation Index (FLAVI700,760) [30].
In addition, hyperspectral imaging facilitates the creation of scale-independent protocols for pigment quantification. Studies have demonstrated that optimal wavelengths for total chlorophyll detection at the leaf level are also effective at canopy and landscape scales, highlighting their potential for ecological monitoring and large-scale precision agriculture.

3.2. Flavonoids

Flavonoids play a vital role in plants by acting as antioxidants, protecting from environmental stresses. They are crucial in oxidative stress caused by reactive oxygen species [76], acting as signalling molecules, physical or chemical barriers to pathogens, modulating the biosynthesis of protective metabolites, and inducing defence-related genes [77].
Hyperspectral imaging across UV light (200–380 nm), VIS (400–700 nm), and red-edge bands (680–800 nm) offers precise methods for detecting flavonoids in plant cells in the context of plant biotic stress or defence responses. Spectral signatures in the UV range were used for the detection of early plant-pathogen interactions and secondary plant metabolites in the study of three different barley lines inoculated with Blumeria graminis f.sp. hordei [78]. Wavelengths within the SWIR range are commonly associated with the distribution of flavonoids [37]. Hyperspectral signatures were characterised by a high reflectance value at 253 nm, beyond which the reflectance decreased to 420 nm or 500 nm for leaves of sugar beet with symptoms of the disease Cercospora leaf spot and brown rust, respectively. Healthy leaves had 0.4% reflectance at 253 nm and 0.09% reflectance at 500 nm [38]. A method for simultaneously evaluating various pigments, including chlorophylls, carotenoids, anthocyanin, and flavonoids, was developed for six agronomic crops: corn, sugarcane, coffee, canola, wheat, and tobacco. The method linked wavelengths within the SWIR range, i.e., 555 nm and 660 nm, with NIR wavelengths, including 710 nm, 940 nm, 1080 nm, 1190 nm, 1470 nm, 1850 nm, and 2245 nm [37]. Similarly, the total chlorophyll, phenolic, flavonoids, glucosinolates, and anthocyanin were evaluated simultaneously in Brassica juncea cells, with the bands for flavonoids at 692.69 nm, followed by 608.64 nm [40]. Hyperspectral imaging was also used to determine the total flavonoids in Chrysanthemum morifolium at 1119 nm and 1311 nm and valleys at 1210 nm and 1487 nm [39].

3.3. Anthocyanin

Anthocyanin is a water-soluble pigment that gives red, purple, and blue colours in plants and plays an essential role in plant-environment interactions, including photoprotection, antioxidation (scavenging), and signalling [79,80]. Anthocyanin enhances resistance against pathogens and pests and acts as a visual signal to herbivores, indicating unpalatability or toxicity [81].
Hyperspectral imaging can help detect anthocyanin in plant calls by analysing reflectance patterns across various wavelengths, e.g., 1/in VIS spectrum with the absorption in the green (500–550 nm) and reflectance in the red (600–700 nm) regions, making these wavelengths critical for detection; 2/in NIR (700–900 nm), with reflectance data helping differentiate anthocyanin accumulation from other pigments in plant tissues. Depending on the plant and developmental stage, the wavelength positions can be concentrated at 519–520 nm [41], 703–835 nm (704, 709, 711–713, 729, 754–755, 759, 761, 801, 837, and 892 nm) as well as 924, 957, 963–1046 nm [40,42]. The spectral reflection value in the range of 500 to 700 nm is very low due to the maximum absorbance of anthocyanin pigments being about 535 nm. The spectral reflectance lowers further with the increase of anthocyanin content and the decrease shifts to the range of 590–800 nm [82]. Based on anthocyanin reflectance in the VIS spectrum, some Indexes 1 can be calculated. Increases in Anthocyanin Reflectance Index 1 (ARI1 = (1/ρ550) − (1/ρ700)) indicate canopy changes in foliage via new growth or death, while using additional band 800 in ARI2 (ARI2 = ρ800 * [(1/ρ550) − (1/ρ700)]) higher concentrations of anthocyanin in vegetation can be detected [83].

3.4. Carotenoids

Carotenoids are yellow, orange, and red plant cell pigments that serve multiple essential roles in plant physiology and ecology as they protect photosynthetic tissues by quenching reactive oxygen species, excess excitation energy, and photooxidative damage [21,84]. They are biosynthetic precursors for key phytohormones, including abscisic acid and strigolactones, which regulate development and stress responses [85].
Hyperspectral imaging is used to differentiate carotenoids from other pigments, enabling their precise quantification and mapping. Carotenoids strongly absorb light in the VIS spectrum, especially blue light (400–500 nm). Estimating the state of leaf carotenoids directly from their absorption peak at 470 nm is challenging due to the overlap between chlorophyll and carotenoid absorption peaks and the generally higher chlorophyll concentration in most leaves [34]. Therefore, reflectance in red-edge and NIR (700–850 nm) aids in distinguishing carotenoids from overlapping chlorophyll. In this case, the Carotenoid Reflectance Index focuses on wavelengths like 510 and 550 nm (CRI1 = (1/ρ510) − (1/ρ550)), which indicates greater carotenoid concentration relative to chlorophyll; on the other hand, 510 and 700 nm (CRI2 = (1/ρ510) − (1/ρ700) provide better results in areas of high carotenoid concentration [46]. Guan et al. [47] demonstrated that reflectance ratios like R680/R825 are effective for carotenoid estimation in rice leaves, and Huang et al. [34] showed the importance of wavelengths between 500 and 580 nm for accurate carotenoid detection in plant leaves.

3.5. Xanthophyll

The xanthophyll cycle is critical for protecting the photosynthetic apparatus from oxidative stress, and xanthophyll detection provides valuable insights into plant health and stress responses. Spectral imaging effectively detects xanthophyll in plants, utilising key wavelengths in the VIS range (500–570 nm) and indices like the Photochemical Reflectance Index (PRI = (ρ531 − ρ570)/(ρ531 + ρ570)) for assessing photoprotection and stress responses [48]. PRI has been suggested to closely correlate with the epoxidation state of the xanthophyll cycle; however, its applications are largely restricted [49]. In contrast, a newly identified differential index, which utilizes reflectance derivatives at 677 and 803 nm, demonstrated significantly better performance [49].

3.6. NPK

Hyperspectral imaging has emerged as a critical tool for the early detection of nitrogen (N), phosphorus (P), and potassium (K) deficiencies in agricultural and industrial crops.
Key wavelengths for effective nutrient deficiency detection spanned the VIS range, underscoring the early changes in leaf pigment levels (chlorophyll, carotenoids, and anthocyanins) before any visible symptom development [50]. For example, change detection at 467, 557, 665, 686, 706, 752, 874, 879, 886, 900, 978, and 995 nm were used for the successive projections algorithm as optimal for nitrogen prediction [51]. In the red-edge region, wavelengths are sensitive to chlorophyll and nitrogen content, as demonstrated in crops such as wheat and pepper [86]. In other studies, the selected important wavelengths of leaves were mainly scattered in three regions, i.e., in the VIS region at 648–650 nm, NIR at 790 nm, and 970 nm [52]. The spectral reflectance of soybean leaves was positively correlated with leaf nitrogen content in the spectral range of 450~494 nm and 755–1000 nm, while the spectral reflectance of soybean leaves was negatively correlated with leaf nitrogen content in the spectral range of 495–754 nm [53].

3.7. Water (Leaf Moisture)

Changes in water content are critical indicators of plant health and stress conditions. Water-deficit stress encompasses the physiological responses of plants triggered by insufficient water availability, leading to dehydration. It is one of the most significant abiotic stress factors and is often exacerbated by pathogen infections, severely constraining plant growth, crop yield, and quality, thereby posing a substantial challenge to global food production.
Since water exhibits strong absorption in NIR and SWIR regions, the optical properties of leaves are expected to correlate closely with their relative water content [55]. A regression model for assessing water content using spectral methods identified the wavelengths 1410 nm and 1520 nm, as well as 1300 nm and 1310 nm, as the most effective for describing the relationship between hyperspectral reflectance and leaf water status [63]. Noticeable differences between leaves with varying relative water content were observed in the 1300–1500 nm range. Characteristic water-related absorption bands identified particular differences at 1480 nm. The water molecule absorption peak, located in this region, is attributed to the stretching and variable angle vibrations of the hydroxide radical (•OH) [56]. Water-related absorption bands usually include 975 nm and 1200 nm [56,57]. Various indices were evaluated, utilising the 1129 nm and 1459 nm bands, such as SRC (1459 nm/1129 nm) and WC (1459 nm − 1129 nm)/1129 nm), demonstrating satisfactory contrast between leaves. Further analysis revealed that images captured within the 1500–1590 nm range, which were divided by those recorded in the 1390–1430 nm range, provide excellent contrast for distinguishing leaves based on relative water content. For example, a 1529/1416 nm image effectively highlighted differences between leaves, while 1529/1416 nm images of leaves with similar moisture levels showed minimal contrast, resulting in a nearly mono-modal histogram distribution. At the same time, absorption at 819 nm is weakly affected by changes in water content, making this band suitable for use as a reference [57]. In time-series hyperspectral imaging (TS-HSI) for assessing water content in tea leaves, the most critical wavelengths identified were 542 nm, 709 nm, 752 nm, and 971 nm [58]. Furthermore, 13 sensitive wavelengths for detecting water content in leaves were identified using the Competitive Adaptive Reweighted Sampling (CARS) algorithm. These wavelengths included 976.4 nm, 1037.7 nm, 1044.5 nm, 1061.4 nm, 1108.7 nm, 1139.0 nm, 1357.8 nm, 1380.7 nm, 1397.0 nm, 1432.8 nm, 1452.3 nm, 1513.6 nm, and 1520.0 nm [59]. Hyperspectral imaging was also used to detect changes in leaf water content caused by infection. The study showed that infection of apple trees with Venturia inaequalis increased plant cuticle transpiration, causing localised water content changes and green bands, and NIR regions were critical for identifying water deficits [60]. Despite reflectance, also transmission data were used to analyse pathogen-induced water content changes in barley leaves infected with Blumeria graminis. Transmission data in the 580–650 nm range were critical for identifying water content changes [24].

3.8. Polyphenols

Phenols play a crucial role in plant defence mechanisms, participating in signalling pathways to trigger the production of defence-related compounds, acting as antioxidants, and mitigating various abiotic (heat, drought, cold, salt or heavy metal) and biotic (bacterial, fungal, viral, insect or weed) stresses [87]. These compounds are antimicrobial agents that inhibit the growth of pathogens through their toxicity. Plant phenols can even be used as biological pesticides to replace chemical pesticides [88]. Additionally, phenols contribute to the reinforcement of plant cell walls by cross-linking with proteins, creating physical barriers against pathogen entry [89].
For phenolic prediction, hyperspectral image data was acquired across VIS and NIR (355–900 nm) and partially SWIR (900–1700 nm) spectral ranges [64]. The wavelengths associated with phenolic compounds were identified in Brassica juncea by hyperspectral imaging and advanced machine learning models, including Partial Least Squares Regression (PLSR), Adaptive Boosting (AdaBoost), Extreme Gradient Boosting (XGBoost), and Light Gradient Boosting Machine (LightGBM). The selected spectral features were distributed in the ranges of 488.57–544.61 nm and 672.68–992.87 nm, indicating their relevance in detecting phenolic metabolites. The key wavelengths with the highest feature importance were also identified as 904.82 nm and 760.73 nm [40].
Considering a strong absorbance of the phenolic group in the UV and blue zone up to 420 nm, this led to attempts to use the wavelengths sensitive (λ < 420 nm) and insensitive (λ > 420 nm) to the presence of UV-absorbing compounds to produce phenols (including flavonoid) reflectance indices, based on the R410,460 wavelengths. Similar trends were observed in the flavonoid parameter based on NIR spectral bands (700, 760 nm), which showed a high correlation with chlorogenic acid [30]. On the other hand, the selected spectral bands sensitive to the prediction of total polyphenol content in tomato seedlings included very specific indications. These comprised blue (430.2 nm and 490.0 nm), green (509.6 nm and 519.5 nm), red (601.1 nm, 610.1 nm, 620.1 nm), red edge (660.3 nm, 670.4 nm, 679.3 nm, 719.8 nm, 730.0 nm), NIR bands below 900 nm (750.4 nm, 759.4 nm. 779.8 nm, and 790.1 nm, 791.4 nm, 879.4 nm), and NIR bands over 900 nm (909.4 nm, 930.3 nm, 939.5 nm, 969.8, nm, 980.3 nm, 989.6 nm, 1000.2 nm, and 1002.8 nm) [65].

3.9. Mycotoxins Produced by Pathogens

The detection of crop diseases can be based on changes within the plant’s biochemical and physiological changes, the production of specific mycotoxins by pathogens, or interactions between these two factors [90,91]. However, it is difficult to attribute plant diseases to a single toxic factor, as the development and progression of disease are often the result of complex interactions between multiple elements [26,92]. Furthermore, certain pathogens may induce different biochemical responses in plants depending on the host’s susceptibility, the pathogen’s strain, and the stage of infection. Consequently, the identification and monitoring of disease-specific biochemical markers is usually through more common diagnostic indices. While hyperspectral imaging has shown potential for plant disease detection, studies focusing on the monitoring of specific toxins produced by pathogens remain relatively rare. This highlights a significant gap in research, underscoring the need for hyperspectral studies that are specifically designed to detect and monitor these toxins, which could improve the precision and specificity of disease diagnostics.
Detection of black spot disease on kimchi cabbage using hyperspectral imaging and machine learning techniques defined regions of interest (ROIs) for spectral imaging based on plant symptoms, healthy tissue, and background characteristics. A differentiation between these categories was found in both NIR and VIS bands. Healthy leaves generally exhibited higher NIR reflectance compared to infected areas. Conversely, NIR reflectance in infected regions decreased due to impaired cellular function. Mature symptoms, characterised by their colour, reflect less light than early symptoms or healthy tissue, resulting in a darker (black-brown) colour due to increased light absorption. In contrast, early symptoms reflect slightly higher levels of green and red wavelengths, giving a yellowish appearance. The highest changes occurred at 928 nm (NIR band), 444 nm (blue visible region), and 686 nm (red visible region) [93]. Further, the red-edge band provides critical information for powdery mildew disease in wheat before any physical symptoms appear. Although it is not an exact signature of the disease, it indicates disease presence related to a lack of chlorophyll, a lack of nutrition, leaf texture, and shape [67].
The average spectra differed for healthy plants and plant infected with Alternaria solani primarily included three key spectral regions: 1/the green region, where the production of stress-related pigments, such as anthocyanin and carotenoids, led to increased absorption compared to non-infected plants; 2/the chlorophyll a absorption region, where slightly lower absorption was observed due to the breakdown of chlorophyll a following infection; and 3/the reduced reflectance in NIR region, which attributed to the destruction of cell structure, as NIR light is known to interact with cell walls and air pockets, particularly in the spongy mesophyll. Consequently, the three wavelengths with the highest contrast were detected as 550 nm, 680 nm, and 750 nm. Among them, the reflectance at 750 nm exhibited the highest difference between healthy leaves and darker Alternaria lesions, providing the clearest indication for selecting and delineating the infected areas. Additionally, a spectral change (ratio) analysis revealed that wavelengths 505 nm, 510 nm, 640 nm, 665 nm, 690 nm, 750 nm, and 935 nm exhibited the largest variations during early blight infection [68]. Furthermore, in detecting early blight (A. solani) on tomato leaves, the most important wavelengths were identified as 442, 508, 573, 696, and 715 nm [58]. Furthermore, the spectral responses of Brassica napus to various Alternaria species, identifying the SWIR region, particularly the water absorption bands at 1470 nm and 1900 nm, as the most effective for distinguishing between uninfected and infected plant tissues. These spectral regions enabled clear separation between healthy and diseased areas, with the water absorption features serving as a sensitive indicator of physiological changes associated with infection. The observed spectral differences are likely attributed to alterations in tissue structure and moisture content induced by fungal colonisation, thus emphasizing the utility of the SWIR range for early and accurate detection of plant diseases [69].
Similarly, grey mould disease caused by the fungus B. cinerea was detected using two optimal (with high contrast) spectral bands from continuous hyperspectral imagery (450–800 nm), i.e., located at 540 and 670 nm [70,71].
Furthermore, hyperspectral imaging has been utilised for the classification of soft rot disease in napa cabbage (Brassica rapa subsp. pekinensis), with key wavelengths—970 nm, 978 nm, 980 nm, 1070 nm, 1120 nm, and 1180 nm—identified as the most effective for distinguishing diseased plants from healthy specimens. These spectral bands correspond to distinct absorption features that reflect modifications in tissue composition and structure [66].
Examples of single-toxin detection using hyperspectral imaging include attempts to determine deoxynivalenol levels in bulk wheat kernels. To predict the concentration of the mycotoxin deoxynivalenol (DON) in wheat kernels infected with Fusarium head blight (FHB), specific wavelengths critical for DON detection were applied within the ranges of 406–407 nm, 435–437 nm, 489 nm, 519–567 nm, 636–674 nm, 744–780 nm, 823–878 nm, and 901–999 nm [72]. Another example is the detection of aflatoxin B1 on inoculated maize kernel surfaces using VIS and NIR hyperspectral imaging. Significant differences in absorption between maize kernels were observed at wavelengths 670.2 nm, 735.2 nm, 873.7 nm, 918.3 nm, 913.3 nm, 977.2 nm, and 985.8 nm. However, these wavelengths were associated rather with kernel colour and nutrient-related substances such as protein, starch, oil, and cellulose, with no direct identification of individual toxin substances. For example, absorption at 670 nm was attributed to the chlorophyll absorption peak due to residual pigments in the seed coat. A wavelength of 873.7 nm was linked to the N–H of protein, 918.3 nm to the C–H starch (or cellulose), 913.3 nm to CH2 in fatty acids, and 977.2 nm and 985.8 nm to the O–H of water [73].

3.10. Sugars

Sugars play a critical role in plant cells as essential energy sources derived from photosynthesis and key components in various metabolic processes. They are used in cellular respiration to produce adenosine triphosphate (ATP), structural components like cellulose, and storage carbohydrates such as starch. Sugars act as signalling molecules, which regulate plant responses to environmental stress stimuli and play a vital role in plant acclimatisation [94].
The NIR and SWIR regions are associated with vibrational and overtone combinations of fundamental O–H, C–H, and N–H bonds, key structural elements of organic molecules. Analysis of sugar content by hyperspectral imaging revealed that the reflection sharply decreased between the wavelengths of 1115 and 1150 nm, reaching an absorption peak at 1254 nm. The primary absorption peaks were identified at 1052, 1254, and 1381 nm, linked to the presence of carbohydrates, starch, cellulose, and related substances. The second derivative absorbance spectra exhibited peaks around 972 and 1450 nm corresponding to sugars (C–H and O–H) [56]. In a study on strawberries, the reflectance values at 1077 and 1940 nm were used for the visualisation of sugar content distribution [95]. The feature importance for glucosinolate prediction was concentrated in the range of 870–900 nm. The highest importance values were, in order, 872.80, 896.81, 880.8, and 628.66 nm among 28 bands selected based on the Adaptive Boosting (AdaBoost) algorithm with Standard Normal Variate (SNV) processing data [40].

3.11. Lignin/Cellulose/Proteins

Lignin, cellulose, and proteins are essential components of cell structures, including cell walls and membranes, providing structural support, mechanical strength, and resistance to environmental stress. Lignin, a complex phenolic polymer, enhances rigidity and water permeability. Cellulose forms strong fibrils crucial for cell wall integrity. In the context of pathogen infection, lignin and cellulose play a pivotal role by forming a physical and biochemical barrier that limits pathogen spread and enhances plant defence mechanisms. Lignin deposition is critical in plant innate immunity, while lignification is a direct defence response [96].
The NIR hyperspectral characteristics of cellulose, lignin, pectin, and hemicellulose can be effectively analysed within the range of 800–1300 nm. To differentiate water absorption from structural components, the specific absorption wavelengths can be selected for water at 970, 1200, and 1450 nm versus 1170 nm and 1410 nm for fibre components such as lignin. To determine total polysaccharides together with flavonoids content wavelength range at 1119 nm and 1311 nm, and valleys around 1210 nm and 1487 nm were applied [39]. In contrast, wavelengths associated with the structural water content of proteins and conjugated water within intrinsic structures, such as vacuoles, other organelles, and cellulose-lignin cell walls, are observed in the SWIR region within the ranges of 1600–1800 nm and 2100–2300 nm. Lignin, cellulose, and proteins collectively account for approximately 40% of the total leaf absorption in these spectral regions. Additionally, some spectral subsets were proposed to specifically characterise the wavelengths associated with protein, cellulose, and lignin content, i.e., 1/for fresh leaves 1600–1800 nm, 2100–2300 nm; 2/for dry leaves 2100–2300 nm; 3/individually for proteins 1020, 1510, 2130, 2180, 2300 nm (N-H bend), 1730, 2240 nm (C-H bend), 1980, 2060 nm (N=H bend); 4/individually for cellulose + lignin 1120, 1420, 1780, 2270, 2280, 2340 nm (C-H), 1200, 1450, 1490, 1540, 1820 nm (O-H), 2100 nm (O=H) [75,97]. In contrast, fruits are composed of approximately 80% moisture, and most of the moisture absorption bands appear strongly between 960 and 990 nm, which are caused by O-H overtones [31].

4. Hyperspectral Research for Cabbage

The analysis of studies employing hyperspectral imaging to investigate cabbage under various research objectives (Scopus database, 12 January 2025, search query: TITLE-ABS-KEY ‘cabbage’ AND TITLE-ABS-KEY ‘hyperspectral imaging’) revealed a limited number of publications (i.e., 24 publications). The analysis highlights the applications of this method in assessing yield quality and quantity, evaluating responses to abiotic stress, and managing biotic stress. The categories are summarised in Table 3, providing a scientific overview of the methodologies, spectral ranges, and study outcomes.
Research on yield quantity and quality demonstrates the versatility of hyperspectral imaging as a non-destructive tool for evaluating various crop attributes. Studies have highlighted its applications in post-harvest quality assessment, such as freshness evaluation and food safety, including pesticide residue detection in cabbage [41]. Hyperspectral imaging has also proven effective in analysing crop physiology and morphology [103], spatial crop classification in the field [100], and differentiation of varieties based on seed [104]. Moreover, it has been used for biomass and yield estimation [102]. Collectively, these studies underscore the potential of hyperspectral imaging to enhance precision agriculture and crop management through advanced spectral analysis.
Research on abiotic stress highlights hyperspectral imaging as a powerful tool for assessing environmental impacts on cabbage. Fertilisation with nitrogen and wastewater, as well as nitrogen content in cabbage, were quantified in the context of plant responses, supporting precision nutrient management [105,106,107]. Drought tolerance, salinity effects, and chilling injury were also successfully analysed in cabbage [108,109,110,111]. Additionally, the effects of treatment on cabbage physiology were assessed [112], underscoring hyperspectral imaging’s potential in precision agriculture and environmental stress management.
Figure 1 illustrates the relative importance of hyperspectral bands in cabbage-related studies (Table 3) and the role of specific spectral regions in addressing both scientific and practical challenges.
Bands associated with chlorophyll content and its degradation (650–500, 680–750 nm) are the most frequent indices in the literature. These bands are critical for assessing photosynthetic activity and detecting changes in plant health due to environmental or biological factors. Studies on nitrogen content, drought stress, and crop yield estimation commonly utilise this range. Chlorophyll content often serves as a physiological marker, with reductions in chlorophyll a and b caused by pathogen infection. The 600–750 nm range, capturing changes in pigments and water content, plays a pivotal role in early disease detection. Diseases like Alternaria dark spot and clubroot often result in measurable changes within these bands. The ability to identify early symptoms allows for timely interventions, minimizing crop losses and improving disease management strategies. The 800–900 nm range is particularly significant for monitoring water content in plant tissues in the context of agricultural plant yield. This region is widely applied in studies targeting abiotic stress, such as drought or salinity, and biotic stress, including pest infestations. By providing insights into crop health and stress levels, these bands enable precise agricultural practices, enhancing yield stability and sustainability. Bands within the 900–1000 nm range are critical for identifying chemical compounds, such as plant phenols or pathogen toxins, that influence crop quality. Despite their importance, these bands are underutilised in cabbage research. Increasing their application could enhance capabilities for detecting subtle biochemical changes, such as pesticide residues or mycotoxin contamination, further improving food safety and quality control.
The ARI analysis underscores the need for a more targeted application of specific spectral regions in cabbage research. Future studies should aim to integrate these bands into disease diagnostics and stress detection protocols, expanding the scope of hyperspectral imaging in precision agriculture. Furthermore, increasing focus on the 400–1000 nm range for agricultural stress monitoring could provide deeper insights into crop-water relations and their impact on yield.

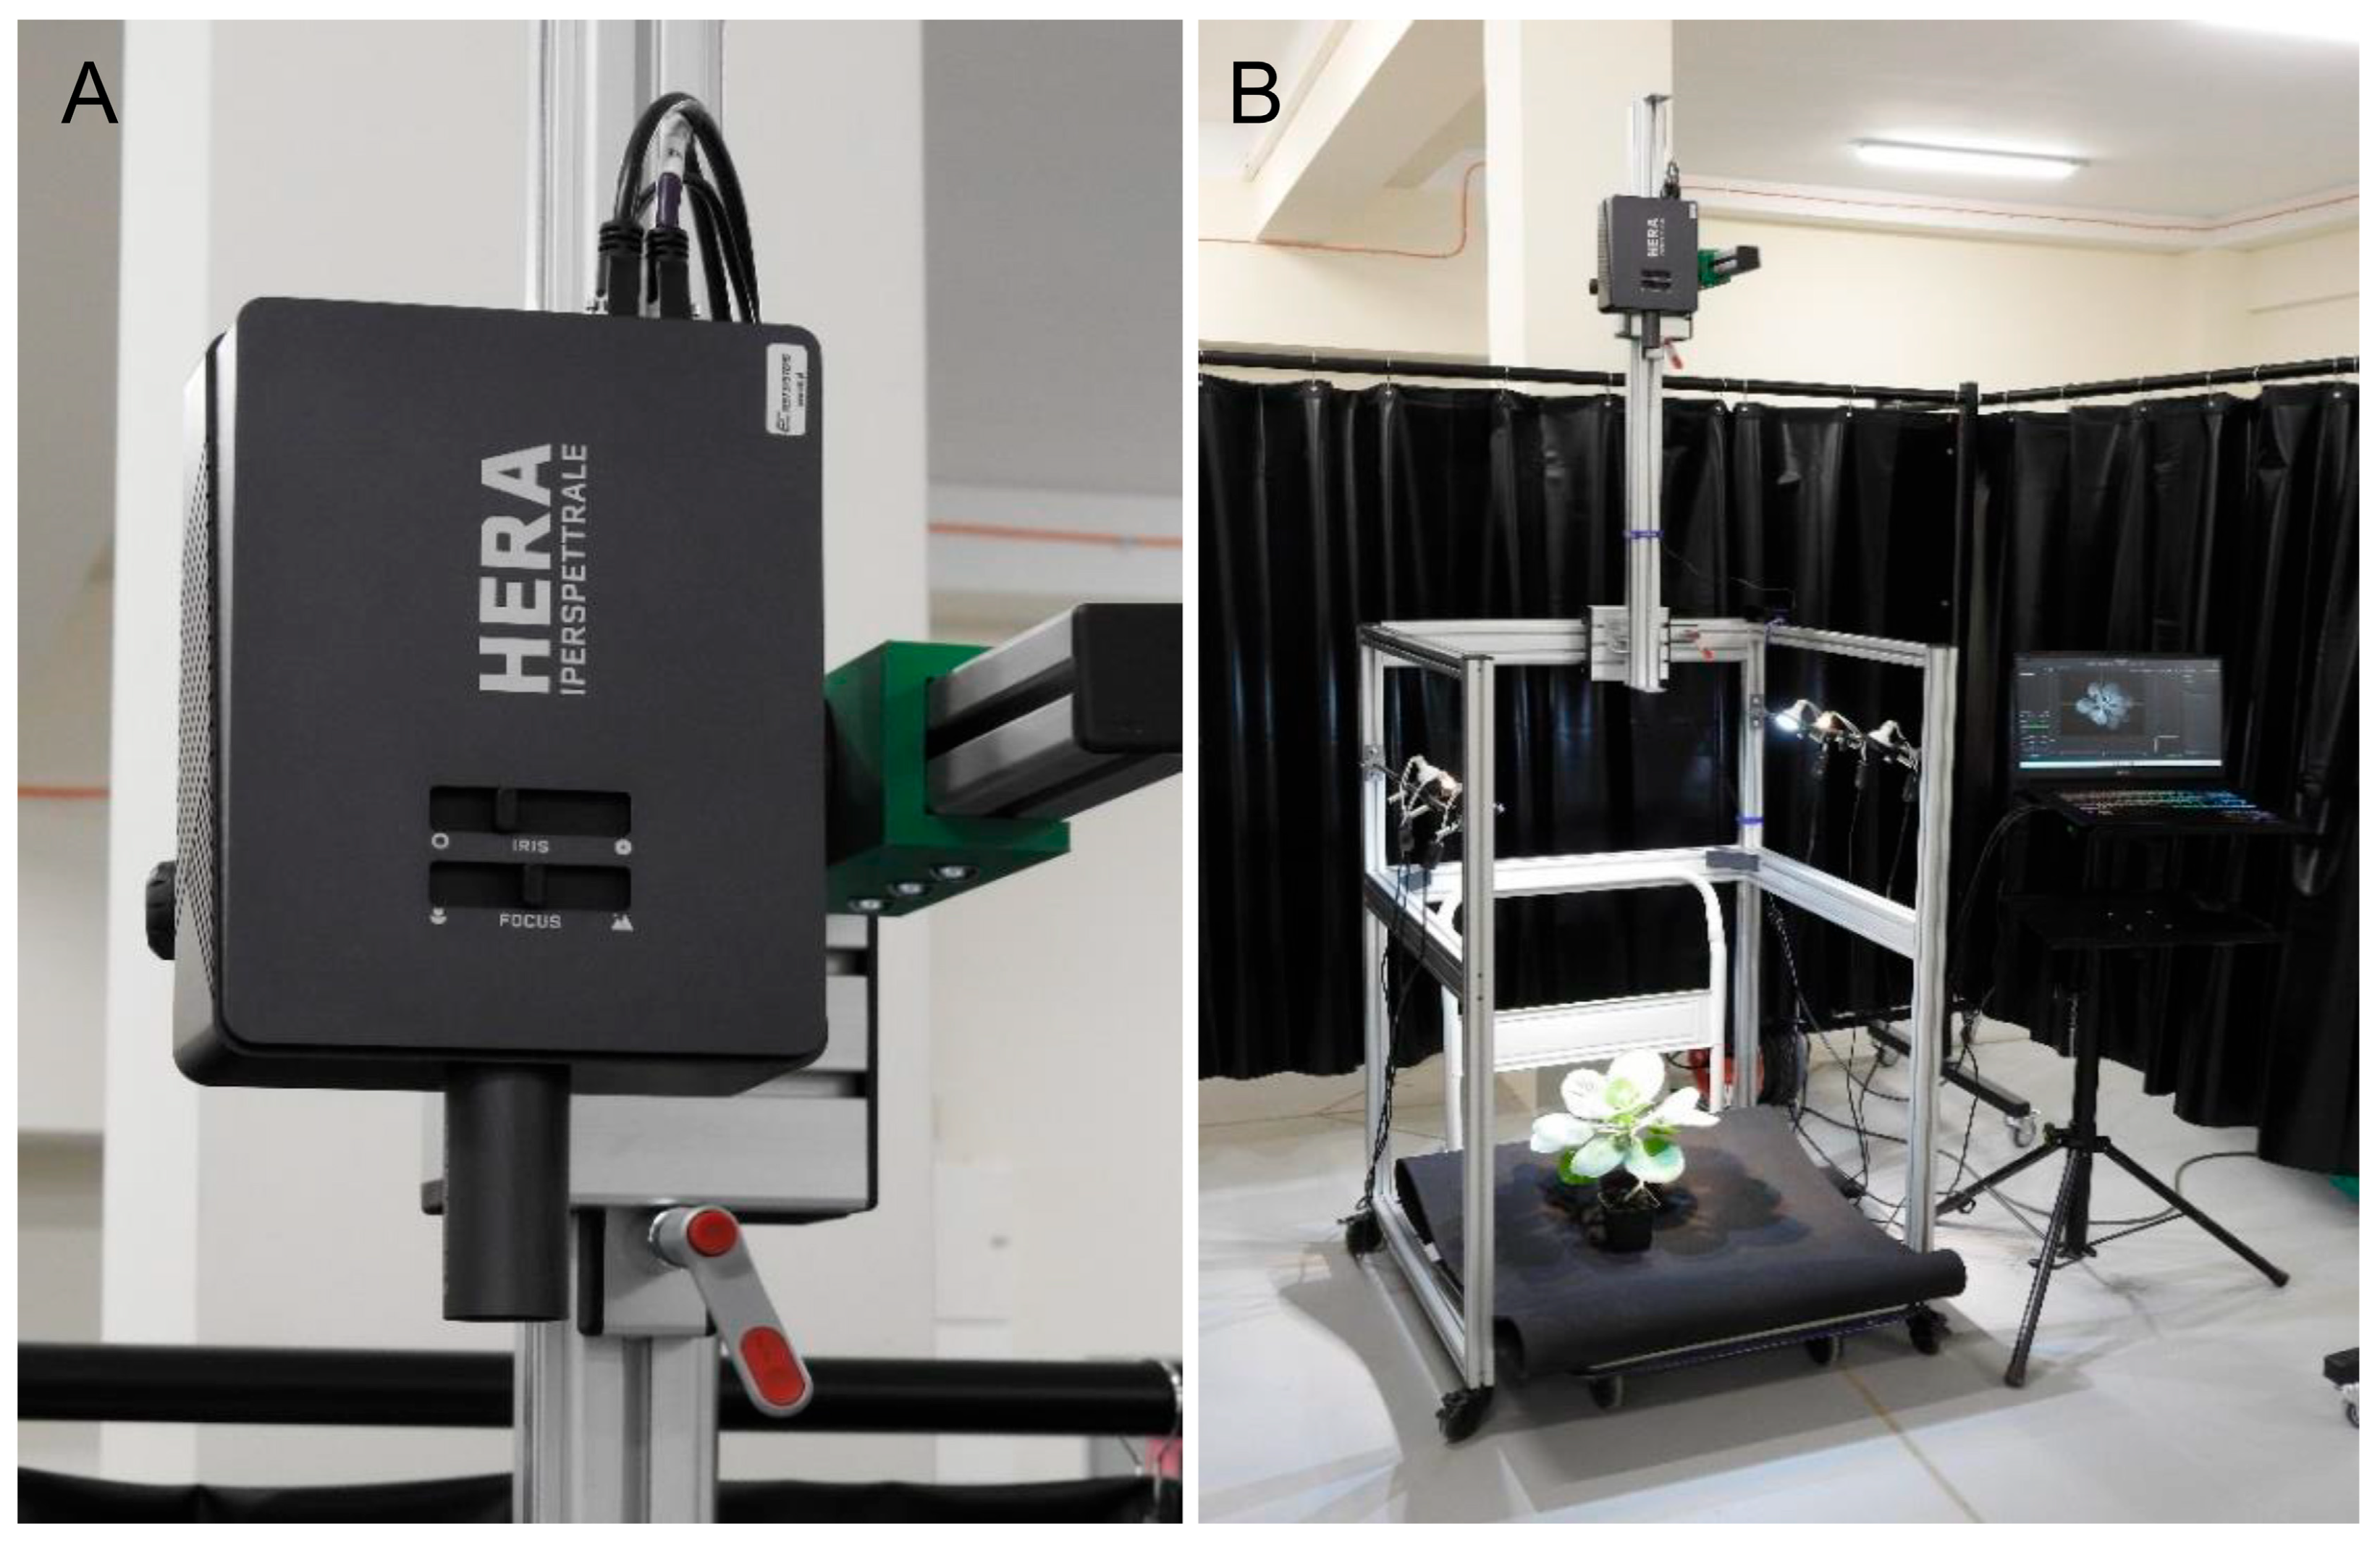
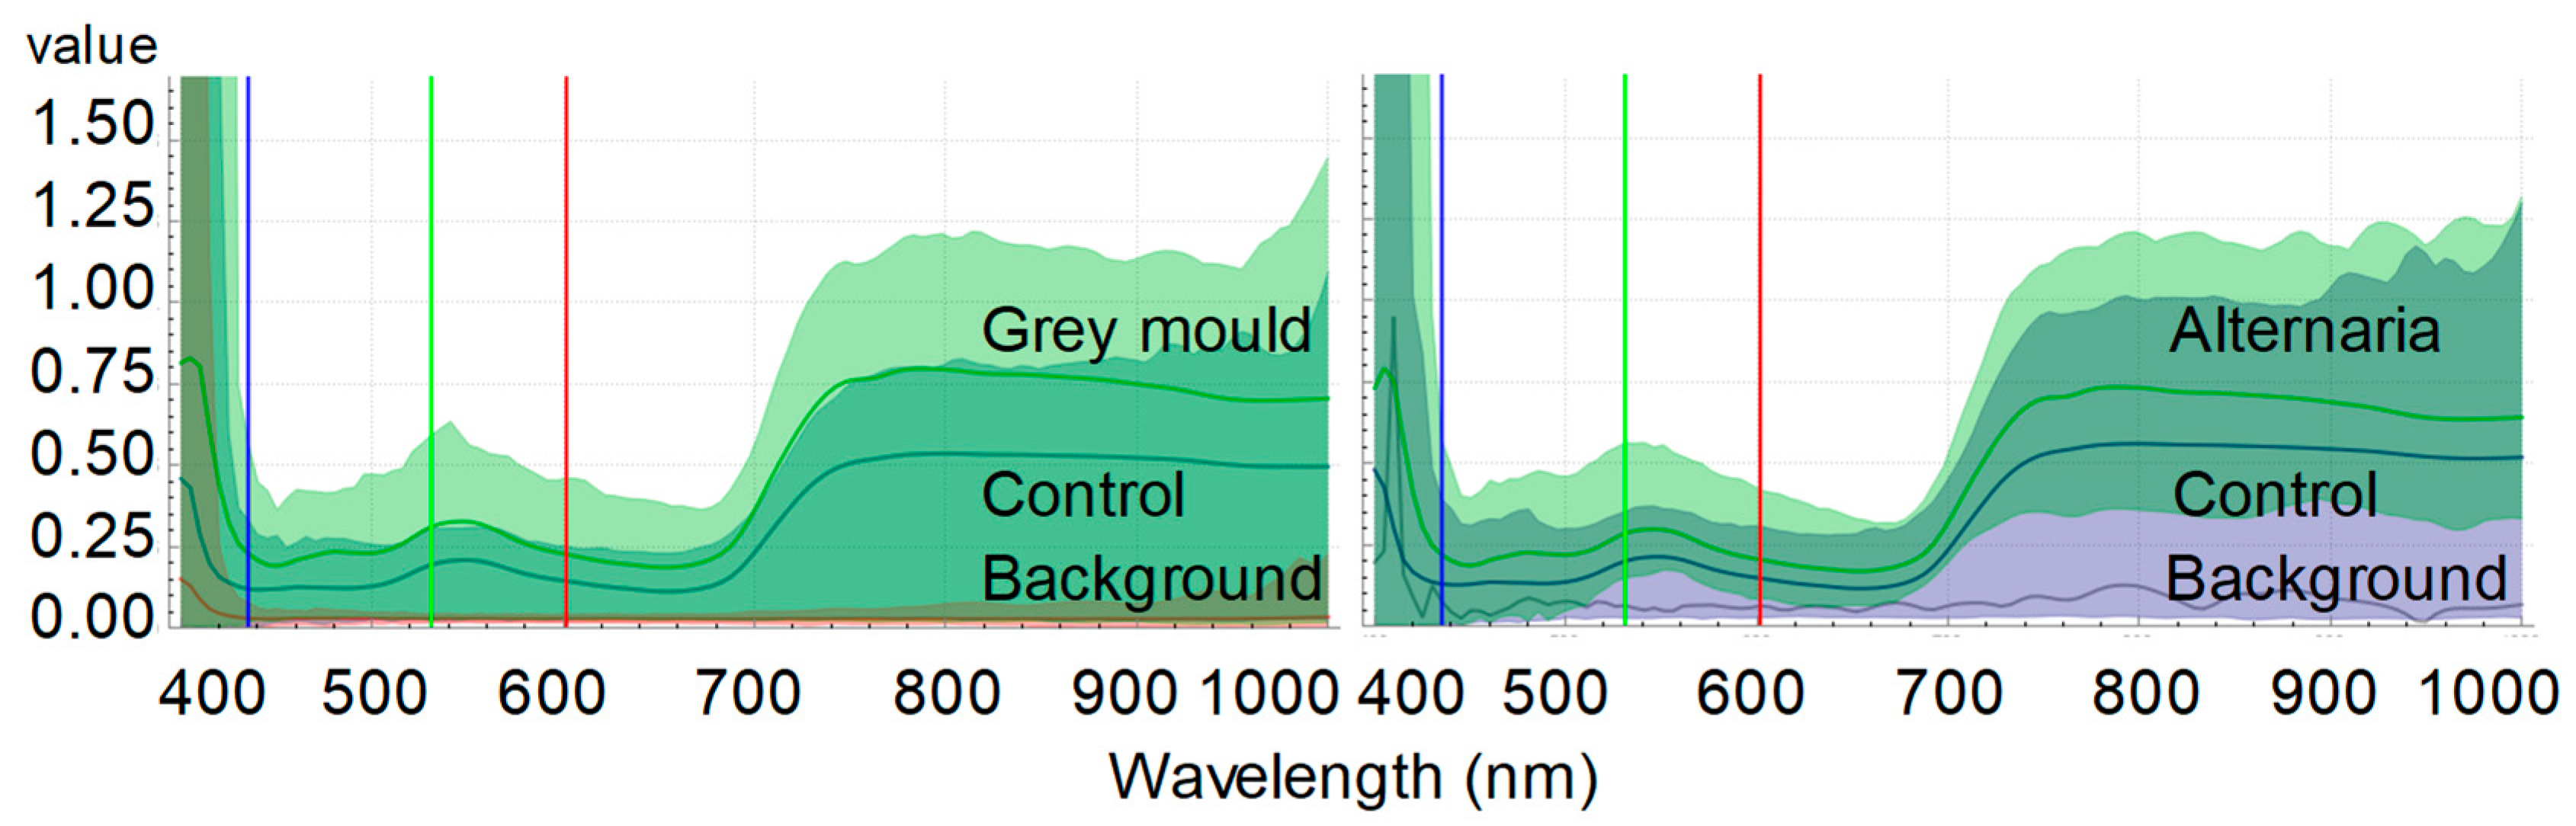
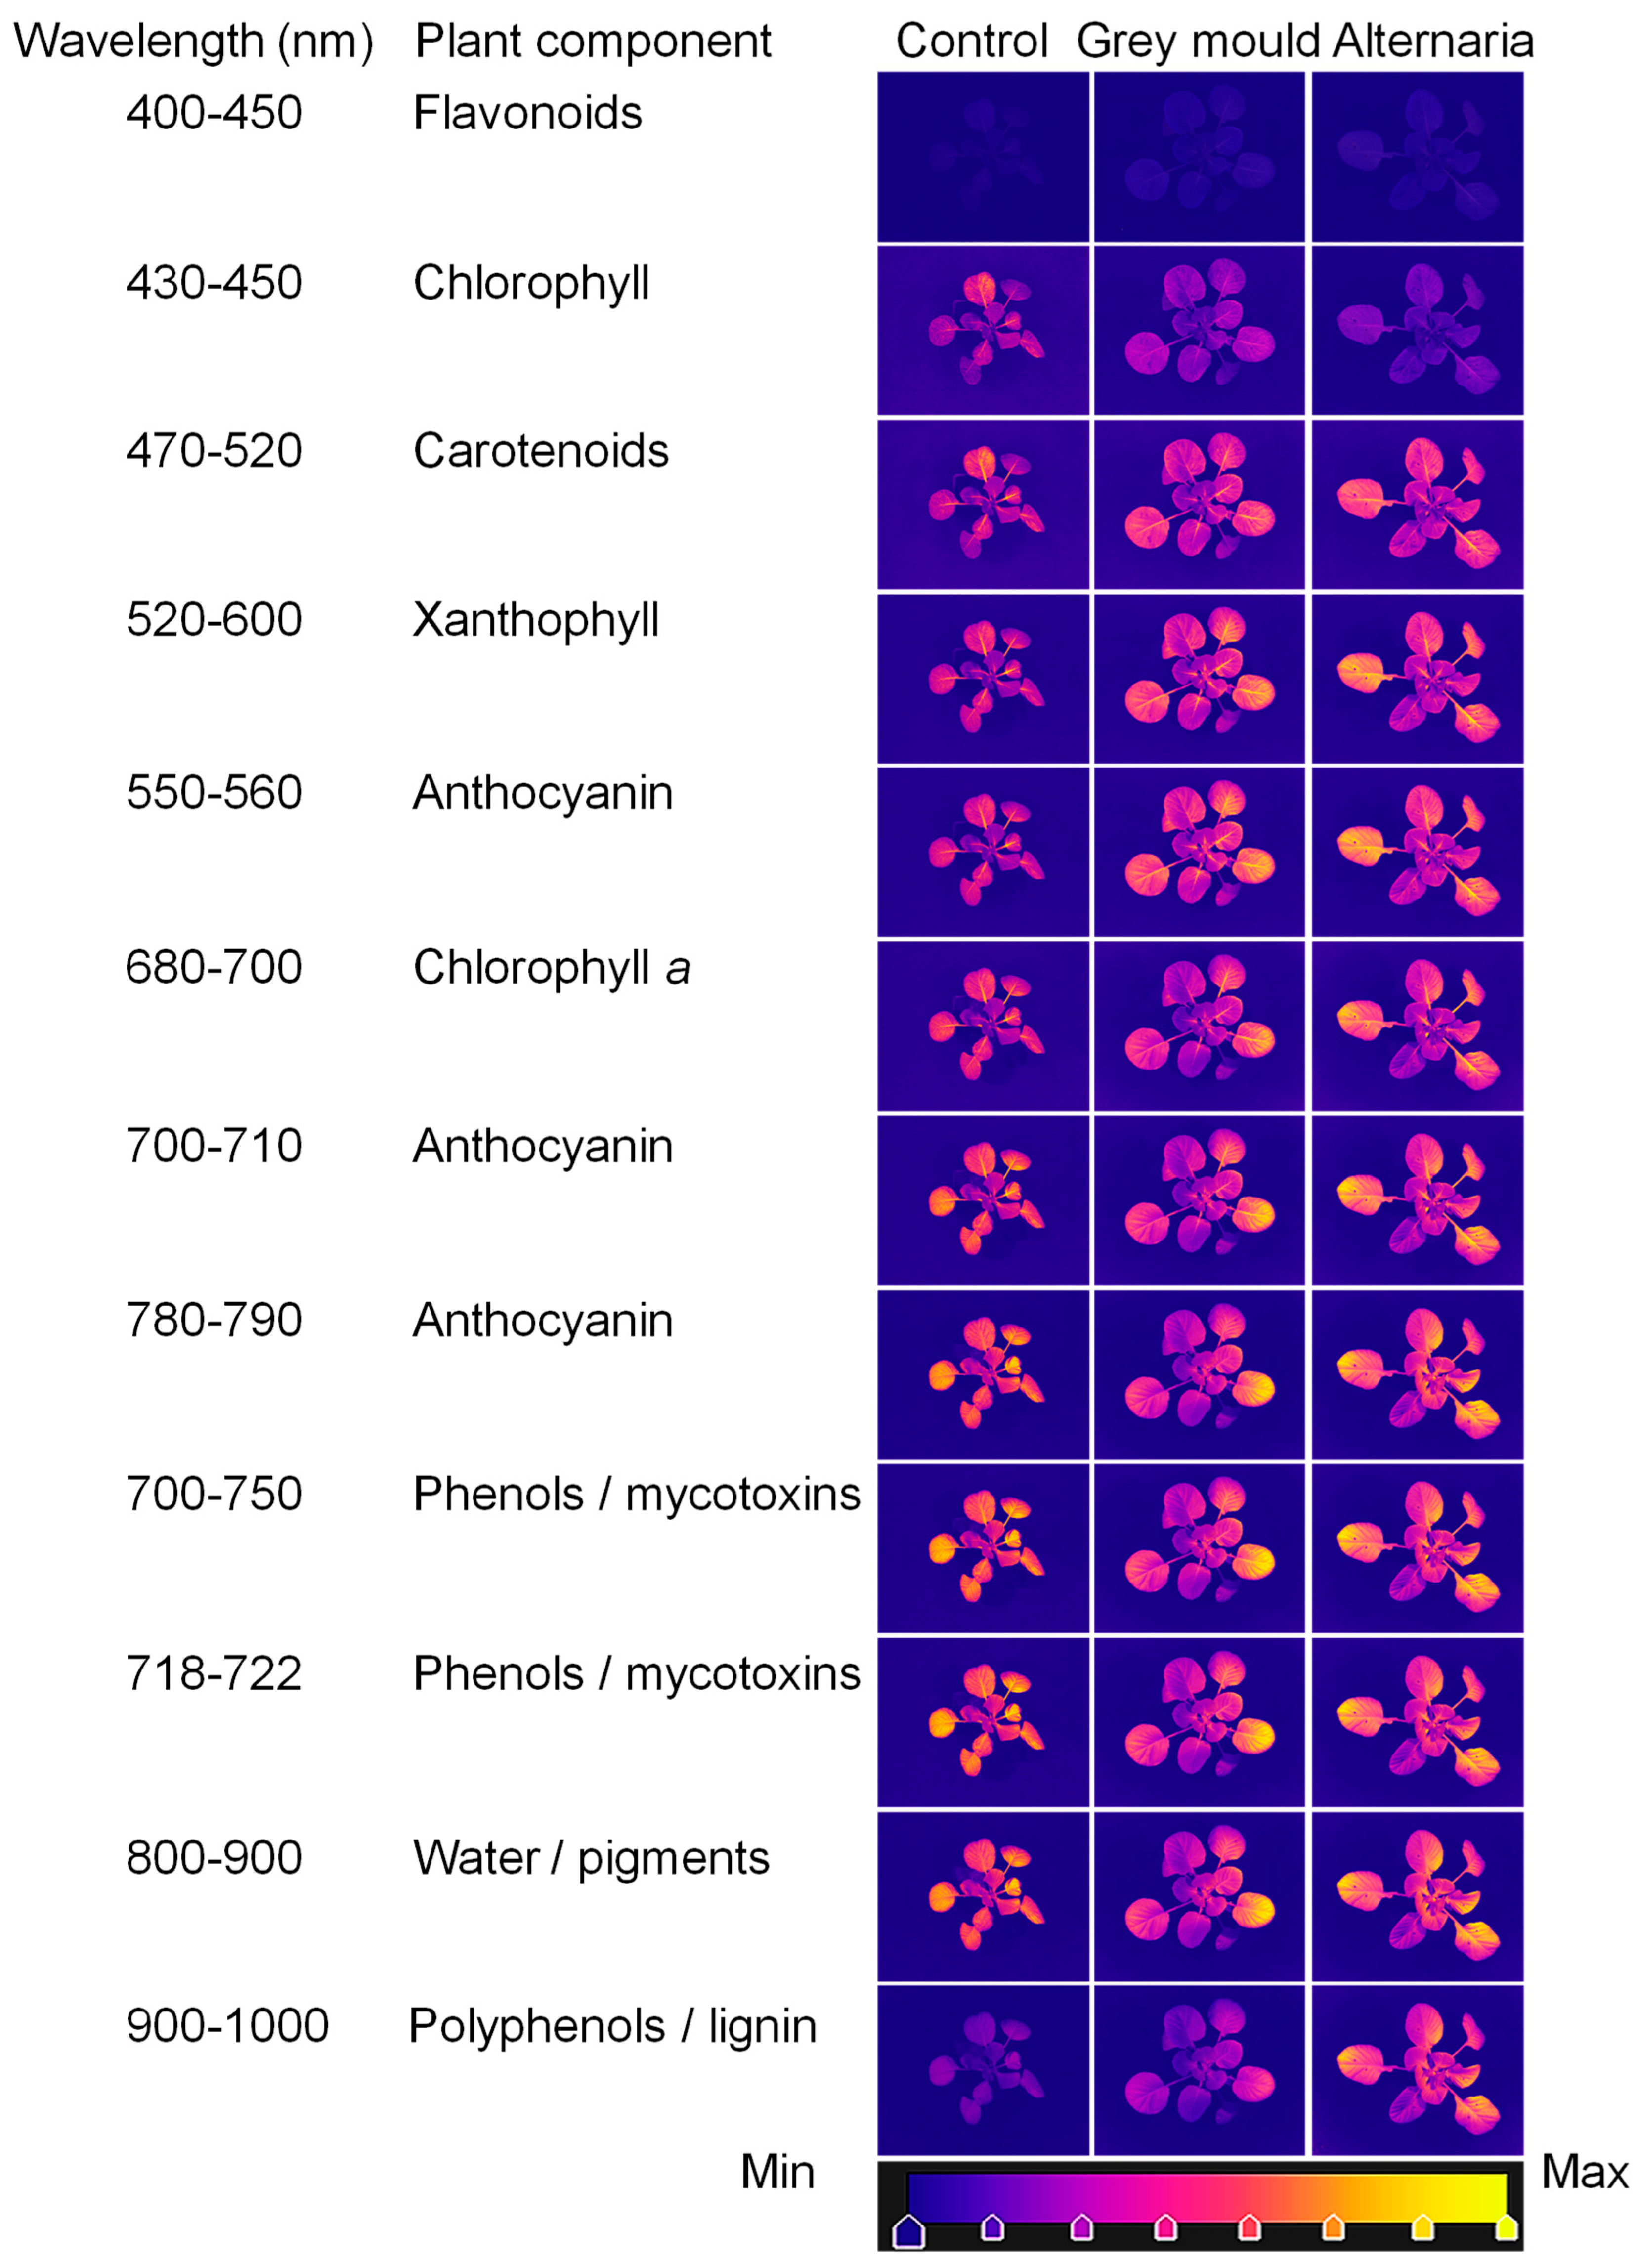
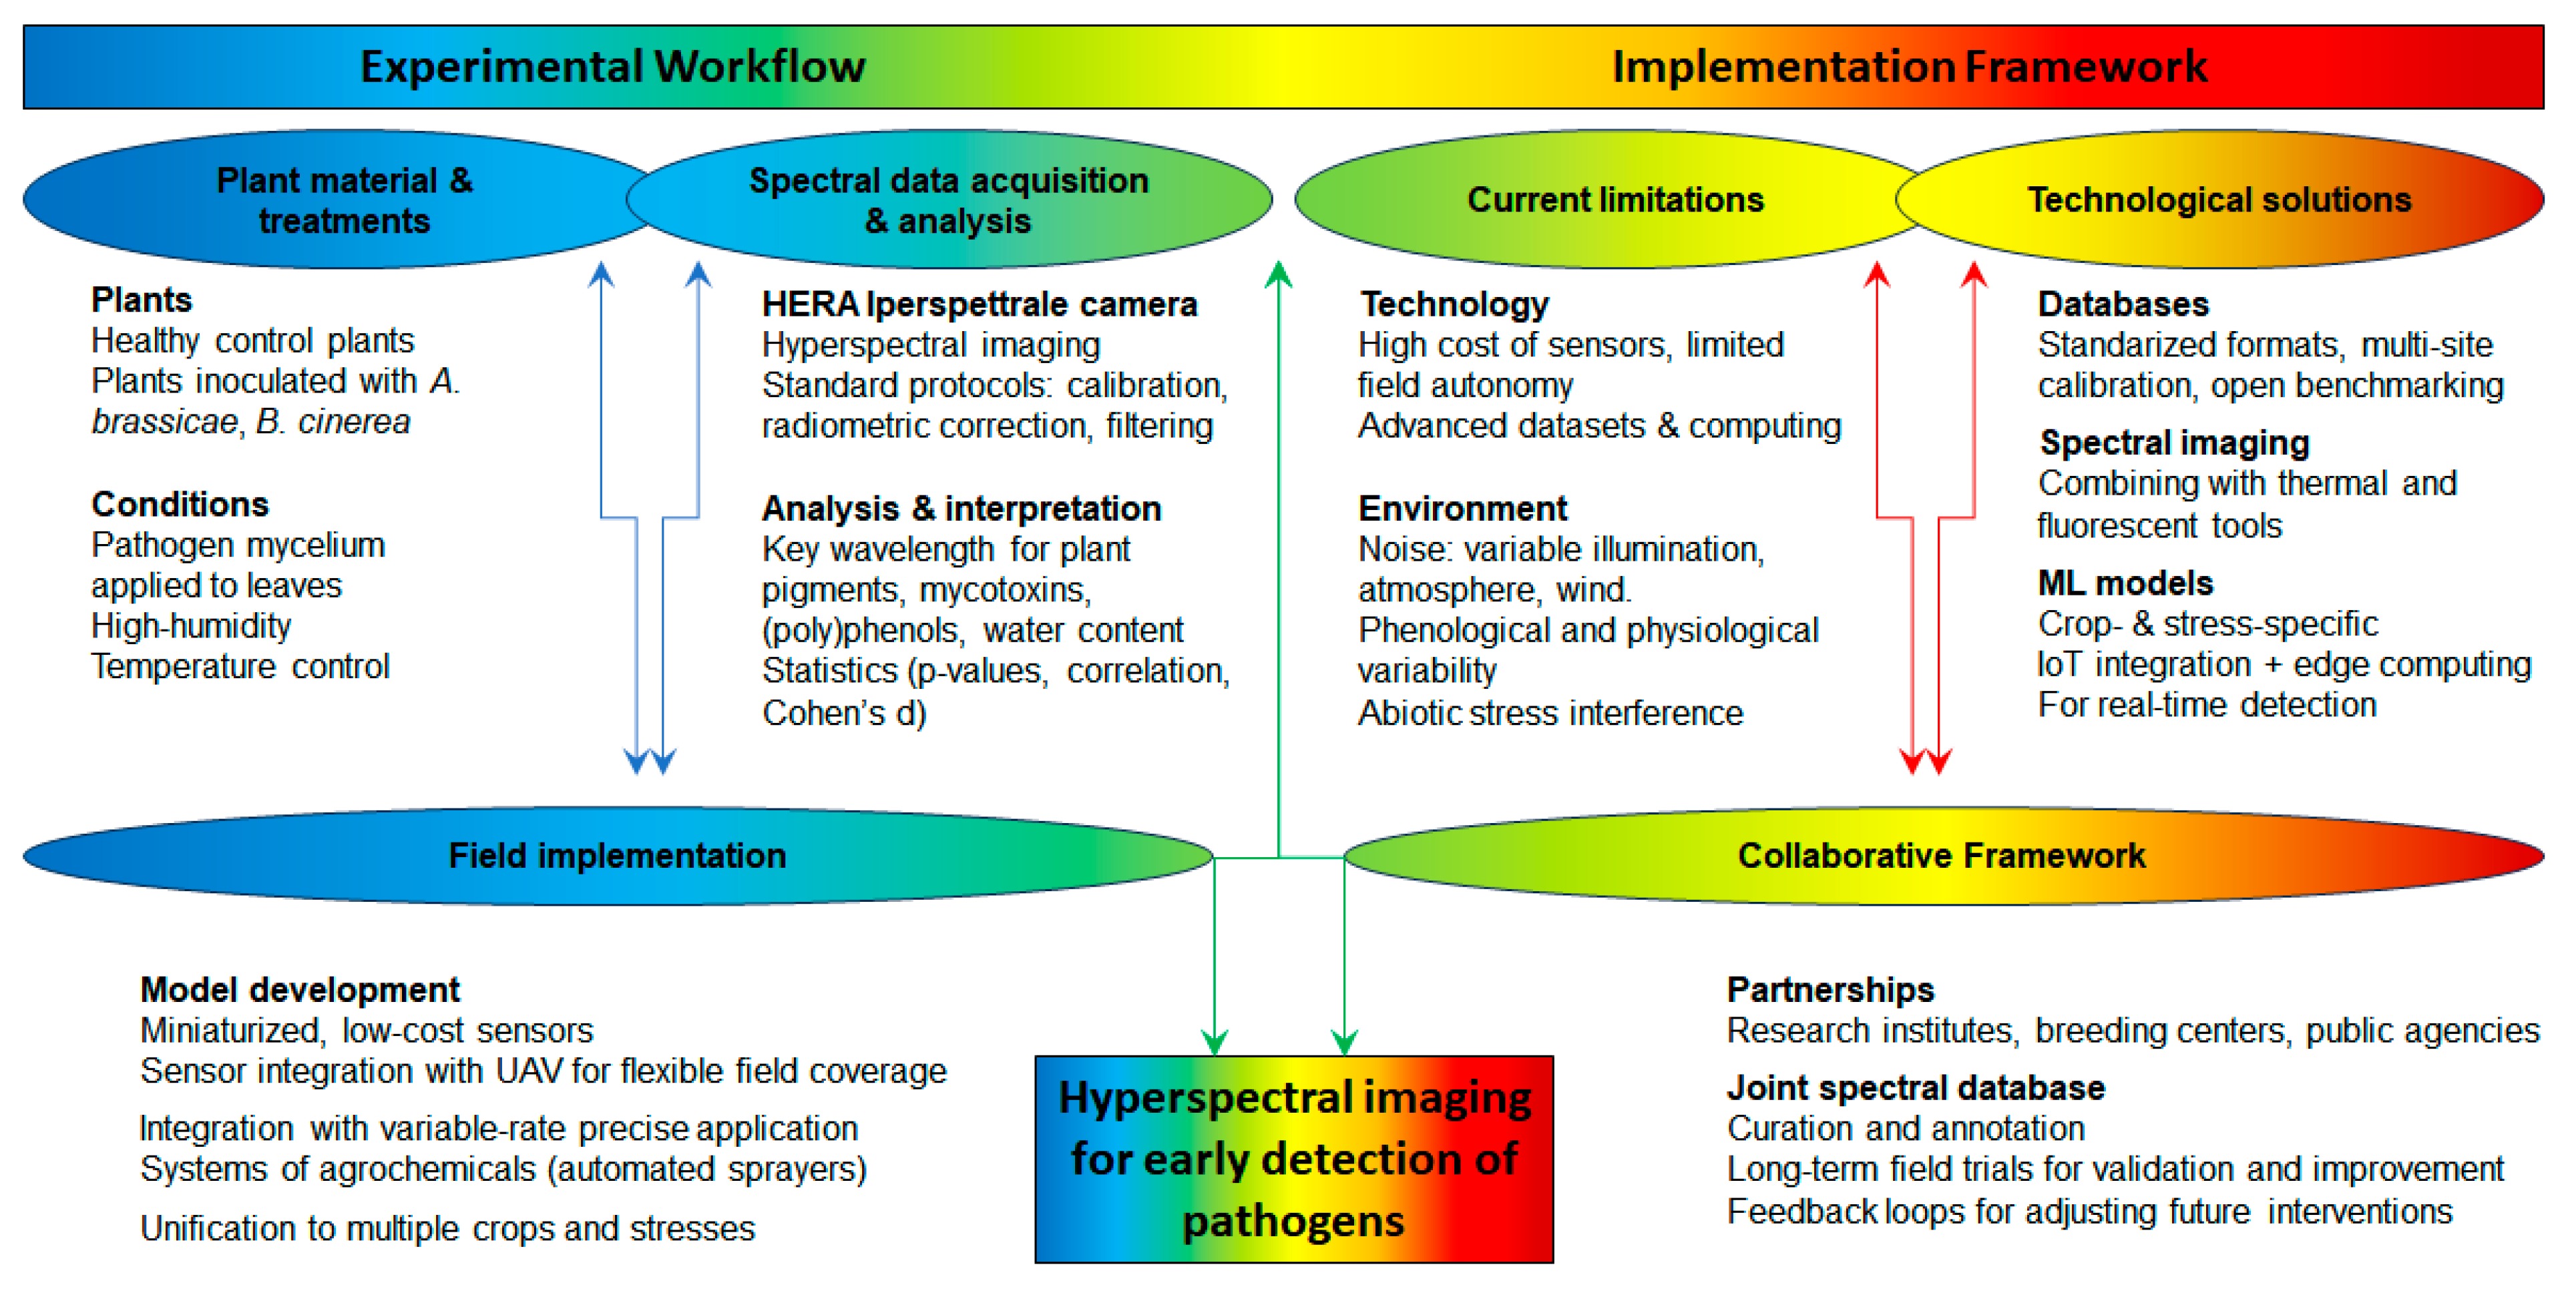
5. An Experimental Case Study: A Novel Contribution to Hyperspectral Imaging for Detecting Cabbage Diseases

In the autumn of 2024, at the National Institute of Horticultural Research, AgroEngineering Dept and Department of Plant Protection (Skierniewice, Poland), research began on the use of hyperspectral imaging for early identification of diseases in cabbage (Brassica oleracea var. capitata) (project INFOSTRATEG-VI/0003/2023). Preliminary work included taking hyperspectral images of young cabbage plants produced under controlled conditions, healthy and infected ones, at different times after inoculation with fungi B. cinerea and A. brassicae. Spectral images in 400–1000 nm were taken using a HERA Iperspettrale camera (NIREOS S.r.l., Milan, Italy) based on Fourier transform (FT) spectroscopy, a technique that uses interference of light rather than dispersion to measure spectra. In this technique, the spectral resolution is not constant, as the spectrum at each pixel of the image is a continuous function of the wavelength. This approach guarantees a variable spectral resolution, easily adjustable via software, without compromising the spatial resolution. The camera was mounted on a dedicated stand (Figure 2) at a height of 1.90 m above the imaged plant so that all the leaves of the plant in the stage of leaf development (BBCH 19) were within the camera’s field of view. For the proper exposure of the plants, a mixed illumination system was used, consisting of two halogen lamps generating a continuous spectrum of light that ranges from the central ultraviolet through VIS and into NIR regions (350–3500 nm) and four LED lamps producing natural white colour light (4000 K), well reproducing the colours of the object. It took approximately 20 s to take each individual image with an entire hyperspectral cube.
The hyperspectral profiles captured in Figure 3 underline significant differences between healthy and diseased cabbage (B. oleracea var. capitata) plants. These changes are reflective of the early physiological and biochemical disruptions caused by grey mould (B. cinerea) and alternaria (A. brassicae). The experiment comprised three combinations: non-infected (healthy) control, plants inoculated with Alternaria brassicae and Botrytis cinerea. In each combination, 96 plants were analysed (representing a whole multi-pot of plants). In the case of initial trials, plants were infected with 5 mm diameter discs of Potato Dextrose Agar (PDA, GranuCult, Merck KGaA, Darmstadt, Germany) medium overgrown with the mycelia of the pathogens tested. The medium discs with pathogen mycelium were applied directly to the leaf surface. Infected plants, as well as control plants, were placed on sills in the greenhouse in small foil tunnels to achieve high humidity to stimulate pathogen growth. The air temperature for the development of B. cinerea ranged from 20 to 22 °C during the day and 16 °C at night. In the case of A. brassicae, it was 22–25 °C during the day and 18 °C at night.
In the control plants, the spectral profiles exhibit consistent reflectance patterns typical of healthy vegetation. Notable dips in reflectance within the red (around 680–700 nm) and blue (450–480 nm) regions correspond to chlorophyll a and b absorption, while elevated reflectance in the NIR to intact cellular structures and robust mesophyll layer. Uniformity in spectral signatures indicates stable physiological and biochemical conditions.
In contrast, plants with early symptoms of grey mould and alternaria exhibit pronounced deviations in their spectral profiles. Lower reflectance dips (relative to the whole spectral curve) in the red and blue regions suggest chloroplast damage, degradation of chlorophyll, or disruption of photosynthesis. Increased reflectance in the green edge (500–600 nm) and ultraviolet (UV) regions indicates the accumulation of stress-induced secondary metabolites like flavonoids and phenols, which play a role in defence mechanisms. Reduced reflectance in the NIR region implies structural damage to the leaf tissues, likely caused by pathogen activity or water stress. Greater heterogeneity in reflectance values across sampled pixels reflects localised physiological changes, such as patchy tissue necrosis or uneven pathogen spread.
Figure 4 presents hyperspectral images of cabbage, highlighting reflectance across specific wavelength ranges associated with chlorophyll, flavonoids, carotenoids, anthocyanins, phenols, and water. The data provide insights into the physiological and biochemical status of control plants compared to those exhibiting early symptoms of grey mould and alternaria. Infected plants display disease-specific progression.
The most informative wavelength ranges reveal critical changes in pigment composition, stress responses, and tissue hydration. The reflectance data were analysed relative to control plants, with the differences confirmed statistically (Figure 5). Specifically, changes in flavonoids, chlorophyll, carotenoids, phenols, and water content were confirmed. Reflectance in the absorption of these bands was significantly higher in infected plants compared to controls (* p ≤ 0.01), indicating a loss of tissue integrity and disruption of cellular components. This reflects the pathogen-induced degradation of plant tissues and interference with photosynthetic processes. Pathogens such as Alternaria spp. and B. cinerea compromise cellular structures, including chloroplasts, either directly through their necrotrophic activity or indirectly by inducing oxidative stress. This oxidative stress accelerates chlorophyll degradation, further impairing photosynthetic efficiency and contributing to disease progression. Among the studied pathogens, A. brassicae induced more pronounced changes, while B. cinerea caused a less extensive impact. Indeed, the fungal infection of Chinese cabbage leaves by A. brassicae has been shown to have detrimental effects on photosynthesis and results in a high reduction in the sucrose concentration in leaves. Instead, increased amounts of indole glucosinolates were found [119]. Phenylpropanoid-related enzymes were also markers in Alternaria dark spot resistance. Importantly, in susceptible cabbage genotypes, myo-inositol, glucose, and fructose content was higher, thus attracting pathogens, while reduced in resistant genotypes [120].
Notably, at wavelengths between 700 and 750 nm, no significant differences in reflectance are observed between control and infected plants, indicating minimal phenolic or mycotoxin-related changes in this region (Figure 5, Table 4). However, at specific subranges (718–722 nm), significant differences emerge, with p-values of p ≤ 0.01 for grey mould and p ≤ 0.001 for alternaria infection (Table 4). These findings reflect distinct pathogen-specific alterations in the biochemical and structural properties of the infected tissue. Effect size analysis using Cohen’s d indicated differences in spectral reflectance between infected and healthy cabbage leaves across several wavelength ranges (Cohen’s d 0.5–0.8 means moderate effect, <0.5 small effect). The most pronounced differences were observed in the 400–520 nm region (blue to green) for grey mould, while 700–710 and 718–722 for alternaria. Considering fungi belonging to the genus Alternaria, common pathogens of fruit and vegetables, more than 80% of the isolates show the ability to produce mycotoxin, generally with higher levels of tenuazonic acid. However, other mycotoxins, such as alternariol, alternariol monomethyl ether, altenuene, and tentoxin are detected [121,122]. Similarly, B. cinerea produces a range of phytotoxic metabolites, including low molecular weight compounds and phytotoxic proteins. Among the most studied of these metabolites is botrydial, with concentrations often exceeding the toxicity threshold. In addition to botrydial, B. cinerea can also produce other toxins, such as botcinolides or oxalic acid, believed to serve as cofactors in pathogenesis (particularly the last one), potentially enhancing the pathogen’s ability to infect and degrade plant tissues [123].
Similarly, the toxicity of botrydial and oxalic acid produced by B. cinerea plays a significant role in tissue maceration, facilitating the pathogen’s access to plant resources. The induction of photosynthesis, CO2 fixation, and sucrose transport triggers defence responses in cabbage against B. cinerea, and this activation likely contributes to the host plant’s induced systemic resistance [124]. However, metabolic shifts may fail to support the plant’s direct defences once the pathogen successfully spreads throughout the tissues.
Further, smaller changes were observed in anthocyanins, polyphenols, and lignin. Unlike other components, lignin levels were reduced, likely due to pathogen activity targeting structural cell wall components, which may facilitate further colonisation. The reduction in lignin could also imply a weakened defence mechanism, as lignin is crucial for reinforcing cell walls against pathogen invasion.
Considering the above, the biochemical and physiological changes observed in cabbage infected by A. brassicae and B. cinerea highlight the dynamic interplay between host defence mechanisms and pathogen virulence strategies. These findings provide valuable insights into the pathways exploited by pathogens and the corresponding metabolic responses of the host, which can inform strategies for breeding disease-resistant crops and improving plant health management.
Figure 6 illustrates the correlation matrices of hyperspectral reflectance for specific wavelength ranges recorded from control plants, plants with early symptoms of grey mould, and plants with early symptoms of alternaria. These matrices highlight the interdependence between various spectral regions and provide insight into the physiological and biochemical processes altered during infection.
In control plants, strong positive correlations are observed between wavelengths associated with chlorophyll (red and blue regions) and those linked to phenols/mycotoxins and anthocyanins. This indicates tightly coupled processes of photosynthesis, photoprotection, and oxidative stress mitigation. Phenols and anthocyanins, both exhibiting potent antioxidant properties, likely contribute to maintaining cellular redox homeostasis. Their correlation reflects the functional stability of primary (e.g., photosynthesis) and secondary (e.g., phenolic and flavonoid biosynthesis) metabolic processes in healthy plants. The efficient operation of these pathways underscores the robust physiological state of the control group.
For plants with early symptoms of grey mould, significant deviations in correlation patterns are evident. Wavelengths associated with chlorophyll demonstrate negative correlations with most other spectral regions, including those linked to flavonoids. This disruption suggests a metabolic trade-off, where resources are reallocated from photosynthetic activity to the synthesis of defence-related secondary metabolites. Although the correlation between flavonoid-associated wavelengths remains positive, it is considerably weaker than other highly correlated parameters observed in healthy plants. Additionally, wavelengths associated with water content exhibit reduced correlations with other spectral bands, highlighting compromised hydration and tissue structural integrity. These changes are consistent with the physiological effects of B. cinerea, which is known to disrupt plant cellular water retention and integrity.
For plant symptoms of alternaria, the correlation matrices reveal distinct spectral differences, particularly across the threshold at 700 nm. Shorter wavelengths (e.g., 400–450 nm for flavonoids, 430–450 nm for chlorophyll, and 470–520 nm for carotenoids) exhibit weak or negative correlations with longer wavelengths (e.g., 700–710 nm for anthocyanins and 780–790 nm for anthocyanins). However, shorter wavelengths, similar to longer ones, correlated positively within these groups. It indicates, respectively, a coordinated response among pigments such as flavonoids, chlorophyll, and carotenoids, as well as reflects interactions among anthocyanin-related processes and their role in stress mitigation. Wavelengths in the 900–1000 nm range, linked to polyphenols and lignin, deviate from the correlation trends observed in other spectral bands, indicating localised disruptions in lignin biosynthesis or accumulation.

6. Conclusions

Multispectral imaging offers a practical, scalable alternative for large-scale monitoring. Multispectral indices are valuable for assessing general stress and plant development. Most often, spectral imaging identifies changes in chlorophyll, water content, and stress-related pigments as key indicators of plant health. These parameters provide robust markers for early-stage disease detection. Hyperspectral imaging provides unparalleled specificity. However, hyperspectral methods offer much more advanced characteristics and precision by identifying subtle spectral variations, i.e., specific biochemical and physiological changes, individual components, and metabolic processes under biotic and abiotic stresses. The complementary use of these technologies can bridge the gap between precision and accessibility, supporting sustainable agriculture by optimizing input usage and reducing environmental impacts. Their integration with remote sensing applications, particularly drone-based hyperspectral imaging, as well as with machine learning models, shows promise for large-scale, real-time, automated crop monitoring but requires further refinement to account for environmental and data processing challenges (Figure 7).
This study confirms the efficacy of hyperspectral imaging in detecting early-stage infections caused by A. brassicae and B. cinerea. The spectral analysis highlights key wavelength ranges associated with chlorophyll degradation, increased stress-related flavonoid accumulation, and structural tissue changes. These findings extend previous knowledge by providing pathogen-specific spectral profiles and showcasing the potential of these methods for high-resolution disease diagnostics. Expanding the scope of spectral imaging to detect multiple stress factors—such as nutrient deficiencies, abiotic stress, and disease—will make these tools more versatile and valuable for integrated crop management. This kind of research underscores the transformative potential of integrating hyperspectral and multispectral imaging with advanced computational tools. By reducing reliance on chemical treatments and enabling targeted interventions, these innovations align with global goals for sustainable agriculture.
Despite their advantages, these technologies, particularly hyperspectral imaging, are subject to several key limitations that must be addressed to enable broader field application:
Hyperspectral sensors are generally expensive, require specialised handling, and are often not readily adaptable for use on standard agricultural machinery or UAVs.
High-dimensional datasets require significant computational power for storage and real-time processing (advanced algorithms and domain expertise), which may not be feasible in remote field settings and without expert training.
Field conditions introduce multiple sources of spectral noise, including the following:
-
Variable solar illumination (e.g., cloud cover and diurnal light changes) that affect reflectance measurements.
-
Atmospheric interference (e.g., humidity, aerosols) that distorts spectral signals, especially in NIR regions.
-
Wind (induced leaf movement and plant geometry variability) that reduces image sharpness and spatial precision.
-
Heterogeneous background (soil, debris, weeds) that complicates segmentation and classification.
-
Phenological variability (e.g., flowering, senescence) that can mimic or mask symptoms of disease.
-
Physiological variability, e.g., different plant species, even within the same botanical family, can exhibit distinct spectral responses to biotic and abiotic stresses due to variations in leaf morphology, pigment composition, metabolic pathways, and stress signalling mechanisms; similarly, the spectral signature of infection varies across pathogen types (fungi, bacteria, viruses) and disease progression stages, further complicating the universal application of spectral indices.
-
Abiotic stresses such as drought, nutrient deficiency, or heat can mimic or mask biotic stress symptoms, making differential diagnosis based on spectral data particularly challenging.
Systems are not designed for long-term autonomous operation in field conditions and often depend on external power sources and stable platforms.
To overcome these limitations, future research on hyperspectral imaging may include the following:
Exploring miniaturised, low-cost sensors; recent sensors weigh <200 g and are compact enough for UAV integration, while acceptable spectral resolution (e.g., 5–10 nm) are maintained across key regions (400–1000 nm), sufficient for detecting plant stress and disease; reduced power consumption and thermal management needs, which make them suitable for autonomous operations in field settings; however, mobile spectrometers do not always provide spatial data with enough resolution for large-scale monitoring.
Integration with UAV platforms to provide flexible, rapid, and repeated coverage of large agricultural plots with centimetre-level spatial resolution, which enables monitoring across different phenological stages and under various light and weather conditions.
Linking spectral imaging devices with Internet of Things (IoT) platforms for seamless data sharing and decision-making; hyperspectral nodes can be linked with soil moisture sensors, temperature/humidity loggers, and weather stations to enable multi-dimensional crop environment monitoring, while integration with edge computing allows for on-site processing, reducing the volume of data transmitted and enabling faster decision-making.
Expanding spectral imaging research to include a broader range of crops and pathogens, as well as methodologies across agricultural systems; current models and diagnostic algorithms are often trained and validated on single species (e.g., cabbage) and specific stress types (pathogens), limiting their generalisability (for other species such as cauliflower and broccoli) and stresses (abiotic drought).
Combining spectral imaging with other diagnostic tools, such as thermal imaging and genomics, to create comprehensive crop health assessment frameworks; ultimately, multispectral methods have too low a resolution to detect details of plant stress, while hyperspectral methods are not yet a fully mature field-deployable tool for most farming operations; their integration with other sensor technologies and decision support systems holds significant promise for early disease detection and improved crop health management in precision agriculture.
Therefore, a structured implementation framework applicable at the farm level requires at least consideration of technical, operational, and agronomic factors:
Technology selection based on spectral and spatial resolution appropriate to the crop, portability, cost-efficiency, and robustness in outdoor conditions.
Standardised data workflows supported by standardised protocols, i.e., calibration, radiometric correction, and filtering to mitigate atmospheric and illumination variability.
Targeted data analysis and pre-trained machine learning models enable real-time crop-specific detection of early stress symptoms.
Decision-support integration to feed spectral outputs into precision management systems (e.g., for fungicide application or selective harvesting), ideally linked with IoT infrastructure for automated response.
To ensure reproducibility and broader adoption, the development of harmonised spectral databases should be based on clearly defined standardisation procedures, including the following:
The use of common data formats and metadata standards for spectral signatures;
Multi-site calibration campaigns to align sensor outputs under varying environmental and agronomic conditions;
Validation of reflectance-based stress indicators across crop species and regions;
Benchmarking of model performance using open-access reference datasets.
Such efforts will benefit from close collaboration with agronomic research institutes, breeding centres, and public agencies, which can provide long-term field trials, expert annotations, and access to diverse plant health conditions. Establishing joint working groups or consortia for spectral database curation would also enhance cross-compatibility between platforms and ensure that the resulting tools are grounded in real-world agronomic practices. By translating spectral data into actionable agronomic insights, this simplified roadmap facilitates the practical uptake of HSI tools in commercial farming, supporting earlier intervention, input reduction, and improved crop protection strategies.

Author Contributions

Conceptualisation, M.S.-H., R.H. and G.D.; methodology, M.S.-H., R.H., G.D., K.S., J.P., A.J.-B., M.P. and A.W.; software, R.H. and K.S.; validation, M.S.-H., R.H. and G.D.; formal analysis, M.S.-H., R.H., G.D., K.S., J.P., A.J.-B., M.P. and A.W.; investigation, M.S.-H., R.H., G.D., K.S., J.P., A.J.-B., M.P. and A.W.; resources, R.H. and G.D.; data curation, M.S.-H.; writing—original draft preparation, M.S.-H.; writing—review and editing, M.S.-H., R.H., G.D. and J.P.; visualisation, M.S.-H. and G.D.; supervision, M.S.-H. and R.H.; project administration, R.H.; funding acquisition, R.H. All authors have read and agreed to the published version of the manuscript.

Funding

This research was funded by the National Centre for Research and Development, Poland, grant number INFOSTRATEG-VI/0003/2023: Selective plant protection system using hyperspectral imaging and neural networks to identify agrophages and control a sprayer of new generation.

Data Availability Statement

The raw data supporting the conclusions of this article will be made available by the authors on request.

Conflicts of Interest

The authors declare no conflicts of interest.

References

  1. Blagojević, J.D.; Vukojević, J.B.; Ivanović, Ž.S. Occurrence and characterization of Alternaria species associated with leaf spot disease in rapeseed in Serbia. Plant Pathol. 2020, 69, 883–900. [Google Scholar] [CrossRef]
  2. Kumar, D.; Maurya, N.; Bharati, Y.K.; Kumar, A.; Kumar, K.; Srivastava, K.; Chand, G.; Kushwaha, C.; Singh, S.K.; Mishra, R.K.; et al. Alternaria blight of oilseed brassicas: A comprehensive review. Asian J. Med. Res. 2014, 8, 2816–2829. [Google Scholar]
  3. Schinkovitz, A.; Guillemette, T.; Blond, N.; Pogam-Alluard, P.L.; Jaozara, N.; Kerdia, K.; Boustie, J.; Simoneau, P.; Richomme, P. Antifungal activity of lichen extracts and compounds against Alternaria brassicola. In Proceedings of the Joint Natural Products Conference, Copenhague, Denmark, 9 July 2016; Planta Medica, 81 (S 01). pp. S1–S381. [Google Scholar]
  4. Padmathilake, K.R.E.; Fernando, W.G.D. Less virulent Leptosphaeria biglobosa immunizes the canola plant to resist highly virulent l. maculans, the blackleg pathogen. Plants 2022, 11, 996. [Google Scholar] [CrossRef] [PubMed]
  5. Coelho, P.S.; Monteiro, A.A.; Lopes, V.R.; Branca, F. New sources of resistance to downy mildew in a collection of wild and cultivated brassicas. Acta Hortic. 2018, 1202, 93–100. [Google Scholar] [CrossRef]
  6. Ding, Y.; Mei, J.; Chai, Y.; Yu, Y.; Shao, C.; Wu, Q.; Disi, J.O.; Li, Y.; Wan, H.; Qian, W. Simultaneous transcriptome analysis of host and pathogen highlights the interaction between Brassica oleracea and Sclerotinia sclerotiorum. Phytopathology 2019, 109, 542–550. [Google Scholar] [CrossRef]
  7. Donald, C.; Porter, I. Integrated control of clubroot. J. Plant Growth Regul. 2009, 28, 289–303. [Google Scholar] [CrossRef]
  8. Borkar, S.G. Threat perception of bacterial plant pathogen Xanthomonas campestris pv. campestris (Pammel) Dowson, causing black rot disease in cabbage fields. Can. J. Agric. Crops 2020, 5, 174–186. [Google Scholar] [CrossRef]
  9. Lee, D.H.; Lim, J.-A.; Lee, J.; Roh, E.; Jung, K.; Choi, M.; Oh, C.; Ryu, S.; Yun, J.; Heu, S. Characterization of genes required for the pathogenicity of Pectobacterium carotovorum subsp. carotovorum Pcc21 in chinese cabbage. Microbiology 2013, 159, 1487–1496. [Google Scholar] [CrossRef] [PubMed]
  10. Mauzey, S.J.; Koike, S.T.; Bull, C.T. First report of bacterial blight of cabbage (Brassica oleracea var. capitata) caused by Pseudomonas cannabina pv. alisalensis in California. Plant Dis. 2011, 95, 71. [Google Scholar] [CrossRef]
  11. Deng, Y.; Li, J.C.; Lyv, X.; Xu, J.W.; Wu, M.D.; Zhang, J.; Yang, L.; Li, G.Q. Large-Scale surveys of blackleg of oilseed rape (Leptosphaeria biglobosa) revealed new insights into epidemics of this disease in China. Plant Dis. 2023, 107, 1408–1417. [Google Scholar] [CrossRef]
  12. Garrett, K.A.; Forbes, G.A.; Savary, S.; Skelsey, P.; Sparks, A.H.; Valdivia, C.; van Bruggen, A.H.C.; Willocquet, L.; Djurle, A.; Duveiller, E.; et al. Complexity in climate-change impacts: An analytical framework for effects mediated by plant disease. Plant Pathol. 2011, 60, 15–30. [Google Scholar] [CrossRef]
  13. Sishodia, R.P.; Ray, R.L.; Singh, S.K. Applications of Remote Sensing in Precision Agriculture: A Review. Remote Sens. 2020, 12, 3136. [Google Scholar] [CrossRef]
  14. Khanal, S.; Fulton, J.; Shearer, S. An overview of current and potential applications of thermal remote sensing in precision agriculture. Comput. Electr. Agric. 2017, 139, 22–32. [Google Scholar] [CrossRef]
  15. Kuswidiyanto, L.W.; Noh, H.-H.; Han, X. Plant disease diagnosis using deep learning based on aerial hyperspectral images: A review. Remote Sens. 2022, 14, 6031. [Google Scholar] [CrossRef]
  16. Omia, E.; Bae, H.; Park, E.; Kim, M.S.; Baek, I.; Kabenge, I.; Cho, B.-K. Remote sensing in field crop monitoring: A comprehensive review of sensor systems, data analyses and recent advances. Remote Sens. 2023, 15, 354. [Google Scholar] [CrossRef]
  17. Lu, B.; He, Y. Evaluating empirical regression, machine learning, and radiative transfer modelling for estimating vegetation chlorophyll content using bi-seasonal hyperspectral images. Remote Sens. 2019, 11, 1979. [Google Scholar] [CrossRef]
  18. Bergsträsser, S.; Fanourakis, D.; Schmittgen, S.; Cendrero-Mateo, M.P.; Jansen, M.; Scharr, H.; Rascher, U. HyperART: Non-invasive quantification of leaf traits using hyperspectral absorption-reflectance-transmittance imaging. Plant Meth. 2015, 11, 1. [Google Scholar] [CrossRef]
  19. Zhang, Y.; Chen, J.M.; Miller, J.R.; Noland, T.L. Leaf chlorophyll content retrieval from airborne hyperspectral remote sensing imagery. Remote Sens. Environ. 2008, 112, 3234–3247. [Google Scholar] [CrossRef]
  20. Szechyńska-Hebda, M.; Kruk, J.; Górecka, M.; Karpińska, B.; Karpiński, S. Evidence for light wavelength-specific photoelectrophysiological signaling and memory of excess light episodes in Arabidopsis. Plant Cell 2010, 22, 2201–2218. [Google Scholar] [CrossRef]
  21. Szechyńska-Hebda, M.; Karpiński, S. Light intensity-dependent retrograde signalling in higher plants. J. Plant Physiol. 2013, 170, 1501–1516. [Google Scholar] [CrossRef]
  22. Qin, J.; Lu, R. Measurement of the optical properties of fruits and vegetables using spatially resolved hyperspectral diffuse reflectance imaging technique. Posthar. Biol. Technol. 2008, 49, 355–365. [Google Scholar] [CrossRef]
  23. Gitelson, A.A.; Gritz, Y.; Merzlyak, M.N. Relationships between leaf chlorophyll content and spectral reflectance and algorithms for non-destructive chlorophyll assessment in higher plant leaves. J. Plant Physiol. 2003, 160, 271–282. [Google Scholar] [CrossRef]
  24. Thomas, S.; Wahabzada, M.; Kuska, M.T.; Rascher, U.; Mahlein, A.-K. Observation of plant–pathogen interaction by simultaneous hyperspectral imaging reflection and transmission measurements. Funct. Plant Biol. 2016, 44, 23–34. [Google Scholar] [CrossRef]
  25. Karpiński, S.; Szechyńska-Hebda, M.; Wituszyńska, W.; Burdiak, P. Light Acclimation, retrograde signalling, cell death and immune defences in plants. Plant Cell Environ. 2013, 36, 736–744. [Google Scholar] [CrossRef] [PubMed]
  26. Szechyńska-Hebda, M.; Wasek, I.; Gołebiowska, G.; Dubas, E.; Zur, I.; Wedzony, M. Photosynthesis-dependent physiological and genetic crosstalk between cold acclimation and cold-induced resistance to fungal pathogens in triticale (Triticosecale Wittm.). J. Plant Physiol. 2015, 177, 30–43. [Google Scholar] [CrossRef]
  27. Lowe, A.; Harrison, N.; French, A.P. Hyperspectral image analysis techniques for the detection and classification of the early onset of plant disease and stress. Plant Meth. 2017, 13, 80. [Google Scholar] [CrossRef]
  28. Ferreira, L.d.C.; Carvalho, I.C.B.; Jorge, L.A.d.C.; Quezado-Duval, A.M.; Rossato, M. Hyperspectral imaging for the detection of plant pathogens in seeds: Recent developments and challenges. Front. Plant Sci. 2024, 15, 1387925. [Google Scholar] [CrossRef] [PubMed]
  29. Ali, F.; Razzaq, A.; Tariq, W.; Hameed, A.; Rehman, A.; Razzaq, K.; Sarfraz, S.; Rajput, N.A.; Zaki, H.E.M.; Shahid, M.S.; et al. Spectral intelligence: Ai-driven hyperspectral imaging for agricultural and ecosystem applications. Agronomy 2024, 14, 2260. [Google Scholar] [CrossRef]
  30. Sytar, O.; Zivcak, M.; Neugart, S.; Brestic, M. Assessment of hyperspectral indicators related to the content of phenolic compounds and multispectral fluorescence records in chicory leaves exposed to various light environments. Plant Physiol. Biochem. 2020, 154, 429–438. [Google Scholar] [CrossRef]
  31. Kim, M.-J.; Yu, W.-H.; Song, D.-J.; Chun, S.-W.; Kim, M.S.; Lee, A.; Kim, G.; Shin, B.-S.; Mo, C. Prediction of soluble-solid content in citrus fruit using visible–near-infrared hyperspectral imaging based on effective-wavelength selection algorithm. Sensors 2024, 24, 1512. [Google Scholar] [CrossRef]
  32. Feng, L.; Wu, B.; Chen, S.; Zhang, C.; He, Y. Application of visible/near-infrared hyperspectral imaging with convolutional neural networks to phenotype aboveground parts to detect cabbage Plasmodiophora brassicae (clubroot). Infrared Phys. Techn. 2022, 121, 104040. [Google Scholar] [CrossRef]
  33. Guo, Z.; Zhang, J.; Ma, C.; Yin, X.; Guo, Y.; Sun, X.; Jin, C. Application of visible-near-infrared hyperspectral imaging technology coupled with wavelength selection algorithm for rapid determination of moisture content of soybean seeds. J. Food Comp. Anal. 2023, 116, 105048. [Google Scholar] [CrossRef]
  34. Huang, J.; Wei, C.; Zhang, Y.; Blackburn, G.A.; Wang, X.; Wei, C.; Wang, J. Meta-analysis of the detection of plant pigment concentrations using hyperspectral remotely sensed data. PLoS ONE 2015, 10, e0137029. [Google Scholar] [CrossRef] [PubMed]
  35. Fiļipovics, M. Hyperspectral Imaging for Early Detection of Foliar Fungal Diseases on Small Grain Cereals: A Minireview. Available online: https://rrd.lbtu.lv/node/69 (accessed on 11 January 2025).
  36. Wan, S.; Yeh, M.-L.; Ma, H.-L. An innovative intelligent system with integrated CNN and SVM: Considering various crops through hyperspectral image data. ISPRS Int. J. Geo-Inf. 2021, 10, 242. [Google Scholar] [CrossRef]
  37. Falcioni, R.; Antunes, W.C.; Demattê, J.A.M.; Nanni, M.R. Reflectance spectroscopy for the classification and prediction of pigments in agronomic crops. Plants 2023, 12, 2347. [Google Scholar] [CrossRef]
  38. Brugger, A.; Yamati, F.I.; Barreto, A.; Paulus, S.; Schramowsk, P.; Kersting, K.; Steiner, U.; Neugart, S.; Mahlein, A.-K. Hyperspectral imaging in the uv range allows for differentiation of sugar beet diseases based on changes in secondary plant metabolites. Phytopathology 2023, 113, 44–54. [Google Scholar] [CrossRef] [PubMed]
  39. He, J.; Chen, L.; Chu, B.; Zhang, C. Determination of total polysaccharides and total flavonoids in Chrysanthemum morifolium using near-infrared hyperspectral imaging and multivariate analysis. Molecules 2018, 23, 2395. [Google Scholar] [CrossRef]
  40. Yoon, H.I.; Lee, H.; Yang, J.-S.; Choi, J.-H.; Jung, D.-H.; Park, Y.J.; Park, J.-E.; Kim, S.M.; Park, S.H. Predicting models for plant metabolites based on PLSR, AdaBoost, XGBoost, and LightGBM algorithms using hyperspectral imaging of Brassica juncea. Agriculture 2023, 13, 1477. [Google Scholar] [CrossRef]
  41. Jiang, S.; Chang, Q.; Wang, X.; Zheng, Z.; Zhang, Y.; Wang, Q. Estimation of anthocyanins in whole-fertility maize leaves based on ground-based hyperspectral measurements. Remote Sens. 2023, 15, 2571. [Google Scholar] [CrossRef]
  42. Liu, Y.; Sun, Y.; Xie, A.; Yu, H.; Yin, Y.; Li, X.; Duan, X. Potential of hyperspectral imaging for rapid prediction of anthocyanin content of purple-fleshed sweet potato slices during drying process. Food Anal. Methods 2017, 10, 3836–3846. [Google Scholar] [CrossRef]
  43. Kuswidiyanto, L.W.; Han, X.; Wang, P.; Noh, H.-H.; Jung, H.-Y.; Jung, D.-H. Airborne Hyperspectral Imaging for Early Diagnosis of Kimchi Cabbage Downy Mildew Using 3D-Resnet and Leaf Segmentation. 2023. Available online: https://papers.ssrn.com/sol3/papers.cfm?abstract_id=4535845 (accessed on 9 August 2023).
  44. Lassalle, G. Monitoring natural and anthropogenic plant stressors by hyperspectral remote sensing: Recommendations and guidelines based on a meta-review. Sci. Total Environ. 2021, 788, 147758. [Google Scholar] [CrossRef] [PubMed]
  45. Thomas, S.; Kuska, M.T.; Bohnenkamp, D.; Brugger, A.; Alisaac, E.; Wahabzada, M.; Behmann, J.; Mahlein, A.-K. Benefits of hyperspectral imaging for plant disease detection and plant protection: A technical perspective. J. Plant Dis. Prot. 2018, 125, 5–20. [Google Scholar] [CrossRef]
  46. Gitelson, A.A.; Zur, Y.; Chivkunova, O.B.; Merzlyak, M.N. Assessing Carotenoid content in plant leaves with reflectance spectroscopy. Photochem. Photobiol. 2002, 75, 272–281. [Google Scholar] [CrossRef] [PubMed]
  47. Guan, Y.; Guo, S.; Xue, Y.; Liu, J.; Zhang, X. Application of airborne hyperspectral data for precise agriculture. In Proceedings of the 2004 IEEE International Geoscience and Remote Sensing Symposium (IGARSS 2004), Anchorage, AK, USA, 20–24 September 2004; Volume 6, pp. 4195–4198. [Google Scholar]
  48. Gamon, J.A.; Peñuelas, J.; Field, C.B. A narrow-waveband spectral index that tracks diurnal changes in photosynthetic efficiency. Remote Sen. Environ. 1992, 41, 35–44. [Google Scholar] [CrossRef]
  49. Sonobe, R.; Wang, Q. Assessing the xanthophyll cycle in natural beech leaves with hyperspectral reflectance. Funct. Plant. Biol. 2016, 43, 438–447. [Google Scholar] [CrossRef] [PubMed]
  50. Sanaeifar, A.; Yang, C.; Min, A.; Jones, C.R.; Michaels, T.E.; Krueger, Q.J.; Barnes, R.; Velte, T.J. Noninvasive early detection of nutrient deficiencies in greenhouse-grown industrial hemp using hyperspectral imaging. Remote Sen. 2024, 16, 187. [Google Scholar] [CrossRef]
  51. Zhang, X.-L.; Liu, F.; Nie, P.-C.; He, Y.; Bao, Y.-D. Rapid detection of nitrogen content and distribution in oilseed rape leaves based on hyperspectral imaging. Guang Pu Xue Yu Guang Pu Fen Xi 2014, 34, 2513–2518. [Google Scholar]
  52. Zou, W.; Fang, H.; Bao, Y.D.; He, Y. Detection of nitrogen content changes of rape leaf using hyperspectral imaging. Adv. Materials Res. 2011, 204–210, 131–134. [Google Scholar] [CrossRef]
  53. Zhang, Y.; Guan, M.; Wang, L.; Cui, X.; Li, T.; Zhang, F. In situ nondestructive detection of nitrogen content in soybean leaves based on hyperspectral imaging technology. Agronomy 2024, 14, 806. [Google Scholar] [CrossRef]
  54. Yu, Y.; Wu, Y.; He, L. A wheat WRKY transcription factor TaWRKY17 Enhances tolerance to salt stress in transgenic arabidopsis and wheat plant. Plant. Mol. Biol. 2023, 113, 171–191. [Google Scholar] [CrossRef]
  55. Higa, S.; Kobori, H.; Tsuchikawa, S. Mapping of leaf water content using near-infrared hyperspectral imaging. Appl. Spectrosc. 2013, 67, 1302–1307. [Google Scholar] [CrossRef] [PubMed]
  56. Yang, X.; Liu, G.; He, J.; Kang, N.; Yuan, R.; Fan, N. Determination of sugar content in lingwu jujube by nir–hyperspectral imaging. J. Food Sci. 2021, 86, 1201–1214. [Google Scholar] [CrossRef] [PubMed]
  57. Kim, D.M.; Zhang, H.; Zhou, H.; Du, T.; Wu, Q.; Mockler, T.C.; Berezin, M.Y. Highly sensitive image-derived indices of water-stressed plants using hyperspectral imaging in swir and histogram analysis. Sci. Rep. 2015, 5, 15919. [Google Scholar] [CrossRef] [PubMed]
  58. Xie, C.; Shao, Y.; Li, X.; He, Y. Detection of early blight and late blight diseases on tomato leaves using hyperspectral imaging. Sci. Rep. 2015, 5, 16564. [Google Scholar] [CrossRef]
  59. Sun, H.; Liu, N.; Wu, L.; Chen, L.; Yang, L.; Li, M.; Zhang, Q. Water content detection of potato leaves based on hyperspectral image. IFAC-PapersOnLine 2018, 51, 443–448. [Google Scholar] [CrossRef]
  60. Oerke, E.-C.; Steiner, U. Hyperspectral imaging reveals small-scale water gradients in apple leaves due to minimal cuticle perforation by venturia inaequalis conidiophores. J. Exp. Bot. 2024, 75, 3125–3140. [Google Scholar] [CrossRef] [PubMed]
  61. Gerhards, M.; Schlerf, M.; Mallick, K.; Udelhoven, T. Challenges and future perspectives of multi-/hyperspectral thermal infrared remote sensing for crop water-stress detection: A review. Remote Sens. 2019, 11, 1240. [Google Scholar] [CrossRef]
  62. Zhang, N.; Yang, G.; Pan, Y.; Yang, X.; Chen, L.; Zhao, C. A review of advanced technologies and development for hyperspectral-based plant disease detection in the past three decades. Remote Sens. 2020, 12, 3188. [Google Scholar] [CrossRef]
  63. Zhao, T.; Nakano, A.; Iwaski, Y.; Umeda, H. Application of hyperspectral imaging for assessment of tomato leaf water status in plant factories. Appl. Sci. 2020, 10, 4665. [Google Scholar] [CrossRef]
  64. Suratanee, A.; Chutimanukul, P.; Saelao, T.; Chadchawan, S.; Buaboocha, T.; Plaimas, K. Phenolic content discrimination in thai holy basil using hyperspectral data analysis and machine learning techniques. PLoS ONE 2024, 19, e0309132. [Google Scholar] [CrossRef]
  65. Kang, Y.S.; Ryu, C.S.; Kang, J.G. Presenting a multispectral image sensor for quantification of total polyphenols in low-temperature stressed tomato seedlings using hyperspectral imaging. Sensors 2024, 24, 4260. [Google Scholar] [CrossRef] [PubMed]
  66. Song, H.; Yoon, S.-R.; Dang, Y.-M.; Yang, J.-S.; Hwang, I.M.; Ha, J.-H. Nondestructive classification of soft rot disease in napa cabbage using hyperspectral imaging analysis. Sci. Rep. 2022, 12, 14707. [Google Scholar] [CrossRef]
  67. Khan, I.H.; Liu, H.; Li, W.; Cao, A.; Wang, X.; Liu, H.; Cheng, T.; Tian, Y.; Zhu, Y.; Cao, W.; et al. Early detection of powdery mildew disease and accurate quantification of its severity using hyperspectral images in wheat. Remote Sens. 2021, 13, 3612. [Google Scholar] [CrossRef]
  68. Van De Vijver, R.; Mertens, K.; Heungens, K.; Somers, B.; Nuyttens, D.; Borra-Serrano, I.; Lootens, P.; Roldán-Ruiz, I.; Vangeyte, J.; Saeys, W. In-field detection of Alternaria solani in potato crops using hyperspectral imaging. Comput. Electron. Agric. 2020, 168, 105106. [Google Scholar] [CrossRef]
  69. Baranowski, P.; Jedryczka, M.; Mazurek, W.; Babula-Skowronska, D.; Siedliska, A.; Kaczmarek, J. Hyperspectral and thermal imaging of oilseed rape (Brassica napus) response to fungal species of the genus alternaria. PLoS ONE 2015, 10, e0122913. [Google Scholar] [CrossRef] [PubMed]
  70. Fahrentrapp, J.; Ria, F.; Geilhausen, M.; Panassiti, B. Detection of gray mold leaf infections prior to visual symptom appearance using a five-band multispectral sensor. Front. Plant Sci. 2019, 10, 628. [Google Scholar] [CrossRef]
  71. Scarboro, C.G.; Ruzsa, S.M.; Doherty, C.J.; Kudenov, M.W. Quantification of gray mold infection in lettuce using a bispectral imaging system under laboratory conditions. Plant Direct. 2021, 5, e00317. [Google Scholar] [CrossRef]
  72. Liang, K.; Liu, Q.X.; Xu, J.H.; Wang, Y.Q.; Okinda, C.S.; Shena, M.X. Determination and visualization of different levels of deoxynivalenol in bulk wheat kernels by hyperspectral imaging. J. Appl. Spectrosc. 2018, 85, 953–961. [Google Scholar] [CrossRef]
  73. Wang, W.; Heitschmidt, G.W.; Windham, W.R.; Feldner, P.; Ni, X.; Chu, X. Feasibility of detecting aflatoxin b1 on inoculated maize kernels surface using vis/nir hyperspectral imaging. J. Food Sci. 2015, 80, M116–M122. [Google Scholar] [CrossRef]
  74. Zhao, Y.; He, Y.; Xu, X. A Novel Algorithm for damage recognition on pest-infested oilseed rape leaves. Comput. Electron. Agric. 2012, 89, 41–50. [Google Scholar] [CrossRef]
  75. Thulin, S.; Hill, M.J.; Held, A.; Jones, S.; Woodgate, P. Predicting levels of crude protein, digestibility, lignin and cellulose in temperate pastures using hyperspectral image data. Am. J. Plant Sci. 2014, 5, 997–1019. [Google Scholar] [CrossRef]
  76. Ferreyra, M.L.F.; Serra, P.; Casati, P. Recent Advances on the roles of flavonoids as plant protective molecules after uv and high light exposure. Physiol. Plant. 2021, 173, 736–749. [Google Scholar] [CrossRef]
  77. Shah, A.; Smith, D.L. Flavonoids in agriculture: Chemistry and roles in, biotic and abiotic stress responses, and microbial associations. Agronomy 2020, 10, 1209. [Google Scholar] [CrossRef]
  78. Brugger, A.; Schramowski, P.; Paulus, S.; Steiner, U.; Kersting, K.; Mahlein, A.-K. Spectral signatures in the UV range can be combined with secondary plant metabolites by deep learning to characterize barley–powdery mildew interaction. Plant Pathol. 2021, 70, 1572–1582. [Google Scholar] [CrossRef]
  79. Landi, M.; Tattini, M.; Gould, K.S. Multiple functional roles of anthocyanins in plant-environment interactions. Environ. Exp. Bot. 2015, 119, 4–17. [Google Scholar] [CrossRef]
  80. Steyn, W.J.; Wand, S.J.E.; Holcroft, D.M.; Jacobs, G. Anthocyanins in vegetative tissues: A proposed unified function in photoprotection. New Phytol. 2002, 155, 349–361. [Google Scholar] [CrossRef]
  81. Lev-Yadun, S.; Gould, K.S. Role of anthocyanins in plant defence. In Anthocyanins: Biosynthesis, Functions, and Applications; Winefield, C., Davies, K., Gould, K., Eds.; Springer: New York, NY, USA, 2009; pp. 22–28. [Google Scholar]
  82. Li, X.; Wei, Z.; Peng, F.; Liu, J.; Han, G. Non-destructive prediction and visualization of anthocyanin content in mulberry fruits using hyperspectral imaging. Front. Plant. Sci. 2023, 14, 1137198. [Google Scholar] [CrossRef]
  83. Gitelson, A.A.; Merzlyak, M.N.; Chivkunova, O.B. Optical properties and nondestructive estimation of anthocyanin content in plant leaves. Photochem. Photobiol. 2001, 74, 38–45. [Google Scholar] [CrossRef]
  84. Karpiński, S.; Szechyńska-Hebda, M. Systemic acquired acclimation, network acquired acclimation and cellular light memory in plants–molecular, biochemical, and physiological mechanisms. Adv. Bot. Res. 2023, 105, 277–310. [Google Scholar]
  85. Nisar, N.; Li, L.; Lu, S.; Khin, N.C.; Pogson, B.J. Carotenoid metabolism in plants. Mol. Plant 2015, 8, 68–82. [Google Scholar] [CrossRef]
  86. Yu, K.-Q.; Zhao, Y.-R.; Li, X.-L.; Shao, Y.-N.; Liu, F.; He, Y. Hyperspectral imaging for mapping of total nitrogen spatial distribution in pepper plant. PLoS ONE 2014, 9, e116205. [Google Scholar] [CrossRef] [PubMed]
  87. Tak, Y.; Kumar, M. Phenolics: A key defence secondary metabolite to counter biotic stress. In Plant Phenolics in Sustainable Agriculture: Volume 1; Lone, R., Shuab, R., Kamili, A.N., Eds.; Springer: Singapore, 2020; pp. 309–329. [Google Scholar]
  88. Gautam, A.K.; Singh, P.K.; Aravind, M. Defensive role of plant phenolics against pathogenic microbes for sustainable agriculture. In Plant Phenolics in Sustainable Agriculture: Volume 1; Lone, R., Shuab, R., Kamili, A.N., Eds.; Springer: Singapore, 2020; pp. 579–594. [Google Scholar]
  89. Cocuron, J.-C.; Casas, M.I.; Yang, F.; Grotewold, E.; Alonso, A.P. Beyond the wall: High-throughput quantification of plant soluble and cell-wall bound phenolics by liquid chromatography tandem mass spectrometry. J. Chrom. A 2019, 1589, 93–104. [Google Scholar] [CrossRef] [PubMed]
  90. Dyda, M.; Wąsek, I.; Tyrka, M.; Wędzony, M.; Szechyńska-Hebda, M. Local and systemic regulation of psii efficiency in triticale infected by the hemibiotrophic pathogen Microdochium nivale. Physiol. Plant. 2019, 165, 711–727. [Google Scholar] [CrossRef] [PubMed]
  91. Szechyńska-Hebda, M.; Hebda, M.; Mierzwiński, D.; Kuczyńska, P.; Mirek, M.; Wędzony, M.; van Lammeren, A.; Karpiński, S. Effect of cold-induced changes in physical and chemical leaf properties on the resistance of winter triticale (×Triticosecale) to the fungal pathogen microdochium nivale. Plant. Pathol. 2013, 62, 867–878. [Google Scholar] [CrossRef]
  92. Szechyńska-Hebda, M.; Wȩdzony, M.; Tyrka, M.; Gołȩbiowska, G.; Chrupek, M.; Czyczyło-Mysza, I.; Dubas, E.; Zur, I.; Golemiec, E. Identifying QTLs for cold-induced resistance to microdochium nivale in winter triticale. Plant Gen. Res. Charact. Util. 2011, 9, 296–299. [Google Scholar] [CrossRef]
  93. Kuswidiyanto, L.W.; Kim, D.E.; Fu, T.; Kim, K.S.; Han, X. Detection of black spot disease on kimchi cabbage using hyperspectral imaging and machine learning techniques. Agriculture 2023, 13, 2215. [Google Scholar] [CrossRef]
  94. Saddhe, A.A.; Manuka, R.; Penna, S. Plant sugars: Homeostasis and transport under abiotic stress in plants. Physiol. Plant 2021, 171, 739–755. [Google Scholar] [CrossRef]
  95. Seki, H.; Ma, T.; Murakami, H.; Tsuchikawa, S.; Inagaki, T. Visualization of sugar content distribution of white strawberry by near-infrared hyperspectral imaging. Foods 2023, 12, 931. [Google Scholar] [CrossRef]
  96. Ma, Q.-H. Lignin biosynthesis and its diversified roles in disease resistance. Genes 2024, 15, 295. [Google Scholar] [CrossRef]
  97. Wang, Z.; Skidmore, A.K.; Wang, T.; Darvishzadeh, R.; Hearne, J. Applicability of the PROSPECT model for estimating protein and cellulose + lignin in fresh leaves. Remote Sen. Environ. 2015, 168, 205–218. [Google Scholar] [CrossRef]
  98. He, M.; Li, C.; Cai, Z.; Qi, H.; Zhou, L.; Zhang, C. Leafy vegetable freshness identification using hyperspectral imaging with deep learning approaches. Infr. Phys. Technol. 2024, 138, 105216. [Google Scholar] [CrossRef]
  99. Jiang, R.; Gu, M.; Zhao, Q.; Li, X.; Shen, J.; Su, Z. Identification of pesticide residue types in chinese cabbage based on hyperspectral and convolutional neural network. Spectrosc. Spectral Anal. 2022, 42, 1385. [Google Scholar]
  100. Galodha, A.; Vashisht, R.; Nidamanuri, R.R.; Ramiya, A.M. Deep convolution neural networks with resnet architecture for spectral-spatial classification of drone borne and ground based high resolution hyperspectral imagery. Int. Arch. Photogramm. Remote Sens. Spat. Inf. Sci. 2022, XLIII-B2-2022, 577–584. [Google Scholar] [CrossRef]
  101. Astor, T.; Wachendorf, M. Biomass Estimation of vegetables—Can remote sensing be a tool for it? In The Rural-Urban Interface: An interdisciplinary Research Approach to Urbanisation Processes Around the Indian Megacity Bengaluru; Hoffmann, E., Buerkert, A., von Cramon-Taubadel, S., Umesh, K.B., Pethandlahalli Shivaraj, P., Vazhacharickal, P.J., Eds.; Springer International Publishing: Cham, Switzerland, 2021; pp. 95–102. [Google Scholar]
  102. Na, S.; Park, C.; So, K.; Ahn, H.; Lee, K. Selection on optimal bands to estimateyield of the chinese cabbage using drone-based hyperspectral image. Korean J. Rem. Sens. 2019, 35, 375–387. [Google Scholar]
  103. Suthar, G.; Huang, J.Y.; Chidangil, S. Optimisation and evaluation of hyperspectral imaging system using machine learning algorithm. In Proceedings of the Emerging Imaging And Sensing Technologies for Security and Defence II, SPIE Security + Defence, Warsaw, Poland, 11–14 September 2017; Volume 10438, pp. 121–127. [Google Scholar]
  104. Cheng, S.-X.; Kong, W.-W.; Zhang, C.; Liu, F.; He, Y. Variety recognition of Chinese cabbage seeds by hyperspectral imaging combined with machine learning. Guang Pu Xue Yu Guang Pu Fen Xi 2014, 34, 2519–2522. [Google Scholar] [PubMed]
  105. Chandra, H.; Nidamanuri, R.R. Object-based spectral library for knowledge-transfer-based crop detection in drone-based hyperspectral imagery. Precision Agric. 2024, 26, 6. [Google Scholar] [CrossRef]
  106. Chen, C.-T.; Chen, S.; Wang, C.-Y.; Yang, I.-C.; Hsiao, S.-C.; Tsai, C.-Y. Evaluation of nitrogen content in cabbage seedlings using hyper-spectral images. Sens. Instrum. Food Qual. 2008, 2, 97–102. [Google Scholar] [CrossRef]
  107. Munipalle, V.K.; Nelakuditi, U.R.; Kumar, M.; Nidamanuri, R.R. Ultra-High-resolution hyperspectral imagery datasets for precision agriculture applications. Data Brief 2024, 55, 110649. [Google Scholar] [CrossRef]
  108. Lee, S.-D.; Lee, J.-H.; Kim, J.-H.; Jang, Y.; Moon, J.-H. Evaluation technologies for assessing drought tolerance of kimchi cabbage seedlings using hyperspectral imaging and principal component analysis. Microchem. J. 2024, 206, 111499. [Google Scholar] [CrossRef]
  109. Choi, J.-Y.; Lee, M.; Lee, D.U.; Choi, J.H.; Lee, M.-A.; Min, S.G.; Park, S.H. Non-Destructive monitoring of qualitative properties of salted cabbage using hyperspectral image analysis. LWT 2024, 203, 116329. [Google Scholar] [CrossRef]
  110. Song, H.; Kim, M.; Yoo, K.S.; Ha, J.-H. Rapid and non-destructive classification of salinity levels in brined kimchi cabbage using hyperspectral imaging. Heliyon 2024, 10, e40817. [Google Scholar] [CrossRef] [PubMed]
  111. Choi, J.-Y.; Park, S.H.; Lee, M.-A.; Chung, Y.B.; Yang, J.H.; Cho, J.-S.; Min, S.G. Chemometrics and neural networks for estimating the chilling injury severity of kimchi cabbage (Brassica rapa L. ssp. pekinensis) based on hyperspectral images. LWT 2024, 207, 116601. [Google Scholar] [CrossRef]
  112. Ofori, S.; Abebrese, D.K.; Klement, A.; Provazník, D.; Tomášková, I.; Růžičková, I.; Wanner, J. Impact of treated wastewater on plant growth: Leaf fluorescence, reflectance, and biomass-based assessment. Water Sci. Technol. 2024, 89, 1647–1664. [Google Scholar] [CrossRef] [PubMed]
  113. Fan, Y.; Feng, W.; Qiu, Z.; Wang, S. Identification of early peach aphid infestation based on hyperspectral imaging Technology. J. Beijing Inst. Technol. 2023, 32, 374–383. [Google Scholar]
  114. Zhao, Y.; Yu, K.; Feng, C.; Cen, H.; He, Y. Early detection of aphid (Myzus persicae) Infestation on chinese cabbage by hyperspectral imaging and feature extraction. Trans. ASABE 2017, 60, 1045–1051. [Google Scholar] [CrossRef]
  115. Hu, Z.; Xiang, Y.; Li, Y.; Long, Z.; Liu, A.; Dai, X.; Lei, X.; Tang, Z. Research on identification technology of field pests with protective color characteristics. Appl. Sci. 2022, 12, 3810. [Google Scholar] [CrossRef]
  116. Wu, X.; Zhang, W.; Qiu, Z.; Cen, H.; He, Y. A novel method for detection of pieris rapae larvae on cabbage leaves using nir hyperspectral imaging. Appl. Eng. Agric. 2016, 32, 311–316. [Google Scholar]
  117. Wei, D.; Huang, Y.; Chunjiang, Z.; Xiu, W. Identification of seedling cabbages and weeds using hyperspectral imaging. Int. J. Agric. Biol. Eng. 2015, 8, 65–72. [Google Scholar]
  118. Zu, Q.; Zhang, S.; Cao, Y.; Zhao, H.; Dang, C. Research on identification of cabbages and weeds combining spectral imaging technology and sam taxonomy. Guang Pu Xue Yu Guang Pu Fen Xi 2015, 35, 479–485. [Google Scholar]
  119. Rostás, M.; Bennett, R.; Hilker, M. Comparative physiological responses in chinese cabbage induced by herbivory and fungal infection. J. Chem. Ecol. 2002, 28, 2449–2463. [Google Scholar] [CrossRef]
  120. Mahatma, M.K.; Thawait, L.K.; Jadon, K.S.; Rathod, K.J.; Sodha, K.H.; Bishi, S.K.; Thirumalaisamy, P.P.; Golakiya, B.A. Distinguish Metabolic profiles and defense enzymes in alternaria leaf blight resistant and susceptible genotypes of groundnut. Physiol. Mol. Biol. Plants 2019, 25, 1395–1405. [Google Scholar] [CrossRef] [PubMed]
  121. Siciliano, I.; Gilardi, G.; Ortu, G.; Gisi, U.; Gullino, M.L.; Garibaldi, A. Identification and characterization of alternaria species causing leaf spot on cabbage, cauliflower, wild and cultivated rocket by using molecular and morphological features and mycotoxin production. Eur. J. Plant. Pathol. 2017, 149, 401–413. [Google Scholar] [CrossRef]
  122. Siciliano, I.; Ortu, G.; Gilardi, G.; Gullino, M.L.; Garibaldi, A. Mycotoxin Production in liquid culture and on plants infected with Alternaria spp. isolated from rocket and cabbage. Toxins 2015, 7, 743–754. [Google Scholar] [CrossRef] [PubMed]
  123. Williamson, B.; Tudzynski, B.; Tudzynski, P.; Van Kan, J.A.L. Botrytis Cinerea: The cause of grey mould disease. Mol. Plant Pathol. 2007, 8, 561–580. [Google Scholar] [CrossRef]
  124. Liu, C.-M.; Liu, S.-Y.; Liao, C.-K.; Lo, C.-T.; Lin, K.-C.; Peng, K.-C. Cabbage defense response provoked by trichoderma Th-LAAO. Arch. Microbiol. 2021, 203, 1641–1647. [Google Scholar] [CrossRef]
Figure 1. Arbitrary relative importance (ARI) for hyperspectral band significance in studies of cabbage-based scientific and practical criteria: 1/frequency in the scientific literature (e.g., spectral bands associated with chlorophyll and its degradation, such as 680–750 nm); 2/application in disease diagnostics (e.g., bands enabling early detection of leaf health, like chlorophyll and water changes at 600–750 nm); 3/agricultural relevance (detecting abiotic and biotic stresses, e.g., 800–900 nm for water content in tissues, crop health monitoring and yield loss mitigation e.g., 680–750 nm); 4/chemical substance differentiation (bands that facilitate the detection of phenols or mycotoxins e.g., 900–1000 nm are critical but rarely applied).
Agronomy 15 01516 g001
Figure 2. Equipment for spectral imaging: (A)—hyperspectral camera HERA Iperspettrale (400–1000 nm) based on Fourier transform (FT) spectroscopy; (B)—stand holding with illumination system for the spectral camera (HERA Iperspettrale camera, NIREOS s.r.l., Milan, Italy).
Agronomy 15 01516 g002
Figure 3. Hyperspectral imaging analysis. The full spectrum from chosen pixels for control cabbage plants and plants with early symptoms of grey mould (Grey mould green line) and alternaria (Alternaria green line) in comparison to uninfected control (blue lines). Third line (close to ‘0’ value of Y axix) represent background.
Agronomy 15 01516 g003
Figure 4. Hyperspectral images of control cabbage plants as well as plants with early symptoms of grey mould and alternaria disease across key wavelength ranges representing reflectance of flavonoids, chlorophyll, carotenoids, anthocyanins, phenols, and water changes. Correction of white balance was applied. Software perClass Mira 5.0 (perClass BV, Delft, The Netherlands) was used for spectral feature extraction, supervised classification and regression analysis of hyperspectral image as well as data and visualisation. The scale used as a pseudo-colour “plasma” ranges from dark purple (low values, unhealthy tissues) to yellow (high values, healthy tissues); it defines the scaled reflectance intensity for the selected spectral feature and enables visual differentiation between lesion areas and healthy tissues.
Agronomy 15 01516 g004
Figure 5. Quantitative analysis of changes in hyperspectral reflectance following cabbage infection with grey mould and alternaria. Bar charts present relative changes in reflectance across individual wavelength ranges compared to control plants. Key spectral regions are associated with flavonoids, chlorophyll, carotenoids, anthocyanins, phenols, and water.
Agronomy 15 01516 g005
Figure 6. Correlation between specific wavelengths of hyperspectral reflectance in cabbage: (A)—control plants; (B)—plants with early symptoms of grey mould; (C)—plants with early symptoms of alternaria. Positive correlation (green), negative correlation (red); intensity scale from −1 (red) to 1 (green), with 0 representing lack of correlation (white).
Agronomy 15 01516 g006
Figure 7. Integrated workflow connecting experimental research (plant material selection, spectral data acquisition, and analysis) with field-scale implementation (sensors, UVA, sprayers for different crops and stresses), additionally addressing key limitations and technological solutions within a collaborative framework.
Agronomy 15 01516 g007
Table 1. Comparison of multispectral and hyperspectral imaging techniques.
AspectMultispectral ImagingHyperspectral Imaging
Spectral bands3–10 broad bands, capturing general reflectance patterns indicative of biotic stress.Hundreds of contiguous bands allow detailed spectral signatures of pathogens or specific stress markers.
Spatial resolution/pathogen specificityModerate spatial resolution, identifying stressed areas in fields, like reduced chlorophyll or water content.High spatial resolution allows detailed mapping of infections at the leaf or plant level, enabling differentiation between pathogen types and biochemical changes.
Disease detection stageDetects stress at early to intermediate stages, but not always pathogen-specific.Detects biochemical changes at early stages, often before visible symptoms appear.
Temporal resolutionFaster data acquisition due to fewer bands; suitable for real-time monitoring.Slower due to detailed data acquisition, requiring higher computational capacity.
Environmental conditionsModerate performance in varying weather conditions.Sensitive to environmental variability (e.g., light, humidity), impacting data quality.
Integration potentialEasily integrates with drone and satellite systems for real-time data acquisition.Requires specialised computational tools for processing and analysing large datasets.
Integration with modelsProduces smaller datasets, is easier to store and analyse, and easily integrates with simple stress detection models.Generates large datasets, requiring robust computational infrastructure for analysis and advanced machine learning or AI-based models for analysis and prediction.
Scalability for farmsSuitable for large-scale, low-cost deployment using drones or satellites.Best for high-value crops or research settings due to cost and complexity.
UsersRelatively simple operation and minimal expertise required; more accessible to farmers and agricultural practitioners.Requires skilled operators and advanced analytical tools, limiting its use to advanced research or high-value production.
Table 2. Characteristic spectral bands in plant leaves and corresponding plant physiological markers or stress responses.
Band (nm)IdentificationMonitoringReferences
430–500
550–560
800–810
Chlorophyll a and bLeaf health, early disease symptoms, photosynthetic efficiency[18,23,30,31,32,33,34]
680–750Chlorophyll degradationPhotosynthetic efficiency[35,36]
200–380
400–450
680–800
870–900
940, 1080 1190, 1470 1850, 2245
430–500Stress response, antioxidant activity[37,38,39,40]
550–560
700–710
750–770
780–790
910–950
AnthocyaninStress-induced pigmentation, signalling in pathogen defence[15,23,34,40,41,42,43,44,45]
400–580
510, 700
825
CarotenoidsOxidative stress, early infection detection[23,34,46,47]
500–570
677, 803
XanthophyllOxidative stress, early infection detection[34,37,48,49]
495–754
648–650
790, 970
Nitrogen contentPhotosynthetic efficiency, nitrogen availability[50,51,52,53,54]
542–752
800–1529
Changes in water/pigment contentPathogen presence/Abiotic and biotic stress[24,43,55,56,57,58,59,60,61,62,63]
430–567
601–1002
900–1700
PolyphenolsPlant defensive response to infections[30,40,45,64,65,66]
406–489
505–573
636–696
735–780
823–878
901–999
Mycotoxins by pathogensFungal metabolites/plant responses[43,58,66,67,68,69,70,71,72,73,74]
870–900
972–1450
1052–1254
1940
SugarCarbohydrate storage and translocation[40,56,61]
970–1450
1600–1800
2100–2300
Lignin/cellulose/proteinsStructural integrity, mechanical stress[39,56,73,75]
Table 3. Applications of hyperspectral imaging in cabbage research: summary of studies on yield, abiotic stress, and biotic stress.
SpeciesAim of StudyBands (nm)Reference
Yield quantity and quality
Chinese cabbageFreshness identification874–1734[98]
Chinese cabbagePesticide (chlorpyrifos, dimethoate, methomyl, cypermethrin)400–1000[99]
CabbageSpatial crop classification450–980[100]
CabbageBiomass estimation 470–950[101]
Chinese cabbageYield estimation 403–995[102]
CabbagePhysiology, morphology, composition400–1000[103]
Chinese cabbage Variety recognition (seeds)874–1734[104]
Abiotic stress
CabbageNitrogen level/content400–1090[105,106,107]
Kimchi cabbageDrought tolerance 680–700[108]
Kimchi cabbageSalinity level 874–1734[109,110]
Kimchi cabbageChilling injury874–1734[111]
Napa cabbage Wastewater treatment400–1000[112]
Biotic stress
Kimchi cabbageAlternaria dark spot400–1000[93]
Kimchi cabbageDowny mildew disease400–1000[43]
Green cabbage/
Chinese cabbage
Aphid infestation450–1000/
380–1030
[113,114]
Napa cabbageSoft rot disease900–1700[66]
CabbageField pest identificationn/a[115]
Cabbage Disease clubroot 400–1000[32]
CabbagePieris rapae larvae 1000–1600[116]
CabbageCabbage seedling vs weed identification1000–2500[117,118]
Table 4. Quantitative analysis of changes in hyperspectral reflectance following cabbage infection with grey mould and alternaria. Statistical analysis for the data presented in Figure 5 was performed using one-way ANOVA, followed by pairwise two-sample t-tests assuming equal variances (for comparisons between infected and control samples). Significance levels indicated as * p ≤ 0.05, ** p ≤ 0.01, and *** p ≤ 0.001 (Student’s t-test). To assess the magnitude of reflectance differences, effect sizes were calculated using Cohen’s d.
WavelengthControlGrey MoldAlternaria
(nm)AvrSTDAvrSTDP(0.05) Cohen’s dAvrSTDP(0.05) Cohen’s d
Flavonoids400–450159.4524.21379.9855.371.89 × 10−5***5.16523.12302.161.39 × 10−2*1.70
Chlorophyll430–4501.780.276.701.251.24 × 10−5***5.477.062.477.21 × 10−4***3.01
Carotenoids470–5202.920.285.280.684.70 × 10−5***4.545.571.052.96 × 10−4***3.46
Xanthophylls520–6006.570.5810.271.626.75 × 10−4***3.0410.572.177.24 × 10−7***2.51
Anthocyanins550–5600.890.091.360.161.14 × 10−8***3.611.450.291.53 × 10−3**2.65
Chlorophyll a680–7001.680.262.600.672.35 × 10−4***1.822.7800.414.36 × 10−4***3.26
Anthocyanins700–7101.030.061.780.473.44 × 10−1 2.231.890.195.65 × 10−6***6.09
Anthocyanins780–7901.900.123.160.835.62 × 10−2 2.113.520.841.36 × 10−3**2.70
Resveratrol700–7508.984.6611.852.861.37 × 10−1 0.7412.541.430.07 1.03
Resveratrol718–7220.710.061.210.292.29 × 10−3**2.461.270.127.68 × 10−6***5.84
Water 800–90019.601.1130.287.416.44 × 10−3**2.0136.2810.073.10 × 10−3**2.33
Polyphenols/lignins900–100054.918.9453.4921.564.47 × 10−1 −0.0940.757.071.20 × 10−2*−1.76
Disclaimer/Publisher’s Note: The statements, opinions and data contained in all publications are solely those of the individual author(s) and contributor(s) and not of MDPI and/or the editor(s). MDPI and/or the editor(s) disclaim responsibility for any injury to people or property resulting from any ideas, methods, instructions or products referred to in the content.

