Article

GYS-RT-DETR: A Lightweight Citrus Disease Detection Model Based on Integrated Adaptive Pruning and Dynamic Knowledge Distillation

Mechanical and Electrical Engineering College, Yunnan Agricultural University, Kunming 650201, China
*
Author to whom correspondence should be addressed.
Agronomy 2025, 15(7), 1515; https://doi.org/10.3390/agronomy15071515 (registering DOI)
Submission received: 12 May 2025 / Revised: 14 June 2025 / Accepted: 16 June 2025 / Published: 22 June 2025
(This article belongs to the Section Precision and Digital Agriculture)

Abstract

:
Given the serious economic burden that citrus diseases impose on fruit farmers and related industries, achieving rapid and accurate disease detection is particularly crucial. In response to the challenges posed by resource-limited platforms and complex backgrounds, this paper designs and proposes a lightweight method for the identification and localization of citrus diseases based on the RT-DETR-r18 model—GYS-RT-DETR. This paper proposes an optimization method for target detection that significantly enhances model performance through multi-dimensional technology integration. First, this paper introduces the following innovations in model structure: (1) A Gather-and-Distribute Mechanism is introduced in the Neck section, which effectively enhances the model’s ability to detect medium to large targets through global feature fusion and high-level information injection.(2) Scale Sequence Feature Fusion (SSFF) is used to optimize the Neck structure to improve the detection performance of the model for small targets in complex environments. (3) The Focaler-ShapeIoU loss function is used to solve the problems of unbalanced training samples and inaccurate positioning. Secondly, the model adopts two model optimization strategies: (1) The Group_taylor local pruning algorithm is used to reduce memory occupation and the number of computing parameters of the model. (2) The feature-logic knowledge distillation framework is proposed and adopted to solve the problem of information loss caused by the structural difference between teachers and students, and to ensure a good detection performance, while realizing the lightweight character of the model. The experimental results show that the GYS-RT-DETR model has a precision of 79.1%, a recall of 77.9%, an F1 score of 78.0%, a model size of 23.0 MB, and an mAP value of 77.8%. Compared to the original model, the precision, recall, the F1 score, the mAP value, and the FPS value have improved by 3.5%, 5.3%, 5.0%, 5.3%, and 10.3 f/s, respectively. Additionally, the memory usage of the GYS-RT-DETR model has decreased by 25.5 MB compared to the original model. The GYS-RT-DETR model proposed in this article can effectively detect various citrus diseases in complex backgrounds, addressing the time-consuming nature of manual detection and improving the accuracy of model detection, thereby providing an effective theoretical basis for the automated detection of citrus diseases.

1. Introduction

Yunnan is one of the central origins of citrus in the world, and it is also the dominant production area of extra-early and very late-maturing citrus in China [1]. Since the beginning of the 21st century, the citrus industry in Yunnan has continued to develop rapidly, and the planting area has expanded, making it one of the important citrus- producing areas [2]. According to the data from the National Bureau of Statistics and the Yunnan Statistical Yearbook, the total area of citrus planting in the Province in 2021 was 135,000 hm2, with a total output of 2,437,700 tons, which was distributed among 16 prefectures. With the rapid development of science and technology, the timely detection and prevention of citrus diseases is an inevitable trend of citrus informatization and scientific planting [3,4,5].
In recent years, many researchers have achieved certain research results in the field of citrus disease identification [6,7,8,9,10,11,12,13]. However, these studies cannot be directly applied to real-world scenarios in complex contexts. The main challenges include the presence of multiple interfering factors, such as weeds, healthy leaves, overlapping leaves, and other diseased leaves, in a complex context, which make it difficult for the existing models to accurately and efficiently detect and locate citrus disease targets. In addition, the shape and scale of diseased citrus fruits are different, and some diseased fruits are easily blocked by leaves, so it is easy to miss them during the detection process. In 2023, the RT-DETR model by the Baidu Flying Pulp team outperformed the YOLO series in detecting small targets against complex backgrounds after 100 rounds of fine-tuning, demonstrating its technical advantages in object detection [14].
This paper designs and proposes a lightweight citrus disease detection and localization model, GYS-RT-DETR, which provides favorable conditions for deployment using edge devices, ensuring that citrus disease detection can be applied in real-time within agricultural scenarios. Based on the RT-DETR-r18 model as the benchmark model, this paper introduces the GD collection and distribution mechanism and the SSFF (Scale Sequence Feature Fusion) mechanism into the Neck network, which, respectively, improves the feature extraction and feature fusion capabilities of the Neck network for feature maps of different scales, and expands the receptive field of feature maps of different scales. The Focaler-ShapeIoU [15] loss function is used to alleviate the problem of imbalance in the model training samples and the accuracy of model prediction and positioning. In order to make the model lightweight, the Group_taylor [16] pruning strategy and the feature-logic distillation framework are used to optimize the recognition performance, memory footprint, and computational complexity of the model.
The main contributions of this article are as follows:
  • Model innovation: An innovative, GYS-RT-DETR, first-order object detection model is proposed. By introducing the GD mechanism and the SSFF mechanism, the Neck network structure of the original model is greatly improved. By using the Focaler-shapeIoU loss function, the recognition performance of the model is improved, and the problem of an unbalanced sample size during model training is solved.
  • Lightweight model: Compared with the original model, the proposed GYS-RT-DETR model has improved memory usage and computational complexity. The Group_taylor pruning strategy greatly reduces the memory footprint and computational complexity of the GYS-RT-DETR model, which makes it easy to deploy edge devices.
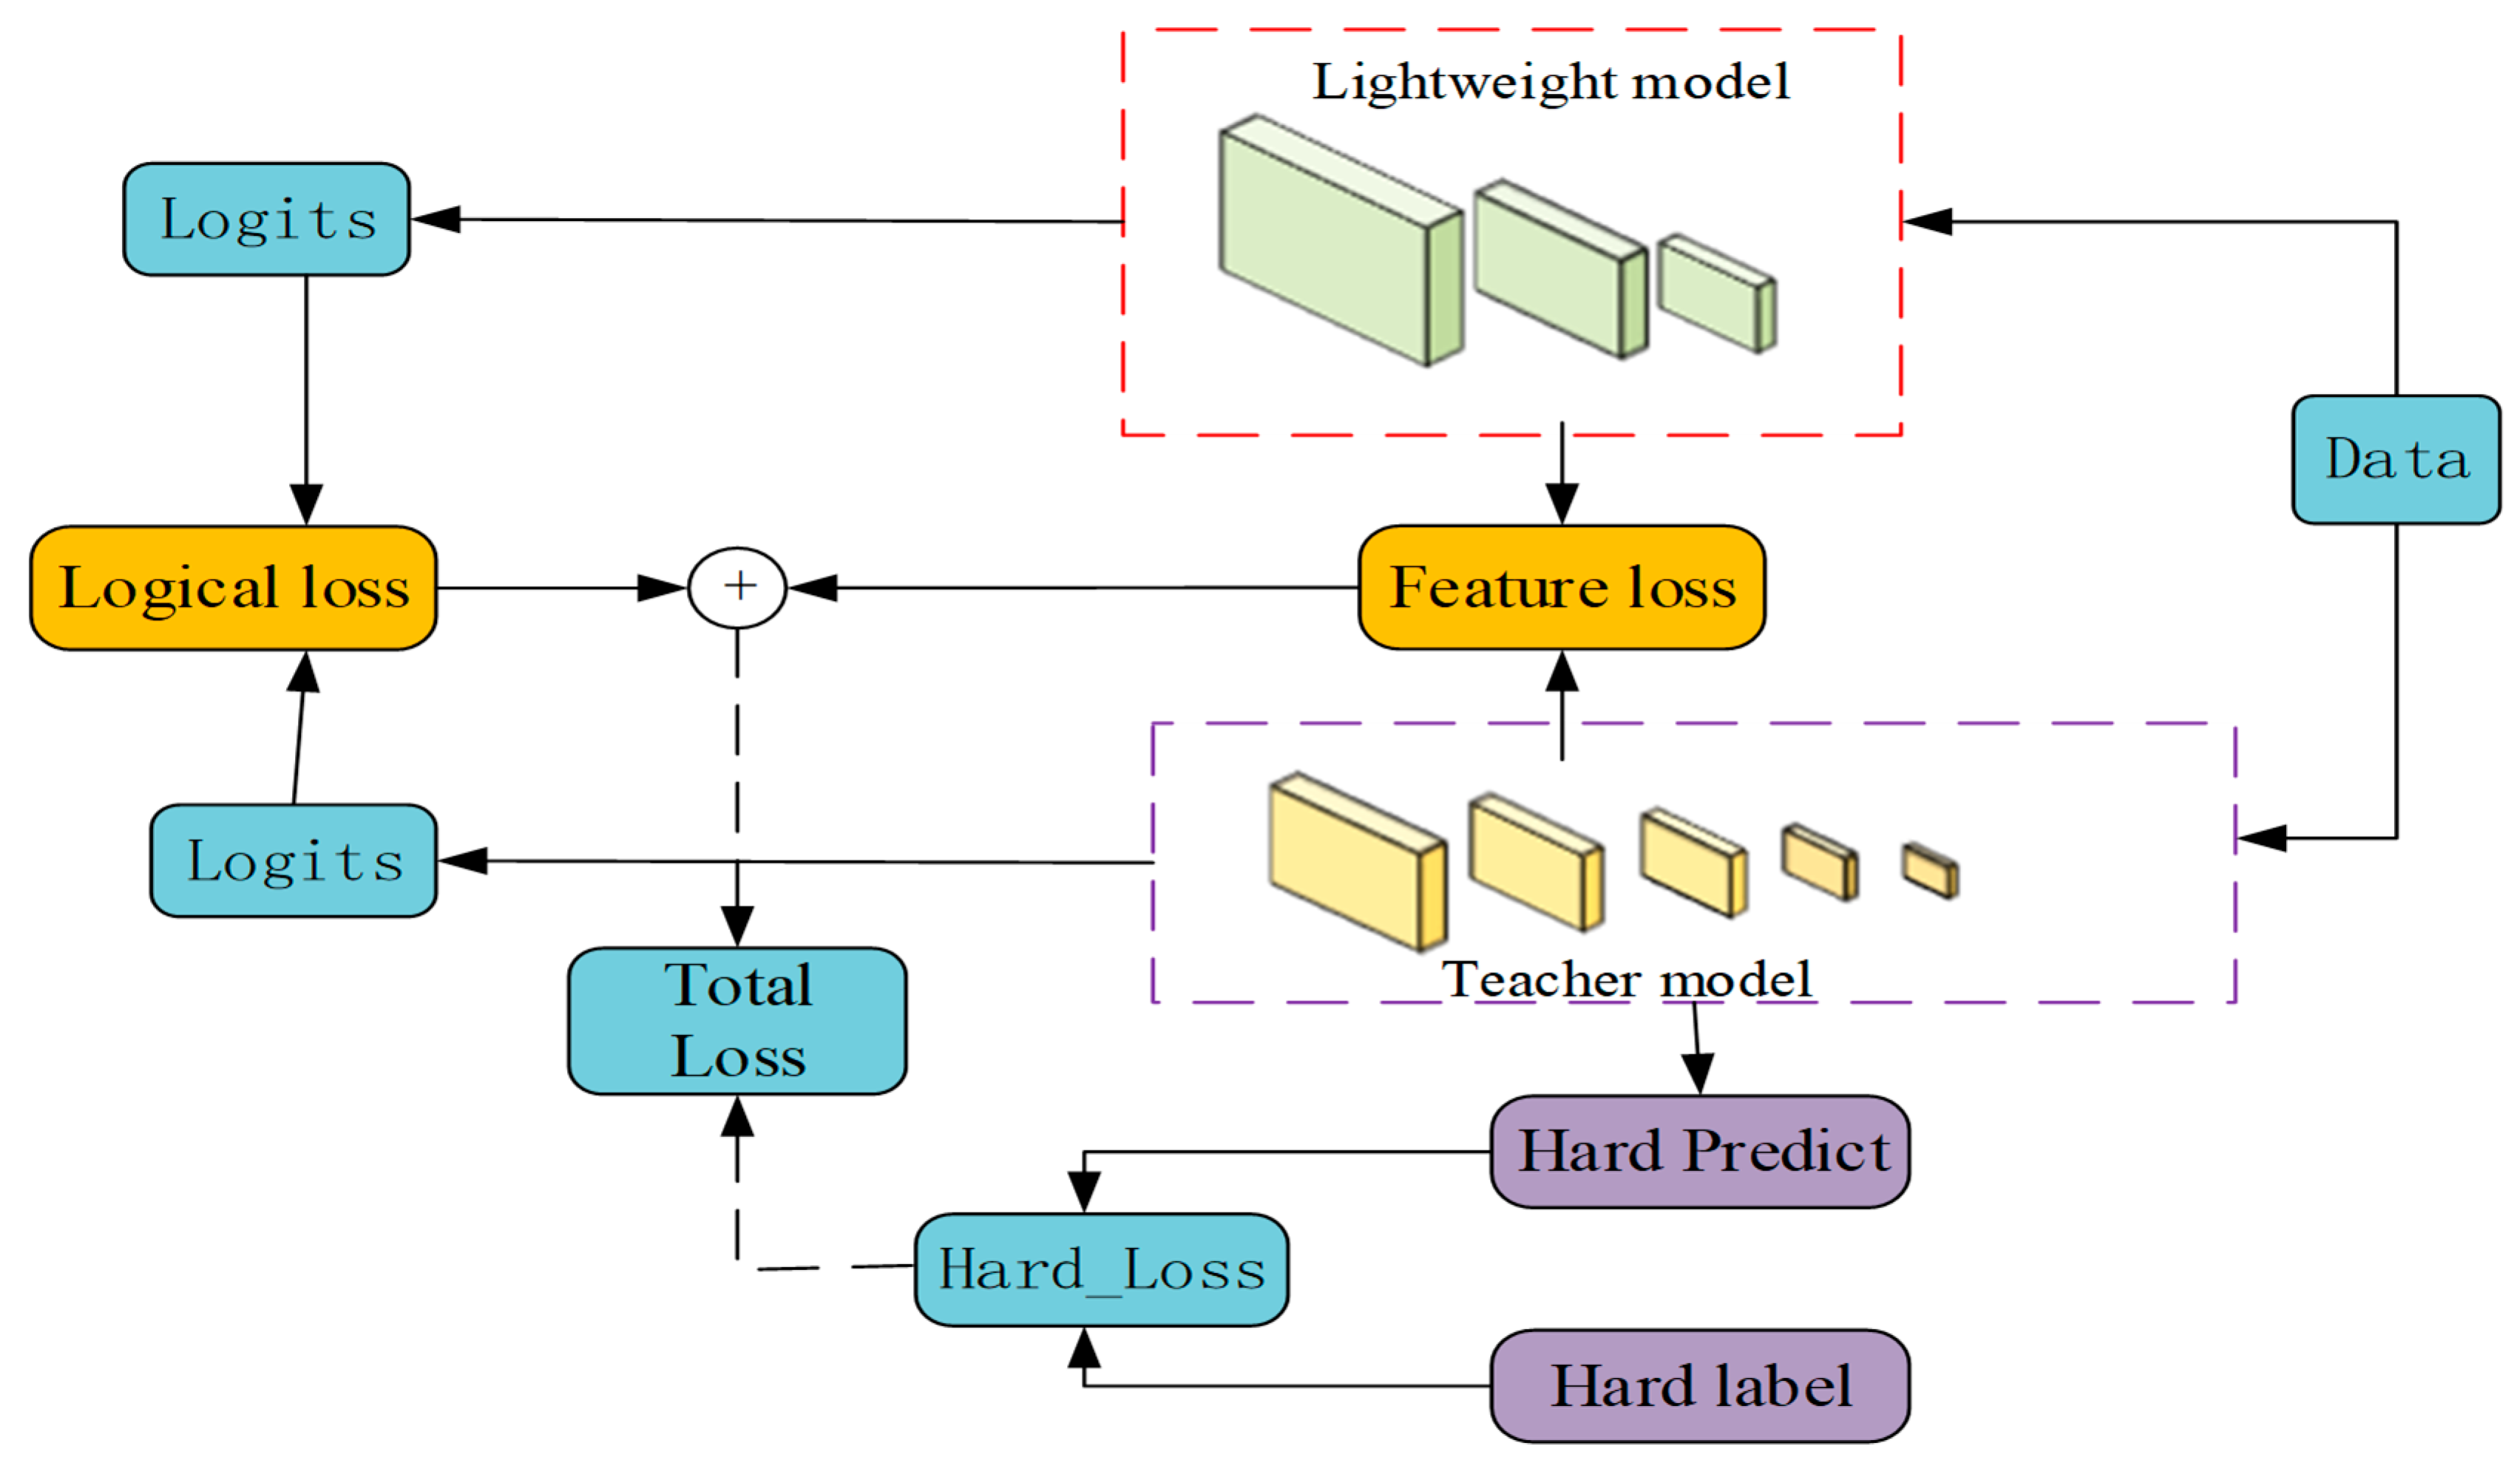
  • Knowledge distillation framework: A knowledge framework combining feature-logic distillation is proposed, which takes the pruning optimization model as the student model and RT-DETR-r50 as the teacher model, which can effectively solve the problem of information loss caused by the structural difference between the teacher and the students, and ensure a good detection performance, while realizing making the model lightweight.

2. Experiment Materials

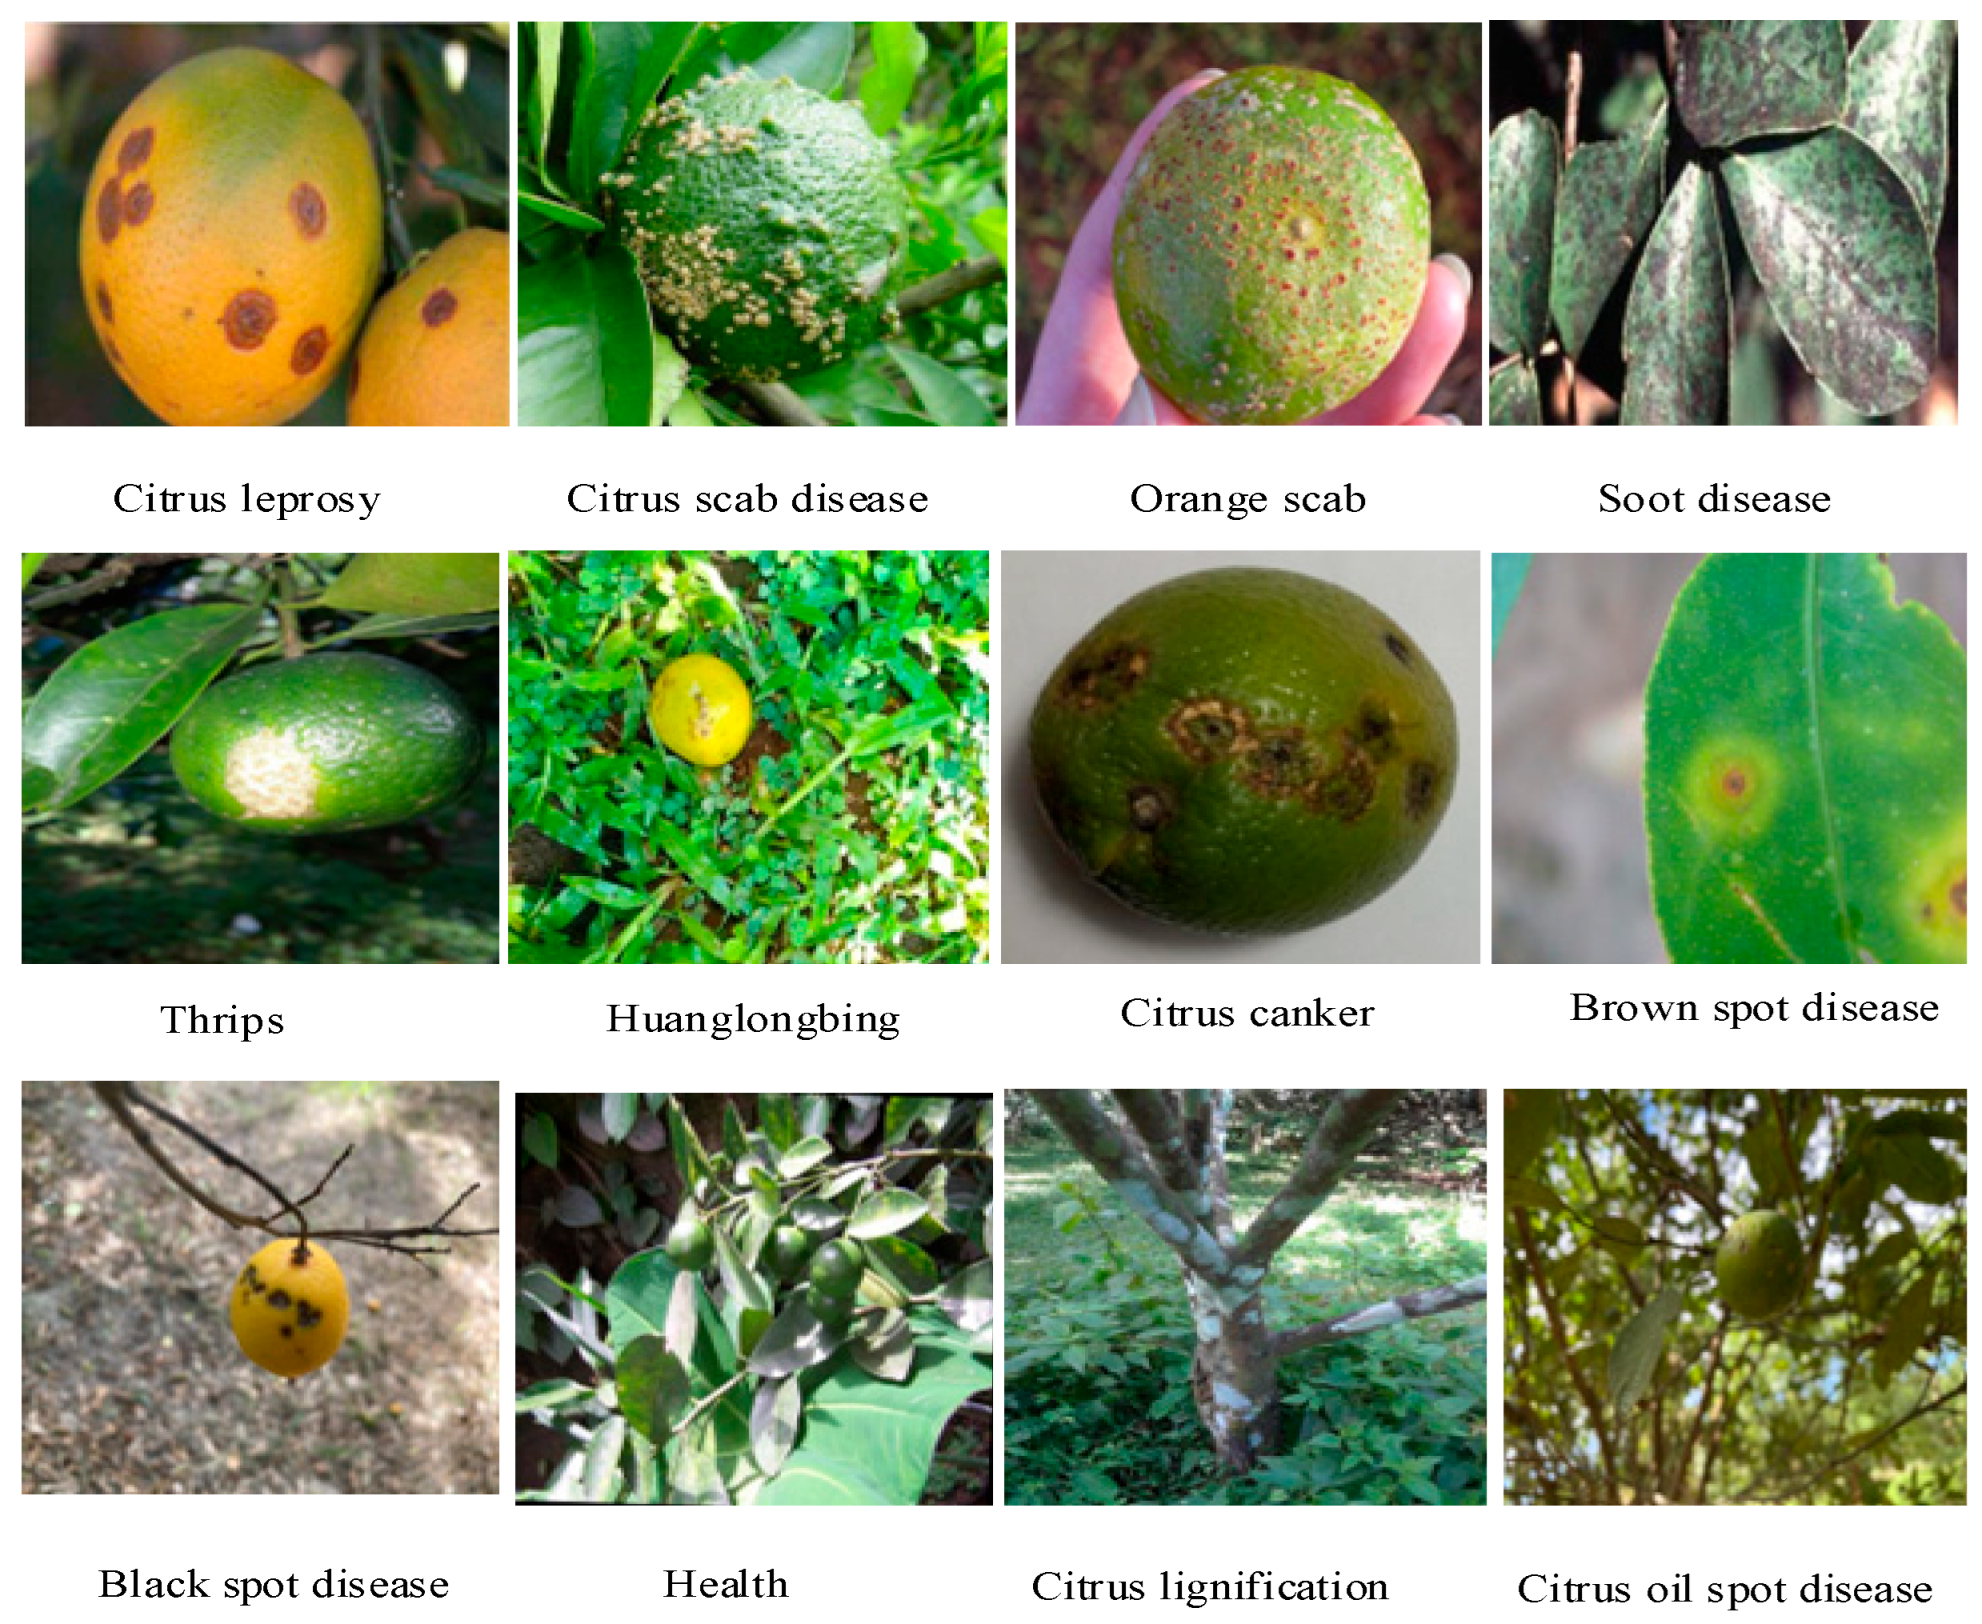
2.1. Data Collection

The main data collection locations are Man Village, Mosha Town, Xinping Yi Dai Autonomous County, Yunnan Province, Ode Village, Mosha Town, Xinping Yi Dai Autonomous County, Yunnan Province, and Nanbang Community, Gasa Town, Xinping Yi Dai Autonomous County, and Yunnan Province. The data collection period was the fruit setting period of citrus fruit trees. The data acquisition tool is the Intel D455 camera. Images were captured under various lighting conditions to ensure robustness against different environmental factors, and the selection of disease characteristics is guided by relevant farmers and experts. The experimental dataset contains a total of 2377 images in 12 categories, and the data types and number structures are shown in Table 1. Some of the datasets are shown in Figure 1.

2.2. Dataset Creation and Operating Environment

First, data cleaning and data augmentation were performed on the dataset; this was then divided into training, validation, and test sets in a ratio of 7:2:1. The validation and test sets are composed of new images that are independent of the training set to ensure an unbiased evaluation of the model’s performance. The labeling work is completed using the labeling software (version 1.8.6).
The experimental environment used a PC configuration, including an AMD Ryzen 9 5900X 12-core processor and an RTX 4090 24G GPU, running on Ubuntu 22.04. The types of citrus diseases in the dataset are classified sequentially, with each specific disease being categorized into one class.

3. Research Methods

3.1. Model Design

3.1.1. GYS-RT-DETR Network Structure

This paper improves upon the RT-DETR-r18 baseline model to develop the GYS-RT-DETR model for real-time detection of citrus diseases. The improvements to the model mainly involve significant changes to the Neck part, utilizing the GD mechanism and the SSFF scale sequence fusion mechanism to enhance the internal information exchange capability of the model and strengthen the network’s ability to learn multi-scale feature information. The improved model’s network structure is shown in Figure 2.

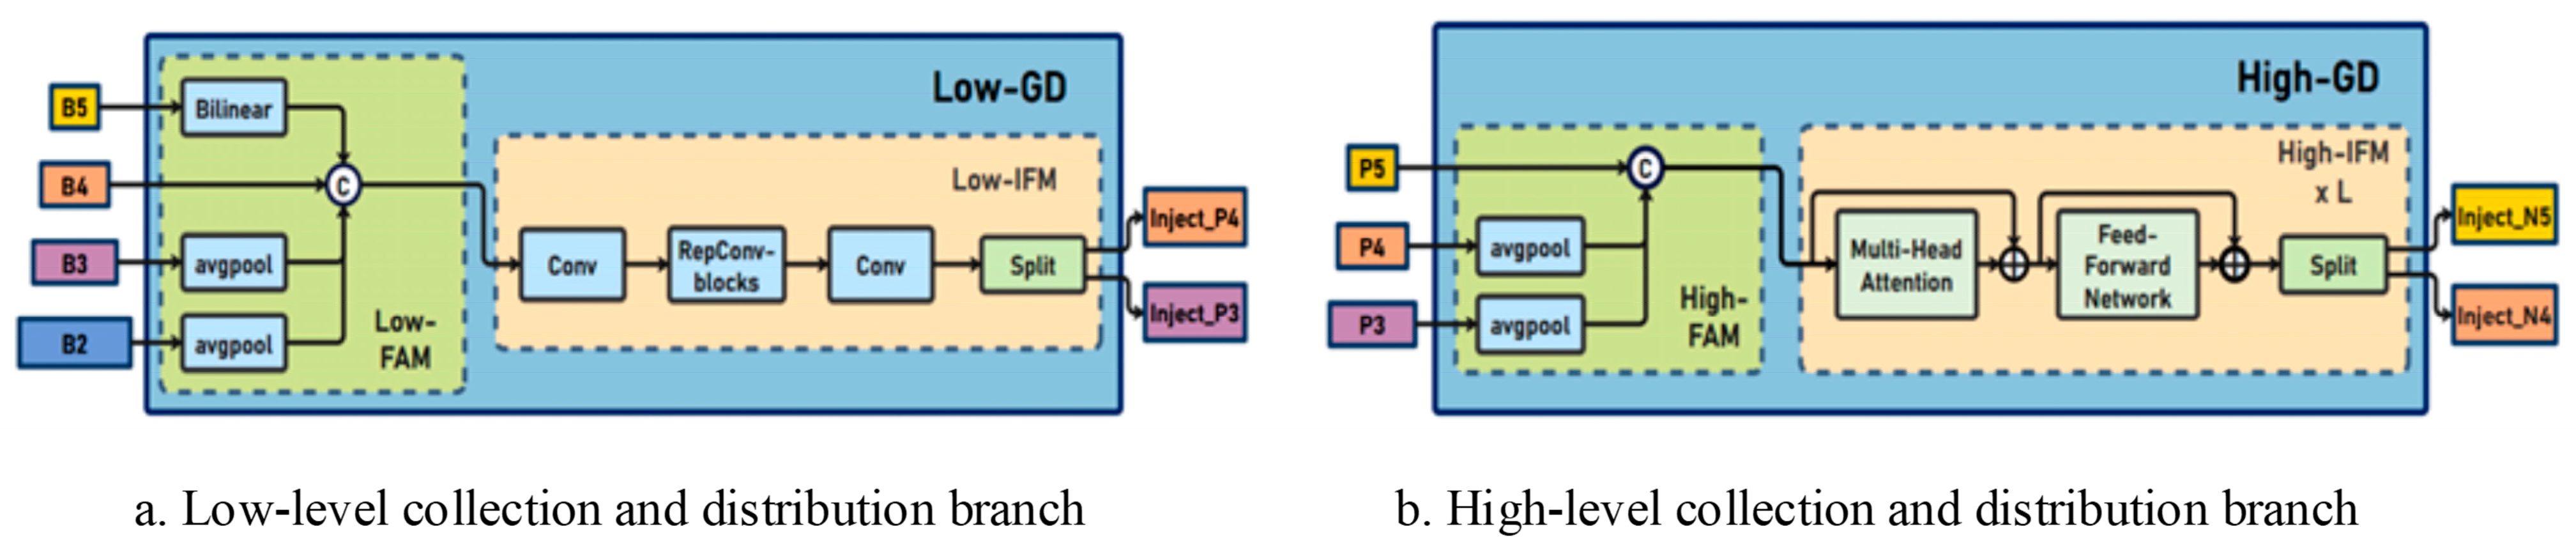
3.1.2. GD Collection and Distribution Mechanism

Wang et al. [17] proposed a collection and distribution mechanism for effective information exchange in YOLO by integrating multi-level features globally and injecting global information into higher levels. The GD mechanism includes two collection and distribution mechanisms—a low-level collection and distribution branch, and a high-level collection and distribution branch—and its basic principle is shown in Figure 3.
(1)
As shown in Figure 3a, the low-level GD structure is mainly composed of two key modules: the low-level feature alignment module (Low-FAM) and the low-level information fusion module (Low-IFM). The input features are downsampled by using the average pooling operation in the low-level feature alignment module to unify the feature size to the minimum size of the group, so as to obtain accurate low-level feature alignment information. The low-level information fusion module consists of multi-layer reparametrized convolutional blocks (RepBlocks) and segmentation operations. In order to improve the effective integration of global information between different levels, the attention mechanism is introduced, and the deep integration of information is realized.
(2)
As shown in Figure 3b, the high-level GD structure is mainly composed of two key modules: the high-level feature alignment module (High-FAM) and the high-level information fusion module (High-IFM). The advanced feature alignment module consists of an average pooling layer that maps the dimensions of the input features to a uniform size. The advanced information fusion module mainly includes the Transformer module and the splitting operation. Each Transformer module includes a multi-head attention block, a feedforward network (FFN), and a residual connection, and since the Transformer module extracts high-level information, the pooling operation facilitates information aggregation and reduces the subsequent computational complexity in the Transformer module. This not only ensures that the model inference is not affected by the multi-head attention mechanism, which leads to performance degradation, but also improves the effective integration of global information between different levels.
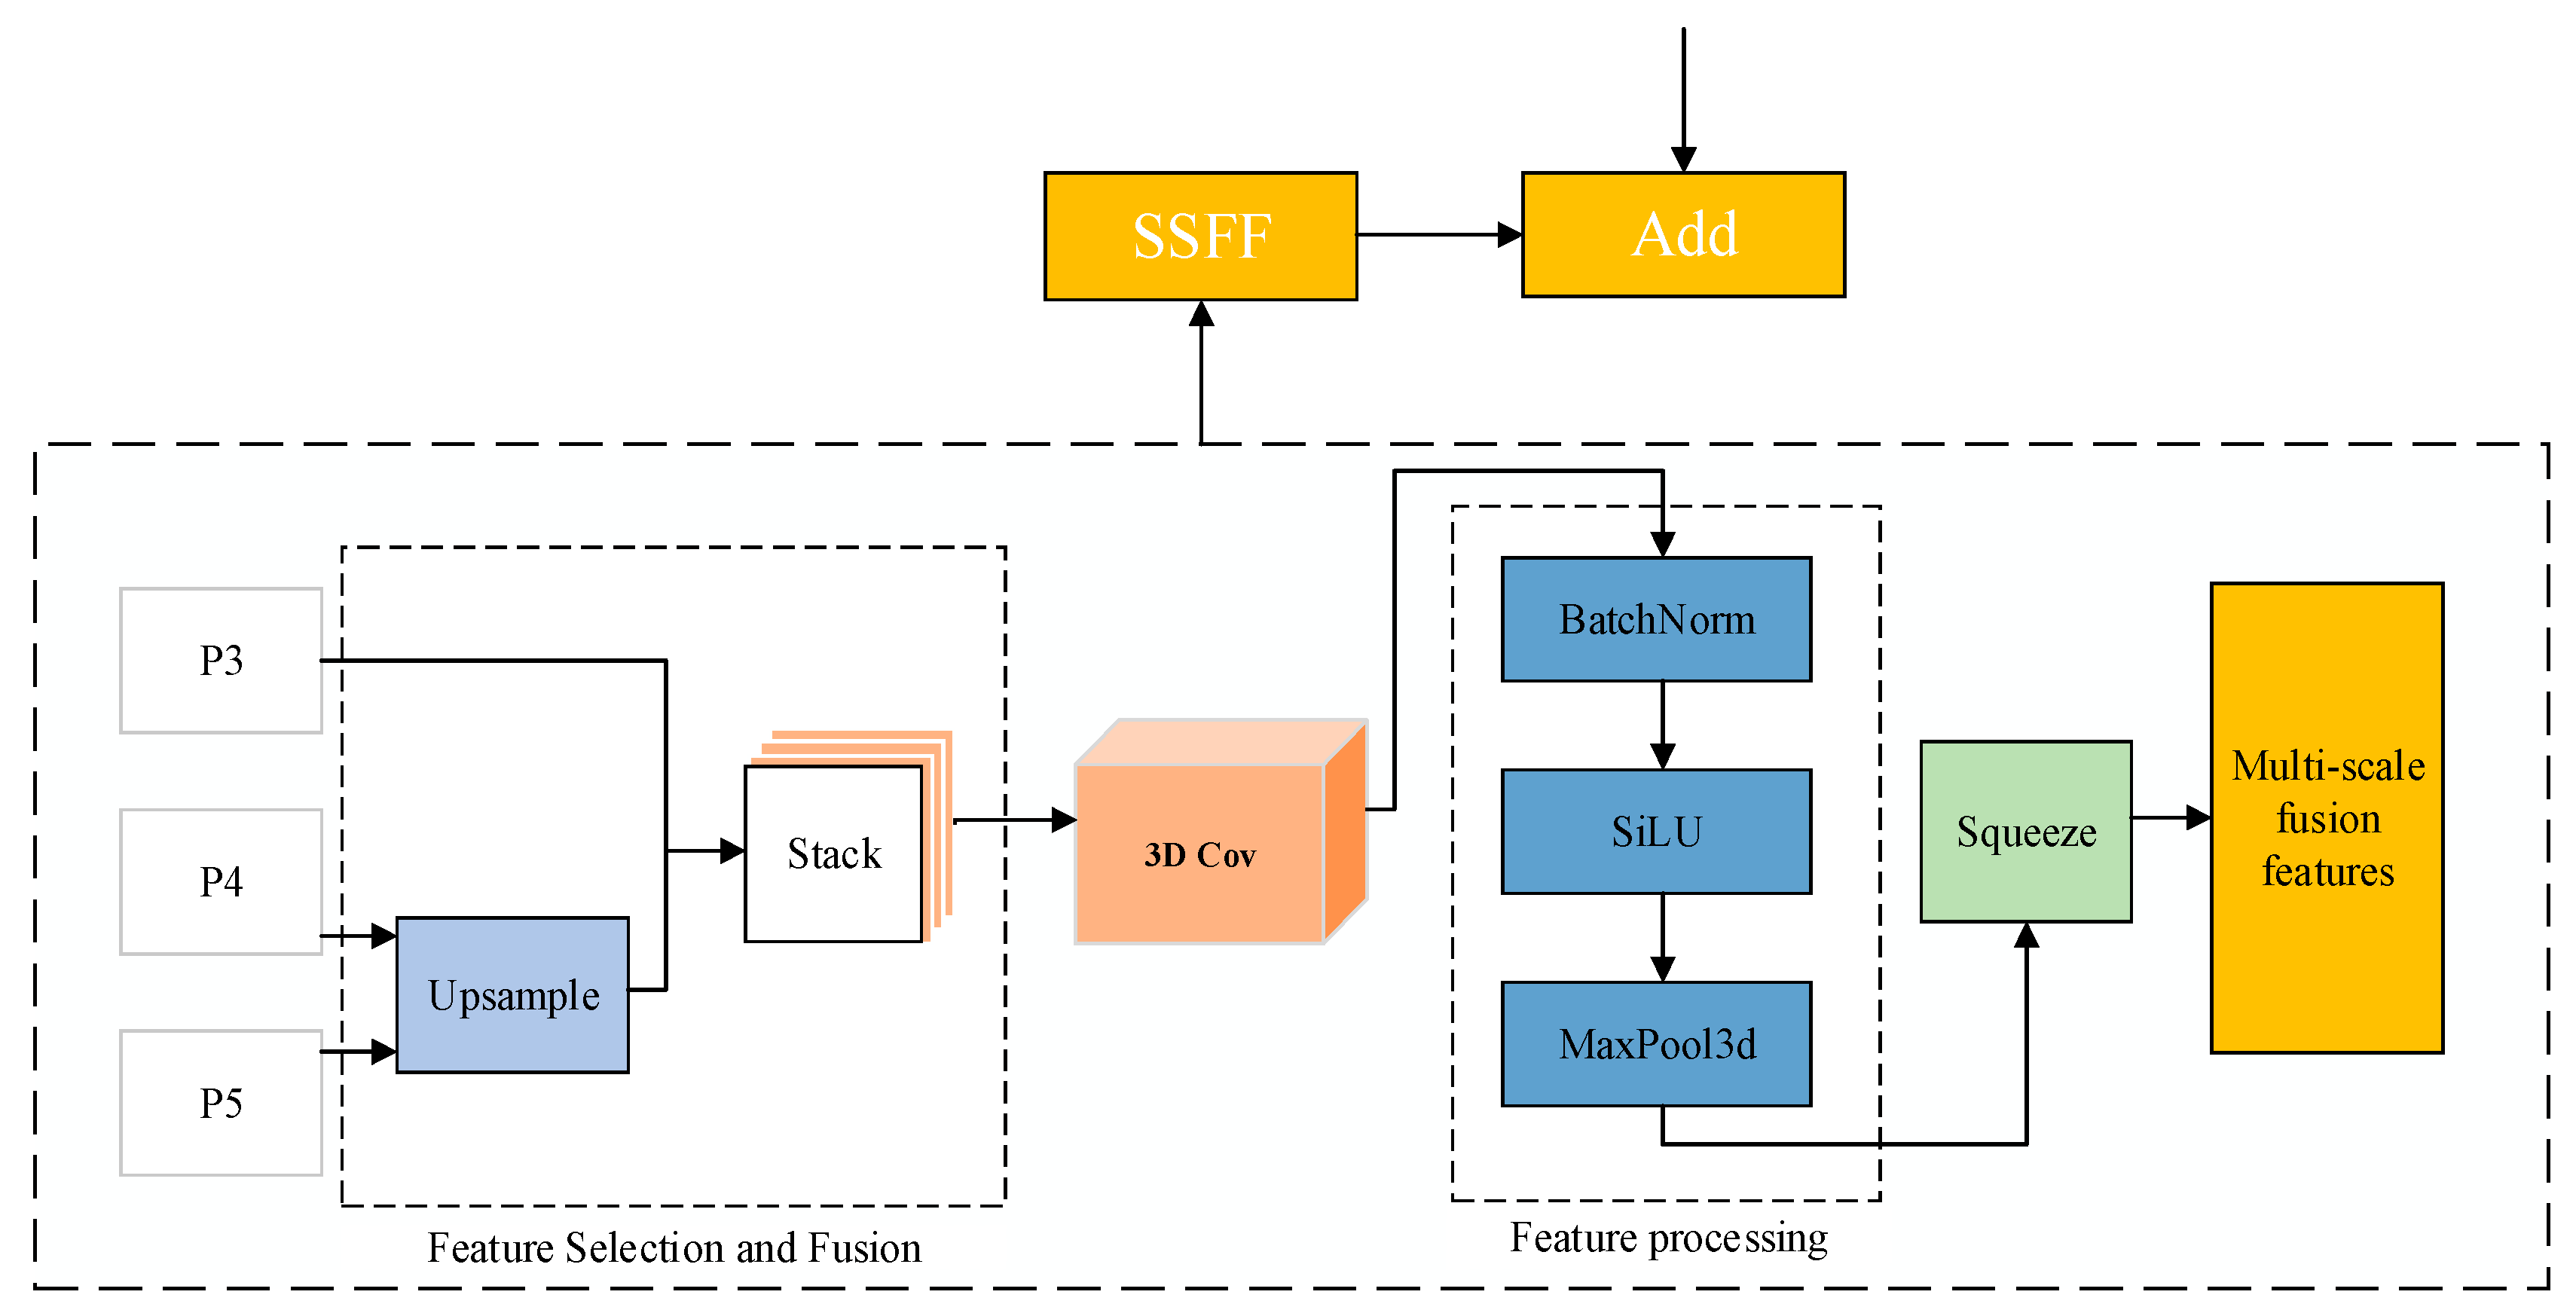
3.1.3. SSFF Module

On the basis of the YOLO segmentation framework, Kang et al. [18] enhanced the multi-scale information extraction capability of the network by using the Scale Sequence Feature Fusion (SSFF) module, which used the Triple Feature Encoder (TPE) module to fuse feature maps at different scales to increase detailed information. As shown in Figure 4, the SSFF module stacks the upsampled feature information as the input of the 3D convolutional network. At the same time, the SSFF module passes through the BN, SiLU activation function and MaxPool3d maximum pooling layer, respectively. Finally, the shape of the feature matrix is transformed by Squeeze and the filtered feature information is output.
It is worth noting that since the P3-level feature information contains important information for small target detection, the input of the SSFF module only upsamples the feature information at the P4 and P5 levels. Such processing can not only expand the feature receptive field and increase the representation information of small targets, but also help to integrate multi-scale sequence features. At the same time, the maximum pooling layer is added at the tail end of the SSFF network structure to reduce redundant information and speed up network inference.

3.1.4. Neck Network Structure Design

Figure 5 shows the difference between the network structure before and after the improvement. In the figure, B2, B3, B4, and B5 represent the feature maps extracted by the backbone network. The sizes are as follows: B 2 R N × C × H × W , B 3 R N × 2 C × H 2 × W 2 , B 4 R N × 4 C × H 4 × W 4 , B 5 R N × 8 C × H 8 × W 8 . At the same time, N, C, H, and W represent the batch size, number of channels, height of the feature map, and width of the feature map, respectively. P3, P4, and P5 represent feature maps that contain feature information for small, medium, and large targets, respectively.

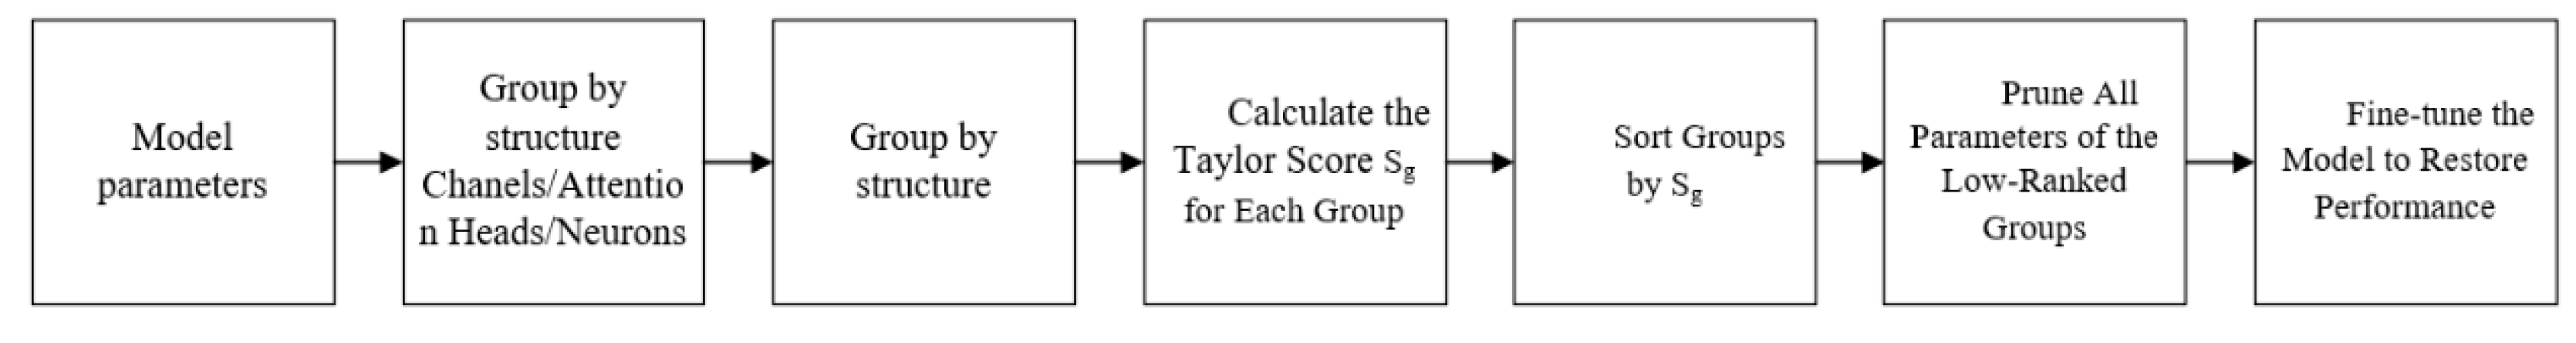
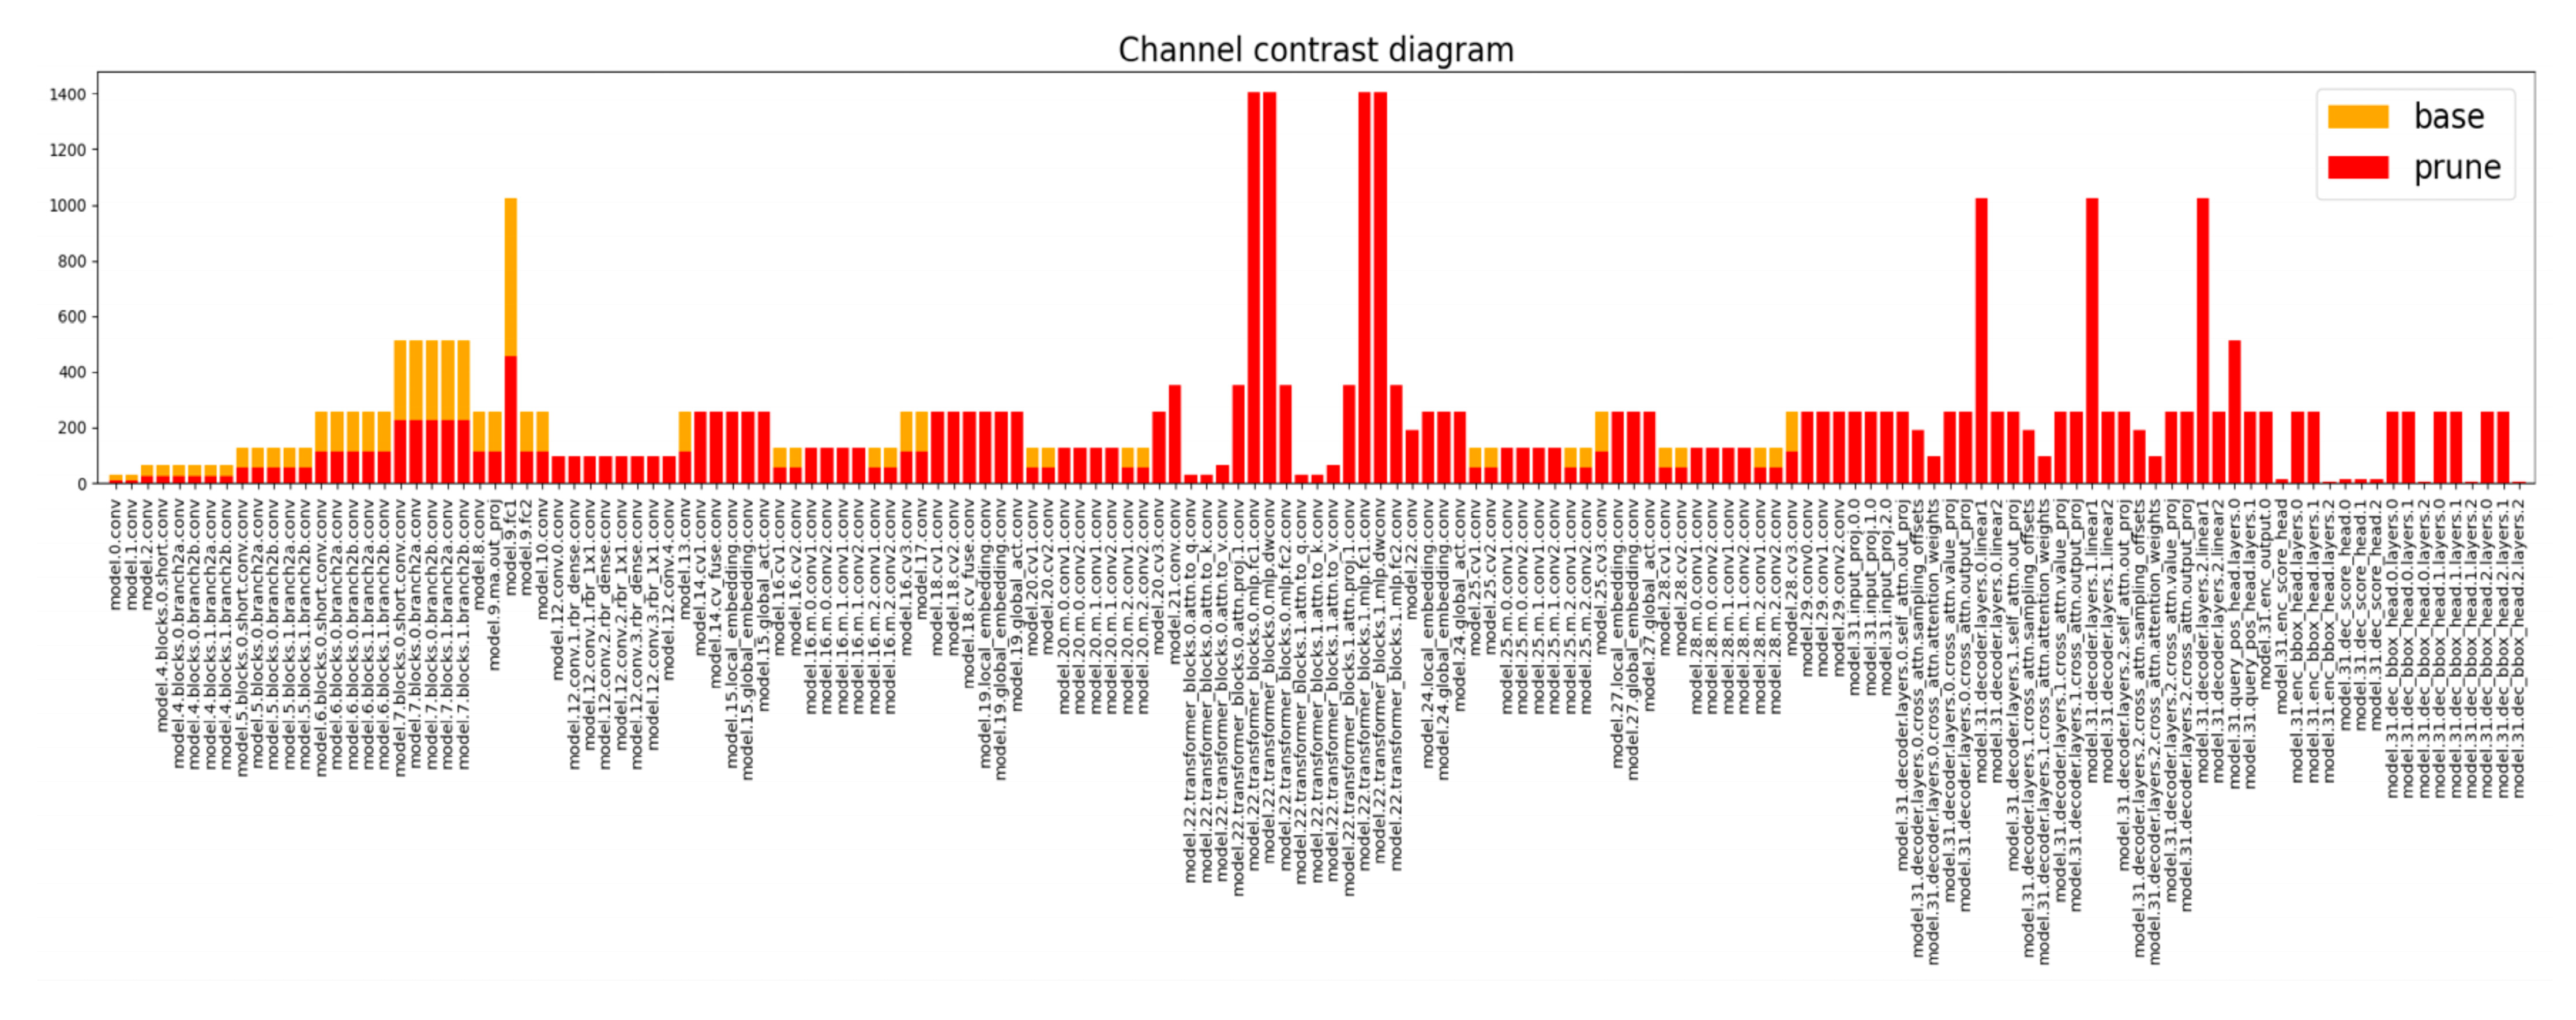
3.2. Group_Taylor Pruning Strategy

Group_taylor pruning is a structured pruning method based on Taylor unfolding, which divides neural network parameters into groups according to specific rules, and then prunes them in groups, reducing model complexity by evaluating the impact of groups of neurons (such as convolutional kernels or channels) on the loss function and removing the groups with smaller contributions. The Group_taylor pruning strategy process can be shown in Figure 6.
Group_taylor pruning can reduce the scale of the model and balance computational efficiency and the model performance. Firstly, the Taylor expansion importance evaluation method preferentially prunes out the groups that have less impact on the output of the model, so as to compress the model while maintaining the accuracy of the model. Secondly, group-level pruning ensures the integrity of the filter, avoids the unstructured pruning affecting computational efficiency, and can be better used for hardware acceleration.

3.3. Feature-Logic Distillation Framework

As shown in Figure 7, the feature-knowledge distillation framework constructed in this paper uses a pruned model as the student model and RT-DETR-r50 as the teacher model. This framework integrates a dual strategy of feature distillation and logic distillation: on one hand, feature distillation calculates the loss between the intermediate network layers of the teacher model and the student model; on the other hand, logic distillation calculates the loss between the output layers of the student model and the teacher model. Ultimately, by integrating the output layer loss, intermediate layer loss, and the student model’s own loss, a comprehensive loss function is formed. This ensures that the feature extraction and feature fusion capabilities of a certain layer in the student model’s network structure are close to those of the corresponding layer in the teacher model. Additionally, by calculating the supervised loss between the teacher model’s predictions and the true labels, the prediction accuracy of the student model is further constrained, ensuring that the distillation process enhances detection performance while maintaining model lightweightness. The feature-logic distillation loss function proposed in this article can be expressed mathematically as shown in Formula (1):
L o s s = α × L F e a t u r e + β × L L o g i t + H a r d _ L o s s
The meaning of each variable in the formula is as follows:
L F e a t u r e : Measure the differences between the student model and the teacher model in the middle layer.
L L o g i t : Measures the difference in raw scores between the student model and the teacher model at the final output layer, without passing through the Softmax layer.
Hard_Loss: Cross-entropy loss of student model on ground truth labels.
α and β: Hyperparameters that balance the weights of different loss items.

3.4. Focaler-ShapeIoU Loss Function

Existing bounding box regression methods typically consider the geometric relationship between the ground truth (GT) box and the predicted box, while neglecting the impact of inherent properties such as the shape and scale of the bounding boxes on the regression process [19]. In order to alleviate the problem of imbalance in the number of training samples and improve the effectiveness of the model for occluding targets and other difficult to detect positive samples, the Focaler-ShapeIoU loss function is used in this paper. In order to improve the detection performance of the model for occluding targets and other hard-to-detect positive samples, the ShapeIoU bounding box regression loss function was used to detect citrus diseases.
The formula for defining the ShapeIoU total regression loss function is as follows.
L S h a p e I o U = 1 I o U + d i s t a n c e s h a p e + 0.5 × s h a p e
The meaning of each variable in the formula is as follows:
d i s t a n c e s h a p e : the similarity between the shape of the GT box and the predicted box.
IoU: the traditional regression loss function.
s h a p e : the cost function of the shape of the GT box and the predicted box.
The problem of sample imbalance exists in various object detection tasks. In order to focus on different detection tasks in different regression samples, Zhang et al. [20] used a linear interval mapping method to reconstruct the IoU loss, which helps to improve edge regression. The formula is defined as follows:
I o U F o c a l e r = 0 , I o U < d I o U d u d , d < = I o U < = u 1 , I o U > u  
In the formula, IoUFocaler is the reconstructed Focaler-IoU function, where IoU is the Intersection over Union. Here, u is set to 0 and d is set to 0.95, which allows the model to focus on training samples of varying difficulty levels.
Combined with the advantages of Focaler-IoU to alleviate the equalization of the number of sample types and the advantages of ShapeIoU to improve the occlusion target, the Focaler-ShapeIoU loss function can solve the problem of imbalance in the number of training samples and improve the ability of the model to detect occluding targets, and the loss function formula is defined as follows:
L Focaler - ShapeIoU = L S h a p e I o U + I o U I o U F o c a l e r  

3.5. Comparison with Existing Models

To clearly demonstrate the innovations and improvements of the proposed GYS-RT-DETR model, we conducted a detailed comparison with the existing Gold-YOLO and ASF-YOLO models, with the results shown in Table 2. Unlike Gold-YOLO, which incorporates only the Gather-and-Distribute (GD) mechanism but lacks the Scale Sequence Feature Fusion (SSFF) mechanism, and ASF-YOLO, which includes the SSFF mechanism but not the GD mechanism, the GYS-RT-DETR model uniquely integrates both GD and SSFF mechanisms. In addition, GYS-RT-DETR employs the Focaler-ShapeIoU loss function to address issues of sample imbalance and inaccurate localization, which are not fully resolved in Gold-YOLO or ASF-YOLO. Meanwhile, GYS-RT-DETR utilizes Group_taylor pruning and feature-logic distillation to achieve lightweight performance.

3.6. Model Training and Model Evaluation Metrics

The improved GYS-RT-DETR model was trained, the training rounds were 150 rounds, the input image size was 640 × 640, the Batchsize was set to 16, the scaling factor in the ShapeIoU regression loss function was set to 0.6, and the optimizer was selected AdamW.
In this paper, precision (P), recall (R), F1-score, mean average precision (mAP), FLOPs, model size, FPS, and model parameters are selected as model evaluation indicators. Table 3 shows the definitions of the formulas.
The variables in the table have the following meanings:
  • TP is a true positive, predicted to be a positive sample, and the actual sample is also a positive sample.
  • FP is a false positive, predicted to be a positive sample, and actually a negative sample.
  • FN is a false negative, predicted to be a negative sample, and the actual sample is positive.
  • TN is a true negative, predicted to be a negative sample, and actually a negative sample.

4. Experiment Analysis

4.1. Experiment Environment Configuration

4.1.1. Conventional Experimental Parameter Settings

In the conventional experimental process, to ensure a fair comparison among different models, we set consistent experimental parameters: the Epochs were set to 250, the Batch size was set to 16, and the Optimizer was chosen as AdamW. The Image size was set to 640 × 640.

4.1.2. Model Pruning Experiment Parameter Settings

The channel pruning algorithm used in this paper can be divided into two stages, which are the pruning stage and the fine-tuning stage. In the pruning stage, different pruning strategies were used to prune, and different pruning rates were set to find the optimal pruning model. Due to the sparse parameters of the pruned model, it is important to fine-tune the parameters to ensure network performance. After fine-tuning, the pruned network parameters are re-optimized to the best state. Table 4 shows the fine-tuning of the pruning model and the setting of the pruning rate parameters.

4.1.3. Knowledge Distillation Experiment Parameter Settings

The parameters of the distillation test in this paper are shown in Table 5 below. The number of layers set by the teacher network layer and the student network layer in Table 4 is inconsistent, which is to better verify the feature extraction ability, output decision-making ability and feature fusion ability of the corresponding network layer in the student model network layer of the learning teacher model.

4.2. Ablation Test

By observing Experiment 2 in Table 6, it can be seen that the model accuracy increased by 0.5 percentage points and the model size decreased by 3 MB when the GD collection and distribution mechanism was introduced into the RT-DETR model. However, the other indicators are reduced, which proves that the Neck network improved by the GD mechanism cannot effectively extract the feature information in the network. At the same time, the SSFF mechanism is introduced into the RT-DETR model, and it can be seen that compared with the RT-DETR-r18 model, the precision, recall, mAP value and F1-score are reduced compared with the RT-DETR-r18 model. This proves that the monotonous introduction of the SSFF mechanism cannot effectively enhance the performance of the model.
After the GD mechanism is improved to the Neck network part of the RT-DETR model, the SSFF scale sequence feature fusion module is introduced again. By observing Experiment 4 in Table 6, it can be seen that the precision, recall, mean average precision and F1-score of the improved model combined with SSFF and GD mechanisms are increased by 2.8%, 1.1%, 1.4% and 2.0%, respectively. Based on these indicators, this fully proves that the overall model performance of the RT-DETR model has been significantly improved after the introduction of the GD mechanism and the SSFF module, and fully proves that the GD mechanism and the SSFF mechanism have good adaptability, and the improvement of the model is effective.
In order to visually verify the effectiveness of the model, this paper selects two challenging images to test its detection effect in complex backgrounds. As shown in Figure 8, the GYS-RT-DETR model successfully detected healthy citrus and citrus with crust disease in a strongly interfering environment, depicted in green, as shown in Figure 8a. However, the original RT-DETR-r18 model could not accurately identify and locate the location and disease type of citrus in the face of such strong interference, as shown in Figure 8b.

4.3. Comparison of Different Loss Functions

The Focaler-ShapeIoU, WIoU, CIoU and GIoU loss functions were used to validate the models. As shown in Table 7, the accuracy of the Focaler-ShapeIoU loss function is increased by 0~4.2% compared with other loss functions, which indicates that the Focaler-ShapeIoU loss function is more accurate in the detection of citrus diseases. The recall rate of Focaler-ShapeIoU loss function is increased by 0.1~4.8%, which proves that the missed detection rate of Focaler-ShapeIoU loss function in real scenarios is greatly reduced compared with other loss functions in complex backgrounds. The mAP0.5 and mAP0.5:0.95 of the Focaler-ShapeIoU loss function were increased by 2.6~5.1% and 2.9~4.1%, respectively. This proves that the average precision of the Focaler-ShapeIoU loss function is improved under different detection thresholds. The F1 -score of the Focaler-ShapeIoU loss function is increased by 2~3%, which proves that it has the best overall performance compared with other loss functions. This also proves that it can effectively alleviate the imbalance of training samples and improve the detection ability of masked objects.
To intuitively verify the comparison of the Focaler-ShapeIoU loss function with other loss functions in terms of model performance, as shown in Figure 9, panels a, b, c, and d represent the Precision–Recall (P-R) curves obtained when the RT-DETR-r18 model, augmented with the GD mechanism and SSFF mechanism, employs CIoU, GIoU, WIoU, and Focaler-ShapeIoU loss functions, respectively. By comparison, it is evident that Focaler-ShapeIoU achieves performance improvements in the detection of all disease categories, particularly for those with fewer samples, such as brown-spot and orange scab, where there is a significant enhancement. In contrast to the other three P-R curves, they still exhibit limitations when it comes to categories with fewer samples. This indicates that Focaler-ShapeIoU can effectively address the issue of data imbalance and enhance the model’s detection capability for categories with small sample sizes.

4.4. Comparison and Analysis of Different Models

By replacing different mainstream backbone networks and mainstream YOLO series models, the superiority of the detection performance of the GYS-RT-DETR model was compared and analyzed.
As shown in Table 8, the precision of the GYS-RT-DETR model is improved by 2.4~16.7% compared with other models, which proves that the improved model has higher accuracy in detecting citrus diseases. Compared with other models, the recall rate of the GYS-RT-DETR model is increased by 1.2~12.6%, which proves that the improved model is less likely to miss difficult samples in complex environments. Compared with other models, the average precision of the GYS-RT-DETR model is increased by 4.0~16.7%, which proves that it has good detection performance under different judgment thresholds. Compared with other models, the F1-score of the GYS-RT-DETR model was increased by 2.0~14%, which proved that it had better robustness and detection performance than other models. After a comprehensive comparative analysis of the key performance indicators of the improved model and other models, including FLOPs, Params, model size, and frame rate, the overall performance of the improved model is still among the highest.
By comparing the training curves of different models (Figure 10), it can be intuitively observed that the GYS-RT-DETR model has the highest average precision and converges more quickly. This fully demonstrates that the GYS-RT-DETR model exhibits better generalization and detection performance compared to other models.

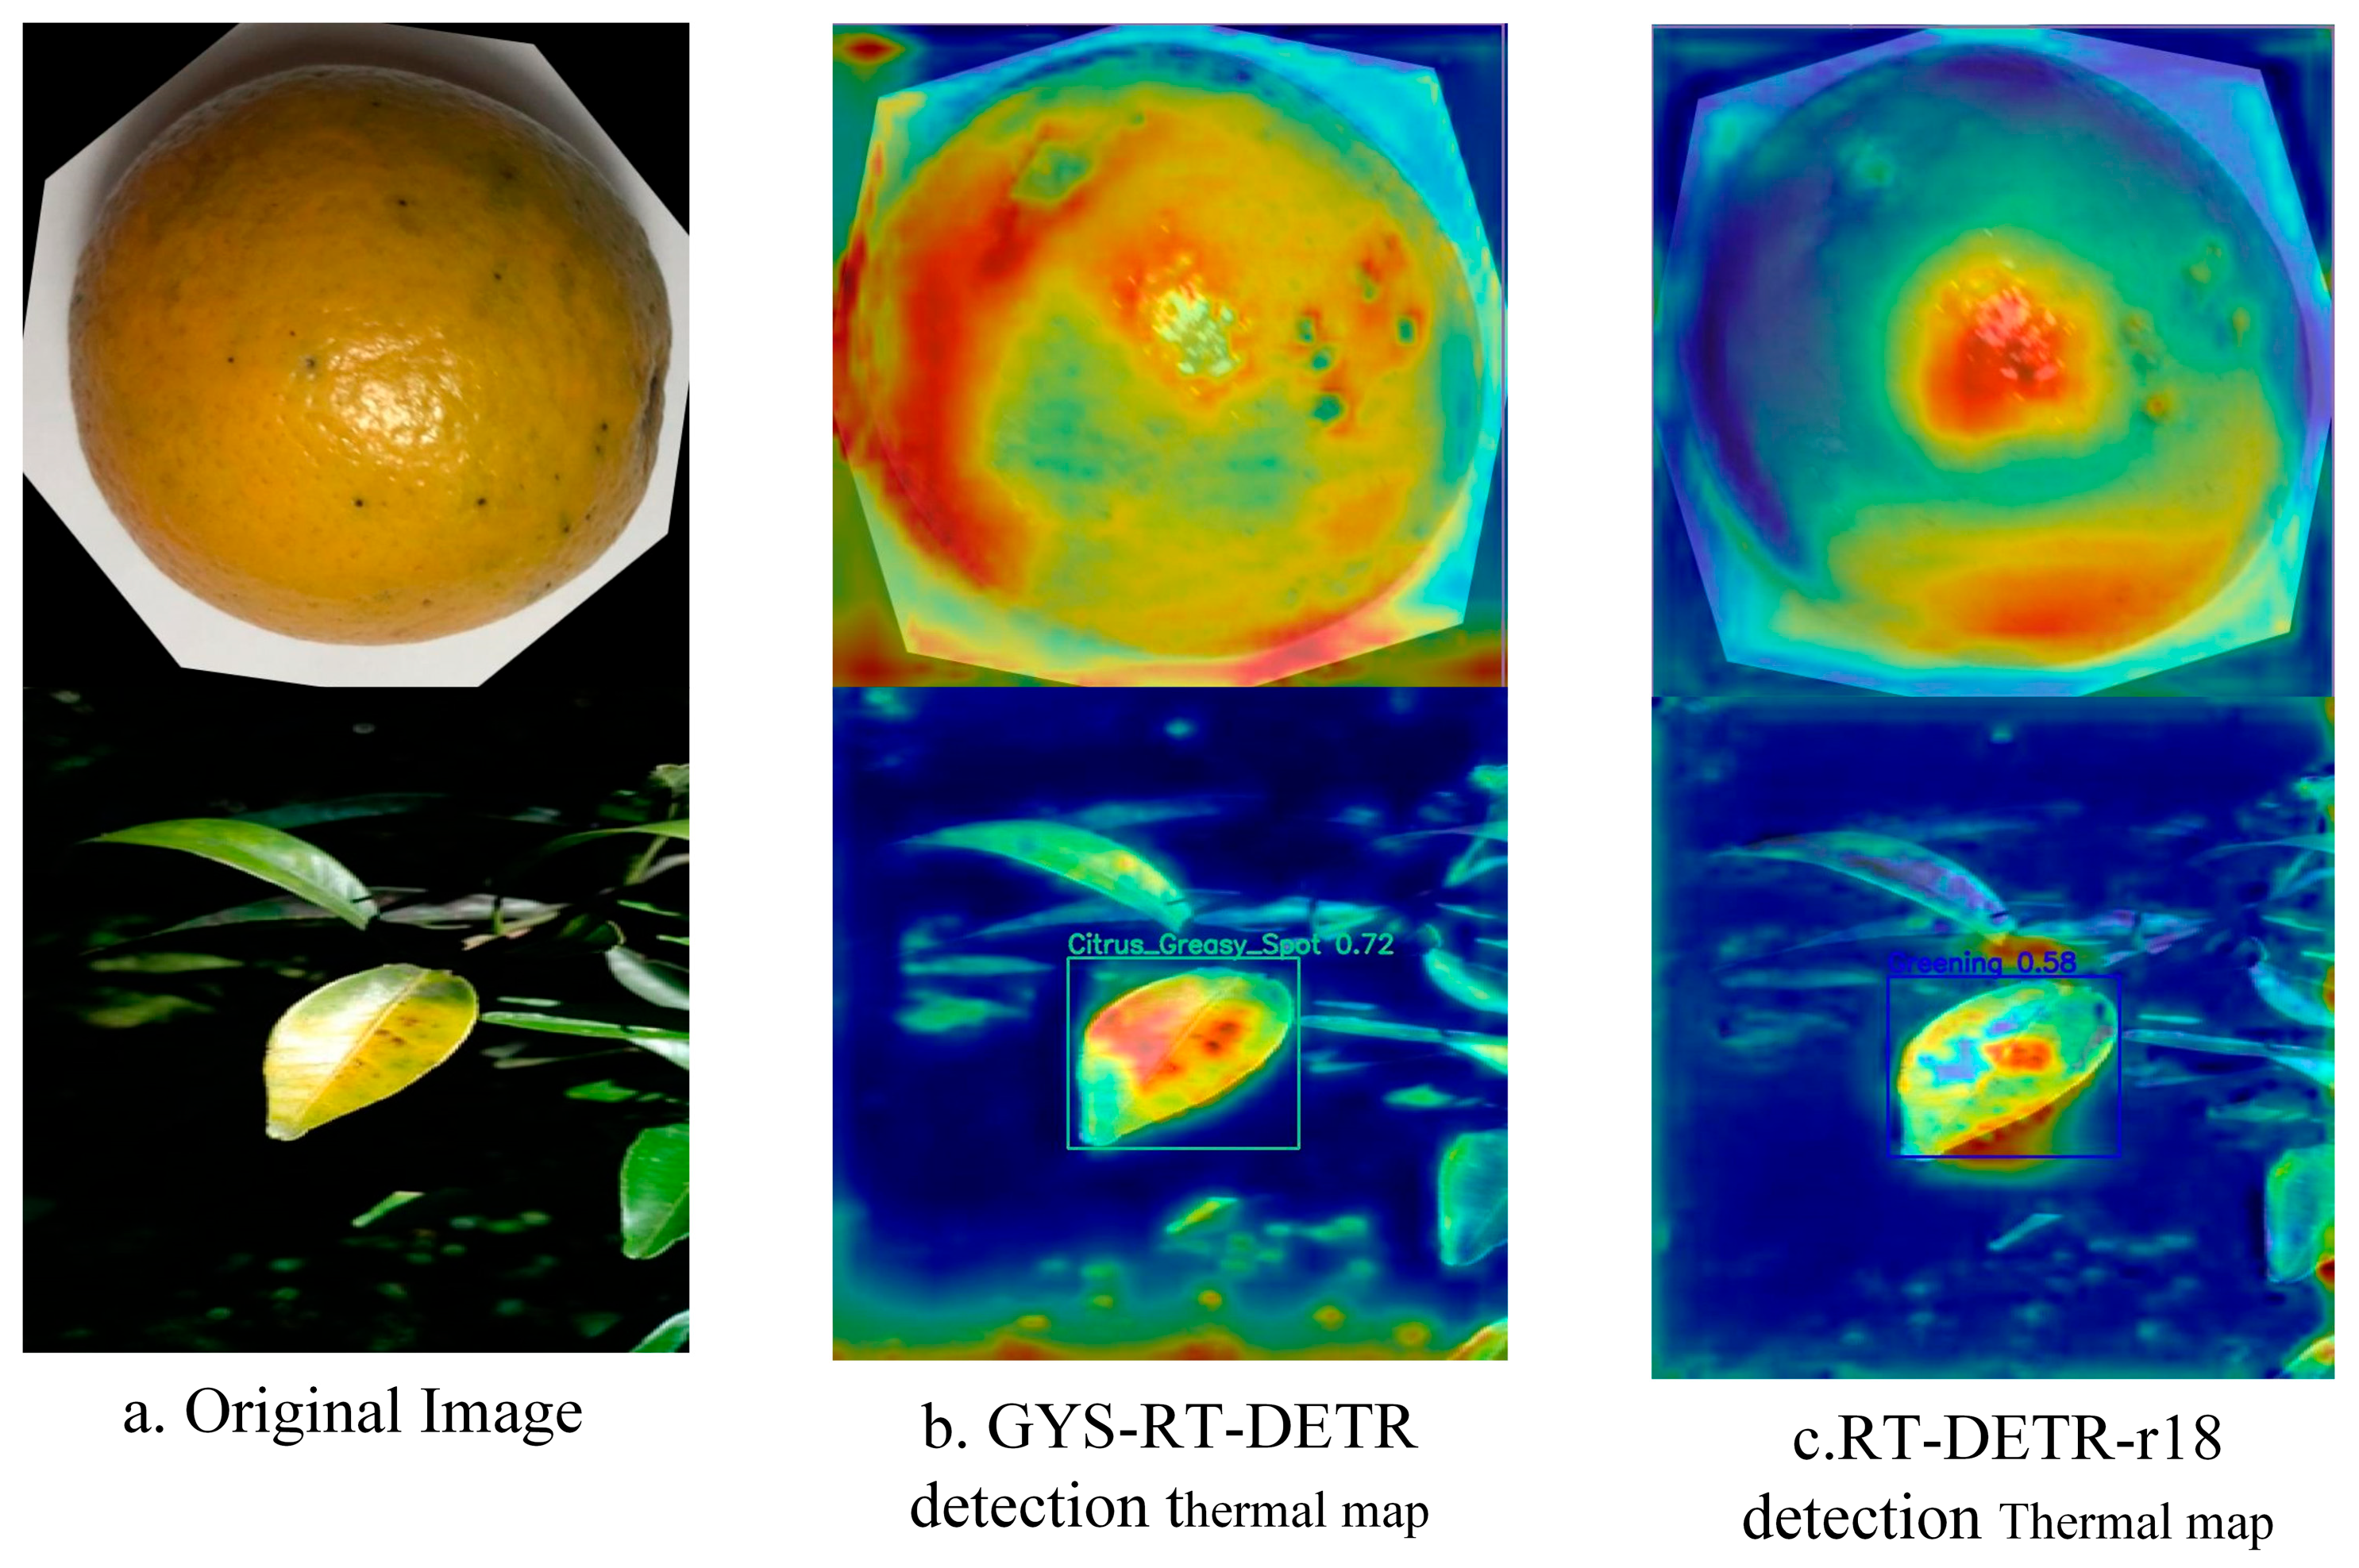
4.5. Global Contextual Information Utilization Capability Analysis

Gradient-weighted Class Activation Mapping (GradCAM) is a tool for visualizing the decision-making process of deep learning models, which helps to understand the decision-making basis of the model by generating heat maps to show the key areas of the image that the model focuses on during classification. The red areas in the heatmap indicate regions of higher importance, which correspond to the parts of the image that the model considers more relevant for its decision-making process. In contrast, the blue areas represent regions of lower importance. In order to verify the detection ability of the GYS-RT-DETR model, two challenging images were selected for analysis. As shown in Figure 11, comparing the heat maps of Figure 11b,c, it can be found that the red areas in Figure 11b are more widely distributed, indicating that the GYS-RT-DETR model can capture more characteristic information and thus more precisely determine the type of citrus disease. The results show that the proposed structure can significantly improve the multi-scale feature fusion ability of the model, so as to make full use of the global context information.

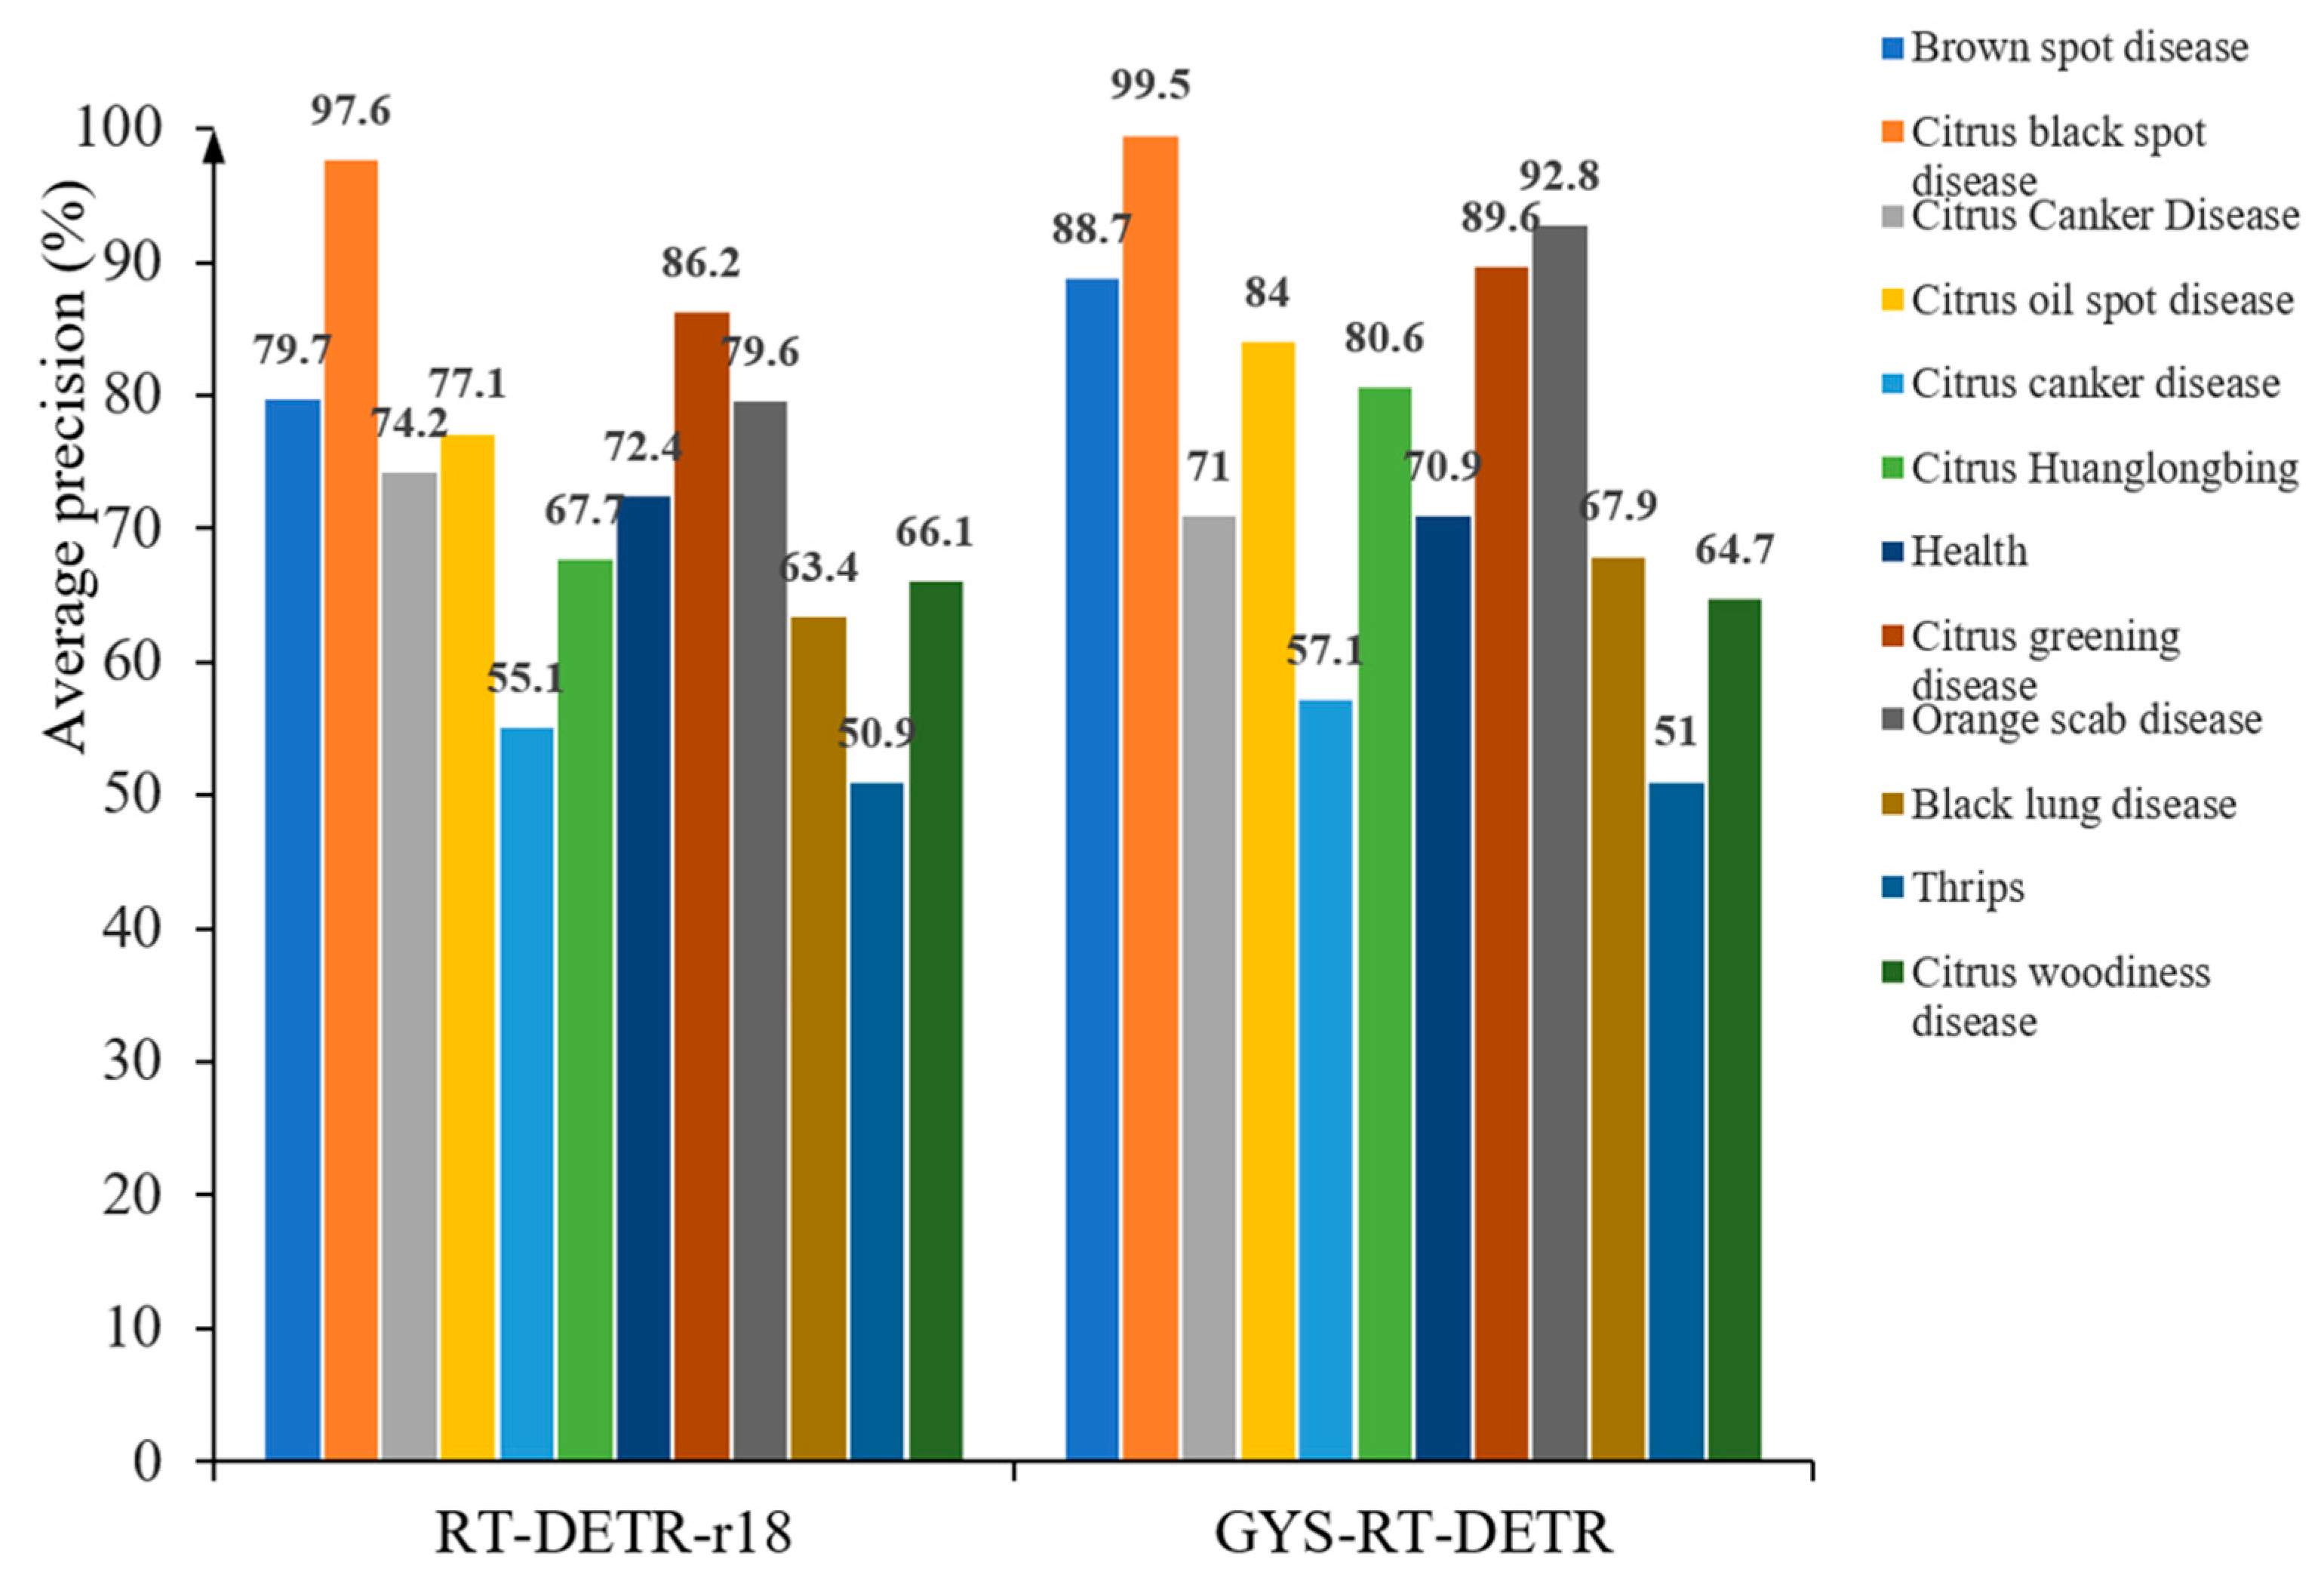
4.6. Comparison of Accuracy in Identifying Different Diseases

By comparing the average accuracy of the twelve types of diseases in Figure 12, it can be seen that the GYS-RT-DETR model has achieved significant improvement in the detection of citrus diseases compared with the RT-DETR-r18 model, and most of its average precision has been improved. Although the training samples for citrus brown spot and orange scab were only 63 and 72, respectively, which were far less than the sample size of other diseases, the mean average precision of the GYS-RT-DETR model for these two diseases was 9% and 13.2% higher than that of the original RT-DETR-r18 model, respectively. This significant improvement fully proves that the GYS-RT-DETR model has a strong ability to solve the problem of sample size imbalance.

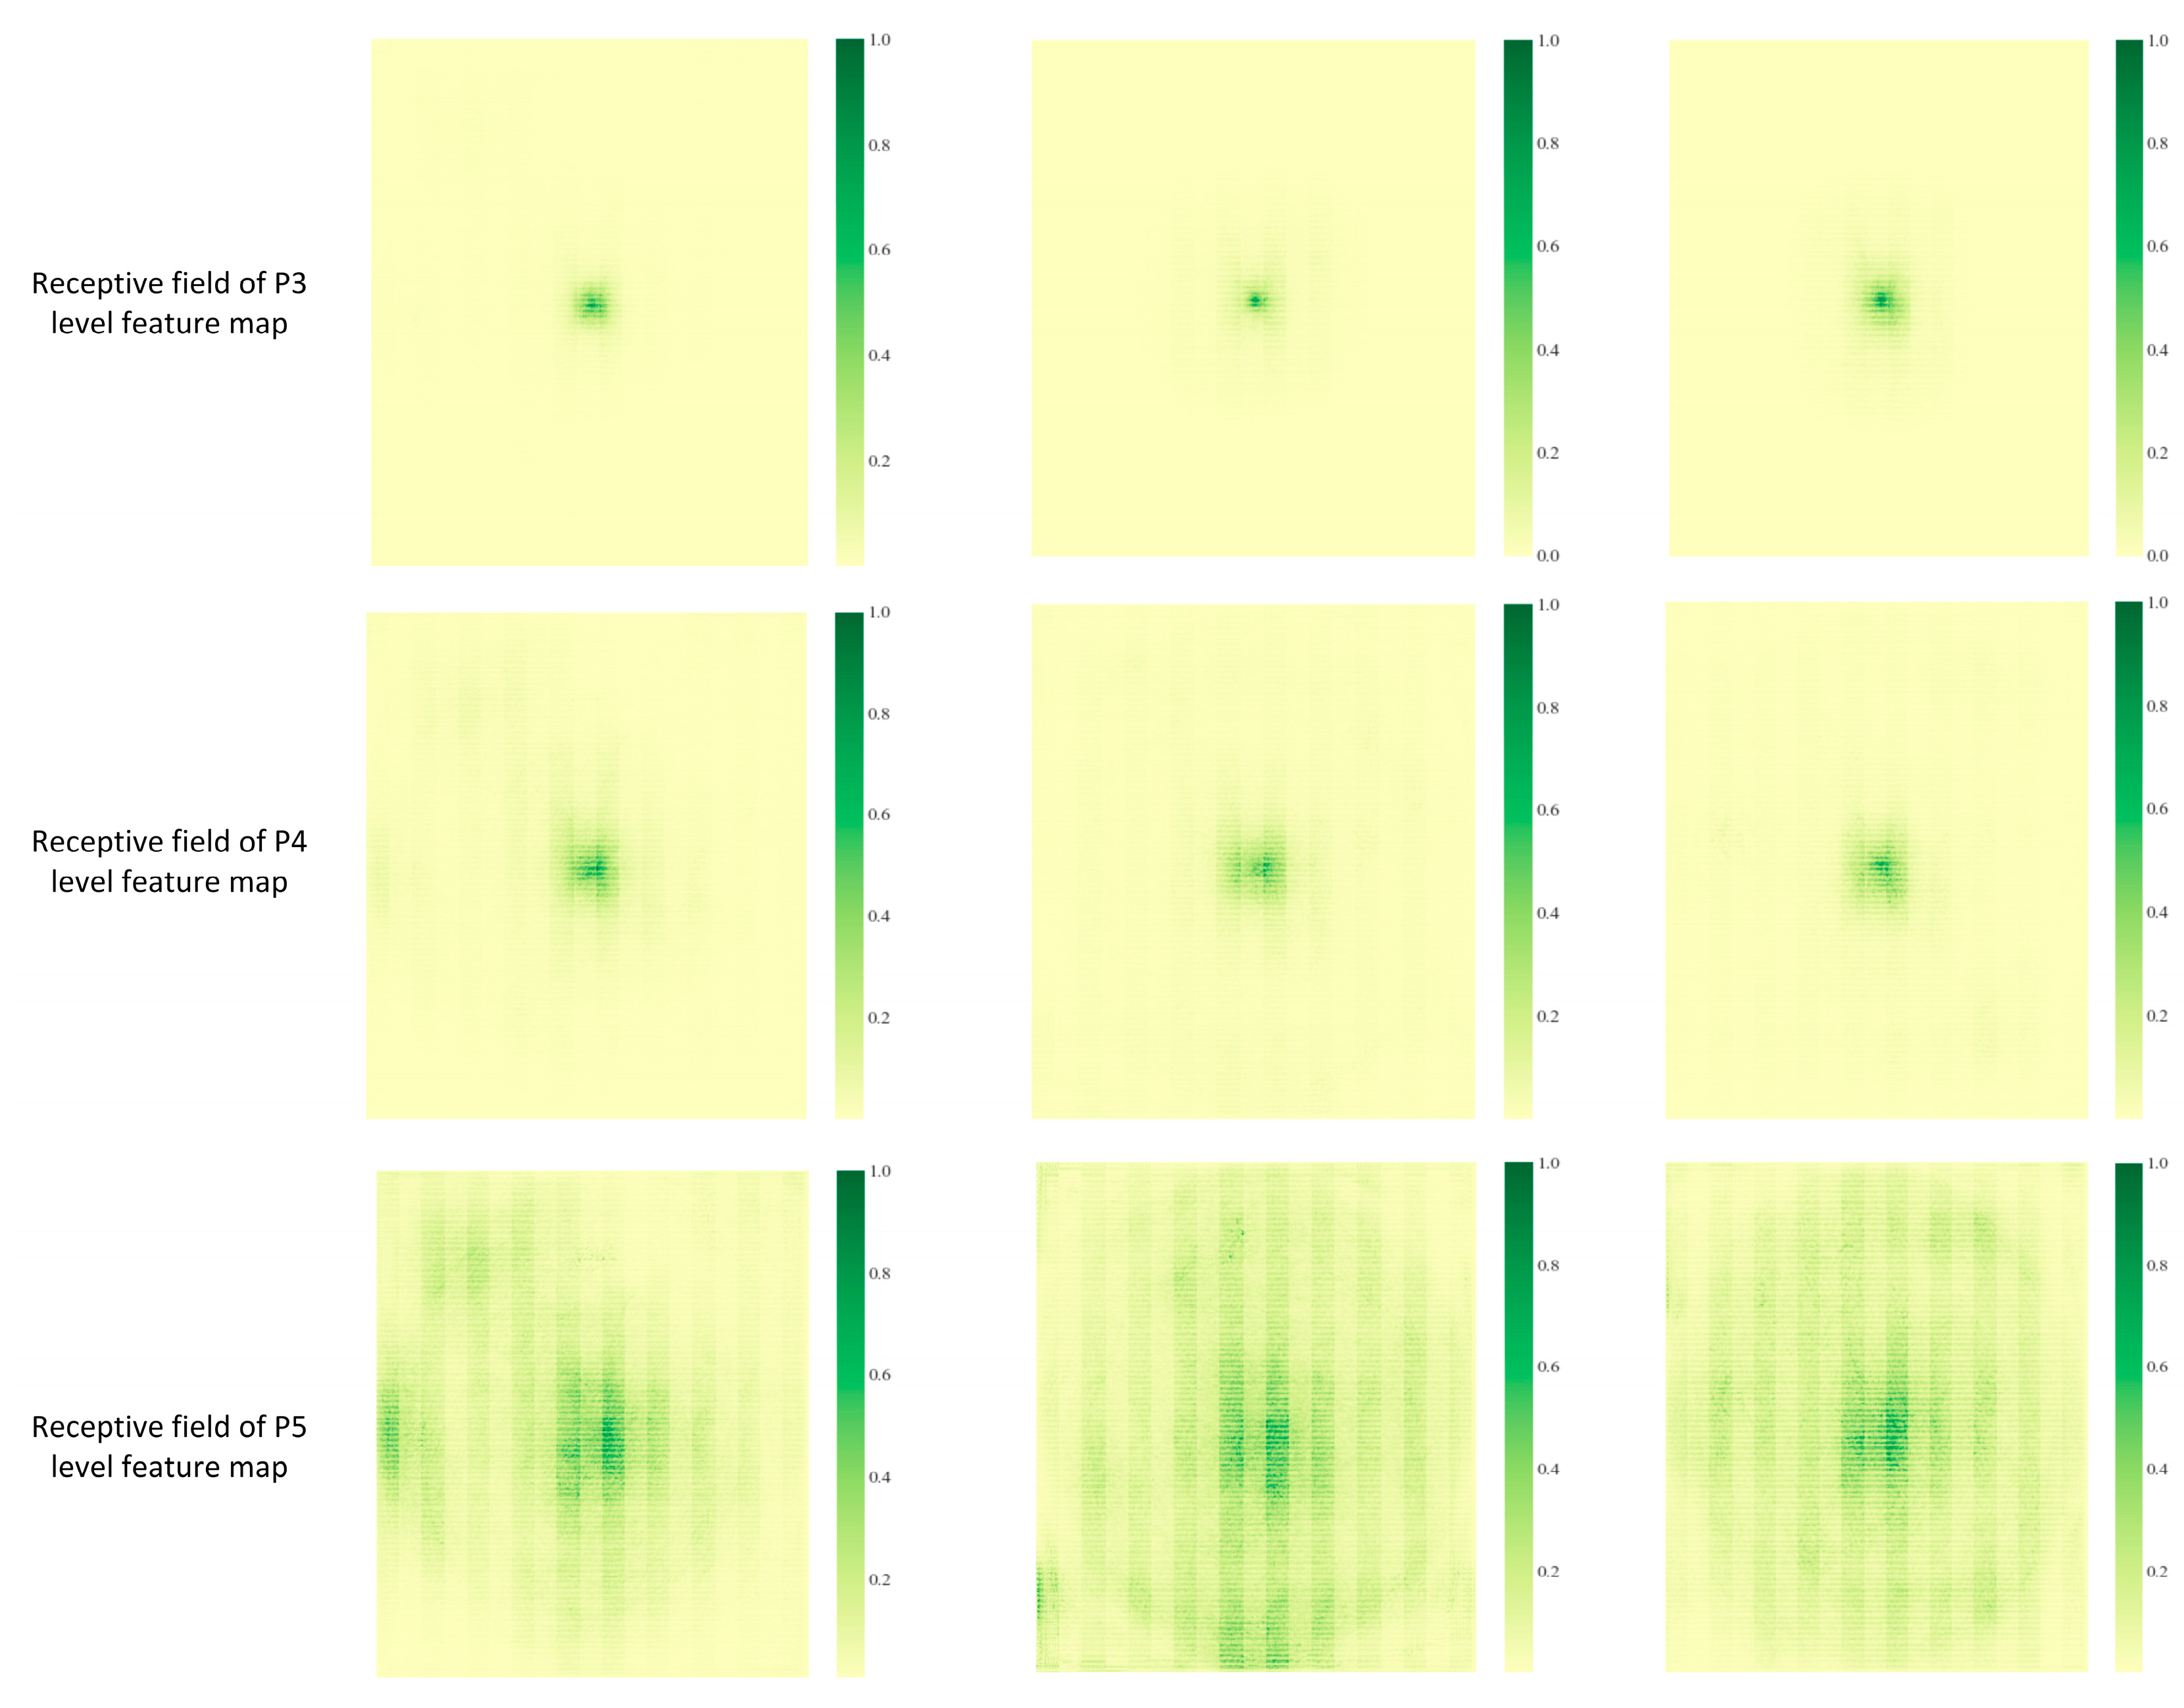
4.7. Comparison of Receptive Fields with Different Network Feature Extraction Capabilities

In order to clearly demonstrate the receptive field sizes for feature extraction of small, medium, and large targets in the Neck network of different network models, Figure 13 visualizes the feature receptive fields of the P3, P4, and P5 feature maps in different networks.
By observing the first row in Figure 13, it can be seen that the receptive field of feature extraction for small targets is significantly reduced after the introduction of GD mechanism in the RT-DETR-r18 network, but after the introduction of SSFF mechanism in the Neck network, the receptive field of feature extraction for small targets is expanded. The results show that the receptive field of the P3 feature map and the small target feature information contained in the feature map are effectively increased by introducing the SSFF mechanism.
By observing the second and third rows in Figure 13, it can be seen that the receptive field of feature extraction for large and medium-sized targets has been significantly expanded after the introduction of the GD mechanism of the original model RT-DETR-r18. This result shows that after the GD mechanism is introduced into the Neck network, the feature extraction ability of P4 and P5 level feature maps for medium and large targets is effectively improved, and the information richness is significantly increased compared with the original model. Since the SSFF network module is only used to solve the loss of GD detection performance for small targets, it can be seen from the third column in Figure 13 that the RT-DETR-r18 GD SSFF network and RT-DETR-r18 GD network do not change much from the feature extraction receptive field for large and medium targets.
Through the above analysis, it can be seen that after the introduction of the GD mechanism, the detection ability of the Neck network for medium and large targets has been effectively improved, but its detection performance for small targets has decreased. The introduction of the SSFF mechanism can effectively make up for the shortcomings caused by the GD mechanism. Therefore, by analyzing the receptive field visualization of the P3, P4 and P5 level feature maps of the Neck network, it can be seen that the detection performance of the GYS-RT-DETR network model has been comprehensively improved compared with the detection performance of the original model.

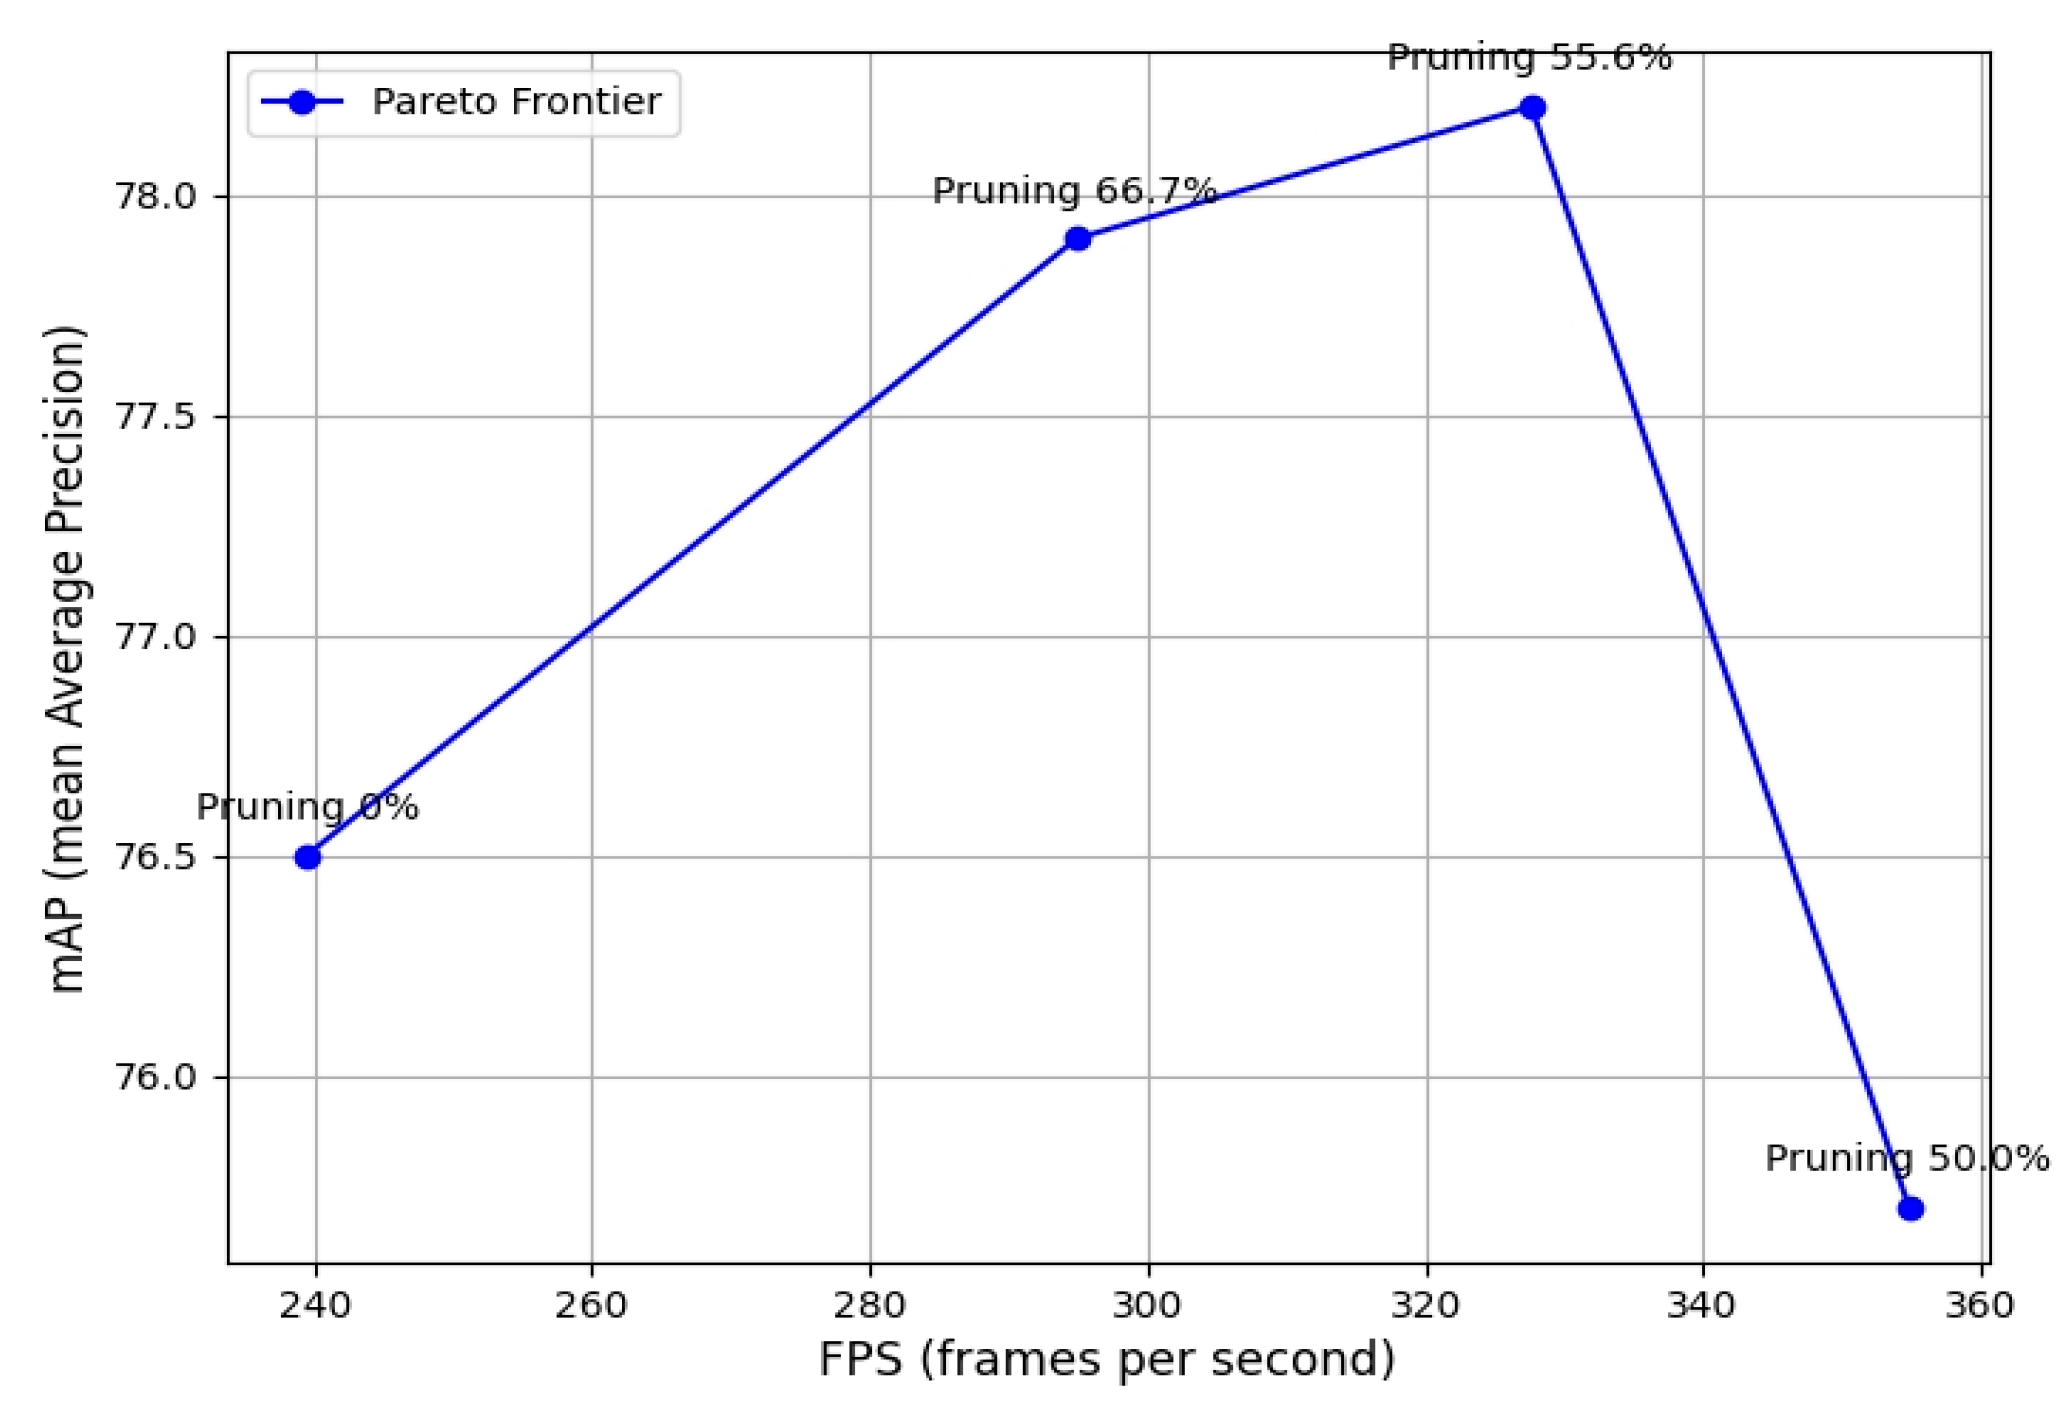
4.8. Experiments with Different Pruning Rates Based on the Group_Taylor Pruning Strategy

In order to achieve model compression and reduce the memory usage and computational complexity of the model, this paper uses different pruning rates to prune the model based on Group_taylor pruning strategies, and the experimental results are analyzed as follows:
As shown in Table 9, by comparing Experiment 1 with Experiment 0, at a pruning rate of 66.7%, the mAP0.5 and mAP0.5:0.9 values of the pruned model show significant improvement, and both the computational parameters and model size have significantly decreased. Comparing the data from Experiment 1 and Experiment 2 shows that when the pruning rate is reduced to 55.6%, the mAP0.5 and mAP0.5:0.9 values of the model continue to improve, and at this point, the computational parameters and model size have also decreased compared to the previous one, which indicating that the model still has the potential to increase the pruning rate. Observing the results of Experiment 3 shows that when the pruning rate is reduced to 50.0%, the mAP value of the pruned model only experiences a slight decline, suggesting that under the current conditions, the pruning rate may be close to or has reached an optimal balance point, and further pruning may lead to a decrease in model performance. Since the decline in mAP value in Experiment 3 compared to Experiment 2 is very small, it is determined that a pruning rate of 55.6% is the optimal pruned model.
To further clarify this point, we have plotted the Pareto frontier of mAP and FPS at different pruning rates. As shown in Figure 14, the Pareto frontier demonstrates the trade-off between mAP values and FPS at various pruning rates. The optimized pruning rate of 55.6% has been determined as the point at which the model achieves the highest mAP while maintaining a high FPS. In contrast, although a 50% pruning rate can yield the highest FPS, it results in a significant decrease in mAP, which also highlights the importance of avoiding excessive pruning.
In order to more intuitively demonstrate the pruning effect of the compression model and the GYS-RT-DETR model on the number of channel parameters under the Group_taylor pruning strategy, the comparison between the two can be revealed in Figure 15. As can be seen from the figure, the optimal pruning model has the most significant reduction in the channel parameters in the left network layer, while the reduction in the number of parameters in the other network layers is relatively small. This phenomenon shows that the optimal pruning model effectively removes the redundant or small contribution channel parameters in the network through the local pruning strategy, rather than simply reducing the number of parameters in all layers.

4.9. Comparative Analysis of Different Feature Loss Functions

This experiment explores the impact of different feature distillation methods on the detection performance of the student model and the model’s lightweighting effects, based on the knowledge distillation framework that combines feature distillation and logic distillation proposed in this paper. The optimal pruned model is selected as the lightweight student model and paired with a teacher model that has more parameters and stronger performance. Experiments are conducted by setting different teacher models, various distillation evaluation score strategies, and different learning rate decay algorithms for comparative analysis to obtain the optimal student model.
The mainstream algorithms for the loss function of feature distillation include cwd, mimic, mgd, chsim, and sp. However, in this paper, the logical distillation loss function is consistently set to the logical algorithm. The constant parameter settings for different feature distillation methods are shown in Table 10.
From Table 11, it can be seen that compared with other loss functions, the characteristic distillation loss function SP has the highest mAP0.5 and mAP0.5:0.95 values. This indicates that the comprehensive detection performance of the student model based on the SP loss function is the best. In addition, the student model based on the SP loss function has the highest F1-score compared with other loss functions, which further proves that its comprehensive performance evaluation is the best. Therefore, by comparing the experiments of different eigen-loss functions, it can be concluded that the student model based on the SP loss function has the best comprehensive performance.

4.10. Comparative Analysis of Model Performance Evaluation Indexes at Different Stages

In order to objectively assess the performance differences and improvement effects of the optimization model at various stages, this paper conducts a systematic comparative analysis of the performance metrics data for RT-DETR-r18, GYS-RT-DETR, the pruned model, and the distilled model. Parameter settings for the experimental content in this subsection are all configured according to the parameters in Section 4.1.3.
The comparison results of the models at different stages are shown in Table 12:
(1)
Compared with the original model RT-DETR-r18, the improved GYS-RT-DETR model has an improvement of 4%, 3.7%, 2.4%, 1.2% of F1-scores, mAP0.5, mAP0.5:0.95, precision, recall and F1-score, respectively, which proves that the improved model has stronger generalization ability. At the same time, compared with RT-DETR-r18, the number of parameters and FLOPs of the GYS-RT-DETR model increased by 2.7 M and 6.2 G, respectively, which proved that the model memory occupation and model inference prediction speed of the improved GYS-RT-DETR model decreased significantly. This result shows that although the detection performance of GYS-RT-DETR is better than that of the original RT-DETR-r18 model, its deployment difficulty on edge devices is significantly increased.
(2)
After multiple experiments with different channel pruning strategies and pruning rates, the pruned model showed a decrease of 0.8% in mAP0.5 and 0.4% in mAP0.5:0.95 compared to the GYS-RT-DETR model. This demonstrates that models based on coarse-grained channel pruning strategies often experience a decline in detection performance due to excessively high pruning rates. Although the precision of the pruned model decreased by 2.9% compared to the GYS-RT-DETR model, the former’s F1-score and recall rate increased by 1% and 1.7%, respectively. This improvement in recall rate led to an increase in the F1-score. Finally, since the model pruning algorithm primarily focuses on the model’s memory usage and inference prediction speed, a comparison between the pruned model and the GYS-RT-DETR model shows that the FLOPs and parameter count decreased by 35.5 G and 11.5 M, respectively, indicating that the model’s computational complexity and memory usage were nearly reduced by 50%. This indicates that the pruned model addresses the deployment challenges of the GYS-RT-DETR model on edge devices, while the overall performance evaluation metrics of the pruned model only show a slight loss compared to the GYS-RT-DETR model.
(3)
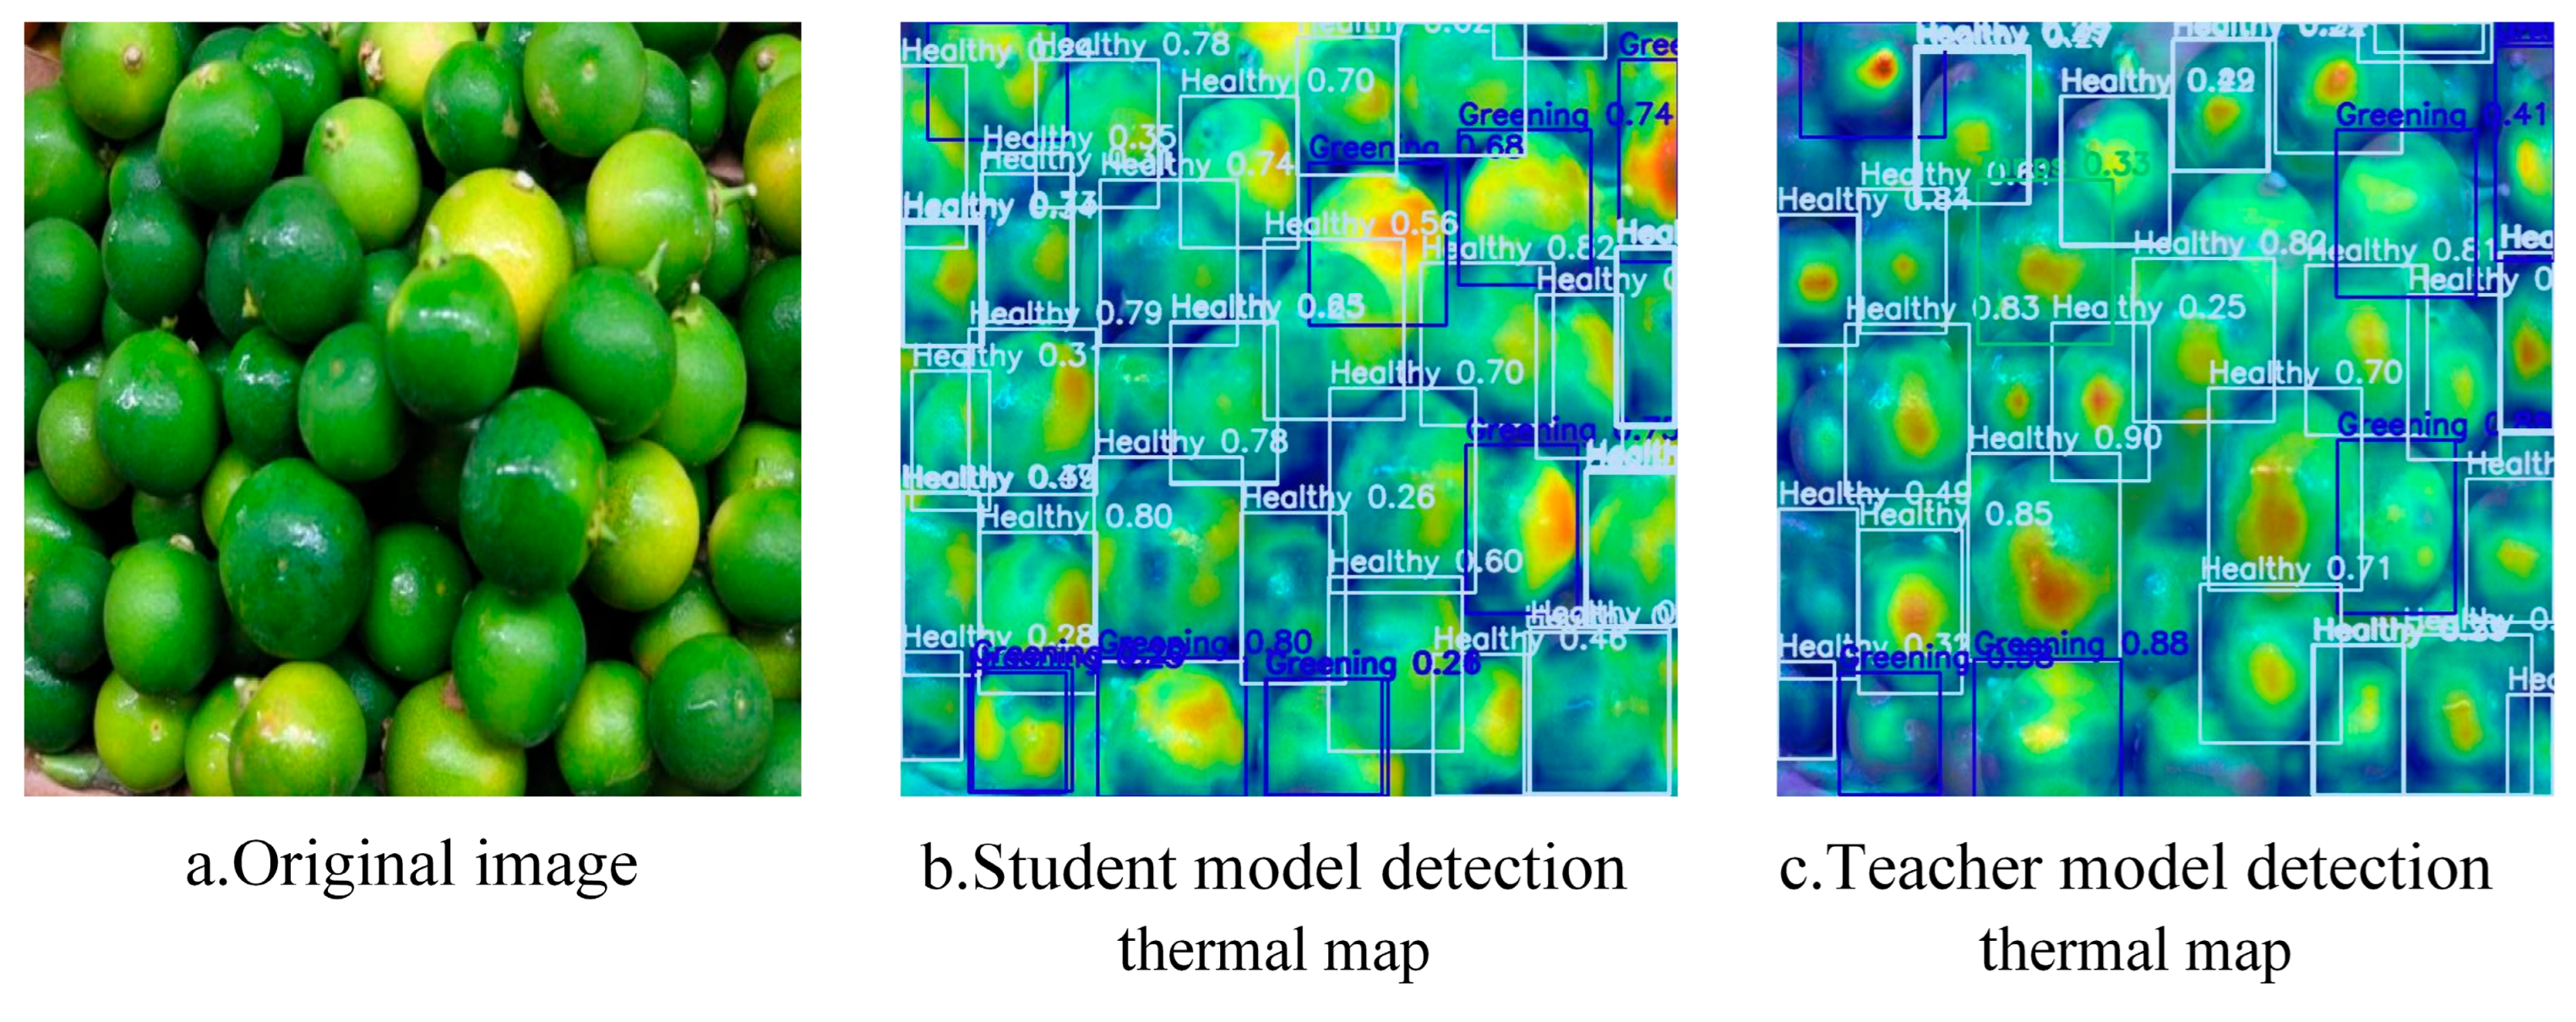
Compared with the pruning model, the FLOPs and parameters of the student model KDP-GYS-RT-DETR model after feature-logic distillation remain unchanged, which proves that the attention of the KD distillation algorithm mainly focuses on the deep feature learning of the network layer between the student-teacher model, without changing the number of model parameters and the computational complexity of the model. At the same time, the distillation optimization model increased the mAP0.5, mAP0.5:0.95, precision, recall and F1-score by 2.0%, 1.7%, 3.5%, 0.8% and 1.0%, respectively, compared with the pruning model. This proves that the feature-logic distillation framework proposed in this paper makes the pruning model effectively learn the deep features and output decision-making ability of the RT-DETR-r50 model.
Previous analysis shows that the improvement strategies at each stage can specifically enhance the model’s performance. To further verify whether the detection performance gap between the distilled optimized model and the RT-DETR-r50 model in real scenarios has narrowed or surpassed that of the teacher model, the comparison of Figure 16b,c reveals that the teacher model has instances of missed detections, while the student model does not have any missed detections. This result indicates that the student model, after distillation optimization, outperforms the teacher model RT-DETR-r50 in terms of disease recognition performance in real scenarios.

5. Discussion

(1)
Network Improvement: After improvements to the network structure and loss function, the GYS-RT-DETR model shows an increase of 4%, 3.7%, 2.4%, 1.2%, and 2% in mAP0.5, mAP0.5:0.95, precision, recall, and F1-score, respectively, compared to the original model RT-DETR-r18. At the same time, the parameter count and FLOPs of the GYS-RT-DETR model increased by 2.7 M and 6.2 G, respectively, compared to RT-DETR-r18, indicating that the memory usage and inference prediction speed of the GYS-RT-DETR improved model have significantly decreased. This result suggests that the increase in computational parameters for GYS-RT-DETR is not conducive to the model’s lightweight goals.
(2)
Model Pruning: The pruned model obtained using the Group_taylor pruning strategy shows a reduction of 35.5 G in FLOPs and 11.5 M in parameter count compared to the GYS-RT-DETR model, resulting in nearly a 50% decrease in computational complexity and memory usage. This result demonstrates that the pruned model addresses the deployment challenges of the GYS-RT-DETR model on edge devices, while the overall performance evaluation parameters of the pruned model only incur a slight loss compared to the GYS-RT-DETR model.
(3)
Knowledge Distillation: This article optimizes lightweight pruned models through a feature-logic distillation framework. Compared to the pruned models before distillation, the pruned models after distillation show improvements of 2.0% in mAP0.5, 1.7% in mAP0.5:0.95, 3.5% in precision, 0.8% in recall, and 1.0% in F1-score. Additionally, the knowledge distillation framework proposed in this article shows differences in the feature learning network layers between the student model and the teacher model. This demonstrates that the feature-logic distillation framework enables the pruned model to effectively learn the deep features and output decision-making capabilities of the RT-DETR-r50 model.
(4)
Comparison with Other Studies: Compared with the ASF-YOLO model proposed by Kang et al. [18], the GYS-RT-DETR model, with the addition of the GD mechanism, outperforms ASF-YOLO in the detection capability of medium and large targets. When compared with the Gold-YOLO model proposed by Wang et al. [17], both Gold-YOLO and GYS-RT-DETR enhance the detection of multi-scale targets through the introduction of the global feature fusion mechanism (GD). However, GYS-RT-DETR further improves the detection performance of small targets by incorporating the Scale Sequence Feature Fusion (SSFF) mechanism. Compared with the Focaler-IoU method proposed in reference [20], the GYS-RT-DETR model adopts a different strategy to address the issues of sample imbalance and localization accuracy in disease detection tasks. It introduces the Focaler-ShapeIoU loss function, which combines shape and scale information to optimize the detection capability for occluded and small targets. Moreover, the GYS-RT-DETR model achieves model lightweighting and is more suitable for deployment on edge devices compared to the two aforementioned models.

6. Conclusions

In summary, the precision, recall, F1-score, model size, and mAP value of the GYS-RT-DETR model were 79.1%, 77.9%, 78.0%, 23.0 MB, and 77.8%, respectively. Compared with the original model, the accuracy, recall, F1-score, mAP value, and FPS value are increased by 3.5%, 5.3%, 5.0%, 5.3%, and 10.3 f/s, respectively. At the same time, the memory usage of the GYS-RT-DETR model is reduced by 25.5 MB compared with the original model. This result shows that the GYS-RT-DETR model proposed in this paper is optimized compared with the original model in terms of recognition performance and light weight of the model. These indicators are sufficient to provide reliable citrus detection and diagnostic results, while also meeting the demand for low computational resource usage. The GYS-RT-DETR model is designed to address the real-world challenges faced by citrus farmers and agricultural practitioners. The complete implementation details of the GYS-RT-DETR model, including its architecture and optimization strategies, are provided in Appendix A. Finally, in future work, the richness of datasets will be expanded, and the disease detection models will be continuously optimized in close integration with mobile apps, edge devices, and drone deployments to enhance actual detection capabilities. We will also strengthen our research on the issue of multiple diseases that may affect a single citrus fruit. As a result, farmers will be able to obtain real-time disease detection results. Additionally, we plan to conduct field trials to verify the effectiveness of the models in real agricultural scenarios.

Author Contributions

L.Y.: Writing—review and editing, Writing—original draft, Methodology, Funding acquisition, Conceptualization. Z.H.: Writing—review and editing, Writing—original draft, Validation, Methodology, Conceptualization, Software. Y.H.: Writing—review and editing, Validation, Software, Resources. R.L.: Writing—review and editing, Data Curation. X.W.: Writing—review and editing, Data Curation. Z.P.: Writing—review and editing, Data Curation. J.S.: Writing—review and editing, Validation, Supervision, Investigation. All authors have read and agreed to the published version of the manuscript.

Funding

This research was funded by the China Central Fund for Guiding Development of Local Science and Technology under Grant No. 202407AB110010, in part by the Yunnan Science and Technology Major Project under Grant No. 202302AE090020, in part by Yunnan Science and Technology Major Project under Grant No. 202303AP140014.

Data Availability Statement

To ensure the transparency and reproducibility of our research, the dataset used in this study is now publicly available. The dataset includes all the images and related information used for the analyses. It can be accessed via the following link: https://www.kaggle.com/datasets/jxgahs/citrus-disease-dataset159 (accessed on 14 June 2025). The data may be freely used, distributed, and reproduced under the condition of appropriate attribution.

Conflicts of Interest

The authors declare that they have no known competing financial interests or personal relationships that could have appeared to influence the work reported in this paper.

Appendix A

Below is the complete code of the GYS-RT-DETR model
# Parameters
nc: 80  # number of classes
scales: # model compound scaling constants, i.e. 'model=yolov8n-cls.yaml' will call yolov8-cls.yaml with scale 'n'
  # [depth, width, max_channels]
  l: [1.00, 1.00, 1024]
backbone:
  # [from, repeats, module, args]
  - [-1, 1, ConvNormLayer, [32, 3, 2, None, False, 'relu']] # 0-P1/2
  - [-1, 1, ConvNormLayer, [32, 3, 1, None, False, 'relu']] # 1
  - [-1, 1, ConvNormLayer, [64, 3, 1, None, False, 'relu']] # 2
  - [-1, 1, nn.MaxPool2d, [3, 2, 1]] # 3-P2/4
  # [ch_out, block_type, block_nums, stage_num, act, variant]
  - [-1, 1, Blocks, [64, BasicBlock, 2, 2, 'relu']] # 4
  - [-1, 1, Blocks, [128, BasicBlock, 2, 3, 'relu']] # 5-P3/8
  - [-1, 1, Blocks, [256, BasicBlock, 2, 4, 'relu']] # 6-P4/16
  - [-1, 1, Blocks, [512, BasicBlock, 2, 5, 'relu']] # 7-P5/32
head:
  - [-1, 1, Conv, [256, 1, 1, None, 1, 1, False]]  # 8 input_proj.2
  - [-1, 1, AIFI, [1024, 8]] # 9
  - [-1, 1, Conv, [256, 1, 1]]  # 10, Y5, lateral_convs.0
  - [[4, 5, 6, 7], 1, SimFusion_4in, []] # 11
  - [-1, 1, IFM, [[64, 32]]] # 12
  - [10, 1, Conv, [256, 1, 1]] # 13
  - [[5, 6, -1], 1, SimFusion_3in, [256]] # 14
  - [[-1, 12], 1, InjectionMultiSum_Auto_pool, [256, [64, 32], 0]] # 15
  - [-1, 3, RepC3, [256, 0.5]] # 16
  - [6, 1, Conv, [256, 1, 1]] # 17
  - [[4, 5, -1], 1, SimFusion_3in, [256]] # 18
  - [[-1, 12], 1, InjectionMultiSum_Auto_pool, [256, [64, 32], 1]] # 19
  - [-1, 3, RepC3, [256, 0.5]] # 20
  - [[20, 16, 10], 1, PyramidPoolAgg, [352, 2]] # 21
  - [-1, 1, TopBasicLayer, [352, [64, 128]]] # 22
  - [[20, 17], 1, AdvPoolFusion, []] # 23
  - [[-1, 22], 1, InjectionMultiSum_Auto_pool, [256, [64, 128], 0]] # 24
  - [-1, 3, RepC3, [256, 0.5]] # 25
  - [[-1, 13], 1, AdvPoolFusion, []] # 26
  - [[-1, 22], 1, InjectionMultiSum_Auto_pool, [256, [64, 128], 1]] # 27
  - [-1, 3, RepC3, [256, 0.5]] # 28
  - [[5, 6, 8], 1, ScalSeq, [256]] # 29
  - [[20, -1], 1, Add, []] # 30
  # - [[20, -1], 1, asf_attention_model, []] # 30
  - [[30, 25, 28], 1, RTDETRDecoder, [nc, 256, 300, 4, 8, 3]] # 29

References

  1. Deng, X. A Review and Perspective for Citrus Breeding in China During the Last SixDecades. Acta Hortic. Sin. 2022, 49, 2063–2074. [Google Scholar] [CrossRef]
  2. Zhao, J.; Liu, Y.; Feng, Z.; Li, R.; Li, M.; Li, Y. Analysis of Competitive Advantages in the Development of the Citrus Industry in Yunnan Province. Yunnan Agric. 2018, 40–41. [Google Scholar]
  3. Nie, R.; Sun, M.; Feng, D.; Song, X.; Gao, J.; Guo, L.; Deng, X.; Chai, L.; Xie, Z.; Ye, J. An Investigation on Occurrence and Distribution Patterns of Five Common Citrus Diseases in Yunnan. Acta Hortic. Sin. 2024, 51, 2685–2700. [Google Scholar] [CrossRef]
  4. Tan, B. Research on Citrus Disease Identification Based on Convolutional Neural Networks. Master’s Thesis, Jiangsu University, Zhenjiang, China, 2023. [Google Scholar]
  5. Zeng, W.; Chen, Y.; Hu, G.; Bao, W.; Liang, D. Detection of citrus Huanglongbing in natural background by SMS and two-way feature fusion. Trans. Chin. Soc. Agric. Mach. 2022, 53, 1. [Google Scholar]
  6. He, C. Rapid Detection Citrus HLB by Developing a Handheld Device Based on Spectral Imaging Technology. Master’s Thesis, Fujian Agriculture and Forestry University, Fuzhou, China, 2022. [Google Scholar]
  7. Dai, Z. Research on Citrus Huanglongbing Diagnosis System Based on Edge Computing. Master’s Thesis, Southwestern University, Georgetown, TX, USA, 2022. [Google Scholar]
  8. Lian, B. Research on Online Diagnostic Technology and System of Citrus Huanglongbing Based on MobileNet. Master’s Thesis, South China Agricultural University, Guangzhou, China, 2019. [Google Scholar]
  9. Liu, Y.; Xiao, H.; Sun, X.; Zhu, D.; Han, R.; Ye, L.; Wang, J.; Ma, K. Spectral feature selection and discriminant model building for citrus leaf Huanglongbing. Trans. Chin. Soc. Agric. Eng. 2018, 34, 180–187. [Google Scholar]
  10. Qing, D. Rapid Nondestructive Detection of Citrus Greening (HLB) Using Hyperspectral Imaging Technology. Ph.D. Dissertation, East China Jiaotong University, Nanchang, China, 2016. [Google Scholar]
  11. Bové, J.; Chau, N.M.; Trung, H.M.; Bourdeaut, J.; Garnier, M. Huanglongbing (greening) in Vietnam: Detection of Liberobacter asiaticum by DNA-hybridization with probe in 2.6 and PCR-amplification of 16S ribosomal DNA. In Proceedings of the International Organization of Citrus Virologists Conference Proceedings (1957–2010), Fuzhou, China, 16–23 November 1996. [Google Scholar]
  12. Weng, H.; Liu, Y.; Captoline, I.; Li, X.; Ye, D.; Wu, R. Citrus Huanglongbing detection based on polyphasic chlorophyll a fluorescence coupled with machine learning and model transfer in two citrus cultivars. Comput. Electron. Agric. 2021, 187, 106289. [Google Scholar] [CrossRef]
  13. He, C.; Li, X.; Liu, Y.; Yang, B.; Wu, Z.; Tan, S.; Ye, D.; Weng, H. Combining multicolor fluorescence imaging with multispectral reflectance imaging for rapid citrus Huanglongbing detection based on lightweight convolutional neural network using a handheld device. Comput. Electron. Agric. 2022, 194, 106808. [Google Scholar] [CrossRef]
  14. Zhao, Y.; Lv, W.; Xu, S.; Wei, J.; Wang, G.; Dang, Q.; Liu, Y.; Chen, J. Detrs beat yolos on real-time object detection. In Proceedings of the IEEE/CVF Conference on Computer Vision and Pattern Recognition, Seattle, WA, USA, 17–21 June 2024; pp. 16965–16974. [Google Scholar]
  15. Linlin, L.; Hailong, S. Forest Pedestrian Detection Based on Improved YOLOv8. For. Eng. 2025, 41, 138–150. [Google Scholar]
  16. Molchanov, P.; Tyree, S.; Karras, T.; Aila, T.; Kautz, J. Pruning convolutional neural networks for resource efficient transfer learning. arXiv 2016, arXiv:1611.06440. [Google Scholar] [CrossRef]
  17. Wang, C.; He, W.; Nie, Y.; Guo, J.; Liu, C.; Wang, Y.; Han, K. Gold-YOLO: Efficient object detector via gather-and-distribute mechanism. Adv. Neural Inf. Process. Syst. 2023, 36, 51094–51112. [Google Scholar]
  18. Kang, M.; Ting, C.-M.; Ting, F.F.; Phan, R. ASF-YOLO: A novel YOLO model with attentional scale sequence fusion for cell instance segmentation. Image Vis. Comput. 2024, 147, 105057. [Google Scholar] [CrossRef]
  19. Zhang, H.; Zhang, S. Shape-iou: More accurate metric considering bounding box shape and scale. arXiv 2023, arXiv:2312.17663. [Google Scholar]
  20. Zhang, H.; Zhang, S. Focaler-iou: More focused intersection over union loss. arXiv 2024, arXiv:2401.10525. [Google Scholar]
Figure 1. Partial dataset.
Agronomy 15 01515 g001
Figure 2. GYS-RT-DETR network structure (improved network structure).
Agronomy 15 01515 g002
Figure 3. The collection and distribution structure. (In (a), Low FAM and Low IFM are, respectively, the low-level feature alignment module and low-level information fusion module in the low-level branch. In (b), High FAM and High IFM are, respectively, the advanced feature alignment module and advanced information fusion module).
Agronomy 15 01515 g003
Figure 4. SSFF module.
Agronomy 15 01515 g004
Figure 5. Comparison of Neck network structures (The (left) shows the Neck network structure of the RT-DETR-R18+GD network model, and the (right) shows the Neck network with the introduction of SSFF sequence feature fusion mechanism on the basis of RT-DETR-R18+GD).
Agronomy 15 01515 g005
Figure 6. Group_taylor pruning strategy process.
Agronomy 15 01515 g006
Figure 7. Knowledge distillation framework.
Agronomy 15 01515 g007
Figure 8. Comparison of detection effects ((a) on the left shows the detection effect of GYS-RT-DETR model, and (b) on the right shows the detection effect of RT-DETR-R18 original model).
Agronomy 15 01515 g008
Figure 9. Precision–recall curves of the model under different loss functions.
Agronomy 15 01515 g009
Figure 10. Comparison results of training curves for different models.
Agronomy 15 01515 g010
Figure 11. Visual comparison results of GYS-RT-DETR and RT-DETR-R18 characteristic heatmaps ((a) on the left is the original image, (b) in the middle is the heatmap after GYS-RT-DETR model detection, and (c) on the right is the heatmap after RT-DETR-R18 model detection).
Agronomy 15 01515 g011
Figure 12. Comparison results of average precision of different citrus diseases (the (left) shows the average precision of RT-DETR-R18 for different diseases, and the (right) shows the average precision of GYS-RT-DETR for different diseases).
Agronomy 15 01515 g012
Figure 13. Comparison of receptive fields of different models (the first column in the figure shows the visualization results of the receptive field of RT-DETR-R18, the second column shows the visualization results of the receptive field of RT-DETR-R18+GD, and the third column shows the visualization results of the receptive field of RT-DETR-R18+GD+SFF, where the first row shows the receptive field of the P3 level feature map, the second row shows the receptive field of the P4 level feature map, and the third row shows the receptive field of the P5 level feature map).
Agronomy 15 01515 g013
Figure 14. Pareto frontier of mAP vs. FPS for different pruning rates.
Agronomy 15 01515 g014
Figure 15. Comparison results of channel parameter quantities between the GYS-RT-DETR model and the pruning model (yellow represents different channel parameter quantities of the GYS-RT-DETR model, and red represents different channel parameter quantities of the pruning model).
Agronomy 15 01515 g015
Figure 16. Thermal map results of student model and teacher model in actual scene recognition. (a) is the original image, (b) is the thermal map detection result of the student model, and (c) is the thermal map detection result of the teacher model).
Agronomy 15 01515 g016
Table 1. Data structure of citrus diseases.
Citrus Disease CategoriesNumber of ImagesCollection Time
Brown spot disease639:00 a.m.~11:00 a.m.,
15:00 p.m.~17:00 p.m.
Citrus black spot disease372
Citrus canker277
Citrus oil spot disease121
Citrus scab disease366
Citrus huanglongbing222
healthy citrus fruits604
Citrus leprosy187
Orange scab72
Soot disease160
Thrips350
Citrus lignification91
Table 2. Comparison of GYS-RT-DETR with Gold-YOLO and ASF-YOLO.
ModelBase ModelMechanismsLoss Function
GYS-RT-DETRRT-DETR-r18Gather-and-Distribute (GD)
Scale Sequence Feature Fusion (SSFF)
Focaler-ShapeIoU
Gold-YOLOYOLOv5Gather-and-Distribute (GD) Mechanism
Lightweight Adjacent Layer Fusion (LAF)
Global Context Fusion Module (GCFM)
Traditional IoU loss + classification loss (cross-entropy)
ASF-YOLOYOLOv5Scale Sequence Feature Fusion (SSFF) Module
Channel and Position Attention Mechanism (CPAM)
EIoU loss function + classification loss (cross-entropy)
Table 3. Definition of formulas for various indicators.
Evaluation IndicatorsEvaluation Formula
Precision (P) T P T P + F P
Recall (R) T P T P + F N
F 1 -Scores 2 × R × P R + P
Average Precision (AP) 0 1 P ( R ) d R
Mean Average Precision (mAP) i = 1 N A P i N
Accuracy (Acc) T P + T N T P + T N + F N + T F
Table 4. Parameter settings for different stages of model pruning.
StageParameter Settings
PruningPruning rate/%50.0~66.7%
Global_pruningFalse
Image size 640 × 640
Epochs250
Fine-tuningBatch size16
OptimizerAdamW
Table 5. Distillation test parameter settings.
Parameter TypeParameter Value
Image size 640 × 640
Epochs200
Batch size16
Teacher Network Layer3,5,6,7,25,22,19
Student Network Layer3,5,6,7,28,25,30
Table 6. Comparison of model improvement results. (“√” represents the fact that the experimental model adopts this mechanism, while “×” represents that the experimental model cancels this mechanism).
Baseline ModelGDSSFFP/%R/%mAP/% F 1 /%FLOPs/GParams/MModel Size/MBFPS(f/s)
RT-DETR-r18××75.672.672.573.057.019.848.5344.5
RT-DETR-r18×76.171.972.173.060.022.245.5275.1
RT-DETR-r18×73.172.170.272.061.520.139.2267.2
RT-DETR-r1878.473.773.975.063.222.545.9239.5
Table 7. Comparison results of different loss functions. (“√” represents that the experimental model adopts this Loss function, while “×” represents that the experimental model cancels this loss function).
Baseline ModelFocaler-ShapeIoUWIoUCIoUGIoUP/%R/% m A P 0.5 / % m A P 0.5 : 0.95 / % F 1 / %
RT-DETR-r18 + GD+SSFF×××78.073.876.549.875.0
RT-DETR-r18 + GD+SSFF×××78.073.773.946.975.0
RT-DETR-r18 + GD+SSFF×××73.872.272.446.873.0
RT-DETR-r18 + GD+SSFF×××75.969.071.445.772.0
Table 8. Performance comparison results of different models.
ModelP/%R/%mAP/%F1/%FLOPs/GParams/MModel Size/MBFPS (f/s)
GYS-RT-DETR78.073.876.575.063.222.543.8239.5
rtdetr-EfficientViT70.363.964.364.323.710.722.7255.8
rtdetr-VanillaNet74.565.468.869.0110.221.755.8182.8
rtdetr-unireplknet65.765.767.465.035.313.112.7247.0
rtdetr-SwinTransformer66.464.663.464.098.136.626.8129.7
YOLOv8n68.371.473.969.08.13.06.31916.8
YOLO v5n68.365.371.266.07.12.55.31920.9
YOLO v10m74.263.673.367.058.915.333.5444.9
RT-DETR-r1875.672.672.573.057.019.848.5344.5
Table 9. Experimental results of different pruning rates based on the Group_taylor pruning strategy. ("×" indicates that no pruning rate was used in this experiment).
Experiment Serial NumberModelParams/MFLOPs/GModel Size/MB m A P 0.5 /% m A P 0.5 : 0.95 /%FPS (f/s)Pruning Rate/%
0GYS-RT-DETR22.563.243.876.549.8239.5×
1Group_taylor exp115.1 (67.1%)39.6 (62.7%)31.3 (71.5%)77.9 (+1.4)51.3 (+1.5)294.9 (+55.4)66.7
2Group_taylor exp213.3 (59.1%)34.2 (54.1%)27.6 (63.0%)78.2 (+1.7)51.4 (+1.6)327.6 (+88.1)55.6
3Group_taylor exp311.0 (48.9%)27.7 (43.8%)23.0 (52.5%)75.7 (−0.8)49.4 (−0.4)354.8 (+115.3)50.0
Table 10. Distillation constant parameter settings.
Parameter TypeParameter Value
kd_loss_decayLinear
kd_loss_epoch1.0
logical_loss_typelogical
kd_loss_typeall
Table 11. Comparison results of distillation loss functions for different features of student teacher models.
Student Model Feature   Loss   Function m A P 0.5 / % m A P 0.5 : 0.95 / % FLOPs/GParams/MP/%R/% F 1 /%
Pruning modelx75.749.427.711.075.175.576.0
cwd77.2 (+1.5)50.8 (+1.4)27.711.075.9 (+0.8)75.9 (+0.4)77.0 (+1.0)
mimic76.4 (+0.7)50.4 (+1.0)27.711.080.6 (+5.5)72.3 (−3.2)76.0 (+0.0)
mgd76.8 (+1.1)50.1 (+0.7)27.711.080.9 (+5.8)74.1 (−1.4)77.0 (+1.0)
chsim76.5 (+0.8)50.3 (+0.9)27.711.076.0 (+0.9)74.4 (−1.1)75.0 (−1.0)
sp77.7 (+2.0)51.1 (+1.7)27.711.078.6 (+3.5)76.3 (+0.8)77.0 (+1.0)
Table 12. Comparison results of models at different stages.
Model m A P 0.5 /% m A P 0.5 : 0.95 /%FLOPs/GParams/MP/% R / % F 1 / %
RT-DETR-r1872.546.157.019.875.672.673.0
GYS-RT-DETR76.549.863.222.578.073.875.0
Pruning model75.749.427.711.075.175.576.0
Distillation optimization model77.751.127.711.078.676.377.0
Disclaimer/Publisher’s Note: The statements, opinions and data contained in all publications are solely those of the individual author(s) and contributor(s) and not of MDPI and/or the editor(s). MDPI and/or the editor(s) disclaim responsibility for any injury to people or property resulting from any ideas, methods, instructions or products referred to in the content.

