1. Introduction
Tomatoes are among the most consumed vegetables worldwide. While the global average per capita consumption is approximately 5 kg per year, certain countries like Turkey and Italy report significantly higher rates, with per capita consumption reaching up to 138 kg and 109 kg per year, respectively [
1]. One of the most significant factors negatively affecting yield and quality in tomato production is diseases caused by harmful organisms. Due to climate and environmental factors, tomatoes are susceptible to various diseases during the sowing and growing processes. Detecting these diseases and taking necessary precautions is crucial for producers.
Improving agricultural productivity and reducing crop losses are of great importance for global food security. Especially tomatoes (
Solanum lycopersicum), due to their economic value and widespread consumption, are among the most widely cultivated vegetables worldwide. However, tomato production faces serious threats from various plant diseases. These diseases, caused by fungal, bacterial, and viral agents, can result in yield losses ranging from 20% to 80% if not diagnosed in a timely and accurate manner [
2]. Early detection of tomato diseases not only increases yield but also helps reduce pesticide use. Unconscious and excessive use of chemical treatments poses significant risks to environmental pollution, soil health, and human health. In this context, fast and reliable detection of diseases is of critical importance for sustainable agricultural practices [
3].
Traditional visual diagnostic methods require expertise, are time-consuming, and prone to errors. Therefore, the use of artificial intelligence-based methods, such as image processing and machine learning in agriculture, has significantly increased in recent years. Systems employing deep learning techniques have particularly attracted attention for their high accuracy in the automatic recognition and classification of diseases [
4].
Many studies on detecting tomato diseases using image processing and machine learning techniques have shown that early diagnosis can improve productivity. For instance, common tomato diseases such as Alternaria alternata and Phytophthora infestans were classified with 97% accuracy using the ResNet50 architecture. This study demonstrated the high performance of deep learning-based models [
5]. Similarly, the Inception-V3 architecture achieved 87.2% accuracy in detecting
Tuta absoluta (tomato leafminer) pests [
6].
Studies using the YOLOv4 architecture have also produced successful results, with a 96.29% accuracy rate in detecting tomato leaf diseases [
7]. Using the Transformer-based TomFormer model, accuracy (mAP) scores of 87%, 81%, and 83% were achieved on the KUTomaDATA, PlantDoc, and PlantVillage datasets, respectively [
8]. The MobileNetV2 architecture, developed for mobile and embedded systems, was evaluated with a 99.30% accuracy rate. These results show that even systems with low computational power can achieve high accuracy [
9]. In a comparative analysis using DenseNet, ResNet50, and MobileNet architectures, the highest accuracy (99%) was achieved with DenseNet, highlighting the superior performance of densely connected networks in processing health data [
10]. Kotwal et al. (2024) classified tomato diseases with 98.7% accuracy using the EfficientNet-B4 architecture [
11].
Molecular biotechnology-based studies have also provided important findings in identifying tomato diseases. A real-time PCR method developed using an LNA probe was shown to detect Dickeya chrysanthemi with a sensitivity of 2 cells [
12]. Using a multiplex RT-PCR method, the tomato viral diseases ToMV and PVY were detected with a 20.1% infection rate [
13]. Another study combining morphological and molecular analyses reported a 27.23% occurrence rate of Alternaria alternata [
14]. In tomato fields in Elazığ, phytoplasma diseases were detected using qPCR and Nested qPCR methods [
15].
Another study focused on creating and analyzing an image-based dataset for classifying diseases in
Agaricus bisporus (J.E. Lange) Imbach cultures. The dataset included images of healthy mushrooms and those affected by various disease classes. The study aimed to create a dataset useful for identifying and classifying mushroom diseases using deep learning or other machine learning techniques. During dataset creation, a portable mushroom imaging system developed for the study was used during visits to mushroom farms, resulting in approximately 7250 diseased mushroom images and 1800 healthy images (about 3000 images for each lighting condition). Four different disease classes commonly found in cultivated mushrooms were observed, and each mushroom was imaged under three different lighting conditions [
16].
Similar deep learning approaches have been used in different agricultural fields such as wheat variety identification [
17,
18], but the focus in this work is on tomato diseases. Deep learning techniques have been widely adopted in plant disease detection, especially for economically important vegetables like tomatoes. Convolutional Neural Networks (CNNs) have demonstrated significant success in classifying tomato leaf diseases such as early blight, late blight, and leaf mold. For instance, Mohanty et al. (2016) used a deep CNN trained on the PlantVillage dataset to classify 14 crop species and 26 diseases, achieving over 99% accuracy in tomato disease recognition [
19]. Similarly, Fuentes et al. (2017) proposed a real-time system combining Faster R-CNN and VGG16 for detecting multiple diseases in tomato plants under natural field conditions [
20]. More recent approaches integrate transfer learning with models such as ResNet, EfficientNet, and MobileNet, enabling high accuracy even with limited datasets. These studies highlight the increasing role of deep learning in building reliable, fast, and scalable systems for automated diagnosis of tomato diseases, which aligns closely with the objective of the present study [
19,
20].
In this study, a five-class classification problem was addressed to detect tomato diseases using a dataset consisting of original tomato images collected under real-world conditions. The five classes include tomato downy mildew, early leaf blight, gray mold, bacterial canker and spot, and healthy tomatoes. These categories were selected due to their prevalence and economic importance in tomato production. Initially, the dataset consisted of 3207 images collected from tomato plants at various growth stages and different plant parts including leaves, green tomatoes, and red tomatoes. To improve the generalization ability of the model and address the class imbalance issue, data augmentation techniques such as rotation, translation, scaling, and contrast adjustment were applied, resulting in a balanced and enriched dataset of 6414 images. This augmented dataset was then split into training and testing subsets in the ratio of 80:20. A total of 21 different deep learning models, including state-of-the-art convolutional neural networks (CNNs) such as ResNet, EfficientNet, DenseNet, and NasNet, were trained and evaluated to determine their classification performance. Based on accuracy and other evaluation metrics, five architectures with a success rate above 85% were selected for further analysis. To better understand the learned representations and potentially increase the classification accuracy, deep feature extraction was performed on these first five models. From each model, 1000 deep features representing the high-level visual patterns learned during training were initially extracted. These features were then subjected to feature selection using five well-established statistical and information-theoretic methods: minimum redundancy maximum relevance (MRMR), Chi-Square (Chi2), ReliefF, ANOVA, and Kruskal–Wallis. The aim was to identify the top 100 most discriminative features from each cluster, thereby reducing dimensionality and improving the performance of traditional machine learning classifiers.
Finally, the selected features were used as input to various machine learning algorithms, and five-fold cross-validation was performed on the same 80:20 split to ensure robust evaluation. This hybrid approach, combining deep learning-based feature extraction with classical machine learning classifiers, enabled a comprehensive performance analysis. The resulting metrics were compared across models, feature selection techniques, and classifiers to determine the optimal configuration for tomato disease detection.
2. Materials and Methods
In this article, diseases that can be detected using visual analysis methods were selected based on a literature review. Studies focusing on visually perceptible plant diseases were examined. Five categories were created from original data consisting of visually identifiable diseases commonly observed in tomatoes: late blight, early blight, gray mold, bacterial canker, and healthy tomatoes.
These diseases can be encountered at any stage of plant cultivation and typically appear as lesions on the leaves, stems, and fruits, and may cause root rot or stem collar rot in seedlings. Early blight (
Alternaria solani) [
21,
22] causes infections in stems, fruits, and leaves. Gray mold (
Botrytis cinerea) [
23] leads to epidermal cracking and water loss in the host, and lesions on stems and fruit stalks that cause fruit drop. Tomato Late blight (
Phytophthora infestans) [
22,
24] initially appears as small, pale green or yellowish spots on leaves, which turn brown to black as the disease progresses, spreading to petioles, branches, and stems. In advanced stages, lesions may tear, dry out, or cause rotting. Bacterial Spot in Tomato (
Xanthomonas vesicatoria) [
22,
25] starts with lesions on leaves resembling oil droplets, surrounded by yellow halos, which turn brownish-black and merge as the disease progresses, leading to yellowing and drying of leaves. Tomato Bacterial Canker and Wilt (
Clavibacter michiganensis subsp.
michiganensis) [
22,
26] shows early symptoms as inward curling, browning, and wilting of leaflets in a localized area of the plant. Infections occurring during the seedling stage can result in stunted growth or rapid wilting and death. In later stages, brown discoloration of vascular tissues may lead to cracks called “cankers” in the stem and branches. Bacterial Speck of Tomato (
Pseudomonas syringae pv. tomato) [
22,
27] manifests as lesions on all above-ground organs, beginning during the seedling stage with numerous brown-black spots on leaves and stems, which can ultimately lead to complete drying of the seedling.
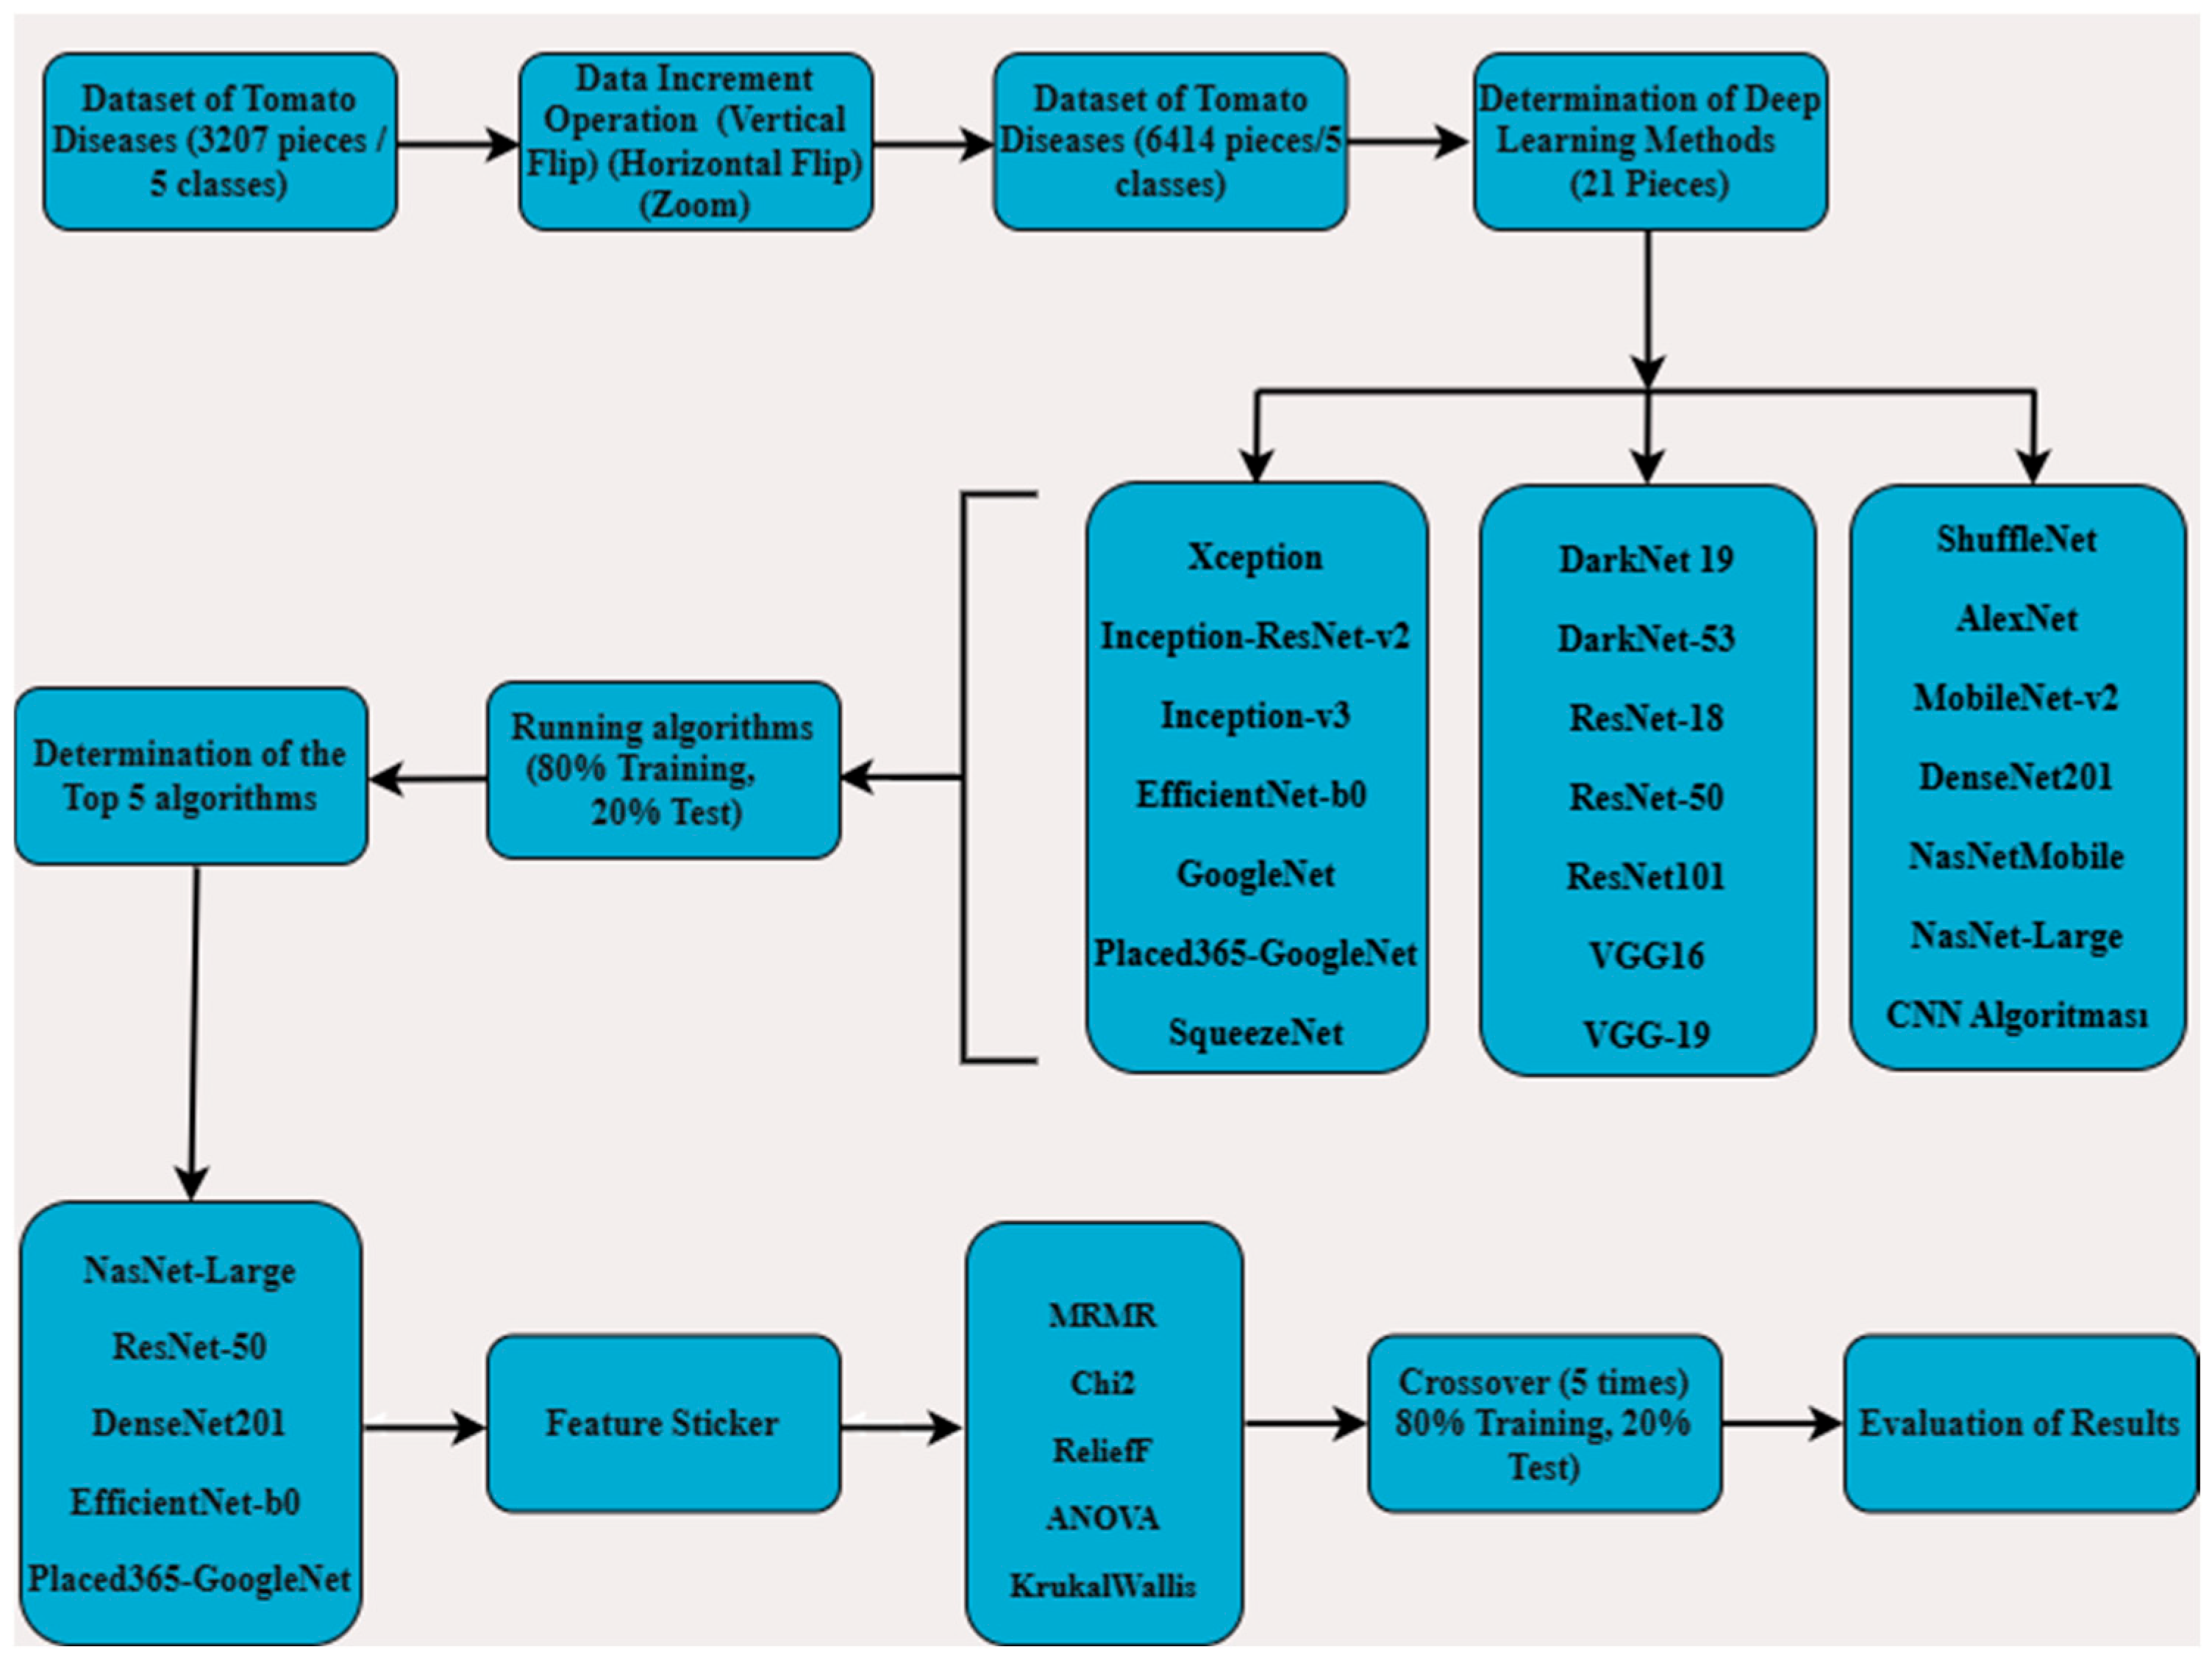
As shown in
Figure 1, a five-class classification was carried out using original data of common tomato diseases—late blight, early blight, gray mold, bacterial canker—and healthy tomatoes. The images were collected in real field conditions at different times of the day (morning, noon, afternoon) to capture variability in natural lighting and shading. Multiple angles and distances were used to reflect realistic scenarios for tomato disease detection. Initially, a total of 3207 data samples were expanded to 6414 using data augmentation techniques. These 6414 data samples were then used to train models using 21 different deep learning algorithms, with 80% used for training and 20% for testing. From the results, the top 5 deep learning algorithms were identified. Feature extraction was applied using these 5 algorithms, resulting in the extraction of 1000 features. Then, 100 features were selected using MRMR, Chi
2, ReliefF, ANOVA, and Kruskal–Wallis methods. These selected features were split into 80% for training and 20% for testing, and reclassification was performed using machine learning algorithms with 5-fold cross-validation. The results obtained from this process were evaluated.
2.1. Five-Fold Cross-Validation
To evaluate the performance and generalizability of the classification models, five-fold cross-validation was employed. In this method, the dataset is randomly partitioned into five equal-sized subsets (folds). For each iteration, four folds are used for training, and the remaining one is used for testing. This process is repeated five times, with each fold used exactly once as the testing set. The average of the five performance metrics is then calculated to obtain a more robust estimate of the model’s accuracy. This technique helps reduce the risk of overfitting and provides a more reliable assessment compared to a single train-test split [
28,
29].
2.2. Model Performance Metrics
Training and test accuracy are two basic metrics commonly used to evaluate model performance. Training accuracy shows how well the model performed on the data it used in the learning process, while test accuracy reflects the model’s ability to generalize on independent data that it has not seen before. A high training accuracy alone indicates that the model may have memorized the data and may fail on new data (overfitting). In contrast, test accuracy reveals the model’s predictive power on real-world data. If training accuracy is high but test accuracy is low, the model has over-learned; if both accuracies are low, the model has not learned enough (underfitting). Therefore, the success of a model should be evaluated not only on the training data but also on the test data [
29].
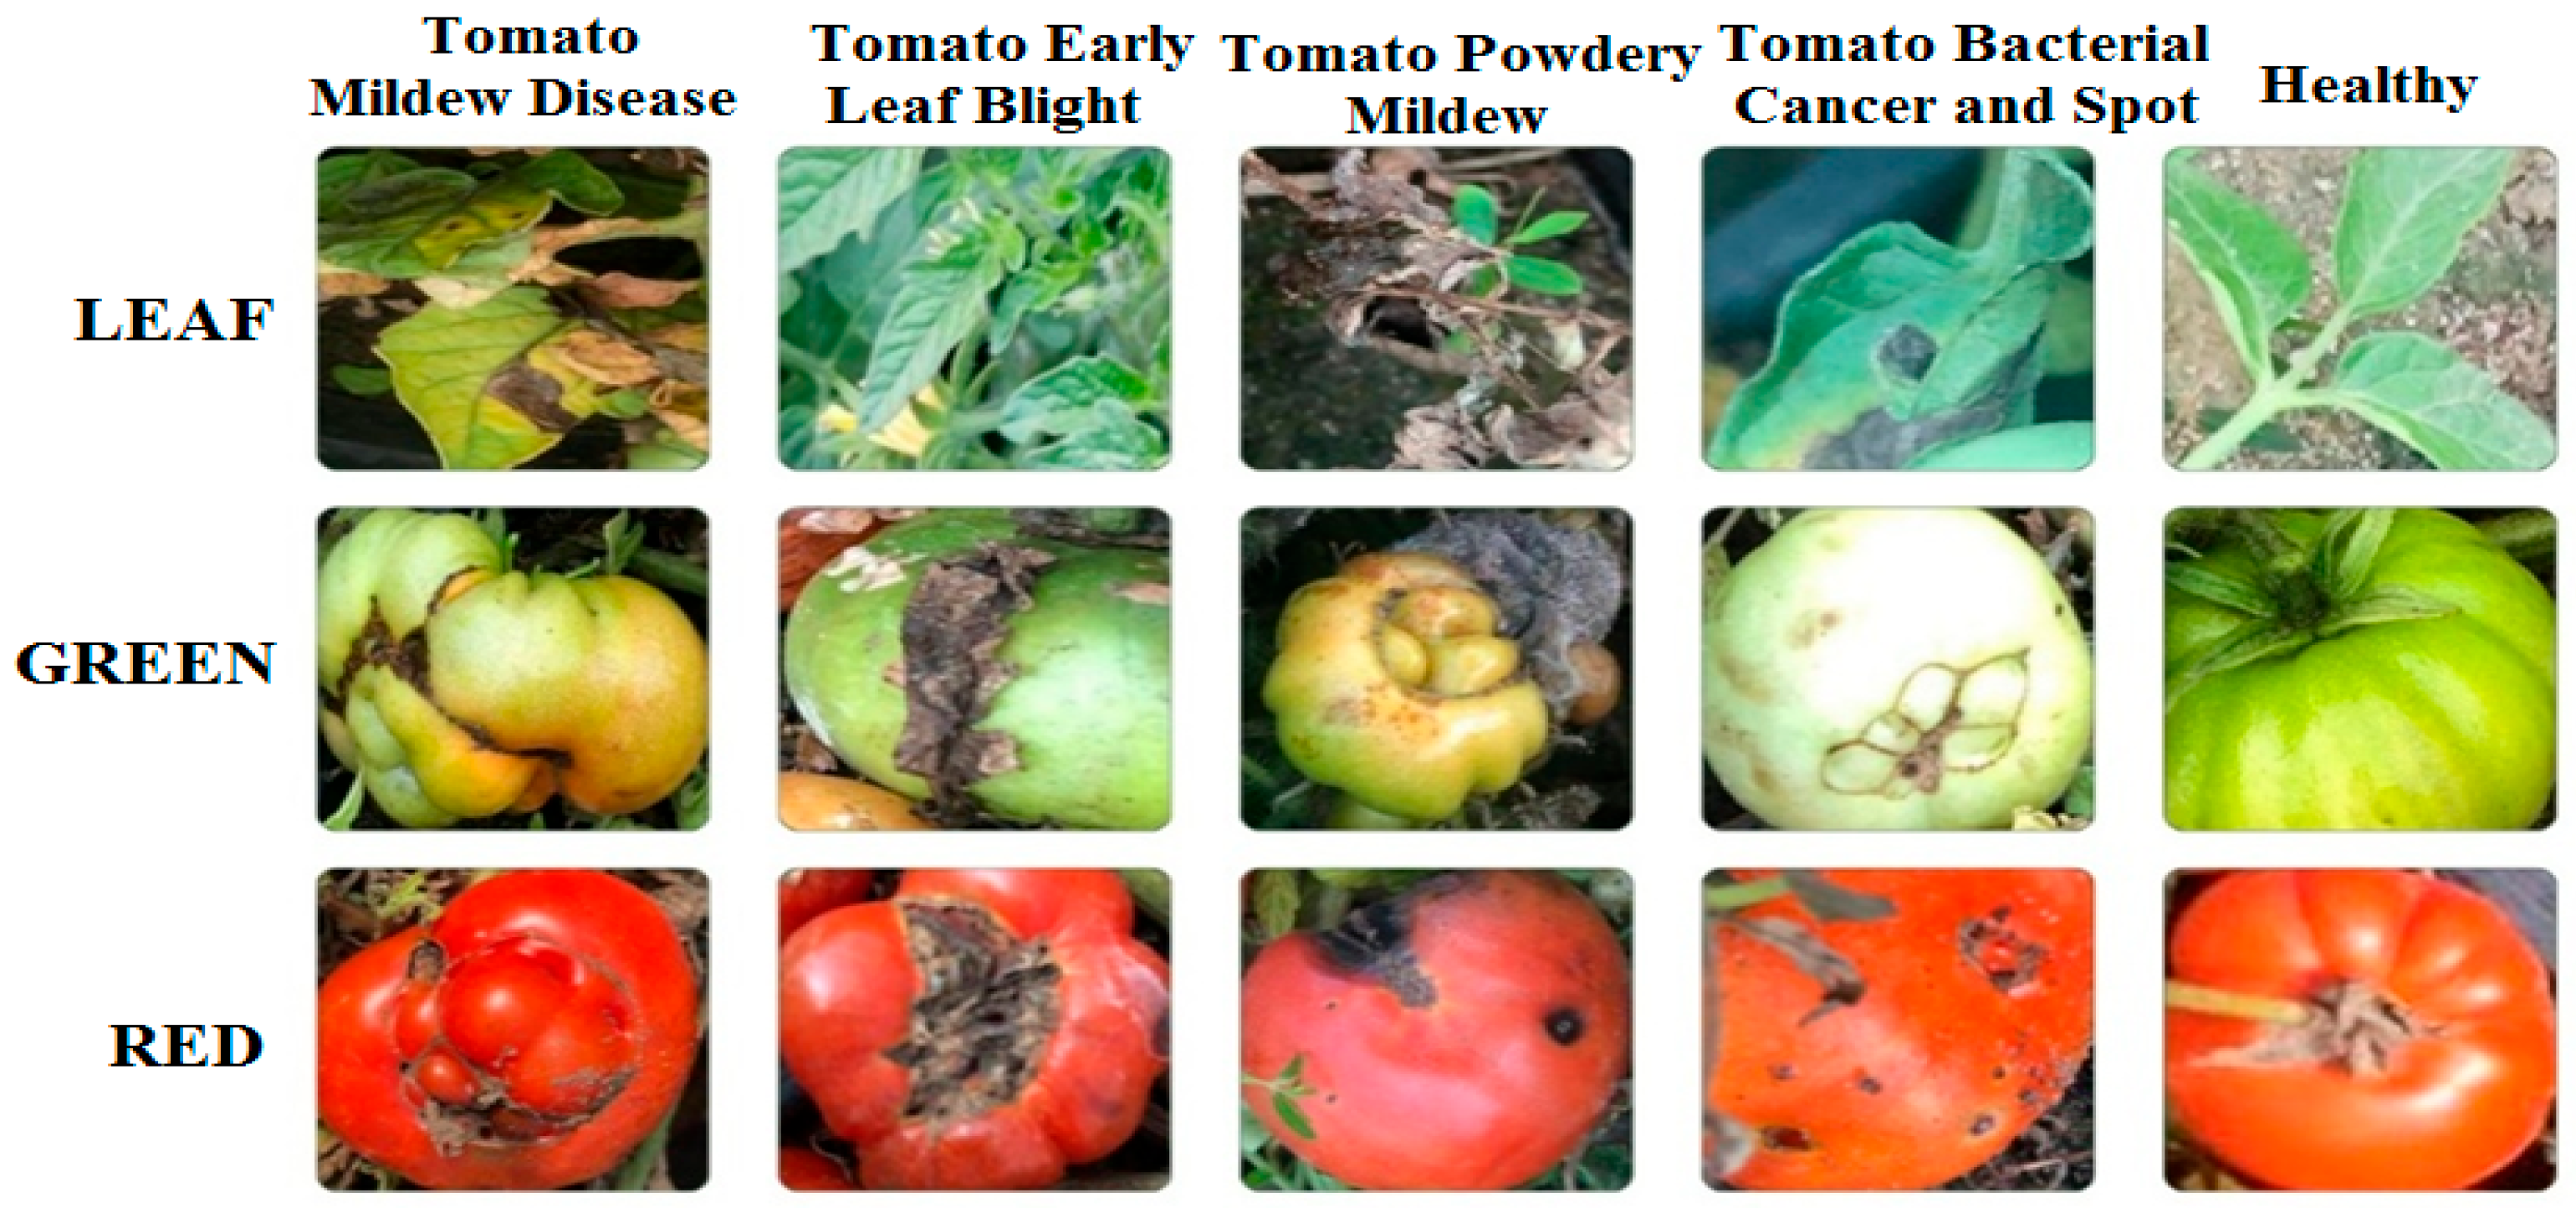
In this study, a dataset composed of unstructured images of red and green tomatoes and leaves, as shown in
Figure 2, was used. This study aims to fill the gap in the literature using this dataset and contribute to the development of more effective pest management strategies for agriculture.
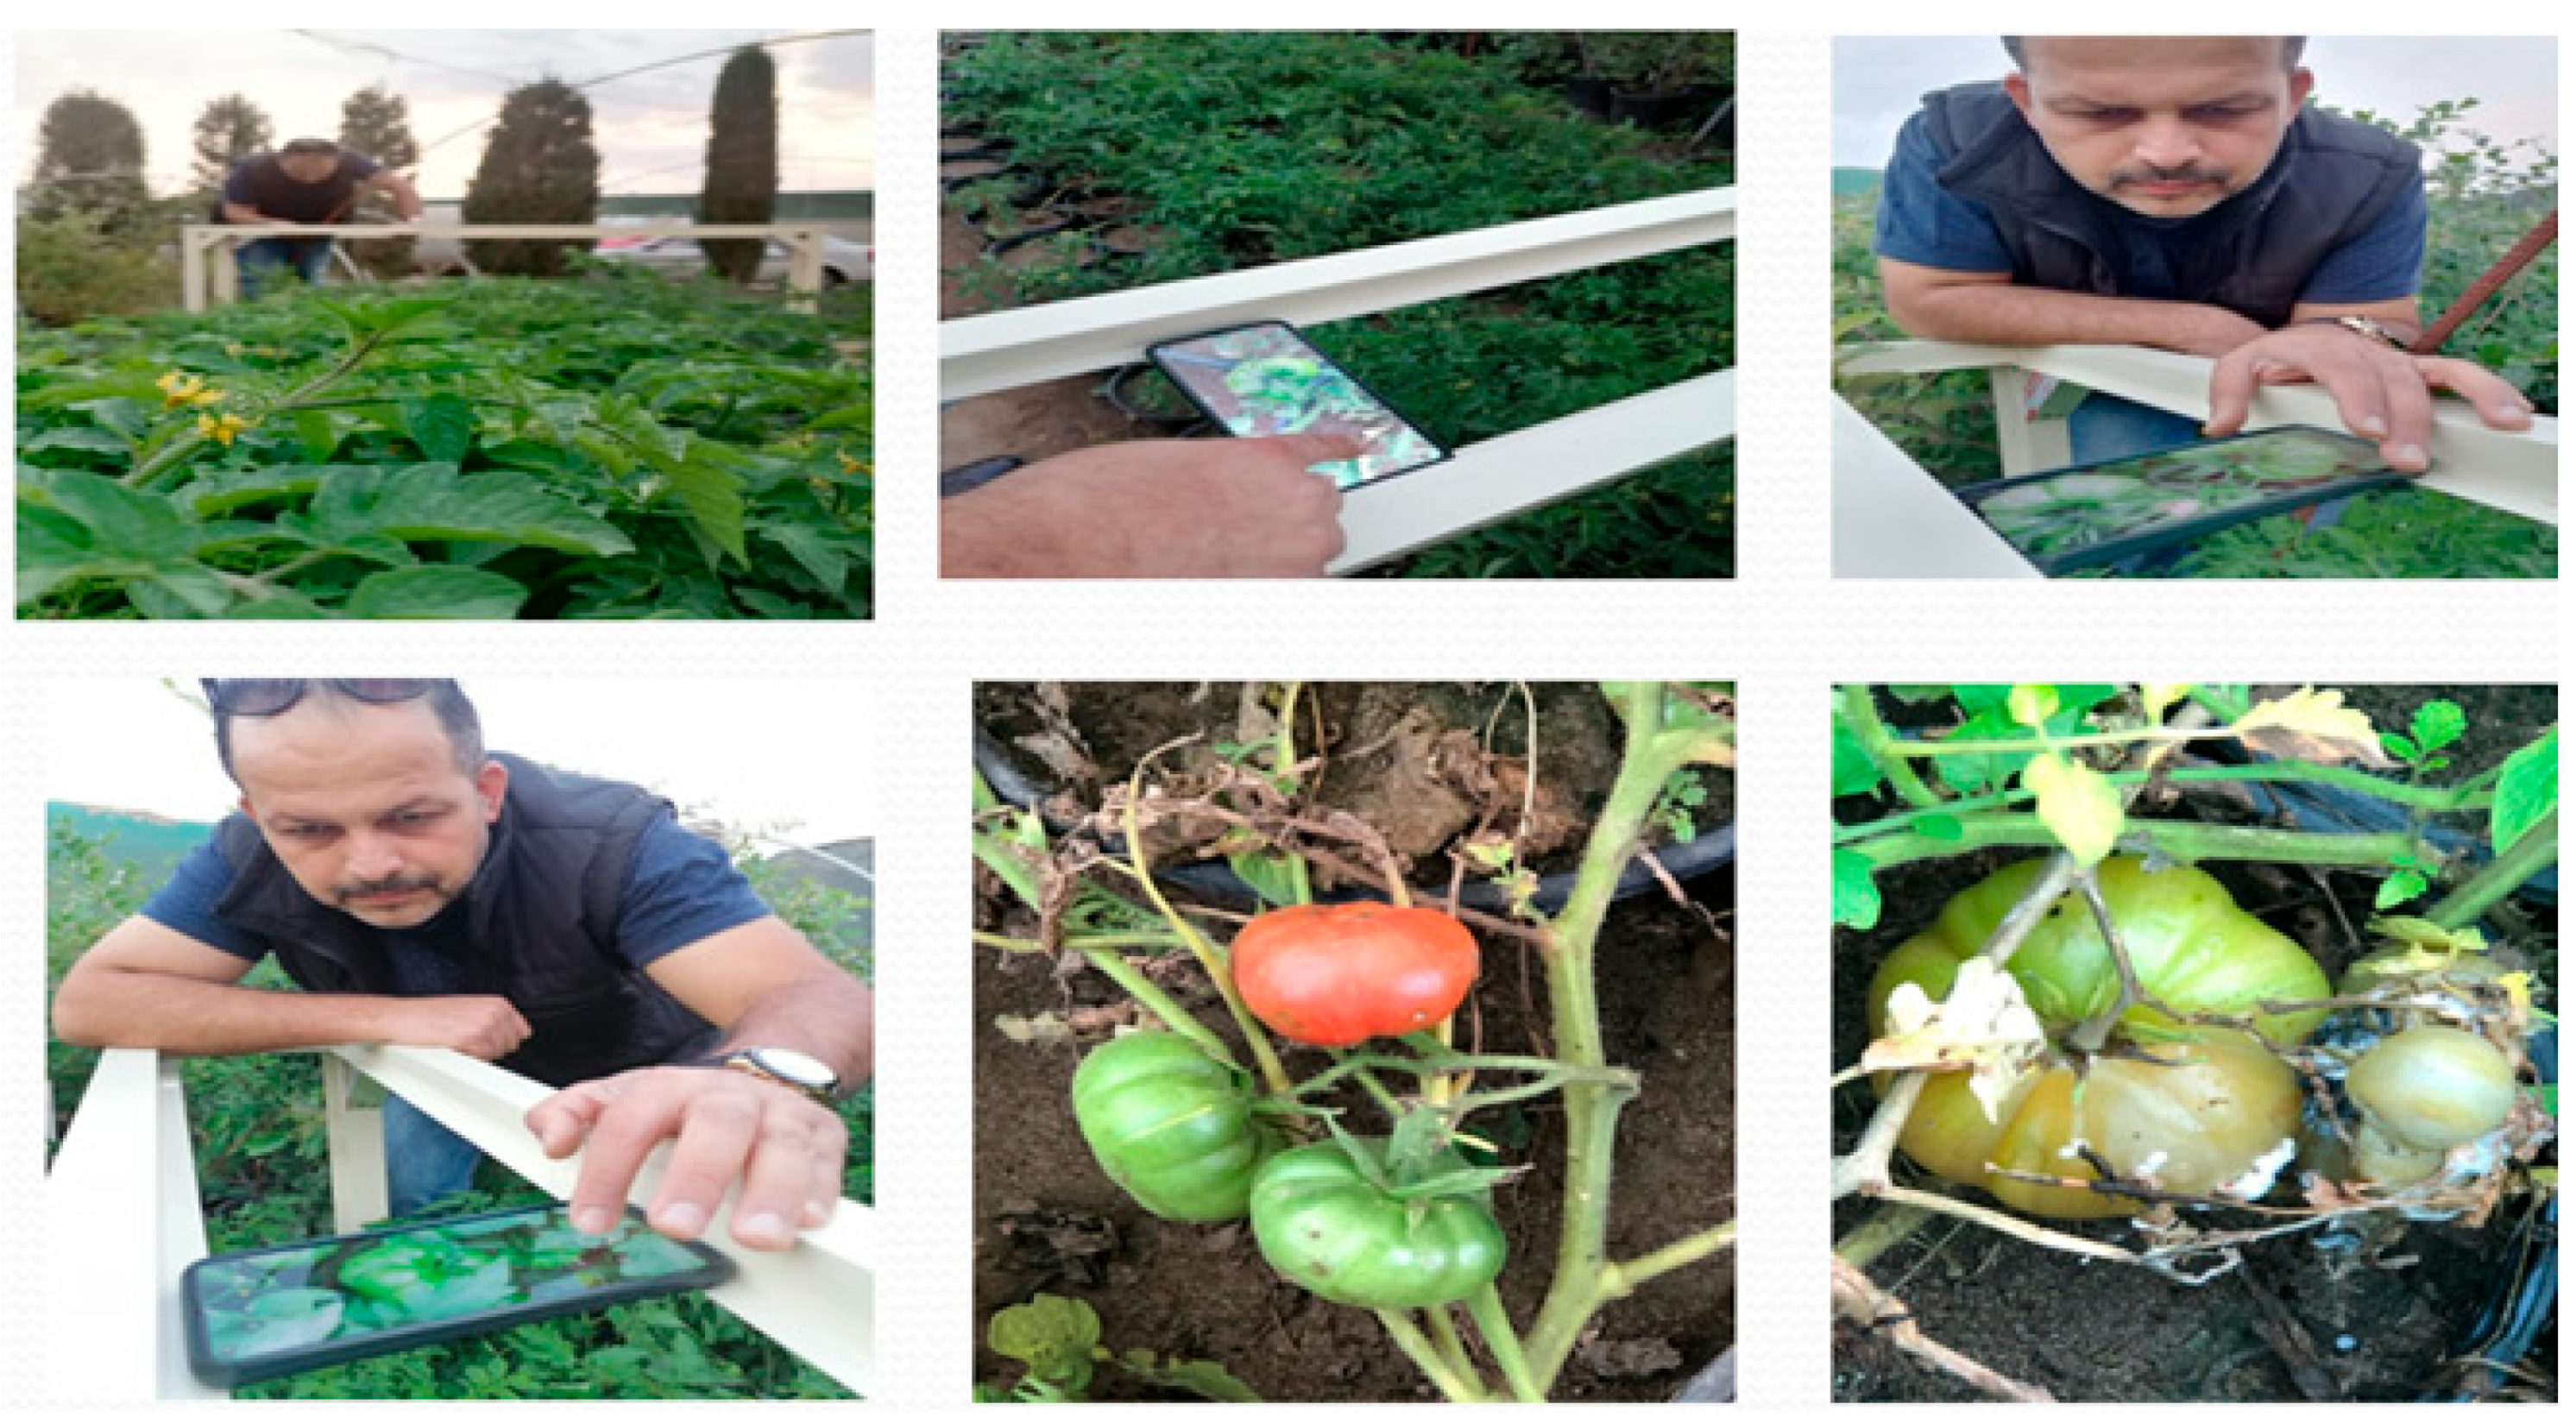
The tomato disease data were collected from the tomato greenhouse established in Kirkuk province, as shown in
Figure 3. Tomato planting was carried out, and their development was monitored daily.
The images of the cultivated tomato plants were captured using the Redmi Note 9 Pro smartphone (Xiaomi Corporation, Beijing, China), which features an AI-powered quad-camera system. This system includes a 64-megapixel main camera with an f/1.89 aperture, an 8-megapixel ultra-wide-angle camera with an f/2.2 aperture, a 2-megapixel depth camera with an f/2.4 aperture, and a 5-megapixel macro camera also with an f/2.4 aperture and focal length.
As shown in
Table 1, the dataset consists of 3207 original tomato images, including leaves, red tomatoes, and green tomatoes, affected by diseases such as late blight, early blight, gray mold, bacterial canker, and bacterial spot.
The data augmentation techniques used in this work are implemented through the ImageDataGenerator class of the TensorFlow Keras library. These techniques are designed to improve the ability of our model to recognize different image variations by increasing the diversity of our image-based datasets. The main data augmentation techniques used were horizontal flip, vertical flip, and zoom.
These parameters were used in the training process of the model and the ratios determined for each transformation technique were carefully selected to maximize the adaptability of the model to scenarios that the model may encounter on real world data. In terms of the number of data augmentations, approximately 2 to 4 augmented images were produced for each original image. This significantly increased the diversity of our dataset and allowed the model to learn from a wider range of data during training. As a result, these data augmentation techniques significantly improved the overall performance of our model and allowed it to work more effectively on complex image recognition tasks. As a result of the data augmentation method, as shown in
Table 1, the study was carried out with a total of 6414 data, including mildew disease (1730), early leaf blight (968), canker mildew (1006), bacterial cancer and spot (1046), and normal healthy tomato (1664).
The computer used for training the deep learning algorithms was equipped with a 12th Gen Intel® Core™ i9-12900HX processor operating at 2.30 GHz, 32.0 GB of RAM, and a 64-bit operating system.
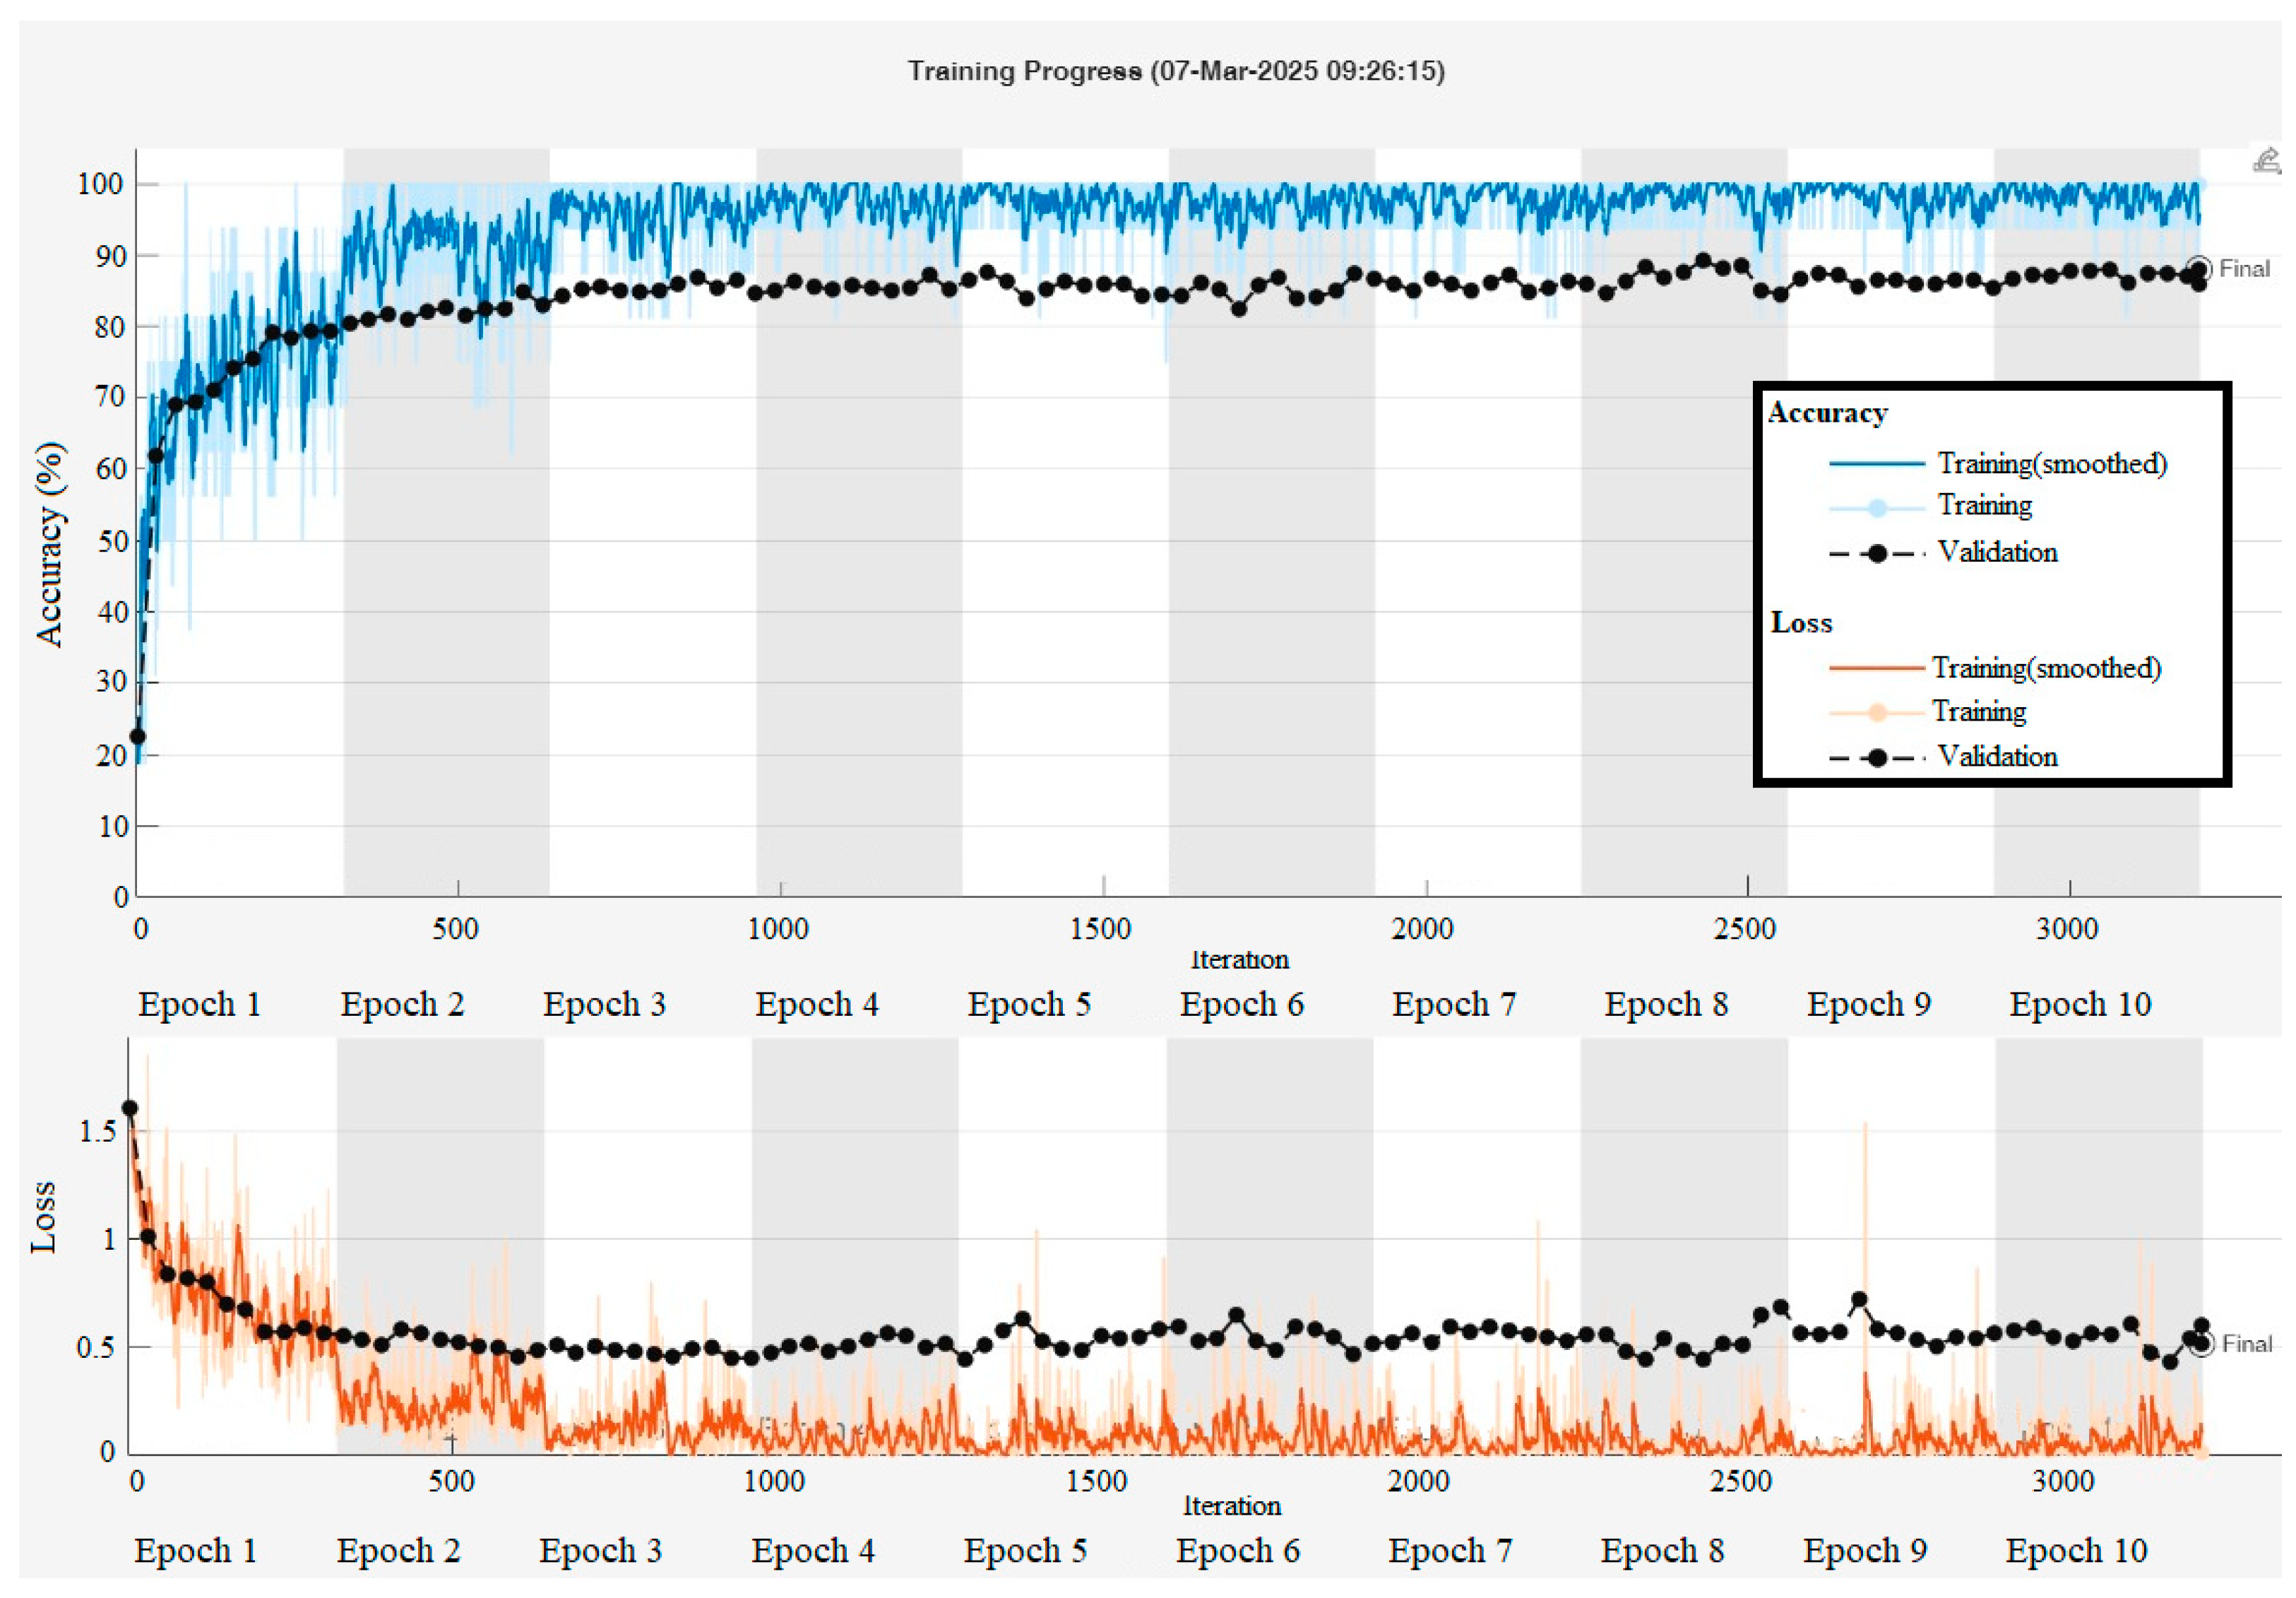
In the classification of tomato diseases, a total of 21 deep learning algorithms were employed, including CNN, Inception-ResNet-v2, GoogleNet, Places365-GoogleNet, SqueezeNet, DarkNet-53, ResNet-50, AlexNet, MobileNet-v2, EfficientNet-b0, DenseNet201, NasNetMobile, ResNet-18, DarkNet-19, VGG-19, ShuffleNet, Xception, Inception-v3, ResNet-101, VGG-16, and NasNet-Large. These models were trained using randomly selected data split into 80% for training and 20% for testing. The training parameters of the top five algorithms, those that achieved the highest classification accuracy, are presented in
Table 2. MATLAB (R2024b, MathWorks, Natick, MA, USA) training result graphs and values of the NasNet-Large algorithm are given in
Figure 4.
3. Results
This study aims to detect and classify four common diseases affecting tomato plants. The augmented dataset presented in
Table 3 includes the training and testing accuracy rates, as well as the execution times for 21 different deep learning algorithms. Upon examining
Table 3, it is observed that the NasNet-Large algorithm achieved the highest accuracy, with a training accuracy of 88.07% and a testing accuracy of 87.23%. However, this performance came at a significant computational cost, with a training time of 2729 min and 39 s, indicating a disproportionate time-to-performance ratio.
Considering both time and performance metrics, the ResNet-50 algorithm demonstrated a more balanced profile, achieving a training accuracy of 88.07% and a testing accuracy of 86.85%, with a training duration of 625 min and 25 s. This indicates that ResNet-50 offers a favorable trade-off between computational efficiency and classification performance.
Moreover, the EfficientNet-b0 algorithm yielded 86.53% training accuracy and 85.76% testing accuracy, while completing its training in just 140 min and 51 s. This highlights its rapid execution time combined with high classification accuracy, making it a promising candidate for time-sensitive applications.
Based on the evaluations and as illustrated in
Table 3, the CNN algorithm, with a training accuracy of 66.17% and a testing accuracy of 60.23%, and the DarkNet-19 algorithm, with a training accuracy of 62.67% and a testing accuracy of 57.16%, were identified as the two least effective models in terms of classification performance.
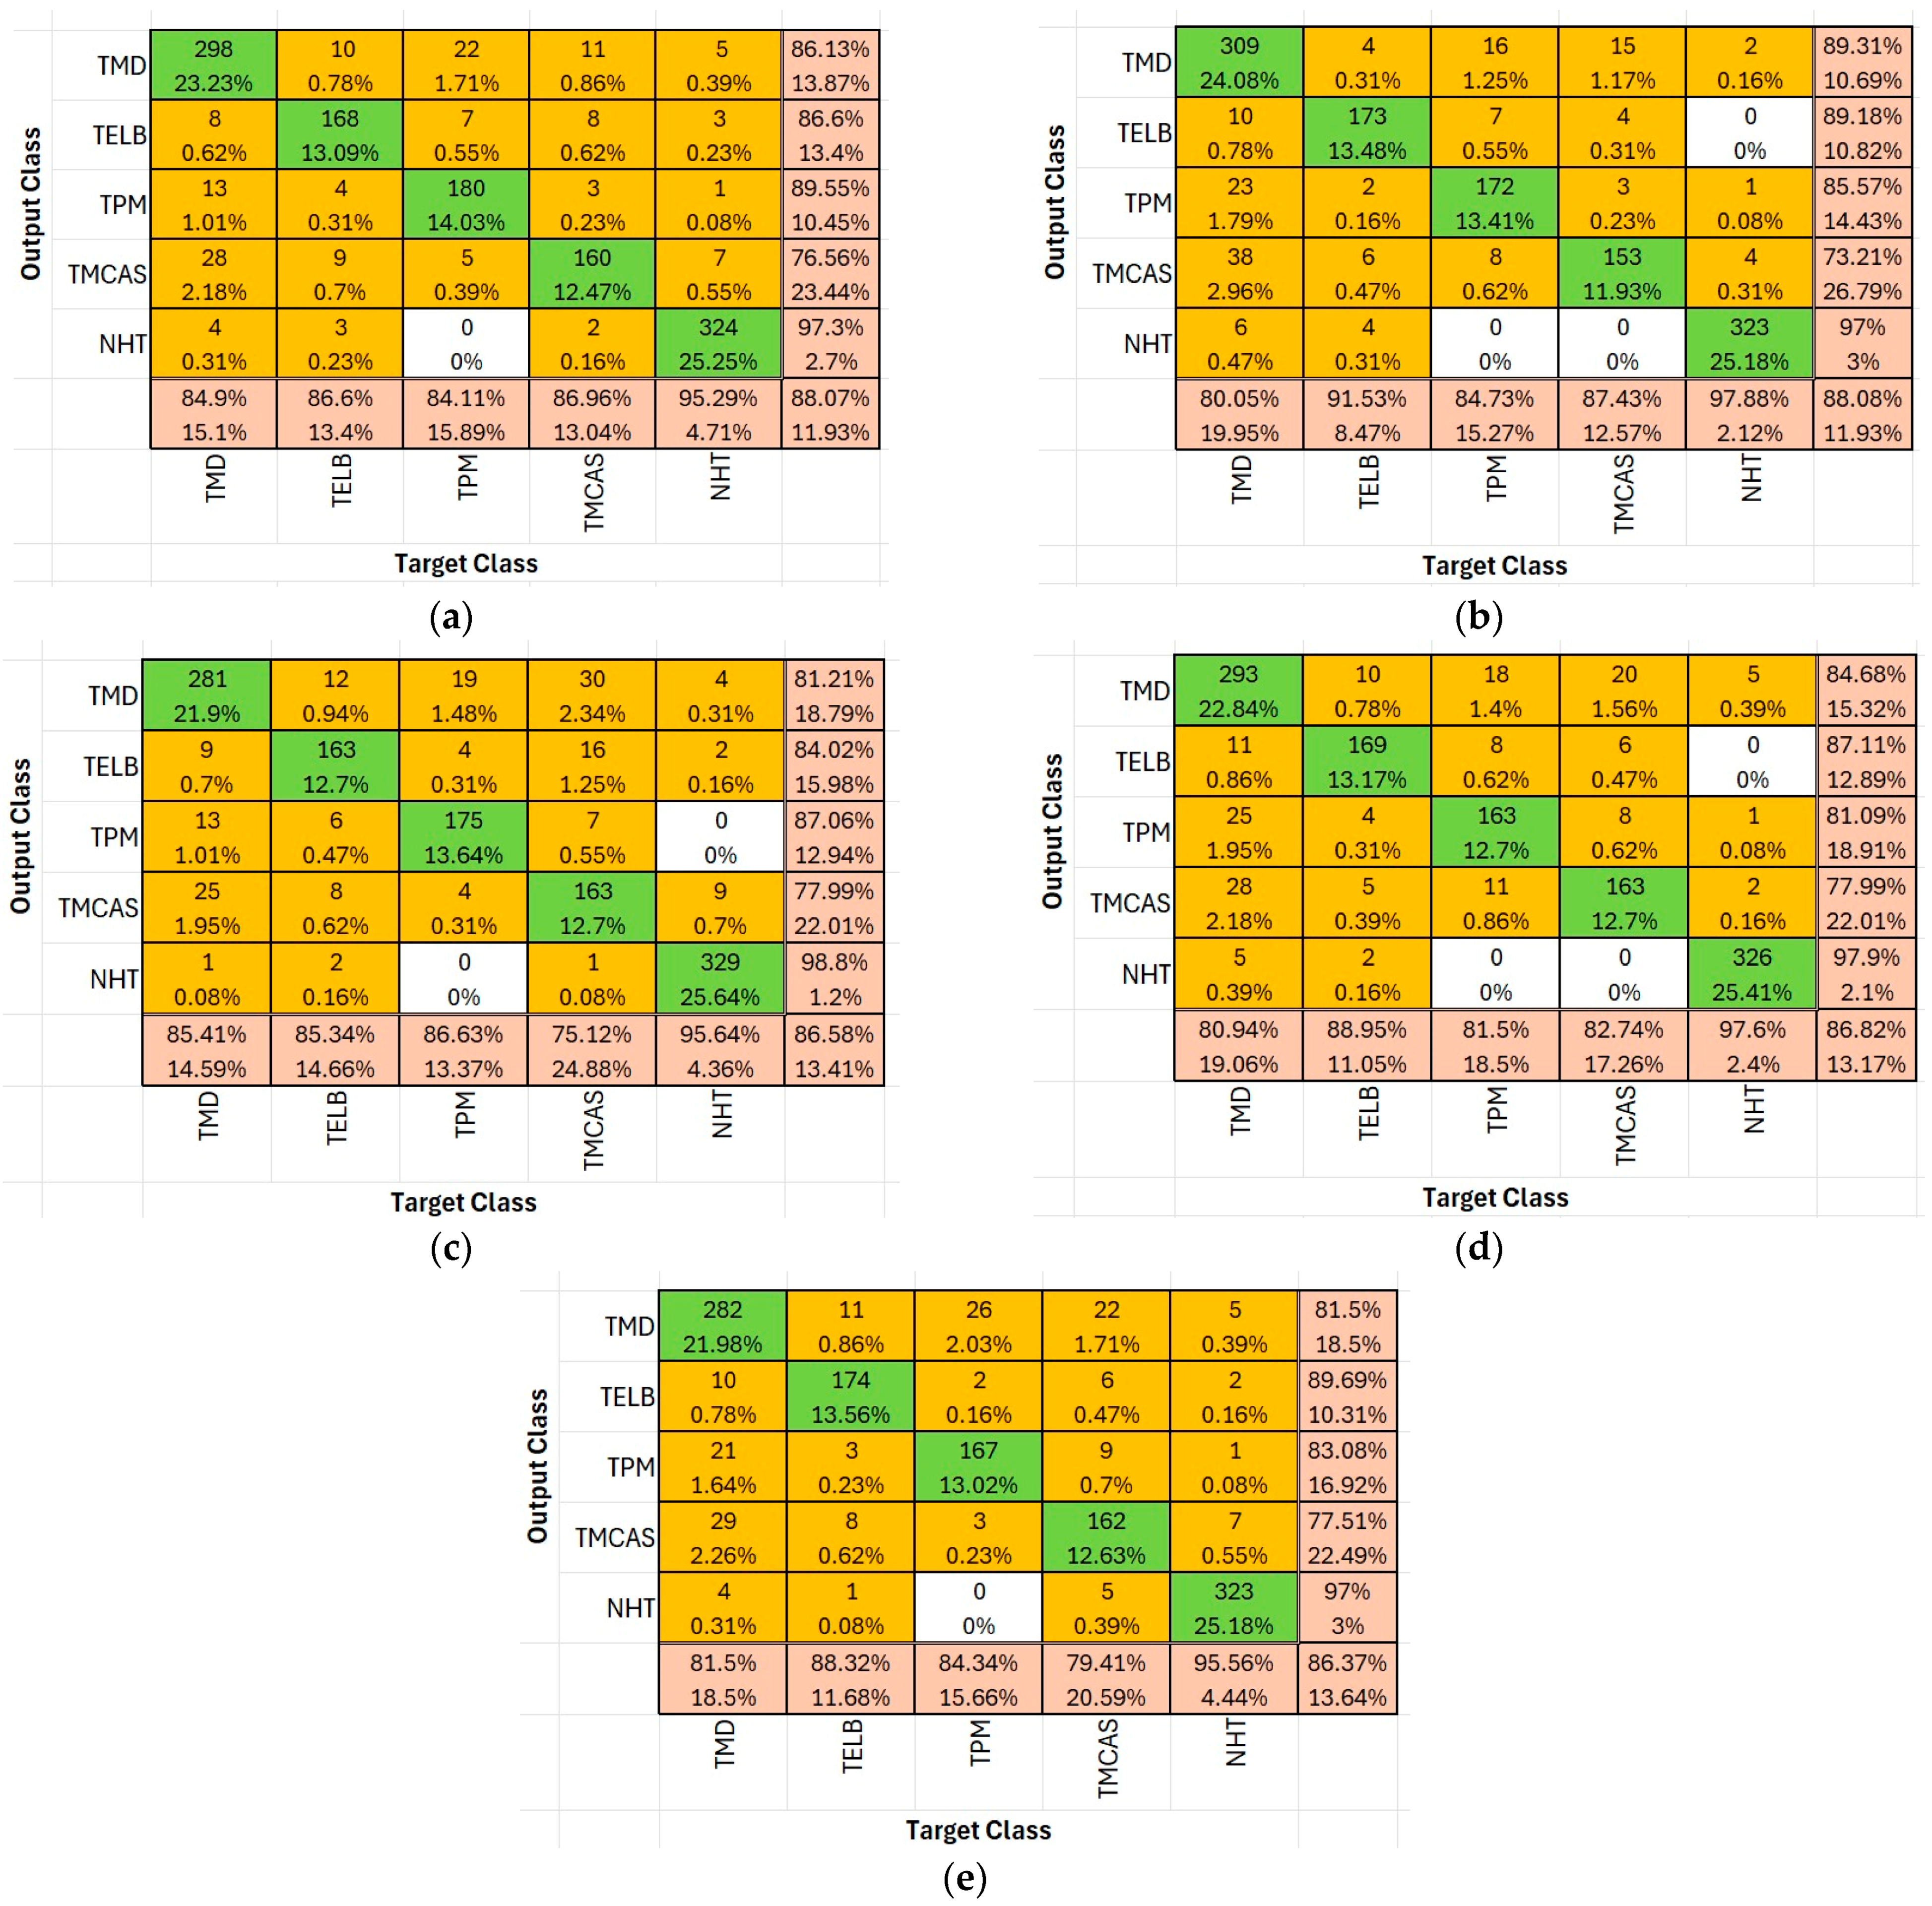
Figure 5 presents the confusion matrices and classification accuracy rates for the four most successful deep learning algorithms—NasNet-Large, ResNet-50, DenseNet201, and EfficientNet-b0—in the context of tomato disease classification. These matrices provide a comparative overview of each model’s ability to distinguish between disease classes and demonstrate their overall predictive effectiveness.
In the confusion matrix:
Green cells indicate high correct classification rates or true positives for each class (diagonal cells), representing accurate model predictions. The darker the green, the higher the percentage of correctly classified instances.
Yellow to orange cells represent misclassifications, with varying shades indicating the severity (i.e., proportion) of the error. Brighter orange signifies higher misclassification counts, while light yellow suggests relatively minor misclassifications.
Bottom row and rightmost column summarize precision and recall values respectively, using similar color scaling for easy visual interpretation of per-class performance.
Table 4 shows the accuracy rates of 21 deep learning methods in disease classification using test comparison matrices.
As shown in
Table 4, late blight (Mildiyö) was classified with over 80% accuracy by 17 models, early blight by 8 models, gray mold by 9 models, and healthy tomato class by 20 models. In contrast, the bacterial canker and spot class was generally classified with relatively lower accuracy across most models. Late blight achieved the highest classification accuracy of 92.2% using the Inception-ResNet-v2 algorithm, while the lowest accuracy of 34.68% was observed with VGG-16. Early blight was best classified with accuracies ranging between 87% and 89% by Place365-GoogLeNet, ResNet-50, and EfficientNet-b0, whereas CNN and DarkNet-19 performed poorly, with accuracies of 41.75% and 44.33%, respectively. Gray mold was best classified by the VGG-16 model, with accuracy values of 91.54% and 90.05%. Bacterial canker and spot disease reached its highest accuracies with VGG-16 and VGG-19, at 91.54% and 78.61%, respectively; however, for most models, the accuracy in this class remained below 60%. For the healthy tomato class, very high accuracy levels exceeding 98% were achieved by Inception-ResNet-v2, DenseNet-201, Xception, and NasNet-Mobile.
Table 5 compares the classification performance of different deep learning models (NasNet-Large, DenseNet201, Res-Net-50, EfficientNetB0, and Places365-GoogLeNet) in five different classes according to Precision, Recall (TPR), F1-Score, and ROC AUC metrics. The highest performance was generally observed in NasNet-Large and Dense-Net201. The NasNet-Large algorithm is the model with the highest average F1-Score and ROC AUC values, and it is seen that it has a very good performance especially for Class 5 with the values of Precision 0.953, Recall 0.973, F1: 0.963, ROC AUC: 0.978. It also has a relatively low F1: 0.867 value in Class 3, but this can be evaluated as not a bad result. DenseNet201 offers a strong performance close to NasNet. Class 5 again stands out with very high scores (F1: 0.962, ROC AUC: 0.986), while for Class 2, Precision is low (0.832) and Recall is high (0.901). This means that the model tends not to miss positive classes. ResNet-50 has low Precision (0.801, 0.847) in Class 1 and 3, but high Recall values. Its overall performance is behind DenseNet and NasNet. EfficientNetB0 has difficulties in Class 3 and 4 with low F1-Scores: (0.815 and 0.810) values. It is moderately successful in other classes. Places365-GoogLeNet is the model with the lowest overall performance (Precision: 0.815, 0.834 in Class 1 and 3). It shows lower success compared to other models with F1: 0.828, 0.835 values. While it shows a high performance with F1: 0.963 in Class 5, it remains weak in terms of general average.
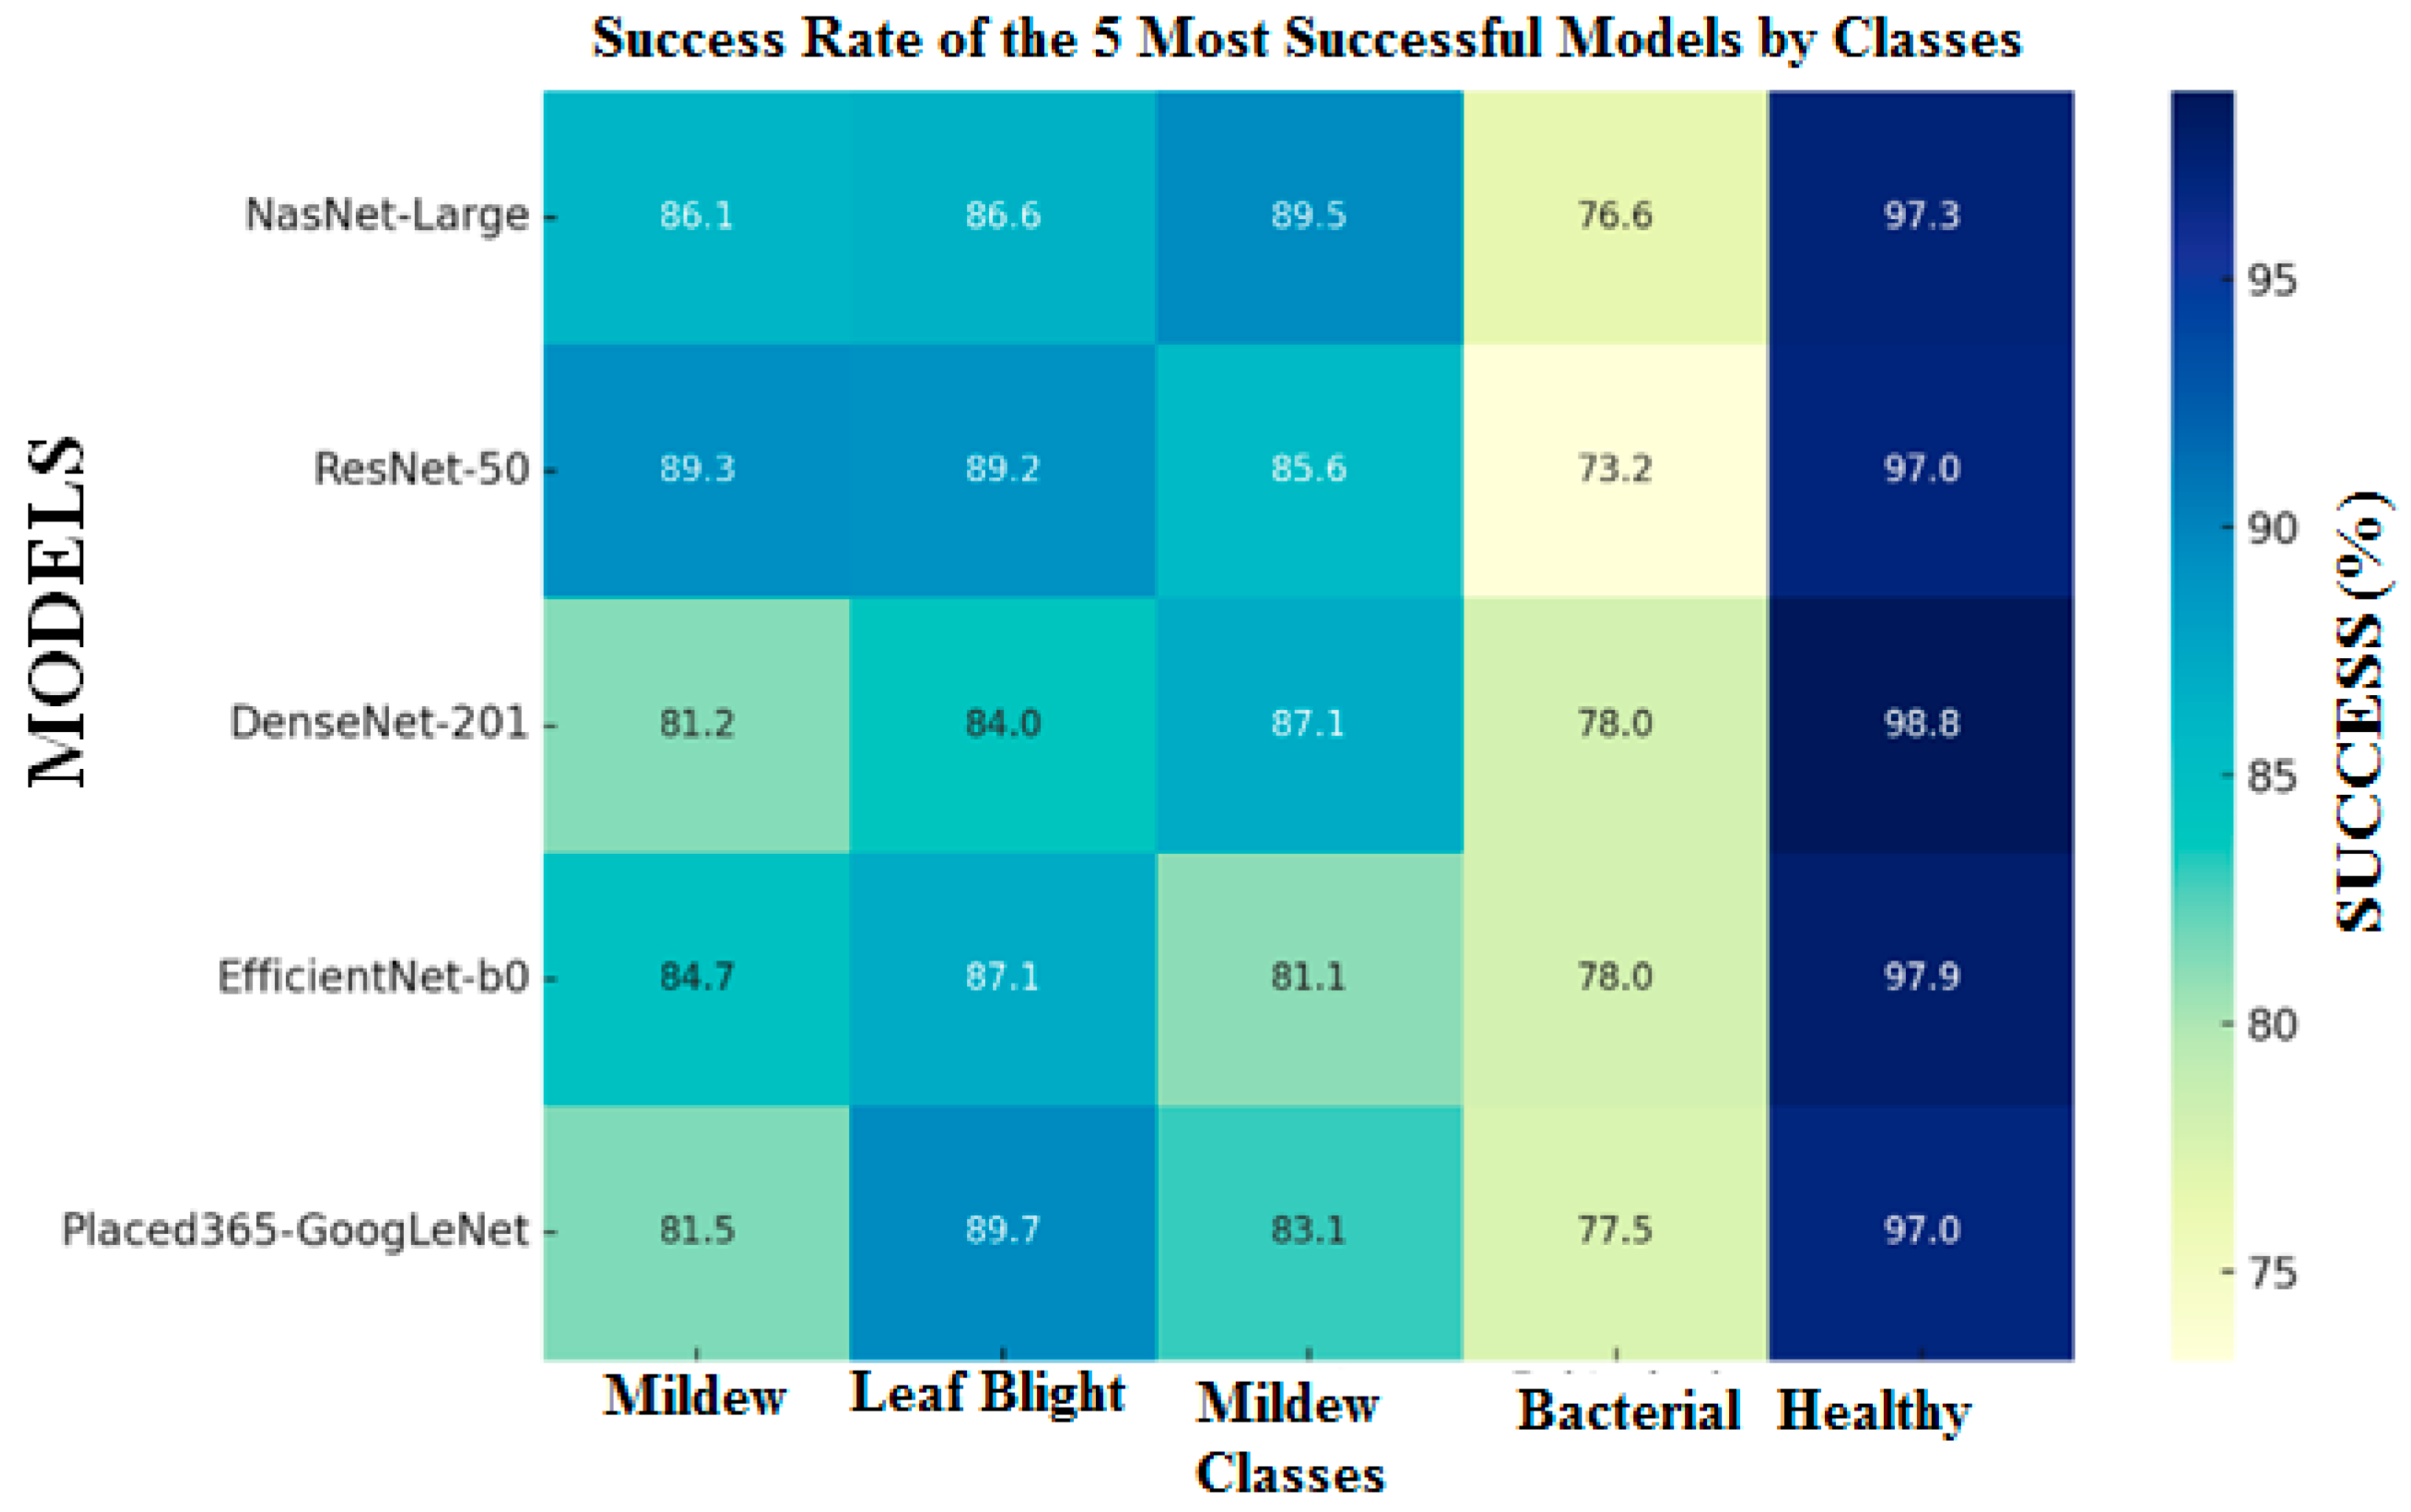
Based on the five most successful algorithms in terms of overall classification, Mildy mildew disease with ResNet-50 algorithm is 89.3%, leaf blight with ResNet-50 algorithm is 89.2%, and Places365-GoogLeNet algorithm is 89.7%. The NasNet-Large algorithm for Tomato Bacterial Mildew disease is the model with the highest classification rates (89.5%), the DenseNet-201 algorithm for bacterial cancer and spot disease has an accuracy rate of 77.99%, and the DenseNet-201 algorithm for Healthy Tomato disease has 98.8%.
Considering the training and test success rates from
Figure 5, the NasNet-Large, ResNet-50, DenseNet-201, EfficientNet-b0, and Places365-GoogLeNet algorithms were identified as the top five performers. Therefore,
Figure 6 and
Table 6 present further analysis and evaluation results specific to these selected models, enabling a more detailed comparison of their diagnostic capabilities.
Based on the results presented in
Table 4 and the heatmap in
Figure 6, the five deep learning algorithms with the highest test accuracy are identified as NasNet-Large, ResNet-50, DenseNet-201, EfficientNet-b0, and Places365-GoogLeNet. After training these top-performing models, feature extraction was carried out by removing their fully connected layers and using the output of the last convolutional layer. This process generated 1000-dimensional feature vectors for each image, representing high-level learned features.
To reduce computational complexity and enhance classification performance, five feature selection methods—MRMR, Chi2, ReliefF, ANOVA, and Kruskal–Wallis—were applied, reducing the feature set from 1000 to 100 dimensions. These methods select the most informative features based on statistical relevance and redundancy criteria. The aim of this reduction was to improve efficiency while preserving classification accuracy.
It was observed that the ANOVA and Kruskal–Wallis methods resulted in lower classification performance compared to the others; therefore, their results were omitted to maintain focus on the more successful techniques. The newly generated datasets (with 100 selected features) were then split into 80% training and 20% testing sets. Classification was performed using various machine learning algorithms with five-fold cross-validation.
Table 5 presents the results of the three machine learning algorithms that achieved the best classification performance.
Table 6 shows the results of the three machine learning algorithms that produced the best classification results using 100 features.
In
Table 6, it is seen that the Subspace KNN classifier provides the highest test accuracies in almost all datasets with 100 features, the Cubic SVM classifier is generally good but does not reach as high results as the Subspace KNN classifier, and the Wide Neural Network classifier generally gives the lowest test accuracies. It is also seen that the Subspace KNN classifier generally provides the highest test accuracy rates in the DenseNet-201 and ResNet-50 deep learning algorithms.
Table 7 compares training and test accuracy rates based on 100 features selected from a set of 1000 deep features using various feature selection methods, including MRMR, Chi
2, and ReliefF, applied to different deep feature extraction techniques. According to this table, the highest test accuracy of 92% was achieved when features extracted from the EfficientNet-b0 model were selected using the Chi
2 method and classified using the Fine K-Nearest Neighbors (Fine KNN) machine learning algorithm. To determine the most consistent classification performance, the mean, standard deviation, and variance of the obtained results were calculated. Based on these calculations, the ReliefF method demonstrated the most stable performance, with an average test accuracy of 89.32%.
Table 8 and
Table 9 show the effects of feature selection methods (MRMR, Chi
2, ReliefF, ANOVA, Kruskal–Wallis) on different deep learning models (NasNet-Large, DenseNet201, ResNet-50, EfficientNetB0, and Placod_GoogLe) for each combination, with Precision, Recall, F1-Score, and ROC AUC metrics given on a class basis.
When
Table 8 is examined, the highest F1-Score and ROC AUC for the NasNet-Large model are generally obtained with the MRMR and Chi
2 methods. As can be understood from the values of MRMR: F1 = 0.968 and ROC AUC = 0.991 for Class 5, it is seen that the classification is successful. For the DenseNet201 model, the Chi
2 and MRMR methods stand out. It is understood from the values of MRMR: F1 = 0.978 and ROC AUC = 0.996 for Class 5 that the classification is successful. In the ResNet-50 model, it is seen that the Chi
2 method is successful in Class 1 F1 = 0.910 and Class 5 F1 = 0.976 classes. In addition, the MRMR method also works correctly for this model.
Table 9 shows that the EfficientNetB0 model is a more balanced model in all feature selection methods. The highest classification was achieved with F1 > 0.95 in Class 5 with the MRMR and Chi
2 feature selection methods. It is understood from
Table 9 that the Places365-GoogLeNet model exhibits a lower performance compared to the other 4 models examined.
Among the deep feature extraction models examined, features derived from EfficientNet-b0 consistently yielded the highest accuracy rates across all feature selection methods. Features extracted from DenseNet-201 and ResNet-50 also showed strong classification performance with high accuracy values. In contrast, features derived from the NasNet-Large model resulted in relatively lower classification accuracy, around 86%, compared to other models.
When considering standard deviation and variance analyses, the ReliefF method exhibited lower standard deviation values in both training and test accuracies, indicating more stable performance. In contrast, the Chi2 method showed greater variability in accuracy rates.
As a result, it can be said that the combination that produces the most stable results in the classifications using 100 features is the classification of the features extracted from the EfficientNet-b0 model with machine learning algorithms by selecting them with the ReliefF method.
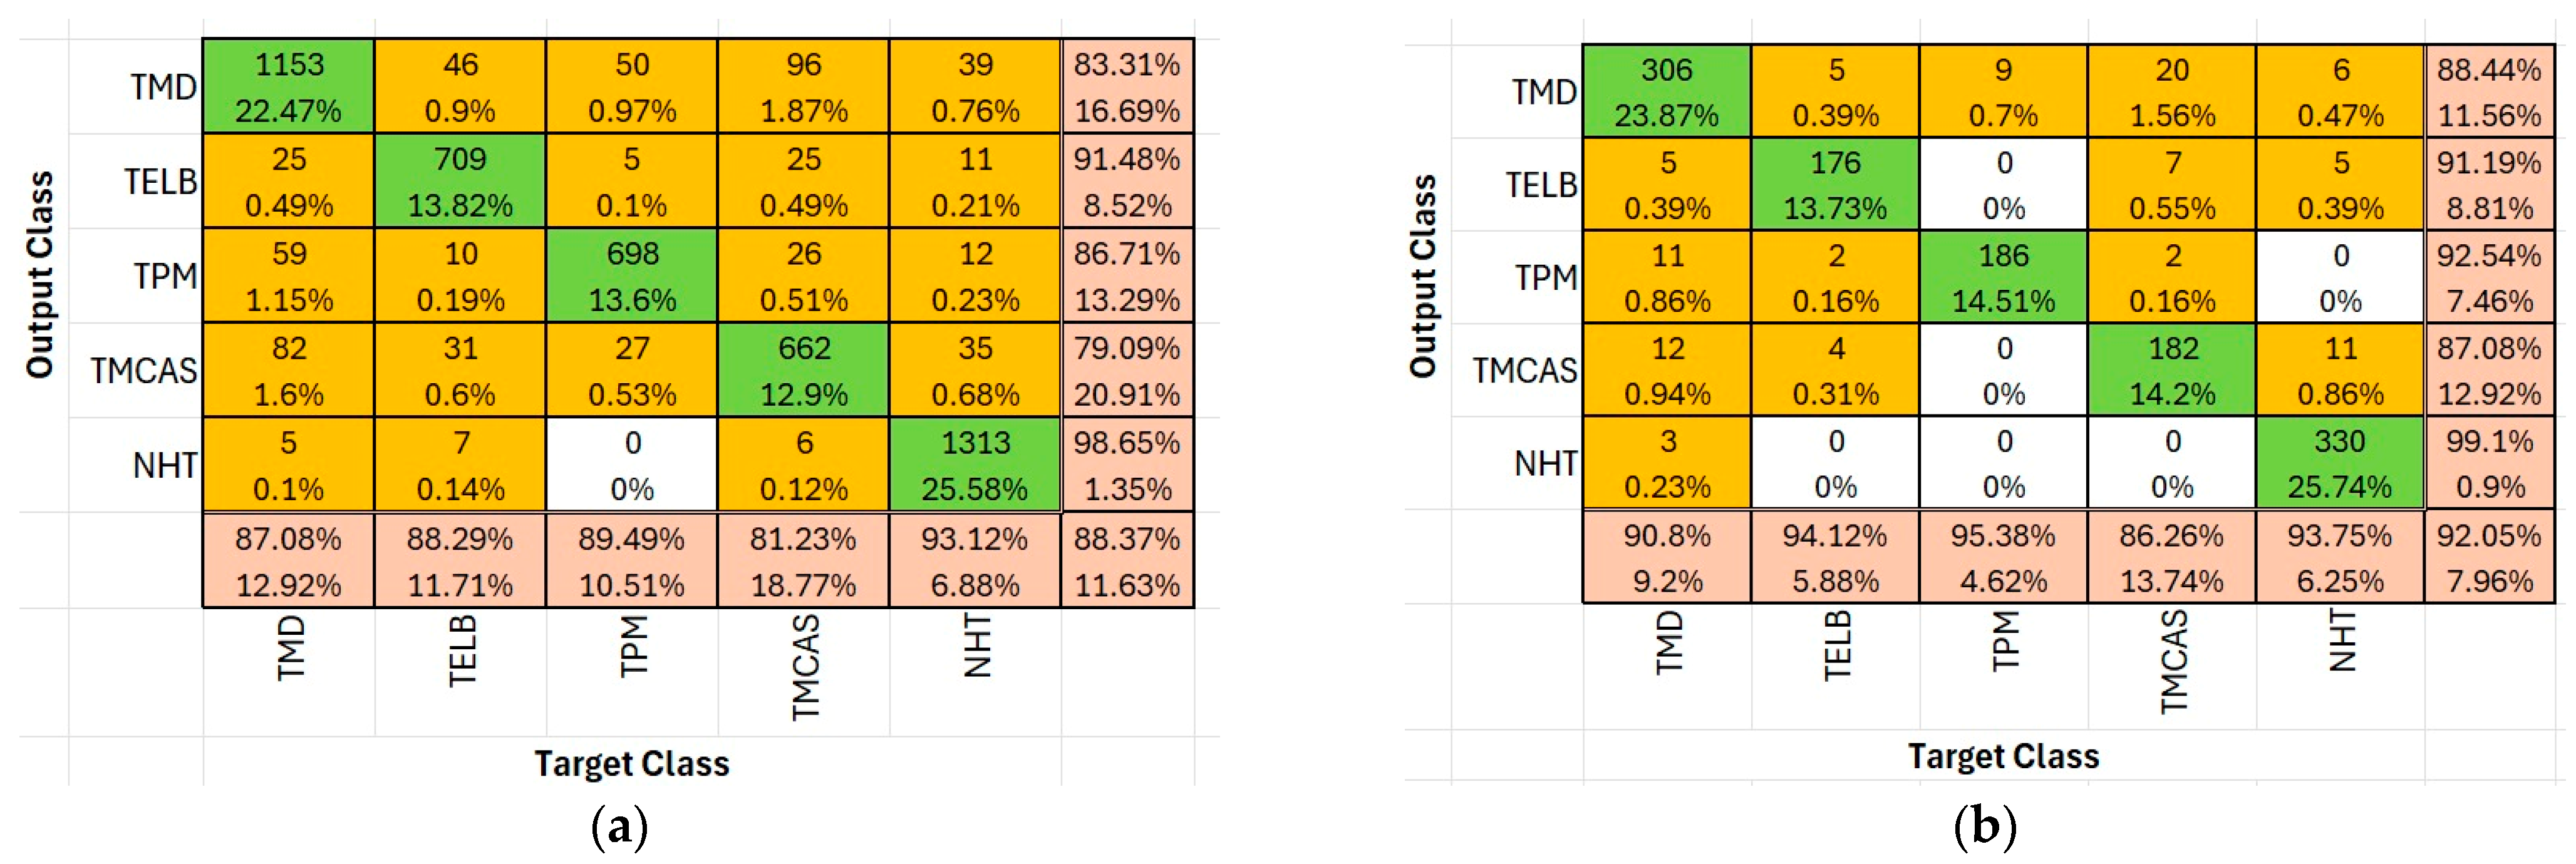
Since the best result was obtained using the EfficientNet-b0 algorithm, the training and test confusion matrices based on the Chi
2 feature selection method applied to this algorithm are presented in
Figure 7. As seen in
Figure 7, when the number of features was reduced using the Chi
2 method with the EfficientNet-b0 algorithm, a training accuracy of 88.4% and a test accuracy of 92% were achieved.
In this study, a five-class classification was performed, covering the most common tomato diseases, namely late blight, early blight, gray mold, bacterial cancer, and healthy tomatoes. The dataset used in the study is entirely original, consisting of 6414 images collected from three groups: leaves, red tomatoes, and green tomatoes, captured in the production field. These data were processed using 21 deep learning algorithms, and their results were evaluated. Among these, the best-performing models were identified as NasNet-Large, ResNet-50, DenseNet201, EfficientNet-b0, and Places365-GoogLeNet.
From each of the selected models, 1000 features were extracted. Feature selection algorithms (MRMR, Chi2, ReliefF, ANOVA, and Kruskal–Wallis) were then applied to select 100 features from each set. The newly constructed datasets were split into 80% training and 20% test sets, and models were trained using five-fold cross-validation with various machine learning algorithms. As a result, a total of 51 combinations were evaluated, comprising 21 deep learning algorithms and 5 feature selection methods.
Among these combinations, the highest performance was achieved with the EfficientNet-b0 algorithm, where the Chi2 feature selection method yielded a training accuracy of 88.4% and a test accuracy of 92%. Furthermore, it can be concluded that the most stable results in classifications using 100 features were obtained when features extracted from EfficientNet-b0 were selected using the ReliefF method and classified with machine learning algorithms.
In conclusion, this study demonstrates the potential and applicability of deep learning-based disease diagnosis systems in the agricultural sector. More effective integration of technology in agricultural practices can enhance both production processes and product quality, thus contributing to the widespread adoption of sustainable agricultural practices. In this context, the study can be considered an important step that may inspire future research.
In this study, it was observed that MRMR and Chi2 reliably increased performance. Since the obtained results may differ depending on the model and class, each class was evaluated separately.
4. Discussion
The tomato plant is one of the most widely cultivated agricultural products globally, and various diseases affecting its leaves, stems, or fruits can significantly reduce yield. Early detection of these diseases is of critical importance, not only to prevent economic losses but also to enable the implementation of environmentally sustainable pest management strategies. Artificial intelligence-based approaches, particularly those utilizing deep learning-supported image processing techniques, have demonstrated high success in this regard.
In this study, a performance analysis of classification models was conducted by combining deep features extracted from 21 deep learning architectures—including NasNet-Large, ResNet-50, and DenseNet-201—with five different feature selection methods, namely MRMR, Chi2, ReliefF, ANOVA, and Kruskal–Wallis.
Table 10 shows the accuracy rates of the classification operations performed with the deep learning method, feature extraction and feature selection operations. As can be understood from this table, it is seen that the success rates of the classification operations performed after the feature extraction and feature selection operations increase.
Table 11 presents a summary of previous studies related to the classification of tomato diseases, including the methods employed and the reported accuracy rates.
Unlike the academic studies and other studies in
Table 11, the studies carried out so far have been based on only leaf, tomato data, and limited images. In this study, red tomato, green tomato, and leaf data taken in the natural environment were used. In previous studies, deep learning methods were used and the algorithms with the best results were determined. In this study, the NasNet-LArge algorithm gave the best results without feature extraction, but it was observed that the accuracy rates of the EfficientNet-b0 algorithm were higher after feature extraction. In this study, 21 deep learning algorithms, the feature extraction of the first five algorithms among these algorithms, the application of five different feature selection methods to these algorithms, and even the classification process using machine learning methods (KNN, SVM, and ANN) within each feature were considered. Therefore, the originality of this study in the current situation and the comparisons made will guide future studies to be carried out not only for tomato diseases but also for the classification of different types of diseases.
Although some studies report higher classification accuracies (e.g., 99.30% with MobileNetV2 [
8] or 98.7% with EfficientNet-B4 [
10]), these results are usually achieved using tomato leaf images on ideal datasets such as PlantVillage. Our dataset, collected under field conditions, includes changes in illumination, occlusions, and background complexity. Moreover, our model is designed with computational efficiency in mind for potential deployment in mobile or embedded systems. Our dataset also includes red and green tomato images along with tomato leaves. Considering these constraints, 92.0% accuracy is a promising result, indicating a good balance between performance and practicality in real-world scenarios.
