1. Introduction
Non-sustainable human activities are among the main factors responsible for climatic changes and the environmental disaster that is affecting the globe. In 2022, the EU Commission proposed the Nature Restoration Law (EU Commission, 2022) [
1], the first legal act that aims to reconstitute 80% of damaged natural habitats and to restore agricultural soils. The document remarks that restoration must be integrated in productive human activities and proposes to reduce to 50% the use of chemical pesticides in agriculture before 2030, which is now.
Legume cultivation contributes to the maintenance and restoration of soil fertility without using chemical fertilizers. Indeed, legumes contribute to restoring natural organic matter, secrete organic acids from their roots that solubilize phosphate, induce pathogen suppression when used in rotation with other crops, and perform nitrogen fixation [
2,
3]. Even more, legumes serve as a source of amino acids, proteins, vitamins, and minerals for human consumption [
3]. Market research by BVA-Doxa (Italy) revealed that 22 million Italian consumers prefer vegetable proteins. At a global level, the plant-based protein market is projected to grow due to the rise in the global population and the increase in veganism and flexitarian diets [
4]. The total area of legumes cultivated in Italy in 2022 was 90,099 ha, and interest in these crops is strongly encouraged by Rural Development Policy 2014–2020. On the other hand, the cultivation of legumes poses no shortage of difficulties: indeed, crop yield can be impacted by numerous plant diseases, many of them caused by seedborne pathogens [
5].
For more than a century, studies were carried out to search for product alternatives to chemical fertilizers and pesticides. In most cases, such alternatives are based on the use of beneficial soil-borne microorganisms (BMs) that improve soil fertility, stimulate plant growth, increase tolerance to soil drought and salinity, and contribute to the detoxification of soils and/or to the suppression of plant pathogens. Several fungal and bacterial BMs are widely studied and utilized as ingredients of commercial biofertilizers and/or biopesticides. Several fungus-based formulations use different species of Trichoderma (Rootshield T22 and Asperello T34, Arbico Organics, OroValley, AZ, USA) or Gliocladium spp. (Prestopmix, Lallemand, FI), while, among the bacteria, those containing Bacillus subtilis, e.g., Serenade and Kodiak (Bayer CropScience, Milano, IT), Bacillus thuringiensis, e.g., Novodor 3FC (Leu+Gigax, Birmenstorf,CH), or Pseudomonas spp. such as Cedomon, (Serbios srl, Badia Polesine, Rovigo, IT) or Bactvipe (IPL Biologicals, Haryana, IN) are the most common.
Compost teas (CTs) have recently emerged as green and sustainable solutions to improve crop productivity [
6]. They are aqueous extracts obtained from compost by extraction and fermentation processes in the liquid phase. CTs can be considered as natural microbial consortia, rich in organic and inorganic molecules with biostimulant activities toward plants and in microorganisms capable of counteracting phytopathogenic fungi and bacteria. In some CTs, only 1% of the microorganisms is known: the culturable BMs belong to the genera
Bacillus,
Serratia,
Pseudomonas,
Stenotrophomonas,
Flavobacterium,
Trichoderma,
Penicillium,
Aspergillus,
Gliocladium, and
Fusarium [
7]. CTs’ composition depends on matrix origin composition, native microflora, and maceration conditions; hence, their effect on plants is difficult to predict and to standardize [
6].
Effective biostimulation by CTs has been reported for different crops, i.e., strawberries, pak choi, tomatoes, grapes, oranges, lettuce, kohlrabi, cowpeas, soybeans, sweet corn, radishes, spinach, and Chinese cabbage [
8,
9,
10,
11,
12,
13,
14,
15,
16,
17,
18]. The biostimulation mechanisms were mainly attributed to the production of organic compounds and hormone-like molecules by microbes [
19].
Moreover, fungicide-like effects of CTs were reported, due to the antagonistic activity of the native microbiota and the presence of abiotic antimicrobial factors [
20] and volatile organic compounds (VOCs). Variable levels of disease control were obtained against
Botrytis cinerea in tomatoes,
Fusarium in pre-germinated rice seeds, powdery mildew and grey mold in grapes,
Pythium ultimum and
Xanthomonas vesicatoria in tomatoes,
Ralstonia solanacearum,
Rhizoctonia solani, and
Alternaria solani in potatoes,
Verticillium dahliae in strawberries, and
Phytophthora capsici and
R.
solani in peppers [
11,
21,
22,
23,
24,
25,
26,
27].
In most cases, it is believed that the biotic and abiotic components of CTs may exert complementary and synergistic functions, which together determine their biostimulatory or suppressive properties [
28]. Abiotic components play a fundamental role in providing nutritional support, exerting selective pressure on the microbial communities present in CTs and influencing both microbial composition and biodiversity levels [
28]. Conversely, microbial metabolic products generated during the fermentation process can, in turn, modify the abiotic environment of the CT, ultimately shaping its biostimulatory effects [
28]. Based on these assumptions, gaining insight into the functional profile of microbial communities in CTs might represent a valuable tool to better understand their potential bioactivity.
The aim of this study is to evaluate two different CTs for their ability to induce biostimulation in two legumes, chickpeas and peas, and to investigate the relationship between biostimulation effects and the metabolic activity of the bacterial microflora. This research includes (i) studies on the metabolism of the microbial community of two CTs; (ii) in vivo evaluation of the biostimulatory effect of CTs in pea and chickpea plants; (iii) study of the correlation between metabolic profiles of CTs and in vivo biostimulation in pea; (iv) isolation and characterization of beneficial microflora from CTs; (v) biostimulation assays and metabolic profile changes after CT storage; and finally, (vi) diagnostic observations of root and collar necrosis in chickpea plants after CT treatment.
2. Materials and Methods
2.1. Compost and Compost Tea Preparation
Two vegetable composts were used as starting matrices for the compost teas. The “in house” compost was prepared in winter 2024–2025 by mixing waste from artichoke (30%) and fennel (30%) cultivation, chestnut bark (30%), and nut foliar residues (10%). The vegetable pile was turned manually once a week to allow aeration of the mass. The composting process was completed in 90 days, and the mass reached its maximum temperature of 28 °C in December. The pH of this compost was 8.6, and the level of humidity was 55%. The second one was a commercial compost (COM compost) obtained from olive pomace (Simbiosoil, Symbiosis, Manduria, TA, Italy). Aiming to produce compost teas (CTs), the composts were inserted in a tissue net bag and immersed in water for 1 week at 28 °C at a ratio of 1:3
v/
v. Aeration of the water phase was performed for 5 min every 3 h by air injection through a tube connected with a pump that was activated by a timer [
15]. The final pH of both CTs was 6.8.
2.2. Cultivable Bacteria Count and Microbial Community Metabolism
The concentration of the bacterial population of the CTs produced from the “in house” compost and the COM compost (“in house” CT and COM CT) was determined by the dilution plating method on glucose nutrient agar (NA amended with 0.25% glucose, NGA). The CTs were serially diluted up to 10−7, and 100 µL of each dilution were spread on the agar medium; then, the plates were incubated at 27 °C for 48 h. All colonies were counted, and the concentration of the bacteria was calculated (CFU/mL).
The bacterial communities’ metabolic activity was characterized in freshly prepared CTs and after 8 months of storage at +4 °C. Community-level physiological profiles (CLPPs) were assessed using the Biolog EcoPlate
TM system (Biolog Inc., Hayward, CA, USA), based on carbon substrate utilization. Biolog EcoPlates
TM enable determination of the metabolic fingerprints of microbial communities by analyzing their carbon metabolism reaction patterns at specific time intervals [
29]. Each plate consists of 96 wells containing 31 different carbon sources and one blank, all in triplicate [
29].
CTs were serially diluted in sterile saline solution (0.8% NaCl). The following dilutions were selected for the experiments: 1:10 and 1:100 for the “in house” CT; 1:100 and 1:1000 for the COM CT. Then, volumes of 150 μL of each dilution were added to the wells of the microplate, which was incubated at 27 °C for 4 days. As the carbon source is utilized, the tetrazolium violet dye provided in the wells is reduced, developing a purple color. Color development in individual wells was recorded by an automated Omnilog System (Biolog) every 30 min, until reaching the plateau phase.
Average well color development (AWCD) in each EcoPlate was calculated using the following formula [
30]:
where C
i is the absorbance value in each well and R is the absorbance value in the blank well, both expressed in Biolog Units (BU). The AWCD values at each time point were used to construct a kinetic curve of total microbial activity. The relative utilization of six main biochemical C-source categories was also assessed (C-AWCD) by adding the AWCD endpoint values (at 96 h) for each substrate category and dividing them by the number of substrates in each category [
30].
Endpoint AWCD values obtained from the three replicates per treatment were also used to calculate biodiversity indices, which reflect the metabolic functional diversity of the microbial communities of CTs. Substrate richness (SR), representing the number of substrates catabolized by each microbial community, was determined as the number of wells with an absorbance value higher than 50 Biolog Units. Shannon (H′), Simpson (D), and Evenness (E) diversity indices were calculated as follows [
30]:
where Pi was calculated with the following formula [
30]:
All data (endpoint AWCD, AUC, C-AWCD, and diversity indices) were tested for normality and homogeneity of variance. If assumptions were met, differences among CTs were assessed using one-way ANOVA followed by Tukey’s HSD post hoc test (p ≤ 0.05). When assumptions were not met, Kruskal–Wallis test was performed, followed by Dunn’s post hoc test (p ≤ 0.05). Statistical testing was achieved using Past v5.0.2 software.
Principal component analysis (PCA) was conducted of absorbance data from the 31 carbon sources at 96 h of incubation to evaluate differences in catabolic profiles among the sampled communities. To account for inoculum density effects, data were standardized by dividing each well’s absorbance by the corresponding whole-plate AWCD. PCA was carried out in the R environment using the prcomp() function and visualized using the ggfortify and plotly packages [
31,
32].
2.3. In Vivo Evaluation of the Biostimulatory Effect of CTs on Pea and Chickpea Plants
In vivo assays were performed to evaluate the biostimulatory activity of CTs on pea (Lincoln variety, Consorzio Sativa, Cesena, IT) and chickpea (Pascià variety, Consorzio Sativa, Cesena, IT) plant growth. In chickpeas, the analyses were performed 1 week after CT preparation and again after 8 months of storage at +4 °C. The CTs were tested undiluted and at 1:10, 1:100, and 1:1000 (v/v) dilutions in sterile distilled water (SDW). The CT treatments were compared to a SDW negative control. Experiments were conducted in a climatic chamber at 26 °C ± 1 with a 12 h day/night photoperiod. For each treatment, three repetitions of eight plants were used. The plants were grown in plastic pots filled with sterile river sand (autoclaved two times at 121 °C for 30 min). Ten days after sowing, plants were irrigated with the CT dilutions and with SDW (negative control). Irrigation with SDW was repeated as needed until the end of the experiment, which lasted 28 days. The biostimulation effect on plants was quantified by measuring the length, the fresh weight, and the dry weight of the aerial and root parts of the plants. The drying process was performed in a stove at 65 °C for 24 h. The experiment was planned as a completely randomized block design, and the data were analyzed by Tukey HSD post hoc test (p ≤ 0.05).
The effects of CT treatments were further recorded as inhibition or stimulation of root elongation by using the relative growth index (RGI). The RGI was calculated as the mean of the root length in the plants treated with the CTs (root length of the sample, RLS) related to the mean of the root length of the negative control (RLC). The RGI test was considered valid when the coefficient of variability in the negative control (CV) was lower than 30% [
33,
34].
RGI value was classified as follows:
RGI < 0.8: inhibition of root elongation
0.8 < RGI < 1.2: no significant effects
RGI > 1.2: stimulation of root elongation
Finally, since root and collar necrosis were observed at the end of the experiment for chickpea plants, the symptom severity was estimated using a necrosis intensity scale with the following levels: 0 = healthy plant; 1 = light brown roots, without necrosis; 2 = collar necrosis and reduction of secondary roots; 3 = absence of secondary roots, necrosis and rotting of main root, or dead plant [
35],. The values were elaborated using the McKinney index (MKI) [
36,
37], and the following classes were defined: MKI < 0.46: no or low level of necrosis (based on symptoms of the SDW control); 0.47 < MKI < 0.75: intermediate level of necrosis; MKI > 0.76: high level of necrosis. The differences between the sample MKIs were analyzed by Kruskal–Wallis test, followed by Dunn’s post hoc test (
p < 0.05), using PASTv5.0.2 software.
To understand the role of storage and CT microflora vitality in chickpea root necrosis, plants were treated with “in house” CT and COM CT at 1:10, 1:100, and 1:1000 dilutions. In this experiment, the treatments were carried out with the same CTs used in the first experiment, but after 8 months of storage at 4 °C. The experiment was planned as a completely randomized block design, and data were analyzed by Tukey HSD post hoc test (p ≤ 0.05), while the MKI data were analyzed by Kruskal–Wallis test, followed by Dunn’s post hoc test (p ≤0.05).
2.4. Correlation Between CTs’ Microflora Metabolic Profiles and Relative Growth Index (RGI) in Pea Plants
The relationships between the Biolog normalized absorbance data (each well’s absorbance value at 96 h divided by the corresponding whole-plate AWCD) obtained for individual compounds and categories and the RGI values obtained after treatment with 1:10 and 1:100 dilutions of “in house” CT and 1:100 and 1:1000 dilutions of COM CT for pea plants were assessed by correlation analysis. The data were first checked for normality and subsequently processed in the R environment using the cor() and rcorr() functions (Hmisc package) [
38] with the Spearman method. To correct for multiple comparisons,
p-values from the Spearman correlation analysis were adjusted using the Benjamini–Hochberg false discovery rate (FDR) procedure (α = 0.05). Adjusted
p-values below 0.05 were considered statistically significant. Correlation matrices were generated using the “corrplot” package [
39].
2.5. Isolation and Characterization of Bacteria from CTs
2.5.1. Bacteria Isolation, Biochemical Characterization, and In Vitro Biocontrol Activity
Bacterial isolation from CTs was performed on NGA. Isolated bacteria were purified and initially selected for their ability to produce 3-indolacetic acid (3-IAA) after an incubation of 48 h in Luria–Bertani LB broth (Oxoid—Thermo Fisher Scientific, Foster City, CA, USA) supplemented with 0.2% tryptophan (Merk, Darmstadt, Germany) and for antagonistic activity against the pathogenic fungus
Fusarium solani. Strains positive for 3-IAA production were further characterized for motility, biofilm production, siderophore production, and phosphorus solubilization. 3-IAA production was evaluated using the method described by Haque et al. (2020) [
40], while biofilm production and motility were evaluated using the methods described by Ansari and Achmad (2018) [
41]. The reference strain
Pseudomonas fluorescens C16 was used as a control [
42,
43]. Briefly, to assess biofilm formation, bacteria were grown in nutrient broth (NB) (Oxoid—Thermo Fisher Scientific, Foster City, CA, USA) at 28 °C overnight under shaking conditions. The absorbance at 600 nm was recorded, and the bacteria were diluted to 0.02 OD/mL (10
7 CFU/mL). Then, 150 µL of each bacterial suspension was plated in 96-well plates and incubated at 28 °C for 24, 48, and 72 h. At the end of the incubation, the wells were washed with sterile PBS three times, and 0.1% crystal violet (CV) (Merk, Darmstadt, Germany) was added. Plates were incubated for 20 min at room temperature. After that, the CV was removed, and the samples were rinsed three times with sterile phosphate buffer saline (PBS). Finally, 70% ethanol was added, and the absorbance at 600 nm was recorded using a multi-plate reader (Microplate Reader, 550 Biorad, Hercules, CA, USA). To test motility, bacteria were grown overnight in NB, and 10 µL of 1 × 10
8 CFU/mL were spotted on NA (Oxoid—Thermo Fisher Scientific, Foster City, CA, USA) with 0.3 or 0.5% agar to evaluate swimming and swarming ability, respectively. After 72 h of incubation, colony diameters were recorded. Siderophores and phosphorus solubilization were studied using the methods described by Perez-Miranda et al. (2007) and Haque et al. (2020) [
40,
44], respectively. Siderophore detection was performed by spotting 10 µL of the bacterial suspensions at 1 × 10
8 CFU/mL on NA plates and incubating at 28 °C for 24 h. Then, 10 mL of Chrome Azurol S O-CAS medium (Thermo Fisher Scientific, Foster City, CA, USA) was overlaid on the NA plates, which were incubated overnight at room temperature. Finally, the appearance of a halo around the colony indicated siderophore production. Regarding phosphorus solubilization, bacteria were incubated on National Botanical Research Institute phosphate agar (NBRIPSA) for 5 days at 28 °C, then the size of the clear halo around the colonies was recorded [
41]. The formula for the calculation of phosphate solubilization index (PSI) is
; where CHd means clear halo diameter, and Cd stands for colony diameter. At PSI > 1, the strain was considered able to solubilize phosphate.
Antagonistic activity against F. solani was tested by dual colony assay on potato dextrose agar (PDA) (Oxoid—Thermo Fisher Scientific, Foster City, CA, USA). To perform the test, agar plugs 5 mm in diameter cut from a F. solani colony were transferred to the middle of PDA plates, while eight drops of 3 µL each of a 1 × 10⁸ CFU/mL suspension of bacteria were placed around the margin of the agar plate. PDA plates with only F. solani colonies represented the negative control. The inhibitory effect of the bacteria was recorded by comparing the radius of the F. solani colonies after 7 days at 25 °C with the colony radius of the control (in mm). Strain MH_ 897.2.1 of F. solani from the CREA MicroHort collection was used. The statistical analyses were performed by one-way ANOVA followed by Tukey’s HSD post hoc test (p < 0.05). When assumptions were not met, Kruskal–Wallis test was performed, followed by Dunn’s post hoc test (p ≤0.05). Statistical testing was achieved using Past v5.0.2 software.
2.5.2. Biostimulatory Properties of Selected Microflora
Bacteria able to produce 3-IAA in vitro were tested in vivo for biostimulation activity toward pea plants. The assay was performed using three repetitions of 10 pea plants (variety Lincoln), grown for 1 week in double-sterilized river sand. The plants were grown as described in
Section 2.3. Each plant was treated with 10 mL of a bacterial suspension containing 1 × 10
6 CFU/mL of viable cells, and after 3 weeks the root length was measured. Finally, the RGI was calculated as described in the previous section.
2.5.3. Molecular Identification of Selected Bacteria
Bacterial isolates selected for their ability to produce 3-IAA and to reduce the growth of
F. solani strain MH_897.2.1 in vitro were molecularly identified by amplification and sequencing of the 16S rDNA region. Briefly, bacteria were grown overnight in Luria–Bertani (LB) broth (Oxoid—Thermo Fisher Scientific, Foster City, CA, USA) and, after 24 h, the suspensions were centrifuged at 3500 rpm for 10 min. The pellets were collected, and the DNA was extracted using a Purlink Genomic DNA mini kit (ThermoFisher scientific, Foster City, CA, USA) following the manufacturer’s instructions. Polymerase chain reaction (PCR) was performed using Phusion Hot Start DNA polymerase purchased from ThermoFisher scientific (Foster City, CA, USA) and the primers fD1 (5′-CCGAATTCGTCGACAACAGAGTTTGATCCTGGCTCAG-3′) and rD1 (5′-CCCGGGATCCAAGCTTAAGGAGGTGATCCAGCC-3′) [
43,
45]. The PCR protocol was run, setting the initial denaturation at 98 °C for 30 sec, followed by 35 cycles at 98° C for 10 sec, 58 °C for 20 sec, 72 °C for 20 sec, a final extension at 72 °C for 5 min, and final holding at 4 °C. The PCR product was purified using a GeneJET Purification Kit (ThermoFisher Scientific, Foster City, CA, USA) following the manufacturer’s instructions. The PCR products were sent to BMR Genomics (Padova, Italy) for Sanger sequencing. The obtained sequences were then analyzed by multiple alignment using the BLASTn tool 1.4.0 in the Genbank database.
2.6. Diagnostic Analysis of Chickpea Plants
To investigate if root necrosis of chickpeas could be caused by a fungal infection, isolation of fungi was performed on PDA amended with 50 ppm streptomycin, 50 ppm neomycin, and 50 ppm chloramphenicol (Merk, Darmstadt, DE). Chickpea plants showing collar and root necrosis were externally disinfected with 1% NaClO, rinsed three times with SDW, and dried in a laminar flow cabinet. Two 3 mm slices were cut from the plant collar and root necrosis, placed on PDA plates, and incubated at 25 °C for 7 days. Fungal colonies were purified, and Fusarium-like isolates were submitted to molecular identification and pathogenicity tests.
Molecular identification was carried out as reported by Dell’Olmo et al. (2023) [
35]. Briefly, monosporic cultures were prepared, and spores were collected and incubated in potato dextrose broth for 72 h under shaking conditions. Genomic DNA was extracted and analyzed by amplifying four different gene regions, namely ITS (internal transcribed spacer), TEF (transcription elongation factor), TUB (tubulin), and ACT (actin) [
35]. The PCR products were purified using a GeneJET Purification Kit purchased from ThermoScientific (Foster City, CA, USA) following the manufacturer’s instructions. The PCR products were sent to BMR Genomics for Sanger sequencing. The sequences were then analyzed by multiple alignment using the BLASTn tool in the Genbank database.
Pathogenicity tests were performed on one-week-old chickpea plants, Pascià variety (), grown on sterile vermiculite at 26 °C. The plants were uprooted, and the roots were wounded and immersed in a conidial suspension at 1 × 10
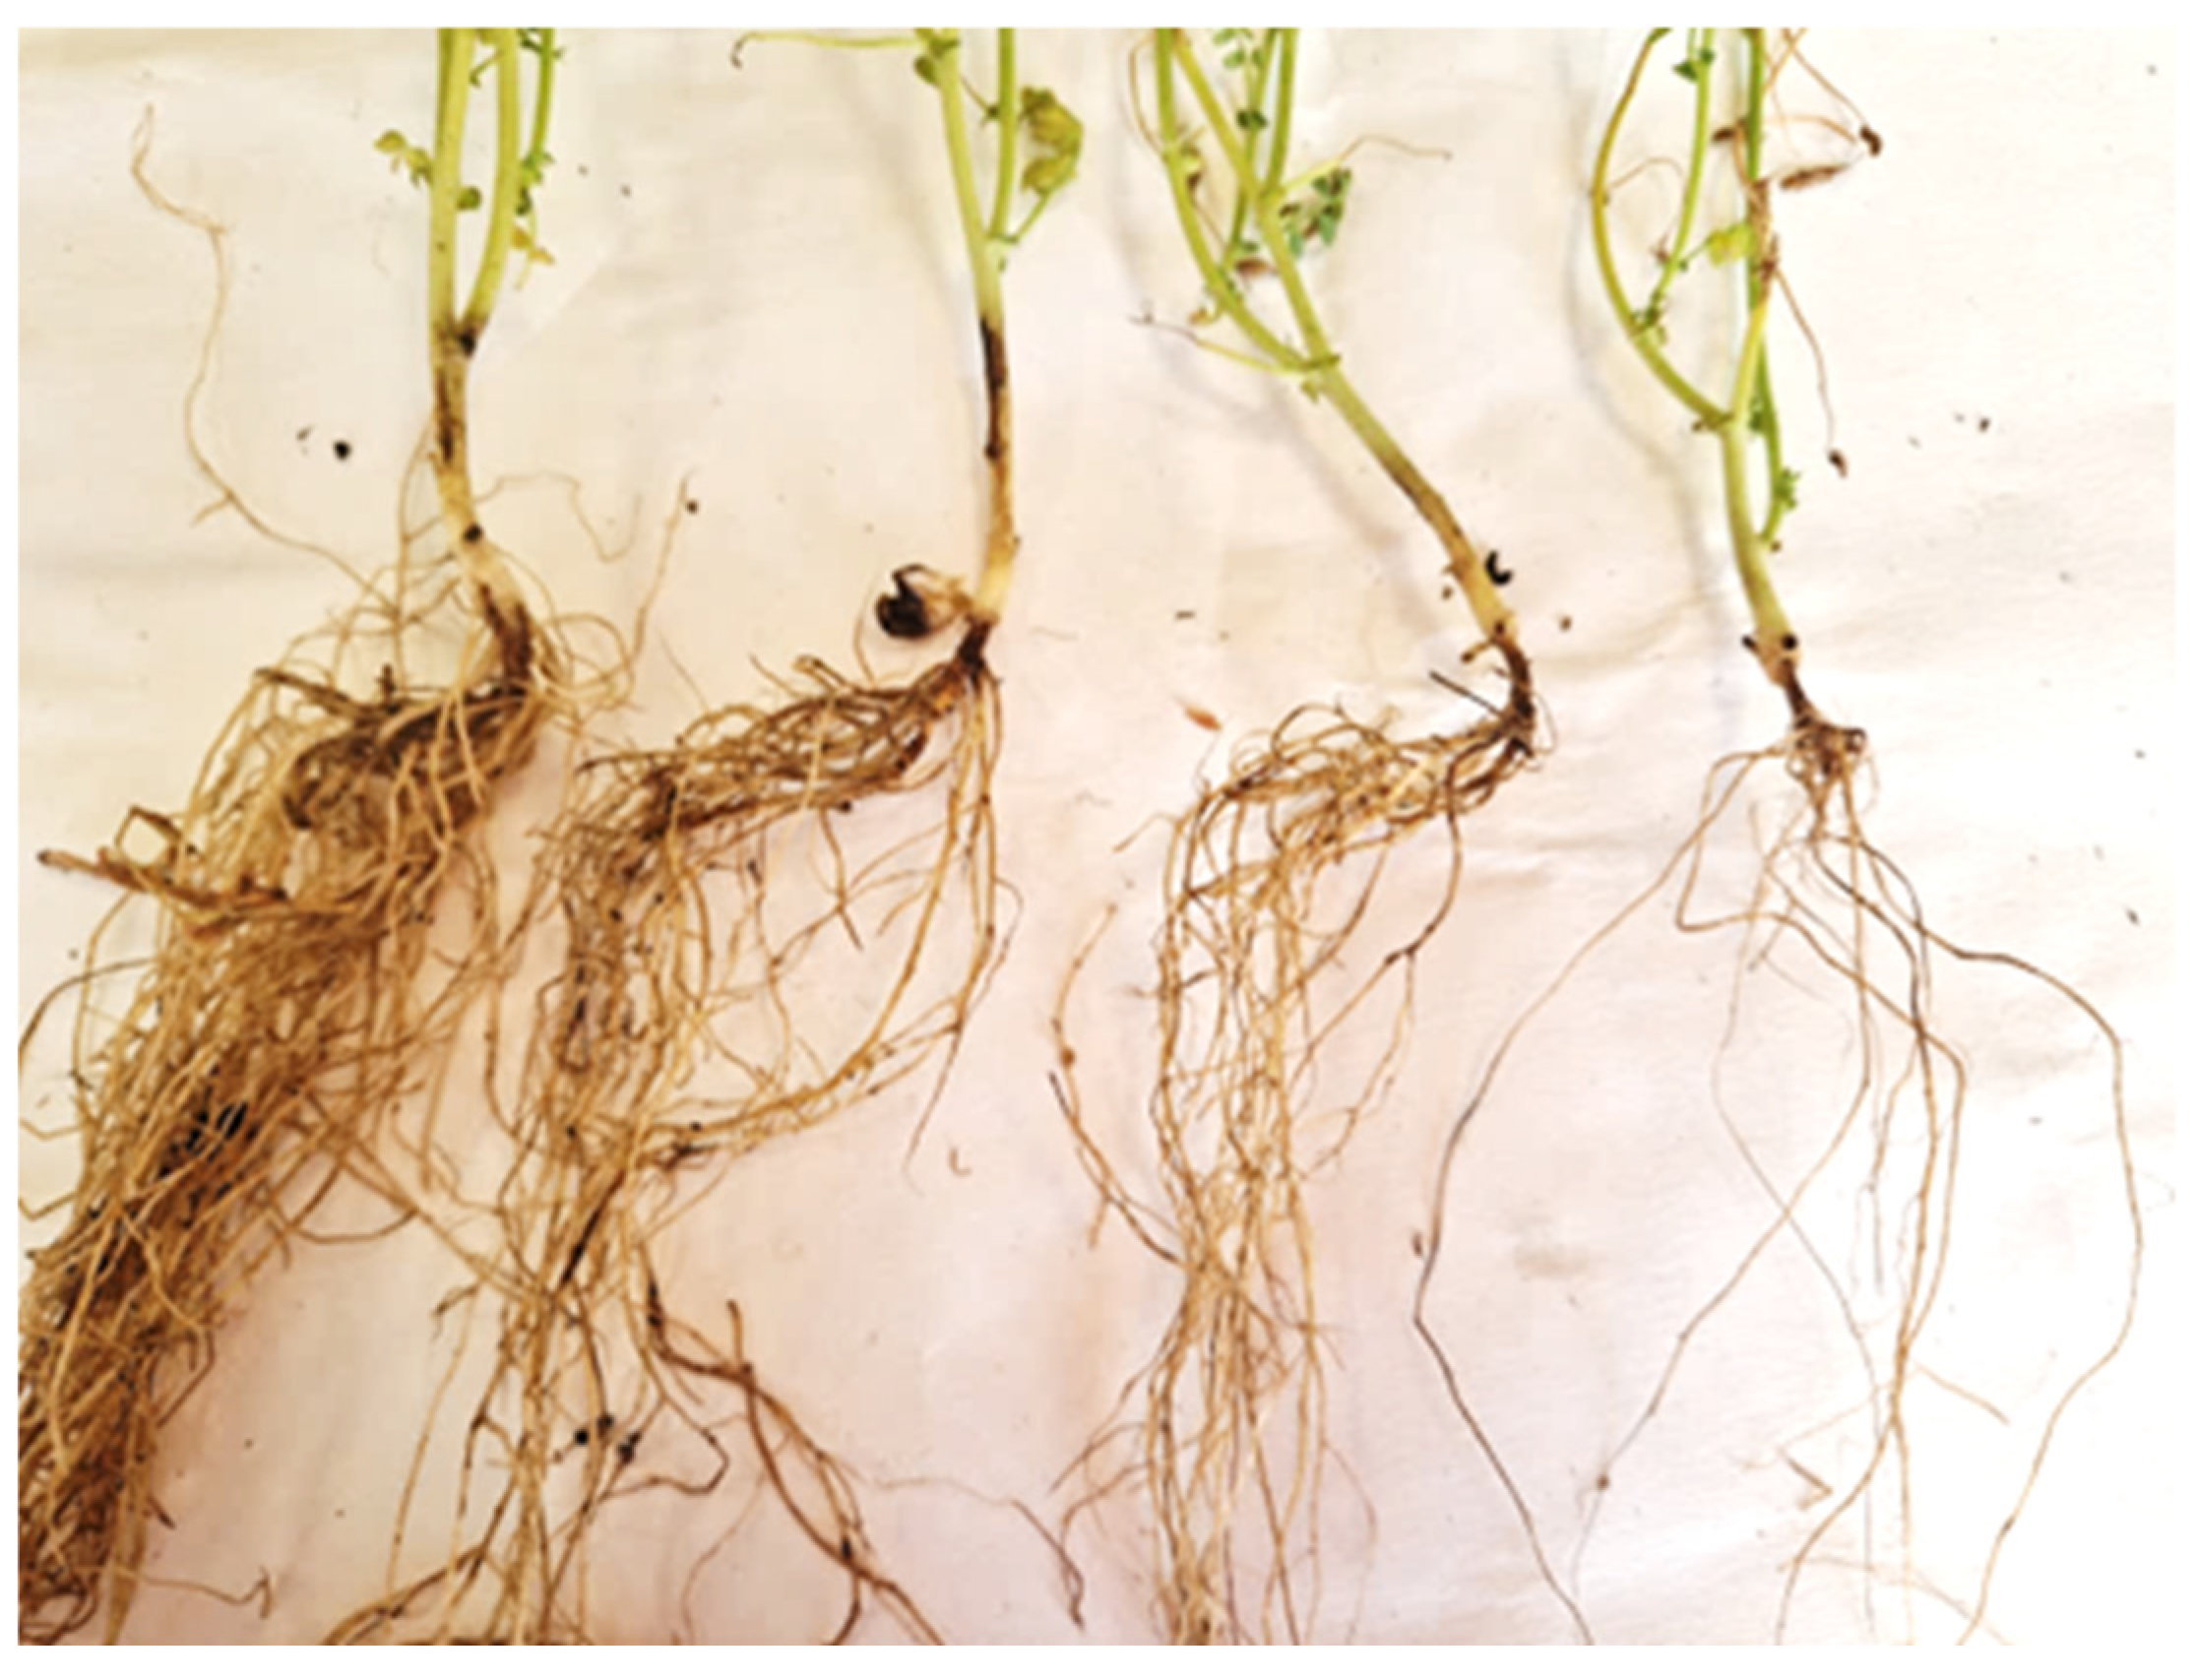
6 CFU/mL for 5 min. Finally, the plants were transplanted into pots containing a mixture of sterile peat and sand (5:1 ratio). The plants were kept at 26 °C in a climatic chamber with a 12 h photoperiod. After 2 months, the disease symptoms were evaluated using the following disease scale (
Figure 1): 0 = no symptoms (comparable with negative control); 1 = collar browning; 2 = collar necrosis, collar shrinkage, secondary root rotting; 3 = main root necrosis, strong shrinkage of collar, reduction of secondary roots (0). The data were elaborated using the McKinney index formula (DI) [
35,
36].
3. Results
3.1. Cultivable Bacteria Count and Microbial Community Metabolism
CLPP analysis was performed using Biolog EcoPlates. Prior to microplate inoculation, the vital titer of the two freshly prepared CTs was assessed (
Table 1). Based on these data, the following dilutions were selected for the experiments: 1:10 and 1:100 for “in house” CT (INHOUSE_1:10 and INHOUSE_1:100 samples) and 1:100 and 1:1000 for COM CT (COM_1:100 and COM_1:1000 samples).
AWCD serves as an indicator of total metabolic activity, reflecting the overall trend of microbial community activity over time or at the curve’s endpoint (96 h). Changes in AWCD over 96 h of incubation are depicted in
Figure 2a. The kinetics revealed that cell density significantly influenced the total metabolic activity of the microbial communities. Additionally, differences between the two CT types are evident: INHOUSE_1:10 and INHOUSE_1:100 kinetics exhibit a longer lag phase, a slower metabolic rate, and lower AWCD values in the plateau phase compared to COM_1:100 and COM_1:1000 at the same cell density. Notably, the INHOUSE_1:10 curve closely resembles that of COM_1:1000.
Comparison of the endpoint AWCD values reached by the four samples (
Figure 2b) revealed that, as previously noted, higher cell density corresponds to higher endpoint AWCD values within the same CT community, indicating reduced metabolic efficiency at lower titers. Tukey’s test revealed that the COM_1:100 endpoint AWCD value differed significantly from both INHOUSE_1:10 and INHOUSE_1:100 (ANOVA
p = 1.84 × 10
−6).
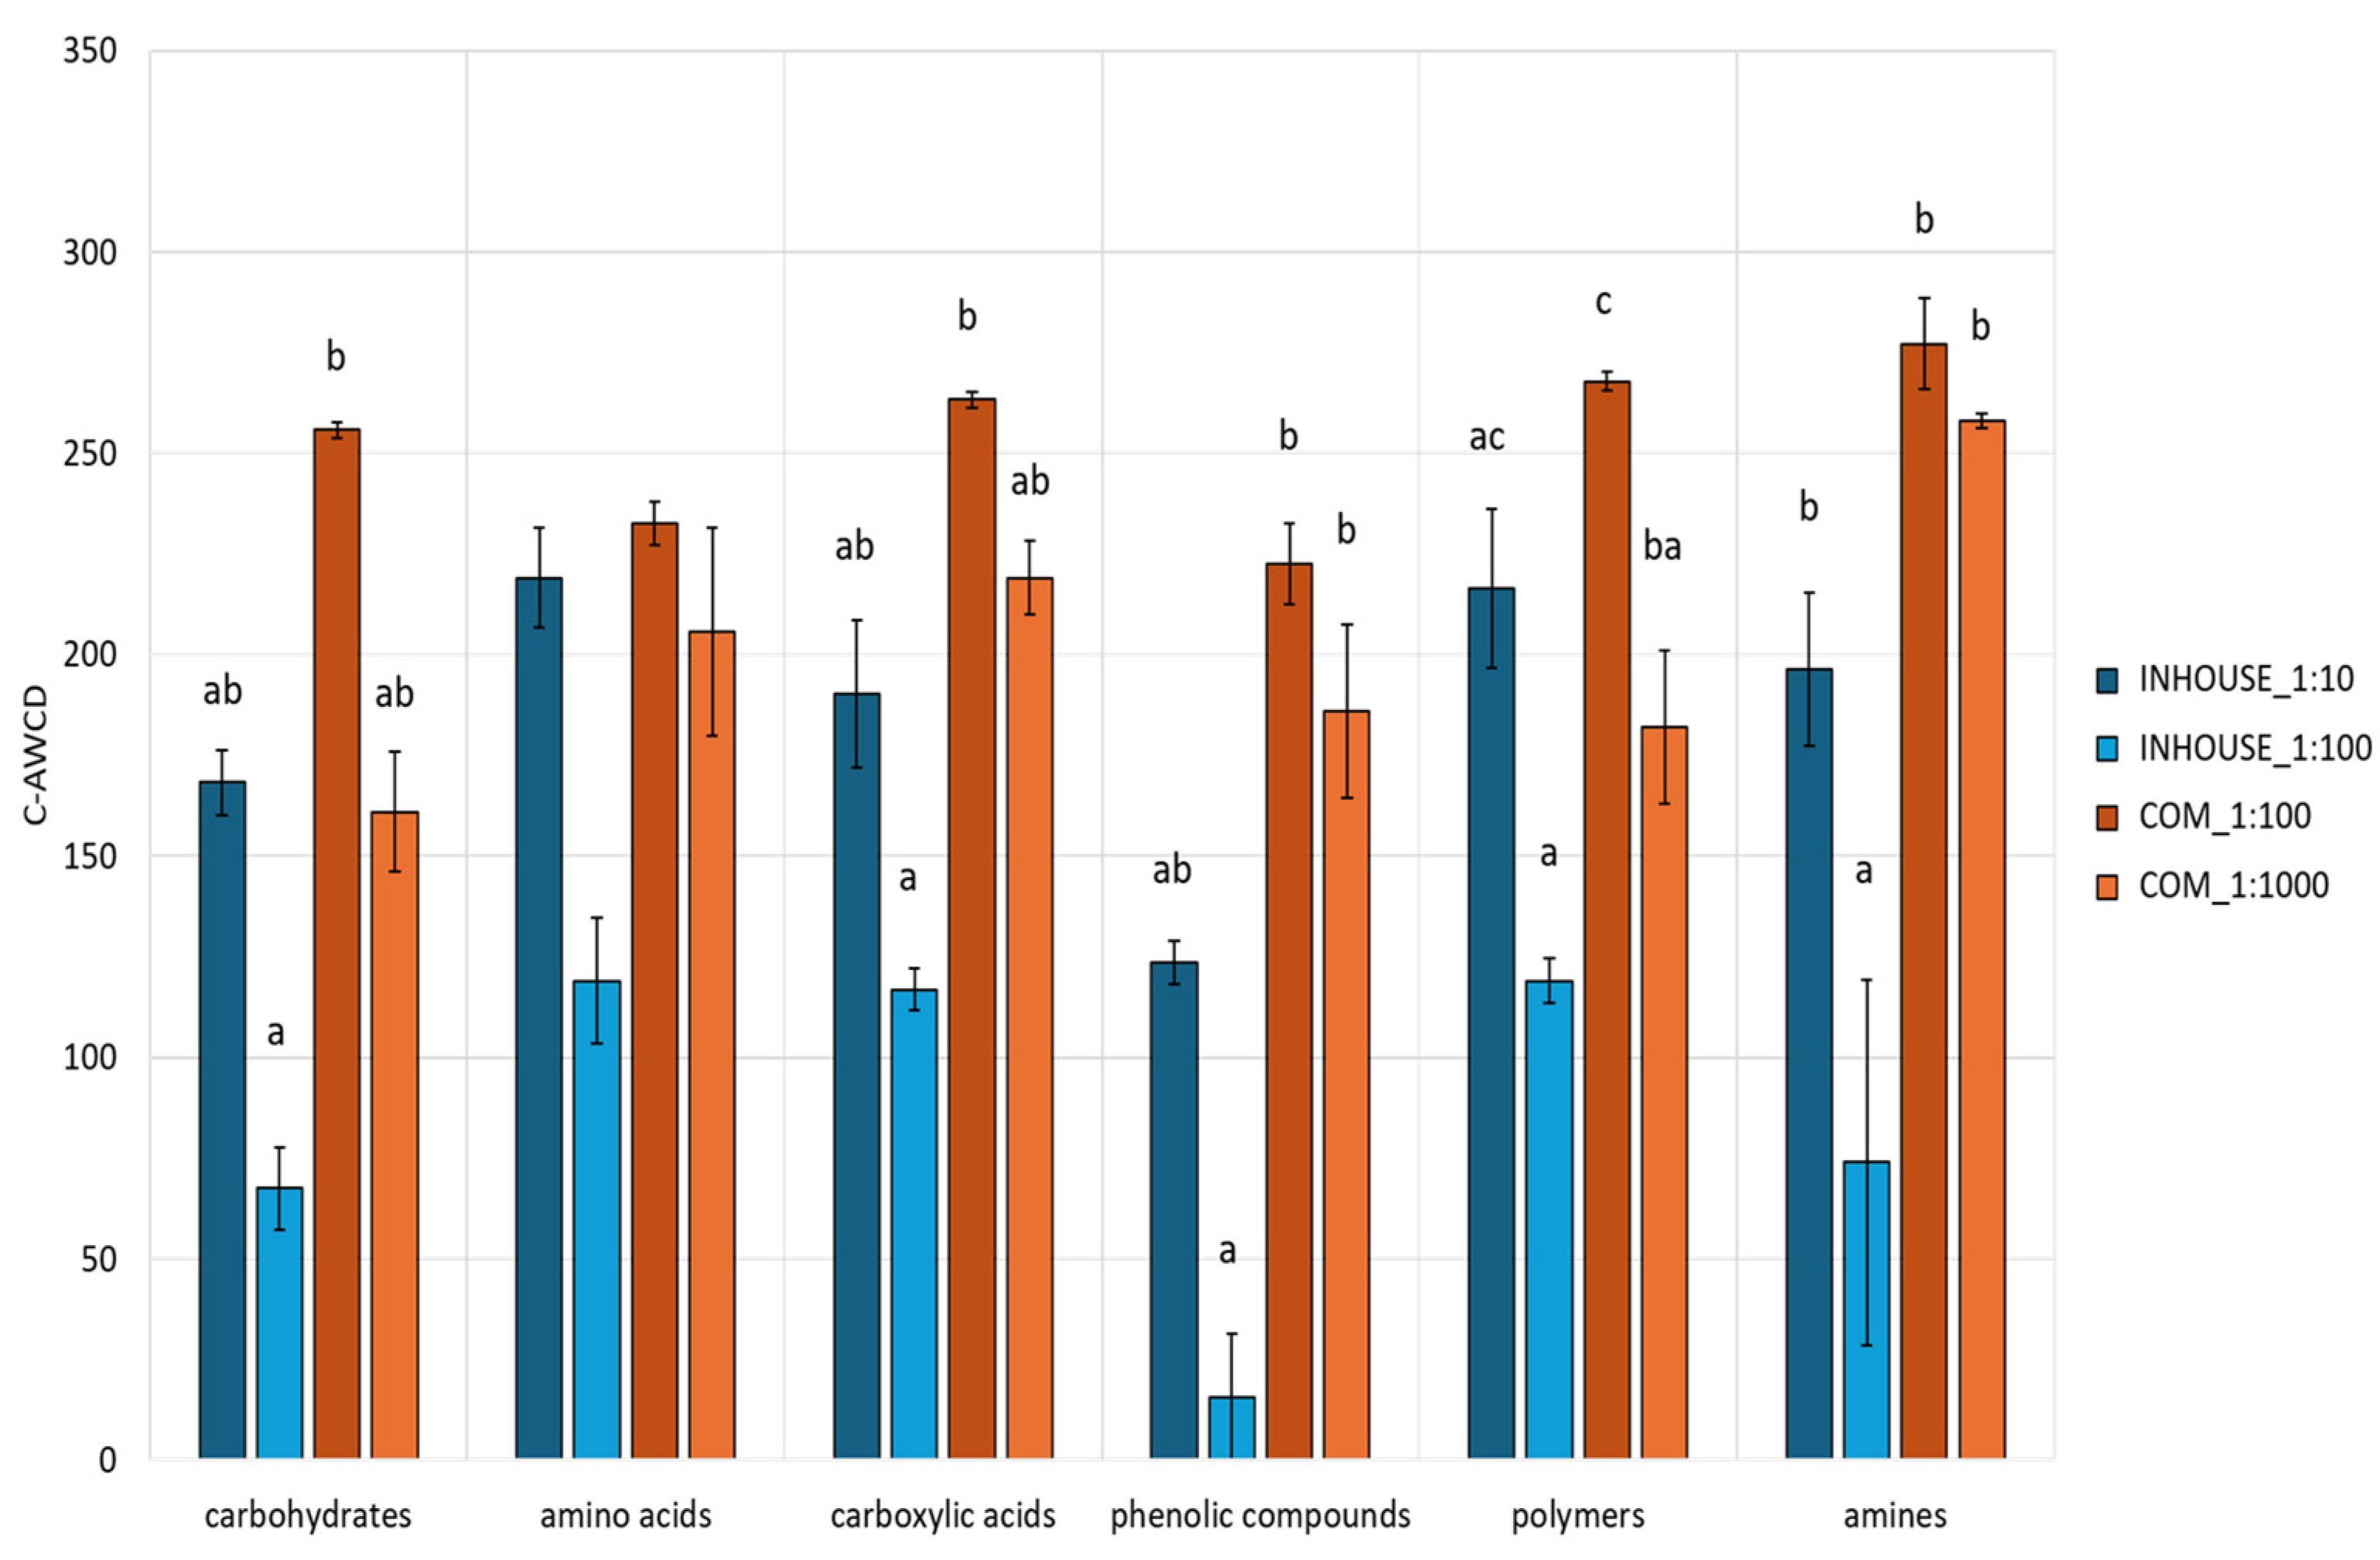
Regarding substrate utilization, carbon sources were categorized into six groups (
Table S1). The mean C-AWCD was calculated for each category (
Figure 3). Significant differences were observed across all compound classes, except for amino acids. The COM_1:100 microbial community registered the highest C-AWCD values (over 200 BU) for all categories. The highest dilution of the same CT maintained a similar profile, except for metabolism of carbohydrates and polymers, which was noticeably impaired. The INHOUSE_1:10 microbial community metabolic profile closely mimicked the one of COM_1:1000; on the other hand, INHOUSE_1:100 exhibited the lowest C-AWCD values across all categories, particularly for phenolic compounds and amines, when compared with the other three CT samples.
Lastly, diversity indices were calculated for all four conditions (
Table 2). Differences among CT samples were statistically significant for all indices (
p < 0.05), except for the evenness (E) index. COM_1:100 exhibited the highest H′, D, and SR indices, indicating broader metabolic diversity and utilization of a greater range of substrates. Indeed, the COM_1:100 microbial community metabolized all 31 compounds provided in the Biolog EcoPlates (AWCD > 50 BU). Conversely, INHOUSE_1:10 displayed the lowest H′, D, and SR values, metabolizing only 14.3 carbon sources. Both INHOUSE_1:10 and COM_1:1000 reported a SR value of ~26, among which D-Xylose, 2-Hydroxybenzoic Acid, and α-Ketobutyric Acid were exclusively metabolized by the COM_1:1000 microbial community, while α-Cyclodextrin, D-Glucosaminic Acid, and D,L-α-Glycerol Phosphate registered an absorbance value higher than 50 BU only in the INHOUSE_1:10 sample.
The distribution observed in the PCA revealed a separation along PC1 (
Figure 4), which accounted for 41.91% of the variance, with INHOUSE_1:100 replicates distinctly positioned on the right side of the plot. INHOUSE_1:10 and COM_1:1000 samples clustered together, confirming their similar metabolic profile. Lastly, COM_1:100 replicates formed a distinct group on the left. PC1 was positively correlated (R > 0.60) with the degree of utilization of Pyruvic Acid Methyl Ester (B1, carboxylic acid), L-Asparagine (B4, amino acid), Tween 40 (C1, polymer), L-Phenylalanine (C4, amino acid), Tween 80 (D1, polymer), D-Mannitol (D2, carbohydrate), and Itaconic Acid (F3, carboxylic acid); it was negatively correlated (R < −0.60) with metabolism of β-Methyl-D Glucoside (A2, carbohydrate), α-D-Lactose (H1, carbohydrate), D,L-α-Glycerol Phosphate (H2, carbohydrate), Glucose-1-Phosphate (G2, carbohydrate), 4-Hydroxy Benzoic Acid (D3, phenolic compound), Glycogen (F1, polymer), D-Glucosaminic Acid (F2, carboxylic compound), Glycil-L-Glutamic Acid (F4, amino acid), and Phenyletyl-amine (G4, amino acid). Additionally, PC2, accounting for 16.83% variation, was positively correlated with color development on L-Arginine (A4, amino acid), D-Galacturonic Acid (B3, carboxylic acid), and Putresceine (H4, amine) and negatively with L-Serine (D4, amino acid) and D-Malic Acid (H3, carboxylic acid).
3.2. In Vivo Evaluation of the Biostimulatory Effect of CTs on Pea and Chickpea Plants
The biostimulation effects of freshly prepared CTs were estimated on chickpeas and peas 3 weeks after CT plant treatment. Root length, plant height, root wet and dry weight, and above-ground wet and dry weight parameters were considered. Significant differences were observed in root development for both species. In detail, for chickpeas, root length and root dry weight demonstrated biostimulation after treatments with COM CT at the 1:10 dilution, with root length increasing by 56% compared to SDW. Similarly, for peas, an increase in root elongation was observed after COM CT treatments at dilutions of 1:100 and 1:1000; particularly, pea root length increased in the 1:1000 dilution group by 49% compared to SDW. This biostimulatory effect was also evidenced by the highest pea plant height at the same COM CT dilution (ranging from 10.9 cm to 11.3 cm after treatment with 1:100 and 1:1000 dilutions, compared to the 9.4 cm registered for SDW) (
Figure 5). No significant differences (
p > 0.05) were observed for the aerial part of chickpea plants (plant height and above-ground wet and dry weight) or pea plant weight (
Table 3).
The “in house” CT produced biostimulating effects on pea plants: all tested dilutions determined an increase in root length, ranging from 10.6 cm to 12.7 cm, when compared with SDW (3.6 cm). No biostimulating effects were observed in chickpeas after “in house” CT treatments.
The biostimulating effect of CT treatments was confirmed by RGI calculation. The RGI value was higher than 1.2 when chickpeas were treated with CT COM 1:10 (RGI = 1.56) and when peas were treated with “in house” CT and COM CT at all the dilutions tested (RGI ranging from 3.52 to 3.36 for “in house” CT and from 1.22 to 1.49 for COM CT). Biostimulation of peas after treatment with COM CT 1:10, 1:100, and 1:1000 is evidenced by the RGI calculation and confirmed by differences in root elongation after treatment with 1:10 and 1:00 dilutions, compared to SWD.
The RGI index also allowed us to estimate the inhibitory effect of CTs on roots. In these experiments, the RGI was lower than 0.8 for all the treatments of chickpeas, except for the application of COM CT at a 1:10 dilution (RGI = 1.56). On the contrary, no inhibition of root elongation was registered for peas after treatment. The RGI calculation was considered valid, as the coefficient of variability (CV) was lower than 30% in the SDW controls.
Due to the inhibitory effects observed in chickpeas, the McKinney index (MKI) was used to evaluate the root and collar necrosis observed on the plants. The index registered the lowest values (healthy roots) after treatment with the 1:1000 dilution of “in house” CT and the 1:10 dilution of COM CT (MKI = 0.04 and MKI = 0.01, respectively)
Figure 6a,b), while undiluted CTs caused the most severe necrosis, as depicted in
Figure 6c.
3.3. Correlation Analysis Between Microbial Metabolic Activity and Biostimulatory Effects on Pea Plants
Correlation analysis between the RGI obtained for pea plants and the metabolic profiles of the CT microflora revealed significant associations with specific substrates. A correlation matrix was constructed using RGI values obtained from plants treated with two dilutions of each CT: 1:10 and 1:100 for “in house” CT, and 1:100 and 1:1000 for COM CT. In this context, it should be possible to identify “robust” compounds—i.e., those correlated with biostimulatory activity under multiple conditions—potentially involved in general underlying mechanisms. The RGI values were correlated with the normalized C-AWCD values for the six Biolog EcoPlate™ compound categories, calculated for the corresponding dilutions. A total of 21 Spearman correlation coefficients (R) were generated, of which 5 showed statistically significant associations (
p < 0.05). Two metabolic categories showed a significant correlation with the RGI: polymers were positively correlated (R = 0.66), whereas phenolic compounds were negatively correlated (R = −0.60). Notably, these two categories were also negatively correlated with each other (
Figure 7a).
Regarding the correlation matrix based on the normalized absorbance values of single compounds, 496 Spearman’s correlation coefficients were calculated, of which 110 were statistically significant (
p < 0.05). Several compounds displayed positive or negative inter-correlations; however, our attention was primarily focused on those significantly correlated with the RGI of pea plants (
Figure 7b). Specifically, metabolism of Erythritol (C2, carbohydrate) and L-Serine (D4, amino acid) was positively correlated with a biostimulatory effect (R = 0.63 and R = 0.60, respectively), whereas 2-Hydroxybenzoic Acid (C3, phenolic compound), α-Ketobutyric Acid (G3, carboxylic acid), Phenylethylamine (C4, amine), and α-D-Lactose (H1, carbohydrate) were negatively correlated with RGI (R = −0.79, −0.72, −0.70, and −0.61, respectively). When analyzed separately, only the COM CT community exhibited a positive correlation (R = 0.83) with L-Serine and a negative correlation (R = −0.89) with α-Ketobutyric Acid.
3.4. Bacterial Isolation, Biochemical Characterization, In Vitro Biocontrol Activity, Biostimulation Properties, and Molecular Identification
Overall, 75 isolates were obtained on NGA after isolation from both CTs. The strains were initially selected based on their ability to produce 3-IAA and for their antagonistic activity against F. solani strain MH_897.2.1. As a result, one strain named MH_PL50.2, isolated from CT COM, was selected for its ability to produce 49.1 µg/mL of 3-IAA, higher than P. fluorescens C16, which was used as a positive control (44.23 µg/mL). Moreover, crystal violet assays highlighted the ability of MH_PL50.2 to produce biofilms, which was found to increase during an incubation time of 72 h. Unlike the positive control P. fluorescens C16, which formed a thick biofilm in 24 h with destabilization after 48 h, P. putida MH_PL50.2 forms biofilms slowly and needs 72 h to obtain a stable and thick biofilm.
Isolate MH_PL50.2 showed swimming motility, but did not produce siderophores or solubilize phosphorus (
Figure 8). Molecular identification by 16S rDNA sequencing allowed us to identify strain MH_PL50.2 as
Pseudomonas putida (Genbank accession number: PV442371); indeed, it showed a percentage of identity of 99.18% with
P. putida strains W5 (CP026115.2) and SLAY10 (KP993215.1).
Four strains were selected from the “in house” CT for their ability to limit the growth of F. solani MH_897.2.1 in the dual colony test. These strains were named MH_PL47, MH_PL48, MH_PL51.1, and MH_PL58.1 and reduced the colony average ray to 1.2 cm, 1.3 cm, 1.25 cm, and 1.35 cm, respectively, compared to the average ray of the F. solani control (4.00 cm). The 16S rDNA sequences amplified from these strains were uploaded to the NCBI database with the accession numbers PV442214 (MH_PL47), PV442215 (MH_PL48), PV442216 (MH_PL51.1), and PV442217 (MH_PL58.1) and aligned with Pseudomonas aeruginosa strain NBFPALD_RAS140 (Genbank: KJ819583), showing an identity percentage of 99.72%.
Strain MH_PL50.2 was finally evaluated for its in vivo biostimulation effect on pea plants. As a result, treatment with a bacterial concentration of 1 × 10⁶ CFU/mL determined an RGI of 1.2, with a CV in the negative control of 29%, demonstrating a slight biostimulatory effect on pea plants.
3.5. Biostimulation Assays After 8 Months of Storage
Biostimulation assays were repeated to determine the effect of both CTs on chickpea plants after an 8-month period of storage at +4 °C (
Supplementary Table S2). Root length, plant height, root dry weight, and RGI values did not evidence any significant variation in the measured parameters compared to SDW, except for the root length and root dry weight of plants treated with “in house” CT at 1:100 and 1:1000 dilutions. However, all RGI values were under the 1.2 threshold, showing no biostimulation after the treatments. Root parameters were negatively affected when plants were treated with the “in house” CT at the 1:10 dilution (RGI = 0.73). However, a decrease in inhibition of root elongation for both CTs was registered; indeed, the RGIs calculated after “in house” CT treatment at 1:10, 1:100, and 1:1000 dilutions before storage were 0.69, 0.84, and 0.99, respectively, and increased to 0.73, 1.08, and 1.11, respectively, after storage. The same variation was observed for COM CT, except for the 1:10 dilution. Indeed, the RGIs calculated for chickpea plants before storage were 1.56, 0.76, and 0.73 at 1:10, 1:100, and 1:1000 dilutions, respectively, and 0.84, 0.95, and 1.19 respectively, after storage.
Moreover, it is worth noting that the root necrosis incidence, measured by the McKinney index, decreased after treatment with stored CTs. After 8 months of storage, the MKI was higher in the SDW control, and significant differences were evidenced between SDW and the 1:1000 dilution of “in house” CT and between the SDW and the 1:100 dilution of COM CT (
Table 4). The correlation between RGI and MKI was assessed using Spearman’s rank correlation coefficient. A statistically significant negative correlation was found (R = −0.744,
p = 0.0086).
3.6. Metabolic Profiling of “In House” CT and COM CT Microbial Communities After Storage at 4 °C
CLPP analyses were repeated on CTs after 8 months of storage at +4 °C to verify whether the storage period could have an impact on microbial metabolism and if the changes observed in MKI could be related to variations in the microbial metabolic profiles. The vital titer of both samples was determined prior to inoculation into the Biolog EcoPlates, revealing a one-order-of-magnitude reduction for both CTs (
Table 5). The dilutions selected for inoculation into the microplates were 1:10 and 1:100 for both CTs (INHOUSE_S_1:10, INHOUSE_S_1:100, COM_S_1:10, and COM_S_1:100 samples). Although we could have matched the “in house” CT cell counts used in the previous test (~10
4 and 10
3 CFU/150 μL), we chose not to use the undiluted CT due to its natural dark color, which could interfere with absorbance readings.
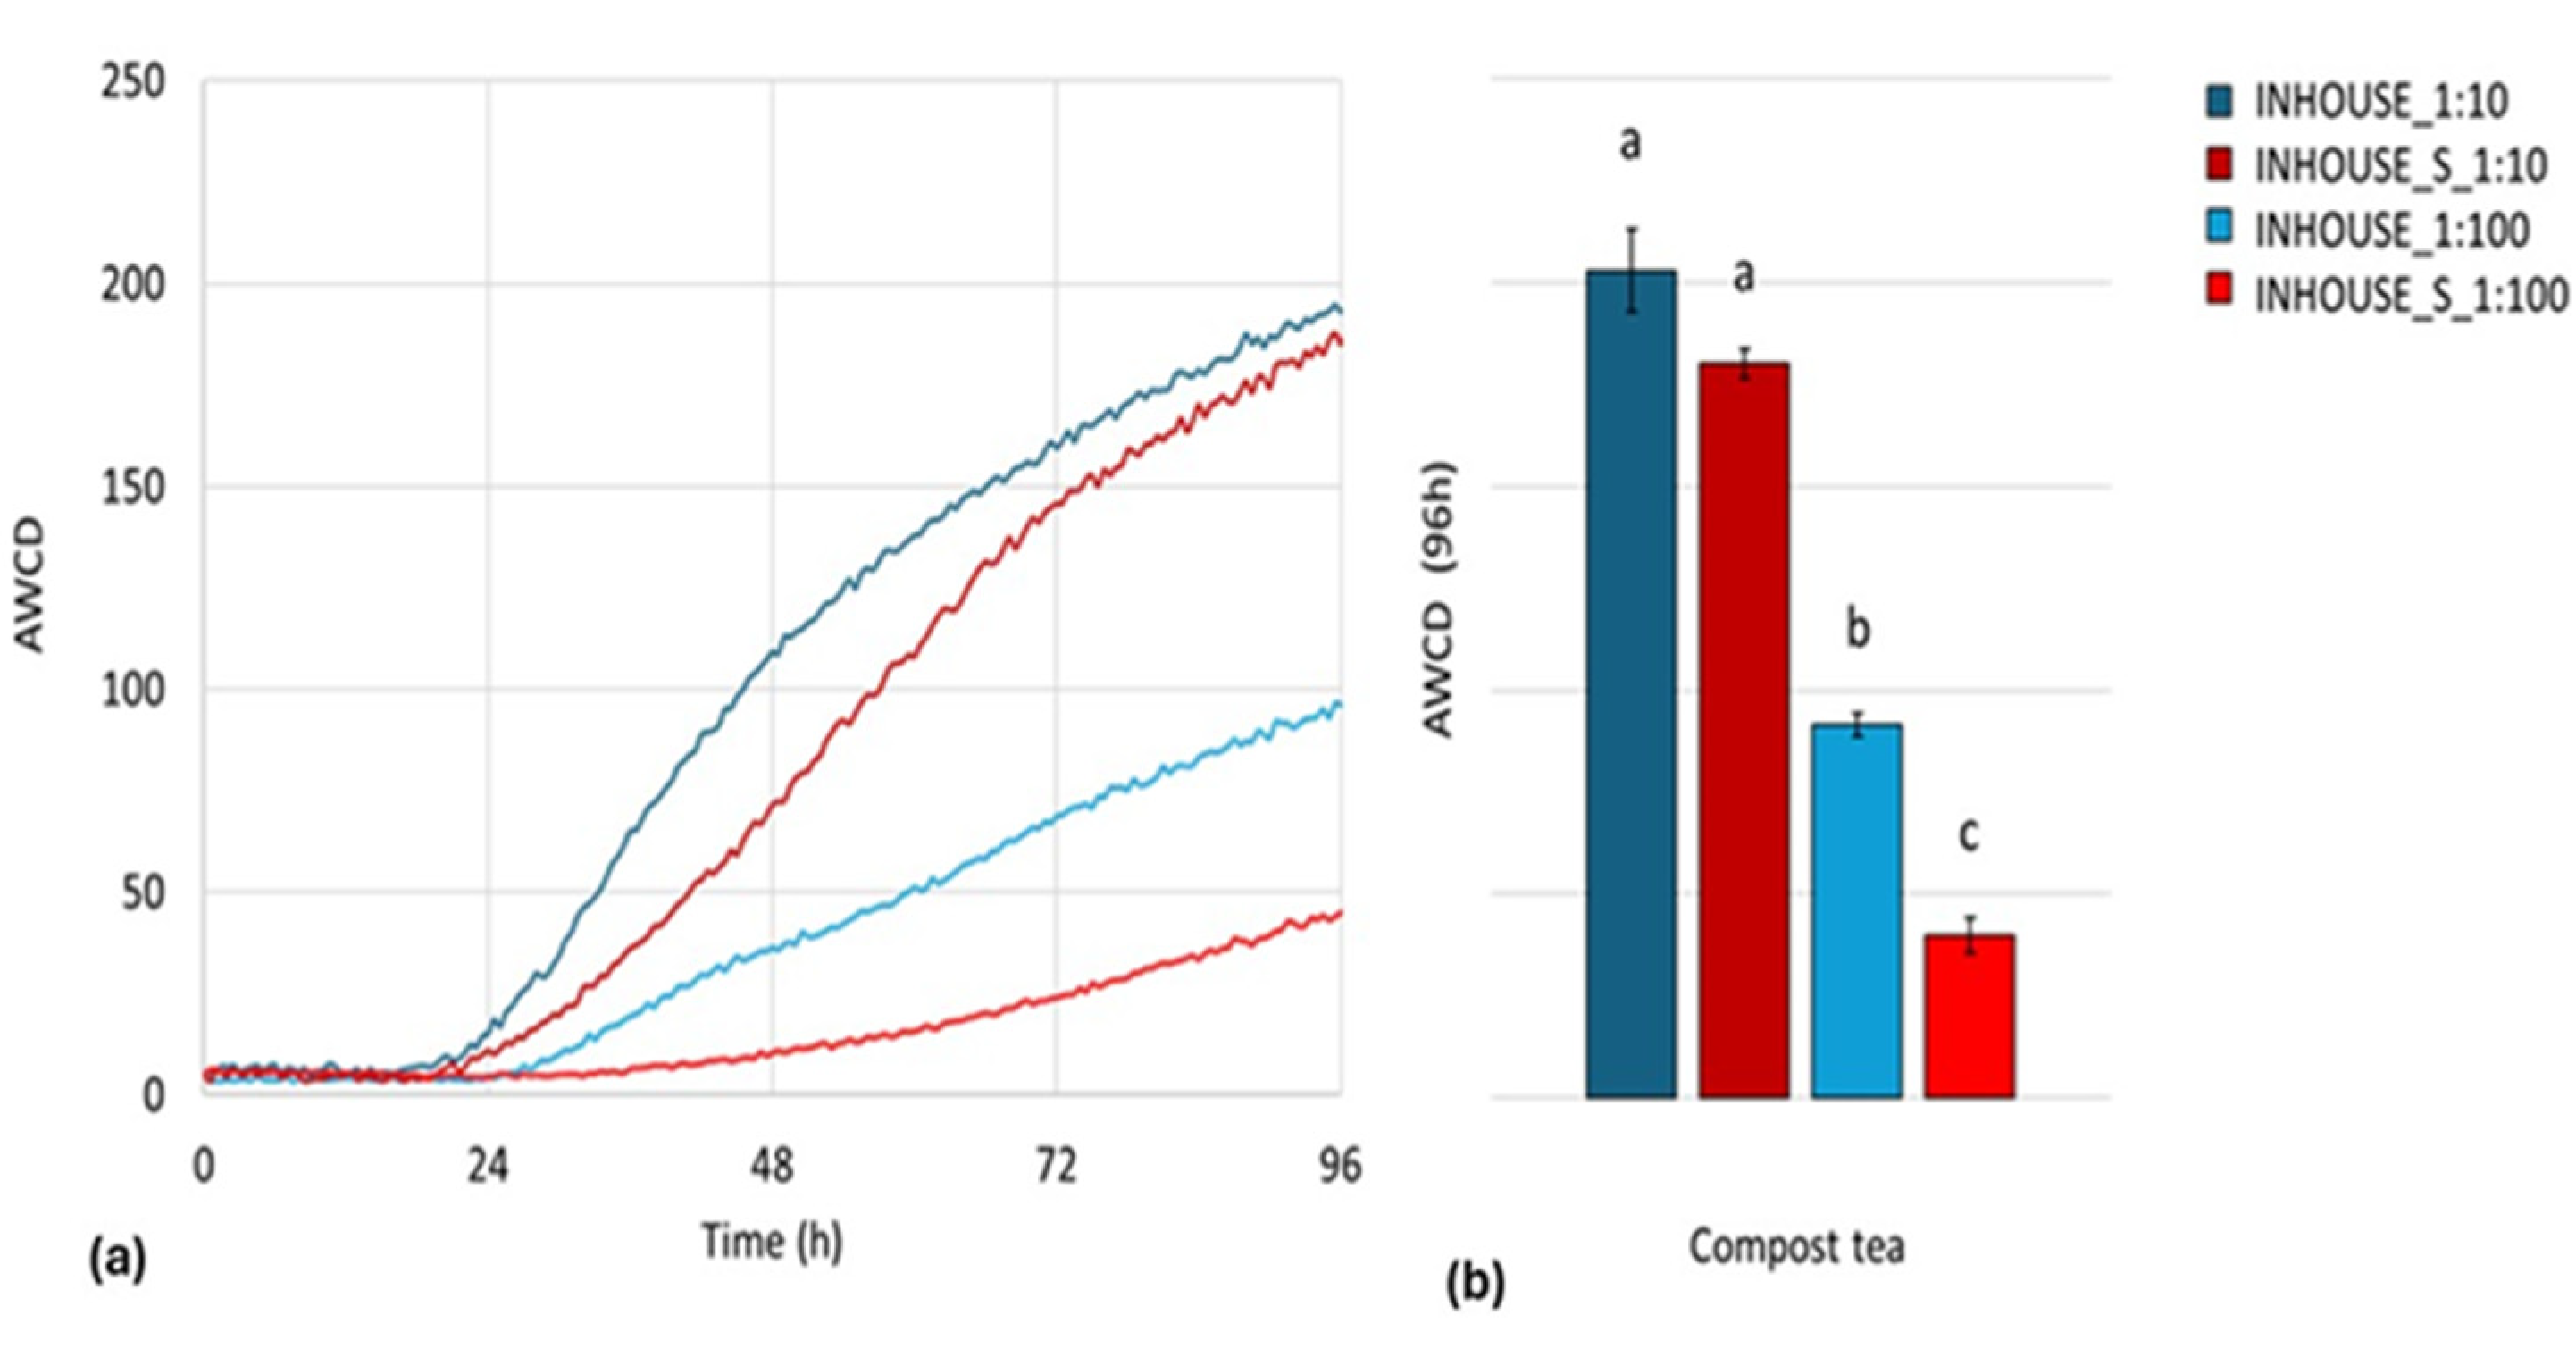
The AWCD kinetics over 96 h for the “in house” CT samples are presented in
Figure 9a. The INHOUSE_S1:100 microbial community exhibited a marked reduction in AWCD across most of the tested substrates, indicating a significant decline in metabolic activity. Conversely, INHOUSE_S1:10 displayed a metabolic profile closely resembling that of INHOUSE_1:10, with a slower exponential phase but ultimately reaching a similar plateau. These trends were further confirmed by the endpoint AWCD analysis (
Figure 9b).
Comparative analysis of substrate utilization across different compound classes (
Figure 10a) revealed significant differences among the four “in house” CT samples for all compound categories, except for amines. Despite the one-order-of-magnitude difference in cell densities between INHOUSE_1:10 and INHOUSE_S_1:10, their metabolic profiles remained largely comparable. In contrast, INHOUSE_S_1:100 demonstrated a substantial decline in metabolic activity across all substrate classes, with the most pronounced reductions observed in amino acid and phenolic compound utilization. PCA analysis (
Figure 10b) revealed a clear separation alongside PC1, accounting for 28.63% of the total variance. Notably, samples were mainly separated based on their cell densities: the 1:10 dilution samples, both pre- and post-storage, clustered on the right side of the plot, while the 1:100 dilution samples were positioned on the left. The separation along PC1 was primarily driven by metabolic utilization of specific substrates. In particular, consumption of D-Mannitol (D2, carbohydrate) was positively correlated (R > 0.60) with PC1, whereas metabolism in the presence of D-Galactonic Acid-Lactone (A3, carbohydrate), D-Cellobiose (G1, carbohydrate), Glucose-1-Phosphate (G2, carbohydrate), D-Galacturonic Acid (B3, carboxylic acid), D-Glucosaminic Acid (F2, carboxylic acid), 4-Hydroxy Benzoic Acid (D3, phenolic compound), L-Threonine (E4, amino acid), Glycil-L-Glutamic Acid (F4, amino acids), and Phenyletyl-amine (G4, amine), exclusive to the INHOUSE_1:10 and INHOUSE_S_1:10 microbial communities, was negatively correlated (R > −0.60) with PC1. Concerning PC2, it was positively correlated with color development in the presence of L-Phenylalanine (C4, amino acid) and 2-Hidroxy Benzoic Acid (C3, phenolic compound) and negatively correlated with consumption of L-Arginine (A4, amino acids), L-Asparagine (B4, amino acid), Tween 80 (D1, amino acids), D-Mannitol (D2, carbohydrate), D,L-α-Glycerol Phosphate (H2, carbohydrate), and α-Ketobutyric Acid (G3, carboxylic acid).
Diversity indices were computed for all four conditions (
Supplementary Table S3). INHOUSE_1:10 and INHOUSE_S_1:10 exhibited the highest H’, D, and SR indices, suggesting broader metabolic diversity and the ability to metabolize a wider range of substrates. INHOUSE_S_1:100 displayed the lowest values for such indices, indicating reduced metabolic versatility. Additionally, the E index of the INHOUSE_S_1:100 microbial community notably deviated from 1, suggesting uneven metabolic activity distribution across substrates.
The microbial community of the COM CT exhibited a significant reduction in AWCD at both tested dilutions following storage, compared to the fresh CT (
Figure 11a). Endpoint AWCD values were significantly lower than those of their respective pre-storage counterparts, despite the viable titer remaining within the same order of magnitude after the inoculation in the EcoPlates microplates (
Figure 11b). Substrate utilization analysis across different compound classes (
Figure 12a) revealed significant differences among the four CT samples for all categories, except for carbohydrates. Post-storage samples consistently exhibited lower C-AWCD values compared to their corresponding pre-storage dilutions, indicating a broad reduction in metabolic activity. In particular, the ability to metabolize phenolic compounds was substantially impaired following the 4 °C storage period.
PCA (
Figure 12b) revealed an evident separation among all four COM CT samples along both PC1 (explaining 45.7% variance) and PC2 (explaining 19.51% variance). The COM_S_1:100 replicates were distinctly positioned on the right side of the plot, while the remaining samples formed separate clusters on the left, with distribution occurring along PC2. In this case, no clear separation based on storage period or cell density is observed. PC1 was positively correlated (R > 0.60) with metabolism in the presence of β-Methyl-D Glucoside (A2, carbohydrate), D-Mannitol (D2, carbohydrate), N-Acetil-D-glucosamine (E2, carbohydrate), D-Cellobiose (G1, carbohydrate), Glucose-1-Phosphate (G2, carbohydrate), D-Galactonic Acid-Lactone (A3, carboxylic acid), Pyruvic Acid Methyl Ester (B1, carboxylic acid), D-Malic Acid (H3, carboxylic acid), L-Asparagine (B4, amino acid), and Phenyletyl-amine (G4, amine); PC1 was negatively correlated (R < −0.60) with consumption of L-Arginine (A4, amino acid), D-Galacturonic Acid (B3, carboxylic acid), D-Glucosaminic Acid (F2, carboxylic acid), 4-Hydroxy Benzoic Acid (D3, phenolic compound), α-Cyclodextrine (E1, polymer), Glycogen (F1, polymer), and D,L-α-Glycerol Phosphate (H2, carbohydrate). On the other hand, PC2 was strongly negatively correlated with metabolic activity in the presence of Tween 40 (C1, polymer), Tween 80 (D1, polymer), L-Phenylalanine (C4, amino acid), 4-Hydroxy Benzoic Acid (D3, phenolic compound), and γ-Hydroxybutyric Acid (E3, carboxylic acid).
Diversity indices further substantiated these findings (
Supplementary Table S4). COM_S_1:100 displayed the lowest values for the H′, D, and SR indices, suggesting constrained metabolic potential and limited substrate utilization. Additionally, the evenness index (E) deviated from 1, indicating an uneven distribution of metabolic activity across different carbon sources.
3.7. Diagnostic Analyses of Chickpea Plants
Diagnostic analyses were conducted with the aim of detecting the causal agent of the root necrosis observed in chickpea plants. Fusarium-like colonies were isolated from symptomatic plants in the SDW control group. Molecular identification of monosporic cultures allowed us to identify strain MH_1372.2 as F. solani (FS) and strain MH1372.1 as Fusarium oxysporum. In fact, the ITS sequence (PV441411) of the F. solani MH_1372.2 strain aligned with the already annotated isolate WF7(2) (acc. MT180477.1), with an ID percentage of 99.46; the TEF (PV483380) region was found to share 100% ID with strain Flaxville-MT (MK816982); the tubulin region (PV483382) revealed an ID percentage of 100% with strain KUYZ001B-1-1 (MH888078); while, in the actin gene region (PV483381), alignment revealed 99.65% identity with strain CREA_897.1.1 (OQ249626). With regard to plant strain MH_1372.1, in detail, the ITS region (PV446549) revealed a percentage of identity of 99.44% with several strains of F. oxysporum (i.e., PQ722562); TEF (PV483383) revealed several alignments with 100% identity, including those with F. oxysporum f. sp. pisi (MT630383) and F. osysporum f. sp. dianthi (LT841231). Similarly, the tubulin (PV504880) and actin (PV504881) sequences revealed identity percentages of 95.62% and 99.64% with F. oxysporum f. sp. vasinfectum and F. oxysporum f. sp. dianthi, respectively.
The pathogenicity of the two isolates was ascertained in chickpea plants (
Figure 13). Indeed, the disease indices calculated for the plants inoculated with FS MH_1372.1 and MH_1372.2 were 0.71 and 0.40, respectively, compared to 0.16 for the negative control. Koch’s postulates were confirmed by reisolation of the
F. solani MH_1372.2 strain from the collars and the
F. oxysporum MH_1372.1 strain from the collars and roots of all of the symptomatic plants.
4. Discussion
This study reports the results of an in-depth characterization of the microbial metabolic activity of a CT obtained from a mixture of artichoke, fennel, nut, and chestnut waste (“in house” CT) and a CT derived from commercial compost of olive pomace (COM CT). Moreover, the effects of CT treatment on chickpeas and peas in the early stage of plant development were also evaluated. This is a crucial phase of the crop cycle, since it strongly affects the next steps of plant growth in the field.
Biostimulation in vivo assays, carried out in this study, evidenced a diverse response of the two leguminous plants to the CT treatments, depending on the original CT matrix, CT dilution, plant species, and CT age. The “in house” CT had a biostimulating effect on peas at all the dilution tested; on the contrary, chickpea plants were negatively affected by “in house” CT treatment, showing a reduction in root length and the development of necrosis at the root and collar levels. These results were obtained considering root length measures, RGI calculation, and the index of necrosis severity calculated using the McKinney formula. On the other hand, the in vivo responses of the plants revealed that the COM CT was able to induce biostimulation of peas at all the dilutions tested and at a 1:10 dilution for chickpea plants. Also in this case, no negative effects were observed on pea roots, while in chickpeas intermediate necrosis severity in roots (MKI values) and root elongation inhibition (RGI values) were noticed after treatment with the 1:100 and 1:1000 dilutions.
Overall, the biostimulatory effect elicited by the two CTs was better highlighted by an increase in the root length of pea plants. The biostimulatory activity of CTs was previously demonstrated in different crops, as comprehensively reviewed in Pilla et al. 2023 [
28].
Although the scientific literature about the effect of compost tea on legumes is rather scarce, a study by Jarboui et al. [
46] demonstrated an increase in plant growth for both chickpeas and peas when treated with non-aerated fermented extract from food waste compost at appropriate dilutions. This study also highlighted that the same compost extract caused phytotoxicity to peppers (
Capsicum annuum L.), limiting the germination rate. For this species, the authors speculated an inhibitory effect of lignin and phenolic compounds, already reported as inhibitory molecules by Jara-Samaniego et al. [
47]. Indeed, lignin is one of the complex molecules being slightly degraded and remaining almost intact at the end of the composting process [
48]. he presence of phenolic compounds and lignin at high concentrations could explain the phytotoxicity effect of the “in house” CT toward chickpeas in the present study. Other research showed that a vermicompost tea had a mitigative effect on drought stress in chickpea plants during the germination phase, improving root and plumule dry weight [
49].
Biostimulatory effects might be related to some of the diverse bioactive substances of a CT after the fermentation process, as well as to the presence of plant-growth-promoting microorganisms. Thus, gaining insight into the functional profile of microbial communities in CTs might represent a valuable tool to better understand their potential biostimulatory action. To this end, Biolog EcoPlates were employed as a high-throughput phenotypic microarray tool to assess the metabolic activity of the microbial consortia present in the different CT formulations. This approach enables relatively fast characterization of community-level physiological profiles (CLPPs) by monitoring the utilization of a wide range of carbon sources, thereby providing an indirect yet informative measure of microbial functional diversity and activity. To the best of our knowledge, this is the first study applying the Biolog system to CTs, whereas several works have already explored the metabolism of the microbial communities in composts [
50,
51].
In our study, higher cell density corresponded to higher endpoint AWCD values within the same CT community, indicating decreased metabolic efficiency or a lower level of metabolic activity at reduced microbial titers. This could be attributed to the loss of specific microbial species at higher dilutions [
51]. Although the microbial loads inoculated onto the Biolog EcoPlates were the same for both freshly prepared CTs (10⁴ and 10
3 CFU/150 µL), the COM CT microbial community exhibited higher metabolic potential in terms of total AWCD, C-AWCD, and biodiversity indices. Notably, the COM_1:1000 and INHOUSE_1:10 samples exhibited a quite similar metabolic profile, suggesting shared metabolic potential between the two CT communities. For this reason, correlation analysis was conducted using normalized C-AWCD and single compound absorbance values obtained for both CTs. The activity observed toward pea plant roots (RGI) was positively correlated with metabolism of the compound category polymers, as well as with consumption of two specific compounds: erythritol and L-serine. The number of bacterial species capable of utilizing erythritol—a four-carbon polyol—as a carbon source appears to be limited [
52]. Erythritol catabolic loci have been mainly identified in Alpha-proteobacteria, particularly within the order Rhizobiales, which includes numerous plant-associated taxa [
52]. Notably, an erythritol-uptake mutant of
Rhizobium leguminosarum bv.
viciae, although still capable of forming functional nitrogen-fixing nodules, exhibited a marked reduction in its competitive ability to colonize pea roots compared to the wild-type strain [
53]. Moreover, beyond plant-associated bacteria, erythritol metabolism has also been implicated in the virulence of the animal pathogen
Brucella, where it supports bacterial growth and induces the expression of key virulence factors [
54]. Although in a different biological context, this finding reinforces the hypothesis that erythritol-utilizing bacteria may be better equipped to engage with eukaryotic host tissues. Taken together, these observations suggest that erythritol metabolism within CT microbial communities may reflect the presence of functionally specialized plant-associated bacteria. Such taxa could contribute to both the ecological fitness of the microbial community and its capacity to promote plant growth [
53]. L-serine catabolism could also be indirectly correlated with plant biostimulation. Selective metabolism of amino acids over sugars and repression of glucose assimilation in the presence of amino acids is known to occur among several members of the rhizosphere microflora [
55]. Indeed, as a source of carbon and nitrogen, amino acids are able to support microbial growth, in contrast to other chemicals found in the rhizosphere, such as some sugars and organic acids [
56]. In particular, amino acids like glycine and serine are typically found at high levels in root exudate [
57]. L-serine metabolism generates ammonium, which can contribute to soil nitrogen availability, potentially benefiting the plant [
57]. Moreover, ammonium could be assimilated directly by the microflora, promoting microbial proliferation and indirectly supporting plant growth [
57].
Large-scale preparation of CTs might offer a practical advantage for their repeated application to cultivated plants, particularly in agricultural systems aiming to reduce synthetic inputs [
58]. However, such an approach necessitates the development of appropriate storage strategies to preserve the microbial viability and functional properties of the CTs over time. To understand the impact of storage conditions on the functional stability of CTs, chickpea plants were treated with INHOUSE CT and COM CT after a storage period of 8 months at 4 °C. We chose to focus our attention on chickpea plants due to the suspected phytotoxic effects observed following treatment, with the aim of gaining a deeper understanding of this phenomenon. This experiment revealed loss of the biostimulatory effect of the COM CT (observed at the 1:10 dilution using the freshly prepared CT), which might be attributed to loss of the beneficial microbial contribution related to a reduction in the microorganisms’ titer. It was extensively demonstrated, after all, that a reduction in the microbial load in CTs leads to the loss of beneficial properties [
11]. On the other hand, a slight reduction in the inhibitory effect on root elongation was also observed for both CTs. Indeed, when chickpea plants were treated with the “in house” CT, the RGI increased after storage at all the dilutions tested, while the root necrosis severity (MKI values) decreased. Thus, we hypothesize a loss of phytotoxic effect related to the period of storage.
On the other hand, CLPP analyses demonstrated that prolonged storage of the “in house” CT and COM CT at +4 °C led to a decline in microbial metabolic activity, particularly at higher dilutions. The “in house” CT microbial community maintained a metabolic profile similar to its fresh counterpart at the 1:10 dilution, but higher dilutions experienced an important loss in metabolic potential, probably due to the low cell density inoculated into the microplate. In contrast, the COM CT microbial community exhibited a substantial overall reduction in metabolic activity across all substrate classes. Then, the results obtained by CLPP analysis confirmed that the bacterial density and the relative metabolic activity strongly affected the beneficial properties of the COM CT [
59]. In addition to microbial decline, it is plausible that storage may also alter the composition or availability of bioactive compounds beneficial to plant growth (e.g., phytohormones, humic acids) [
9,
10,
11,
12,
13,
14,
15,
16,
17,
18,
19,
20,
21,
22,
23,
24,
25,
26,
27,
28,
29,
30,
31,
32,
33,
34,
35,
36,
37,
38,
39,
40,
41,
42,
43,
44,
45,
46,
47,
48,
49,
50,
51,
52,
53,
54,
55,
56,
57,
58,
59,
60].
The etiology of root necrosis present in chickpea plants was not easy to determine, since the symptoms could be attributed to a CT phytotoxic effect or to the putative presence of seedborne pathogens. During our experimental assays, we evaluated root necrosis in chickpeas through two indices: the RGI, giving a measure of root elongation/inhibition, and the MKI, highlighting the health status of the roots. Nevertheless, it was very tricky to understand the contribution to root necrosis attributable to CT treatment or other causes. With the aim of answering this question, isolation of fungi was performed for the necrotic areas of plants, before complete rotting. Pathogenic
F. solani (MH_1372.2) and
F. oxysporum (MH_1372.1) isolates were obtained from plants treated with SWD, suggesting putative fungal contamination of the chickpea seed lot. It is worth noting that no pathogenic fungi were obtained from plants treated with the two CTs, suggesting a possible protective effect against
Fusarium diseases. In fact, a previous study conducted by Samet et al. (2018) [
61] already showed that CT from industrial wastes is effective in the control of
F. solani in potatoes.
In this study, the hypothesis of the biocontrol potential of CTs against
Fusarium species is also supported by the isolation of several bacterial strains from the “in house” CT that could be involved in plant protection against
F. solani. Indeed, characterization carried out on the cultivable microflora of the CTs revealed the presence of four
P. aeruginosa strains, which showed in vitro biocontrol against the
F. solani collection strain MH_897.2.1. Supporting this hypothesis, several strains of
P. aeruginosa were already reported in the literature as effective biocontrol agents, thanks to their ability to produce antimicrobial compounds such as phenazines [
62] and pyocyanin [
63]. Moreover, two strains of
P. aeruginosa isolated from compost were able to counteract
F. solani in cucumbers [
64]. Strain RZ9 of
P. aeruginosa, isolated from the rhizosphere of faba beans, inhibited mycelial growth and
F. culmorum aggressiveness in greenhouse experiments [
65], while strain CQ-40 was demonstrated to promote tomato plant growth and protection against
Botrytis cinerea [
66]. Recently,
P. aeruginosa strain OG was found to be effective in the biocontrol of
F. oxysporum f. sp.
vasinfectum in cotton [
67].
In addition, characterization of cultivable microflora also allowed us to identify a strain of
P. putida, isolated from the COM CT, able to produce 3-IAA and showing in vivo biostimulatory effects on peas.
P. putida was already reported as a plant-growth promoting rhizobacterium (PGPR) in
Brassica juncea; indeed, strains from the rhizosphere had biostimulating and biosurfactant properties, positively affecting the growth of the host plant [
68]. Moreover, this bacterial species is often reported as an agent of bioremediation in several studies [
69,
70].


 ,
, 


