Article

Influence of Nitrogen Addition Levels on N2O Flux and Yield of Spring Wheat in the Loess Plateau

1
School of Environment and Urban Construction, Lanzhou City University, Lanzhou 730070, China
2
College of Forestry, Gansu Agricultural University, Lanzhou 730070, China
3
College of Agriculture, Hexi University, Zhangye 734000, China
*
Author to whom correspondence should be addressed.
Agronomy 2025, 15(6), 1377; https://doi.org/10.3390/agronomy15061377
Submission received: 24 April 2025 / Revised: 23 May 2025 / Accepted: 28 May 2025 / Published: 4 June 2025
(This article belongs to the Section Agroecology Innovation: Achieving System Resilience)

Abstract

Nitrogen fertilizer plays a crucial role in enhancing soil fertility, impacting both crop yields and nitrous oxide (N2O) emissions from farmland soils. However, while nitrogen fertilizers increase yields, they also influence N2O emissions, and this relationship remains understudied in the Loess Plateau region of China. This study examined the effect of four nitrogen fertilizer levels—no nitrogen (CK), low (LN), medium (MN), and high (HN)—on N2O emissions and spring wheat yield. Over two years, nitrogen fertilization significantly increased N2O emissions, with HN treatment resulting in emissions 229.95%, 69.38%, and 46.52% higher than CK, LN, and MN, respectively. Emission fluxes exhibited strong seasonal variability, influenced by soil temperature, enzyme activity, and nitrogen availability. Spring wheat yields initially increased and then decreased, with the highest yields recorded under MN treatment (1283.67 and 1335.83 kg·ha−1). Given the sharp rise in N2O emissions due to nitrogen application in arid areas, the contribution of spring wheat soil to global warming and ozone depletion cannot be overlooked. Results suggest that a moderate nitrogen application of 110 kg·ha−1 in the Loess Plateau optimizes yield, enhances soil conditions, and mitigates N2O emissions, whereas excessive nitrogen leads to nitrate accumulation, exacerbating environmental issues like the greenhouse effect, and ultimately reducing wheat yield and causing economic losses.

1. Introduction

Nitrous oxide (N2O), one of the three major greenhouse gases, has a long atmospheric lifetime (up to 114 years) and a global warming potential 298 times that of CO2 and 34 times that of CH4 [1]. Around 80% of atmospheric N2O emissions originate from soil, with human activity accounting for 43% of these emissions, of which farmland soils contribute 52% [2]. The extensive use of nitrogen fertilizers to increase crop yields has become a key source of agricultural N2O emissions [3,4]. Studies show that urea application inhibits the NO2 to NO3 conversion process, leading to peak N2O emissions post-fertilization [5,6]. Reducing N2O emissions from agriculture is critical for food security and environmental sustainability.
Global nitrogen fertilizer use rose from 112.5 million tons in 2015 to 118.2 million tons in 2019, with a 1% annual growth rate [7,8]. China accounts for 29% of global nitrogen fertilizer consumption, and N2O emissions from fertilizer use contribute 21.02% to 50.47% of total farmland soil emissions, making it a significant form of nitrogen loss [9,10]. Only 30–50% of the nitrogen applied is absorbed by crops, with the remainder leading to soil acidification and increased N2O emissions, threatening sustainable agriculture [11]. Changes in soil ammonium (NH4+) and nitrate (NO3) content under various fertilization regimes influence N2O emissions [12]. Soil N2O production is closely tied to pH and nutrient content [13,14], with high-pH soils showing greater N2O production through nitrifying denitrification [15]. Urea has been shown to inhibit NO2 to NO3 conversion, leading to peak N2O emissions post-fertilization due to ammonia-oxidizing bacteria [5,16,17,18,19].
Soil enzymes, derived from microorganisms and plant residues, play a key role in nitrogen cycling [20]. Urease breaks down urea into ammonia and CO2, while nitrate and nitrite reductases convert soil nitrates to ammonium hydroxide [21,22,23]. These enzymes are essential for soil nitrogen conversion. Proper nitrogen fertilization improves soil nutrient content, supports plant growth, and boosts wheat yields [24,25]. However, excessive nitrogen application reduces soil quality and enzyme activity, promoting nitrogen loss through nitrification and denitrification [26,27,28]. Fertilization also accelerates nitrogen cycling, affecting both enzyme activity and inorganic nitrogen levels, which in turn influence crop yields and N2O emissions [29,30]. Numerous factors, including soil temperature, texture, pH, moisture, and enzyme activity, contribute to uncertainties in farmland N2O emissions [31,32,33,34,35,36,37].
The Longzhong Loess Plateau, a semi-arid region of the Loess Plateau, is one of the world’s most fragile ecosystems. Nitrogen cycling in this region is vital for maintaining agricultural productivity and nitrogen reservoirs. Spring wheat, known for its drought resistance and short growth period, is widely cultivated here [38]. While moderate fertilization increases yields [39], over-fertilization has become a common practice, leading to soil degradation and reduced fertilizer efficiency [40,41,42]. Most studies on dryland crop yields and N2O emissions focus on rainfall patterns [43,44], land use [45,46], and farming practices [47,48], while the response patterns and key control factors of spring wheat yield and N2O emissions in semi-arid regions to different nitrogen application levels are still unclear.
This study investigates the effects of different nitrogen application levels on spring wheat yield and soil N2O emissions in the Loess Plateau’s arid farming areas. By analyzing N2O emission fluxes and yields, we aim to clarify the optimal nitrogen application rate for maximizing yields while minimizing N2O emissions, contributing to a better understanding of nutrient cycling and food production, and improving farmland ecology in Northwest China. We hypothesize that (1) nitrogen application increases N2O emissions by influencing soil nitrogen content and enzyme activity and (2) nitrogen enhances wheat yields, though the relationship between yield and nitrogen application is non-linear, implying overapplication of nitrogen can lead to reduced yields.

2. Methods

2.1. Study Site

The study was conducted in Anjiapo Village, Anding District, Dingxi City, Gansu Province (35°64′ N, 104°64′ E, 2000 m asl), situated in the hilly and gully region of the Longzhong Loess Plateau. The area experiences large day–night temperature variations, with an annual average temperature of 7.2 °C, a frost-free period of 140 days, and an average annual evaporation of 1531 mm. The annual average accumulated precipitation is 377 mm, with most rainfall occurring between July and September, accounting for about 65% of the total annual precipitation. The average accumulated precipitation in the research area was higher in 2022 than in 2023 (Figure 1), while soil temperature (maximum and average temperatures) was lower in 2022 than in 2023 (p < 0.05). This semi-arid region, characterized by a temperate continental climate, frequently experiences spring and winter droughts, limited groundwater resources, and seasonal water shortages. The soil is primarily yellow loess, derived from secondary loess parent material, featuring a soft and uniform texture. Pre-experiment topsoil characteristics included a pH of 8.36, total nitrogen of 0.61 g·kg−1, total phosphorus of 0.32 g·kg−1, bulk density of 1.19 g·cm−3, and organic carbon of 6.21 g·kg−1.

2.2. Experimental Design for N Addition in Spring Wheat

A randomized block design was used with no N fertilizer as the control treatment (CK), and three different N application levels were set based on the local fertilizer application [9]: low nitrogen (LN, 55 kg N ha−1 y−1, accounting for 1/4 of the local nitrogen fertilizer application rate), medium nitrogen (MN, 110 kg·N·ha−1 y−1, accounting for 1/2 of the local nitrogen fertilizer application rate), and high nitrogen (HN, 220 kg N ha−1 y−1, local fertilizer application rate). Nitrogen fertilizers were applied in two equal doses, once during sowing and the second during the tillering stage. Each treatment was replicated three times, resulting in 12 experimental plots. Plot dimensions were 4 m × 6 m, with 25 cm row spacing. The local spring wheat variety, ‘Ganchun 27’, was used as the indicator crop at a sowing rate of 187.5 kg·ha−1. Sowing occurred in late March 2022 and 2023, with harvesting in early August, while maintaining consistent field management practices.

2.3. Sampling and Analysis of N2O Gas

N2O fluxes were measured during the spring wheat growing season (April to August) in 2022 and 2023 using static (closed) dark chambers (length × width × height = 0.5 m × 0.5 m × 0.5 m) and gas chromatography [49]. Sampling commenced on 3 April 2022 and 15 April 2023, and concluded on 3 August 2022 and 15 August 2023, with collections every 15 days. Gas samples were typically collected between 9:00 and 11:00 a.m. Each static chamber was locked, and the first sample was taken using a 100 mL syringe, injected into a gas bag, followed by additional samples every 8 min, totaling five samples over 32 min. Samples were then transported to the lab for analysis using a meteorological chromatograph (A90, Beijing Zhonghui Pu Analytical Technology Institute, Beijing, China) within 72 h. N2O flux was calculated based on Wu et al. [50].
F = d c d t × M V × P P 0 × T 0 T × H
where F is N2O flux (μg m−2 h−1), dc/dt is the rate of change in N2O concentration, M is the molar mass of N2O (g mol−1), V is molar volume at standard conditions (mL mol−1), P0 and T0 are standard pressure and temperature, respectively, P and T are the chamber pressure and temperature during sampling, and H is the chamber height.

2.4. Spring Wheat Yield and Soil Sample Collection and Analysis

Spring wheat yields were determined during maturity on 3 August 2022, and 15 August 2023. Soil samples from each treatment were collected at three key growth stages: emergence (April), jointing (June), and maturity (August). The 0–10 cm soil layer was sampled diagonally from each plot, combined, and stored in clean ziplock bags at 4 °C for laboratory nitrogen content analysis. Additional soil samples were collected during 2023 to measure enzyme activities, including urease, nitrate reductase, and nitrite reductase. Soil moisture content (SWC) was determined using the drying method, and pH was measured with a pH meter using a 2.5:1 water-to-soil ratio. The detailed determination method of soil total nitrogen (TN), ammonium nitrogen (NH4+), and nitrate nitrogen (NO3) can be found in prior study [51]. The determination of enzyme activity is based on the method of Guan [52] and Tabatabai [53], specifically as follows: urease activity was measured by the indophenol blue colourimetric, while nitrate and nitrite reductase activities were quantified using the benzenesulfonic acid-α-naphthylamine colourimetric method.

2.5. Statistical Analysis

Data normality was tested using SPSS 26.0; one-way analysis of variance (ANOVA) and LSD mean separation method were used to test the significance of differences in N2O fluxes, soil nitrogen fractions (TN, NH4+, NO3), enzyme activities (urease, nitrate reductase, nitrite reductase) and yields among treatments (significance level 0.05). Principal component analysis (PCA) and linear regression models were used to evaluate the effects of soil nitrogen components and enzyme activities on N2O flux in spring wheat.

3. Results

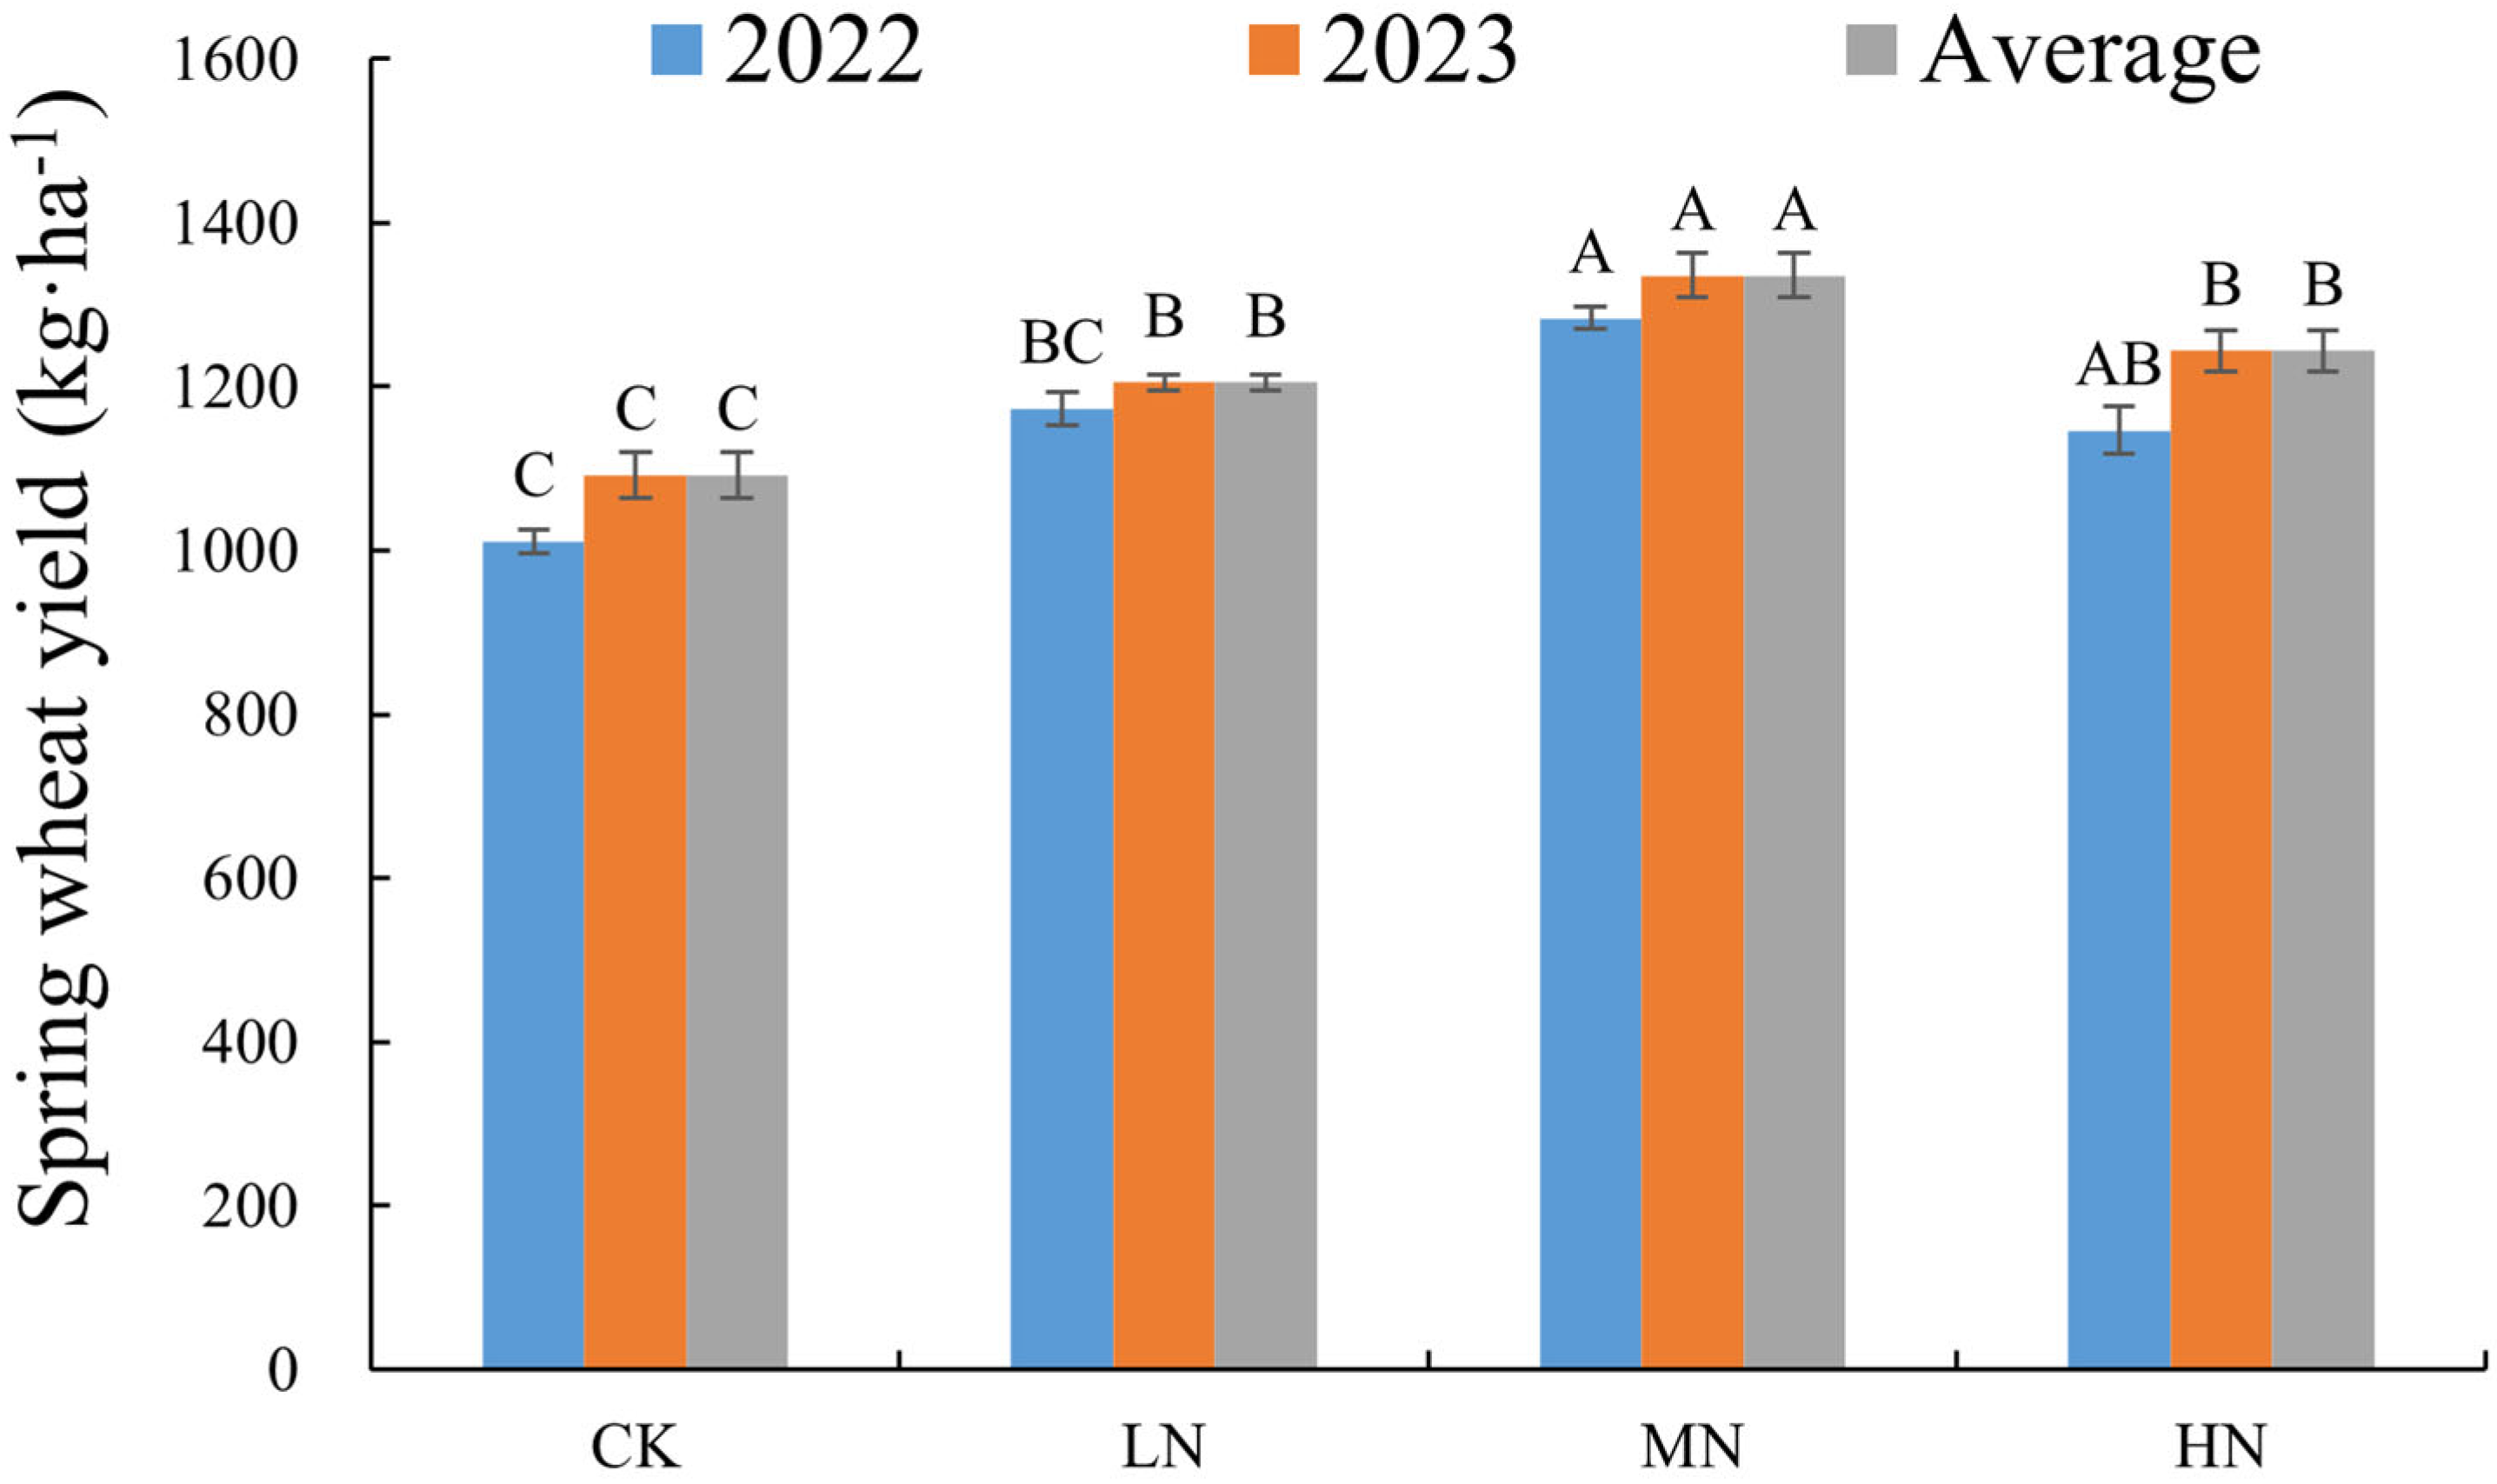
3.1. Changes in Soil Characteristics and Spring Wheat Yield Under Different N Addition Levels

Significant differences in average soil properties were observed across the four treatments over two years (Table 1). Compared to the CK treatment, nitrogen (N) addition significantly increased soil TN, NO3, NH4+, and pH levels (p < 0.05) while reducing soil water content (SWC). Soil enzyme activities, including urease, nitrate reductase, and nitrite reductase, also significantly increased with higher N addition levels (p < 0.05, Table 2). Urease and nitrate reductase activities initially increased and then decreased over the spring wheat growth period, while nitrite reductase activity showed a steady increase. Spring wheat yield exhibited an initial rise and subsequent decline as N addition increased over the two-year period (Figure 2). The average yield under the MN treatment was significantly higher than CK, LN, and HN treatments by 22.31%, 10.83%, and 7.38%, respectively (p < 0.01).

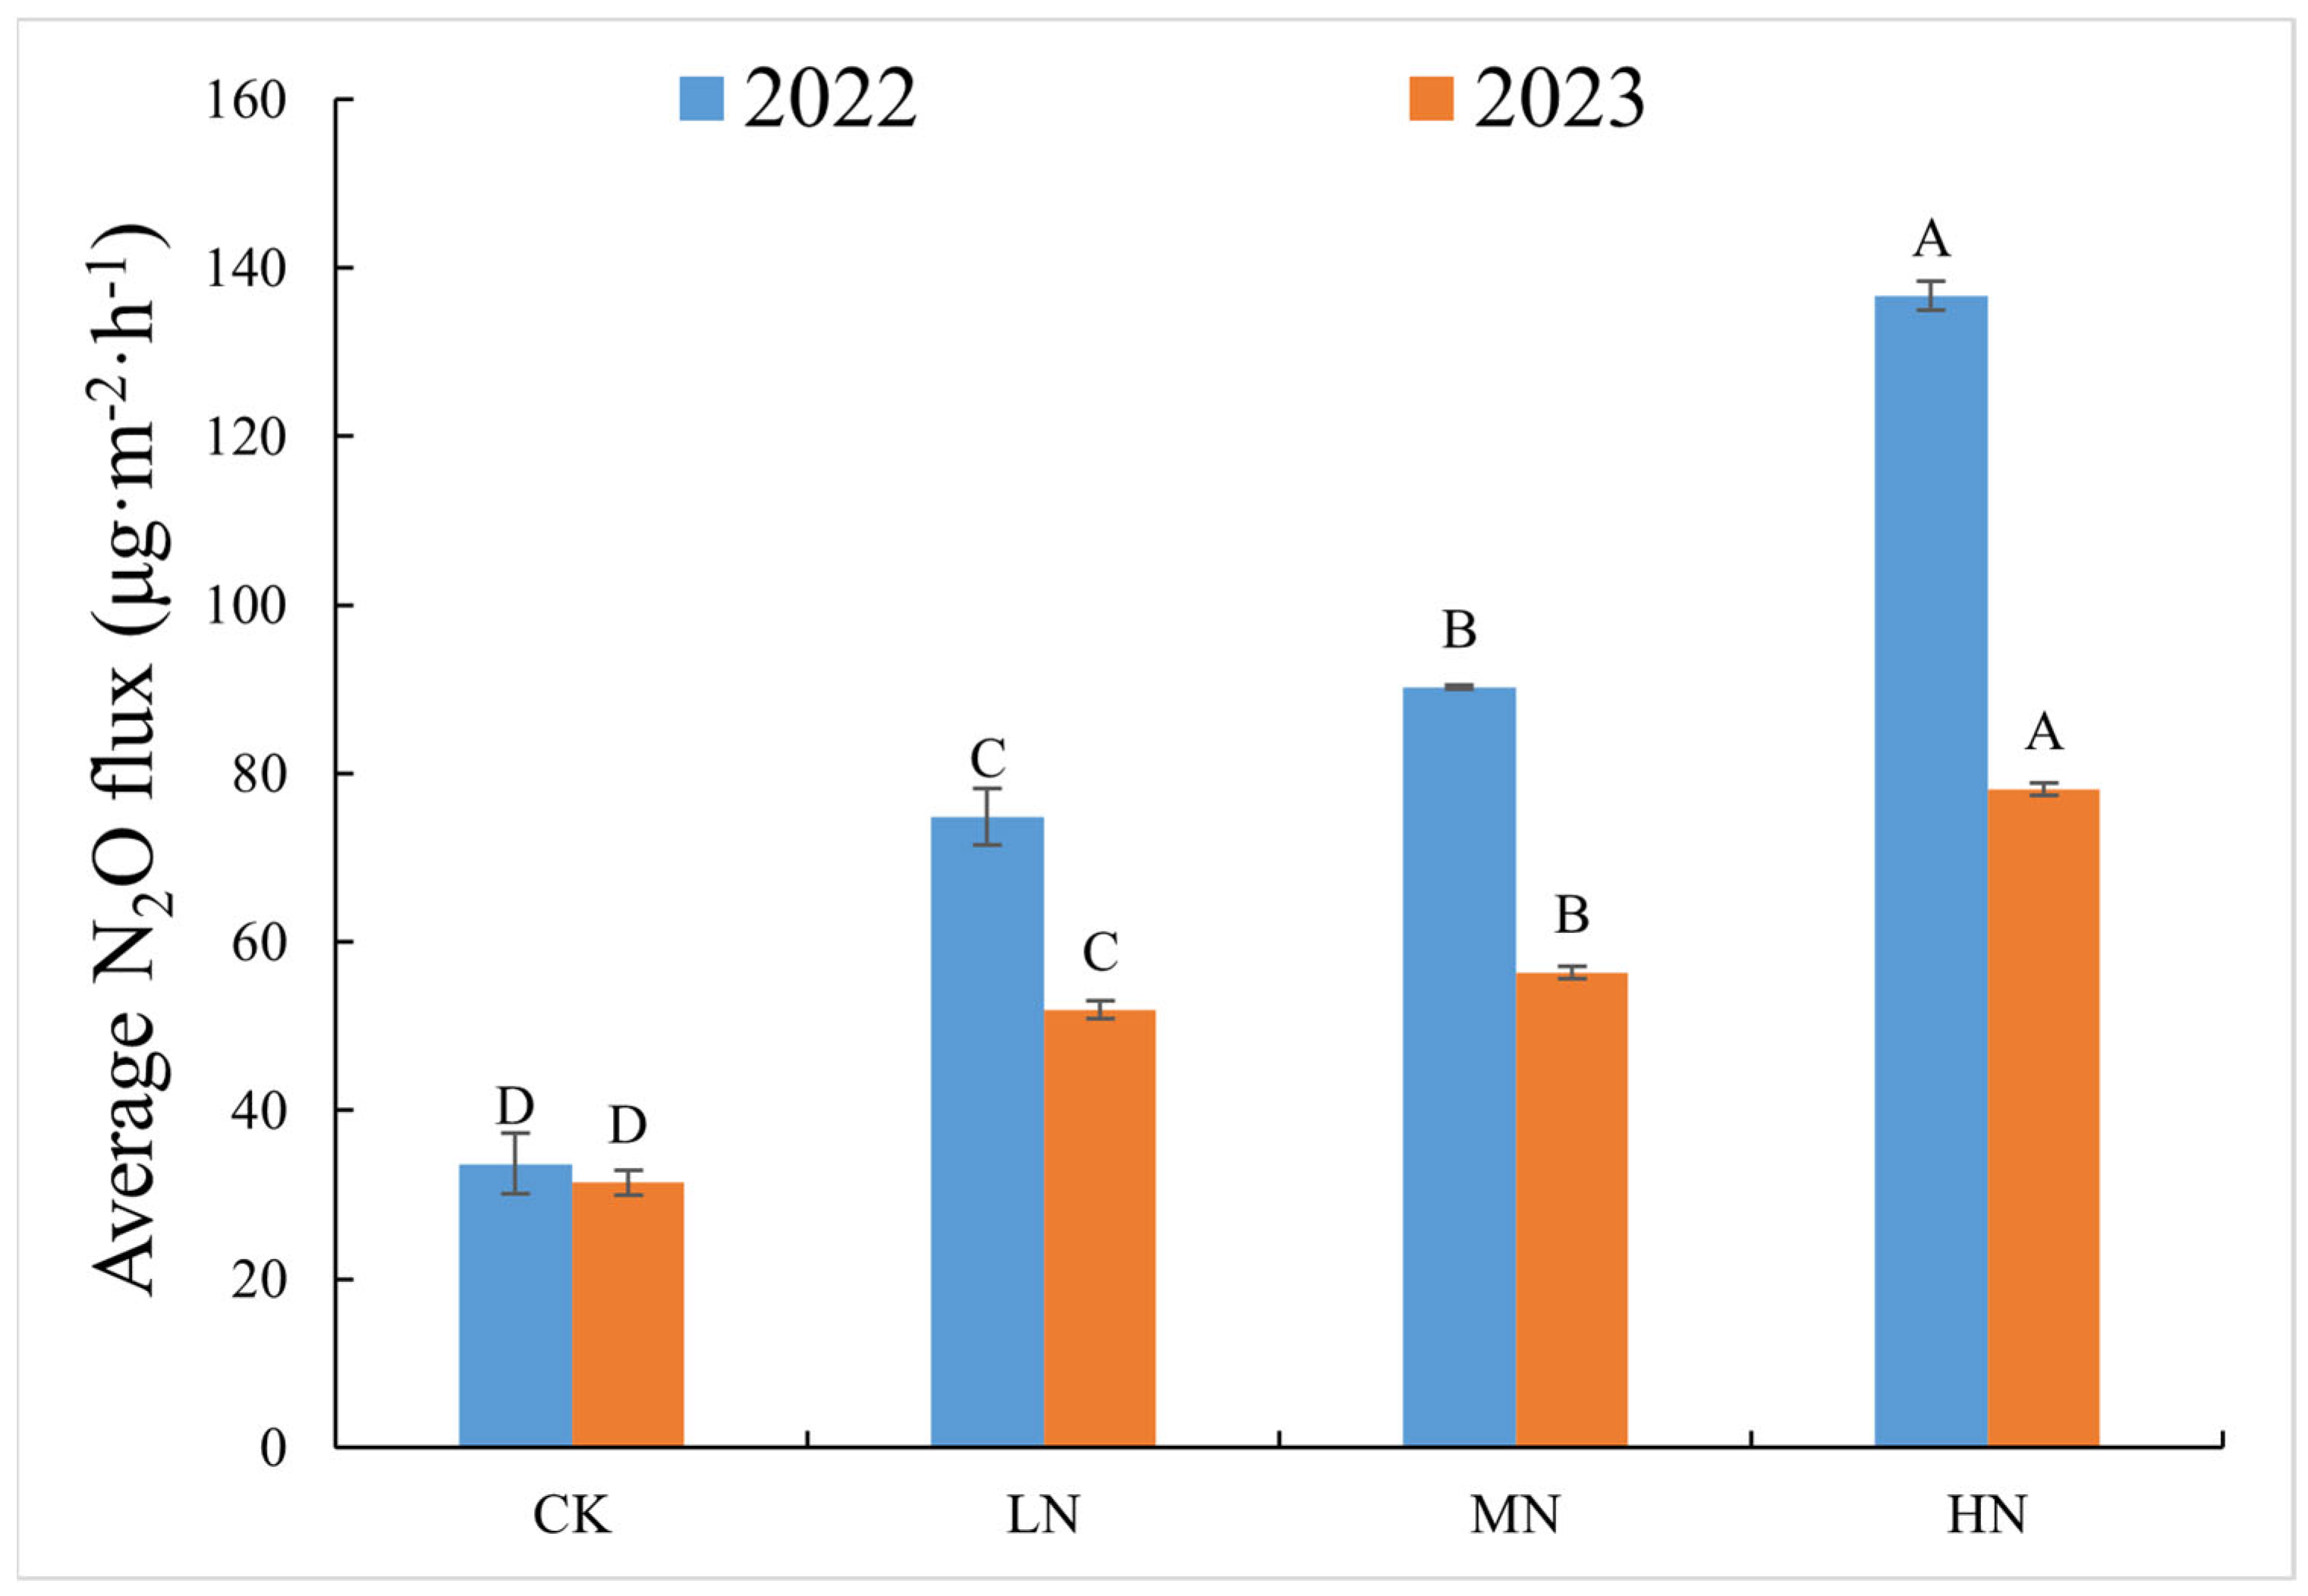
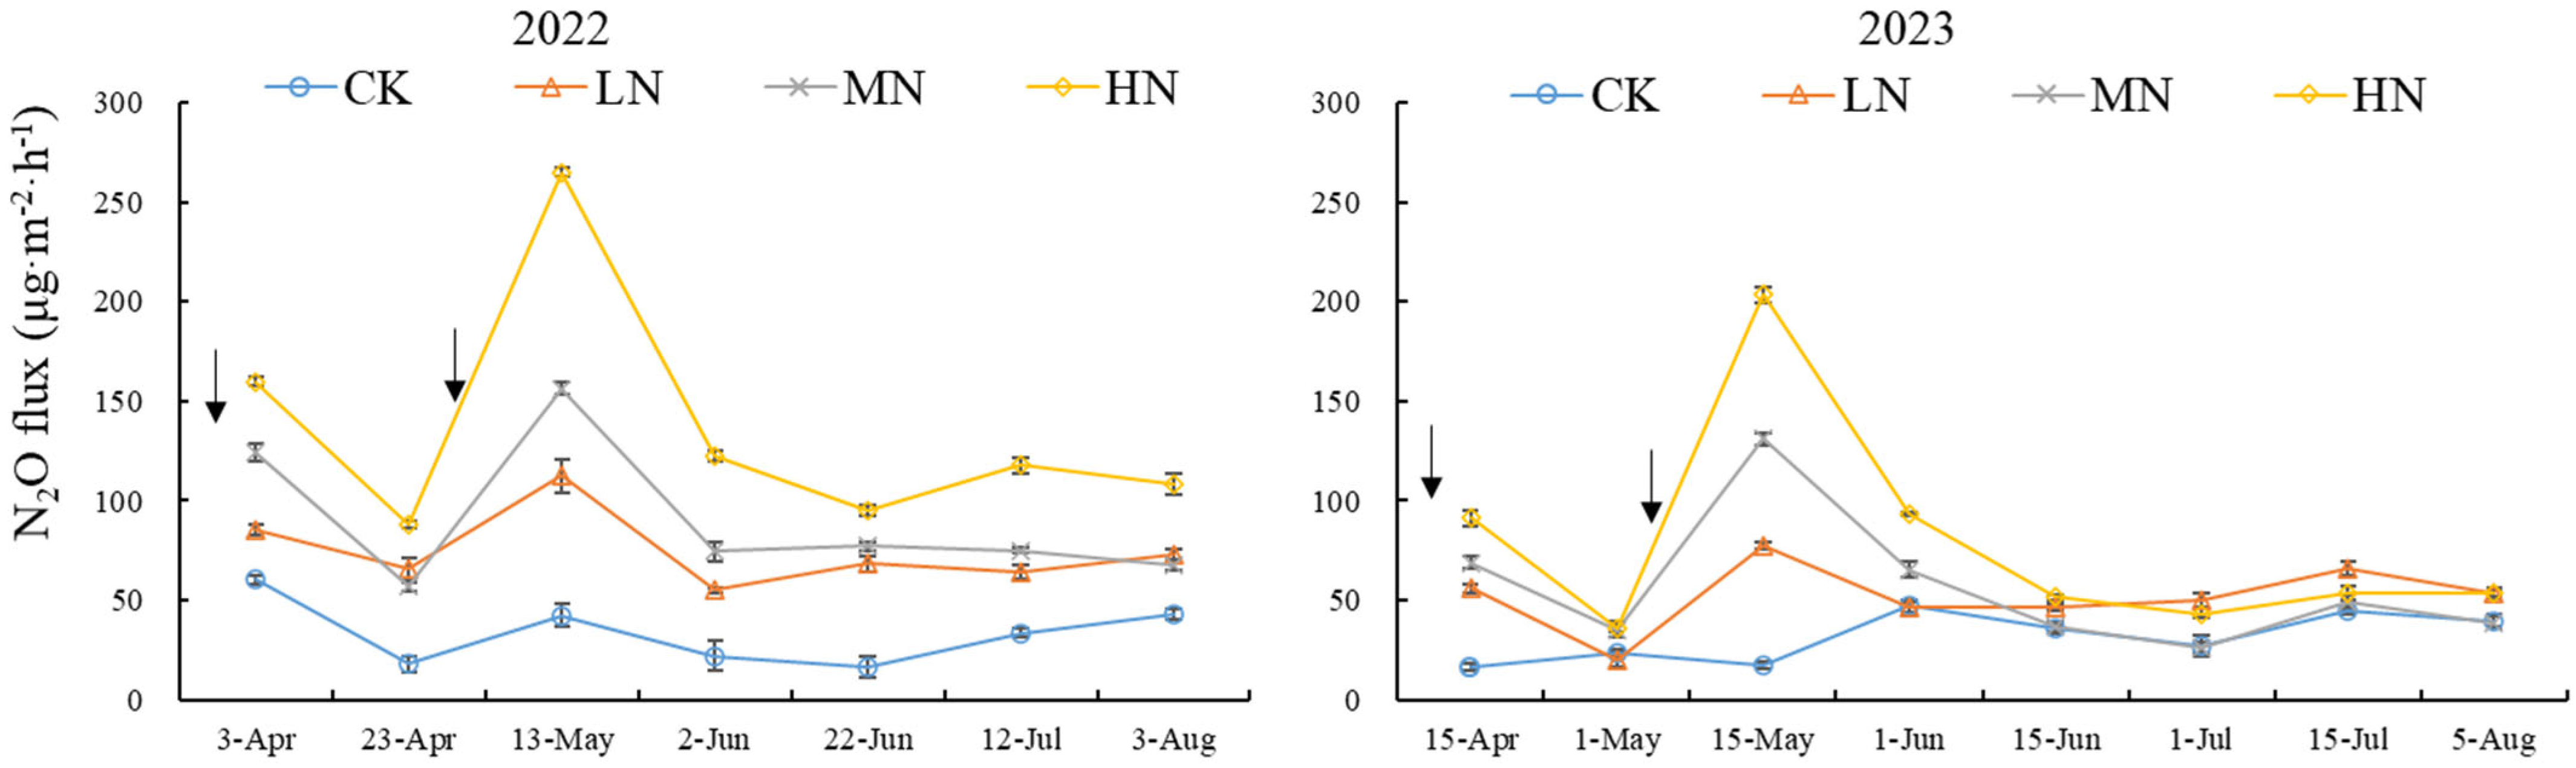
3.2. Variation in N2O Flux in Spring Wheat Soil Under Different N Addition Levels

Compared to CK, both years of nitrogen addition significantly increased N2O emissions from spring wheat soil, and N2O emissions in 2022 were higher than those in 2023, with the most significant increase observed under the HN treatment (p < 0.05, Figure 3 and Table 3). Over the spring wheat growth period, N2O fluxes under the N addition treatments followed a “down-up-down” pattern (Figure 4), with the maximum values occurring during the tillering stage of spring wheat (mid May), and there was a significant difference in the average N2O fluxes of the two years (p = 0.025), whereas no significant seasonal variation was observed under CK treatment. A repeated analysis of variance indicated a significant interaction between N addition levels and seasons on N2O flux (p < 0.01, Table 3).

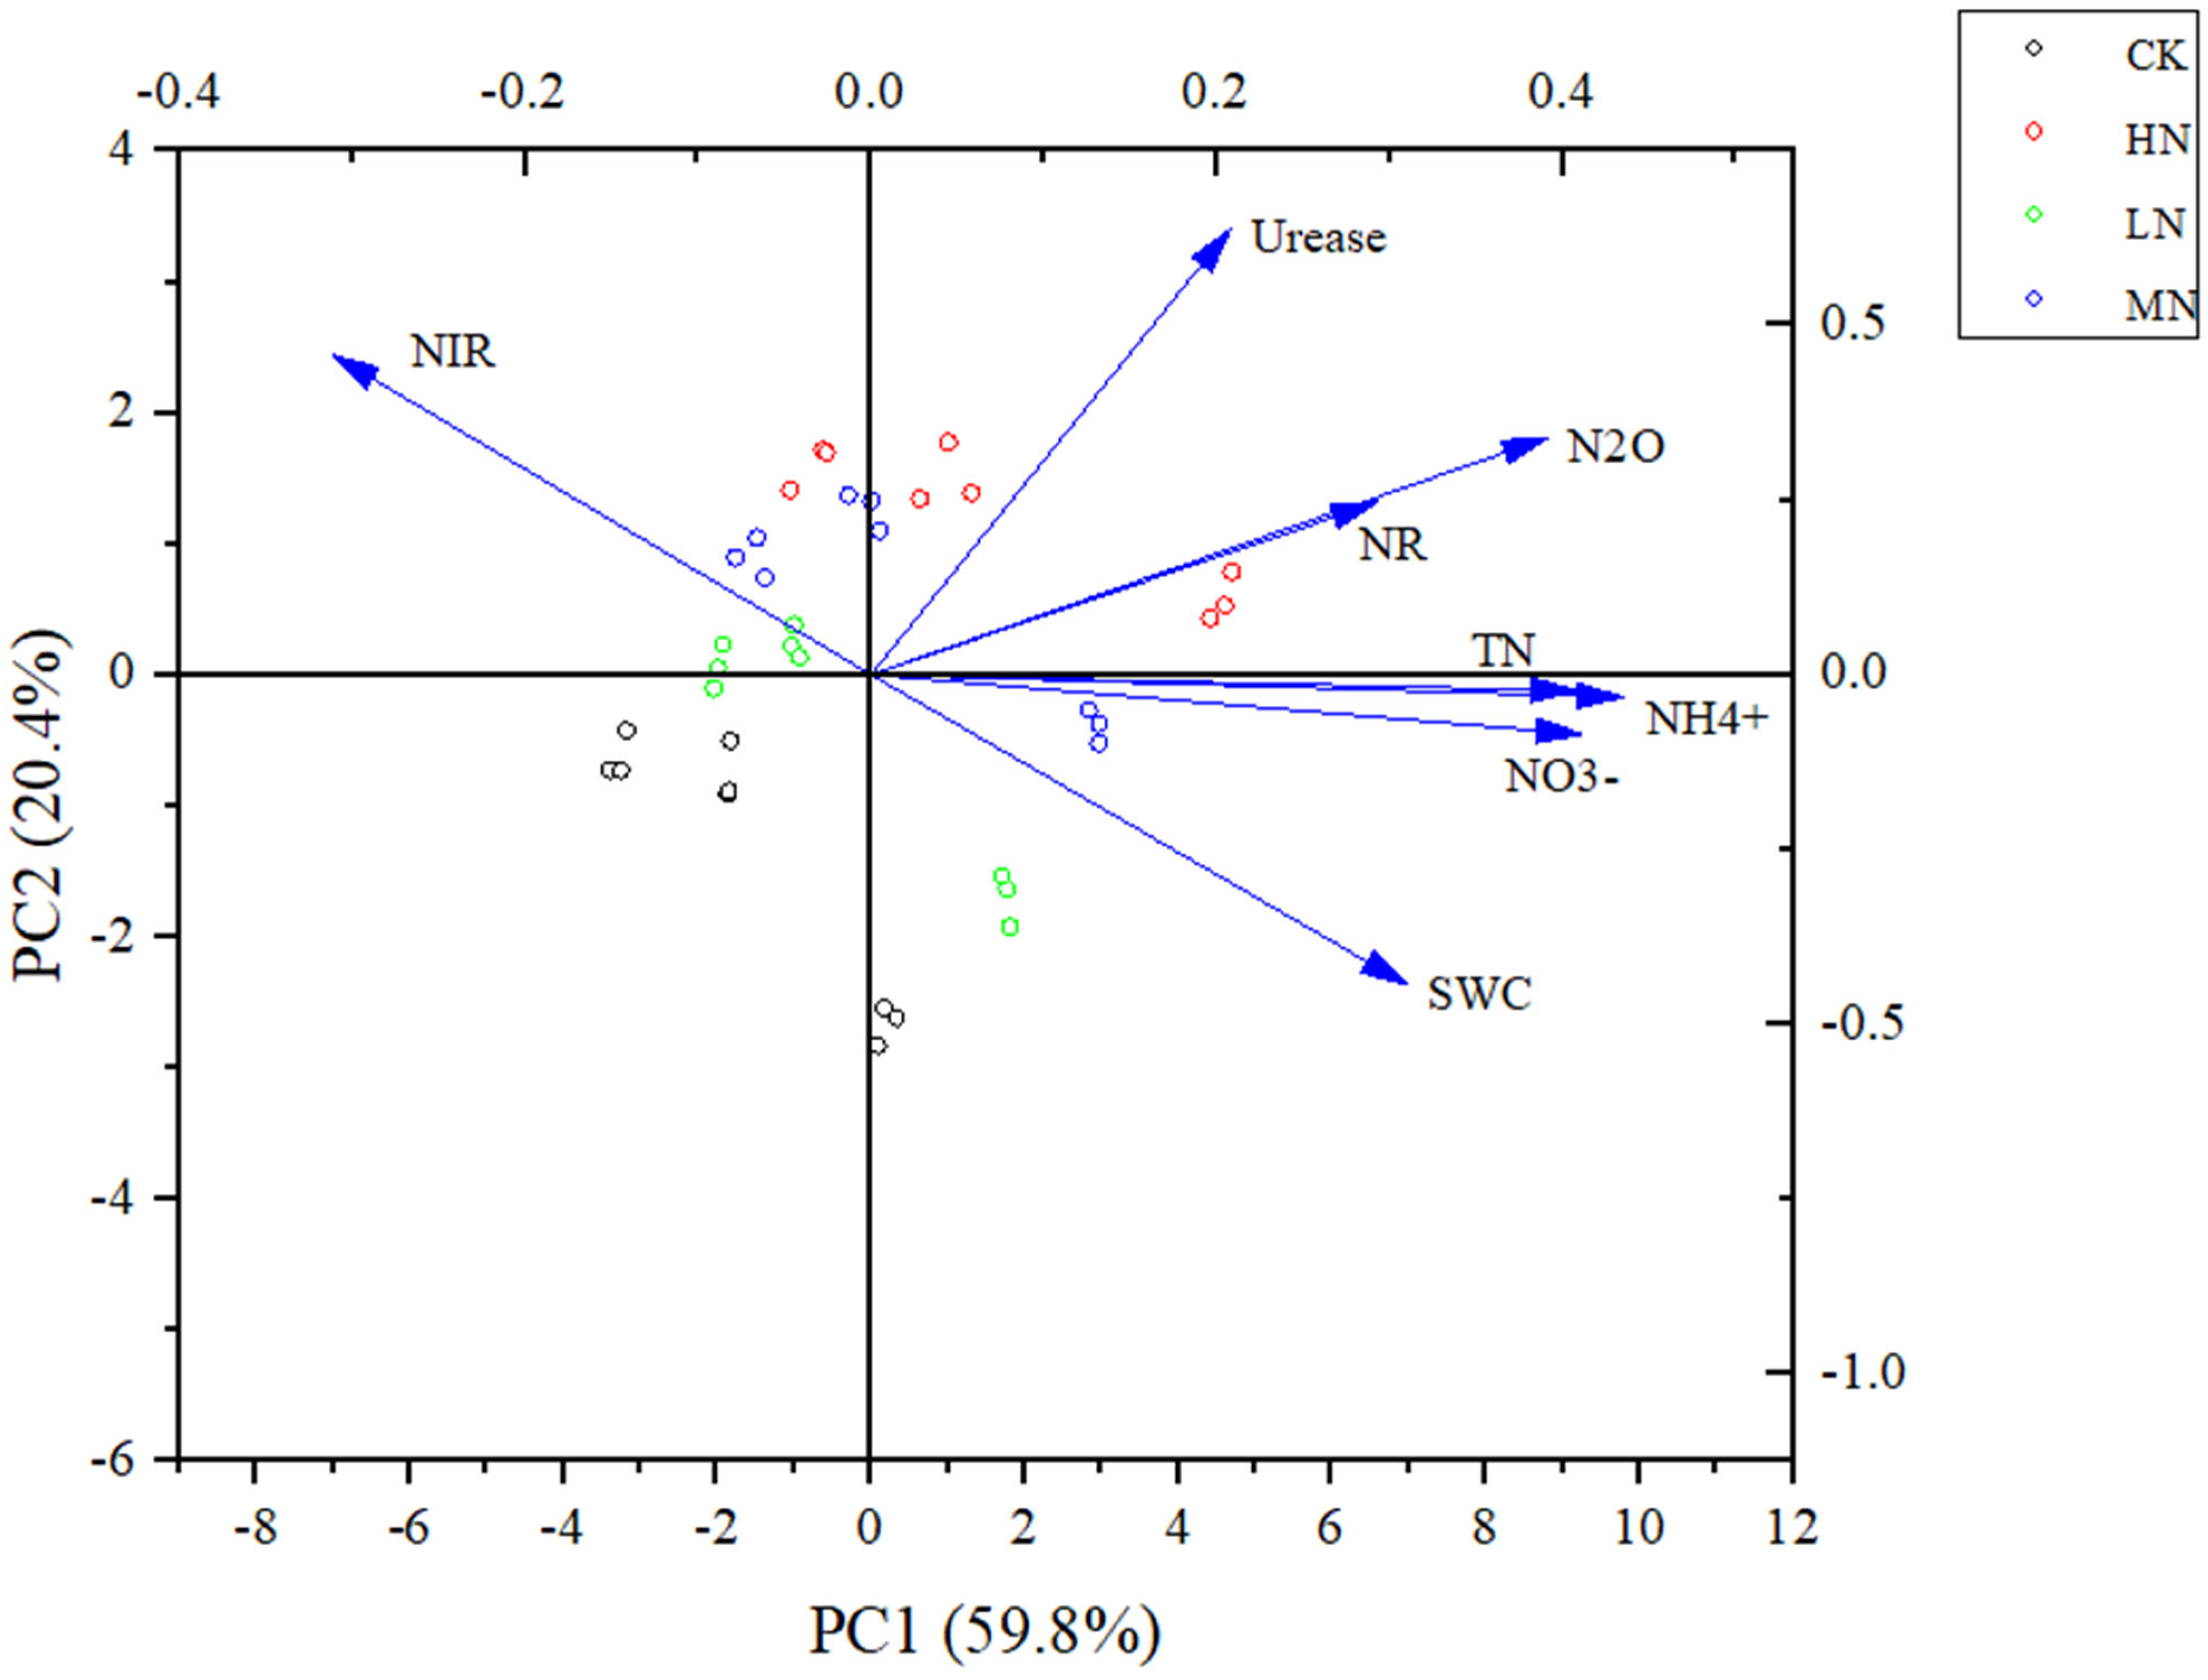
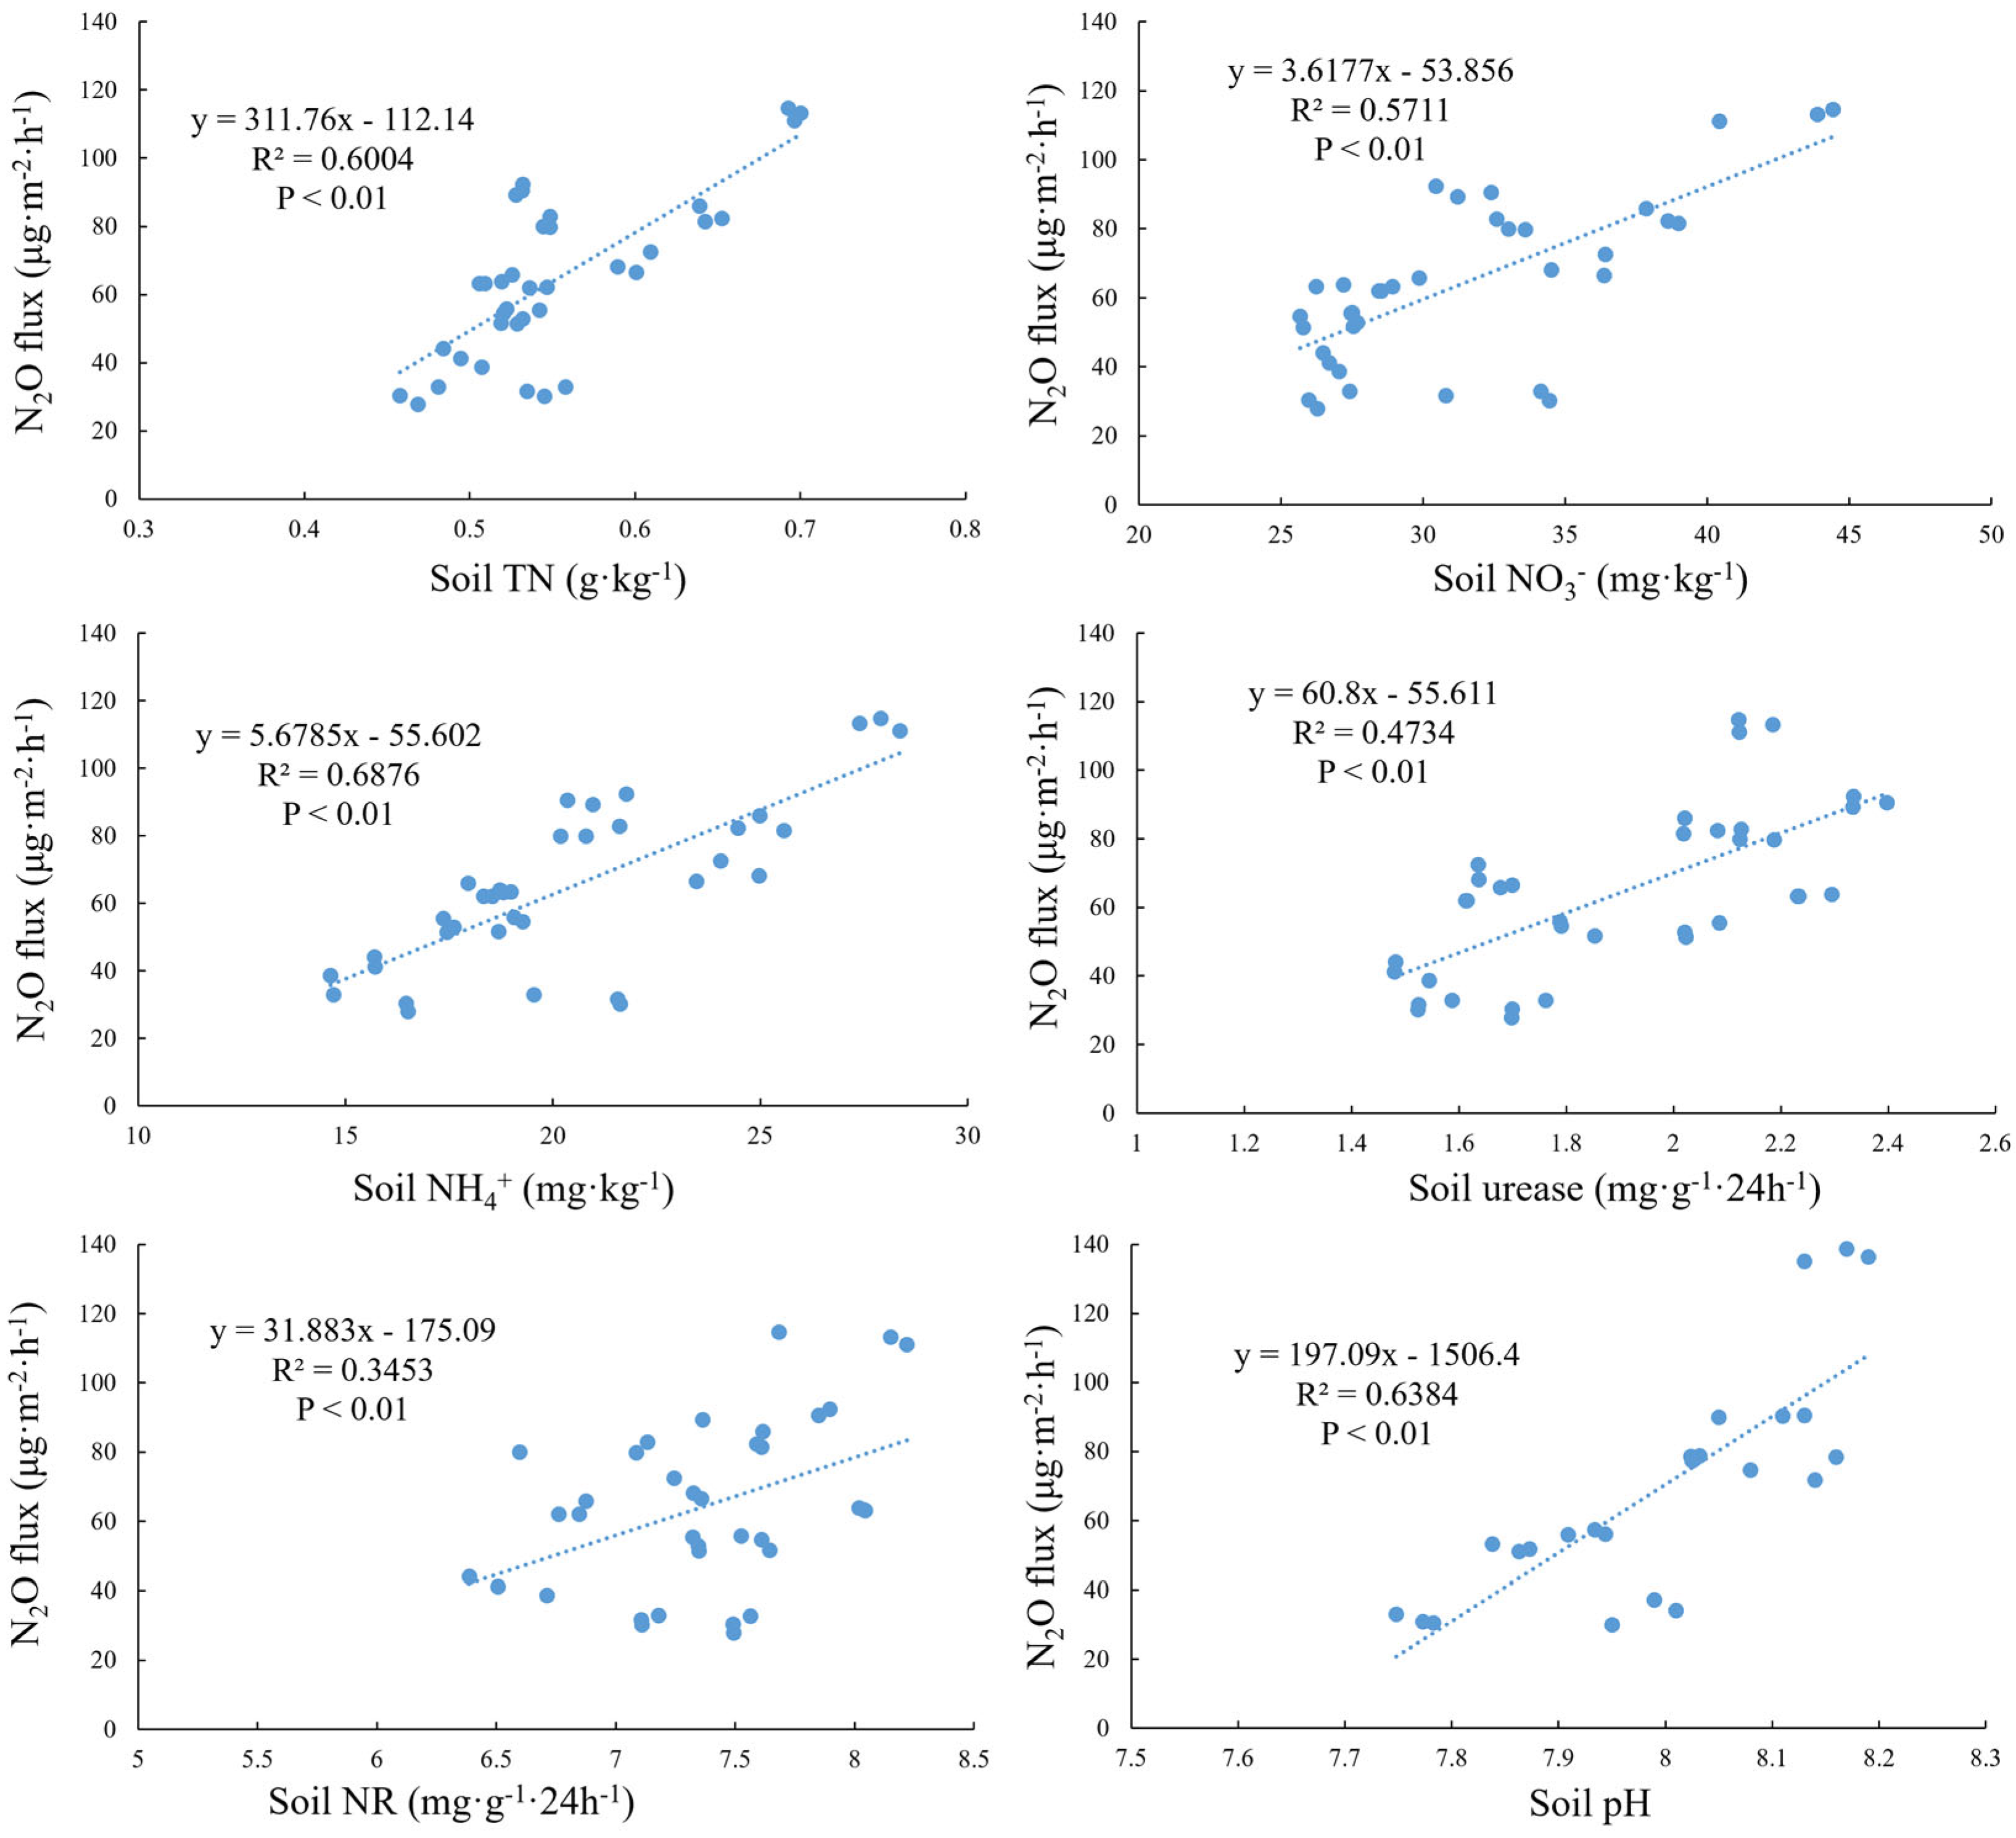
3.3. Correlation Analysis Between Soil Characteristics and N2O Flux

Principal component analysis (PCA) revealed a significant positive correlation between soil urease, nitrate reductase, TN, NH4+, NO3, and N2O flux (p < 0.05), while SWC and nitrite reductase showed weaker correlations (p = 0.097, 0.079) (Figure 5). Soil TN, NO3, NH4+, urease, nitrate reductase, and pH had a linear relationship with N2O flux, explaining 60.04%, 57.11%, 68.76%, 47.34%, 34.53%, and 63.84% of its variability, respectively (Figure 6).

4. Discussion

4.1. Effects of Different N Addition Levels on Soil Characteristics in Spring Wheat

Fertilization in agricultural production not only provides essential nutrients but also affects various soil indicators. This study demonstrated that soil TN, NO3, and NH4+ levels in N addition treatments were significantly higher than in CK (Table 1), which can be attributed to the urea-based N fertilizer. Urea hydrolysis by urease increases TN, NO3, and NH4+ content in the shallow soil layers. N addition also reduced soil water content, likely due to increased wheat biomass, elevated photosynthetic rates, and higher water use by roots [54].
Soil pH, an important indicator of soil properties, was found to increase under N addition, contrasting with previous studies that reported pH reductions following N application [55]. The alkaline nature of the Loess Plateau soil, combined with high salt content [56], reduced root respiration and CO2 partial pressure, contributing to increased soil pH [57,58]. Additionally, higher NO3 levels in the soil may have caused excessive anion uptake by wheat plants, leading to rhizosphere alkalization [59,60]. The region’s lower rainfall compared to evapotranspiration [61] rates may also have limited acidification, further promoting pH increase.
N addition promoted soil enzyme activities, including urease, nitrate reductase, and nitrite reductase (Table 2), although this contrasts with the results of a meta-analysis by Chen [62]. The increased substrate availability (NO3, NH4+) and continuous urea application likely enhanced these enzyme activities [63]. Furthermore, N fertilizers likely stimulated wheat root metabolism and increased root exudates, enhancing microbial activity and forming a nutrient pool in the rhizosphere, which boosted soil enzyme activity [64]. Urease and nitrate reductase activities increased during the middle growth stage (June) due to favorable temperature and moisture conditions, accelerated wheat metabolism, and higher root exudate content. However, during the ripening period (August), nutrient competition between wheat and soil microorganisms, along with elevated temperatures, likely suppressed microbial activity, leading to reduced enzyme activity. In contrast, nitrite reductase activity continued to increase throughout the growth period.

4.2. Effects of Different N Addition Levels on N2O Flux in Spring Wheat

Spring wheat soil in the Loess Plateau of northwest China is a significant source of atmospheric N2O, with an average emission rate of 32.55 ± 2.24 μg·m−2·h−1 under traditional tillage (CK). This emission rate is markedly higher than that of winter wheat in the North China Plain (2.50 μg·m−2·h−1) [65], yet lower than that in the Yangtze River Basin (54.17 μg·m−2·h−1) [66]. These differences can largely be attributed to variations in soil water content and pre-planting soil nutrient levels. Our study found that N addition significantly enhanced N2O emissions from spring wheat, with N2O fluxes rising in line with increasing N addition levels, supporting findings by Liu et al. [67]. The long-term N limitation in the Loess Plateau means that N fertilizers can effectively elevate the substrate content (NH4+ and NO3) necessary for nitrification and denitrification processes in the soil [68,69]. Consequently, this enhances N2O production and emissions due to the availability of nitrogen sources [25]. Our results indicate a significant linear relationship between N2O flux and NH4+ and NO3 content, further elucidating this effect.
Previous research has shown that soil pH values between 6 and 8 significantly influence the nitrification rate of fertilizer N, with higher pH promoting increased nitrification rates [70,71]. This, in turn, enhances nitrogen absorption and utilization by wheat, leading to increased yields and higher N2O emissions as an intermediate product of nitrification [31,44], our findings align with these studies, demonstrating a significant positive linear correlation between soil pH and N2O flux. Additionally, N addition raised the available nitrogen content in the soil, boosted soil urease and nitrate reductase activities, and accelerated nitrogen mineralization rates [72,73], all contributing to increased N2O flux.
Throughout the growth period of spring wheat, N2O emissions from the four treatments exhibited notable seasonal variability (Figure 3), driven primarily by soil temperature, enzyme activity, and nutrient content [74,75,76]. In the early growth stage, N2O emissions under N addition treatments were higher than those under CK due to the immediate effects of basal fertilizer application. However, lower soil temperatures and moisture levels limited microbial activity, resulting in reduced nitrogen cycling processes and lower N2O emissions [77]. Spring wheat soil N2O emissions peaked in mid-May, because May is the tillering period of spring wheat, and the addition of the second nitrogen fertilizer increased the effective nutrient content in the soil, and the higher amount of nutrients provided favorable conditions for soil microbial proliferation, which increased soil enzyme activities and led to an increase in spring wheat soil N2O emissions [18]. In contrast, N2O emissions declined in the late growth stage, likely due to increased competition for nutrients between wheat roots and soil microorganisms as wheat absorbed large amounts of nutrients to support grain development [78,79,80]. This study showed that the spring wheat soil N2O emission flux was higher in 2022 than in 2023 because the Loess Plateau region is mainly limited by nitrogen [81], and the first nitrogen addition has a greater stimulating effect on soil microorganisms and enzyme activity than the second, and gradually stabilizes with the extension of nitrogen addition years [82]. In addition, the rainfall in 2022 was higher than that in 2023 (Figure 1), and the higher rainfall during the spring wheat reproductive period promoted microbial activity and increased N2O gas production [83], resulting in higher soil N2O emission fluxes in 2022 than in 2023.

4.3. Effects of Different N Addition Levels on Spring Wheat Yield and the Environment

Spring wheat is a key crop in the Loess Plateau region, and an adequate supply of nitrogen fertilizer in the soil is essential to maximize grain yield. A recent study has revealed that the average N fertilizer application in the Loess Plateau region has reached 220 kg·ha−1·y−1, and N fertilizer application in excess of N uptake by wheat will reduce grain yield [84], which is consistent with our research results, that is, the recommended nitrogen fertilizer application rate for the highest spring wheat yield in this region is 110 kg·ha⁻1 (MN) [9]. In addition, we found a non-linear relationship between spring wheat yield and N application, which is consistent with the findings of Zhang et al. [85], who identified a quadratic relationship between nitrogen application rates and wheat yields. Specifically, yield increases with nitrogen application rates up to a critical point, beyond which the input-output ratio of nitrogen fertilizer declines sharply. Excessive nitrogen levels can lead to increased nitrogen storage in wheat while reducing transport to grains, ultimately decreasing yields [11,86].
Moreover, we found that average N2O fluxes over two years under HN and MN treatments were 69.38% and 15.60% higher than under LN treatment, respectively, indicating that fertilization practices in the Loess Plateau can escalate the global warming potential and ozone depletion potential of spring wheat N2O emissions. Although this study did not cover all greenhouse gases, the substantial N2O emissions in this region are significant contributors to global warming and ozone depletion [87]. Therefore, maintaining an appropriate nitrogen application rate (110 kg·ha−1) is vital for boosting crop yields, enhancing soil conditions, and mitigating greenhouse gas emissions. Conversely, excessive nitrogen applications can lead to reduced nitrogen use efficiency, accumulation of nitrate nitrogen, and exacerbated greenhouse effects, resulting in diminished crop yields and economic losses.

5. Conclusions

This study investigated the effects of different nitrogen fertilizer levels on spring wheat yield and N2O flux in the Loess Plateau. We observed that nitrogen application levels increased soil TN, NO3, NH4+, and enzyme activities, and promoted spring wheat soil N2O emissions. In addition, nitrogen fertilizer significantly increased spring wheat yield, whereas a non-linear relationship was observed between spring wheat yield and N application level, and excessive nitrogen application (HN) decreased spring wheat yield. Therefore, we recommend applying moderate nitrogen levels (110 kg·ha−1) to optimize spring wheat yields while mitigating N2O emissions in the semi-arid regions of the Loess Plateau. However, this article currently studies three levels of nitrogen application, and in the future, a more detailed division of nitrogen fertilizer levels will be carried out based on the moderate nitrogen levels (110 kg·ha−1) to determine the optimal nitrogen application level and promote its application.

Author Contributions

H.W.: methodology, writing—original draft preparation, funding acquisition. J.W.: investigation, writing—reviewing and editing. G.L.: methodology, supervision, funding acquisition. J.Y.: methodology, data collection. All authors have read and agreed to the published version of the manuscript.

Funding

This research was funded by [the Doctoral Research Fund of Lanzhou City University] grant number [LZCU-BS2024-04], [the National Natural Science Foundation of China] grant number [32360438], [the Longyuan Young Talents Special Program in Gansu Province] grant number [LYYC-2025-02], [the Top-notch Leading Talent Project in Gansu Province] grant number [GSBJLJ-2023-09]. And The APC was funded by [the Doctoral Research Fund of Lanzhou City University].

Data Availability Statement

The original contributions presented in this study are included in the article. Further inquiries can be directed to the corresponding author.

Acknowledgments

We appreciate and thank the anonymous reviewers for helpful comments that led to an overall improvement of the manuscript.

Conflicts of Interest

The authors declare no conflicts of interest.

References

  1. Voigt, C.; Lamprecht, R.E.; Marushchak, M.E.; Lind, S.E.; Novakovskiy, A.; Aurela, M.; Biasi, C. Warming of subarctic tundra increases emissions of all three important greenhouse gases–carbon dioxide, methane, and nitrous oxide. Glob. Change Biol. 2017, 23, 3121–3138. [Google Scholar] [CrossRef]
  2. Tian, H.; Xu, R.; Canadell, J.G.; Thompson, R.L.; Winiwarter, W.; Suntharalingam, P.; Yao, Y. A comprehensive quantification of global nitrous oxide sources and sinks. Nature 2020, 586, 248–256. [Google Scholar] [CrossRef] [PubMed]
  3. Lu, C.; Yu, Z.; Zhang, J.; Cao, P.; Tian, H.; Nevison, C. Century-long changes and drivers of soil nitrous oxide (N2O) emissions across the contiguous United States. Glob. Change Biol. 2022, 28, 2505–2524. [Google Scholar] [CrossRef]
  4. Cui, X.; Zhou, F.; Ciais, P.; Davidson, E.A.; Tubiello, F.N.; Niu, X.; Zhu, D. Global mapping of crop-specific emission factors highlights hotspots of nitrous oxide mitigation. Nat. Food 2021, 2, 886–893. [Google Scholar] [CrossRef] [PubMed]
  5. Lyu, X.; Wang, T.; Song, X.; Zhao, C.; Rees, R.M.; Liu, Z.; Siddique, K.H. Reducing N2O emissions with enhanced efficiency nitrogen fertilizers (EENFs) in a high-yielding spring maize system. Environ. Pollut. 2021, 273, 116422. [Google Scholar] [CrossRef]
  6. Ma, L.; Shan, J.; Yan, X. Nitrite behavior accounts for the nitrous oxide peaks following fertilization in a fluvo-aquic soil. Biol. Fertil. Soils 2015, 51, 563–572. [Google Scholar] [CrossRef]
  7. Zhu, Q.; Liu, X.; Hao, T.; Zeng, M.; Shen, J.; Zhang, F.; de Vries, W. Cropland acidification increases risk of yield losses and food insecurity in China. Environ. Pollut. 2020, 256, 113145. [Google Scholar] [CrossRef]
  8. Raza, S.; Miao, N.; Wang, P.; Ju, X.; Chen, Z.; Zhou, J.; Kuzyakov, Y. Dramatic loss of inorganic carbon by nitrogen-induced soil acidification in Chinese croplands. Glob. Change Biol. 2020, 26, 3738–3751. [Google Scholar] [CrossRef] [PubMed]
  9. Xu, A.; Li, L.; Coulter, J.A.; Xie, J.; Gopalakrishnan, S.; Zhang, R.; Khan, S. Long-term nitrogen fertilization impacts on soil bacteria, grain yield and nitrogen use efficiency of wheat in semiarid loess plateau, China. Agronomy 2020, 10, 1175. [Google Scholar] [CrossRef]
  10. Xu, C.; Han, X.; Ru, S.; Cardenas, L.; Rees, R.M.; Wu, D.; Meng, F. Crop straw incorporation interacts with N fertilizer on N2O emissions in an intensively cropped farmland. Geoderma 2019, 341, 129–137. [Google Scholar] [CrossRef]
  11. Liu, J.; Jiang, B.; Shen, J.; Zhu, X.; Yi, W.; Li, Y.; Wu, J. Contrasting effects of straw and straw-derived biochar applications on soil carbon accumulation and nitrogen use efficiency in double-rice cropping systems. Agric. Ecosyst. Environ. 2021, 311, 107286. [Google Scholar] [CrossRef]
  12. Huang, R.; Wang, Y.; Gao, X.; Liu, J.; Wang, Z.; Gao, M. Nitrous oxide emission and the related denitrifier community: A short-term response to organic manure substituting chemical fertilizer. Ecotoxicol. Environ. Saf. 2020, 192, 110291. [Google Scholar] [CrossRef]
  13. Heil, J.; Liu, S.; Vereecken, H.; Brueggemann, N. Abiotic nitrous oxide production from hydroxylamine in soils and their dependence on soil properties. Soil Biol. Biochem. 2015, 84, 107–115. [Google Scholar] [CrossRef]
  14. Rue, K.; Rusevova, K.; Biles, C.L.; Huling, S.G. Abiotic hydroxylamine nitrification involving manganese-and iron-bearing minerals. Sci. Total Environ. 2018, 644, 567–575. [Google Scholar] [CrossRef]
  15. Duan, P.; Zhou, J.; Feng, L.; Jansen-Willems, A.B.; Xiong, Z. Pathways and controls of N2O production in greenhouse vegetable production soils. Biol. Fertil. Soils 2019, 55, 285–297. [Google Scholar] [CrossRef]
  16. Gan, X.; Hu, H.; Fu, Q.; Zhu, J. Nitrate reduction coupling with As (III) oxidation in neutral As-contaminated paddy soil preserves nitrogen, reduces N2O emissions and alleviates As toxicity. Sci. Total Environ. 2024, 912, 169360. [Google Scholar] [CrossRef]
  17. Pan, H.; Ying, S.; Liu, H.; Zeng, L.; Zhang, Q.; Liu, Y.; Di, H. Microbial pathways for nitrous oxide emissions from sheep urine and dung in a typical steppe grassland. Biol. Fertil. Soils 2018, 54, 717–730. [Google Scholar] [CrossRef]
  18. Wrage-Mönnig, N.; Horn, M.A.; Well, R.; Müller, C.; Velthof, G.; Oenema, O. The role of nitrifier denitrification in the production of nitrous oxide revisited. Soil Biol. Biochem. 2018, 123, A3–A16. [Google Scholar] [CrossRef]
  19. Maharjan, B.; Venterea, R.T. Nitrite intensity explains N management effects on N2O emissions in maize. Soil Biol. Biochem. 2013, 66, 229–238. [Google Scholar] [CrossRef]
  20. Zuccarini, P.; Sardans, J.; Asensio, L.; Peñuelas, J. Altered activities of extracellular soil enzymes by the interacting global environmental changes. Glob. Change Biol. 2023, 29, 2067–2091. [Google Scholar] [CrossRef]
  21. Han, P.; Tang, X.; Koch, H.; Dong, X.; Hou, L.; Wang, D.; Shi, G. Unveiling unique microbial nitrogen cycling and nitrification driver in coastal Antarctica. Nat. Commun. 2024, 15, 3143. [Google Scholar] [CrossRef] [PubMed]
  22. Swify, S.; Mažeika, R.; Baltrusaitis, J.; Drapanauskaitė, D.; Barčauskaitė, K. Modified urea fertilizers and their effects on improving nitrogen use efficiency (NUE). Sustainability 2023, 16, 188. [Google Scholar] [CrossRef]
  23. Hoang, H.G.; Thuy, B.T.P.; Lin, C.; Vo, D.V.N.; Tran, H.T.; Bahari, M.B.; Vu, C.T. The nitrogen cycle and mitigation strategies for nitrogen loss during organic waste composting: A review. Chemosphere 2022, 300, 134514. [Google Scholar] [CrossRef]
  24. Hou, S.; Dang, H.; Huang, T.; Huang, Q.; Li, C.; Li, X.; Wang, Z. Targeting high nutrient efficiency to reduce fertilizer input in wheat production of China. Field Crops Res. 2023, 292, 108809. [Google Scholar] [CrossRef]
  25. Li, S.; Li, Z.; Bi, X.; Feng, B.; Wang, Z.; Wang, F.; Liu, K. Nitrogen fertilizer management on wheat yield and nitrogen utilization. J. Plant Nutr. 2022, 45, 1953–1960. [Google Scholar] [CrossRef]
  26. Liu, X.; Zhang, Y.; Wang, F. Effect of reduced subsequent N supply and organic amendment on soil bacterial community in a wheat-maize rotation system with over-fertilization. Appl. Soil Ecol. 2023, 181, 104659. [Google Scholar] [CrossRef]
  27. Chen, A.; Zhang, D.; Wang, H.; Cui, R.; Khoshnevisan, B.; Guo, S.; Liu, H. Shallow groundwater fluctuation: An ignored soil N loss pathway from cropland. Sci. Total Environ. 2022, 828, 154554. [Google Scholar] [CrossRef] [PubMed]
  28. Jiang, Z.; Liu, Y.; Yang, J.; Zhou, Z.; Gunina, A. Effects of nitrogen fertilization on the rhizosphere priming. Plant Soil 2021, 462, 489–503. [Google Scholar] [CrossRef]
  29. Aryal, B.; Gurung, R.; Camargo, A.F.; Fongaro, G.; Treichel, H.; Mainali, B.; Puadel, S.R. Nitrous oxide emission in altered nitrogen cycle and implications for climate change. Environ. Pollut. 2022, 314, 120272. [Google Scholar] [CrossRef]
  30. Linton, N.F.; Machado, P.V.F.; Deen, B.; Wagner-Riddle, C.; Dunfield, K.E. Long-term diverse rotation alters nitrogen cycling bacterial groups and nitrous oxide emissions after nitrogen fertilization. Soil Biol. Biochem. 2020, 149, 107917. [Google Scholar] [CrossRef]
  31. Zhang, Y.; Zhang, F.; Abalos, D.; Luo, Y.; Hui, D.; Hungate, B.A.; Chen, J. Stimulation of ammonia oxidizer and denitrifier abundances by nitrogen loading: Poor predictability for increased soil N2O emission. Glob. Change Biol. 2022, 28, 2158–2168. [Google Scholar] [CrossRef] [PubMed]
  32. An, H.; Owens, J.; Beres, B.; Li, Y.; Hao, X. Nitrous oxide emissions with enhanced efficiency and conventional urea fertilizers in winter wheat. Nutr. Cycl. Agroecosystems 2021, 119, 307–322. [Google Scholar] [CrossRef]
  33. Kim, G.W.; Kim, P.J.; Khan, M.I.; Lee, S.J. Effect of rice planting on nitrous oxide (N2O) emission under different levels of nitrogen fertilization. Agronomy 2021, 11, 217. [Google Scholar] [CrossRef]
  34. Lan, T.; Li, M.; Han, Y.; Deng, O.; Tang, X.; Luo, L.; Gao, X. How are annual CH4, N2O, and NO emissions from rice–wheat system affected by nitrogen fertilizer rate and type? Appl. Soil Ecol. 2020, 150, 103469. [Google Scholar] [CrossRef]
  35. Zhou, M.; Zhu, B.; Wang, S.; Zhu, X.; Vereecken, H.; Brüggemann, N. Stimulation of N2O emission by manure application to agricultural soils may largely offset carbon benefits: A global meta-analysis. Glob. Change Biol. 2017, 23, 4068–4083. [Google Scholar] [CrossRef]
  36. Liu, J.; Zhu, L.; Luo, S.; Bu, L.; Chen, X.; Yue, S.; Li, S. Response of nitrous oxide emission to soil mulching and nitrogen fertilization in semi-arid farmland. Agric. Ecosyst. Environ. 2014, 188, 20–28. [Google Scholar] [CrossRef]
  37. Ma, B.L.; Wu, T.Y.; Tremblay, N.; Deen, W.; Morrison, M.J.; McLaughlin, N.B.; Stewart, G. Nitrous oxide fluxes from corn fields: On-farm assessment of the amount and timing of nitrogen fertilizer. Glob. Change Biol. 2010, 16, 156–170. [Google Scholar] [CrossRef]
  38. Yuan, J.; Sadiq, M.; Rahim, N.; Li, G.; Yan, L.; Wu, J.; Xu, G. Tillage strategy and nitrogen fertilization methods influences on selected soil quality indicators and spring wheat yield under semi-arid environmental conditions of the loess plateau, China. Appl. Sci. 2022, 12, 1101. [Google Scholar] [CrossRef]
  39. Shi, Z.; Liu, D.; Liu, M.; Hafeez, M.B.; Wen, P.; Wang, X.; Li, J. Optimized fertilizer recommendation method for nitrate residue control in a wheat–maize double cropping system in dryland farming. Field Crops Res. 2021, 271, 108258. [Google Scholar] [CrossRef]
  40. Chen, L.; Xie, H.; Wang, G.; Qian, X.; Wang, W.; Xu, Y.; Yang, J. Reducing environmental risk by improving crop management practices at high crop yield levels. Field Crops Res. 2021, 265, 108123. [Google Scholar] [CrossRef]
  41. Li, H.; Zhang, Y.; Sun, Y.; Liu, P.; Zhang, Q.; Wang, X.; Li, J. Long-term effects of optimized fertilization, tillage and crop rotation on soil fertility, crop yield and economic profit on the Loess Plateau. Eur. J. Agron. 2023, 143, 126731. [Google Scholar] [CrossRef]
  42. Zhang, S.; Gao, P.; Tong, Y.; Norse, D.; Lu, Y.; Powlson, D. Overcoming nitrogen fertilizer over-use through technical and advisory approaches: A case study from Shaanxi Province, northwest China. Agric. Ecosyst. Environ. 2015, 209, 89–99. [Google Scholar] [CrossRef]
  43. Wang, C.; Qi, Z.; Zhao, J.; Gao, Z.; Zhao, J.; Chen, F.; Chu, Q. Sustainable water and nitrogen optimization to adapt to different temperature variations and rainfall patterns for a trade-off between winter wheat yield and N2O emissions. Sci. Total Environ. 2023, 854, 158822. [Google Scholar] [CrossRef]
  44. Qiu, L.; Gou, X.; Kong, Y.; Tu, F.; Peng, X.; Xu, L.; Tu, L. Nitrogen addition stimulates N2O emissions via changes in denitrification community composition in a subtropical nitrogen-rich forest. J. Environ. Manag. 2023, 348, 119274. [Google Scholar] [CrossRef]
  45. Yuan, J.; Yao, Y.; Guan, Y.; Sadiq, M.; Li, J.; Liu, S.; Yan, L. Effects of land use patterns on soil properties and nitrous oxide flux on a semi-arid environmental conditions of Loess Plateau China. Glob. Ecol. Conserv. 2024, 51, e02899. [Google Scholar] [CrossRef]
  46. Du, M.; Yuan, J.; Zhuo, M.; Sadiq, M.; Wu, J.; Xu, G.; Yan, L. Effects of different land use patterns on soil properties and N2O emissions on a semi-arid Loess Plateau of Central Gansu. Front. Ecol. Evol. 2023, 11, 1128236. [Google Scholar] [CrossRef]
  47. Alhassan, A.R.M.; Yang, C.; Ma, W.; Li, G. Influence of conservation tillage on Greenhouse gas fluxes and crop productivity in spring-wheat agroecosystems on the Loess Plateau of China. PeerJ 2021, 9, e11064. [Google Scholar] [CrossRef] [PubMed]
  48. Huang, F.; Liu, Z.; Mou, H.; Li, J.; Zhang, P.; Jia, Z. Impact of farmland mulching practices on the soil bacterial community structure in the semiarid area of the loess plateau in China. Eur. J. Soil Biol. 2019, 92, 8–15. [Google Scholar] [CrossRef]
  49. Ma, W.; Alhassan, A.R.M.; Wang, Y.; Li, G.; Wang, H.; Zhao, J. Greenhouse gas emissions as influenced by wetland vegetation degradation along a moisture gradient on the eastern Qinghai-Tibet Plateau of North-West China. Nutr. Cycl. Agroecosystems 2018, 112, 335–354. [Google Scholar] [CrossRef]
  50. Wu, J.; Wang, H.; Li, G. Effects of nitrogen deposition on N2O emission in a wet meadow on the Qinghai-Tibet Plateau. Appl. Soil Ecol. 2023, 191, 105049. [Google Scholar] [CrossRef]
  51. Wu, J.; Wang, H.; Li, G.; Wu, J.; Gong, Y.; Wei, X.; Lu, Y. Responses of CH4 flux and microbial diversity to changes in rainfall amount and frequencies in a wet meadow in the Tibetan Plateau. Catena 2021, 202, 105253. [Google Scholar] [CrossRef]
  52. Guan, Y.S. Soil Enzyme and Research Method 309-313; Agricultural Press: Beijing, China, 1986. [Google Scholar]
  53. Tabatabai, M.A. Soil enzymes. In Methods of Soil Analyses, Part 2. Microbiological and Biochemical Properties; Weaver, R.W., Angle, J.S., Bottomly, P.S., Eds.; Soil Science Society of America: Madison, WI, USA, 1994; pp. 775–833. [Google Scholar]
  54. Harpole, W.S.; Potts, D.L.; Suding, K.N. Ecosystem responses to water and nitrogen amendment in a California grassland. Glob. Change Biol. 2007, 13, 2341–2348. [Google Scholar] [CrossRef]
  55. Lu, X.; Hou, E.; Guo, J.; Gilliam, F.S.; Li, J.; Tang, S.; Kuang, Y. Nitrogen addition stimulates soil aggregation and enhances carbon storage in terrestrial ecosystems of China: A meta-analysis. Glob. Change Biol. 2021, 27, 2780–2792. [Google Scholar] [CrossRef] [PubMed]
  56. Ghani, M.I.; Wang, J.; Li, P.; Pathan, S.I.; Sial, T.A.; Datta, R.; Abdelrahman, H. Variations of soil organic carbon fractions in response to conservative vegetation successions on the Loess Plateau of China. Int. Soil Water Conserv. Res. 2023, 11, 561–571. [Google Scholar] [CrossRef]
  57. Wang, X.; Jiang, Z.; Li, Y.; Kong, F.; Xi, M. Inorganic carbon sequestration and its mechanism of coastal saline-alkali wetlands in Jiaozhou Bay, China. Geoderma 2019, 351, 221–234. [Google Scholar] [CrossRef]
  58. Wong, V.N.; Greene, R.S.B.; Dalal, R.C.; Murphy, B.W. Soil carbon dynamics in saline and sodic soils: A review. Soil Use Manag. 2010, 26, 2–11. [Google Scholar] [CrossRef]
  59. Neina, D. The role of soil pH in plant nutrition and soil remediation. Appl. Environ. Soil Sci. 2019, 2019, 5794869. [Google Scholar] [CrossRef]
  60. Weligama, C.; Tang, C.; Sale, P.W.G.; Conyers, M.K.; Liu, D.L. Application of nitrogen in NO3 form increases rhizosphere alkalisation in the subsurface soil layers in an acid soil. Plant Soil 2010, 333, 403–416. [Google Scholar] [CrossRef]
  61. Fujii, K.; Funakawa, S.; Hayakawa, C.; Kosaki, T. Contribution of different proton sources to pedogenetic soil acidification in forested ecosystems in Japan. Geoderma 2008, 144, 478–490. [Google Scholar] [CrossRef]
  62. Chen, H.; Li, D.; Zhao, J.; Xiao, K.; Wang, K. Effects of nitrogen addition on activities of soil nitrogen acquisition enzymes: A meta-analysis. Agric. Ecosyst. Environ. 2018, 252, 126–131. [Google Scholar] [CrossRef]
  63. Weng, B.; Xie, X.; Yang, J.; Liu, J.; Lu, H.; Yan, C. Research on the nitrogen cycle in rhizosphere of Kandelia obovata under ammonium and nitrate addition. Mar. Pollut. Bull. 2013, 76, 227–240. [Google Scholar] [CrossRef] [PubMed]
  64. Li, R.; Gao, Y.; Chen, Q.; Li, Z.; Gao, F.; Meng, Q.; Zhang, M. Blended controlled-release nitrogen fertilizer with straw returning improved soil nitrogen availability, soil microbial community, and root morphology of wheat. Soil Tillage Res. 2021, 212, 105045. [Google Scholar] [CrossRef]
  65. Shu, X.; Wang, Y.; Wang, Y.; Ma, Y.; Men, M.; Zheng, Y.; Noulas, C. Response of soil N2O emission and nitrogen utilization to organic matter in the wheat and maize rotation system. Sci. Rep. 2021, 11, 4396. [Google Scholar] [CrossRef]
  66. Zhang, Y.; Sheng, J.; Wang, Z.; Chen, L.; Zheng, J. Nitrous oxide and methane emissions from a Chinese wheat–rice cropping system under different tillage practices during the wheat-growing season. Soil Tillage Res. 2015, 146, 261–269. [Google Scholar] [CrossRef]
  67. Liu, Y.; Liao, Y.; Liu, W. High nitrogen application rate and planting density reduce wheat grain yield by reducing filling rate of inferior grain in middle spikelets. Crop J. 2021, 9, 412–426. [Google Scholar] [CrossRef]
  68. Chen, Q.; Liu, Z.; Zhou, J.; Xu, X.; Zhu, Y. Long-term straw mulching with nitrogen fertilization increases nutrient and microbial determinants of soil quality in a maize–wheat rotation on China’s Loess Plateau. Sci. Total Environ. 2021, 775, 145930. [Google Scholar] [CrossRef]
  69. Guo, S.; Zhu, H.; Dang, T.; Wu, J.; Liu, W.; Hao, M.; Syers, J.K. Winter wheat grain yield associated with precipitation distribution under long-term nitrogen fertilization in the semiarid Loess Plateau in China. Geoderma 2012, 189, 442–450. [Google Scholar] [CrossRef]
  70. Kyveryga, P.M.; Blackmer, A.M.; Ellsworth, J.W.; Isla, R. Soil pH effects on nitrification of fall-applied anhydrous ammonia. Soil Sci. Soc. Am. J. 2004, 68, 545–551. [Google Scholar]
  71. Šimek, M.; Jíšová, L.; Hopkins, D.W. What is the so-called optimum pH for denitrification in soil? Soil Biol. Biochem. 2002, 34, 1227–1234. [Google Scholar] [CrossRef]
  72. Chen, J.; Ma, X.; Lu, X.; Xu, H.; Chen, D.; Li, Y.; Yakov, K. Long-term phosphorus addition alleviates CO2 and N2O emissions via altering soil microbial functions in secondary rather primary tropical forests. Environ. Pollut. 2023, 323, 121295. [Google Scholar] [CrossRef]
  73. Abdo, A.I.; Xu, Y.; Shi, D.; Li, J.; Li, H.; El-Sappah, A.H.; Kuzyakov, Y. Nitrogen transformation genes and ammonia emission from soil under biochar and urease inhibitor application. Soil Tillage Res. 2022, 223, 105491. [Google Scholar] [CrossRef]
  74. Pan, Y.; Wu, J.; Liu, G.; Liu, W.; Ma, L. Differential responses of temperature sensitivity of greenhouse gases emission to seasonal variations in plateau riparian zones. Environ. Pollut. 2024, 353, 124190. [Google Scholar] [CrossRef] [PubMed]
  75. Zhang, J.; He, P.; Liu, Y.; Du, W.; Jing, H.; Nie, C. Soil properties and microbial abundance explain variations in N2O fluxes from temperate steppe soil treated with nitrogen and water in Inner Mongolia, China. Appl. Soil Ecol. 2021, 165, 103984. [Google Scholar] [CrossRef]
  76. Pu, Y.; Zhu, B.; Dong, Z.; Liu, Y.; Wang, C.; Ye, C. Soil N2O and NOx emissions are directly linked with N-cycling enzymatic activities. Appl. Soil Ecol. 2019, 139, 15–24. [Google Scholar] [CrossRef]
  77. Liao, J.; Luo, Q.; Hu, A.; Wan, W.; Tian, D.; Ma, J.; Lu, S. Soil moisture—Atmosphere feedback dominates land N2O nitrification emissions and denitrification reduction. Glob. Change Biol. 2022, 28, 6404–6418. [Google Scholar] [CrossRef]
  78. Yu, C.; Liu, M.; Song, M.; Xu, X.; Zong, N.; Zhu, J.; Shi, P. Nitrogen enrichment enhances the competition for nitrogen uptake between Stipa purpurea and microorganisms in a tibetan alpine steppe. Plant Soil 2023, 488, 503–516. [Google Scholar] [CrossRef]
  79. Jones, D.L.; Magthab, E.A.; Gleeson, D.B.; Hill, P.W.; Sánchez-Rodríguez, A.R.; Roberts, P.; Murphy, D.V. Microbial competition for nitrogen and carbon is as intense in the subsoil as in the topsoil. Soil Biol. Biochem. 2018, 117, 72–82. [Google Scholar] [CrossRef]
  80. Jones, D.L.; Clode, P.L.; Kilburn, M.R.; Stockdale, E.A.; Murphy, D.V. Competition between plant and bacterial cells at the microscale regulates the dynamics of nitrogen acquisition in wheat (Triticum aestivum). New Phytol. 2013, 200, 796–807. [Google Scholar] [CrossRef] [PubMed]
  81. Yan, B.; Duan, M.; Wang, R.; Li, J.; Wei, F.; Chen, J.; Wang, G. Planted forests intensified soil microbial metabolic nitrogen and phosphorus limitation on the Loess Plateau, China. Catena 2022, 211, 105982. [Google Scholar] [CrossRef]
  82. Geng, F.; Li, K.; Liu, X.; Gong, Y.; Yue, P.; Li, Y.; Han, W. Long-term effects of N deposition on N2O emission in an alpine grassland of Central Asia. Catena 2019, 182, 104100. [Google Scholar] [CrossRef]
  83. Wang, J.; Liu, Q.; Zhao, S.; He, S.; Yang, B.; Wang, N.; Yang, L. Heavy rainfall stimulates more N2O emissions from wheat fields during basal and overwintering fertilization phases. Agric. Ecosyst. Environ. 2024, 376, 109227. [Google Scholar] [CrossRef]
  84. Li, H.; Zhang, W.F.; Zhang, F.S.; Du, F.; Li, L.K. Chemical fertilizer use and efficiency change of main grain crops in China. Plant Nutr. Fertil. Sci. 2010, 16, 1136–1143. [Google Scholar]
  85. Zhang, Y.; Wang, H.; Lei, Q.; Luo, J.; Lindsey, S.; Zhang, J.; Liu, H. Optimizing the nitrogen application rate for maize and wheat based on yield and environment on the Northern China Plain. Sci. Total Environ. 2018, 618, 1173–1183. [Google Scholar] [CrossRef] [PubMed]
  86. Wang, J.; Sun, X.; Hussain, S.; Yang, L.; Gao, S.; Zhang, P.; Ren, X. Reduced nitrogen rate improves post-anthesis assimilates to grain and ameliorates grain-filling characteristics of winter wheat in dry land. Plant Soil 2024, 499, 91–112. [Google Scholar] [CrossRef]
  87. Gong, Y.; Wu, J.; Vogt, J.; Le, T.B. Warming reduces the increase in N2O emission under nitrogen fertilization in a boreal peatland. Sci. Total Environ. 2019, 664, 72–78. [Google Scholar] [CrossRef]
Figure 1. Temperature and precipitation changes in the Loess Plateau region of 2022 and 2023.
Agronomy 15 01377 g001
Figure 2. Changes in spring wheat yield under different nitrogen fertilizer levels of 2022 and 2023. Different uppercase letters indicate significant differences among treatments (p < 0.05). CK, no nitrogen fertilizer; LN, low nitrogen; MN, medium nitrogen; HN, high nitrogen.
Agronomy 15 01377 g002
Figure 3. Changes in average N2O flux under different nitrogen fertilizer levels of 2022 and 2023. Different uppercase letters indicate significant differences among treatments (p < 0.05). CK, no nitrogen fertilizer; LN, low nitrogen; MN, medium nitrogen; HN, high nitrogen.
Agronomy 15 01377 g003
Figure 4. Seasonal variations of N2O flux under different nitrogen fertilizer levels in 2022 and 2023. CK, no nitrogen fertilizer; LN, low nitrogen; MN, medium nitrogen; HN, high nitrogen. “↓” indicates the time of N fertilization.
Agronomy 15 01377 g004
Figure 5. PCA was used to evaluate the effects of soil nitrogen components and enzyme activities on N2O flux in spring wheat.
Agronomy 15 01377 g005
Figure 6. Relationship between N2O flux and six soil characteristic variables (total nitrogen, TN; nitrate nitrogen, NO3; ammonium nitrogen, NH4+; soil urease; NR, nitrate reductase; and pH at 10 cm soil depths).
Agronomy 15 01377 g006
Table 1. The average changes in soil characteristics of spring wheat 0–10 cm layer under different nitrogen fertilizer levels in 2022 and 2023 (means ± standard errors).
TreamentSWC (%)TN (g·kg−1)NO3 (mg·kg−1)NH4+ (mg·kg−1)pH
CK10.71 ± 0.14 A0.50 ± 0.01 C28.80 ± 0.55 C17.38 ± 0.54 C7.88 ± 0.01 C
LN10.06 ± 0.09 B0.55 ± 0.00 B30.54 ± 0.52 BC20.48 ± 0.26 B7.99 ± 0.01 B
MN10.78 ± 0.05 A0.56 ± 0.00 B30.98 ± 0.55 B20.44 ± 0.15 B8.01 ± 0.02 B
HN10.23 ± 0.17 B0.59 ± 0.01 A35.78 ± 0.65 A23.26 ± 0.36 A8.10 ± 0.01 A
Note: different uppercase letters indicate significant differences among treatments (p < 0.05). CK, no nitrogen fertilizer; LN, low nitrogen; MN, medium nitrogen; HN, high nitrogen.
Table 2. Changes in soil enzyme activity in the 0–10 cm layer under different nitrogen fertilizer levels in 2023 (means ± standard errors).
TreamentSeasonUrease (mg·g−1)Nitrate Reductase (mg·g−1)Nitrite Reductase (mg·g−1)
CKApril1.55 ± 0.03 D7.13 ± 0.02 C0.52 ± 0.01 C
June1.72 ± 0.02 D7.52 ± 0.02 B0.66 ± 0.01 B
August1.50 ± 0.03 D6.53 ± 0.09 C0.85 ± 0.02 C
Average1.60 ± 0.01 D7.06 ± 0.05 B0.68 ± 0.01 C
LNApril1.66 ± 0.02 C7.31 ± 0.03 C0.55 ± 0.03 B
June1.81 ± 0.02 C7.59 ± 0.03 B0.69 ± 0.01 B
August1.64 ± 0.03 C6.83 ± 0.03 BC0.88 ± 0.01 C
Average1.70 ± 0.01 C7.24 ± 0.03 B0.70 ± 0.02 BC
MNApril2.04 ± 0.06 B7.60 ± 0.01 B0.56 ± 0.03 B
June2.25 ± 0.04 B8.03± 0.01 A0.70 ± 0.02 B
August2.04 ± 0.02 B7.34 ± 0.01 A0.89 ± 0.02 B
Average2.11 ± 0.02 B7.55 ± 0.01 A0.72 ± 0.01 B
HNApril2.14 ± 0.04 A8.02 ± 0.17 A0.59 ± 0.01 A
June2.36 ± 0.03 A7.70 ± 0.14 B0.72 ± 0.01 A
August2.15 ± 0.02 A6.94 ± 0.05 B0.91 ± 0.03 A
Average2.21 ± 0.02 A7.66 ± 0.11 A0.74 ± 0.02 A
Note: different uppercase letters indicate significant differences among treatments (p < 0.05). CK, no nitrogen fertilizer; LN, low nitrogen; MN, medium nitrogen; HN, high nitrogen.
Table 3. Results of a repeated-measures ANOVA testing for differences in soil N2O flux among N application levels using season flux as the repeated variable. T: treatment, S: season.
Source of Variation20222023
dfFpdfFp
T32472.5500.0003988.9240.000
S6748.0570.0007779.5760.000
T × S18118.6290.00021250.3220.000
Disclaimer/Publisher’s Note: The statements, opinions and data contained in all publications are solely those of the individual author(s) and contributor(s) and not of MDPI and/or the editor(s). MDPI and/or the editor(s) disclaim responsibility for any injury to people or property resulting from any ideas, methods, instructions or products referred to in the content.

