Article

Assessing Global Agricultural Greenhouse Gas Emissions: Key Drivers and Mitigation Strategies

by
Shuo Zhou
1,
Boyu Liu
2,
Jianquan Wang
2,
Dian Jin
2 and
Hailin Zhang
2,*
1
College of Science, China Agricultural University, Beijing 100193, China
2
College of Agronomy and Biotechnology, China Agricultural University, Beijing 100193, China
*
Author to whom correspondence should be addressed.
Agronomy 2025, 15(6), 1336; https://doi.org/10.3390/agronomy15061336
Submission received: 7 April 2025 / Revised: 24 May 2025 / Accepted: 26 May 2025 / Published: 29 May 2025

Abstract

:
Climate change has emerged as one of the most pressing global challenges in recent decades. Agricultural activities significantly influence climate dynamics, necessitating thorough investigation of their emission patterns. Using the FAO datasets, the objectives of this study were to assess agricultural GHG emissions, identify influencing factors, and explore potential mitigation strategies. The results show that emissions related to crop production are strongly correlated with the yields of predominant crops. Maize production had the largest impact on crop emissions (0.023), followed by potato (0.021) and rice (0.007). Notably, these three crops accounted for substantial portions of total crop-related emissions, with maize contributing 11.70%, potatoes (Solanum tuberosum L.) 10.21%, and rice 9.25%. In the livestock sector, cattle herds generated 10.75% of emissions, with pigs and sheep contributing 9.82% and 10.03%, respectively. Multivariate analysis revealed the cattle/buffalo population as the dominant emission driver (0.32), followed by sheep/goat (0.21) and swine (0.10) populations. Simultaneously, emissions from livestock operations were closely associated with the populations of key livestock species. Thus, from a climate mitigation perspective, prioritizing yield-optimized agronomic approaches for maize and potato cultivation, along with strategic population management of cattle and sheep, represents a critical pathway toward achieving emission reduction targets in global agricultural systems.

1. Introduction

In recent years, climate change has been recognized as one of the most pressing global challenges, with human activities serving as the predominant driver of this phenomenon [1]. Widespread weather changes, rising global temperatures, and unprecedented environmental impacts have resulted from the alteration of the global radiative balance, driven by the current rising atmospheric concentrations of greenhouse gases—including carbon dioxide, methane, and nitrous oxide [2]. Underscoring the urgent need for comprehensive research to understand the complex dynamics between climate change and greenhouse gas (GHG) emissions, the Intergovernmental Panel on Climate Change (IPCC) has unequivocally highlighted the role of anthropogenic GHG emissions in driving climate change [3]. Wang et al. noted that the secondary and tertiary industries are the main contributors to carbon emissions [4]. However, rapid agricultural development accelerates global climate change [5,6]. The direct contribution of agriculture to global anthropogenic GHG emissions is estimated to be between 10% and 12% [5,6]. In China, the contribution of agricultural carbon emissions to total greenhouse gas emissions ranges from 16% to 17% [7], while in the United States, this contribution is around 6% to 7% [8]. Despite the lower carbon emissions from agriculture when compared with those from secondary and tertiary industries, the potential for carbon reduction in agroecosystems—and the positive external effects of such reduction—should not be overlooked [9,10,11]. Therefore, reducing agricultural emissions is critical to achieving global carbon neutrality. However, an increase in agricultural production is essential to meet the growing demands of an increasingly affluent world population [12]. As agricultural production increases, GHG emissions inevitably rise. Thus, balancing agricultural production and emissions reduction is therefore an urgent one.
To effectively address the environmental challenges posed by agricultural emissions, it is crucial to scientifically analyze the characteristics of agricultural GHG emissions and their key drivers. Ciais et al. pointed out that agriculture is the driver of global emissions, contributing approximately 10–12% [13]. To gain deeper insight into agricultural carbon emissions, a number of researchers have conducted research on this topic. As shown in previous studies, the primary sources of agricultural emissions include animal husbandry, fertilizer application, and alterations in land use [14,15]. Some studies indicate that the key drivers of livestock emissions are manure management and enteric fermentation. Together, these account for 5% of total global GHG emissions, with enteric fermentation alone contributing about 2% of total global GHG emissions, while the main contributors to crop-related emissions are fertilizer application and crop residue decomposition, which together account for approximately 0.4% of total global GHG emissions [16,17] Chen et al. found that, for crop cultivation, the most effective emission mitigation measures are water management in paddy fields, efficient irrigation for dryland crops, and slow-release fertilizers. For livestock, the most promising options are feed supplements and improving feed quality [18]. Researchers have shown that these technologies have significant mitigation potential at the European and global levels [19,20]. Among recent studies applying machine learning to agricultural emissions in recent years, Li et al. [21] generated predictive estimates of agricultural GHG emissions for the future 2022–2050 using deep learning models.
Previous studies on the characteristics and driving factors of agricultural greenhouse gas (GHG) emissions have yielded valuable insights, yet notable limitations remain. Most studies focus on individual emission sources or specific regions, lacking a holistic assessment of the overall agricultural emission system. In addition, research on the driving factors and their interactions, particularly in terms of synergistic effects and dynamic changes, is insufficient. To address these gaps, this study aims to (1) comprehensively analyze the characteristics of agricultural GHG emissions; (2) investigate key driving factors by revealing their mechanisms and synergistic effects; (3) and propose targeted emission reduction strategies to support sustainable agricultural development.

2. Methods

2.1. Data Sources

The primary source of data in this study is the Food and Agriculture Organization’s (FAO) global agricultural database. The dataset spans the years 1970 to 2022 and was acquired in October 2024. The data are organized by year and region, encompassing information from 234 countries and regions. Independent variables are grouped into five categories: crop production, livestock stock, livestock manure, land use, and fertilizer application. At the same time, we used crop emissions and livestock emissions as dependent variables, where the relevant emissions are measured using carbon equivalent emissions. According to FAO definitions, this study defines agricultural GHG emissions (expressed as CO2 equivalents) as the total CO2, CH4, and N2O emissions from agricultural land [3]. Inorganic N fertilizers are defined as the total N content from urea; ammonium sulfate; ammonium nitrate; calcium ammonium nitrate; and other mixtures with calcium carbonate, sodium nitrate, urea, and ammonium nitrate solutions, anhydrous ammonia, and other not elsewhere classified inorganic N fertilizer. Crop residues are the sum of N content in crop residues left on agricultural land. Irrigation is the agricultural land area equipped for irrigation. Factors with less influence are eliminated using the Recursive Feature Elimination (RFE) technique. Additionally, separate factor analyses are conducted for carbon dioxide, nitrous oxide, and methane.

2.2. Data Processing

During the training process, we selected 89 features from 219 relevant features by RFE and principal component analysis (PCA).
In this study, PCA and RFE were used for data screening, and the following is the formula for PCA:
We used a dataset X containing m samples and n features, where X = x 1 , x 2 , , x m , and each sample x i is an n-dimensional vector.
Calculate the sample mean vector x ¯ :
x ¯ = 1 m i = 1 m x i
Centered the dataset:
X c e n t e r e d = X x ¯
Calculate the covariance matrix Σ of the dataset:
Σ = 1 m X c e n t e r e d T X c e n t e r e d
Decompose the eigenvalues of the covariance matrix to obtain the eigenvalues λ 1 , λ 2 , , λ n and the corresponding eigenvalues, as well as the corresponding eigenvectors v 1 , v 2 , , v n .
Select the eigenvectors corresponding to the first k eigenvalues as principal components to form a projection matrix W (each column is an eigenvector).
Project the dataset into the subspace consisting of the first k eigenvectors:
X r e d u c e d = X c e n t e r e d W
where X r e d u c e d is the dimensionality-reduced dataset.
RFE evaluates the importance of each feature by recursively removing features and retraining the model. In each iteration, it removes the least important features and retrains the model until the specified number of features is reached.
Moreover, the emissions per unit area and the emissions per unit yield used in this paper were calculated by taking the global GHG emissions of the corresponding crop and dividing them by the area under cultivation and the crop yield of the corresponding crop.

2.3. Statistical Analysis

Descriptive statistical methods were used to analyze trends in the main factors of production in the plantation and farming sectors, covering crop yields, livestock numbers, land use, and fertilizer application. Simultaneously, changes between production and emissions are represented by line graphs
To better understand the key influences on emissions, we extracted emissions-related features in a variable importance analysis, ranked them from highest to lowest, and selected the top ten features by importance. At the same time, structural equation models have been used for the explanation of the influence between factors and the demonstration of theoretical models. Through the use of structural equation models, we analyzed the relevant characteristics of the emissions from crops and livestock, respectively, and established reasonable regression models.

2.4. Model Training

We simultaneously used three machine learning algorithms, namely, random forest regression (RFR), extreme gradient boosting, and ordinary multiple linear regression, to fit regression to complex agricultural data. Cross-validation and hyper-parameter tuning were also used to achieve model optimization, and the performance of the different models was objectively assessed by comparing the R2 of the three and selecting the optimal solution from them.
The RFR implemented in this paper is a combination of several binary decision trees (CART) packaged together, and training the RFR is to train several binary decision trees. When training the binary decision tree model, we need to consider how to select features and how to measure the good and bad features. For feature selection, this paper adopted the exhaustive method to traverse all the features after screening. For measuring the features, it is mathematically equivalent to the following proposition:
x , v = a r g m i n x , v G x i , v i j
That is, find the smallest feature and cut point of G . Here, x i is a particular cut-off variable, and v i j is a cut-off value of the cut-off variable.
In the random forest regression implemented in this paper, H X was chosen as MSE, i.e.,
G x , v = 1 N s y i X l e f t y i y l e f t ¯ 2 + y j X r i g h t y j y r i g h t ¯ 2
In order to evaluate the carbon emission modelling, coefficient of determination was used, and the coefficient of determination is
R 2 = 1 i y i f i 2 i y i y ¯ 2

3. Results

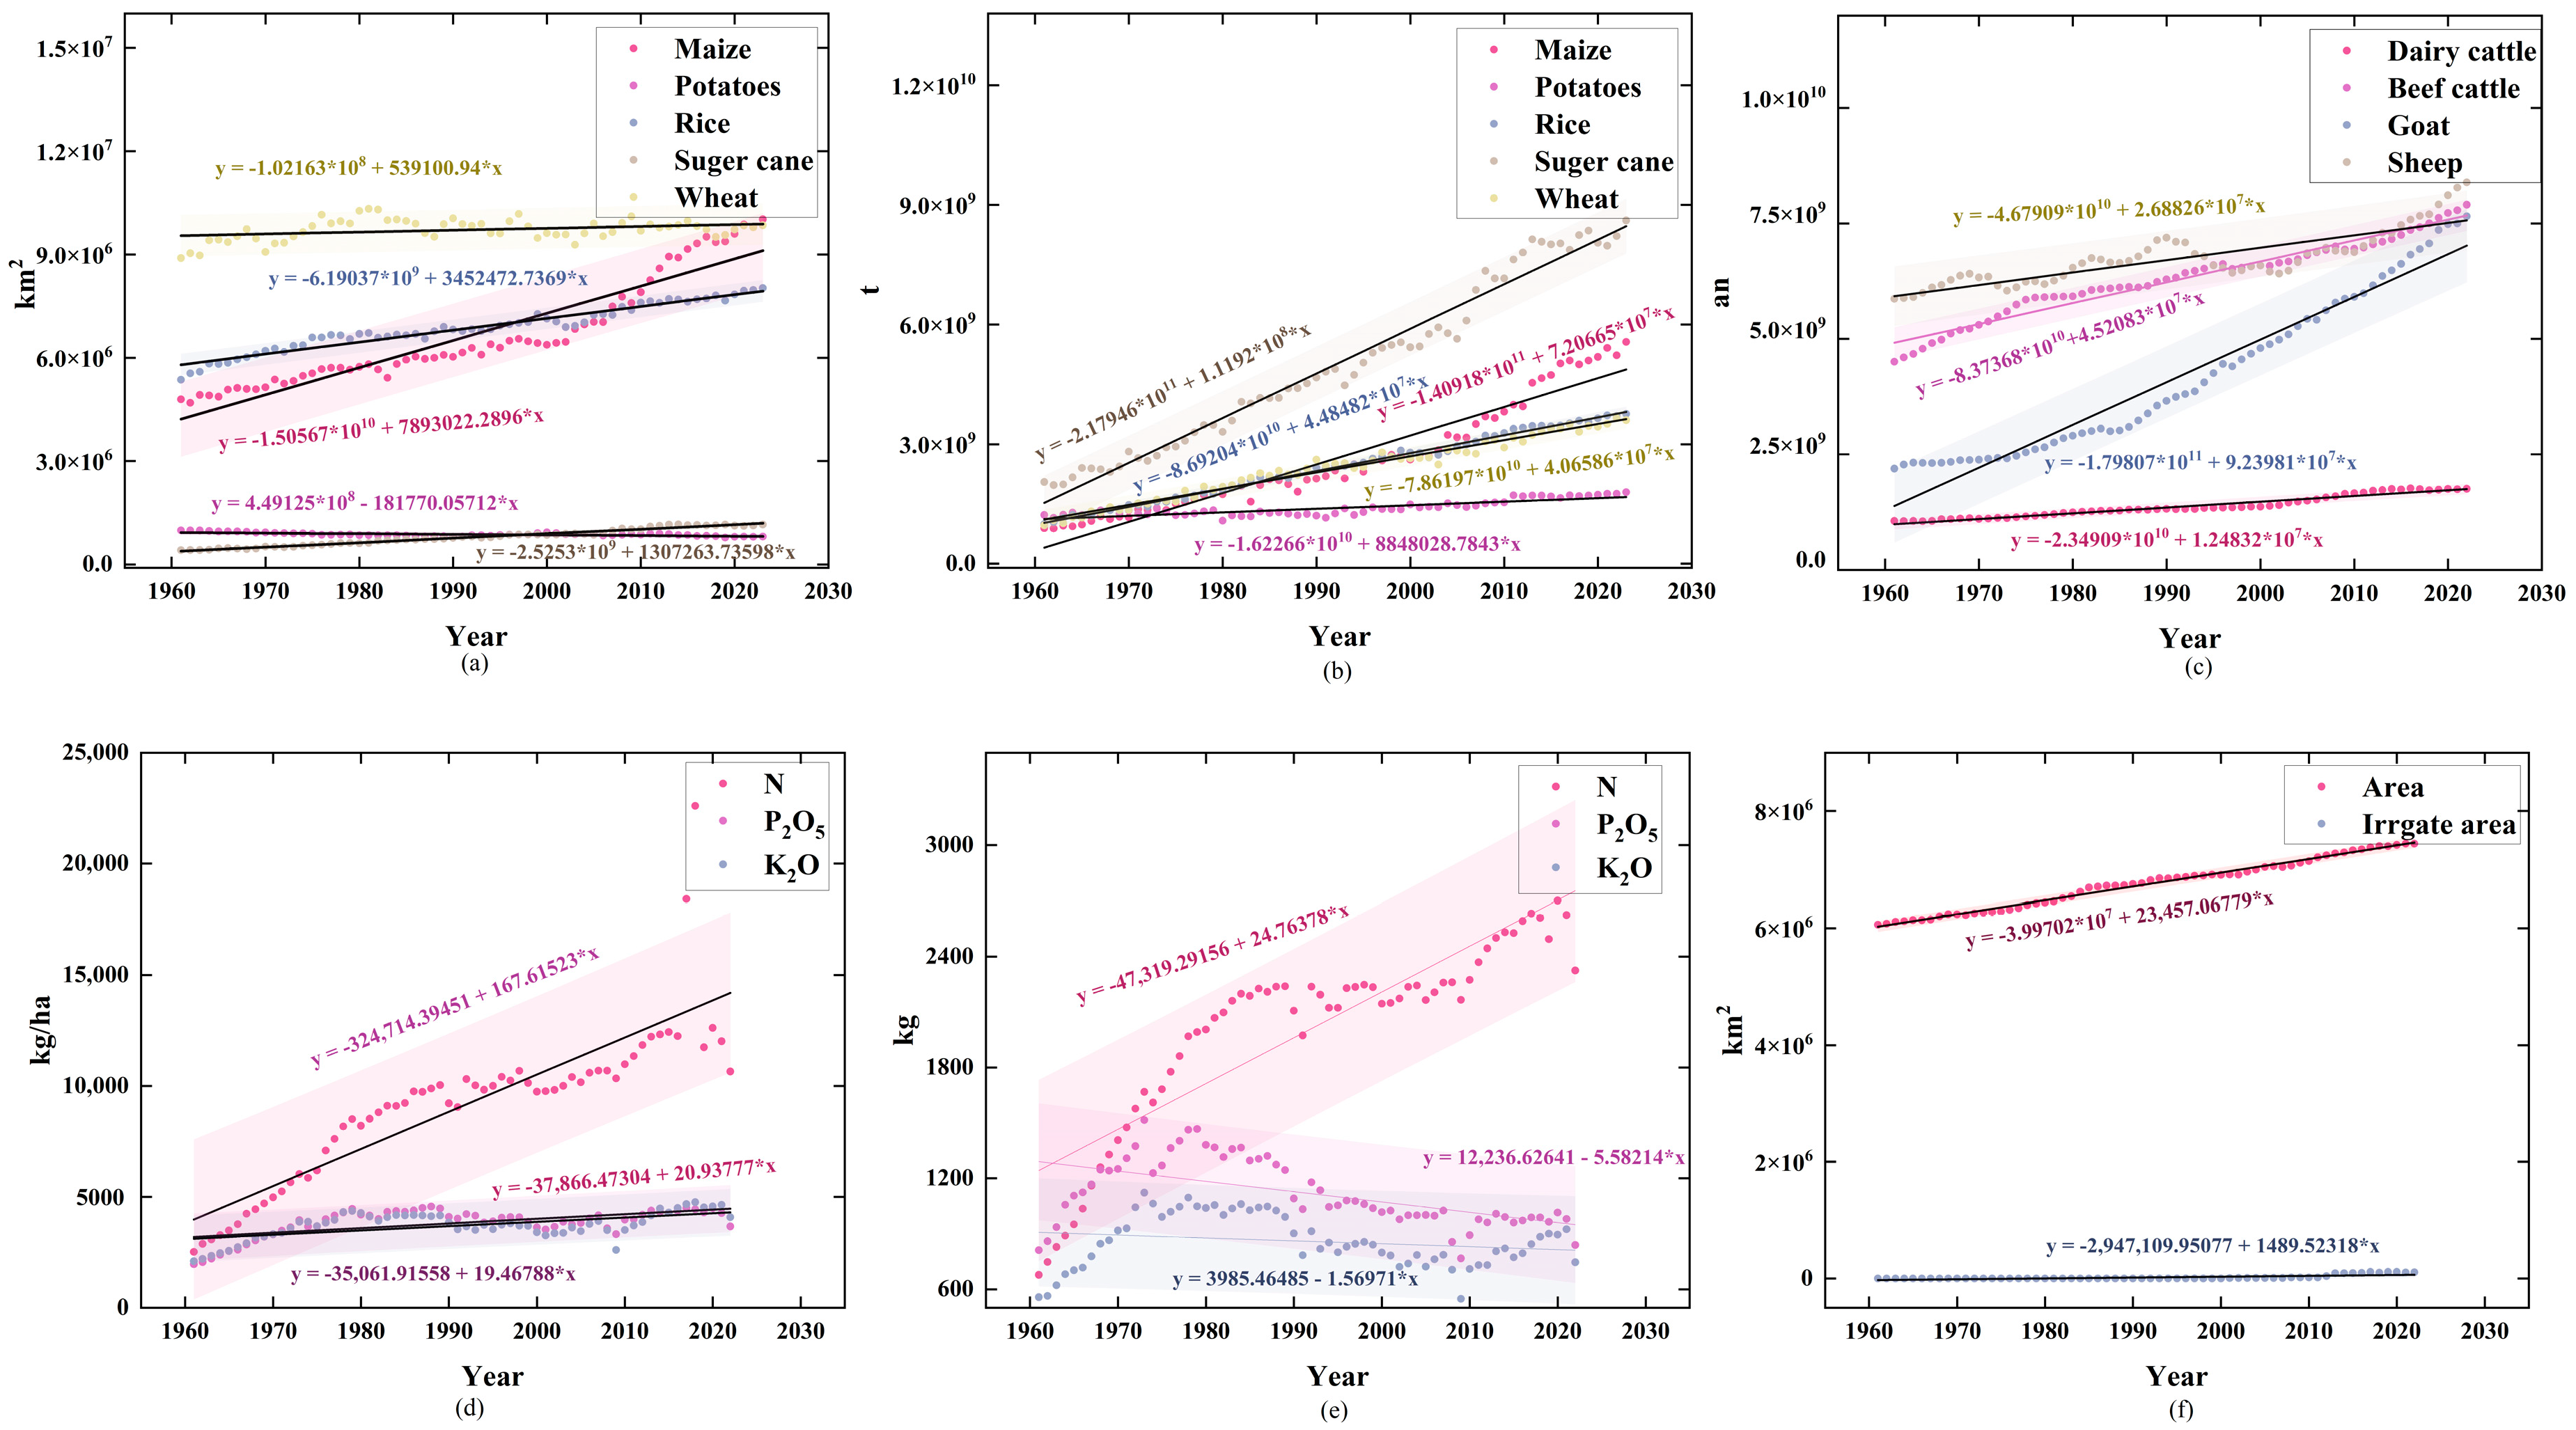
3.1. Agricultural Production

In terms of harvested area (Figure 1a), all crops showed steady growth in recent years. It is worth noting that maize—one of the main crops—saw the fastest growth in harvested volume from the early 2000s to 2022 (Figure 1b). This growth can be attributed to the widespread cultivation of improved maize varieties. Maize yield increased by 98.23% between 2000 and 2020, compared with an increase of only 50.08% between 1980 and 2000.
At the same time, the production of sugar crops increased significantly, while the area under cultivation remained stable (Figure 1a). Specifically, sugar cane production grew at a rate of 64.27% between 1980 and 2000 (Figure 1b). This can be attributed to advances in planting techniques and improvements in crop varieties.
Fertilizer use trends showed a significant increase in nitrogen fertilizer use (Figure 1d). Between 1970 and 2000, the use of nitrogen fertilizers increased by an impressive 162.11%. In contrast, during the same period, maize cultivation grew rapidly. This reveals that the dramatic change in the growth of nitrogen fertilizer use is closely related to the cultivation of maize. This indicates that nitrogen fertilizer plays an important role in promoting the growth of maize crops. The use of the other two types of fertilizer—potash and phosphorus—fluctuated below 5000 kg/ha (Figure 1d), indicating a lower dependency on potash and phosphorus fertilizers.
In terms of livestock operations, the number of beef cattle and dairy cows steadily increased, with beef cattle growing at a higher rate than that of dairy cows (Figure 1c). Beef cattle showed a growth rate of 25.59% from 1990 to 2010, compared with 10.62% for dairy cattle. This trend can be partly attributed to income growth and increased nutritional awareness. It is also noteworthy that while the number of sheep remained consistently high, the number of goats increased significantly (Figure 1c). Between 1990 and 2010, the growth rate of goats reached a remarkable 61.58%. In 1990, the numerical difference between goats and sheep accounted for 49.13% of the sheep population, whereas in 2010, this value was reduced to 14.12%. This shift was likely driven by rising nutritional demands and higher market prices for goat meat.

3.2. GHG Emissions

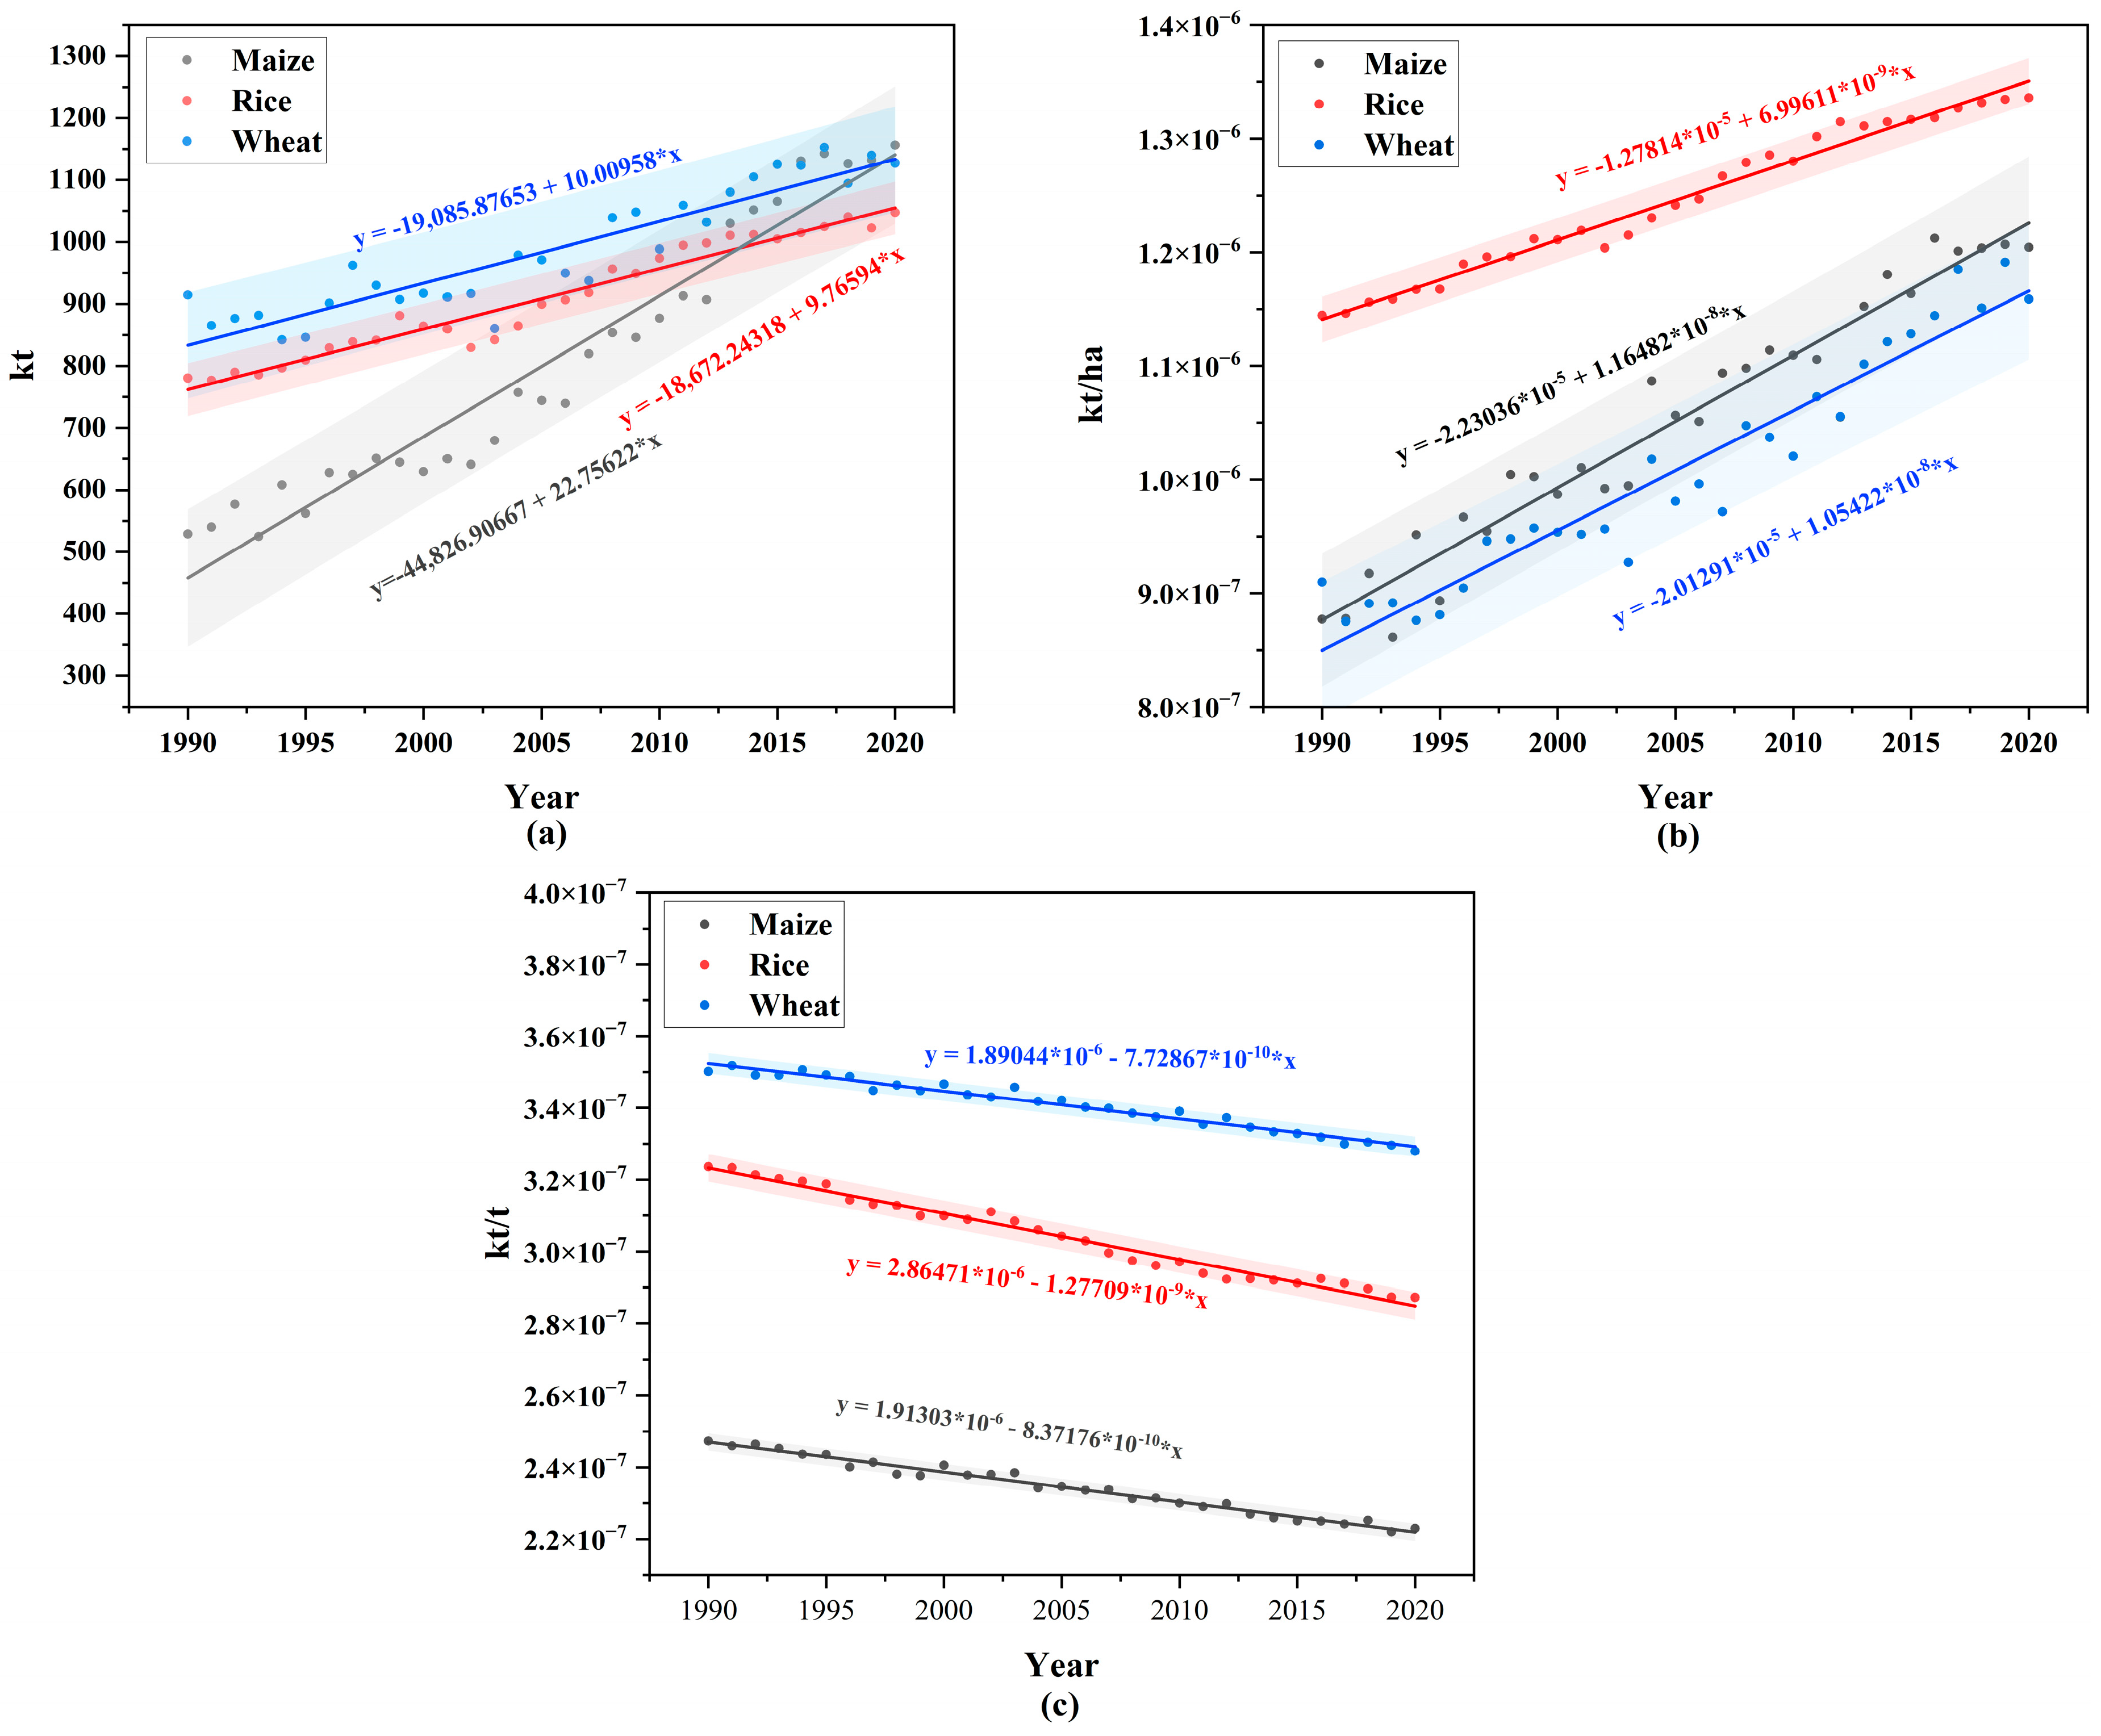
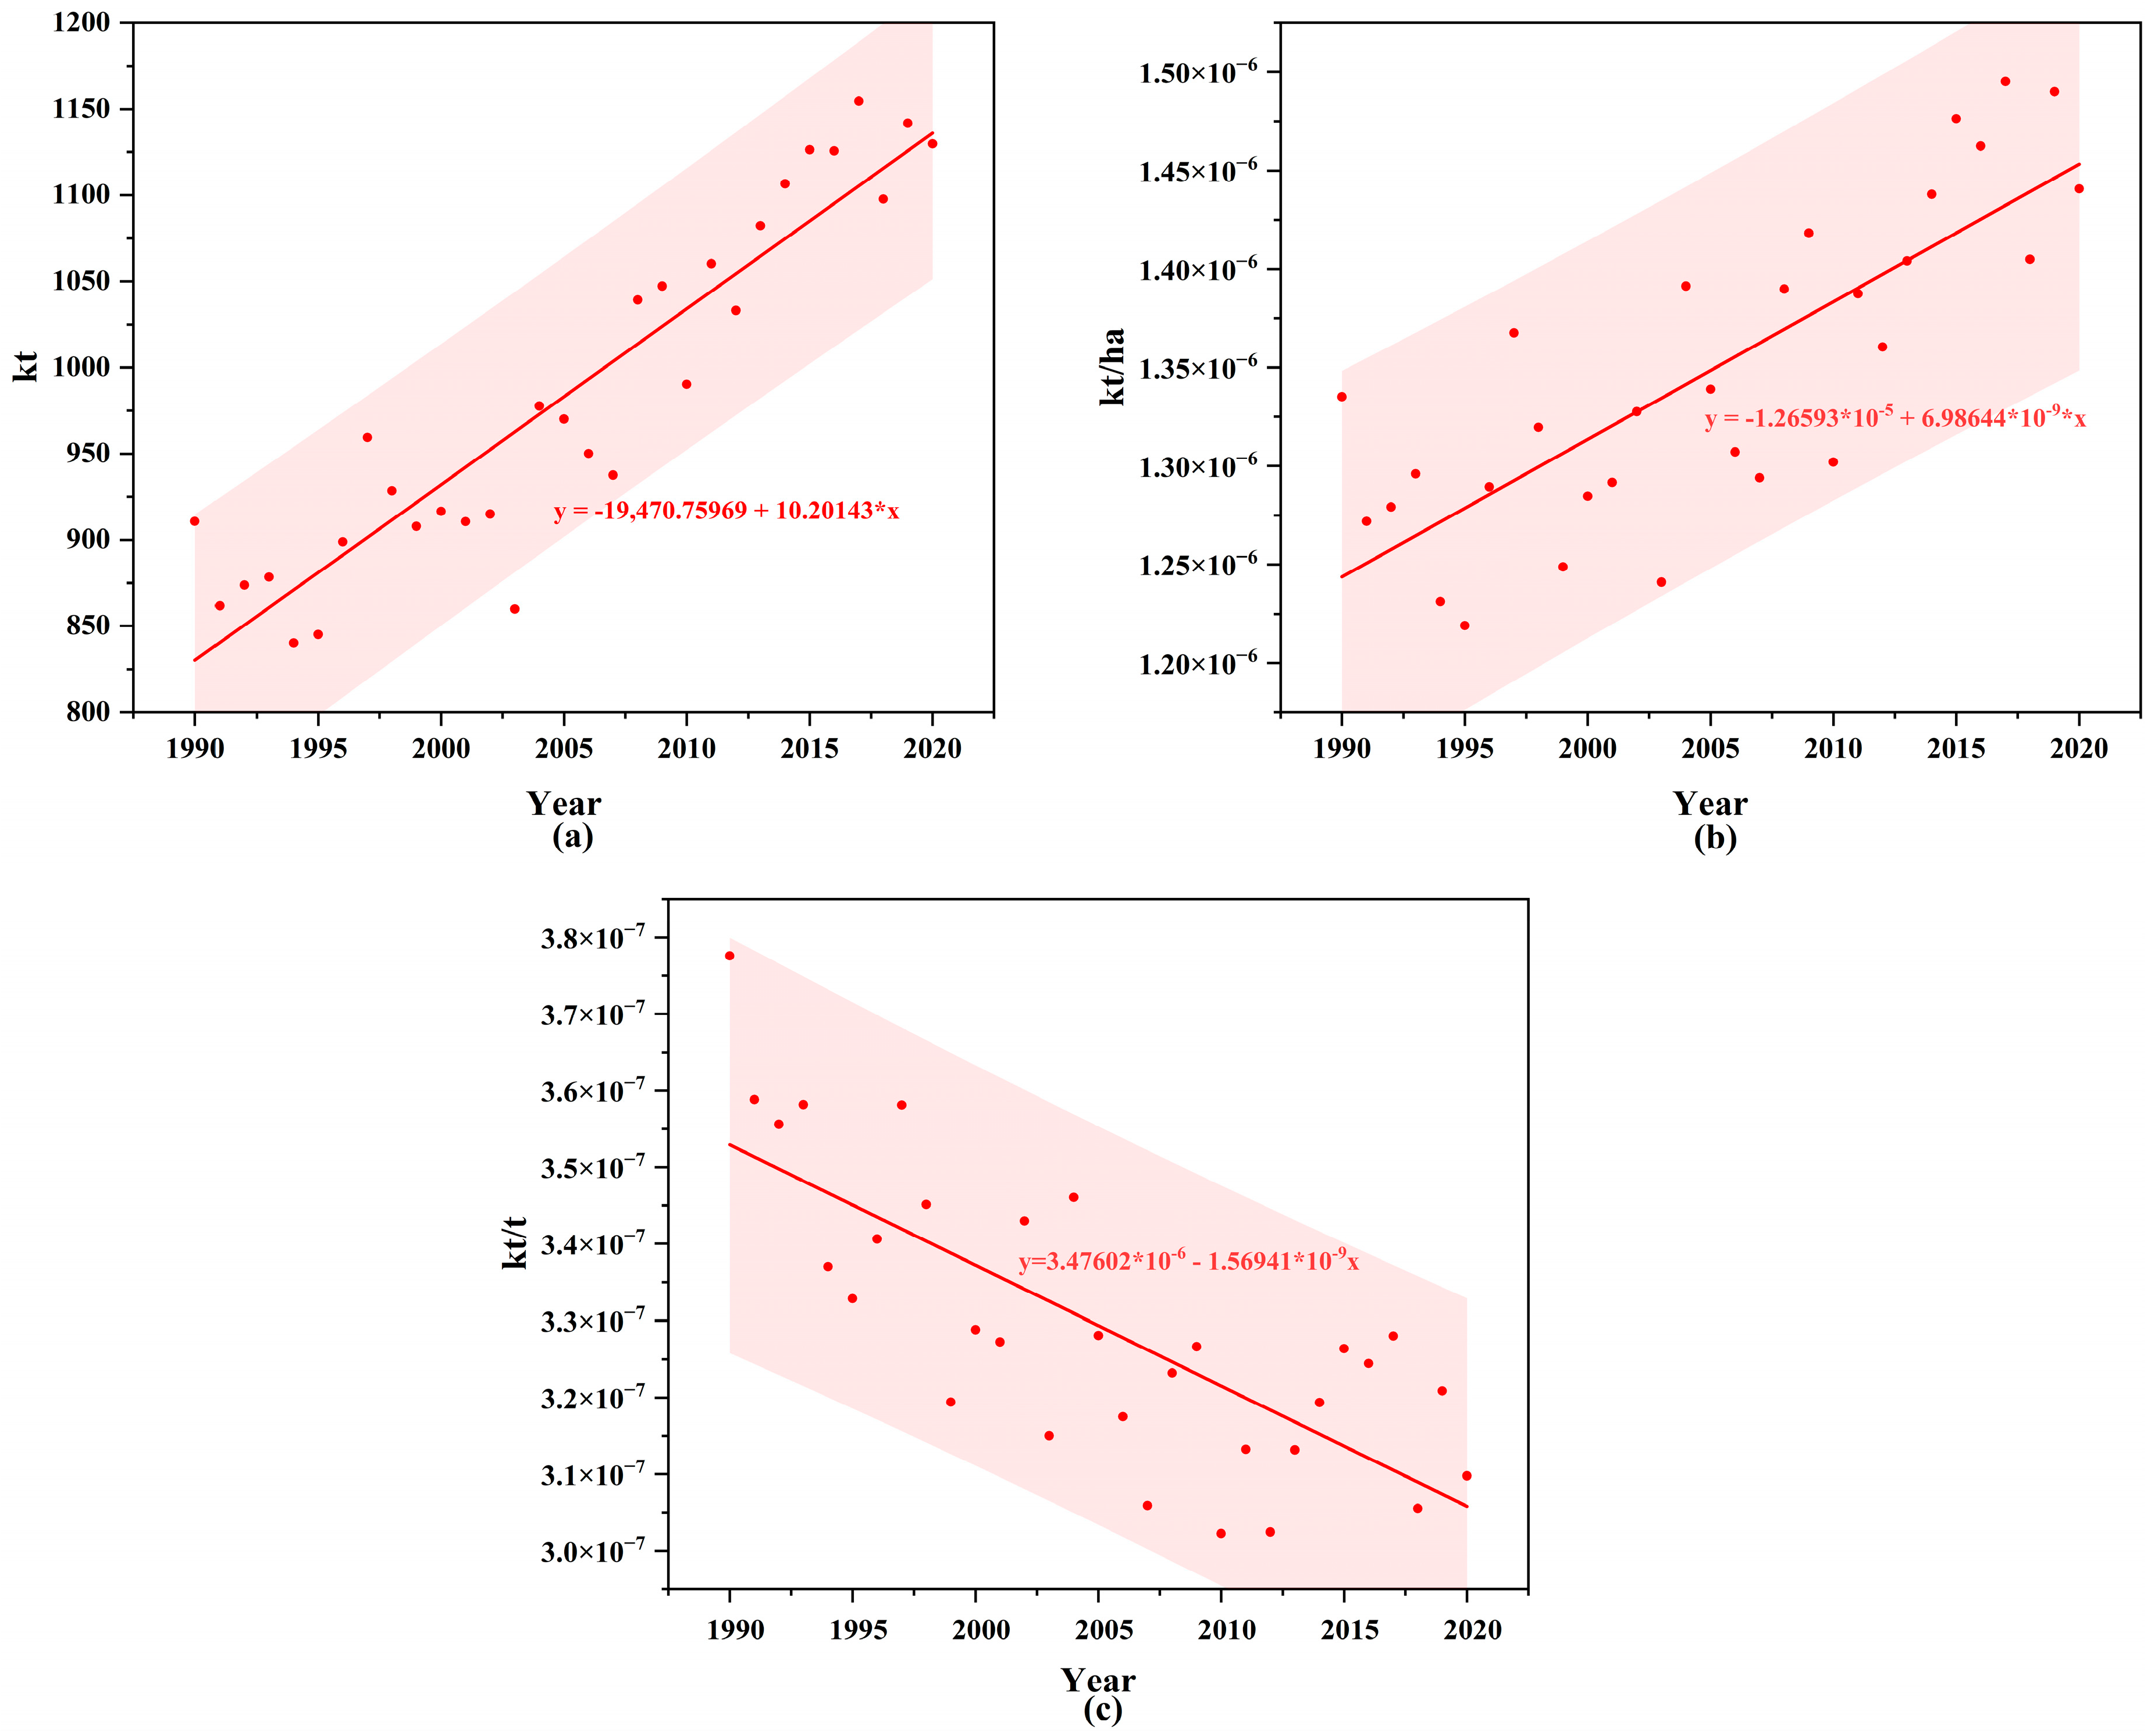
3.2.1. Emission from Crop Production

Since only a few countries have reported N2O and CH4 emissions data for the three major crops, the sample size is too small to be used as a reference. Therefore, only tentative conclusions can be drawn at this stage.
In terms of N2O emissions, wheat and rice were the dominate contributors among the three crops (maize, wheat, and rice). Although total N2O emissions were found to be rising for all three crops, it is worth noting that emissions per unit of output were falling, which is attributable to more rational cultivation practices and fertilizer application (Figure 2c).
The impact of methane emissions was mainly reflected in the rice crop, while emissions from maize and wheat were negligible. Although total CH4 emissions from rice were shown to still be increasing, emissions per unit of production were shown to be steadily decreasing, suggesting that mitigation efforts are yielding positive results.
In terms of CH4 emissions, rice was the dominant emitting crop, while other crops were largely unaffected. Although the data variance was relatively large and the data volatility was high due to the small number of countries contributing data, the overall upward trend for rice slowed down. The decrease in emissions per unit of production indicates an increase in production efficiency (Figure 3c).

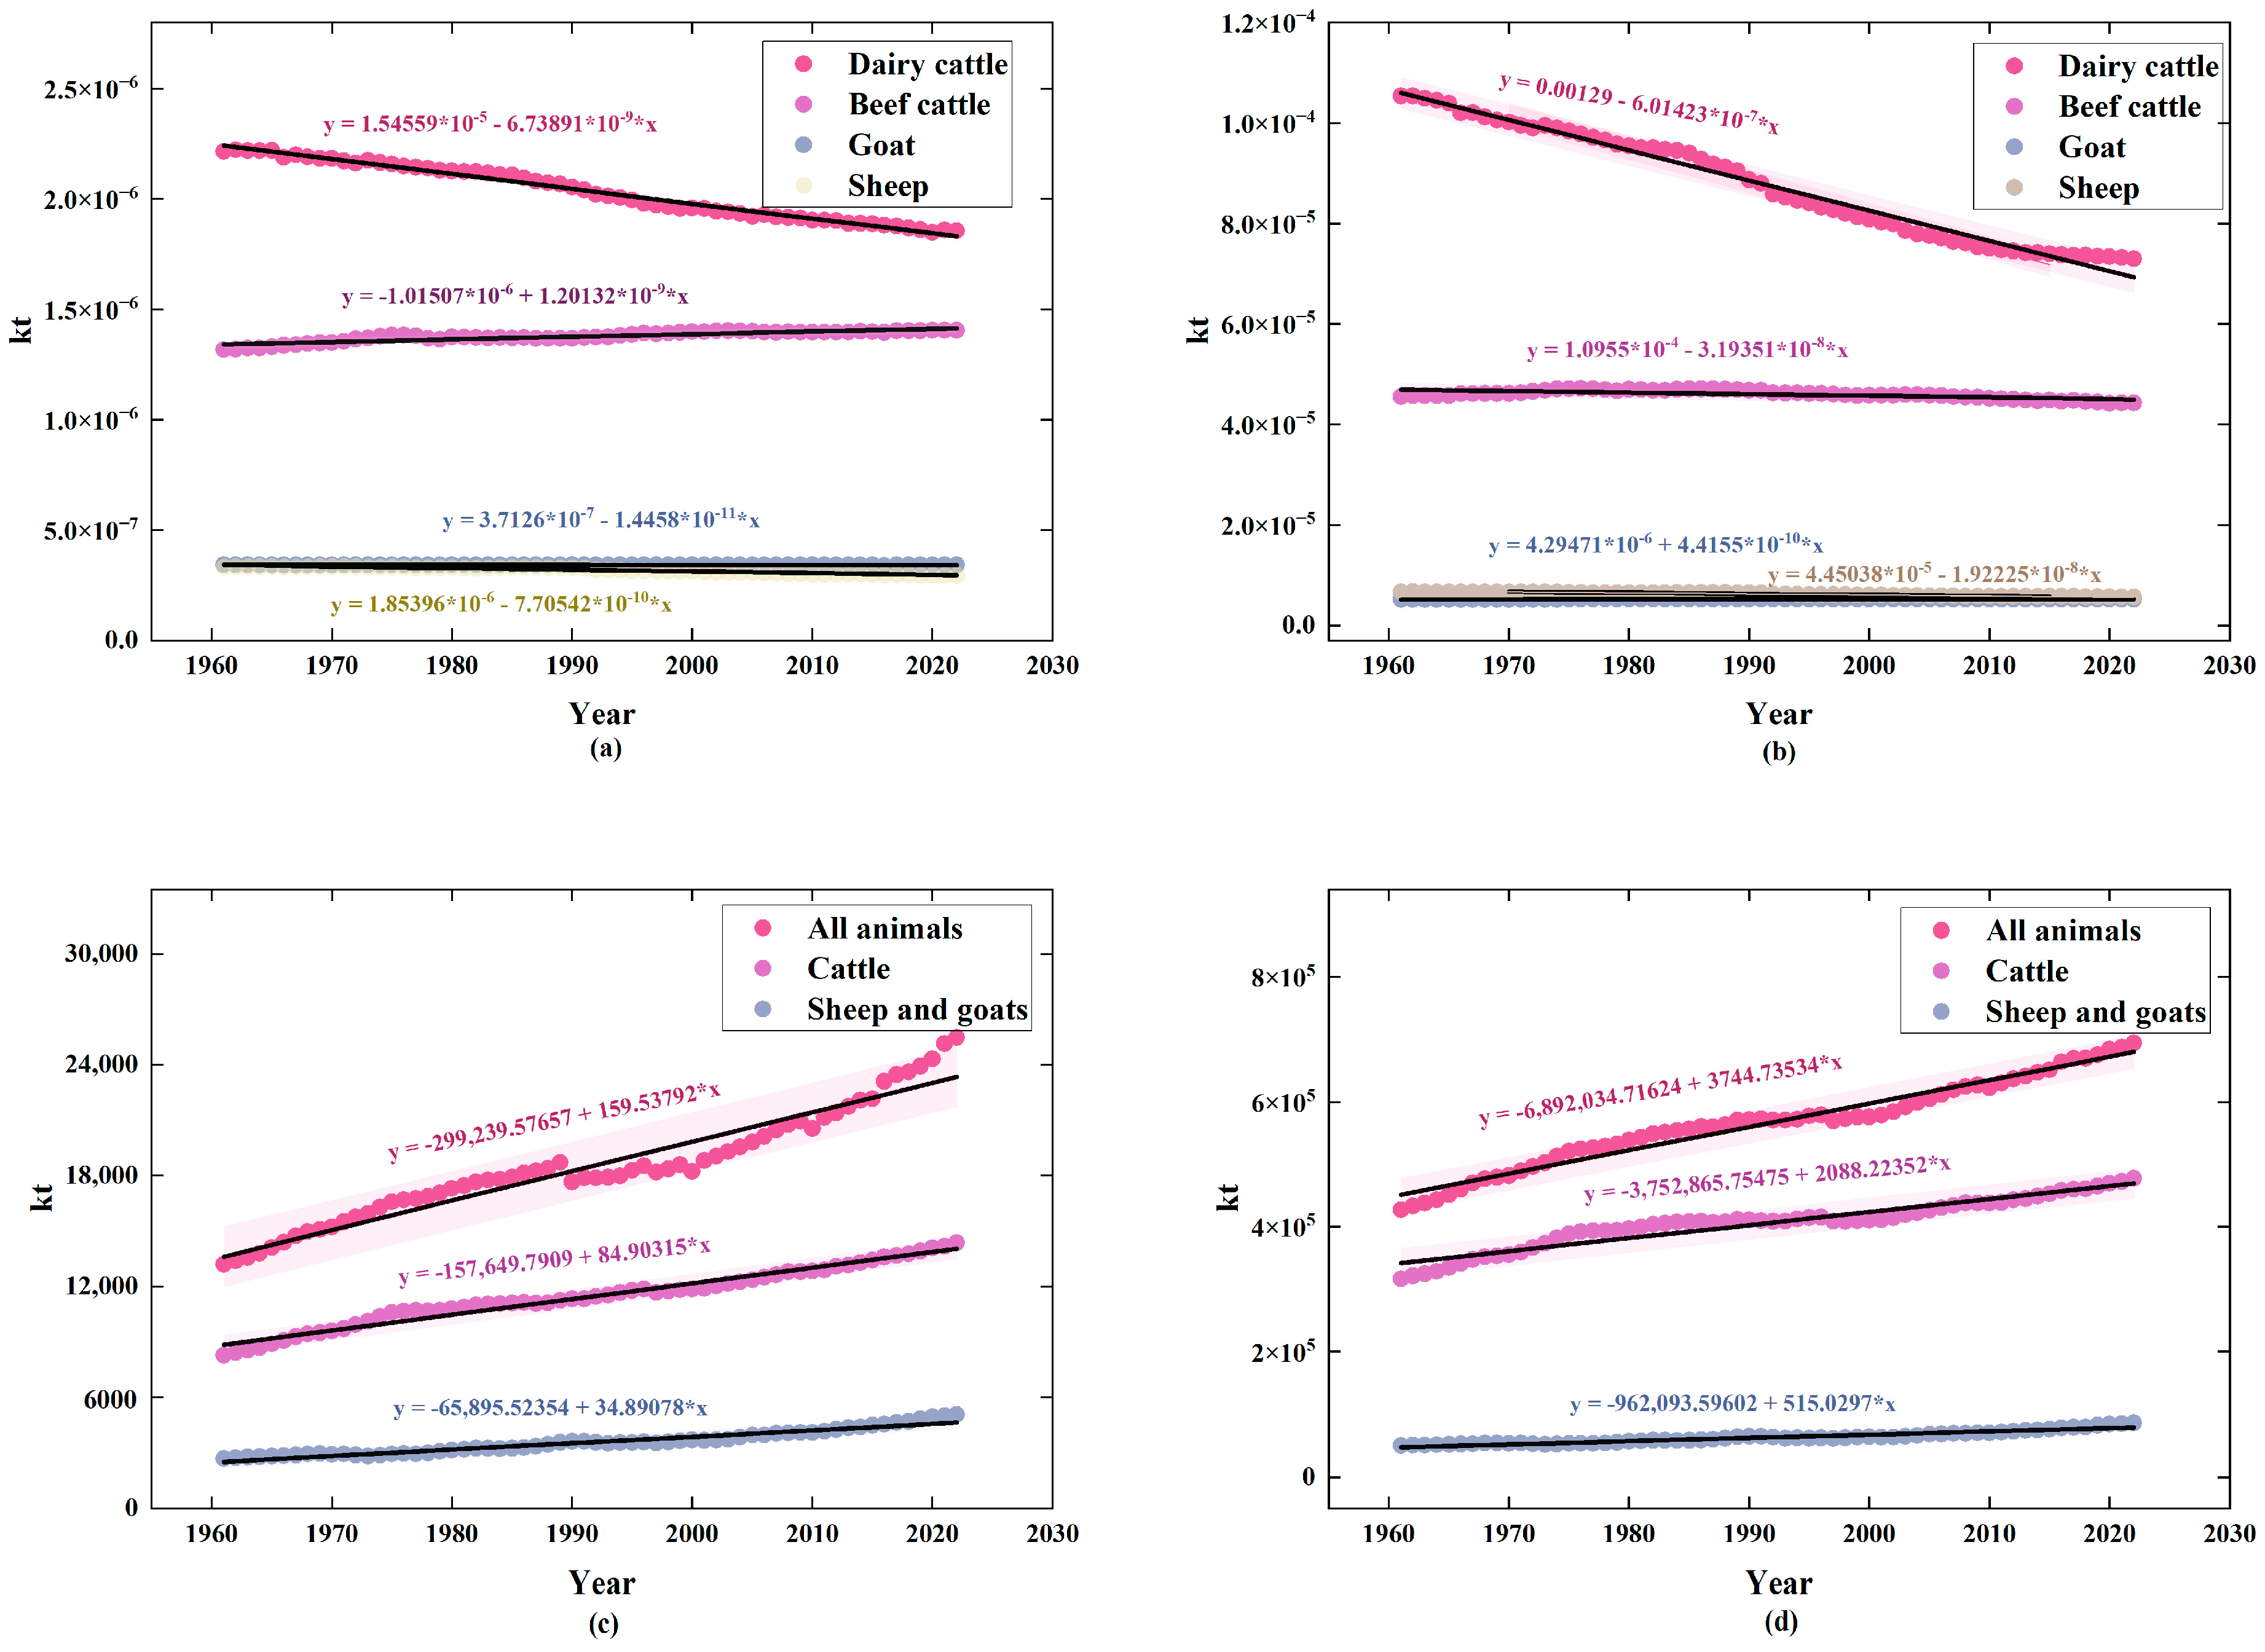
3.2.2. Emissions from Livestock Production

With regard to livestock emissions, cattle were the most significant contributors of GHG emissions, producing high levels of both N2O and CH4 (Figure 4), while sheep and goats had a smaller impact. The data also indicate that as the number of farms increased, associated emissions rose accordingly.
In terms of emissions per unit of livestock, dairy cows and beef cattle exhibited the highest emission intensities and were key targets for emission reduction strategies (Figure 4a,b). Among them, dairy cows showed a significant decrease in both N2O and CH4 emissions, suggesting improvements in feeding practices and management efficiency had improved rapidly and that efficient emission reductions had been achieved. In contrast, beef cattle as well as sheep and goats exhibited only minor or insignificant changes, indicating that current mitigation measures had limited impact on emission reductions.

3.3. Influencing Factors of GHG Emissions

According to the livestock emissions importance ranking, the impact of manure emissions from beef cattle was the largest (Figure 5). The proportion of manure from beef cattle reached 10.75%. Given that beef cattle make up the largest proportion of livestock, managing their manure emissions effectively is a critical priority. Emissions from pigs, sheep and goats, and dairy cows had a relatively low impact compared to beef cattle. Manure from pigs accounted for 9.82%, while manure from sheep and goats accounted for 10.03%. However, with the rapid increase in goat farming, emissions from goats and other smaller livestock remained insufficiently studied, and addressing fecal emissions from goats represents a growing challenge
Results from the structural equation modeling indicate that manure discharge was influenced by the number of cattle and buffalo to the extent of 0.5. In comparison, the effect of sheep and goats was affected to the extent of 0.21, and pigs to the extent of 0.1.
From a crop production perspective, maize, potatoes, and rice were the three most emission-intensive crops (Figure 6). In the rankings of importance of the influencing factors, nitrogen fertilizer use and the maize yield ranked highest in terms of plantation emissions. The importance of nitrogen fertilizer use and maize yield reached 11.84% and 11.70% of total importance, respectively. The importance of potato production was 10.21%, and that of rice production was 9.25%.
According to the results of the structural equation modeling, maize production had the largest impact on crop emissions with 0.023, potato production had the second largest impact with 0.021, and rice production had the smallest impact of the three with 0.007 (Figure 5).

4. Discussion

Despite global climate change mitigation initiatives, effective emission reductions in the sector remains a major challenge [22]. This highlights the need for more aggressive and targeted strategies to mitigate emissions and transition to a low-carbon agricultural system [14,15]. To effectively reduce emissions [16], policymakers should adopt context-specific approaches that account for regional and crop-specific differences.

4.1. Cultivation Emissions

Data from this study reveal that there is a correlation between crop yield and GHG emissions. Duval, Ehrhardt, and others have also found a correlation between accurate simulations of crop yield and productivity and reliable GHG emission results through simulation studies of GHG emissions from different crops [17,23]. Regarding crop production, it is appropriate to focus on crops with a major impact on yields. As the most important food crop globally, maize has the highest total yield of any planted crop, while potatoes come second in terms of impact. Emission reductions could therefore be targeted at the production of maize and potatoes, reducing emissions while maintaining output. Based on the results of the study, measures can be taken to reduce emissions from these two crops. One of the most effective strategies is targeting nitrogen fertilizer use, and promising targeted measures include the adoption of N2O production inhibitors and the dilution of fertilizers. Other measures can be taken to reduce emissions from rice, such as improving water management in rice paddies. The emission potentials of the three emission measures above are 64, 53, and 45 MtCO2-eq yr−1 [18]. There is still great potential for reducing emissions in agriculture. Many current research results show that there is still much room for improving the efficiency of low-carbon agricultural production in many countries such as China, in terms of increasing agricultural production and reducing carbon emissions. This can be achieved by promoting agricultural conservation tillage, developing carbon trading, and developing technologies such as carbon sequestration and agricultural biomass utilization [24,25,26]. To promote the green and low-carbon development of agriculture, the emission reduction of three crops, namely, maize, potato, and rice, should be strengthened in terms of crop emissions. Emission reduction targets should be promoted according to local conditions, such as plastic film mulching, rice–crab co-culture, and a series of other methods. These methods have been shown to have a high level of effectiveness in reducing emissions [27,28,29]. It is worth noting that return of crop residues to the field has many benefits, such as providing significant amounts of nitrogen, phosphorus, and potassium, thus reducing fertilizer use, and increasing crop residue use helps avoid GHG emissions from residue burning. However, it can also be a source of GHG emissions [29].

4.2. Livestock Emissions

Reducing emissions from the livestock sector is essential to achieving the goal of carbon neutrality. According to the data results, the main source of GHG emissions is enteric fermentation, which has also been identified by Wang et al. [30] as the most important driver of GHG emissions. From an emissions reduction perspective, cattle and buffalo, which are at the height of the emissions impact, are the central to emission reduction strategies. Research results point to two promising options: feed supplements and improvements in feed quality, which have emission reduction potentials of 50–74 and 100–134 MtCO2-eq yr−1 [18]. However, with the rapid rise in the number of goats being farmed, emissions from goats remain insufficiently documented, and the way in which to deal with fecal emissions from goats is an emerging concern. Strengthening the management of cattle and buffalo for manure management, while maintaining the number of cattle in the herd, is a viable direction. Therefore, improving feed and digestibility is recognized as an effective way to improve livestock emissions [31]. To this end, the livestock sector should be targeted with measures such as optimizing feed structure, improving manure management, and adopting crop-livestock re-coupling systems. Among these, crop-livestock re-coupling systems are a promising approach to improving agricultural sustainability by optimizing resource use and minimizing environmental impacts. This approach leverages synergies between the crop and livestock sectors, resulting in more efficient resource recovery [32]. For example, crop residues such as straw can be used as animal feed, and livestock manure can be incorporated into crop fertilizer practices, creating a mutually beneficial cycle. In comparison with other straw treatment methods, the use of straw as livestock feed can reduce GHG emissions by a factor of 375 g/kg [33]. This is an indication of the huge potential of crop–livestock systems for the reduction of the carbon footprint of agricultural systems. Thus, adopting more efficient and environmentally friendly livestock practices is vital to sustainable development.

4.3. Implications and Limitations of This Study

With global temperatures rising, it must be actively addressed. To mitigate the effects of climate change on agricultural production and food security, the FAO has proposed climate-smart agriculture (CSA) [34]. As an emerging model, CSA aims to promote food security and sustainable agriculture [34]. Despite the considerable benefits of CSA, its uptake remains low [35]. As a result, this paper makes the following recommendations to address the tension between increasing agricultural productivity and reducing emissions.
Primarily, agricultural subsidy policies should be adjusted in a timely manner. Regional governments should not just stick to the same policies but should adopt targeted agricultural subsidy policies. For example, in areas similar to China’s ‘sickle bend’ region, where cereal yields are low and ecology is fragile, it is important for policymakers to reduce subsidies for grain cultivation and increase ecological transfer subsidies for coarse grains, weeds, and fallow land [36].
Subsequently, regional governments should encourage research and development of green technologies in agriculture and increase support for the research, development, and deployment of these technologies. For instance, it is possible to provide policy support for green crops and encourage financial institutions to lend to agricultural research and development institutions. Advanced and mature technology research and development requires appropriate technical and financial support so that agricultural producers can increase investment in technology research and development and truly develop local adaptation of sustainable technologies. At the same time, in order to enhance farmer awareness of green production techniques, government departments should actively promote and provide training in green production techniques, including soil testing and fertilizing techniques and green pest control techniques, as well as requiring farmers to use fertilizers and pesticides according to actual conditions [37].
Last but not least, it is important to actively promote access to basic education in rural areas and to more actively bring highly skilled people into the agricultural sector, while respecting and gradually changing the backward cultivation habits of farmers. Examples include the overuse of synthetic fertilizers, the misconception that higher inputs guarantee higher yields, and the reduced use of manure as a fertilizer. These are all important factors in increasing GHG emissions. Through combined efforts in education, policy reform, and financial support, farmers’ attitudes can be changed and more sustainable practices adopted [30]. Similarly, regular technical training and professional seminars will lead to a positive change in farmers’ cultivation habits.
Despite the efforts to integrate long-term data from 234 countries and regions, this paper still faces challenges related to incomplete, inconsistent, or missing data. This leads to some bias or uncertainty in the analysis results. At the same time, this paper only considers the most influential factors in the analysis process, and some complex factors are simplified. For example, the relationship between crop yield and emissions can be influenced by various factors such as climate, soil, planting technology, etc., while this study focuses mainly on key factors such as fertilizer use. In addition, there are significant differences in agricultural production conditions, cropping patterns, and farming practices between countries and regions. For example, Latin America, the Caribbean, Russia, and the OECD countries combined accounted for about 36% and 24% of the world’s cattle and sheep populations, respectively, in 2004 [38]. However, rice production and biomass burning are the largest contributors to agricultural carbon emissions in developing countries, accounting for 10.1% of total agricultural emissions [39]. From this perspective, more feasible emission reduction pathways and measures that account for the unique constraints and opportunities of different countries and regions.

5. Conclusions

The study demonstrates that agricultural emissions are closely linked to specific production drivers. Maize production has the largest impact on crop emissions (0.023), followed by potato (0.021) and rice (0.007). Notably, these three crops account for substantial portions of total crop-related emissions, with maize contributing 11.70%, potatoes (Solanum tuberosum L.) 10.21%, and rice 9.25%. Manure discharge is primarily influenced by the number of cattle and buffaloes, with a path coefficient of 0.55. In comparison, sheep and goats had an effect of 0.21, while pigs had an effect of 0.1. Among these, the impact of manure emissions from cattle was the largest. The share of cattle manure was 10.75%, pig manure was 9.82%, and sheep and goat manure was 10.03%. These findings provide valuable insights for realizing low-carbon sustainable development. To reduce emissions, effective methods such as mulching, rice–crab co-cultivation, and returning crop residues to the field can be used. Considering the different agricultural structures and developments in different regions, various policies need to be implemented according to regional agricultural production. To promote the development of green agriculture, we should encourage farmers to use green production methods and increase investment in scientific research, as well as encourage farmers to adopt environmentally friendly production techniques suited to their regional conditions. Future research could be carried out to further analyze the factors influencing agricultural emissions in different production scenarios and to develop recommendations for specific regions accordingly.

Author Contributions

Conceptualization, S.Z. and H.Z.; methodology, S.Z., B.L., J.W., D.J. and H.Z.; software, S.Z.; validation, S.Z. and H.Z.; formal analysis, S.Z.; investigation, H.Z.; resources, S.Z. and H.Z.; data curation, S.Z.; writing—original draft, S.Z.; writing—review and editing, S.Z., B.L., J.W., D.J. and H.Z.; visualization, H.Z.; supervision, H.Z.; project administration, H.Z.; funding acquisition, H.Z. All authors have read and agreed to the published version of the manuscript.

Funding

This research received no external funding.

Data Availability Statement

GHG emissions and agricultural activities data were obtained from FAOSTAT at https://www.fao.org/faostat/en/#data (accessed on 23 October 2024).

Conflicts of Interest

The authors declare no conflicts of interest.

Abbreviations

The following abbreviations are used in this manuscript:
GHGGreenhouse gas
IPCCIntergovernmental Panel on Climate Change
FAOFood and Agriculture Organization of the United Nations
RFERecursive feature elimination
PCAPrincipal component analysis
RFRRandom forest regression
CSAClimate-smart agriculture
OECDOrganization for Economic Co-operation and Development
CNDMLCattle non-dairy manure left on pasture that volatilizes (N content), kg
CNDMACattle non-dairy manure applied to soils that leaches (N content), kg
AALAll animal losses from manure treated (N content), kg
AAMLAll animal manure left on pasture that volatilizes (N content), kg
AAMMAll animal manure management (manure treated, N content), kg
SGMASheep and goat manure applied to soils (N content), kg
SPSSwine/pig stocks, An
CBSCattle and buffalo stocks, An
CDMLCattle dairy manure left on pasture that volatilizes (N content), kg
CDAECattle dairy amount excreted in manure (N content), kg
NNNutrient nitrogen N (total) use per capita, kg/cap
MCYMaize (corn) yield, kg/ha
AAAgriculture area, 1000 ha
PYPotatoes yield, kg/ha
PKAUNutrient potash K2O (total) agricultural use, t
NNAUNutrient nitrogen N (total) agricultural use, t
RAHRice area harvested, ha
PYRice yield, kg/ha
PPCANutrient phosphate P2O5 (total) use per area of cropland, kg/ha
PKCANutrient potash K2O (total) use per area of cropland, kg/ha

References

  1. Anderegg, W.R.; Trugman, A.T.; Badgley, G.; Anderson, C.M.; Bartuska, A.; Ciais, P.; Cullenward, D.; Field, C.B.; Freeman, J.; Goetz, S.J. Climate-driven risks to the climate mitigation potential of forests. Science 2020, 368, eaaz7005. [Google Scholar] [CrossRef] [PubMed]
  2. Tubiello, F.N.; Salvatore, M.; Ferrara, A.F.; House, J.; Federici, S.; Rossi, S.; Biancalani, R.; Condor Golec, R.D.; Jacobs, H.; Flammini, A. The contribution of agriculture, forestry and other land use activities to global warming, 1990–2012. Glob. Change Biol. 2015, 21, 2655–2660. [Google Scholar] [CrossRef]
  3. FAO. Name of Database: FAOSTAT; FAO: Rome, Italy, 2024. [Google Scholar]
  4. Wang, Z.; Deng, X.; Bai, Y.; Chen, J.; Zheng, W. Land use structure and emission intensity at regional scale: A case study at the middle reach of the Heihe River basin. Appl. Energy 2016, 183, 1581–1593. [Google Scholar] [CrossRef]
  5. Smith, P.; Martino, D.; Cai, Z.; Gwary, D.; Janzen, H.; Kumar, P.; McCarl, B.; Ogle, S.; O’Mara, F.; Rice, C. Greenhouse gas mitigation in agriculture. Philos. Trans. R. Soc. B Biol. Sci. 2008, 363, 789–813. [Google Scholar] [CrossRef]
  6. Nayak, D.; Saetnan, E.; Cheng, K.; Wang, W.; Koslowski, F.; Cheng, Y.-F.; Zhu, W.Y.; Wang, J.-K.; Liu, J.-X.; Moran, D. Management opportunities to mitigate greenhouse gas emissions from Chinese agriculture. Agric. Ecosyst. Environ. 2015, 209, 108–124. [Google Scholar] [CrossRef]
  7. Tian, Y.; Zhang, J.; Li, B. Agricultural carbon emissions in China: Calculation, spatial-temporal comparison and decoupling effects. Resour. Sci. 2012, 34, 2097–2105. [Google Scholar]
  8. Johnson, J.M.-F.; Franzluebbers, A.J.; Weyers, S.L.; Reicosky, D.C. Agricultural opportunities to mitigate greenhouse gas emissions. Environ. Pollut. 2007, 150, 107–124. [Google Scholar] [CrossRef]
  9. Smith, P.; Powlson, D.S.; Smith, J.U.; Falloon, P.; Coleman, K. Meeting Europe’s climate change commitments: Quantitative estimates of the potential for carbon mitigation by agriculture. Glob. Change Biol. 2000, 6, 525–539. [Google Scholar] [CrossRef]
  10. Vlek, P.L.; Rodríguez-Kuhl, G.; Sommer, R. Energy use and CO2 production in tropical agriculture and means and strategies for reduction or mitigation. Environ. Dev. Sustain. 2004, 6, 213–233. [Google Scholar] [CrossRef]
  11. Chen, B.; He, G.; Qi, J.; Su, M.; Zhou, S.; Jiang, M. Greenhouse Gas Inventory of a Typical High-End Industrial Park in China. Sci. World J. 2013, 2013, 717054. [Google Scholar] [CrossRef]
  12. Lal, R. Farming systems for global issues of the 21st Century. Farming Syst. 2024, 2, 100113. [Google Scholar] [CrossRef]
  13. Ciais, P.; Sabine, C.; Bala, G.; Bopp, L.; Brovkin, V.; Canadell, J.; Chhabra, A.; DeFries, R.; Galloway, J.; Heimann, M. Carbon and other biogeochemical cycles. In Climate Change 2013: The Physical Science Basis. Contribution of Working Group I to the Fifth Assessment Report of the Intergovernmental Panel on Climate Change; Cambridge University Press: Cambridge, UK, 2013. [Google Scholar]
  14. Wu, S.; Chen, X. Research on the impact of fiscal environmental protection expenditure on agricultural carbon emissions. Front. Environ. Sci. 2023, 11, 1252787. [Google Scholar] [CrossRef]
  15. Balsalobre-Lorente, D.; Driha, O.M.; Bekun, F.V.; Osundina, O.A. Do agricultural activities induce carbon emissions? The BRICS experience. Environ. Sci. Pollut. Res. 2019, 26, 25218–25234. [Google Scholar] [CrossRef] [PubMed]
  16. Chen, X.; Shuai, C.; Wu, Y.; Zhang, Y. Analysis on the carbon emission peaks of China’s industrial, building, transport, and agricultural sectors. Sci. Total Environ. 2020, 709, 135768. [Google Scholar] [CrossRef]
  17. Duval, B.D.; Anderson-Teixeira, K.J.; Davis, S.C.; Keogh, C.; Long, S.P.; Parton, W.J.; DeLucia, E.H. Predicting greenhouse gas emissions and soil carbon from changing pasture to an energy crop. PLoS ONE 2013, 8, e72019. [Google Scholar] [CrossRef]
  18. Chen, M.; Cui, Y.; Jiang, S.; Forsell, N. Toward carbon neutrality before 2060: Trajectory and technical mitigation potential of non-CO2 greenhouse gas emissions from Chinese agriculture. J. Clean. Prod. 2022, 368, 133186. [Google Scholar] [CrossRef]
  19. Fellmann, T.; Witzke, P.; Weiss, F.; Van Doorslaer, B.; Drabik, D.; Huck, I.; Salputra, G.; Jansson, T.; Leip, A. Major challenges of integrating agriculture into climate change mitigation policy frameworks. Mitig. Adapt. Strateg. Glob. Change 2018, 23, 451–468. [Google Scholar] [CrossRef]
  20. Frank, S.; Beach, R.; Havlík, P.; Valin, H.; Herrero, M.; Mosnier, A.; Hasegawa, T.; Creason, J.; Ragnauth, S.; Obersteiner, M. Structural change as a key component for agricultural non-CO2 mitigation efforts. Nat. Commun. 2018, 9, 1060. [Google Scholar] [CrossRef]
  21. Li, L.; Awada, T.; Shi, Y.; Jin, V.L.; Kaiser, M. Global Greenhouse Gas Emissions from Agriculture: Pathways to Sustainable Reductions. Glob. Change Biol. 2025, 31, e70015. [Google Scholar] [CrossRef]
  22. Zhang, L.; Pang, J.; Chen, X.; Lu, Z. Carbon emissions, energy consumption and economic growth: Evidence from the agricultural sector of China’s main grain-producing areas. Sci. Total Environ. 2019, 665, 1017–1025. [Google Scholar] [CrossRef]
  23. Ehrhardt, F.; Soussana, J.F.; Bellocchi, G.; Grace, P.; McAuliffe, R.; Recous, S.; Sándor, R.; Smith, P.; Snow, V.; de Antoni Migliorati, M. Assessing uncertainties in crop and pasture ensemble model simulations of productivity and N2O emissions. Glob. Change Biol. 2018, 24, e603–e616. [Google Scholar] [CrossRef] [PubMed]
  24. Smith, P.; Martino, D.; Cai, Z.; Gwary, D.; Janzen, H.; Kumar, P.; McCarl, B.; Ogle, S.; O’Mara, F.; Rice, C. Policy and technological constraints to implementation of greenhouse gas mitigation options in agriculture. Agric. Ecosyst. Environ. 2007, 118, 6–28. [Google Scholar] [CrossRef]
  25. Kuhn, N.J.; Hu, Y.; Bloemertz, L.; He, J.; Li, H.; Greenwood, P. Conservation tillage and sustainable intensification of agriculture: Regional vs. global benefit analysis. Agric. Ecosyst. Environ. Pollut. 2016, 216, 155–165. [Google Scholar] [CrossRef]
  26. Kassam, A.; Friedrich, T.; Derpsch, R. Global spread of conservation agriculture. Int. J. Environ. Stud. 2019, 76, 29–51. [Google Scholar] [CrossRef]
  27. Bashir, M.A.; Xu, Y.; Wang, H.; Zhang, Y.; Sun, W.; Aon, M.; Zhang, X.; Rehim, A.; Liu, H. Integrated rice-crab co-culture system shows capability to reduce greenhouse gases emission and global warming potential. Aquaculture 2025, 598, 742047. [Google Scholar] [CrossRef]
  28. Huang, Y.; Qin, R.; Wei, H.; Chai, N.; Yang, Y.; Li, Y.; Wan, P.; Li, Y.; Zhao, W.; Lawawirojwong, S. Plastic film mulching application improves potato yields, reduces ammonia emissions, but boosts the greenhouse gas emissions in China. J. Environ. Manag. 2024, 353, 120241. [Google Scholar] [CrossRef]
  29. Li, H.; Dai, M.; Dai, S.; Dong, X. Current status and environment impact of direct straw return in China’s cropland–A review. Ecotoxicol. Environ. Saf. 2018, 159, 293–300. [Google Scholar] [CrossRef]
  30. Wang, W.; Deng, X.; Wang, Y. Changes in non-CO2 greenhouse gas emissions from livestock production, meat consumption and trade in China. Sustain. Prod. Consum. 2023, 42, 281–291. [Google Scholar] [CrossRef]
  31. Herrero, M.; Henderson, B.; Havlík, P.; Thornton, P.K.; Conant, R.T.; Smith, P.; Wirsenius, S.; Hristov, A.N.; Gerber, P.; Gill, M. Greenhouse gas mitigation potentials in the livestock sector. Nat. Clim. Change 2016, 6, 452–461. [Google Scholar] [CrossRef]
  32. Cai, Y.; Zhang, F.; Deng, X. Recoupled crop-livestock system can potentially reduce agricultural greenhouse gas emissions by over 40% in China. Environ. Impact Assess. Rev. 2025, 112, 107756. [Google Scholar] [CrossRef]
  33. Shi, W.; Fang, Y.R.; Chang, Y.; Xie, G.H. Toward sustainable utilization of crop straw: Greenhouse gas emissions and their reduction potential from 1950 to 2021 in China. Resour. Conserv. Recycl. 2023, 190, 106824. [Google Scholar] [CrossRef]
  34. Sardar, A.; Kiani, A.K.; Kuslu, Y. Does adoption of climate-smart agriculture (CSA) practices improve farmers’ crop income? Assessing the determinants and its impacts in Punjab province, Pakistan. Environ. Dev. Sustain. 2021, 23, 10119–10140. [Google Scholar] [CrossRef]
  35. Zakaria, A.; Alhassan, S.I.; Kuwornu, J.K.; Azumah, S.B.; Derkyi, M.A. Factors influencing the adoption of climate-smart agricultural technologies among rice farmers in northern Ghana. Earth Syst. Environ. Dev. Sustain. 2020, 4, 257–271. [Google Scholar] [CrossRef]
  36. Zhang, Z.; Chen, Y.-H.; Mishra, A.K.; Ni, M. Effects of agricultural subsidy policy adjustment on carbon emissions: A quasi-natural experiment in China. J. Clean. Prod. 2025, 487, 144603. [Google Scholar] [CrossRef]
  37. Liu, M.; Liu, H. Farmers’ adoption of agriculture green production technologies: Perceived value or policy-driven? Heliyon 2024, 10, e23925. [Google Scholar] [CrossRef]
  38. United States Environmental Protection Agency. Global Anthropogenic Non-CO2 Greenhouse Gas Emissions: 1990–2020; United States Environmental Protection Agency: Washington, DC, USA, 2006.
  39. Meijide, A.; Gruening, C.; Goded, I.; Seufert, G.; Cescatti, A. Water management reduces greenhouse gas emissions in a Mediterranean rice paddy field. Agric. Ecosyst. Environ. 2017, 238, 168–178. [Google Scholar] [CrossRef]
Figure 1. Global trends in crops, livestock, and land over time. Crop harvested area (a), crop total production (b), livestock stock (c), fertilizer application (unit area) (d), fertilizer application (unit population) (e), and cropland usage (f).
Agronomy 15 01336 g001
Figure 2. Trends in N2O emissions from three major crops. Crop N2O emissions (a), N2O emissions (unit area) (b), and N2O emissions (unit tonnes) (c).
Agronomy 15 01336 g002
Figure 3. Trends in CH4 emissions from rice. Crop CH4 emissions (a), CH4 emissions (unit area) (b), and CH4 emissions (unit tonnes) (c).
Agronomy 15 01336 g003
Figure 4. Trends in global crop emissions over time. N2O emissions (per livestock) (a), CH4 emissions (per livestock) (b), livestock N2O emissions (c), and livestock CH4 emissions (d).
Agronomy 15 01336 g004
Figure 5. Structural equation modelling of crop emissions in relation to major crop yields and fertilizer use. The numbers next to the directed line segments indicate the path coefficients; * indicates p-value < 0.05, *** indicates p-value < 0.001.
Agronomy 15 01336 g005
Figure 6. Top features importance for emission from livestock (CO2eq) (a) and top features importance for emission from crop (CO2eq) (b). The left abbreviation corresponds to the following features: nutrient nitrogen N (total) use per capita, kg/cap: NN; maize (corn) yield, kg/ha: CNDMA; all animal losses from manure treated (N content), kg: AAL; all animal manure left on pasture that volatilizes (N content), kg: AAML; all animal manure management (manure treated, N content), kg: AAMM; sheep and goat manure applied to soils (N content), kg; SGMA, swine/pig stocks, An: SPS; cattle and buffalo stocks, An: CBS; cattle dairy manure left on pasture that volatilizes (N content), kg: CDML; cattle dairy amount excreted in manure (N content), kg: CDAE, MCY; agriculture area, 1000 ha: AA; potato yield, kg/ha: PY; nutrient potash K2O (total) agricultural use, t: PKAU; nutrient nitrogen N (total) agricultural use, t: NNAU; rice area harvested, ha: RAH; rice yield, kg/ha: RY; nutrient phosphate P2O5 (total) use per area of cropland, kg/ha: PPCA; nutrient potash K2O (total) use per area of cropland, kg/ha: PKCA.
Agronomy 15 01336 g006
Disclaimer/Publisher’s Note: The statements, opinions and data contained in all publications are solely those of the individual author(s) and contributor(s) and not of MDPI and/or the editor(s). MDPI and/or the editor(s) disclaim responsibility for any injury to people or property resulting from any ideas, methods, instructions or products referred to in the content.

