Article

Characterization of Selenium Enrichment in Soybean and Its Relationship with Rhizosphere Microbial Communities in Se-Enriched Saline Soil

1
College of Resources and Environment, Xinjiang Agricultural University, Urumqi 830052, China
2
The Green Production Engineering Technology Research Center of Xinjiang Planting Industry, Urumqi 830052, China
3
Xinjiang Key Laboratory of Soil and Plant Ecological Processes, Urumqi 830052, China
4
Xinjiang Engineering Technology Research Center of Soil Big Data, Urumqi 830052, China
5
College of Resources and Environment, Huazhong Agricultural University, Wuhan 430070, China
*
Author to whom correspondence should be addressed.
Agronomy 2025, 15(6), 1320; https://doi.org/10.3390/agronomy15061320
Submission received: 21 April 2025 / Revised: 24 May 2025 / Accepted: 26 May 2025 / Published: 28 May 2025
(This article belongs to the Section Soil and Plant Nutrition)

Abstract

:
Selenium (Se) is an essential trace element for the human body, primarily obtained from dietary sources. The unique characteristics of Se-enriched saline–alkali soils provide valuable insights into how plants absorb and accumulate Se. The present study collected and analyzed soybean plants and rhizosphere soil samples from typical Se-enriched saline–alkali areas in Xinjiang, China to investigate how Se-enriched saline–alkali soil and the associated rhizosphere microbial community influence Se absorption in soybeans. Soybean seeds were the primary site of Se accumulation, with the Se content in the seeds being significantly correlated with that in roots (R2 = 0.4926). The Se content in soybean roots and seeds increased with the total Se soil content, and a significant correlation was observed between them. Additionally, the available Se content in the soil was significantly correlated with the total Se content (R2 = 0.4589). Soil factors such as Na+ concentration, pH, and organic matter (OM) were found to influence the structure of the microbial communities. Furthermore, higher abundances of Proteobacteria, Bacteroidota, and Bacillota in the soil were found to mitigate salt stress and enhance Se absorption in soybean plants. Thus, the rhizosphere microbial community significantly enhances soybean Se uptake. This study provides valuable insights into the mechanisms of Se accumulation in soybeans cultivated in Se-rich soils and offers guidance for cultivating Se-enriched crops. However, this study failed to quantify the differential impacts of different Se forms, such as selenite (SeO42−) and selenate (SeO32−), on microorganisms and plants. Future research should incorporate a detailed analysis of different Se forms to provide more in-depth insights into these complex interactions.

1. Introduction

Selenium (Se) is an essential trace element for the human body, where it plays a critical role in various physiological functions, including antioxidant activity, enhancement of immune function, and cancer prevention [1,2]. While Se effectively improves the body’s antioxidant capacity, excessive intake can lead to selenosis [3], whereas Se deficiency may cause various diseases, such as Keshan disease and rickets [4,5]. Approximately 85% of the daily Se intake in humans is derived directly or indirectly from plants. Crops are the primary food source for humans, and they accumulate Se from the soil, which then enters the human body through the food chain, fulfilling the body’s needs for growth, development, immune function, and other physiological processes [6].
In addition to being an essential trace element for the human body, Se is also a beneficial element for crops [7,8]. Within a single plant, significant differences exist in the ability of various tissues to accumulate Se. The efficiency of Se uptake and utilization by plants is influenced by several factors, including the soil Se concentration, the chemical form in which Se is present, and the soil’s other characteristics [9]. Chilimba et al. demonstrated that plants utilize different forms of Se more efficiently when it occurs at elevated concentrations in the soil [10]. Additionally, soil pH plays a critical role in the uptake of Se by plants. In alkaline soils, Se primarily occurs in the form of selenate (SeO42−), whereas in acidic and neutral soils, it predominantly occurs as selenite (SeO32−). As soil pH increases, more Se is lost from the soil [11] and a significant improvement in Se uptake efficiency by plants occurs as the soil approaches a neutral pH [12]. In contrast, soil organic matter can slowly release Se bound to soil particles through degradation. Therefore, when the soil contains high levels of organic matter, the amount of available Se for plant absorption can be correspondingly high [13].
The bioavailability of Se in plants and its translocation within plants are also influenced by soil microorganisms [14]. Microorganisms are often regarded as containing the “second genome” of plants and play a crucial role in plant growth, development, and health [15]. The inter-root zone, the site of the most direct plant–soil–microorganism material exchange, is critical to interactions between microorganisms and plants [16]. Rhizosphere microorganisms regulate soil nutrient content and availability by participating in organic carbon metabolism and nitrogen, phosphorus, and sulfur cycling [17,18]. They maintain a complex relationship with plants, contributing to mutually beneficial symbiosis through growth-promoting mechanisms and competitive effects that influence plant growth [19,20]. Additionally, the physicochemical properties of soil (e.g., pH, water content, and nutrient availability) significantly impact the diversity and composition of soil microbial communities [21,22,23]. Therefore, comparing the structure of inter-root microbial communities in crops and identifying the factors that drive their composition could enhance our understanding of soil microbial diversity and ecosystem functioning, providing empirical support for the improved cultivation of Se-enriched crops.
Soybean is among the most widely grown crops globally, as its seeds are rich in key nutrients such as proteins, fats, and vitamins [24]. This makes it a key source of high-quality protein and lipid nutrients for both humans and livestock [25]. Additionally, soybeans have demonstrated the ability to absorb and accumulate Se [26], crucial in facilitating Se absorption in the human body [25]. Xinjiang, located in northwestern China, is a major producer of soybeans; however, its soils are arid and heavily salinized. In 2023, the Xinjiang Geological Survey found that 20,260 km2 of Se-enriched land occurs in Xinjiang, concentrated in five regions: Shihezi, Yili Basin, Aksu, Kashgar, and Yanqi Basin. It has been reported that salt stress impairs plant photosynthesis. In saline soils, excess salts form a crust on the surface, thus reducing soil permeability and affecting crop uptake of water and nutrients [27]. Moreover, salinization leads to the formation of precipitates between selenates and soil ions, such as calcium and magnesium, which reduces Se bioavailability and, therefore, limits the amount of Se available to the plant [27]. However, many studies have shown that the application of Se fertilizer has enhanced the nitrogen-fixing ability of leguminous plants [28,29]. The abundance of rhizosphere soil bacteria related to the soil nitrogen cycle process, such as rhizobia and nitrifying bacteria, has also increased [30,31].
At present, numerous studies have focused on the Se enrichment characteristics of different plant parts, primarily analyzing potted plants and the exogenous addition of selenate or selenite [6,32,33,34,35]. However, the Se-enriched crops identified in these studies may not be suitable for Se-enriched agricultural production in specific regions. Qin et al. [36] investigated the distribution of Se in various organs of crops grown in Se-enriched soils. Nonetheless, there is limited research on the characterization of Se enrichment in different crop parts cultivated in Se-enriched saline soils. By collecting soybean crops and their rhizosphere soils from various plots with Se-enriched saline–alkali soil, this study has investigated the characteristics of Se accumulation in soybean and the interaction between the soybean rhizosphere microbial communities and Se. This research is crucial for understanding the biological mechanisms underlying Se enrichment in soybeans within Se-enriched saline–alkali soil environments and improving the nutritional value of Se-enriched agricultural products.
Se application has been demonstrated to enhance plant tolerance to various abiotic stresses, including drought, salinity, and heavy metals [37,38,39,40]. Therefore, this study hypothesizes that in the Se-enriched saline–alkali soil environment of Xinjiang, China, the bioavailability of Se will not only promote soybean growth and stress resistance but also enhance Se uptake and translocation efficiency by modulating the rhizosphere microbial community structure. Building upon these hypotheses, the objectives of this study were as follows: (1) to examine the Se enrichment characteristics of soybeans planted in Se-rich saline areas of Xinjiang, China; (2) to explore the Se enrichment capacity of various crop organs by analyzing the Se uptake in these organs and their correlations; (3) to identify the soil physical and chemical factors and key microorganisms that affect the availability of soil Se, based on 16S rRNA amplicon sequencing.

2. Materials and Methods

2.1. Study Area

From March 2024 to October 2024, soybean field experiments were conducted in nine test plots designated as WA, WB, WC, WD, WE, WF, WG, WH, and WI (In sample naming, the first letter W represents the work location. In addition, based on the differences in soil Se sampled and tested in different work locations, the second letter is named A, B, C, D, E, F, G, H, and I in ascending order of Se content), located in Buzhan Village, Chuohuoer Town, Chabuchaer Xibe Autonomous County, Ili Kazakh Autonomous Prefecture, Xinjiang Uygur Autonomous Region, China (43.88° to 43.89° N, 81.02° to 81.11° E). The total area of the test fields was 31,333.49 m2. The study site is characterized by a continental north temperate mild arid climate and high levels of heat and sunlight, with an annual total of 2846 h of adequate sunshine. The frost-free period spans 177 days, the average annual air temperature is 8.9 °C, and the average annual precipitation accumulation is 222 mm. The soybean variety planted was ‘Kennong 23’, which has a growth period of 119 days. The entire experimental field was managed uniformly. Sowing occurred on 24 April 2024, with a seeding density of 375,000 seeds per hectare. Seedling emergence occurred on 3 May 2024. On 20 May 2024, during the compound leaf stage, a chemical weed control treatment was applied, comprising a mixture of clethodim (Registration No. PD20097130, Catalog No. HX-CLT-24EC-1L, Anhui Huaxing Chemical Co. Ltd., Ma’anshan, Anhui, China) and bentazone (Registration No. PD20096086, Catalog No. XFS-BTZ-48SL-1L, Anhui Xifengshou Agricultural Technology Co. Ltd., Hefei, Anhui, China), with 30 kg of water per hectare. A total of 10 to 12 irrigation events were conducted during the growing season, with an irrigation volume of 0.6 m3/m2. Drip irrigation using well water is implemented, with irrigation frequency adjusted according to crop growth stages. The irrigation water quality shows a pH of 8.02 and an electrical conductivity (EC) of 1827.33 µS/cm. No fertilizer was applied at planting; instead, seed fertilizer was applied in portions, including 0.03 kg/m2 of urea (XJYH-Urea-46-40KG, Xinjiang Yihua Chemical Co. Ltd., Changji, China; N ≥ 46%), 0.03 kg/m2 of monoammonium phosphate (HST-MAP-12-60-0-25KG, Hubei Haosite Agricultural Technology Co. Ltd., Zhongxiang, China; N-P2O5-K2O: 12-60-0), and 0.015 kg/m2 of potassium sulfate (Sinochem-SOP-51-25KG, Sinochem Modern Agriculture (Xinjiang) Co. Ltd., Urumqi, China; K2O ≥ 51%). Manual weeding was performed to prevent weeds from interfering with soil properties.

2.2. Sample Collection and Processing

A five-point sampling method was used, with material from 10 randomly selected soybean plants per plot combined into one composite sample, and each plot was sampled three times. The soybean plants were uprooted, and after gently shaking the root system to remove larger soil aggregates, the remaining inter-root soil on the surface of each root system was collected using a sterile brush. This soil was regarded as inter-root soil, transferred to centrifuge tubes, and stored under −80 °C conditions. Nine groups of mature soybean plants and corresponding inter-root soil samples were collected from the study area on 10 September 2024. The collected soybean plants were washed twice with tap water to remove soil particles adhering to the plant surfaces, followed by three washes with distilled water. The plants were then dried on filter paper. Roots and stems were separated using stainless steel scissors, and the seeds were manually threshed. The pods and seeds were placed in kraft paper bags for subsequent analysis. In the laboratory, different parts of the soybean plants were placed in an oven, initially dried at 105 °C for 30 min, and then further dried at 75 °C until they had reached a constant weight. After drying, the samples were ground in a mill, passed through a 40-mesh nylon sieve, put into polyethylene bags prior to testing, and stored in a refrigerator at 4 °C. The inter-root soil samples were divided into two parts. One portion was passed through a 2 mm mesh sieve to remove plant residues, stones, and other debris and then air-dried in a clean, ventilated area before being placed in polyethylene bags prior to soil property analysis. The other portion was stored at −80 °C for subsequent microbial sequencing analysis.

2.3. Analytical Test Analyses and Methods

2.3.1. Soil and Plant Composition Assays

The soil pH and electrical conductivity (EC) were measured with a pH meter and conductivity meter, respectively [41]. The soil organic matter content (OM) was determined using the potassium dichromate oxidation–external heating method [42]. The alkaline diffusion method was used to determine the soil’s alkaline nitrogen (AN) content [43]. Olsen’s method was used to measure soil available phosphorus (AP) [44]. The sodium and potassium ion concentrations were analyzed using the flame photometric method (FP6400A) [45].
The determination of Se content in the inter-root soil and various soybean organs was conducted based on previously established methods [46,47]. To determine soil Se content, 0.2 g samples of soil were added to 50 mL beakers, to which were added 10 mL of nitric acid and 2 mL of perchloric acid. Each beaker was heated and covered for digestion until the solution cleared. After cooling, 5 mL of diammonium hydrogen phosphate solution was added. Each mixture was diluted to 50 mL with distilled water, shaken well, and filtered, and the resulting filtrate was collected. Then, 0.00, 0.50, 1.00, 1.50, and 2.00 mL of Se standard solution were transferred into 50 mL volumetric flasks, to which nitric acid and perchloric acid were added. The volume was then adjusted to a standard volume with distilled water and shaken well. The processed sample and standard solutions were analyzed using an atomic fluorescence spectrometer.
To determine the Se content in soybean tissues, 0.5 g samples were each accurately weighed into a triangular flask, and 10 mL of a concentrated nitric acid and per-chloric acid mixture ((HNO3:HCIO4, 4:1) was added. After standing for 12 h, each sample was digested on an electric hot plate until white smoke was emitted, and the digestion solution had become colorless and transparent. The solution was then cooled, diluted with ultrapure water to a final volume of 25 mL, mixed well, and stored for further analysis. The Se content in different soybean organs was then determined by atomic fluorescence spectrometry.

2.3.2. Se Bioconcentration and Translocation Coefficients

The bioconcentration factor (BCF) was calculated by comparing the ratio of total Se content in the crop to the total Se content in the soil. A higher BCF value indicates a plant’s greater Se enrichment capacity [48]. The translocation factor (TF) was used to evaluate the ability of Se to be transferred from the soil to the plant and its subsequent migration between different organs [49]. The formulas for calculating BCF and TF are as follows:
B C F = C c r o p C s o i l
T F = C p a r t s   o f   c r o p C a d j a c e n t   p a r t s   o f   c r o p s
Here, Ccrop and Csoil denote total Se content in the plant and total Se content in the soil, respectively; Cparts of crop and Cadjacent parts of crop denote the total Se content in root/stem/pod/seed organs and total Se content in neighboring organs in the plant, respectively.

2.3.3. DNA Extraction and 16S rRNA Sequencing

Soil microbial DNA was extracted using the Ark Magnetic Bead Method Soil DNA Extraction Kit (DC306-09, Findrop Biosafety Technology Co., Ltd., Guangzhou, China) following the manufacturer’s instructions. The purity and concentration of the DNA were assessed using a Nanodrop One (Thermo Fisher Scientific, Waltham, MA, USA). The V3-V4 region of the bacterial 16S rRNA gene was amplified using primers 515F (ACTCCTACGGGGAGGCAGCA) and 806R (GGACTACHVGGGTWTCTAAT), and the quality of the extracted DNA was evaluated by 1% agarose gel electrophoresis. Library construction was performed according to the standard procedure of the ALFA-SEQ DNA Library Prep Kit (EQ121-02, Findrop Biosafety Technology Co., Ltd., Guangzhou, China). The size of the library fragments was evaluated on a Qsep400 High-Throughput Nucleic Acid Protein Analysis System (Hangzhou Houze Biotechnology Co., Ltd., Hangzhou, China), and the library concentration was measured using the Qubit 4.0 instrument (Thermo Fisher Scientific, Waltham, MA, USA). The constructed amplicon libraries were subjected to PE250 sequenced using the Illumina platform (Illumina Novaseq6000, San Diego, CA, USA), filtered by read splicing, and clustered into operational taxonomic units (OTUs) for species annotation.

2.4. Data Processing and Statistical Analysis

Data were compiled and analyzed using Excel 2021 (Microsoft Corp., Redmond, WA, USA) and SPSS 27.0 (IBM Corp., Armonk, NY, USA). Prior to analysis, the data underwent a normality test (Shapiro–Wilk) and a variance homogeneity test (Levene’s test). The datasets were subjected to analysis of variance (ANOVA), specifically one-way ANOVA followed by Duncan’s multiple range test at the p < 0.05 significance level. Means and standard errors were calculated for each plot. Redundancy analysis (RDA) was performed using CANOCO 5.0 software [50], and microbiome data were visualized using Origin 2025 (OriginLab, Northampton, MA, USA) and R (version 4.4.1; https://cran.r-project.org, accessed on 17 October 2024). Venn diagrams [51] were used to depict the shared and unique OTUs using the package “venn”. The Shannon diversity index and Chao1 diversity index were calculated using the vegan package in R to assess microbial diversity. RDA was conducted using CANOCO 5.0 software to elucidate the relationship between soil Se content, physical and chemical properties, and microbial communities. Additionally, the species abundance heatmap and soil-microbial communities correlation analysis were generated via Bioincloud (https://www.bioincloud.tech, accessed on 20 May 2025).

3. Results

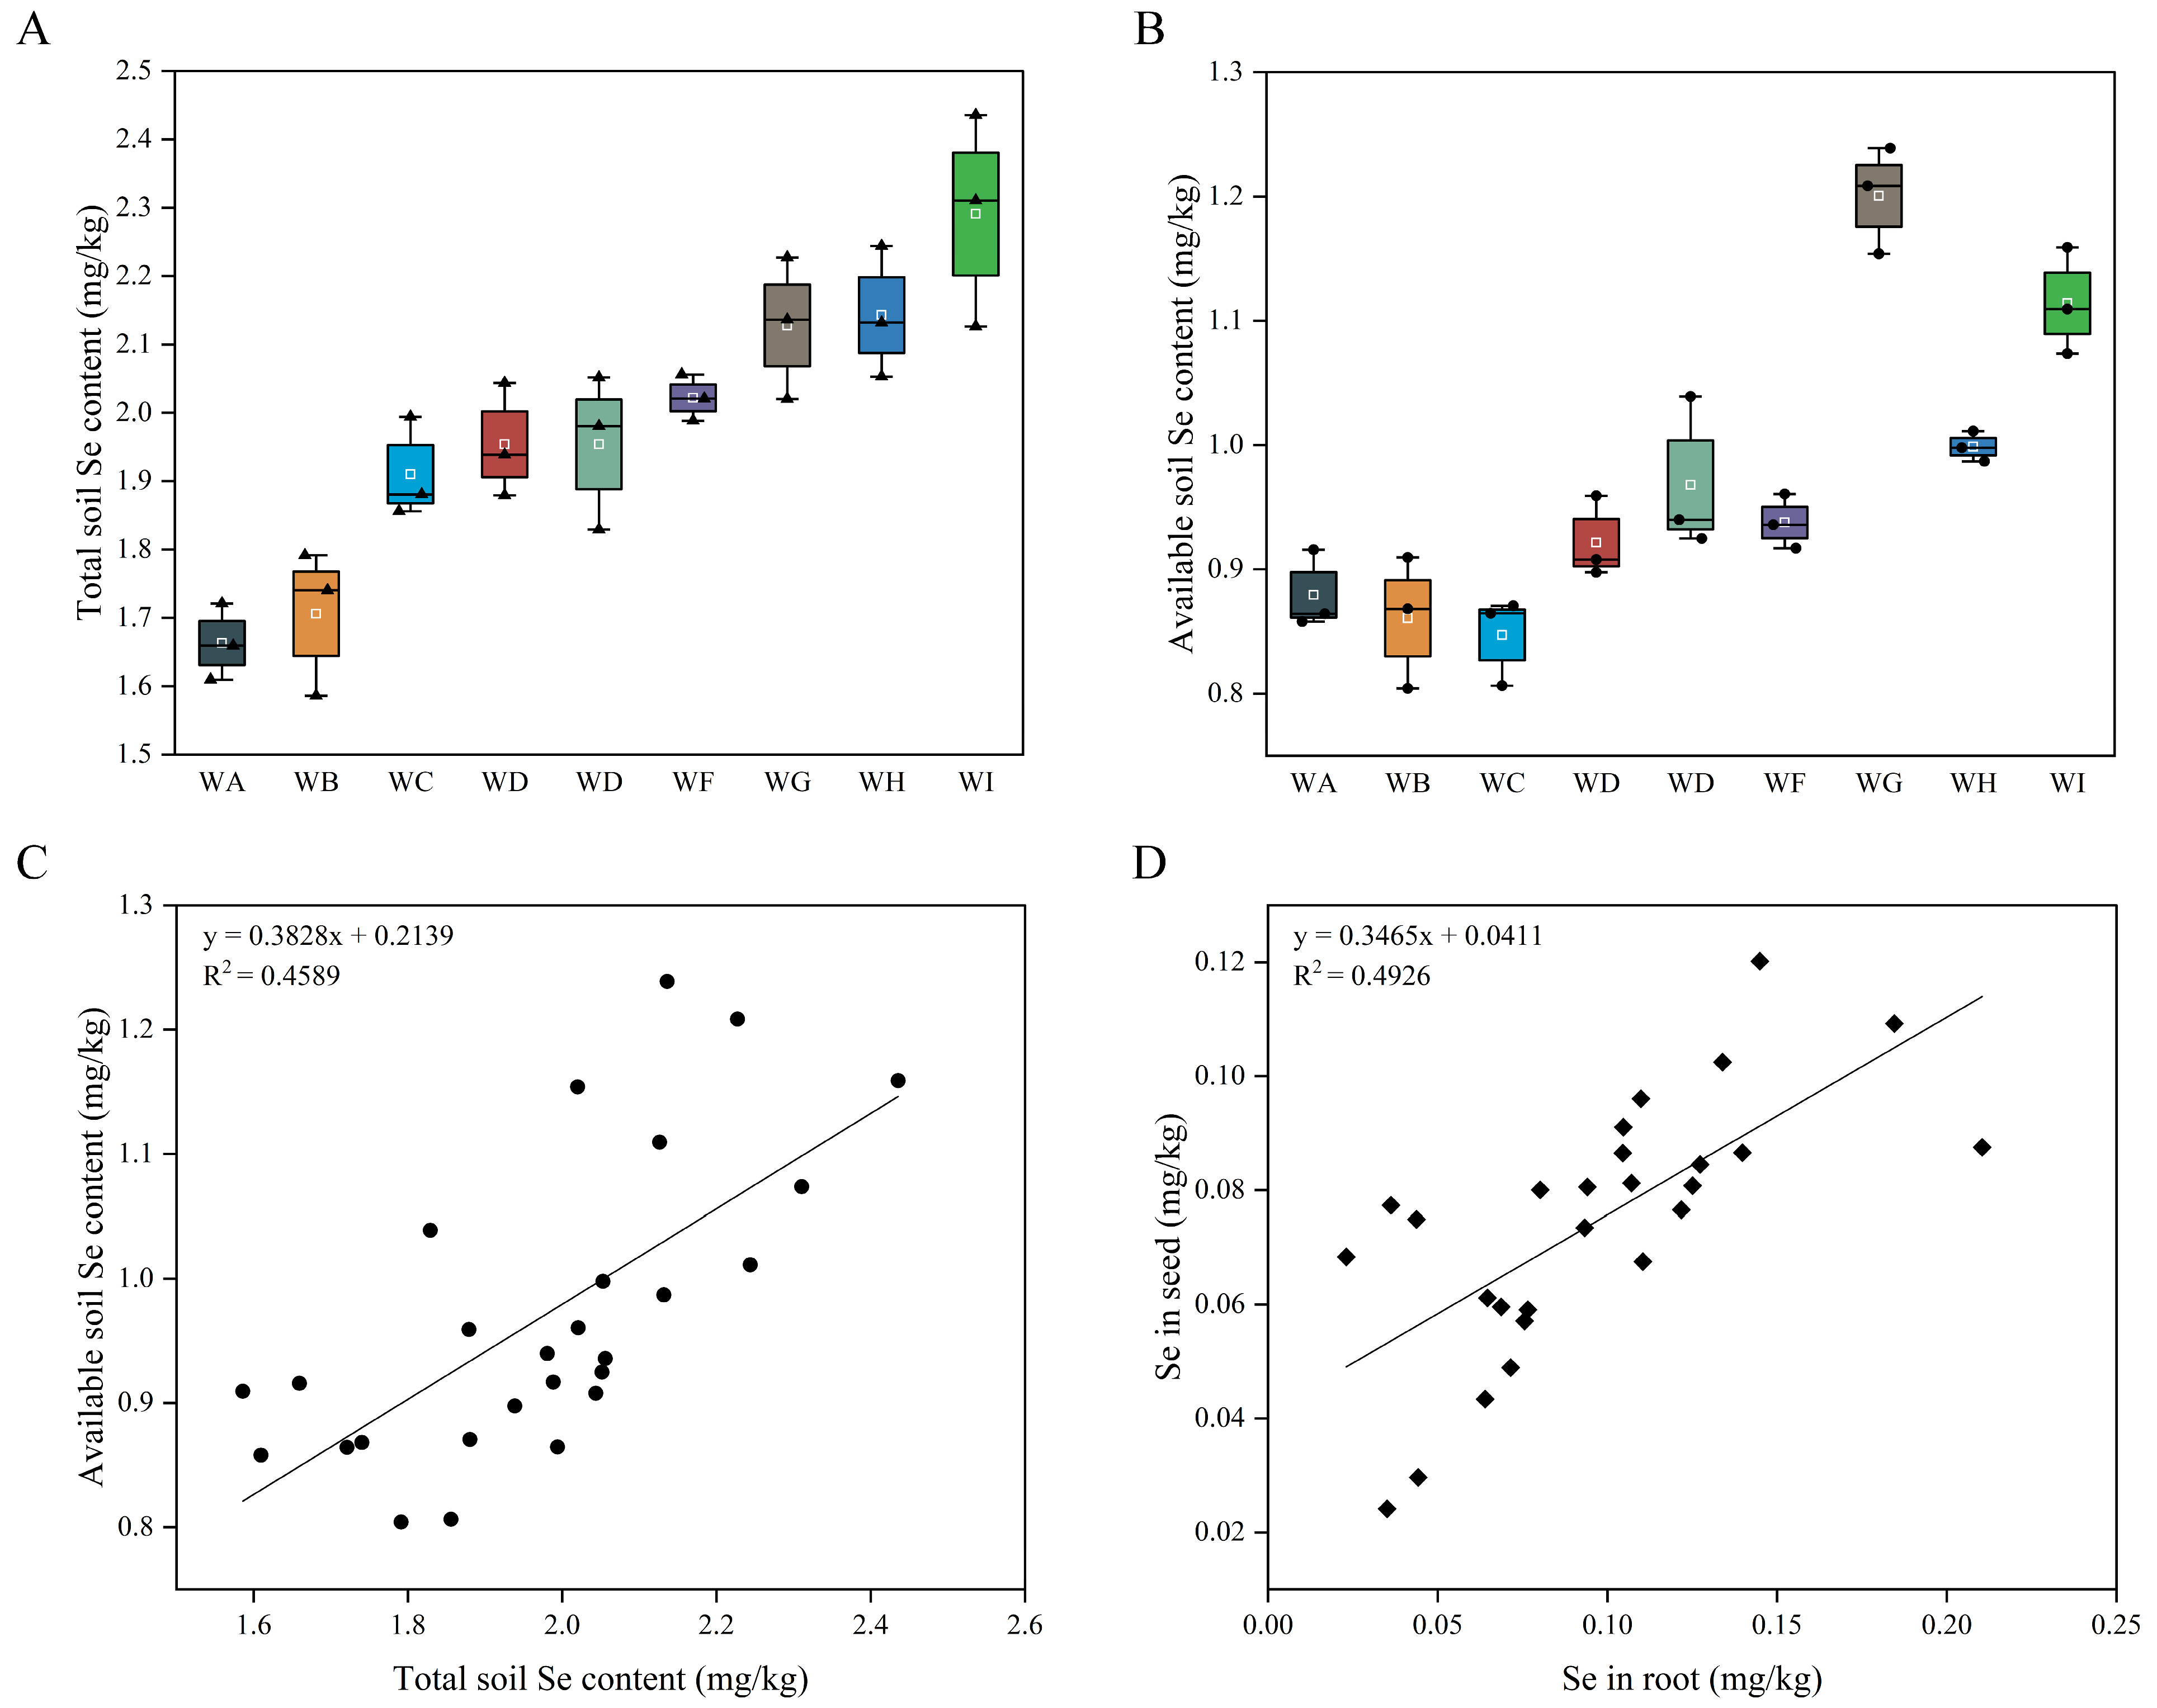
3.1. Se Content in Different Organs of Soybean and Soil Se Content

The basic physical and chemical properties of the surface soils are summarized in Table 1 and Supplementary Table S1. Within the same plant species, the ability of different parts or tissues to absorb and utilize Se varies. Overall, the Se content in various soybean organs follows is highest in roots, followed by seeds, and then both stems and pods (Table 2 and Supplementary Table S2). Correlation analysis of the total Se content in soybean seeds and roots revealed they were positively correlated, with a coefficient of determination (R2) of 0.4926 (Figure 1D).
Figure 1A shows that plot WI among all plots exhibited the highest total Se content (2.29 mg/kg). In comparison, plot WA showed the lowest total Se content (1.66 mg/kg), indicating substantial variation in the Se accumulation capacity of soybean plants across the different plots. Figure 1B shows that the effective Se content in the soil ranged from 0.85 to 1.20 mg/kg. Specifically, the effective Se in plot WA represented 53.01% of the total Se (0.88 mg/kg available Se out of 1.66 mg/kg total Se). In contrast, the proportion of effective Se varied progressively as the total Se content increased; for example, in plot WC, where the total Se content was 1.91 mg/kg, the effective Se was 0.85 mg/kg, corresponding to a proportion of 44.50%.
This suggests that the bioavailability of Se may be higher when total Se levels in the soil are relatively low. Figure 1C illustrates the relationship between total soil Se content and effective Se content. The data show that the effective Se content of the soil increased with total soil Se content, and a positive correlation was observed between the effective Se content and total soil Se content, with a coefficient of determination (R2) of 0.4589.

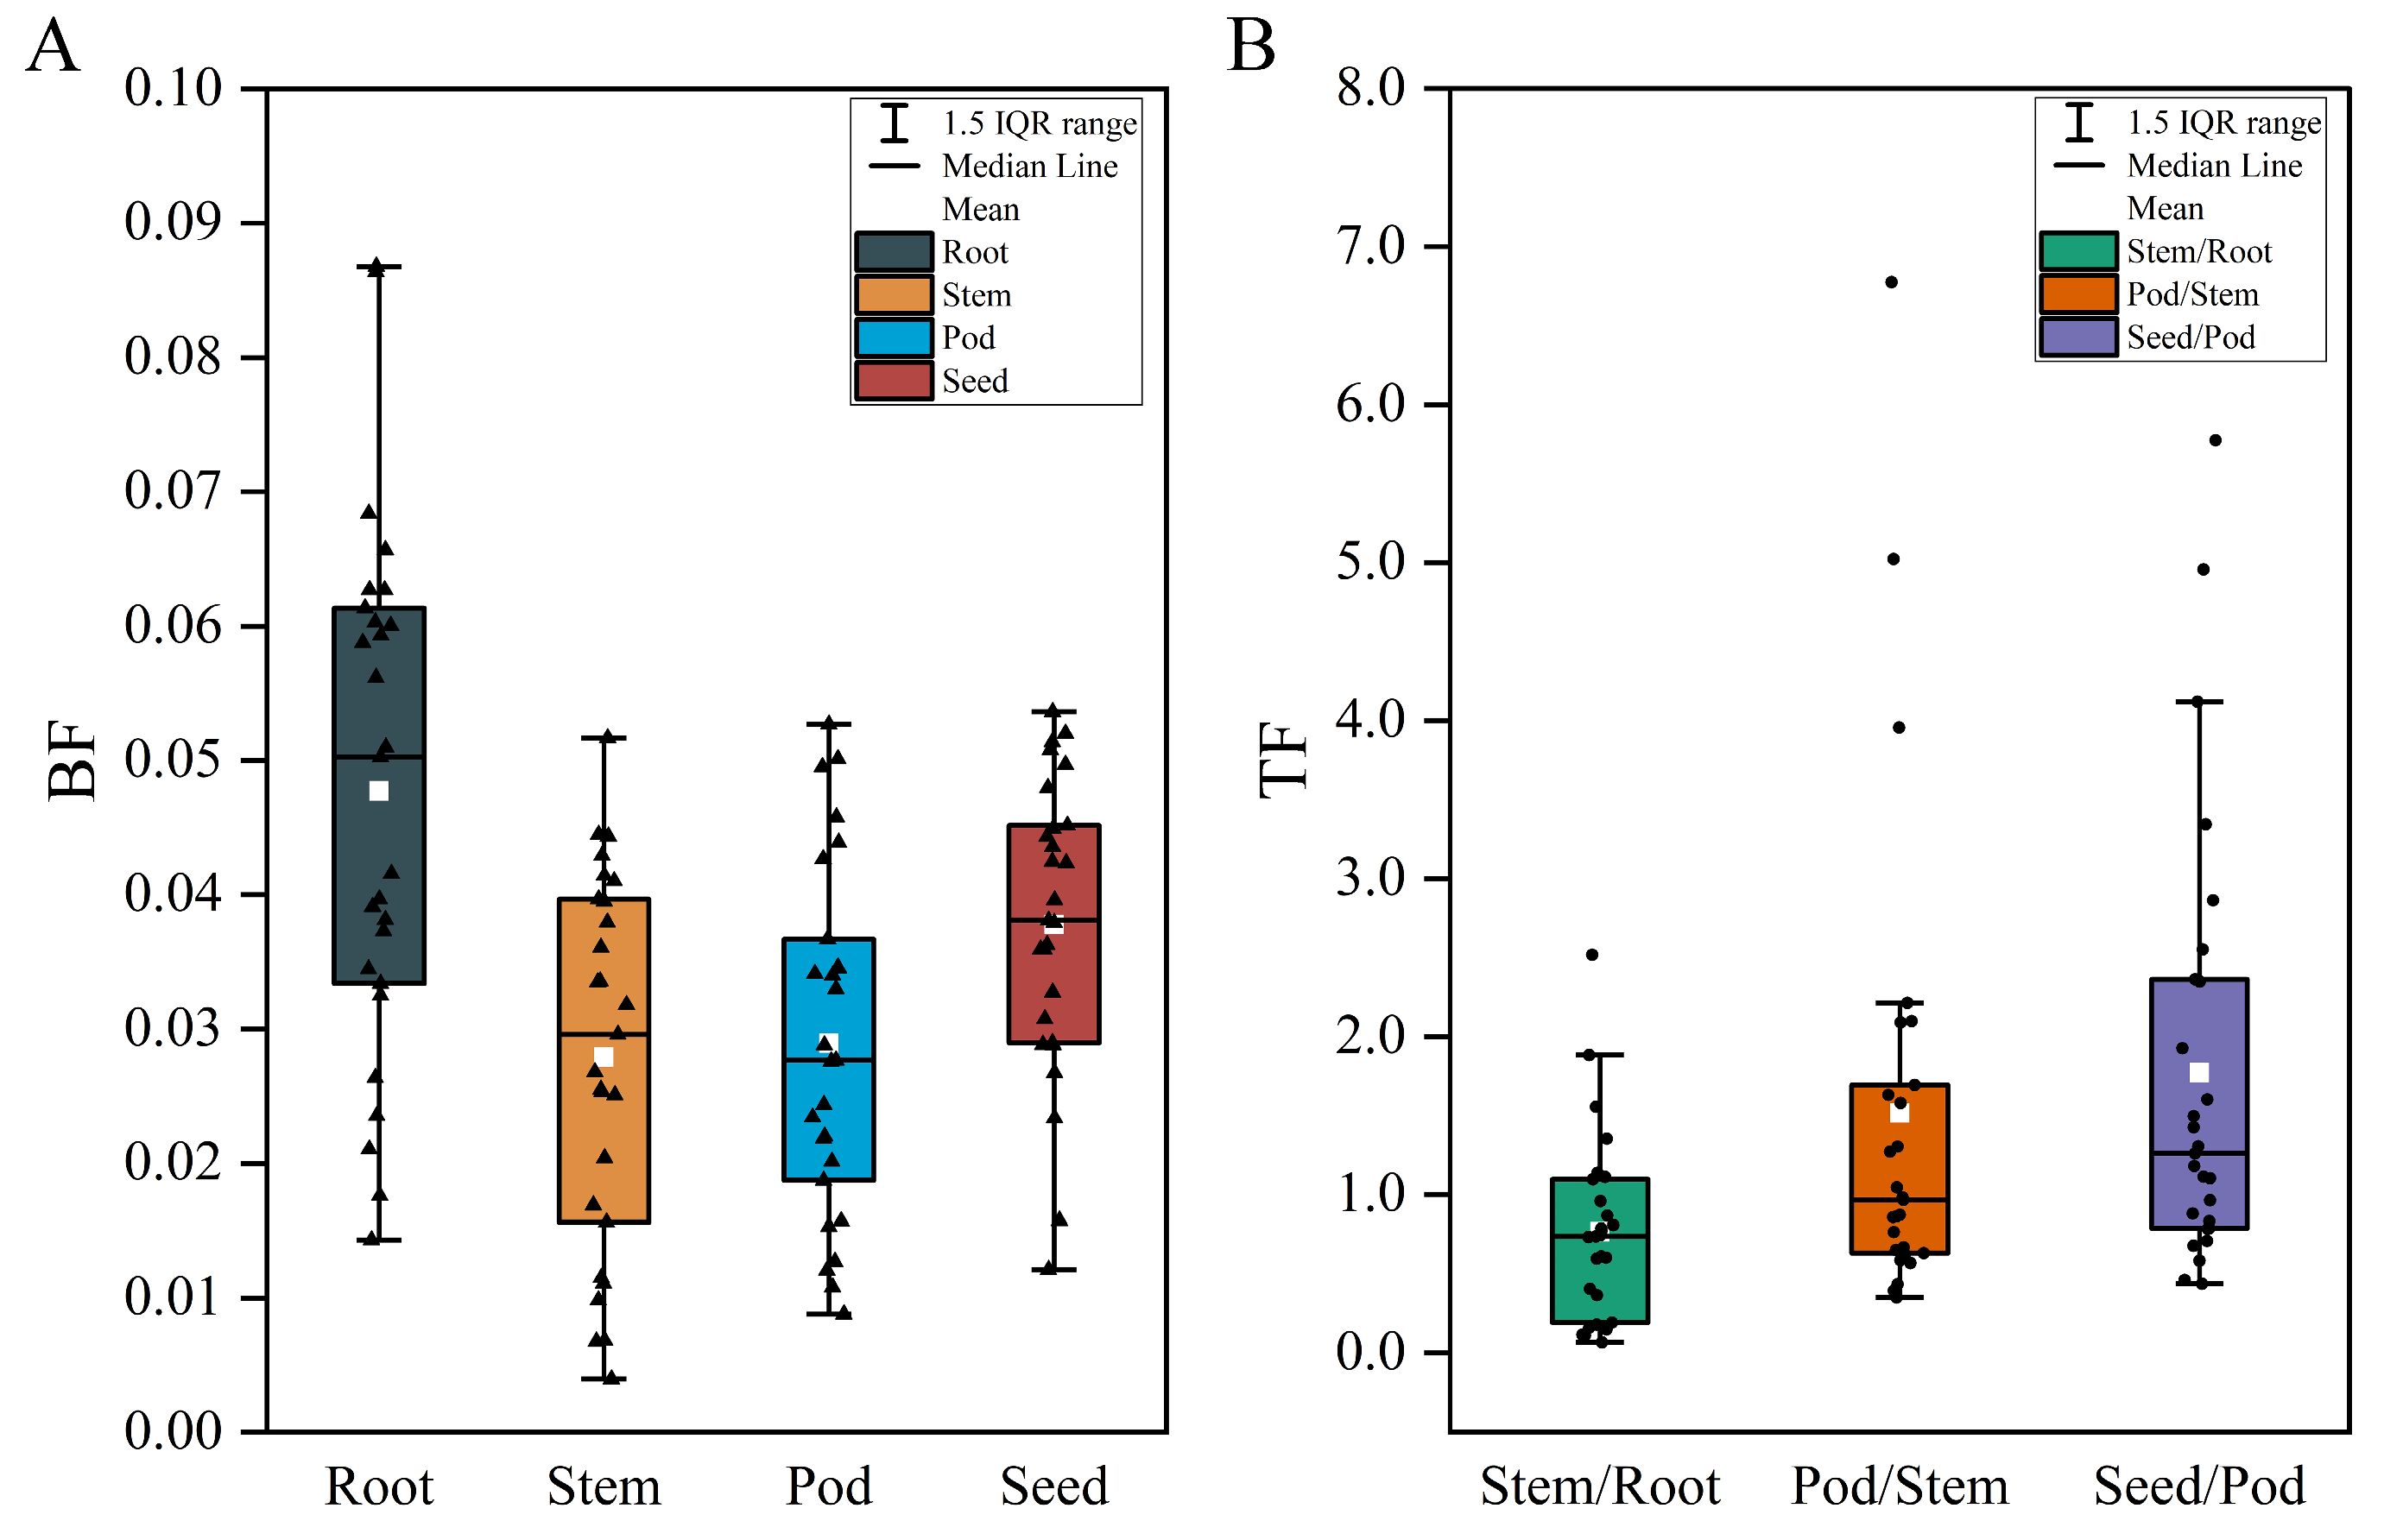
3.2. Characterization of Se Enrichment and Translocation in Soybean

BCF and TF values were calculated to assess the ability of crops in the study area to absorb Se from the soil and transfer it from the root system to the above-ground organs. Figure 2A shows the differences in BCF and TF values among the various organs across different soybean plots. The average BCF values for Se in the root, stem, pod, and seed tissues were 0.048, 0.028, 0.029, and 0.038, respectively. Overall, soybean organs exhibited a relatively low uptake of soil Se [26].
Table 3 and Supplementary Table S3 shows that the enrichment capacity of the roots of WI and seeds of WB was the highest, with enrichment coefficients of 0.079 and 0.051, respectively. These values are significantly higher than those of the other plots. In contrast, the enrichment coefficients for the WI stems and pods were notably lower than those of the other plots. The plots with the most significant BCF values for soybean stems and pods were WE (0.045) and WF (0.049), respectively. When considered along with the enrichment coefficients for soybean seeds, e.g., for WB samples (0.051), which had significantly higher enrichment coefficients than those of WE (0.028) and WF samples (0.033). The overall results indicated that the Se accumulated in the roots was a more informative indicator of Se accumulation in the seeds. In contrast, Se accumulation in the stems and pods of soybeans had less influence. Furthermore, Se accumulation in soybean seeds may be more strongly influenced by external environmental factors or the plant’s developmental stage.
In terms of transport coefficients, as shown in Table 4 and Supplementary Table S4, plot WA exhibited the highest TFStem/Root value (1.986), significantly higher than those of the other plots, indicating that in Se-enriched soils, plot WA demonstrated a higher Se transport capacity, despite it having the lowest total soil Se content (1.66 mg/kg). The highest TFPod/Stem value was observed in plot WD (5.252), while the lowest was found in plot WA (0.440). However, the TFStem/Root of plot WA (1.986) was significantly greater than that of plot WD (0.142), suggesting that soybean translocation from stem to pod was not significantly associated with root-to-stem transport capacity. This indicates that the translocation capacity of above-ground parts of soybeans may be more related to the effective Se they are able to absorb. The WB TFSeed/Pod value was significantly higher than the TFSeed/Pod values of the other groups (4.951). In contrast, the transfer coefficients from pod to seed in the different groups were centrally distributed within the range of 0.685–2.711. Based on the average TF value for Se among neighboring organs of soybean (Figure 2B), the data distribution for TFSeed/Pod was more dispersed, suggesting there was no specific pattern in pod-to-seed Se transport. This further indicates that the Se content of the pods less influenced the high or low Se content levels observed in soybean seeds.
Overall, the highest mean BCF value for Se was observed in soybean roots (0.048), followed by seeds (0.038), pods (0.029), and stems (0.028). Changes in the total Se content of the soil significantly affected the BCF value in soybean roots but did not significantly affect the BCF values in stems and pods. The highest mean TF value was observed in the stem-to-pod translocation (1.773), followed by stem-to-seed (1.515) and stem-to-root (0.764). This suggests that Se was efficiently transferred between the root, stem, and pod, with more Se being enriched in the soybean seeds.

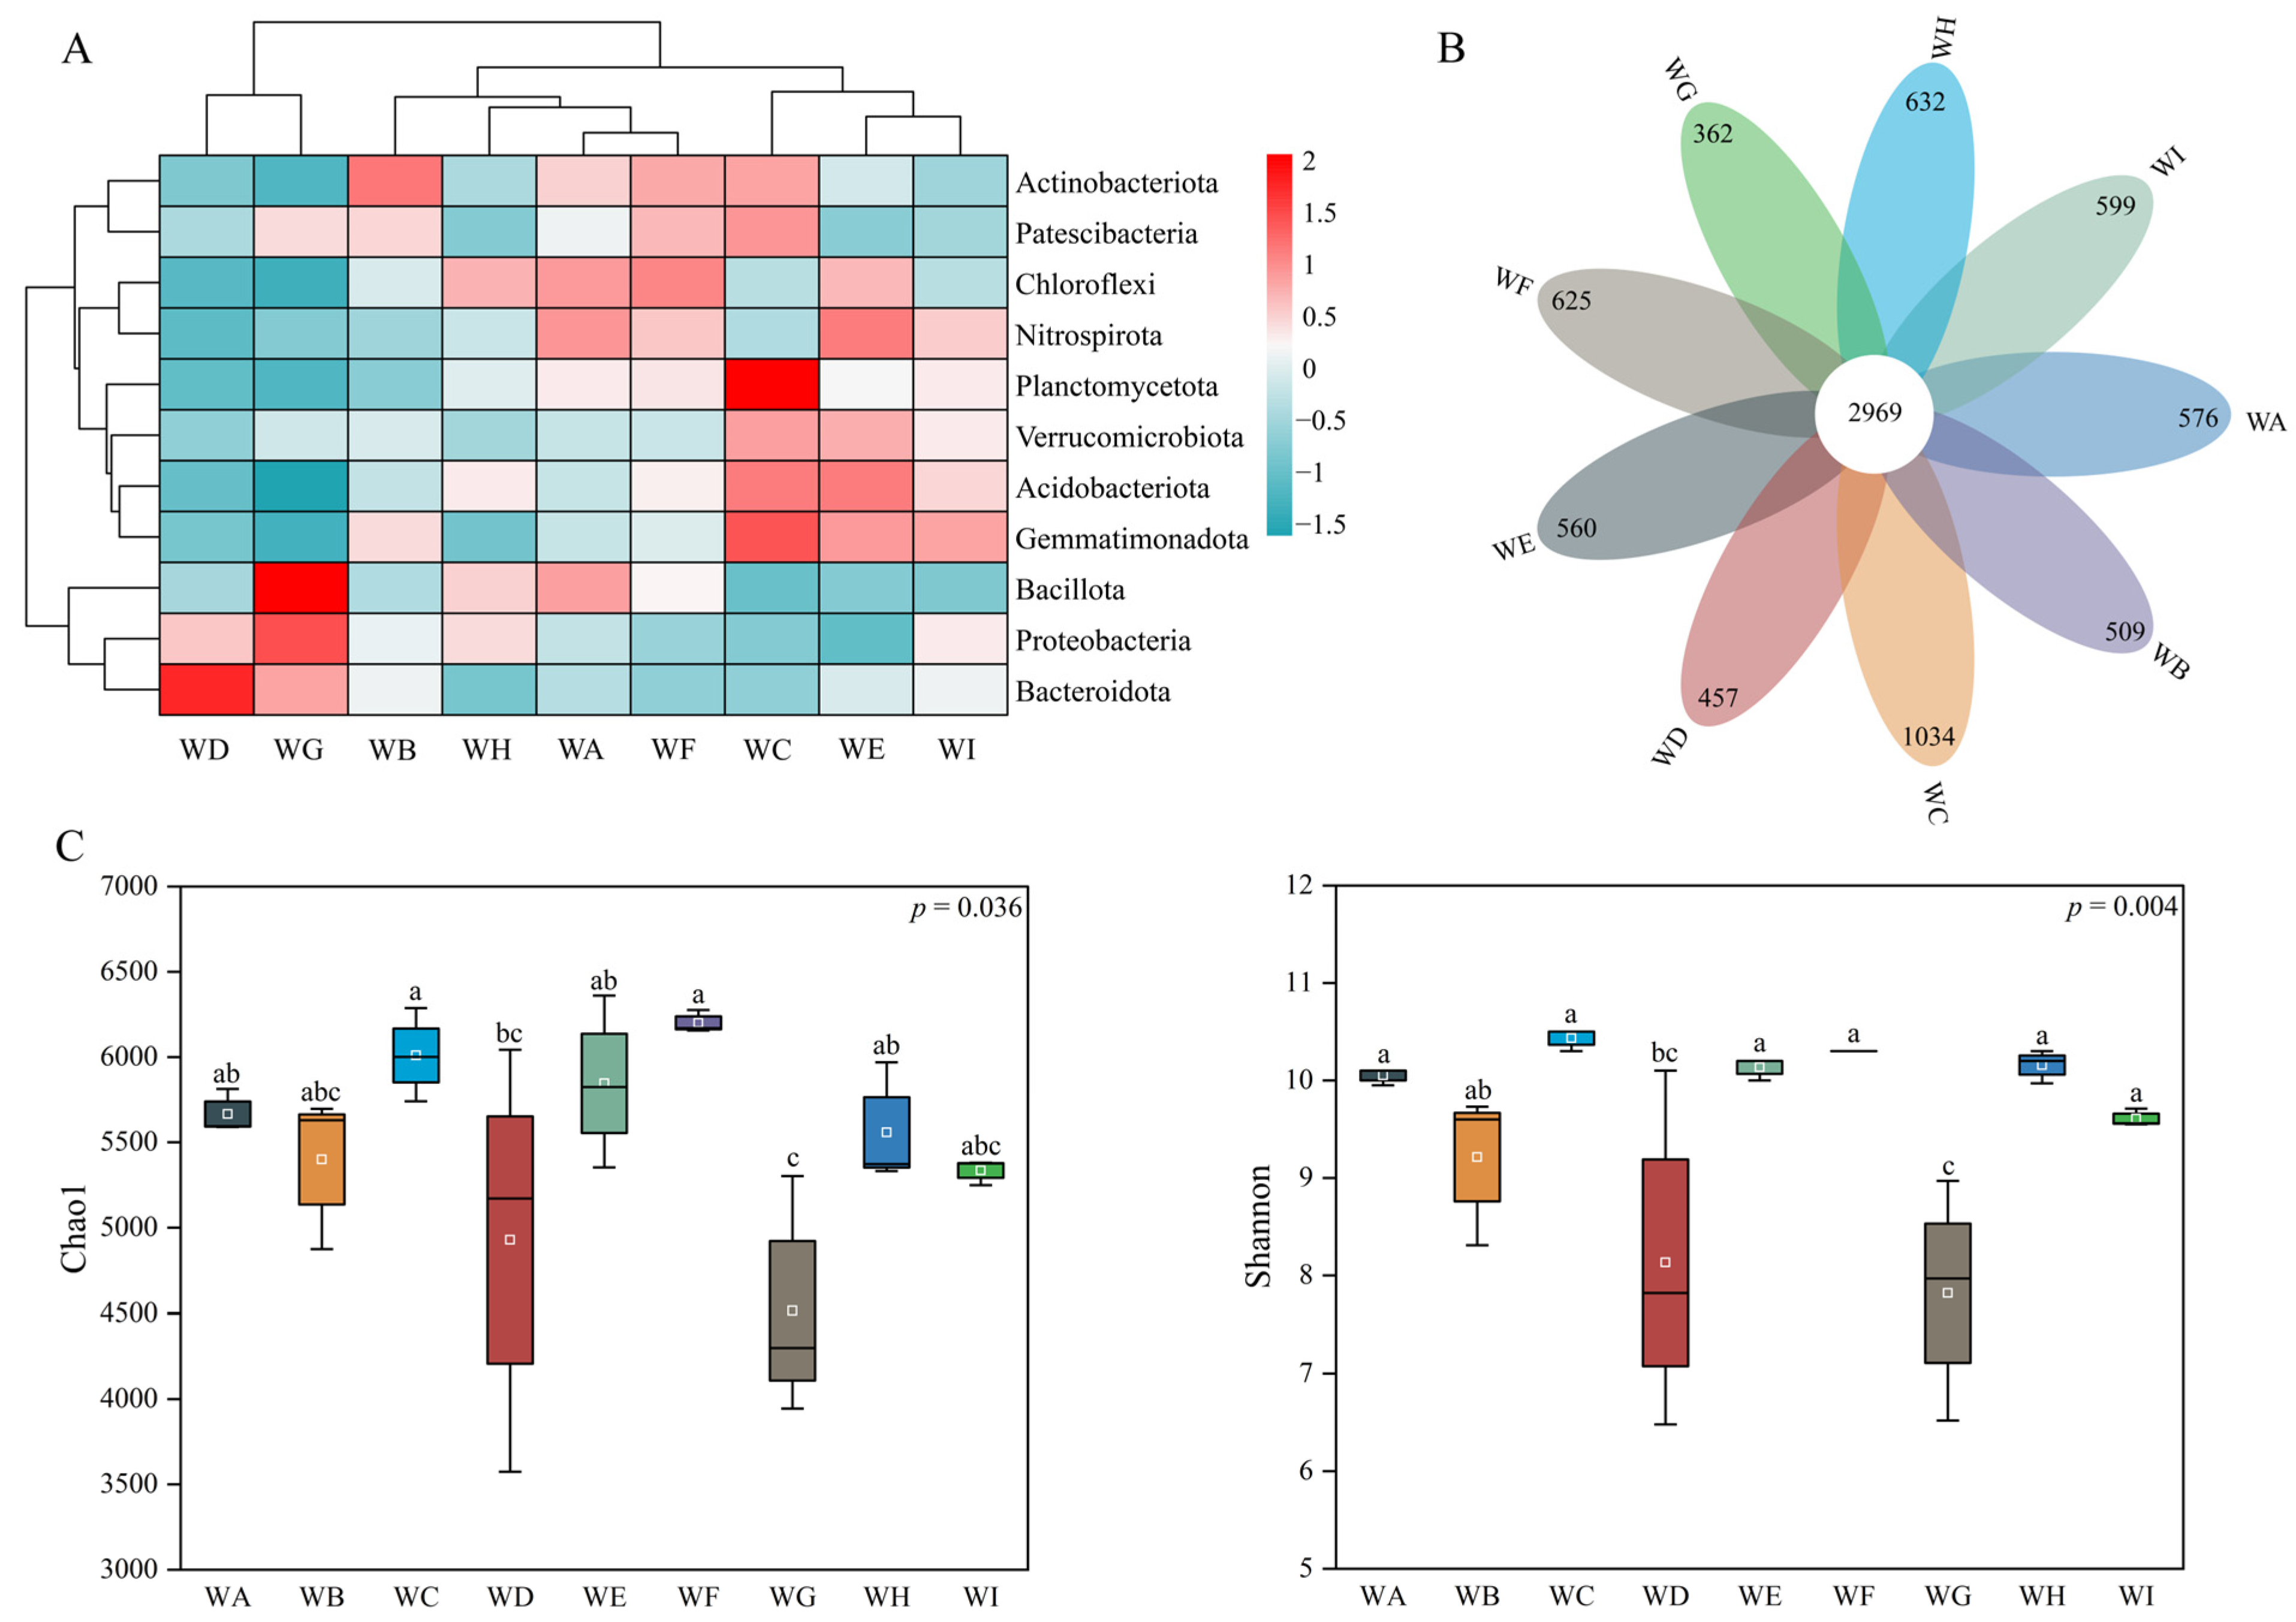
3.3. Bacterial Amplicon Structure Analysis

All raw sequences were deposited in National Center for Biotechnology Information (NCBI) Sequence Read Archive (SRA) database with the accession number PRJNA1264716. The global amount of reads and bp obtained was 3,906,789 and 1,452,717,156, respectively.
Figure 3A shows the species whose relative abundance of OTUs >1% at the phylum level. The community abundance of plot WC is higher than that of other plots, while the relative community abundance of plot WG is the lowest. It is noteworthy that in plot WG, Proteobacteria and Bacillota have the highest abundance, and Bacteroidota has the highest abundance in plot WD. Planctomycetota has the highest abundance in plot WC. In plot WB, Actinobacteriota has the highest abundance. Nitrospirota is significantly enriched in plot WE. Chloroflexi is significantly enriched in plots WF and WE, respectively.
The Venn diagram of shared microbial OTUs among plots (Figure 3B) indicates that OTUs were most enriched in plot WC (1034), while the fewest OTUs were observed in plot WG (362). Alpha diversity indexes were calculated based on a statistical analysis of OTUs. The bacterial alpha diversity of WC rhizosphere soils (Chao 1 index of 6000.9, Shannon index of 10.5, Figure 3C) was significantly higher than that of the other plots, with a statistically significant difference (p < 0.05). In contrast, the bacterial alpha diversity of WG rhizosphere soils was lower than that of the other plot, with a Chao 1 index of 4298.3 and a Shannon index of 7.97 (Figure 3C).

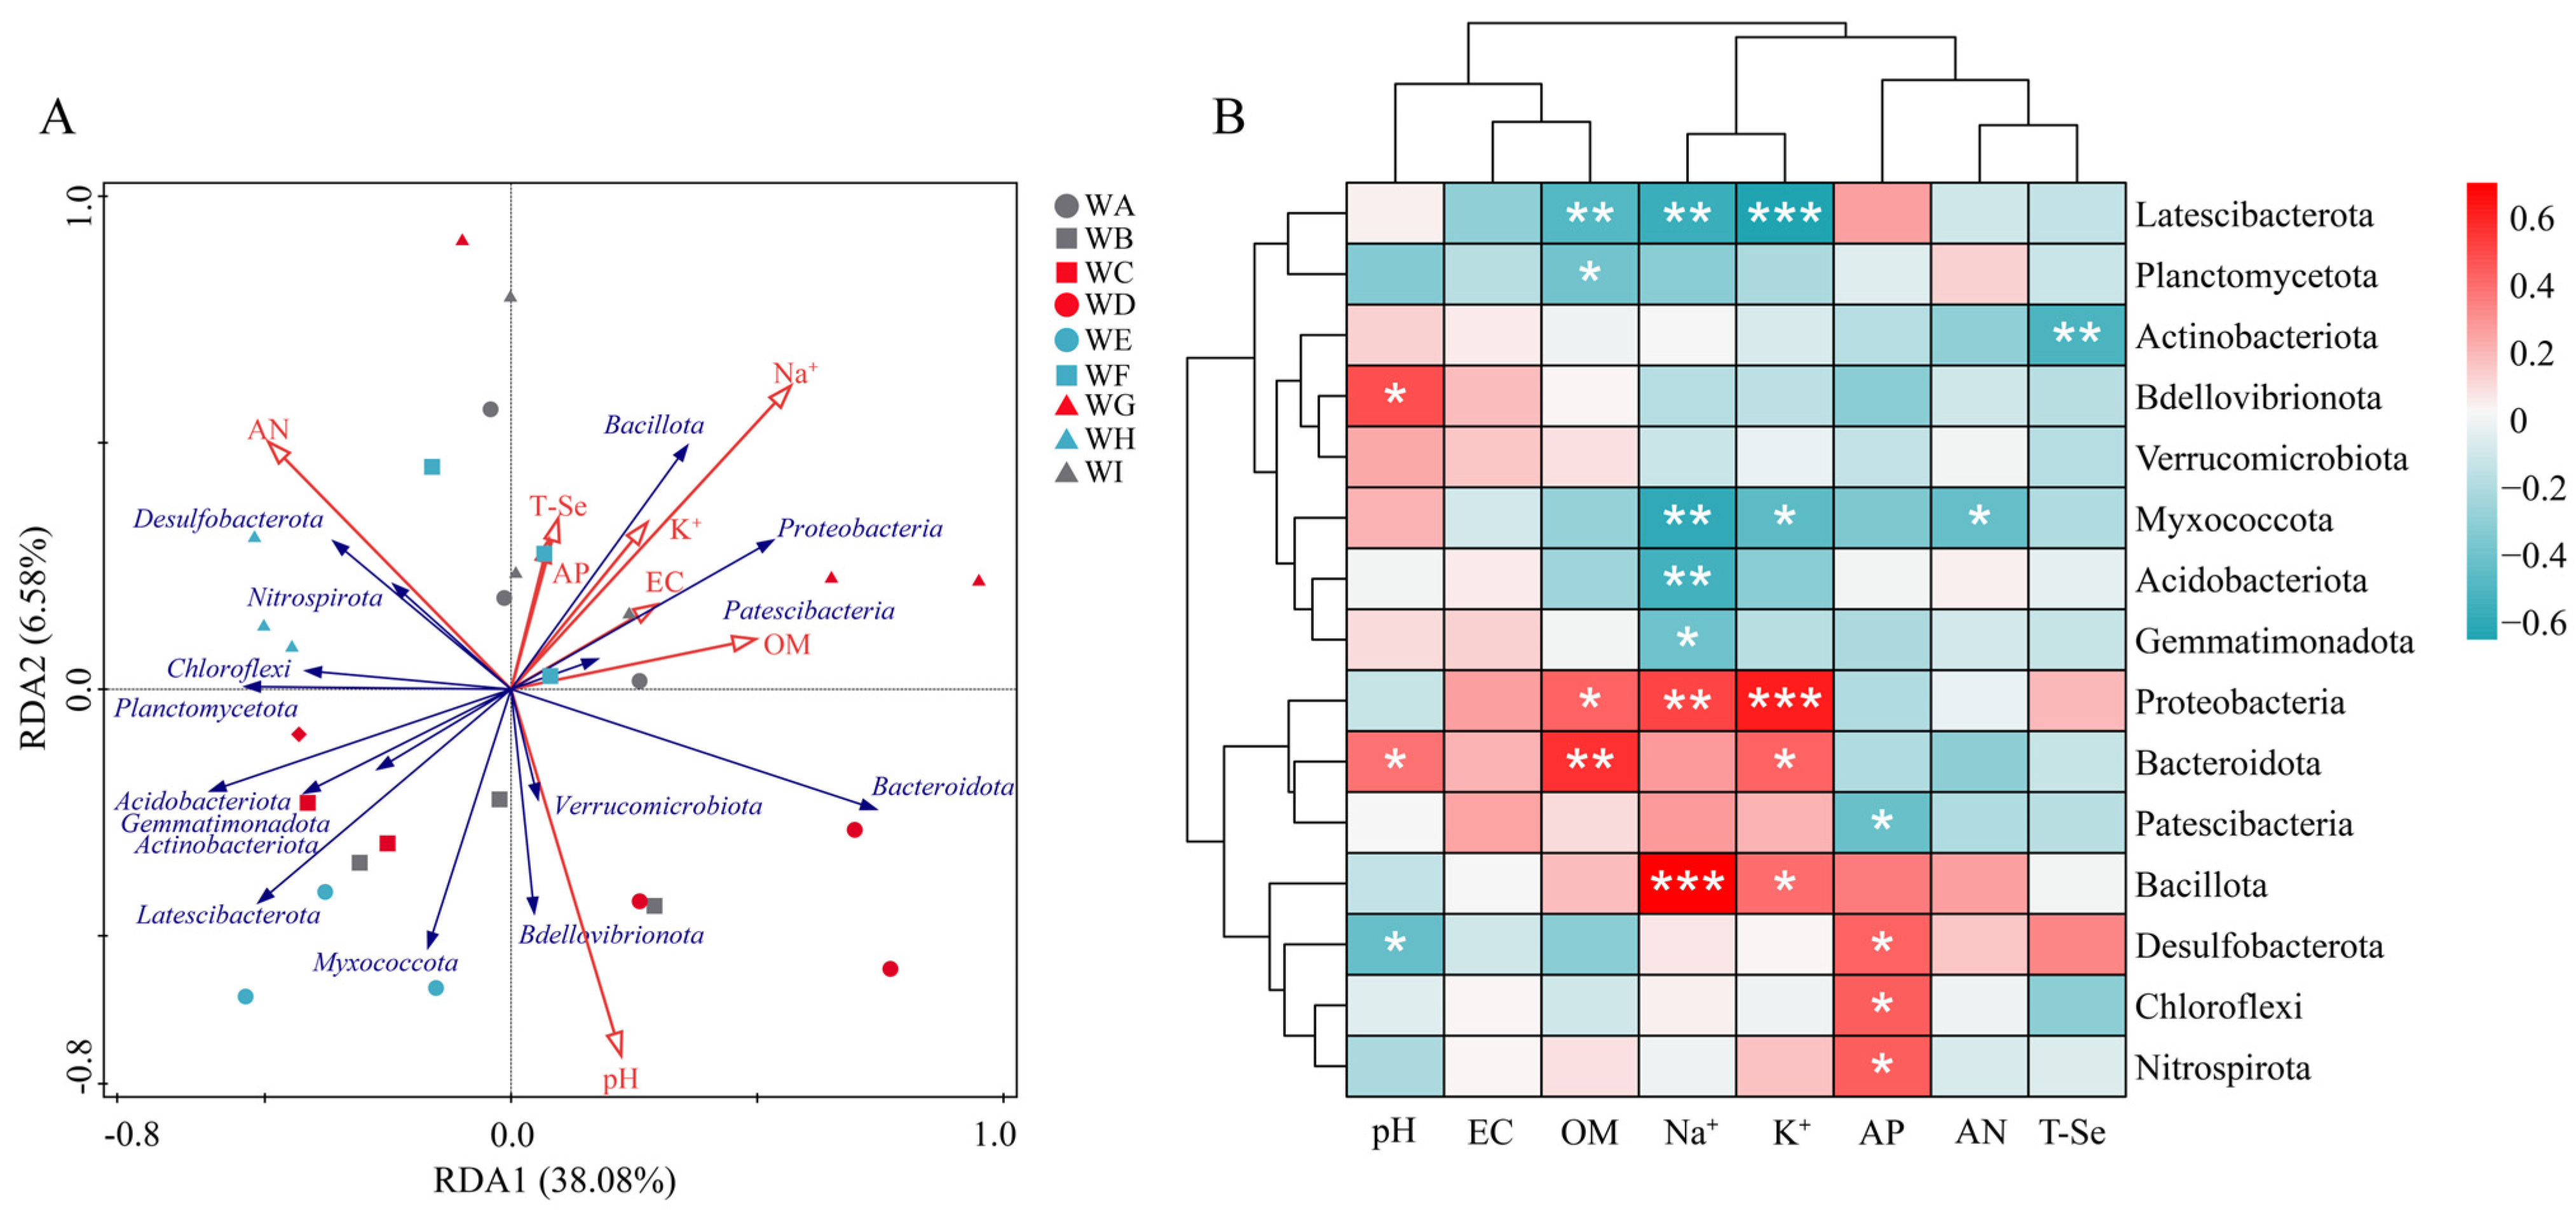
3.4. Differences in Microbial Communities Among Different Rhizosphere Soil Environments

To determine the putative drivers of soil environmental factors on rhizosphere microbial communities, correlations between major species and soil properties (e.g., pH, EC, OM, AN, AP, Na+, K+, and total Se) at the bacterial phylum level of rhizosphere soils were investigated using RDA (Figure 4A). The values of various important soil properties are summarized in Table 5 and Supplementary Table S5, and the selection of soil variables was based on the variance inflation factor (VIF < 5). These selected variables explained 85.65% of the variation in soil bacterial communities, with the first and second axes of the RDA explaining 73.02% and 12.63% of variation, respectively.
Specifically, the relationship between soil variables is indicated by the cosine angle of the arrows (representing soil variables). In terms of the relationship between soil variables and the dominant phylum, Na+ was positively correlated with the abundances of Bacillota, Proteobacteria, and Patescibacteria, with Na+ affecting Patescibacteria to a lesser extent than the other two phyla. Na+ was negatively correlated with the abundance of phyla in the fourth quadrant of Figure 4A, and it had a lesser effect on Actinobacteriota abundance. K+ was positively correlated with Proteobacteria abundance. Additionally, pH was positively correlated with the abundances of Bacteroidota, Bdellovibrionota, and Verrucomicrobiota and negatively correlated with the abundances of Desulfobacterota and Nitrospirota. OM was positively correlated with the abundances of Proteobacteria, Bacteroidota, Bacillota, and Patescibacteria. These findings suggest that soil Na+, pH, and OM were the main drivers affecting rhizosphere microbial communities. Additionally, the relative dispersion of distances between soil samples from the nine groups indicated significant differences in microbial community structure among them.
Furthermore, Spearman correlation analysis was conducted between the top 15 dominant phyla to evaluate the relationship between relative abundance in the bacterial community and the eight soil variables (Figure 4B). The eight environmental factors pH, OM, Na+, K+, AP, AN, and T-Se were significantly associated with the abundance of the fifteen most abundant bacterial phyla. Specifically, Na+ was positively correlated with the abundance of Bacillota and Proteobacteria but negatively correlated with the abundance of Myxococcota, Acidobacteriota, Latescibacterota, and Gemmatimonadota. Similarly, pH was positively correlated with the abundance of Bdellovibrionota and Bacteroidota but negatively correlated with the abundance of Desulfobacterota. OM was positively correlated with the abundance of Bacteroidota and Proteobacteria but negatively correlated with the abundance of Latescibacterota and Planctomycetota. Additionally, EC was not significantly associated with any of fifteen most dominant bacterial phyla in terms of their relative abundance.

4. Discussion

The structure and function of soil microbial communities may be influenced by precipitation content, particularly in arid regions constrained by water resources [52]. Reduced precipitation may indirectly affect the cycling and migration of minerals in soil by altering microbial community structure [53]. Additionally, changes in precipitation have a significant impact on soil pH, thereby influencing the solubility and mobility of minerals in soil [54]. This study conducted field experiments on natural Se-rich saline–alkali land without the application of exogenous Se, Given the low precipitation in the study area (average annual precipitation accumulation of 222 mm), soybean cultivation was implemented using well-water drip irrigation, ensuring no drought stress was induced during the experimental period. Based on this, the enrichment characteristics of Se in soybean crops and its relationship with soil Se content. The relationship between rhizosphere soil bacterial community structure and soil environmental factors was also explored using high-throughput sequencing.
Se does not impede the uptake of other elements by plants [55]. On the contrary, it promotes the absorption of micronutrients in plants [55]. Additionally, Se has been shown to enhance plant tolerance to various abiotic stresses, such as drought, salinity, and heavy metals [37,38,39,40]. Se helps improve plant growth, reduces the absorption and accumulation of heavy metals in plants [56], and inhibits their translocation from roots to aboveground parts [57,58]. It is protective in plants [59,60]. Previous relevant studies have indicated that Se transfer and accumulation in various organs of crops is an indirect process [61]. When a crop is planted in Se-enriched soil, Se is transferred within the soybean plant from the vascular tissues of the roots to the stems, then from the stems to the leaves, and finally to the chloroplasts of the leaves [62]. This process involves numerous enzymatic and non-enzymatic reactions, contributing to Se-containing proteins that accumulate in the crop’s fruit [62]. Increased soil Se content promotes a higher Se concentration in vegetation and also enhances yield [6]. In the present study, Se content in soybean roots and seeds generally increased with increasing total Se content in the soil (Table 2 and Supplementary Table S2). A significant relationship was observed between Se content in soybean seeds and soybean roots (R2 = 0.4926, Figure 1D), suggesting that the Se content influences Se accumulation in the seeds from the soil. Higher Se content in the soil facilitates the transfer of Se from the roots to the aboveground tissues. Additionally, the effective Se content in the soil was significantly correlated with total soil Se content (R2 = 0.4589, Figure 1C). The level of effective Se content in the soil was dependent on the total soil Se content, consistent with the findings of Ahkami et al. [16].
The present study observed significant differences in the BCF and TF values of soybeans among different plots for each organ (Figure 2, Table 3 and Table 4). This suggests that soil Se primarily contributes to Se accumulation in soybean seeds following translocation from the roots, stems, and pods [63]. Furthermore, soybeans accumulate more Se in their above-ground parts during the later stages of growth. Se enrichment in seeds and seed hulls increased as soil Se concentration rose, consistent with the findings of Song et al. [64].
The abundance and diversity of rhizosphere microbial communities are critical for maintaining soil quality and plant health [65]. To investigate the structural characteristics of soybean rhizosphere bacterial communities in soils with varying levels of Se content, this study employed 16S rRNA sequencing to analyze the rhizosphere soil bacteria.
Significant differences were observed in the composition of soybean rhizosphere soil bacterial communities across the nine plots assayed (Figure 4A). This may be attributed to the impact of saline soils on soybean growth, such that salt stress reduces photosynthesis and moisture availability and osmotic imbalances hinder crop growth, ultimately affecting the structure of the rhizosphere bacterial community [6]. Delgado et al. [66] and Li et al. [67] identified Proteobacteria, Bacteroidota, and Chloroflexi as the dominant bacterial phyla in soil bacterial communities. In the present study, these results were supported (Figure 3A). Se can increase the abundance of nitrifying bacteria (e.g., Proteobacteria, Bacillota, and Chloroflexi) in the soybean rhizosphere [28]. When root Se content surpassed 0.1 mg/kg, in WG, WD, WI, and WB plots, Proteobacteria and Bacteroidota were notably enriched. These four plots exhibited significantly higher OM content than the other five plots (Table 5), indicating a possible link between higher OM content and Se content [13]. Proteobacteria can improve soil structure [68] and indirectly promote Se accumulation in soybean roots, while Bacteroidota enhances soil fertility via carbon and nitrogen metabolism [69,70]. Conversely, in WF, WA, and WE plots, where root Se content was below 0.1 mg/kg, Chloroflexi were significantly enriched. This could be related to soil alkaline dissolved nitrogen, as Chloroflexi can access nitrogen sources to increase their abundance [71].
Soil Na+, pH, and OM were identified as the key factors influencing the rhizosphere bacterial community through RDA (Figure 4A). Previous studies have reported that soil salinity significantly impacts microbial community structure [72]. In saline soils, excessive salts can cause soil dispersion by separating and expanding clay particles during the wetting and drying cycles. This process forms a plate-like layer at the soil surface, which reduces soil permeability and impairs water and nutrient uptake, consequently affecting the microbial community [27]. The Na+ content in the WG plot was significantly higher than that in the WC plot (WC, 4.81 mg/kg; WG, 3.88 mg/kg), and the Se content in soybean roots, stems, and seeds in the WG plot was significantly higher that than in the WC plot. Proteobacteria were significantly enriched in the WG plot, and a significant positive correlation was observed between Na+ content and the abundance of Proteobacteria. This further suggests that Proteobacteria are essential in promoting Se accumulation in soybean roots [68]. Additionally, pH is a crucial factor influencing the composition of the soil bacterial community [73]. In the present study, the pH values across the nine plots ranged from 8.07 (WA) to 8.63 (WB), with minimal variation in pH among the plots. There was no significant difference in Se content between the WG and WH plots, with values of 0.087 mg/kg and 0.082 mg/kg, respectively. However, the Se enrichment coefficient in the roots of the WG plot was slightly higher than that in the WH plot (0.060 > 0.048), possibly owing to the influence of Bacteroidota. Additionally, the organic matter content in the WG plot was significantly higher than that in the WH plot (WD, 28.29 g/kg; WH, 14.89 g/kg). Bacillota were significantly enriched in the soybean rhizosphere of the WH plot, which aligns with the findings of Zhang et al. [74], suggesting that Bacillota can proliferate in nutrient-poor soil. Plots with higher organic matter content effectively promoted Se accumulation in soybean roots.
Although certain achievements have been made in this study, there are still some limitations. A key limitation of this study is the failure to conduct separate quantitative analyses of different chemical forms of Se, such as selenite (SeO42−), selenate (SeO32−), and organic Se compounds. This limitation restricts an in-depth understanding of the bioavailability of Se and its mechanism of action. Future research could utilize high-performance liquid chromatography coupled with inductively coupled plasma mass spectrometry (HPLC-ICP-MS) to quantify different Se forms. Comparative experiments could be set up to clarify the effects of Se forms, and microbial functional analyses, such as metagenomic detection of Se metabolism genes, could be incorporated to improve the study of the mechanism. This will provide a more reliable scientific basis for the precise application of Se biofortification.

5. Conclusions

The transport of soil Se from the roots to the shoots promotes the accumulation of Se in seeds. As soil Se content increases, the Se concentrations in both soybean roots and seeds also generally increase, and a significant correlation between them has been observed. Proteobacteria and Bacteroidota influence Se accumulation in soybeans through metabolic activities (e.g., carbon and nitrogen cycling) and soil structure improvement in Se-rich saline soils, while higher abundances of Bacillota enhance soybean resistance to salt stress. Soil Na+ concentration, pH, and organic matter (OM) collectively influence the rhizosphere microbial community, thereby affecting the bioavailability of Se. In agricultural applications, beneficial microorganisms critical for plant growth, health, and quality can be integrated with crops. Strategies such as organic fertilizer amendment or inoculation with functional microbes (e.g., Proteobacteria and Bacillota) can optimize Se utilization efficiency in plants, thereby promoting the sustainable use of biological resources. Future research should include long-term field experiments to verify the stability of Se enrichment under different soil-crop-microbe interaction systems and evaluate the long-term impacts on the quality of agricultural products, soil health, and the ecological environment to ensure their safety and sustainability. This study provides valuable insights into the sustainable production of Se-enriched agricultural products in saline soil and has important guiding significance for the efficient utilization of saline soil resources and the safe production of high-quality Se-enriched crops.

Supplementary Materials

The following supporting information can be downloaded at: https://www.mdpi.com/article/10.3390/agronomy15061320/s1, Table S1: Physical and chemical properties of soils in different plots; Table S2: Total Se content in different plots in root stems, pods, and soybean seeds; Table S3: Bioconcentration factor of Se in soybean from different plots; Table S4: Translocation factor of Se in soybean from different plots; Table S5: Physical and chemical properties of soybean rhizospheric composite soil samples.

Author Contributions

Conceptualization, C.X. and X.Z.; methodology and software, T.F., C.X., and X.Y.; validation, X.Y.; formal analysis, M.Q., Z.X., and X.Y.; investigation, C.X. and X.Z.; resources, X.Z.; data curation, Y.W., M.Q., and Z.X.; writing—original draft, T.F.; writing—review and editing, T.F., Y.W., and X.Z.; project administration, C.X.; funding acquisition, C.X. All authors have read and agreed to the published version of the manuscript.

Funding

This work was funded by the Science and Technology Major Project of Xinjiang Uygur Autonomous Region (2023A02002-4), special fund of Xinjiang Key Laboratory of Soil and Plant Ecological Processes (23XJTRZW02).

Data Availability Statement

The data presented in this study are available upon request from the corresponding author. The data are not publicly available owing to the multiple interests involved in the data.

Conflicts of Interest

The authors declare no conflicts of interest.

References

  1. Burk, R.F.; Hill, K.E. Regulation of selenium metabolism and transport. Annu. Rev. Nutr. 2015, 35, 109–134. [Google Scholar] [CrossRef] [PubMed]
  2. Huang, Y.; Wang, Q.; Gao, J.; Lin, Z.; Banuelos, G.S.; Yuan, L.; Yin, X. Daily dietary selenium intake in a high selenium area of Enshi, China. Nutrients 2013, 5, 700–710. [Google Scholar] [CrossRef] [PubMed]
  3. Rayman, M.P. Selenium and human health. Lancet 2012, 379, 1256–1268. [Google Scholar] [CrossRef] [PubMed]
  4. Winkel, L.H.; Johnson, C.A.; Lenz, M.; Grundl, T.; Leupin, O.X.; Amini, M.; Charlet, L. Environmental selenium research: From microscopic processes to global understanding. Environ. Sci. Technol. 2012, 46, 571–579. [Google Scholar] [CrossRef]
  5. Zhang, L.; Song, H.; Guo, Y.; Fan, B.; Huang, Y.; Mao, X.; Liang, K.; Hu, Z.; Sun, X.; Fang, Y. Benefit–risk assessment of dietary selenium and its associated metals intake in China (2017–2019): Is current selenium-rich agro-food safe enough? J. Hazard. Mater. 2020, 398, 123224. [Google Scholar] [CrossRef]
  6. Wang, Y.; Shan, Q.; Wang, C.; Tang, Z.; Li, Y. Study on the Migration and Accumulation of Selenium between Soil and Vegetations. Sustainability 2022, 15, 592. [Google Scholar] [CrossRef]
  7. El-Ramady, H.; Abdalla, N.; Taha, H.S.; Alshaal, T.; El-Henawy, A.; Faizy, S.E.-D.A.; Shams, M.S.; Youssef, S.M.; Shalaby, T.; Bayoumi, Y. Selenium and nano-selenium in plant nutrition. Environ. Chem. Lett. 2016, 14, 123–147. [Google Scholar] [CrossRef]
  8. Liu, C.; Zhou, G.; Qin, H.; Guan, Y.; Wang, T.; Ni, W.; Xie, H.; Xing, Y.; Tian, G.; Lyu, M. Metabolomics combined with physiology and transcriptomics reveal key metabolic pathway responses in apple plants exposure to different selenium concentrations. J. Hazard. Mater. 2024, 464, 132953. [Google Scholar] [CrossRef]
  9. Wang, M.; Ali, F.; Qi, M.; Peng, Q.; Wang, M.; Bañuelos, G.S.; Miao, S.; Li, Z.; Dinh, Q.T.; Liang, D. Insights into uptake, accumulation, and subcellular distribution of selenium among eight wheat (Triticum aestivum L.) cultivars supplied with selenite and selenate. Ecotoxicol. Environ. Saf. 2021, 207, 111544. [Google Scholar] [CrossRef]
  10. Chilimba, A.D.; Young, S.D.; Black, C.R.; Meacham, M.C.; Lammel, J.; Broadley, M.R. Agronomic biofortification of maize with selenium (Se) in Malawi. Field Crops Res. 2012, 125, 118–128. [Google Scholar] [CrossRef]
  11. Kápolna, E.; Hillestrøm, P.R.; Laursen, K.H.; Husted, S.; Larsen, E.H. Effect of foliar application of selenium on its uptake and speciation in carrot. Food Chem. 2009, 115, 1357–1363. [Google Scholar] [CrossRef]
  12. Fordyce, F.; Guangdi, Z.; Green, K.; Xinping, L. Soil, grain and water chemistry in relation to human selenium-responsive diseases in Enshi District, China. Appl. Geochem. 2000, 15, 117–132. [Google Scholar] [CrossRef]
  13. Lin, L.; Zhou, W.; Dai, H.; Cao, F.; Zhang, G.; Wu, F. Selenium reduces cadmium uptake and mitigates cadmium toxicity in rice. J. Hazard. Mater. 2012, 235, 343–351. [Google Scholar] [CrossRef] [PubMed]
  14. Silva, M.A.; De Sousa, G.F.; Corguinha, A.P.B.; de Lima Lessa, J.H.; Dinali, G.S.; Oliveira, C.; Lopes, G.; Amaral, D.; Brown, P.; Guilherme, L.R.G. Selenium biofortification of soybean genotypes in a tropical soil via Se-enriched phosphate fertilizers. Front. Plant Sci. 2022, 13, 988140. [Google Scholar] [CrossRef]
  15. Berendsen, R.L.; Pieterse, C.M.; Bakker, P.A. The rhizosphere microbiome and plant health. Trends Plant Sci. 2012, 17, 478–486. [Google Scholar] [CrossRef]
  16. Ahkami, A.H.; White, R.A., III; Handakumbura, P.P.; Jansson, C. Rhizosphere engineering: Enhancing sustainable plant ecosystem productivity. Rhizosphere 2017, 3, 233–243. [Google Scholar] [CrossRef]
  17. Huang, J.; Liu, W.; Deng, M.; Wang, X.; Wang, Z.; Yang, L.; Liu, L. Allocation and turnover of rhizodeposited carbon in different soil microbial groups. Soil Biol. Biochem. 2020, 150, 107973. [Google Scholar] [CrossRef]
  18. Spohn, M. Element cycling as driven by stoichiometric homeostasis of soil microorganisms. Basic Appl. Ecol. 2016, 17, 471–478. [Google Scholar] [CrossRef]
  19. Han, Q.; Ma, Q.; Chen, Y.; Tian, B.; Xu, L.; Bai, Y.; Chen, W.; Li, X. Variation in rhizosphere microbial communities and its association with the symbiotic efficiency of rhizobia in soybean. ISME J. 2020, 14, 1915–1928. [Google Scholar] [CrossRef]
  20. Meng, T.; Wang, Q.; Abbasi, P.; Ma, Y. Deciphering differences in the chemical and microbial characteristics of healthy and Fusarium wilt-infected watermelon rhizosphere soils. Appl. Microbiol. Biotechnol. 2019, 103, 1497–1509. [Google Scholar] [CrossRef]
  21. Brockett, B.F.; Prescott, C.E.; Grayston, S.J. Soil moisture is the major factor influencing microbial community structure and enzyme activities across seven biogeoclimatic zones in western Canada. Soil Biol. Biochem. 2012, 44, 9–20. [Google Scholar] [CrossRef]
  22. Jin, H.; Ju, Q.; Yu, Z.; Hao, J.; Gu, H.; Gu, H.; Li, W. Simulation of snowmelt runoff and sensitivity analysis in the Nyang River Basin, southeastern Qinghai-Tibetan Plateau, China. Nat. Hazards 2019, 99, 931–950. [Google Scholar] [CrossRef]
  23. Stark, S.; Eskelinen, A.; Männistö, M.K. Regulation of microbial community composition and activity by soil nutrient availability, soil pH, and herbivory in the tundra. Ecosystems 2012, 15, 18–33. [Google Scholar] [CrossRef]
  24. Stefanello, L.; Schwalbert, R.; Schwalbert, R.; Tassinari, A.; Garlet, L.; De Conti, L.; Ciotta, M.; Ceretta, C.; Ciampitti, I.; Brunetto, G. Phosphorus critical levels in soil and grapevine leaves for South Brazil vineyards: A Bayesian approach. Eur. J. Agron. 2023, 144, 126752. [Google Scholar] [CrossRef]
  25. Silva, M.A.; de Sousa, G.F.; Bañuelos, G.; Amaral, D.; Brown, P.H.; Guilherme, L.R.G. Selenium speciation in se-enriched soybean grains from biofortified plants grown under different methods of selenium application. Foods 2023, 12, 1214. [Google Scholar] [CrossRef] [PubMed]
  26. Arvy, M.P. Translocation of selenium in the bean plant (Phaseolus vulgaris) and the field bean (Vicia faba). Physiol. Plant. 1982, 56, 299–302. [Google Scholar] [CrossRef]
  27. Nouri, H.; Borujeni, S.C.; Nirola, R.; Hassanli, A.; Beecham, S.; Alaghmand, S.; Saint, C.; Mulcahy, D. Application of green remediation on soil salinity treatment: A review on halophytoremediation. Process Saf. Environ. Prot. 2017, 107, 94–107. [Google Scholar] [CrossRef]
  28. Lei, Z.; Li, Q.; Tang, Y.; Zhang, H.; Han, C.; Wang, X.; Zhao, X.; Shi, G. Selenium enhanced nitrogen accumulation in legumes in soil with rhizobia bacteria. J. Clean. Prod. 2022, 380, 134960. [Google Scholar] [CrossRef]
  29. Ekanayake, L.J.; Thavarajah, D.; McGee, R.; Thavarajah, P. Will selenium fertilization improve biological nitrogen fixation in lentils? J. Plant Nutr. 2017, 40, 2392–2401. [Google Scholar] [CrossRef]
  30. Ni, G.; Shi, G.; Hu, C.; Wang, X.; Nie, M.; Cai, M.; Cheng, Q.; Zhao, X. Selenium improved the combined remediation efficiency of Pseudomonas aeruginosa and ryegrass on cadmium-nonylphenol co-contaminated soil. Environ. Pollut. 2021, 287, 117552. [Google Scholar] [CrossRef]
  31. Liu, K.; Cai, M.; Hu, C.; Sun, X.; Cheng, Q.; Jia, W.; Yang, T.; Nie, M.; Zhao, X. Selenium (Se) reduces Sclerotinia stem rot disease incidence of oilseed rape by increasing plant Se concentration and shifting soil microbial community and functional profiles. Environ. Pollut. 2019, 254, 113051. [Google Scholar] [CrossRef] [PubMed]
  32. Bao, K.; Wang, Y.; Du, X.; Wuriyanghan, H.; Wang, X.; Xie, J.; Zhao, X.; Jia, W. Comparison of selenium accumulation in edible parts of wheat and broad bean. Agronomy 2023, 13, 1939. [Google Scholar] [CrossRef]
  33. Feng, Z.; Sun, H.; Qin, Y.; Zhou, Y.; Zhu, H.; Yao, Q. A synthetic community of siderophore-producing bacteria increases soil selenium bioavailability and plant uptake through regulation of the soil microbiome. Sci. Total Environ. 2023, 871, 162076. [Google Scholar] [CrossRef] [PubMed]
  34. Keskinen, R.; Räty, M.; Yli-Halla, M. Selenium fractions in selenate-fertilized field soils of Finland. Nutr. Cycl. Agroecosyst. 2011, 91, 17–29. [Google Scholar] [CrossRef]
  35. Kowalska, I.; Smoleń, S.; Czernicka, M.; Halka, M.; Kęska, K.; Pitala, J. Effect of selenium form and salicylic acid on the accumulation of selenium speciation forms in hydroponically grown lettuce. Agriculture 2020, 10, 584. [Google Scholar] [CrossRef]
  36. Qin, H.-B.; Zhu, J.-M.; Liang, L.; Wang, M.-S.; Su, H. The bioavailability of selenium and risk assessment for human selenium poisoning in high-Se areas, China. Environ. Int. 2013, 52, 66–74. [Google Scholar] [CrossRef]
  37. Hawrylak-Nowak, B.; Dresler, S.; Rubinowska, K.; Matraszek-Gawron, R.; Woch, W.; Hasanuzzaman, M. Selenium biofortification enhances the growth and alters the physiological response of lamb’s lettuce grown under high temperature stress. Plant Physiol. Biochem. 2018, 127, 446–456. [Google Scholar] [CrossRef]
  38. Hawrylak-Nowak, B.; Dresler, S.; Wójcik, M. Selenium affects physiological parameters and phytochelatins accumulation in cucumber (Cucumis sativus L.) plants grown under cadmium exposure. Sci. Hortic. 2014, 172, 10–18. [Google Scholar] [CrossRef]
  39. Hawrylak-Nowak, B.; Hasanuzzaman, M.; Matraszek-Gawron, R. Mechanisms of selenium-induced enhancement of abiotic stress tolerance in plants. In Plant Nutrients and Abiotic Stress Tolerance; Springer: Berlin/Heidelberg, Germany, 2018; pp. 269–295. [Google Scholar] [CrossRef]
  40. Cheng, C.; Liu, J.; Liu, J.; Gao, Z.; Yang, Y.; Zhu, B.; Yao, F.; Ye, Q. Selenium Alleviates Cadmium Toxicity in Pepper (Capsicum annuum L.) by Reducing Accumulation, Enhancing Stress Resistance, and Promoting Growth. Plants 2025, 14, 1291. [Google Scholar] [CrossRef]
  41. Wang, X.; Zhang, Z.; Yu, Z.; Shen, G.; Cheng, H.; Tao, S. Composition and diversity of soil microbial communities in the alpine wetland and alpine forest ecosystems on the Tibetan Plateau. Sci. Total Environ. 2020, 747, 141358. [Google Scholar] [CrossRef]
  42. Yeomans, J.C.; Bremner, J. A rapid and precise method for routine determination of organic carbon in soil. Commun. Soil Sci. Plant Anal. 1988, 19, 1467–1476. [Google Scholar] [CrossRef]
  43. Iqbal, A.; He, L.; Khan, A.; Wei, S.; Akhtar, K.; Ali, I.; Ullah, S.; Munsif, F.; Zhao, Q.; Jiang, L. Organic manure coupled with inorganic fertilizer: An approach for the sustainable production of rice by improving soil properties and nitrogen use efficiency. Agronomy 2019, 9, 651. [Google Scholar] [CrossRef]
  44. Ade, L.; Hu, L.; Zi, H.; Wang, C.; Lerdau, M.; Dong, S. Effect of snowpack on the soil bacteria of alpine meadows in the Qinghai-Tibetan Plateau of China. Catena 2018, 164, 13–22. [Google Scholar] [CrossRef]
  45. Peng, J.; Ji, W.; Ma, Z.; Li, S.; Chen, S.; Zhou, L.; Shi, Z. Predicting total dissolved salts and soluble ion concentrations in agricultural soils using portable visible near-infrared and mid-infrared spectrometers. Biosyst. Eng. 2016, 152, 94–103. [Google Scholar] [CrossRef]
  46. Liu, X.; Zhao, Z.; Duan, B.; Hu, C.; Zhao, X.; Guo, Z. Effect of applied sulphur on the uptake by wheat of selenium applied as selenite. Plant Soil 2015, 386, 35–45. [Google Scholar] [CrossRef]
  47. Wang, S.; Liang, D.; Wang, D.; Wei, W.; Fu, D.; Lin, Z. Selenium fractionation and speciation in agriculture soils and accumulation in corn (Zea mays L.) under field conditions in Shaanxi Province, China. Sci. Total Environ. 2012, 427, 159–164. [Google Scholar] [CrossRef]
  48. Wang, S.; Wu, W.; Liu, F.; Liao, R.; Hu, Y. Accumulation of heavy metals in soil-crop systems: A review for wheat and corn. Environ. Sci. Pollut. Res. 2017, 24, 15209–15225. [Google Scholar] [CrossRef]
  49. Sasmaz, M.; Akgül, B.; Sasmaz, A. Distribution and accumulation of selenium in wild plants growing naturally in the Gumuskoy (Kutahya) Mining Area, Turkey. Bull. Environ. Contam. Toxicol. 2015, 94, 598–603. [Google Scholar] [CrossRef]
  50. Šmilauer, P.; Lepš, J. Multivariate Analysis of Ecological Data Using CANOCO 5; Cambridge University Press: Cambridge, UK, 2014. [Google Scholar] [CrossRef]
  51. Gao, C.-H.; Yu, G.; Cai, P. ggVennDiagram: An intuitive, easy-to-use, and highly customizable R package to generate Venn diagram. Front. Genet. 2021, 12, 706907. [Google Scholar] [CrossRef]
  52. Wu, K.; Xu, W.; Yang, W. Effects of precipitation changes on soil bacterial community composition and diversity in the Junggar desert of Xinjiang, China. PeerJ 2020, 8, e8433. [Google Scholar] [CrossRef]
  53. Wang, S.; Jiang, X.; Li, J.; Zhao, X.; Han, E.; Qu, H.; Ma, X.; Lian, J. Increasing precipitation weakened the negative effects of simulated warming on soil microbial community composition in a semi-arid sandy grassland. Front. Microbiol. 2023, 13, 1074841. [Google Scholar] [CrossRef] [PubMed]
  54. Zhang, Y.; Ye, H.; Liu, R.; Tang, M.; Nie, C.; Han, X.; Zhao, X.; Wei, P.; Wen, F. Spatial and Temporal Variations of Soil pH in Farmland in Xinjiang, China over the Past Decade. Agriculture 2024, 14, 1048. [Google Scholar] [CrossRef]
  55. Moulick, D.; Santra, S.C.; Ghosh, D. Seed priming with Se mitigates As-induced phytotoxicity in rice seedlings by enhancing essential micronutrient uptake and translocation and reducing As translocation. Environ. Sci. Pollut. Res. 2018, 25, 26978–26991. [Google Scholar] [CrossRef]
  56. Nie, M.; Hu, C.; Shi, G.; Cai, M.; Wang, X.; Zhao, X. Selenium restores mitochondrial dysfunction to reduce Cr-induced cell apoptosis in Chinese cabbage (Brassica campestris L. ssp. Pekinensis) root tips. Ecotoxicol. Environ. Saf. 2021, 223, 112564. [Google Scholar] [CrossRef] [PubMed]
  57. Zhao, Y.; Hu, C.; Wu, Z.; Liu, X.; Cai, M.; Jia, W.; Zhao, X. Selenium reduces cadmium accumulation in seed by increasing cadmium retention in root of oilseed rape (Brassica napus L.). Environ. Exp. Bot. 2019, 158, 161–170. [Google Scholar] [CrossRef]
  58. Wu, Z.; Yin, X.; Bañuelos, G.S.; Lin, Z.-Q.; Liu, Y.; Li, M.; Yuan, L. Indications of selenium protection against cadmium and lead toxicity in oilseed rape (Brassica napus L.). Front. Plant Sci. 2016, 7, 1875. [Google Scholar] [CrossRef]
  59. Huang, B.; Xin, J.; Dai, H.; Zhou, W. Effects of interaction between cadmium (Cd) and selenium (Se) on grain yield and Cd and Se accumulation in a hybrid rice (Oryza sativa) system. J. Agric. Food Chem. 2017, 65, 9537–9546. [Google Scholar] [CrossRef]
  60. Qin, X.; Nie, Z.; Liu, H.; Zhao, P.; Qin, S.; Shi, Z. Influence of selenium on root morphology and photosynthetic characteristics of winter wheat under cadmium stress. Environ. Exp. Bot. 2018, 150, 232–239. [Google Scholar] [CrossRef]
  61. Yang, F.; Chen, L.; Hu, Q.; Pan, G. Effect of the application of selenium on selenium content of soybean and its products. Biol. Trace Elem. Res. 2003, 93, 249–256. [Google Scholar] [CrossRef]
  62. Mansoor, T.A.; Borralho, P.M.; Dewanjee, S.; Mulhovo, S.; Rodrigues, C.M.; Ferreira, M.-J.U. Monoterpene bisindole alkaloids, from the African medicinal plant Tabernaemontana elegans, induce apoptosis in HCT116 human colon carcinoma cells. J. Ethnopharmacol. 2013, 149, 463–470. [Google Scholar] [CrossRef]
  63. Jin, C.; Genxing, P.; Yaling, W. Effect of soil se level on selenium uptake and transformation by two spring soybean cultivars. Sci. Agric. Sin. 2005, 38, 428–432. [Google Scholar]
  64. Song, T.; Su, X.; He, J.; Liang, Y.; Zhou, T.; Liu, C. Selenium (Se) uptake and dynamic changes of Se content in soil–plant systems. Environ. Sci. Pollut. Res. 2018, 25, 34343–34350. [Google Scholar] [CrossRef]
  65. Jacoby, R.; Peukert, M.; Succurro, A.; Koprivova, A.; Kopriva, S. The role of soil microorganisms in plant mineral nutrition—Current knowledge and future directions. Front. Plant Sci. 2017, 8, 1617. [Google Scholar] [CrossRef] [PubMed]
  66. Delgado-Baquerizo, M.; Oliverio, A.M.; Brewer, T.E.; Benavent-González, A.; Eldridge, D.J.; Bardgett, R.D.; Maestre, F.T.; Singh, B.K.; Fierer, N. A global atlas of the dominant bacteria found in soil. Science 2018, 359, 320–325. [Google Scholar] [CrossRef] [PubMed]
  67. Tian, L.; Han, M.; Liang, K.; Liu, H.; Feng, B. Profiling of farmland microorganisms in maize and minor-grain crops under extreme drought conditions. Appl. Soil Ecol. 2024, 204, 105743. [Google Scholar] [CrossRef]
  68. Finkel, O.M.; Salas-González, I.; Castrillo, G.; Conway, J.M.; Law, T.F.; Teixeira, P.J.P.L.; Wilson, E.D.; Fitzpatrick, C.R.; Jones, C.D.; Dangl, J.L. A single bacterial genus maintains root growth in a complex microbiome. Nature 2020, 587, 103–108. [Google Scholar] [CrossRef]
  69. Gavande, P.V.; Basak, A.; Sen, S.; Lepcha, K.; Murmu, N.; Rai, V.; Mazumdar, D.; Saha, S.P.; Das, V.; Ghosh, S. Functional characterization of thermotolerant microbial consortium for lignocellulolytic enzymes with central role of Firmicutes in rice straw depolymerization. Sci. Rep. 2021, 11, 3032. [Google Scholar] [CrossRef]
  70. Wu, X.; Xu, H.; Liu, G.; Ma, X.; Mu, C.; Zhao, L. Bacterial communities in the upper soil layers in the permafrost regions on the Qinghai-Tibetan plateau. Appl. Soil Ecol. 2017, 120, 81–88. [Google Scholar] [CrossRef]
  71. Fierer, N.; Lauber, C.L.; Ramirez, K.S.; Zaneveld, J.; Bradford, M.A.; Knight, R. Comparative metagenomic, phylogenetic and physiological analyses of soil microbial communities across nitrogen gradients. ISME J. 2012, 6, 1007–1017. [Google Scholar] [CrossRef]
  72. Rath, K.M.; Rousk, J. Salt effects on the soil microbial decomposer community and their role in organic carbon cycling: A review. Soil Biol. Biochem. 2015, 81, 108–123. [Google Scholar] [CrossRef]
  73. Chu, H.; Sun, H.; Tripathi, B.M.; Adams, J.M.; Huang, R.; Zhang, Y.; Shi, Y. Bacterial community dissimilarity between the surface and subsurface soils equals horizontal differences over several kilometers in the western Tibetan Plateau. Environ. Microbiol. 2016, 18, 1523–1533. [Google Scholar] [CrossRef] [PubMed]
  74. Zhang, L.; Ge, A.H.; Tóth, T.; An, F.; Guo, L.; Nie, Z.; Liu, J.; Yang, F.; Wang, Z. Soil bacterial microbiota predetermines rice yield in reclaiming saline-sodic soils leached with brackish ice. J. Sci. Food Agric. 2021, 101, 6472–6483. [Google Scholar] [CrossRef] [PubMed]
Figure 1. Relationship between Se content in soil and Se content in soybean. (A) Total soil Se content in each sample plot. (B) Effective soil Se content in each sample plot. (C) Correlation between total soil Se content and effective Se content. (D) Correlation between Se content in soybean seeds and roots.
Agronomy 15 01320 g001
Figure 2. Selenium bioconcentration factor (BCF) and translocation factor (TF) box plots of different soybean organs. (A) BCF, the triangle represents the BCF of Se content in different organs of soybean from nine plots (including three replicates). (B) TF, the circle represents the TF between Se content in adjacent organs of soybean in nine plots (including three replicates).
Agronomy 15 01320 g002
Figure 3. Species abundance clustering analysis and number of unique and shared operational taxonomic units (OTUs) in the rhizosphere soil and alpha diversity of the rhizosphere bacterial community in different groups. (A) Heatmaps with a relative abundance of OTUs greater than 1% at the phylum level. Hierarchical clustering was performed using the group average method. Colors represent the relative abundance of species, with blue indicating low abundance and red indicating high abundance. The darker the color, the higher the relative richness of the species. (B) Venn diagrams showing the unique and shared OTUs of different treatment groups. (C) Evaluation of the microflora diversity of different treatment by Chao1 index and Shannon index. Lowercase letters a, b, and c denote inter-group significant differences (p-value < 0.05).
Agronomy 15 01320 g003
Figure 4. Ordination and correlation analysis between soil physicochemical factors and microbial community composition (at the phylum level). (A) Redundancy analysis (RDA) demonstrates the relationship between environmental factors and microbial phyla. (B) Correlation heatmap of soil properties and microbial phyla. By calculating the Spearman correlation coefficient and conducting significance tests (*** p < 0.001, ** p < 0.01, * p < 0.05), hierarchical clustering was performed using the group average method. The color of each color block represents the strength of the correlation coefficient, with red indicating positive correlation and blue indicating negative correlation. The darker the color, the higher the correlation.
Agronomy 15 01320 g004
Table 1. Physical and chemical properties of soils in different plots.
SamplepHEC
(µS/cm)
OM
(g/kg)
AP
(mg/kg)
AN
(mg/kg)
Na+
(mg/kg)
K+
(mg/kg)
WA8.40 ± 0.20 a857.00 ± 29.46 a23.58 ± 0.74 cd7.93 ± 0.04 e53.06 ± 2.84 bcd3.86 ± 0.01 c4.14 ± 0.21 ab
WB8.07 ± 0.15 cd387.33 ± 6.51 d24.12 ± 1.66 cd11.81 ± 0.16 b59.69 ± 5.92 ab4.16 ± 0.02 a4.08 ± 0.05 ab
WC8.07 ± 0.06 cd225.67 ± 7.02 g24.01 ± 0.92 cd7.76 ± 0.15 e42.64 ± 1.64 e3.92 ± 0.03 bc4.21 ± 0.25 a
WD8.10 ± 0.10 bcd285.33 ± 18.04 f25.54 ± 0.83 abc9.43 ± 0.02 d42.64 ± 7.15 e4.12 ± 0.03 a4.21 ± 0.27 a
WE8.10 ± 0.10 bcd336.00 ± 24.52 e22.83 ± 0.32 d9.89 ± 0.04 cd67.27 ± 5.68 a3.86 ± 0.01 c3.91 ± 0.02 b
WF8.23 ± 0.06 abc546.00 ± 21.52 b27.29 ± 0.15 a9.41 ± 0.08 d56.85 ± 7.15 bc3.87 ± 0.01 c3.88 ± 0.06 b
WG8.30 ± 0.10 ab464.33 ± 32.01 c26.81 ± 1.45 ab10.13 ± 0.04 c55.90 ± 7.52 bc4.08 ± 0.22 ab3.96 ± 0.08 ab
WH8.30 ± 0.10 ab173.07 ± 37.41 h25.41 ± 0.96 abc13.86 ± 0.96 a48.32 ± 3.28 cde4.02 ± 0.13 abc4.04 ± 0.01 ab
WI8.00 ± 0.10 d375.00 ± 8.54 de25.25 ± 1.35 bc9.61 ± 0.26 cd45.48 ± 4.34 de4.02 ± 0.15 abc4.01 ± 0.05 ab
EC (electrical conductivity), OM (organic matter), AP (available phosphorus), AN (alkaline nitrogen), Na+ (sodium ion), K+ (potassium ion). Data are averages of three replicates. Values in the same column that do not share lowercase letters indicate significant differences between samples (p < 0.05).
Table 2. Total Se content in different plots in root stems, pods, and soybean seeds.
SampleRoot
(mg/kg)
Stem
(mg/kg)
Pod
(mg/kg)
Seed
(mg/kg)
WA0.034 ± 0.010 d0.065 ± 0.006 ab0.029 ± 0.009 ef0.074 ± 0.005 bc
WB0.103 ± 0.008 bc0.013 ± 0.007 d0.018 ± 0.004 f0.088 ± 0.008 ab
WC0.048 ± 0.015 d0.044 ± 0.009 bc0.060 ± 0.005 cd0.032 ± 0.010 d
WD0.126 ± 0.015 b0.018 ± 0.005 cd0.091 ± 0.005 ab0.080 ± 0.010 abc
WE0.075 ± 0.003 cd0.089 ± 0.012 a0.051 ± 0.017 cde0.055 ± 0.005 cd
WF0.071 ± 0.008 cd0.051 ± 0.009 b0.098 ± 0.009 a0.067 ± 0.011 bc
WG0.127 ± 0.006 b0.082 ± 0.008 a0.070 ± 0.007 bc0.087 ± 0.014 ab
WH0.102 ± 0.007 bc0.084 ± 0.008 a0.060 ± 0.013 cd0.082 ± 0.009 abc
WI0.180 ± 0.033 a0.055 ± 0.015 b0.044 ± 0.007 def0.106 ± 0.017 a
Data are averages of three replicates. Values in the same column that do not share a lowercase letter significantly differ according to Duncan’s multiple range test (p < 0.05). Data are averages of three replicates. Values in the same column that do not share lowercase letters indicate significant differences between samples (p < 0.05).
Table 3. Bioconcentration factor of Se in soybean from different plots.
SampleRootStemPodSeed
WA0.021 ± 0.006 d0.039 ± 0.003 ab0.017 ± 0.006 ef0.044 ± 0.001 ab
WB0.060 ± 0.001 ab0.007 ± 0.004 f0.011 ± 0.002 f0.051 ± 0.002 a
WC0.025 ± 0.009 d0.023 ± 0.005 de0.032 ± 0.004 cd0.017 ± 0.006 d
WD0.064 ± 0.005 ab0.009 ± 0.002 ef0.046 ± 0.003 ab0.041 ± 0.004 abc
WE0.038 ± 0.001 cd0.045 ± 0.006 a0.026 ± 0.008 cde0.028 ± 0.001 cd
WF0.035 ± 0.004 cd0.025 ± 0.005 bcd0.049 ± 0.005 a0.033 ± 0.006 bc
WG0.060 ± 0.003 b0.039 ± 0.006 abc0.033 ± 0.004 bc0.041 ± 0.006 abc
WH0.048 ± 0.005 bc0.039 ± 0.005 ab0.028 ± 0.006 cde0.038 ± 0.006 abc
WI0.079 ± 0.014 a0.024 ± 0.008 cd0.019 ± 0.003 def0.046 ± 0.009 ab
Data are averages of three replicates. Values in the same column that do not share a lowercase letter are significantly different according to Duncan’s multiple range test (p < 0.05).
Table 4. Translocation factor of Se in soybean from different plots.
SampleStem/RootPod/StemSeed/Pod
WA1.986 ± 0.489 a0.440 ± 0.116 b2.711 ± 0.720 b
WB0.124 ± 0.063 d1.613 ± 0.584 b4.951 ± 0.827 a
WC0.944 ± 0.203 b1.403 ± 0.198 b0.536 ± 0.150 d
WD0.142 ± 0.025 d5.252 ± 1.424 a0.877 ± 0.090 d
WE1.188 ± 0.145 b0.565 ± 0.118 b1.147 ± 0.298 d
WF0.710 ± 0.087 bc1.960 ± 0.231 b0.685 ± 0.103 d
WG0.646 ± 0.079 bcd0.864 ± 0.101 b1.227 ± 0.100 d
WH0.821 ± 0.043 bc0.717 ± 0.137 b1.400 ± 0.263 cd
WI0.318 ± 0.120 cd0.826 ± 0.177 b2.421 ± 0.113 bc
Data are averages of three replicates. Values in the same column that do not share a lowercase letter are significantly different according to Duncan’s multiple range test (p < 0.05).
Table 5. Physical and chemical properties of soybean rhizospheric composite soil samples.
SamplepHEC
(µS/cm)
OM
(g/kg)
AP
(mg/kg)
AN
(mg/kg)
Na+
(mg/kg)
K+
(mg/kg)
WA8.07 ± 0.15 c93.33 ± 3.06 d22.23 ± 1.68 a10.16 ± 0.06 a55.90 ± 5.68 ab4.44 ± 0.06 b4.05 ± 0.06 b
WB8.63 ± 0.06 a463.67 ± 34.08 a27.80 ± 1.94 a6.86 ± 0.20 d49.27 ± 7.15 b4.17 ± 0.04 c4.06 ± 0.03 b
WC8.27 ± 0.06 bc199.53 ± 36.83 c15.13 ± 6.40 b3.62 ± 0.08 e56.85 ± 4.34 ab3.88 ± 0.02 d3.85 ± 0.02 b
WD8.40 ± 0.10 ab255.33 ± 38.00 b22.60 ± 1.09 a8.24 ± 0.16 c37.90 ± 5.92 c4.07 ± 0.04 c4.00 ± 0.05 b
WE8.60 ± 0.10 a289.00 ± 14.42 b23.21 ± 2.76 a10.25 ± 0.12 a55.90 ± 5.68 ab3.85±0.00 d3.91 ± 0.02 b
WF8.30 ± 0.10 bc488.33 ± 8.50 a23.82 ± 6.25 a9.06 ± 0.08 b52.11 ± 3.28 ab4.26 ± 0.13 bc4.09 ± 0.04 b
WG8.40 ± 0.26 ab463.67 ± 2.52 a28.29 ± 1.45 a9.05 ± 0.04 b63.48 ± 7.15 a4.81 ± 0.08 a4.10 ± 0.01 b
WH8.10 ± 0.17 c194.30 ± 55.25 c14.89 ± 3.59 b10.21 ± 0.11 a63.48 ± 4.34 a3.94 ± 0.03 d3.93 ± 0.00 b
WI8.10 ± 0.20 c442.67 ± 20.60 a25.95 ± 0.41 a9.18 ± 0.34 b60.64 ± 9.14 ab4.15 ± 0.28 c4.49 ± 0.41 a
Note: EC (electrical conductivity), OM (organic matter), AP (available phosphorus), AN (alkaline nitrogen), Na+ (sodium ion), K+ (potassium ion). Data are averages of three replicates. Values in the same column that do not share lowercase letters indicate significant differences between samples (p < 0.05).
Disclaimer/Publisher’s Note: The statements, opinions and data contained in all publications are solely those of the individual author(s) and contributor(s) and not of MDPI and/or the editor(s). MDPI and/or the editor(s) disclaim responsibility for any injury to people or property resulting from any ideas, methods, instructions or products referred to in the content.

