1. Introduction
Since the 1980s, the Tibetan Plateau (TP) has seen a significant warming trend, approximately double the global average [
1,
2]. This trend presents substantial challenges to the ecological security of the TP, a region known for its sensitivity to climate changes and fragile ecosystems [
3,
4]. The warming both impacts local communities and has broader implications for global climate dynamics [
5,
6]
Previous research on the TP’s vegetation ecological quality has primarily focused on the spatial distribution of net primary productivity (NPP) across various regions, vegetation types, and models, as well as the correlations between the vegetation cover and climate factors [
7,
8]. For instance, research utilizing the Global Inventory Modelling and Mapping Studies normalized difference vegetation index (NDVI) [
9] and multiple models has explored the variation in vegetation and surface temperature on the TP and their interrelationship [
5,
9,
10,
11]. Other studies have examined the spatio-temporal variation types on the TP and their connections to climatic factors [
11,
12,
13]. The influence of meteorological drivers on vegetation coverage has been investigated [
14], revealing that current vegetation on the TP is in a stable recovery state, which is closely associated with temperature and precipitation patterns [
15,
16,
17,
18]. In addition, several studies analyzed the spatial distribution characteristics of fractional vegetation cover (FVC) variations in alpine grasslands of the TP and their climate relationships [
19,
20] using ecological models [
21], time-lag cross-correlation methods, and diverse data sources, including field measurement, remote sensing, frozen soil distribution, soil water and heat data, and meteorological data.
Vegetation ecological quality encompasses both NPP and vegetation cover, along with their combined impact. A comprehensive ecological quality index (EQI), derived from NPP and vegetation cover, has been utilized to evaluate vegetation ecological quality in regions such as the Shiyang River Basin, the Yellow River Basin [
22,
23], the Tarim Basin, and even the entire region of China [
24,
25,
26]. In this study, we employed the EQI to quantitatively analyze the spatio-temporal evolution of vegetation ecological quality on the TP. Additionally, we examined how the interaction between the westerlies and monsoons, which reflects atmospheric circulation patterns, influences vegetation ecological quality. This research aimed to enhance the understanding of ecological environment changes on the TP and provide scientific insights for governmental decision-making.
2. Materials and Methods
2.1. Study Area
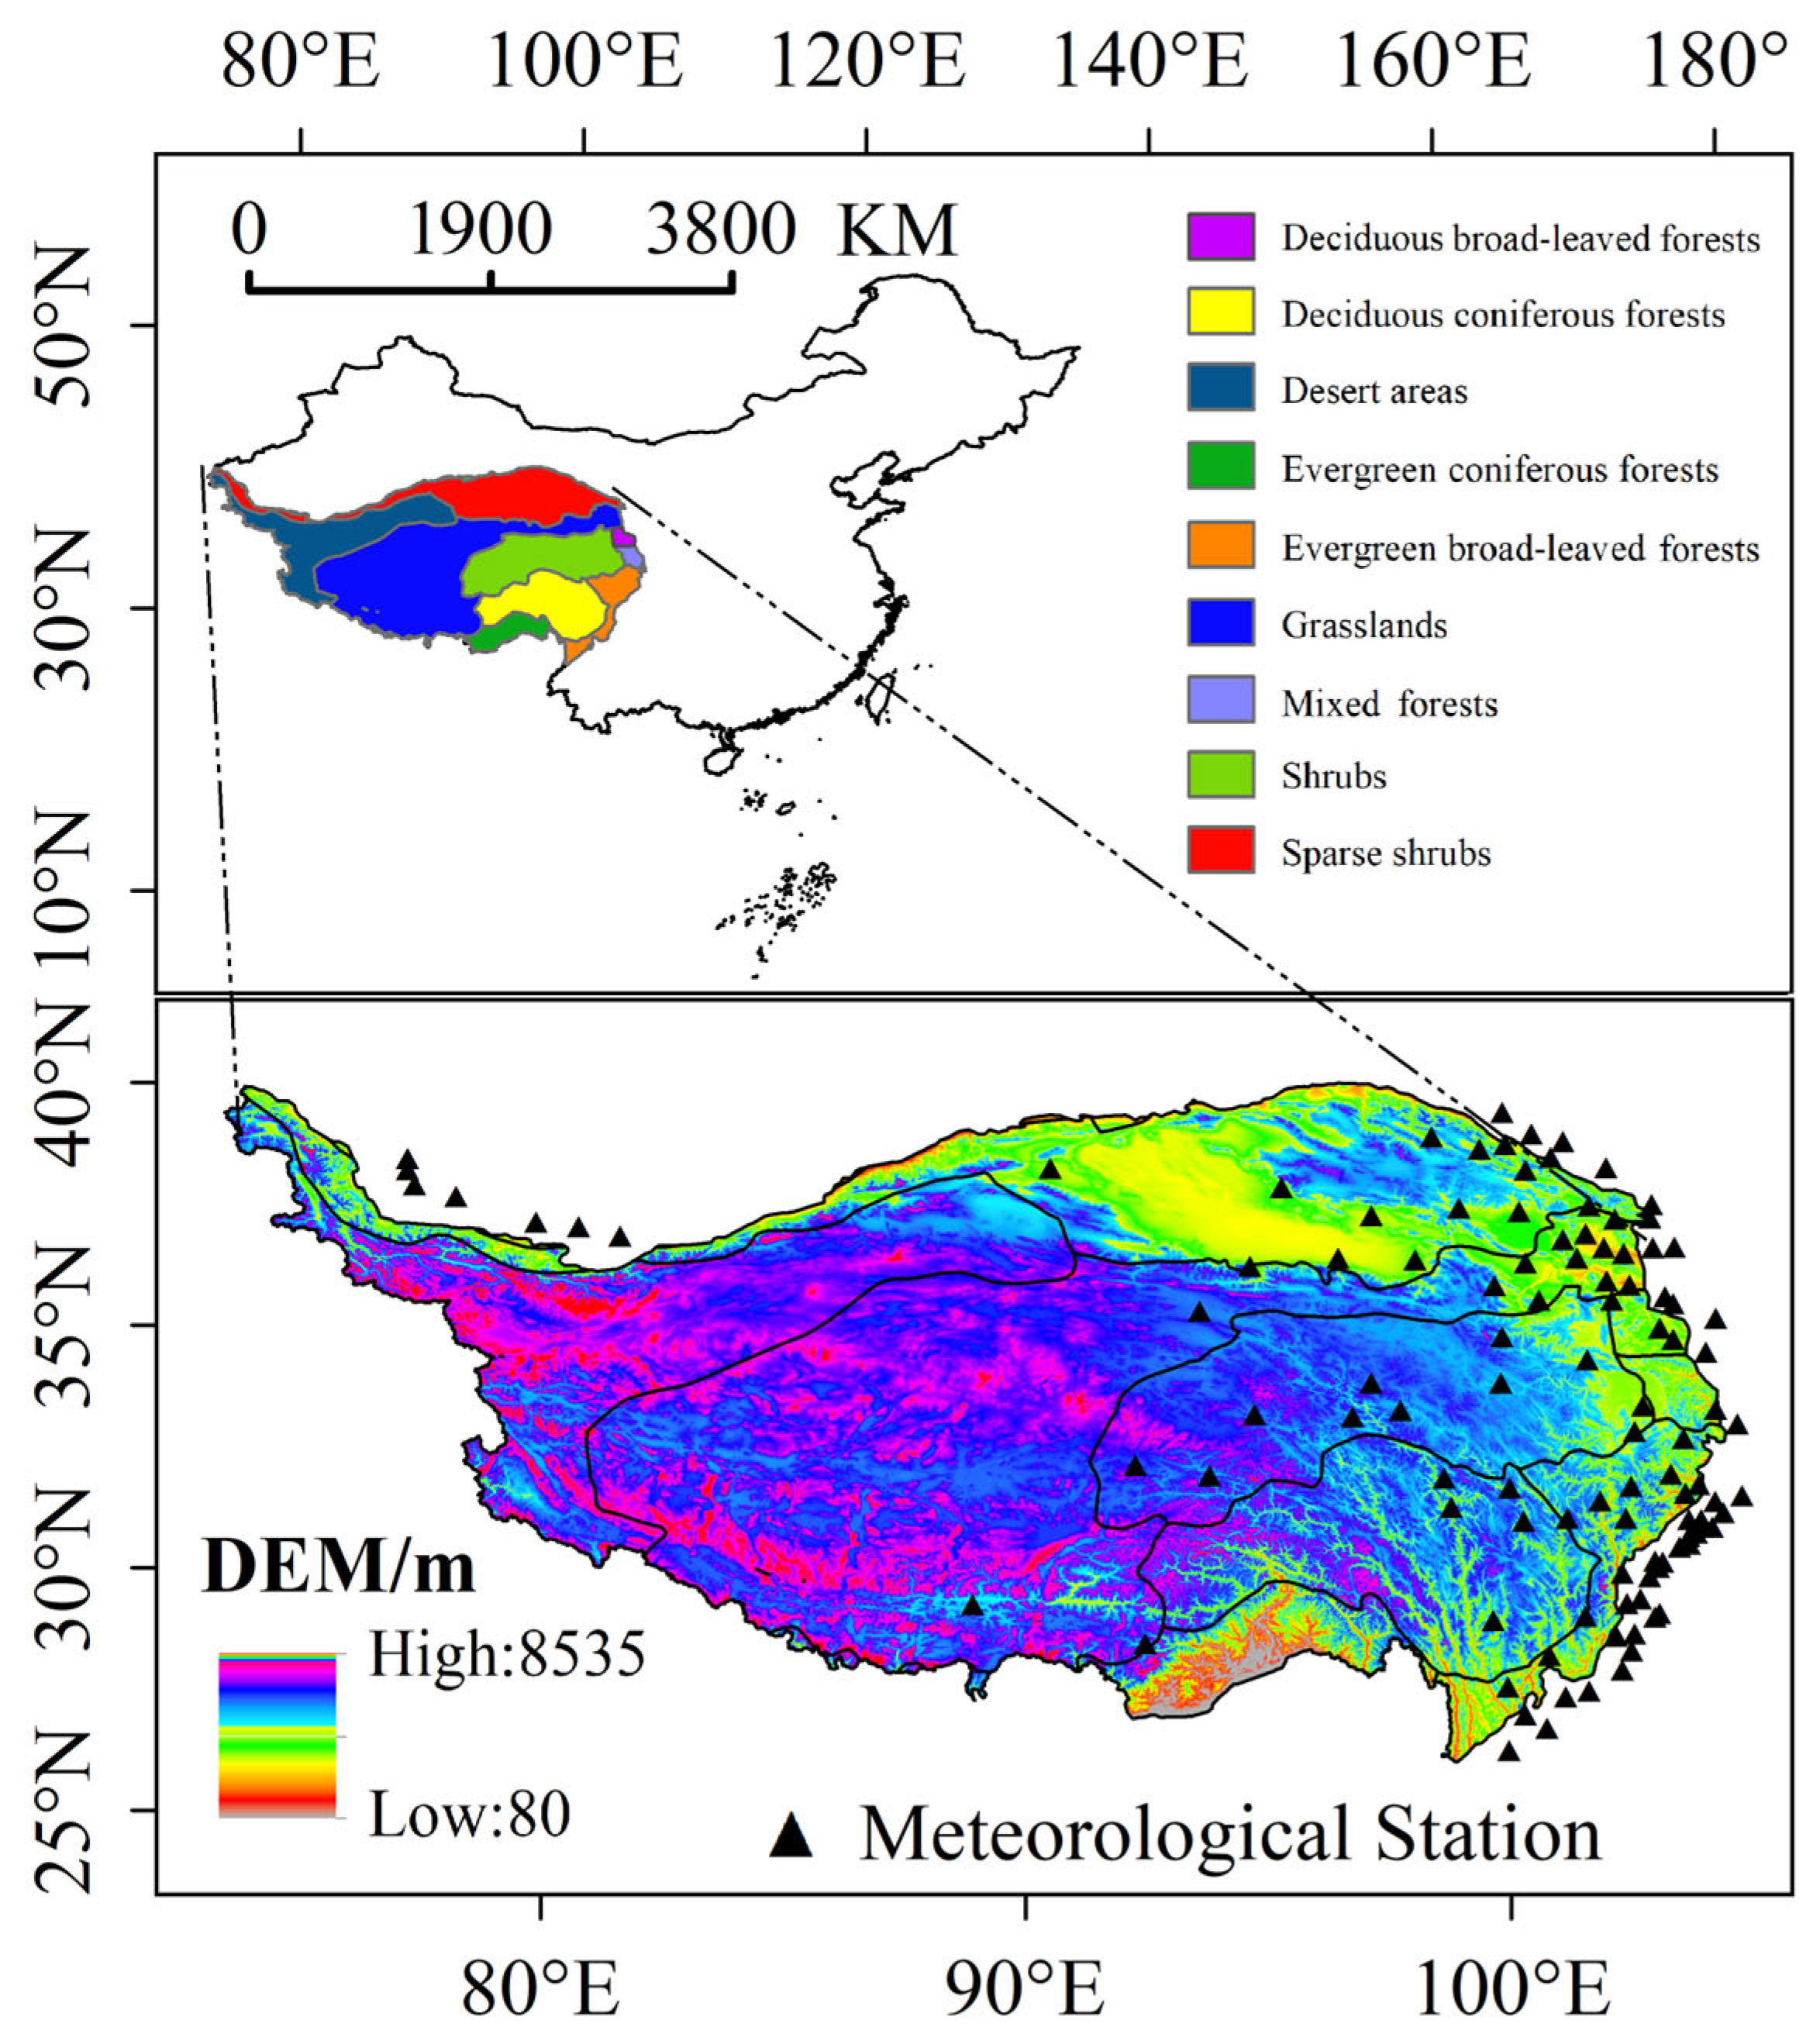
The TP is situated between 25°59′37″ N and 39°49′33″ N latitude and 73°29′56″ E and 104°40′20″ longitude, covering approximately 2,500,000 square kilometers with an average altitude exceeding 4000 m [
27]. Its annual average temperature ranges from −4 °C to 13.4 °C, and its precipitation varies significantly across different regions. During summer, most areas receive ample rainfall due to the southwesterly monsoon and warm, moist air from the Indian Ocean. Conversely, winter sees stronger winds and reduced precipitation because of the influence of the westerly jet stream. From the northwest to the southeast, the plateau transitions through arid, semi-arid, semi-humid, and humid zones based on climate characteristics. Consequently, the vegetation types are diverse and exhibit clear geographical variations (
Figure 1).
2.2. Data
This study utilized NDVI remote sensing data from the Moderate Resolution Imaging Spectroradiometer (MODIS) vegetation index product (MOD13A3) provided by the National Aeronautics and Space Administration, with a spatial resolution of 500 m. The NDVI data were preprocessed using Aeronautical Reconnaissance Coverage Geographic Information System (ArcGIS 10.2) and the Environment for Visualizing Images software (
https://www.nv5geospatialsoftware.com/docs/using_envi_Home.html, (accessed on 3 August 2022)), and the annual maximum NDVI was extracted via a maximum value composite method. The NPP data (g C m
−2 a
−1) come from the MOD17A3 dataset of the MODIS product, also at a 500 m resolution. In addition, the basic data, such as vegetation types, land-use types, elevation, and boundaries, were sourced from the National Tibetan Plateau Data Center (
http://data.Tpdc.Ac.cn, (accessed on 3 August 2022)) and Resource and Environmental Science and Data Center (
https://www.resdc.cn, (accessed on 3 August 2022)). Meteorological data were obtained from the Daily Meteorological Dataset of Basic Meteorological Elements of China’s National Surface Weather Station (version 3.0), released by the National Meteorological Information Center. Daily temperature and precipitation data from 108 meteorological stations on the TP were used to calculate the annual average temperature and total annual rainfall. These data were then interpolated to a 0.25° × 0.25° grid using ordinary Kriging. The ArcGIS method for extracting multiple values to points was employed to convert raster data to grid data, and the ArcGIS resampling method unified the resolutions of the vegetation indices and meteorological data.
2.3. Methods and Evaluation Indicator
2.3.1. Ecological and Circulation Indexes
Fractional Vegetation Cover
The NDVI is the best factor to characterize vegetation growth [
28], which has an extremely significant linear correlation with the FVC. In this research, we use the NDVI to extract the FVC information on the TP, and Equation (1) shows the calculation [
23].
where
denotes the NDVI value in naked land, and its value is the NDVI value at the accumulated probability of 5%.
represents the NDVI value of the region covered by vegetation completely, and its value is the NDVI value at the accumulated probability of 95%.
Ecological Quality Index of Vegetation
The NPP and FVC of vegetation are two critical indicators reflecting the ecological quality of regional ecosystems. The vegetation EQI based on the NPP and FVC is selected as the evaluation indicator to assess the variation characteristics of regional vegetation ecological quality [
29,
30], and it is calculated using the following formulas:
where the values of the EQI and FVC vary in the ranges of 0–100 and 0–1, respectively.
indicates the maximum of the NPP during the assessment period, and f1 and f2 denote the weight coefficients, with values of 0.5. According to the Technical Specification for Investigation and Assessment of National Ecological Status: Ecosystem Patterns Assessment [
31] released by the Ministry of Ecology and Environment, the vegetation ecological quality on the TP is classified into five levels, as shown in
Table 1.
Monsoon and Westerly Indexes
The East Asian summer monsoon index (EMI) [
32] is calculated with Equation (3).
where “Nor” indicates the normalization of data, and u represents the 200 hPa zonal wind field.
The South Asian summer monsoon index (SMI) is the regional average of the seasonal dynamic normalized index at 850 hPa in the South Asian region (5–22.5° N, 35–97.5° E) from June to August [
33].
where
denotes the standardized variability of dynamic circulation during summer in a certain year (n),
the climatic mean of wind vector in January,
the average of the January and July climatic mean of wind vector, and the
the average wind vector during summer in a certain year (n).
The 600 hPa vorticity distribution over the TP is calculated based on the wind field. In summer, the TP is controlled via a positive vorticity center. Considering the stable establishment of positive vorticity, we take the contour of positive vorticity of five units (1 unit = 1 × 10
−6 s
−1) as the characteristic isoline. The grid area with vorticity values equal to or above five units within the region (30–40° N, 70–105° E) is defined as the vorticity range of the cyclonic circulation, i.e., the vorticity area of the TP vortex (IVarea) [
34].
The westerly index (WI) is the average difference of the 500 hPa geopotential height between 35°N and 50° N in 70° E–110° E during June–August [
16].
where
N represents the number of equi-interval longitudes selected along the latitudinal circle, and the interval is 2.5 longitudinal distances.
H denotes the 500 hPa geopotential height.
2.3.2. Statistical Analysis Method
Trend Analysis
Based on a univariate linear regression method, the variation trend of the vegetation EQI on the TP from 2001 to 2020 is analyzed, which is represented by the trend ratio [
35]. The calculation is expressed in Equation (6).
where n (n = 21) is the length of the temporal sequence,
i is a certain year of the temporal sequence,
the EQI value in the
year, and “SLOPE” the trend ratio which refers to the variation rate of an index with time. A positive SLOPE value indicates an increasing trend in the EQI, and a negative SLOPE value represents a decreasing trend in the EQI.
The statistical test is carried out using a combination of the Theil-Sen Median trend analysis [
36] and Mann-Kendall statistical test method (α = 0.05, Z = 1.96). Based on this, we perform pixel analyses of ecological quality variation trends of vegetation on the TP from 2001 to 2020. The Hurst index of vegetation ecological quality variation is calculated through the R/S analysis method, reflecting the sustainability of variation trends. The Hurst index (Hu) value varies from 0 to 1. When
, it indicates that the variation trend is unsustainable to some extent, i.e., the future trend is opposite to that in the past. When
, the variation trend is sustainable, i.e., the future trend is consistent with that in the past. When Hu = 0.5, the future trend is not affected by that in the past. Combined with the result of the Theil–Sen Median trend analysis, four types of trends, namely future degradation trend, persistent degradation trend, future improvement trend and persistent improvement trend, are obtained. The significance test is performed at the significance level of 0.01 (
) (
Table 2).
Correlation Analysis Method
In this study, based on the Pearson correlation coefficient (R), the correlations of vegetation ecological quality with meteorological elements and circulation systems, as well as the significance of these correlations, are investigated. When the absolute value of R () is 0.575 or above, and R passes the significance test at the significance level of 0.01 (), it indicates that the correlation is extremely significant. When , it suggests that the correlation is significant. When , the correlation is not significant.
Partial correlation analysis is conducted with a second-order partial correlation analysis method. If the first and second variables are associated with the third and fourth variables simultaneously, the impacts of the third and fourth variables are excluded, and only the correlation between the first and second variables is analyzed. This correlation is assessed via partial correlation r [
21], and its calculation is shown in Equation (7).
where
,
and
represent the first-order partial correlation coefficients between x and y, between x and w, and between y and w [
37], and the
T-test is applied to analyze the significance. The significance of these partial correlations is classified into four grades: significant positive correlation (
), non-significant positive correlation (
), significant negative correlation (
), and non-significant negative correlation (
).
Regional Area Ratio
For the area ratios of the annual EQI and meteorological elements for different vegetation types, as well as the influenced area ratios of the annual EQI through meteorological elements, they are represented as the percentages of regional area of element variations for each vegetation type to the total area of this vegetation type.
3. Results
3.1. Variations Characters of Different Vegetation Indexes
3.1.1. Spatio-Temporal Variations of Vegetation Net Primary Productivity and Fractional Vegetation Cover
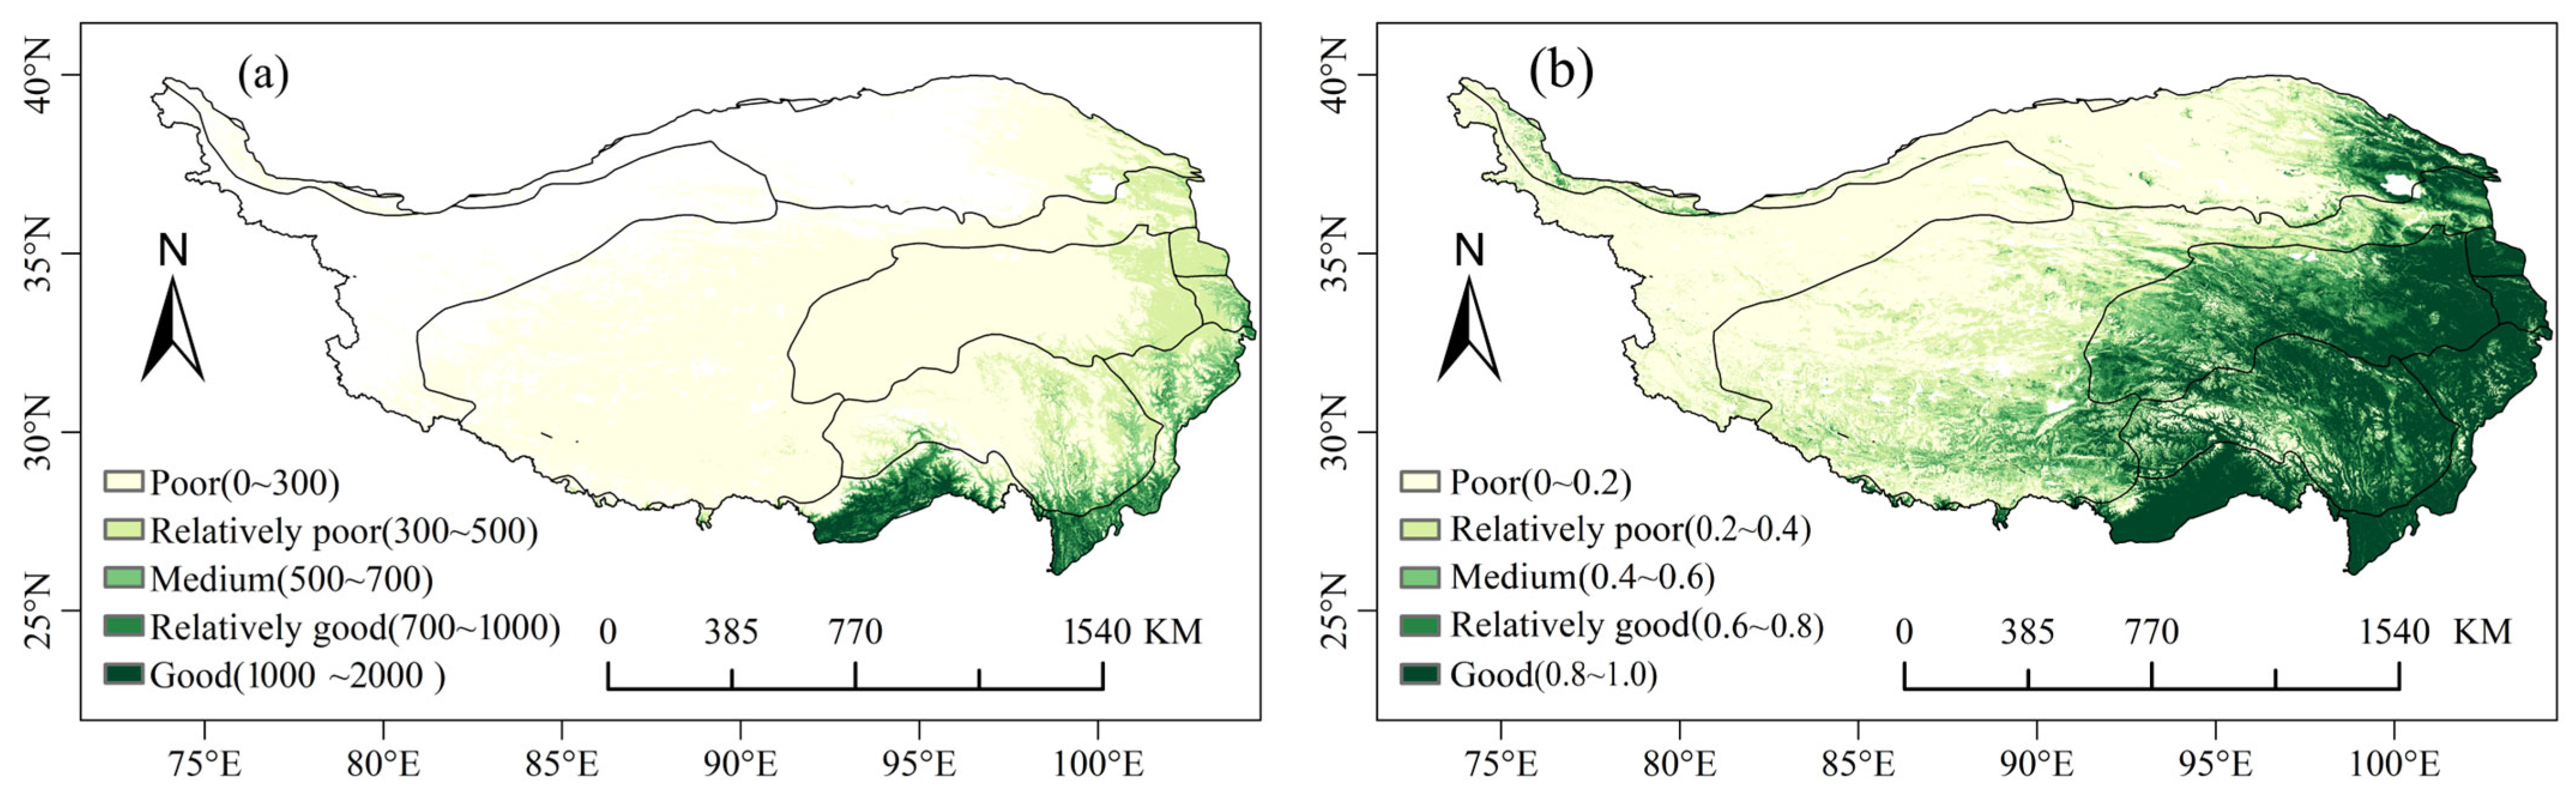
From 2001 to 2020, the overall NPP and FVC of vegetation on the TP display fluctuating and increasing trends. The rising rate of the annual average NPP is 5.4 g cm
−2 (decade)
−1. The maximum of the annual average NPP appears in 2006 (232.1 g cm
−2), and the minimum appears in 2004 (203.6 g cm
−2). The rising rate of the annual average FVC is 0.008 (decade)
−1. The maximum (0.4) of the annual average FVC can be found in 2020, and the minimum (0.37) appears in 2001. Regarding spatial distributions, the NPP and the FVC on the TP are higher in the southeast than those in the northwest. The areas with large differences in the NPP and FVC are mainly found in shrubs, grasslands in the east, deciduous–coniferous forests, deciduous broad-leaved forests, mixed forests, and evergreen broad-leaved forests (
Figure 2).
3.1.2. Spatio-Temporal Variations of Vegetation Ecological Quality
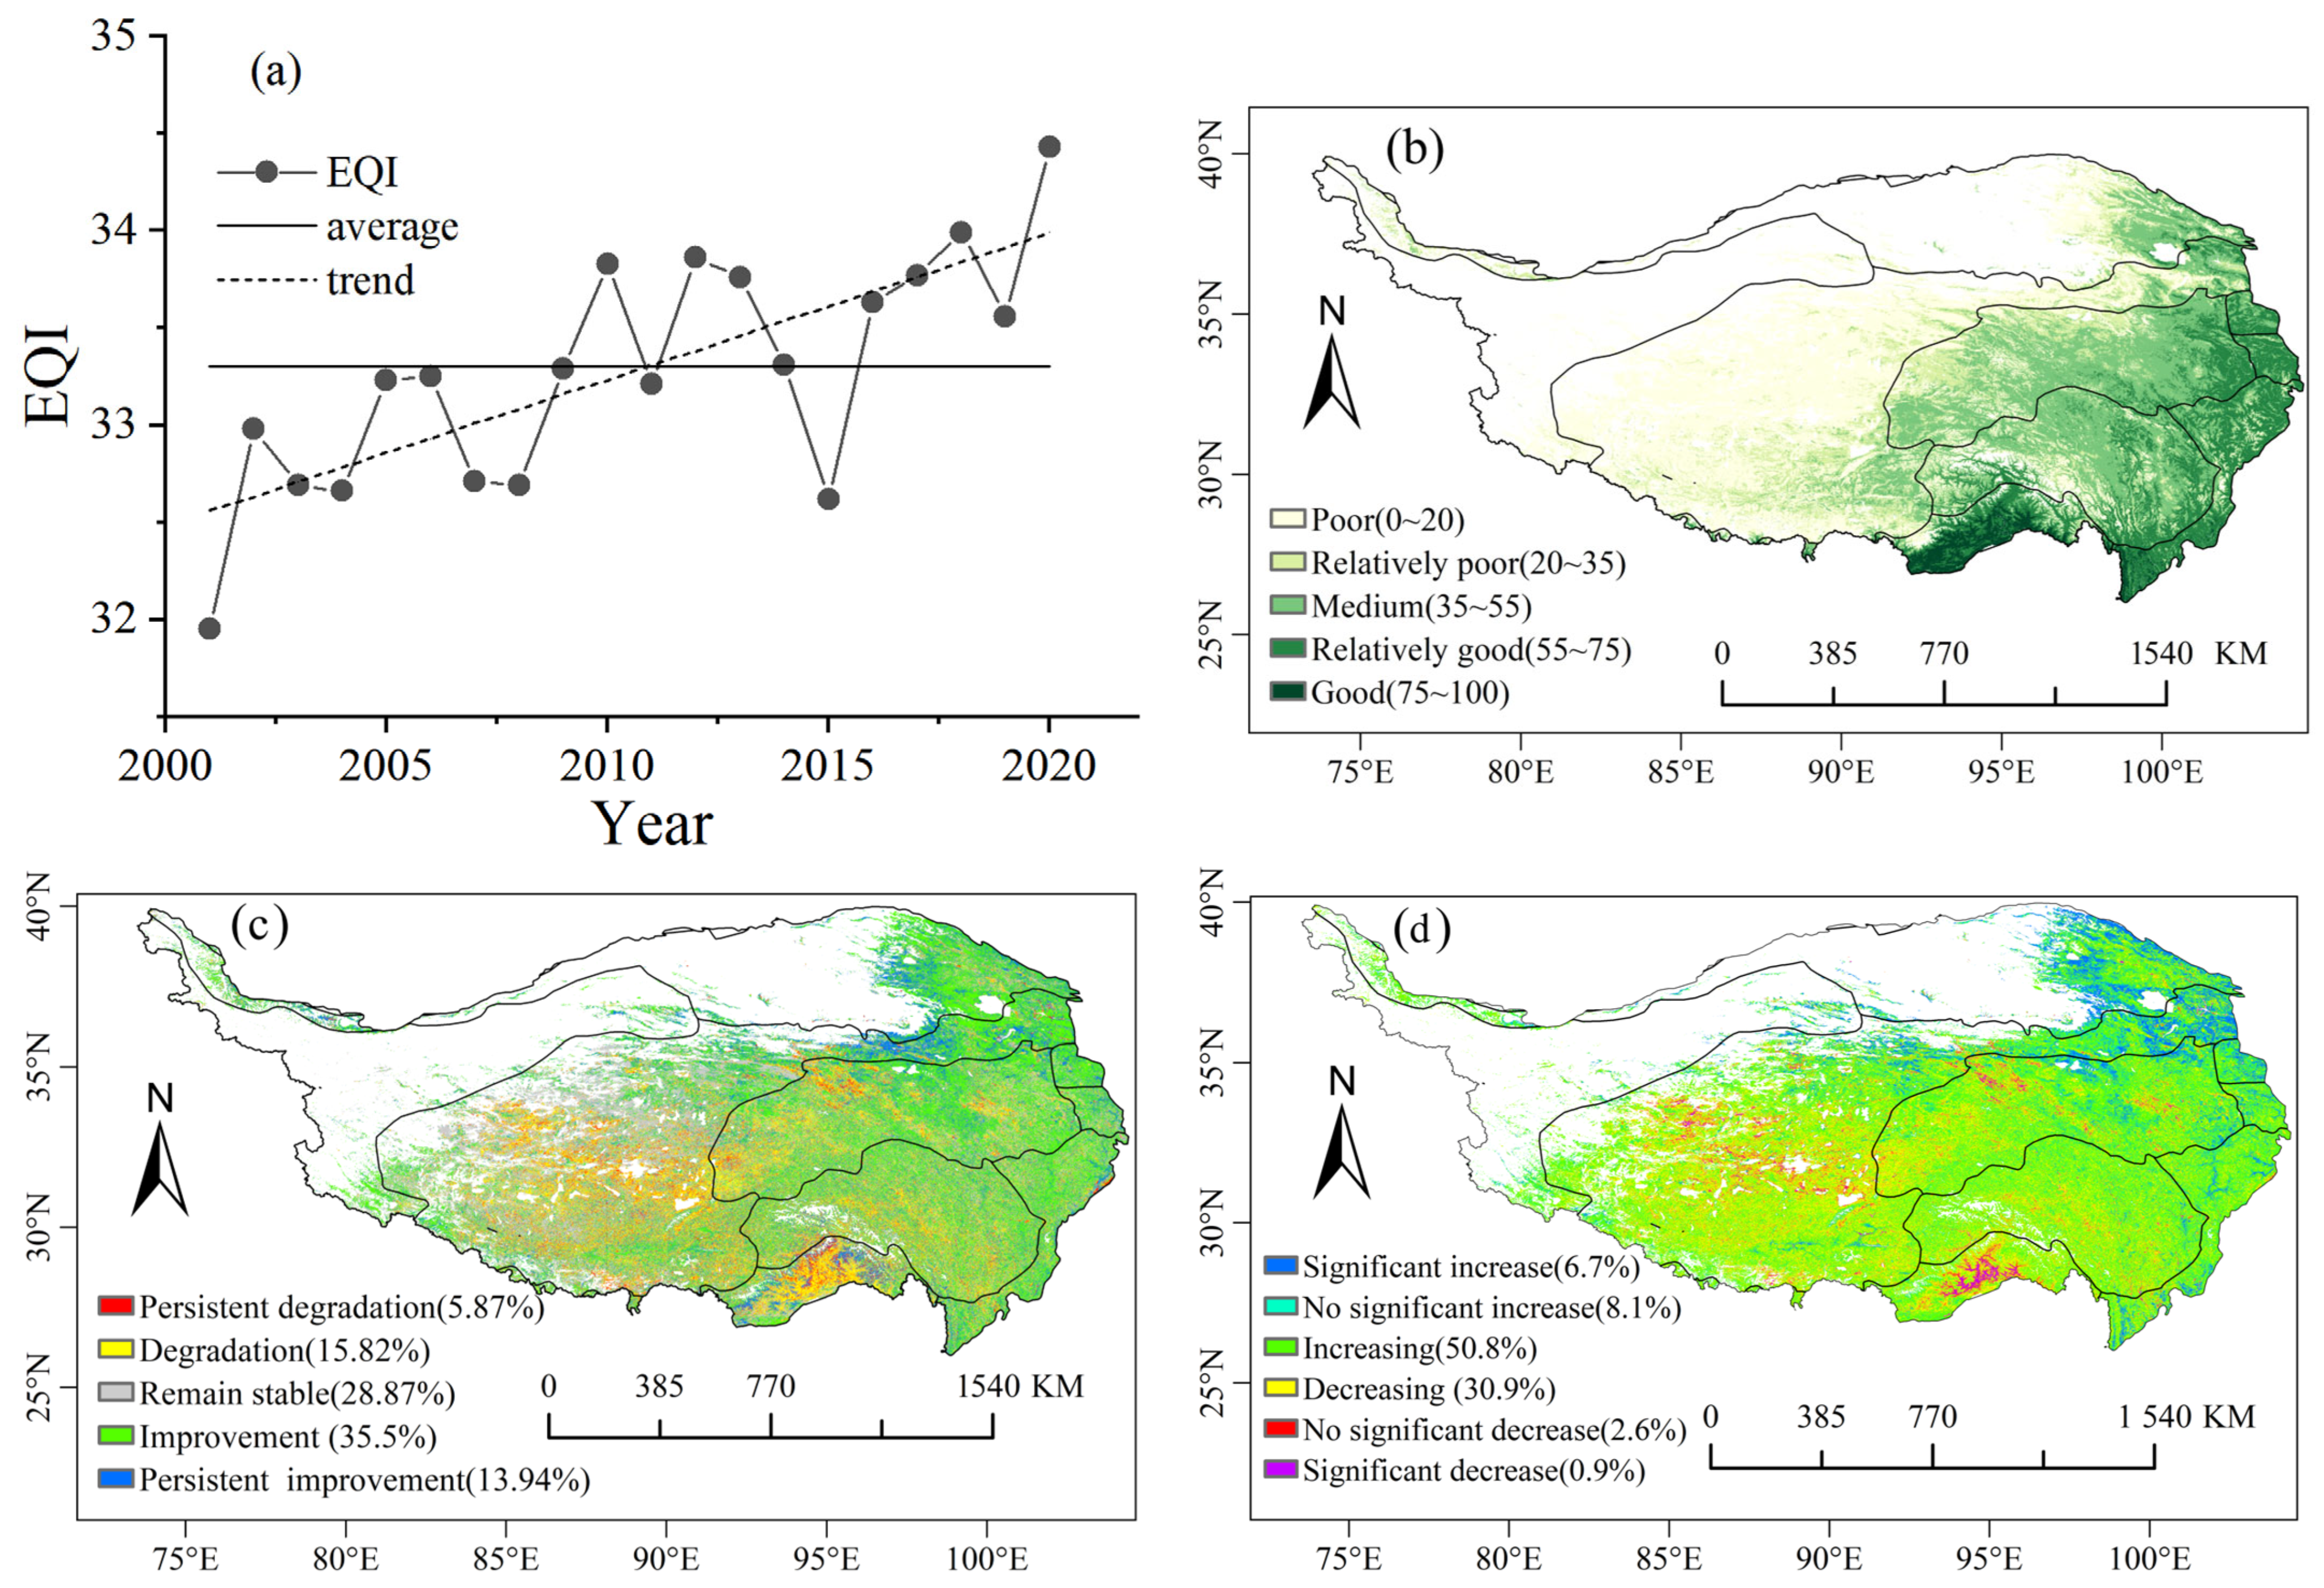
The annual EQI of vegetation on the TP shows an overall fluctuating and increasing trend, with an increasing rate of 0.8 (decade)
−1, reaching its maximum value (34.4) in 2020 (
Figure 3a). Specifically, the EQI reaches a good level in 2.1% of the areas, which are located in the southern part of evergreen coniferous forests. Of the areas, 15.3% show a relatively good level of the EQI, mainly in evergreen broad-leaved forests and evergreen coniferous forests. Additionally, 29.2% of the areas have a medium level of the EQI, and they are mainly distributed in broad-leaved forests and coniferous forests, while 16.6% of the areas display a relatively poor level of the EQI, mainly distributed in shrubs, the western part of grasslands, deciduous–coniferous forests, and the western part of sparse shrubs. The EQI is at a poor level in most areas of sparse shrubs and grasslands, which account for about 36.8% of the TP area (
Figure 3b).
The areas where vegetation ecological quality has improved account for 65.6% of the TP, which are mainly located in sparse grasslands, the northern part of grasslands, and mixed forests. Particularly, the areas with significant improvement and extremely significant improvement account for 8.1% and 6.7%, respectively. The areas with a degradation trend of vegetation ecological quality account for 34.4%, mainly distributed in the central and southern parts of grasslands and evergreen coniferous forests. Among them, the areas with significant degradation and extremely significant degradation trends account for approximately 3% in total (
Figure 3c). In the future, the areas with an improvement trend of vegetation ecological quality on the TP will be larger than those with a degradation trend. The areas with an improvement trend and a persistent improvement trend account for 35.5% and 13.9%, respectively. Additionally, the areas with a degradation trend and a persistent degradation trend account for 15.8% and 5.9%, respectively (
Figure 3d and
Table 3).
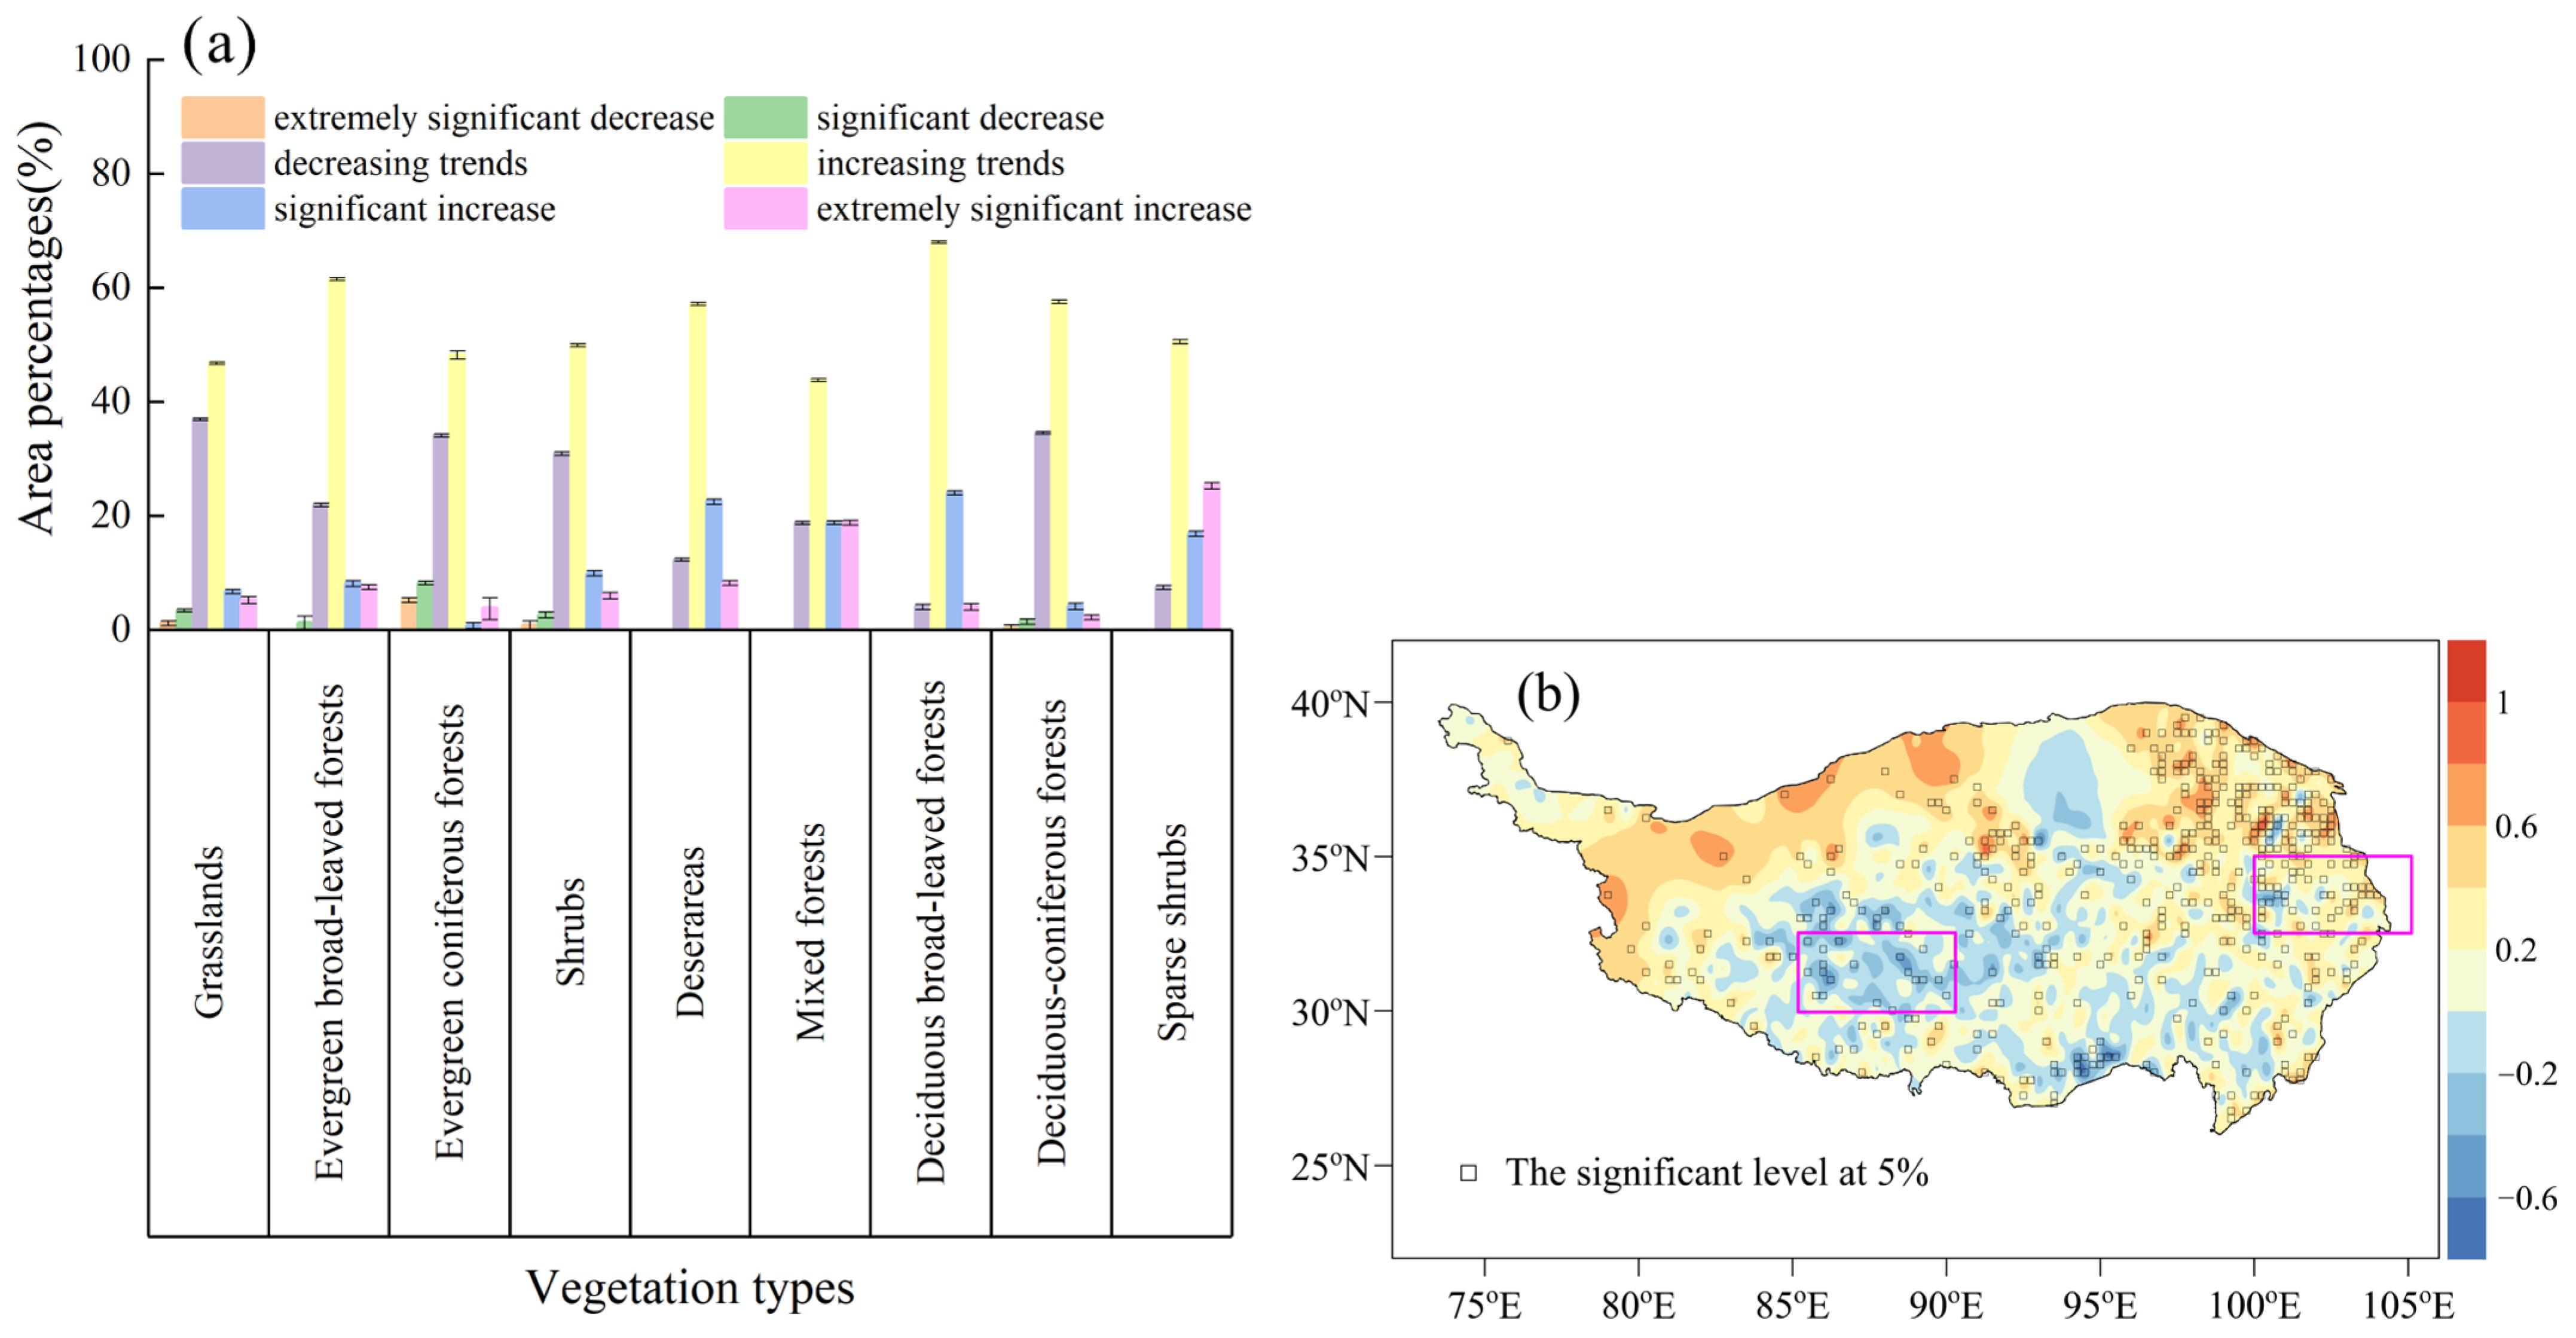
The EQIs for different vegetation types on the TP all show increasing trends, and areas with increasing trends (all the area proportions greater than 50%) are larger than those with decreasing trends (
Figure 4). The rising trends of the EQIs for sparse shrubs, deserts, and deciduous broad-leaved forests are relatively remarkable, all above 1.1 (decade)
−1, with area proportions of 96.0%, 92.6%, and 87.8%, respectively. Specifically, the area with an extremely significant increase in the EQI is the largest for sparse shrubs, accounting for 25.2%. In terms of mixed forests, deserts, sparse shrubs, and deciduous broad-leaved forests, the area proportions for decreasing EQI trends are all below 20%, and there is no area with an extremely significant decrease or a significant decrease. The increasing trend rates of the EQIs for evergreen coniferous forests and shrubs are about 0.5 (decade)
−1, smaller than those of the other vegetation types. Among them, the area with a decreasing EQI trend is the maximum (47.4%) in evergreen coniferous forests, followed by grasslands (41.4%).
3.2. Response of Vegetation Ecological Quality on the Tibetan Plateau to Climate Change
3.2.1. Characteristics of Climate Change
The annual average temperature on the TP shows an increasing trend with a rate of 0.18 °C (decade)
−1. The warming rate in most areas is between 0.1 °C (decade)
−1 and 0.6 °C (decade)
−1, and in the southwest and most areas of the east, the warming rate varies from 0.6 °C (decade)
−1 to 0.8 °C (decade)
−1. Only the northwestern edge and parts of the east show a weak cooling trend. On the TP, about 91.9% of the area displays an increasing trend in annual average temperature, and about 20.9% of the area shows a significant increasing trend. Specifically, more than 95% of mixed forests and grasslands show a warming trend, and 61.3% of mixed forests and 21.0% of grasslands have a significant warming trend. The warming areas of deciduous–coniferous forests and shrubs are relatively smaller than those of mixed forests and grasslands (
Figure 5a). Moreover, 8.1% of the TP area shows a decreasing trend in annual average temperature, and only 0.4% of the area displays a significant cooling trend. Among them, 43.0% of evergreen broad-leaved forests exhibit a cooling trend, and 9.2% of these areas show a significant cooling trend. In addition, 16.0% of deserts and sparse shrubs show a non-significant cooling trend.
The annual rainfall amount on the TP exhibits an increasing trend with a rate of 27.5 mm (decade)
−1, and the increasing trend rate in the northeast is between 40 mm (decade)
−1 and 160 mm (decade)
−1. The areas with an increasing trend of annual precipitation cover about 92.1% of the TP, and the areas with a significant increasing trend account for 14.1% of the TP. Particularly, the areas with a significant increasing trend of annual rainfall are the most in mixed forests (93.5%), followed by evergreen broad-leaved forests (47.7%) and shrubs (44.2%). However, the annual rainfall in the southeast of the TP shows a decreasing trend with a rate of 10–80 mm (decade)
−1, as shown in
Figure 4b. In terms of evergreen coniferous forests, evergreen broad-leaved forests and deciduous-coniferous forests, the areas with a significant decreasing trend of annual rainfall account for 25–70% of their respective total areas (
Figure 5b).
3.2.2. Response of Vegetation Ecological Quality to Climate Change
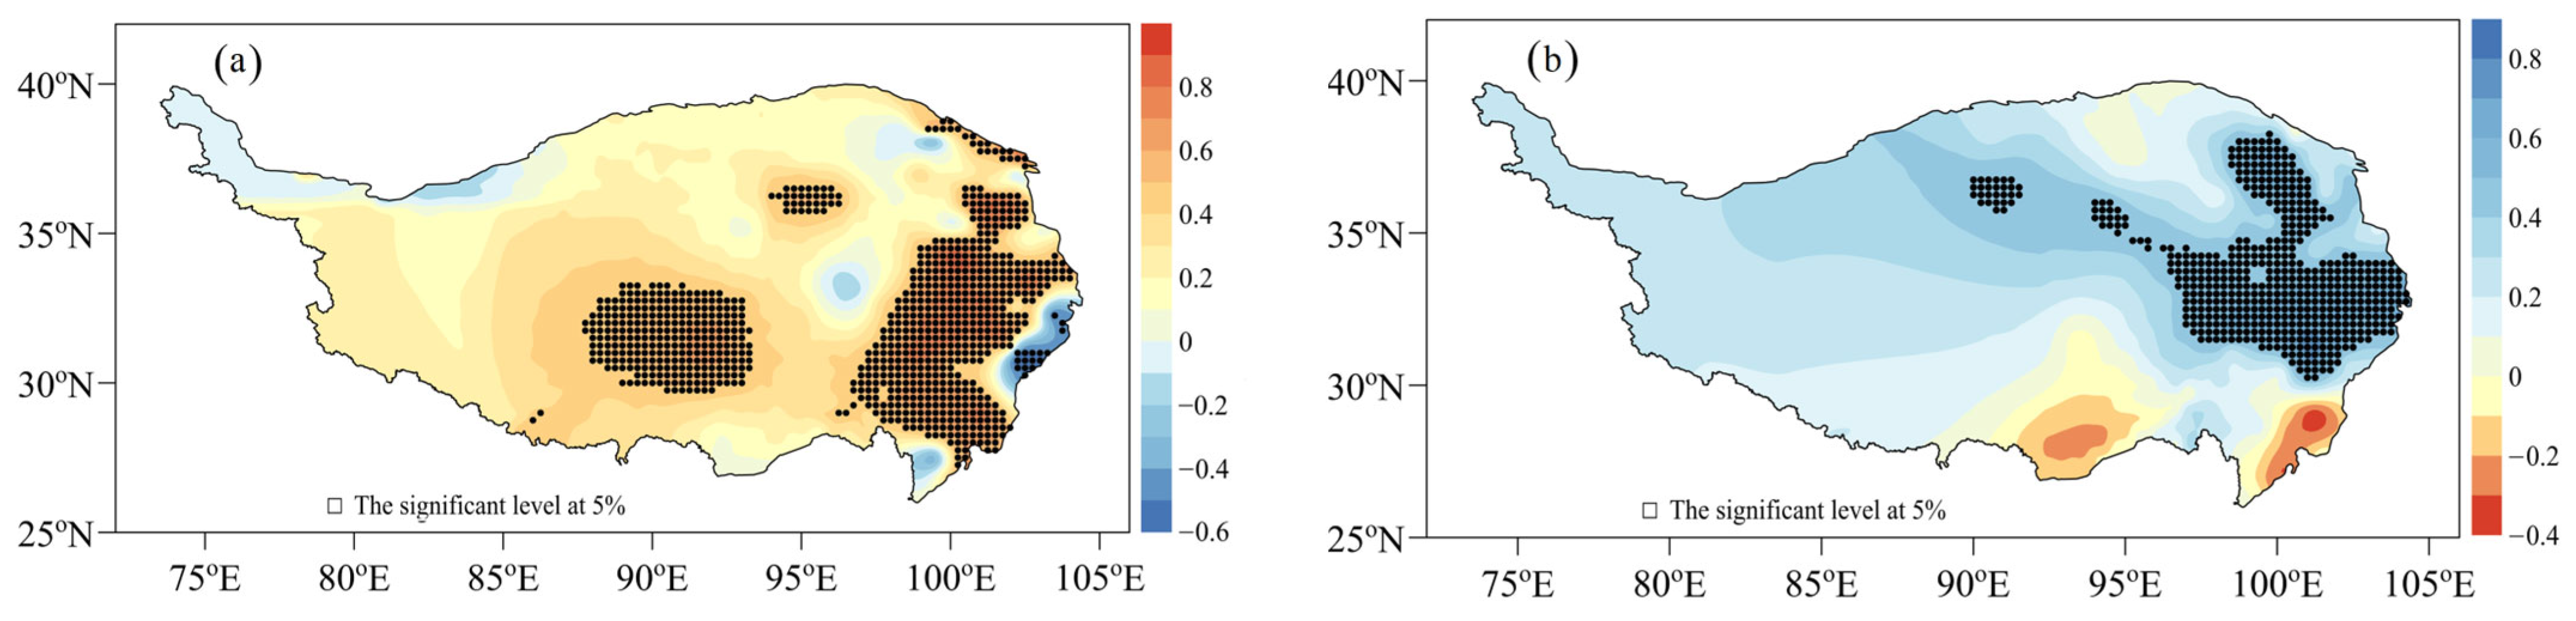
Climate is an essential factor influencing vegetation growth. The high-value areas of positive and negative correlations between annual average temperature and vegetation ecological quality are located in the east and southwest of the TP, respectively (
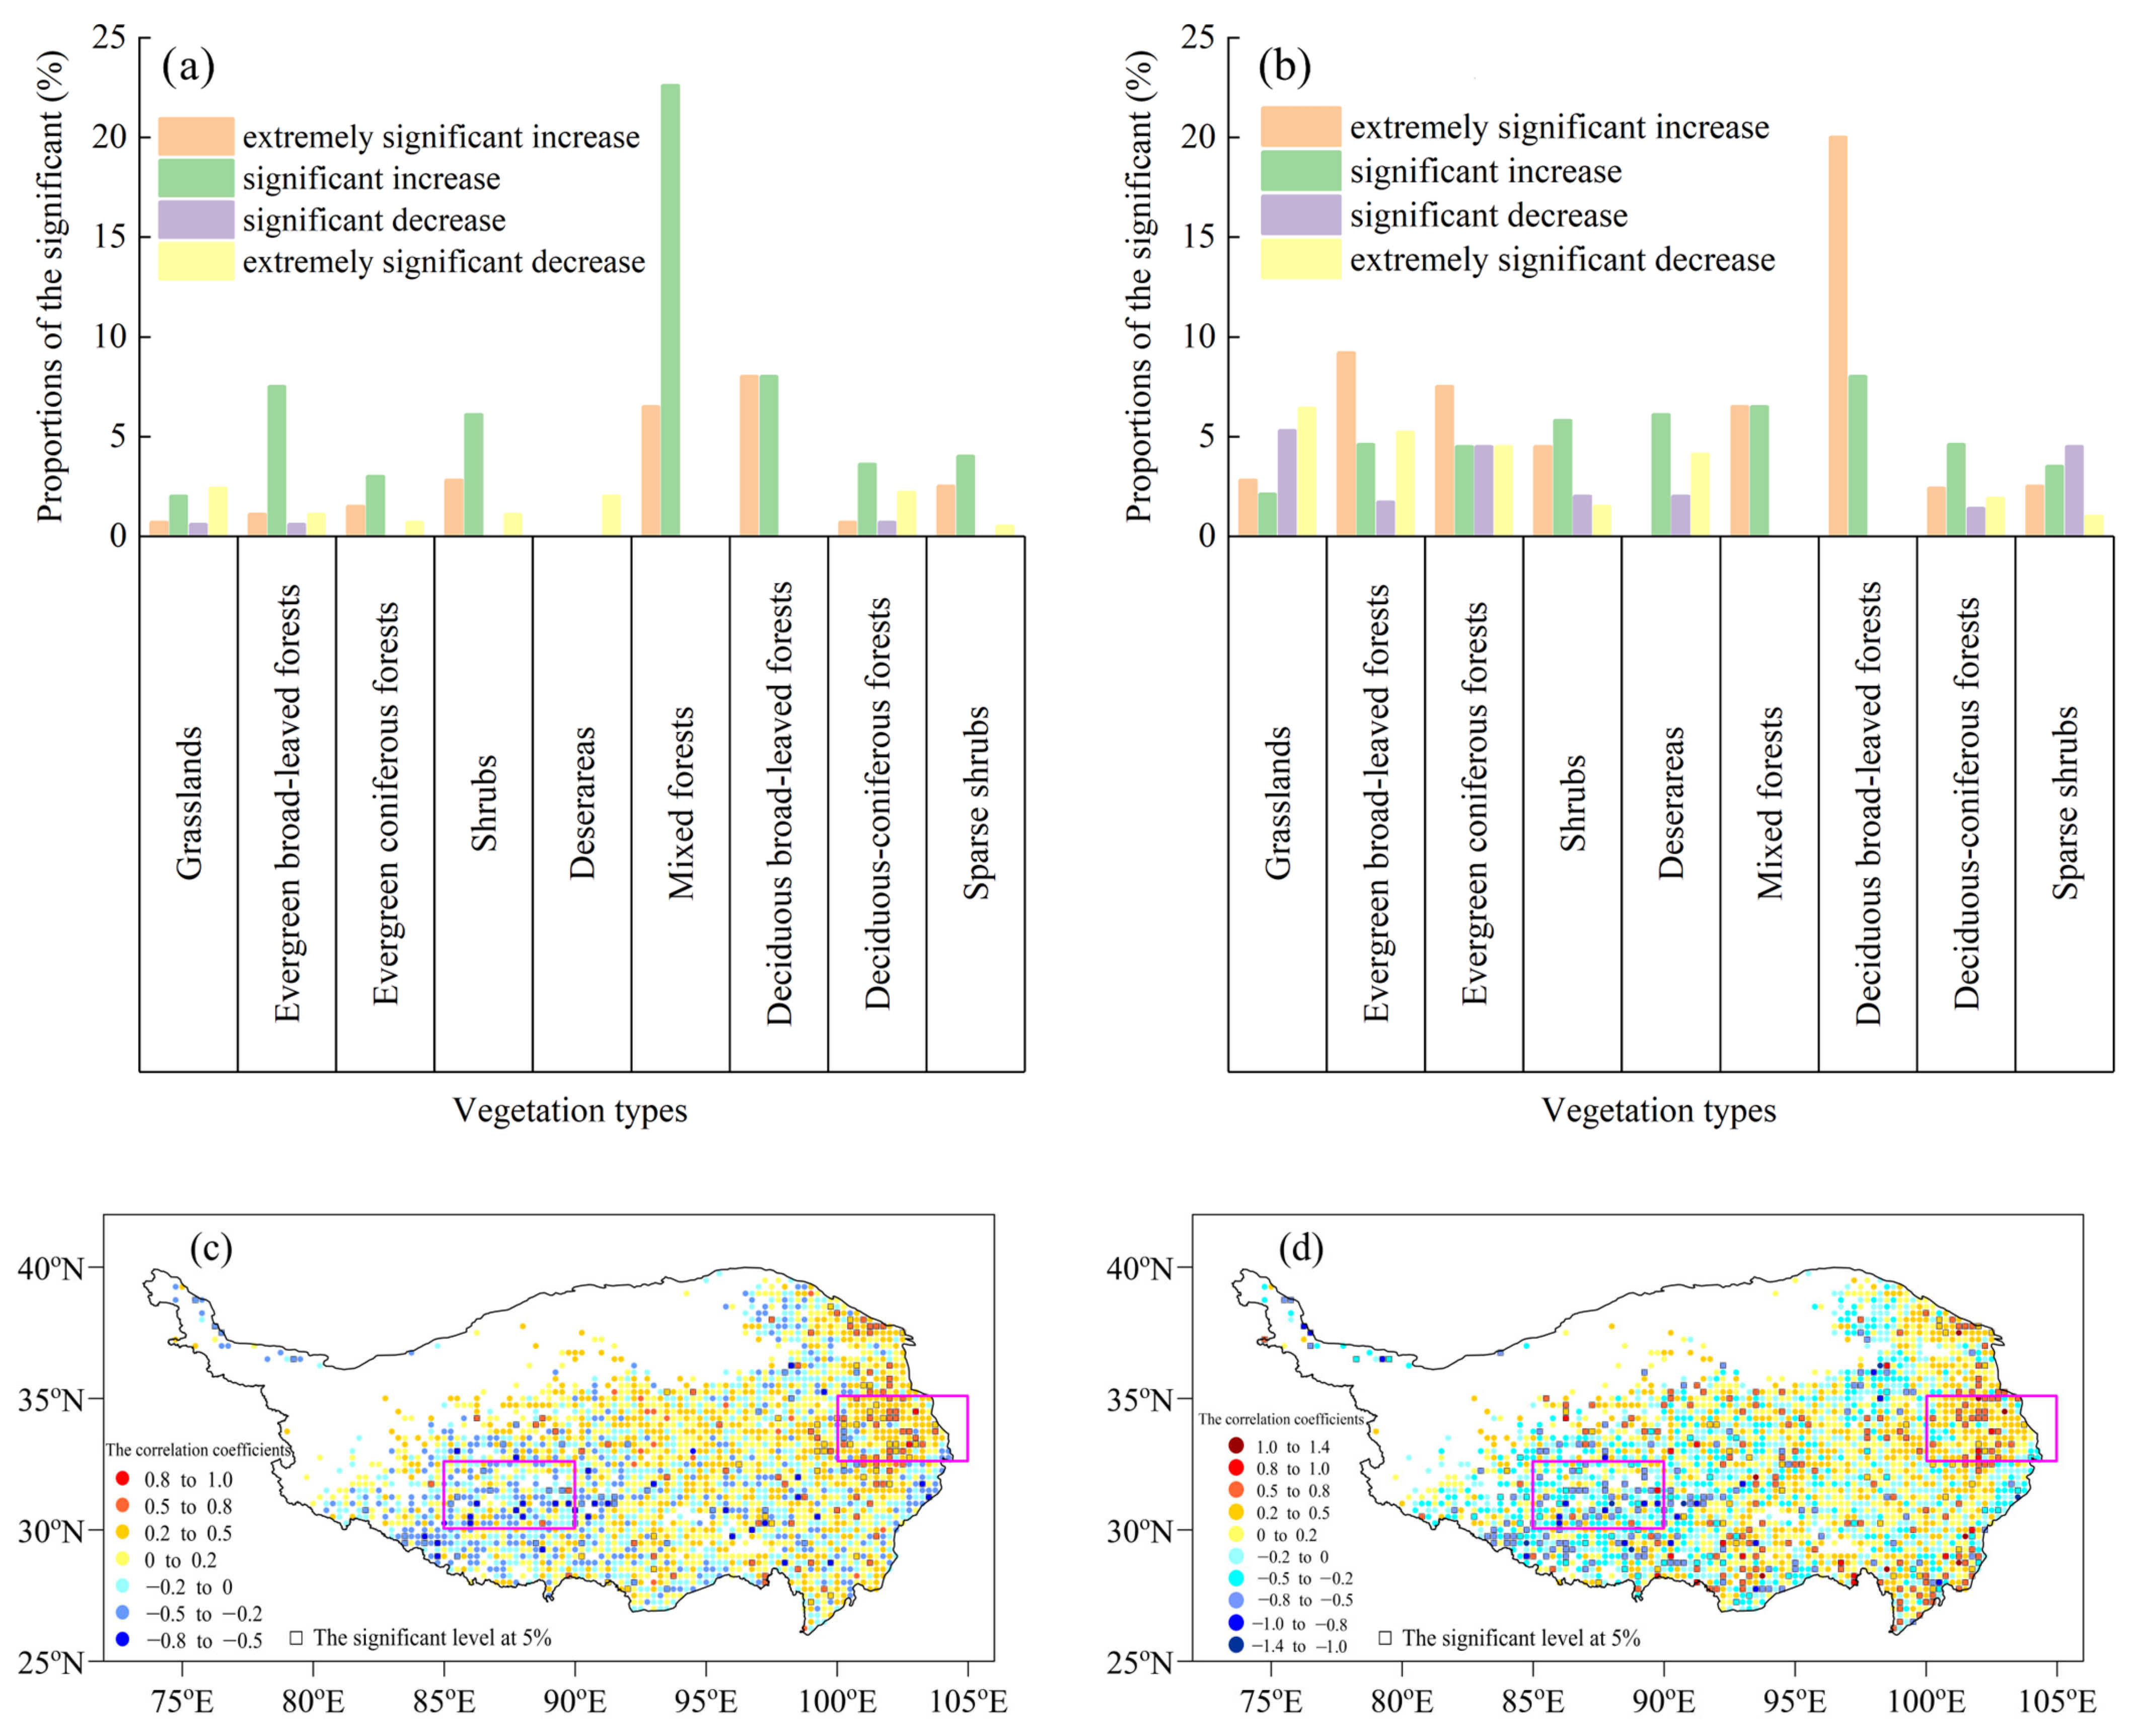
Figure 6a,b). 2.0% of desert areas show a significant negative correlation or a non-correlation between vegetation ecological quality and annual average temperature. For the other vegetation types, the areas with a significant positive correlation between vegetation ecological quality and annual average temperature are all within 30.0% and larger than those with a significant negative correlation. The areas with a significant positive correlation are relatively larger in mixed forests and deciduous broad-leaved forests, 29.0% and 16.0%, respectively, and there are no areas showing a significant negative correlation for both vegetation types. In grasslands, the areas with a significant positive correlation are the smallest (2.7%), and the proportion of areas showing a significant negative correlation is the largest (3.0%).
In the south and northeast of the TP, only 3.8% of the areas show a positive correlation between the annual rainfall and the EQI (
Figure 6a,c). The areas with a significant positive correlation between the EQI and the annual rainfall are the most in deciduous broad-leaved forests, reaching 28.0%. The area proportions for significant positive correlation are 5.0–14.0% for the other vegetation types. Neither deciduous broad-leaved forests nor mixed forests have areas displaying a significant negative correlation between the EQI and annual rainfall. For grasslands, the area proportion for a significant negative correlation between the EQI and annual rainfall is the largest (11.7%), but that for a significant positive correlation is the smallest (4.9%).
It is important to note that the observed statistical associations between EQI and climate variables do not necessarily imply a direct causal relationship. Correlation analysis only reveals the degree of linear dependence between variables, and other factors may confound the relationship. For example, human activities, such as grazing, land-use change, and conservation measures can also significantly affect vegetation ecological quality. Additionally, the feedback mechanisms between vegetation and climate are complex. Vegetation can influence local climate through processes such as evapotranspiration, carbon sequestration, and albedo effects. However, our current analysis does not fully capture these potential feedback loops, which may lead to an incomplete understanding of the EQI–climate relationship. Future studies could incorporate more comprehensive data, such as long-term records of human activities and detailed vegetation physiological parameters, to better disentangle the complex interactions between climate, vegetation, and human factors. Additionally, process-based ecosystem models can be used to simulate and quantify the potential feedback between vegetation and climate, thereby improving our ability to predict the response of vegetation ecological quality to future climate change. By recognizing these interpretative limits, we can more accurately interpret the results and avoid over-interpreting the statistical associations as causal relationships.
3.2.3. Impacts of Atmospheric Circulations
The EQIs in the areas of deciduous broad-leaved forests, mixed forests, some shrubs, and evergreen broad-leaved forests (R1, 32.5° N–35.0° N, 100.0° E–105.0° E) have a relatively significant positive correlation with annual average temperature and annual rainfall. However, the negative correlation is predominant in most areas of the southern part of grasslands (R2, 30.0° N–32.5° N, 85.0° E–90.0° E). Moreover, regions R1 and R2 are the concentration areas of significant positive and significant negative correlations between vegetation ecological quality and meteorological elements on the TP, respectively (
Figure 5). Therefore, the possible impacts of atmospheric circulations on the remarkable difference mentioned above are analyzed below in the aspects of water vapor flux and atmospheric circulation indices.
- (1)
Water vapor transport.
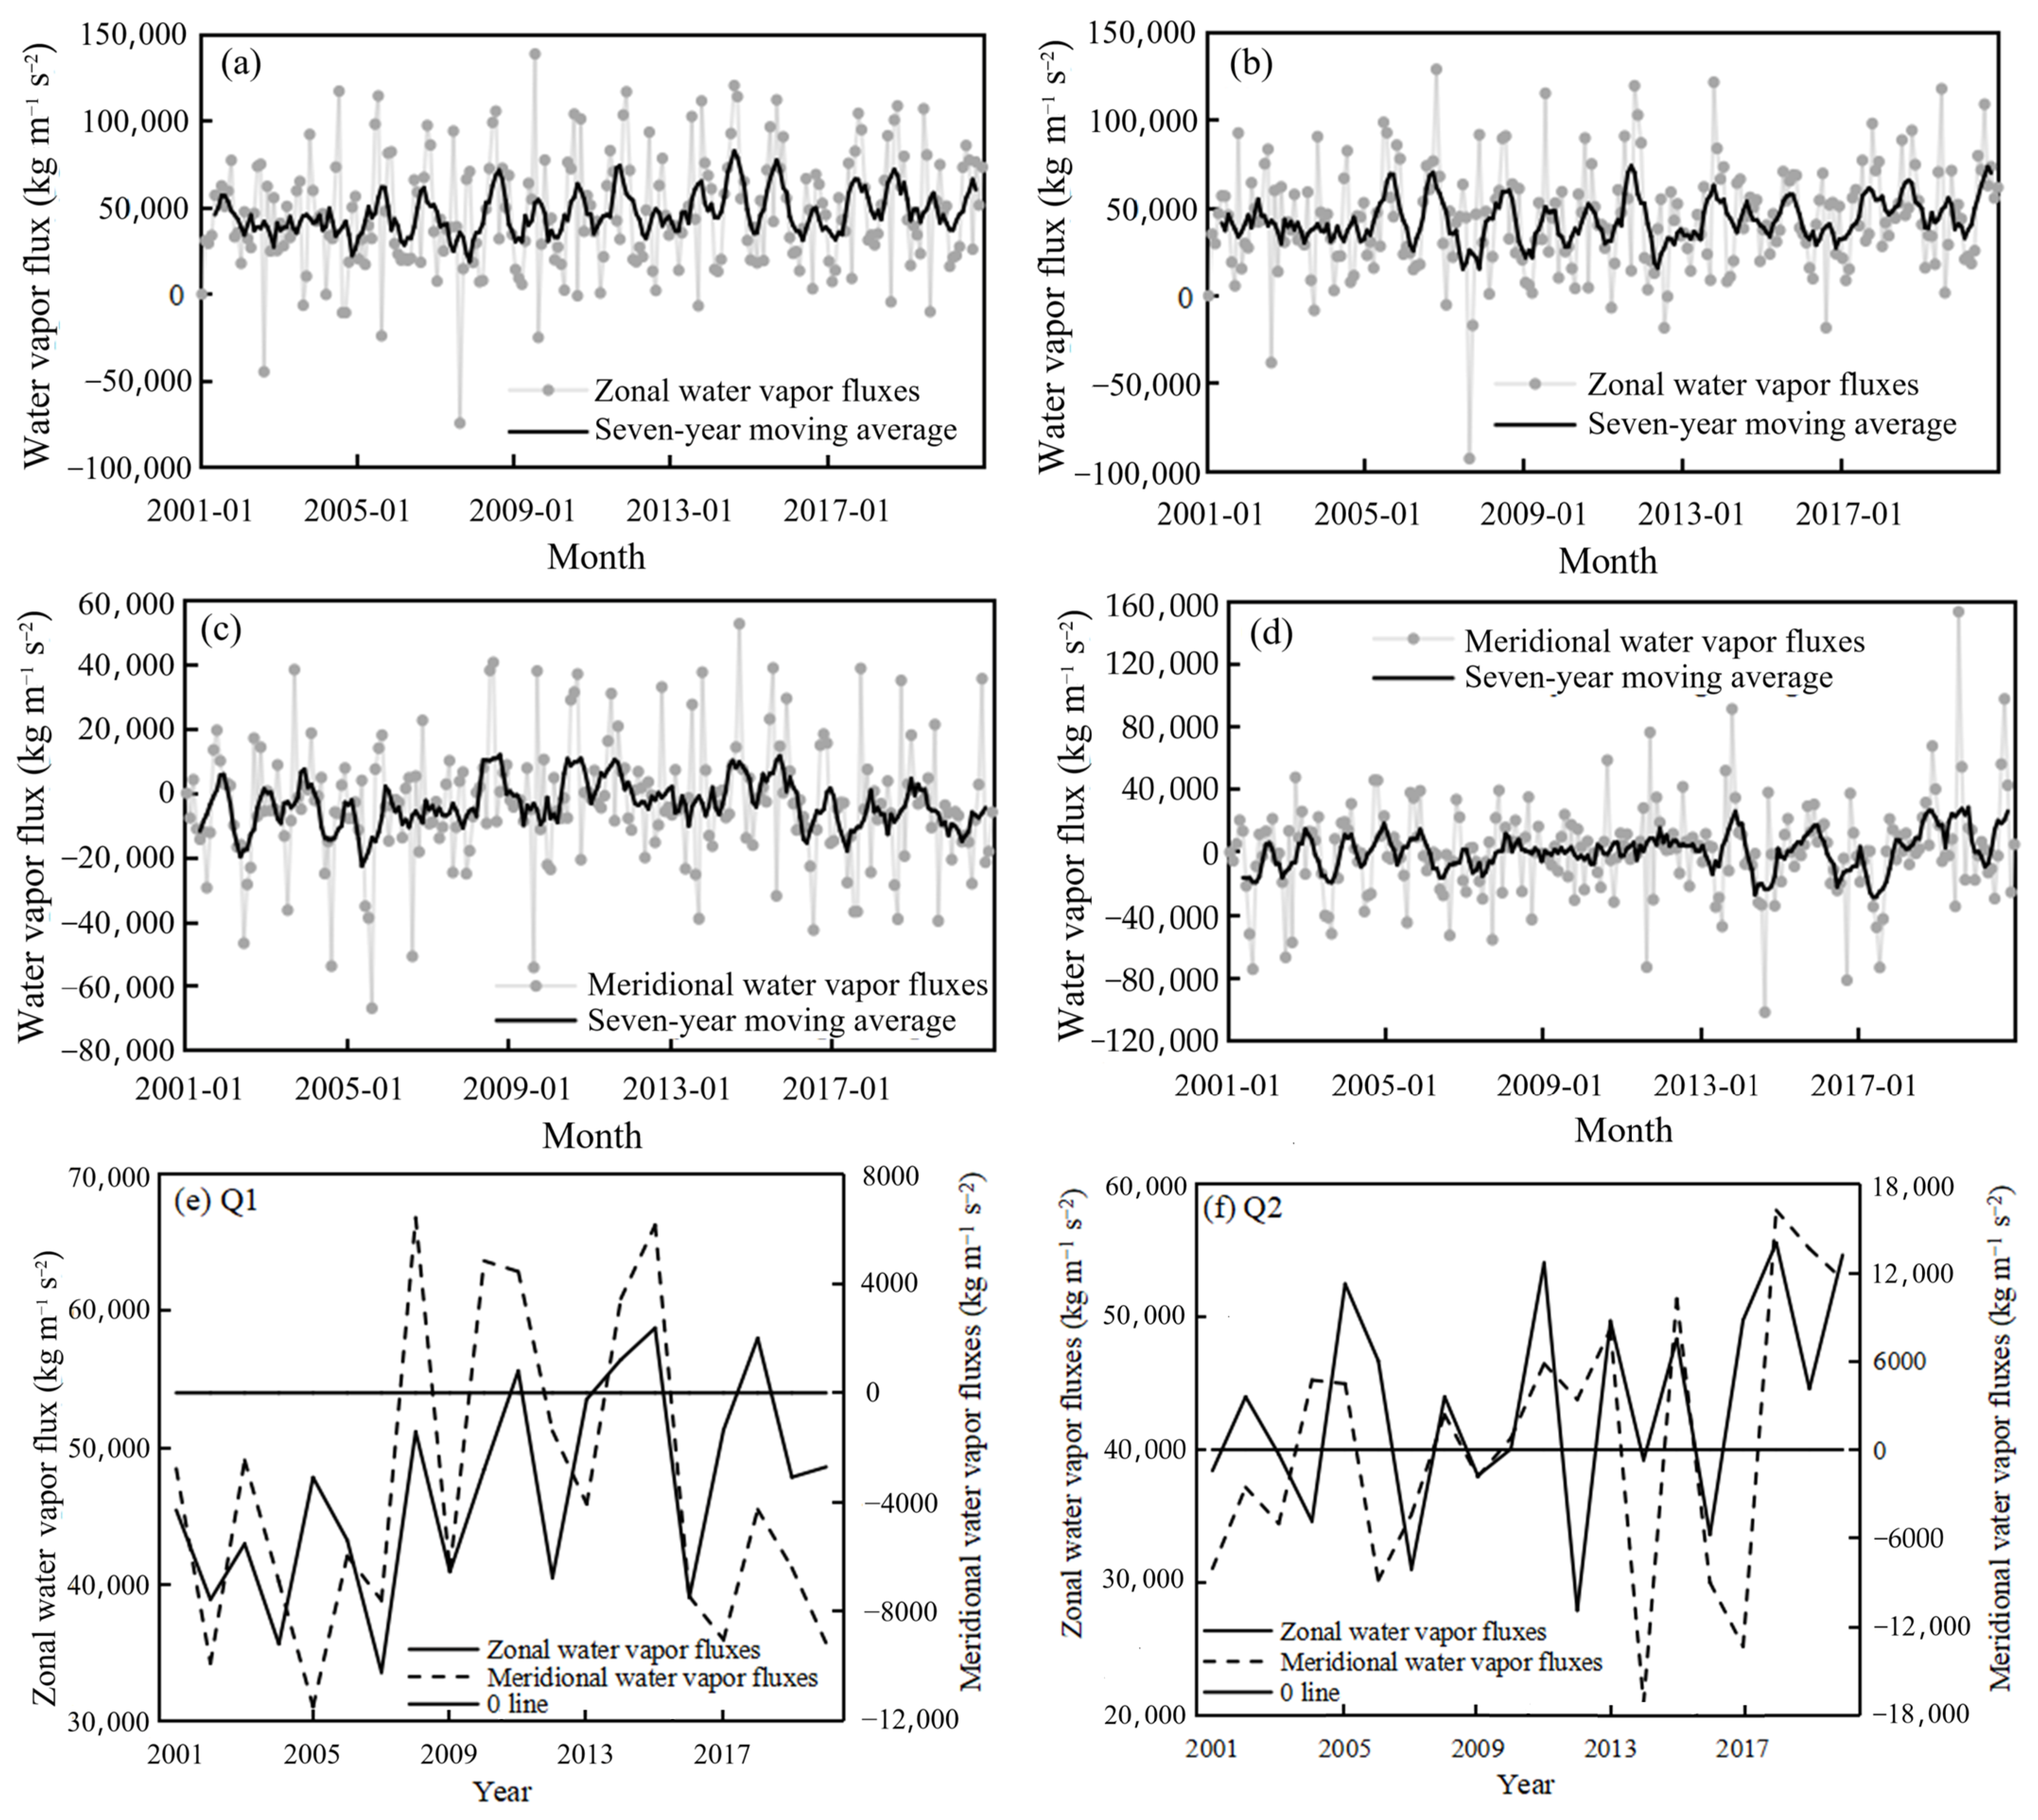
In the past 20 years, the vertical integral of zonal water vapor flux on the TP mainly shows eastward transport, and the transport flux in the north is larger than that in the south. Westward transport only appears in parts of the south. The vertical integral of meridional water vapor flux is relatively smaller, mostly showing northward transport. Additionally, the transport flux in the southeast is larger than that in the northwest (figure omitted). As presented in
Figure 7, the variations of water vapor transport in regions R1 and R2 can be divided into three periods: 2001–2007, 2007–2015, and 2015–2020. From 2001 to 2007, the zonal water vapor fluxes in regions R1 and R2 are both around 0.4 × 10
6 kg m
−1 s
−2, the meridional water vapor flux in R1 fluctuates around −0.8 × 10
6 kg m
−1 s
−2, and the annual variation of meridional water vapor flux in R2 is relatively large. From 2007 to 2015, the zonal and meridional water vapor fluxes in R1 and R2 exhibit increasing trends, the zonal water vapor flux ranges from 0.4 × 10
6 kg m
−1 s
−2 to 0.6 × 10
6 kg m
−1 s
−2, and the meridional water vapor transport shifts from southward to northward in both areas. From 2015 to 2020, the zonal water vapor fluxes in R1 and R2 are both characterized by an increasing trend of eastward transport, and the meridional transport in R1 and R2 displays increasing trends of southward and northward transport, respectively. Note that the increasing trend of zonal water vapor flux in R1 passes the significance test at the significance level of 0.01 (
Table 4).
- (2)
Westerly and monsoons.
Atmospheric water vapor transport relies on the adjustment of circulation systems. Through the four indexes of the EMI, SMI, IVarea, and mid-latitude westerly index (WI), we analyze the impacts of westerly and monsoons on the EQIs in regions R1 and R2.
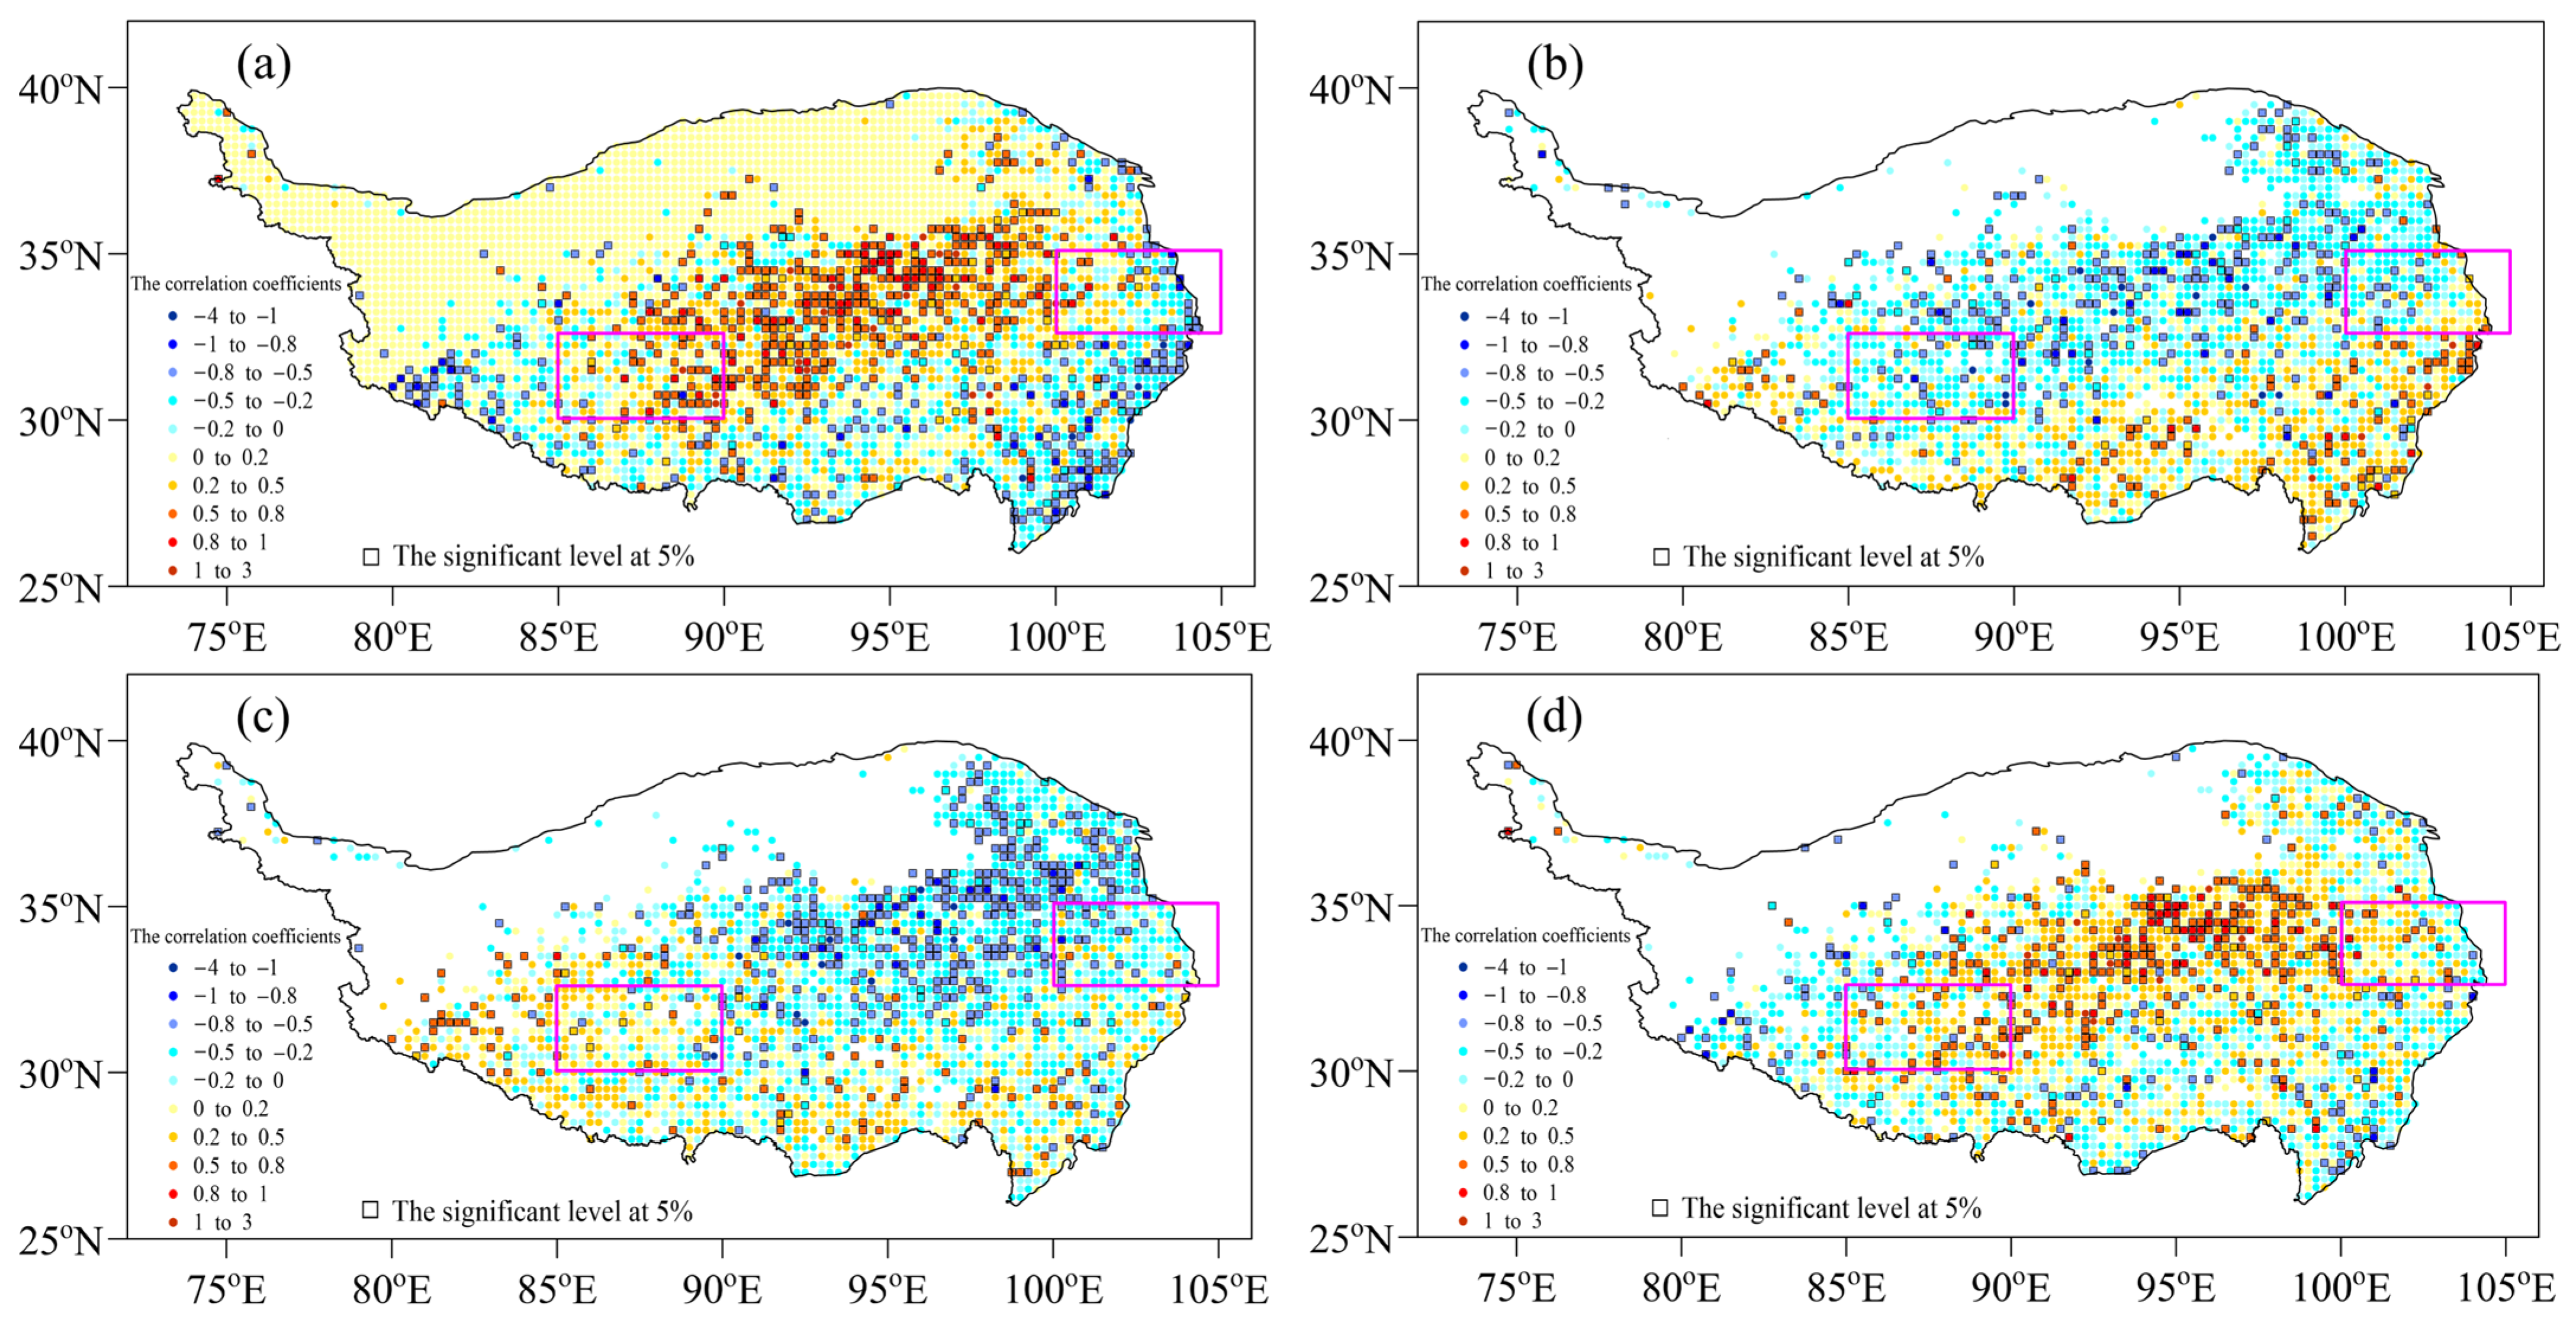
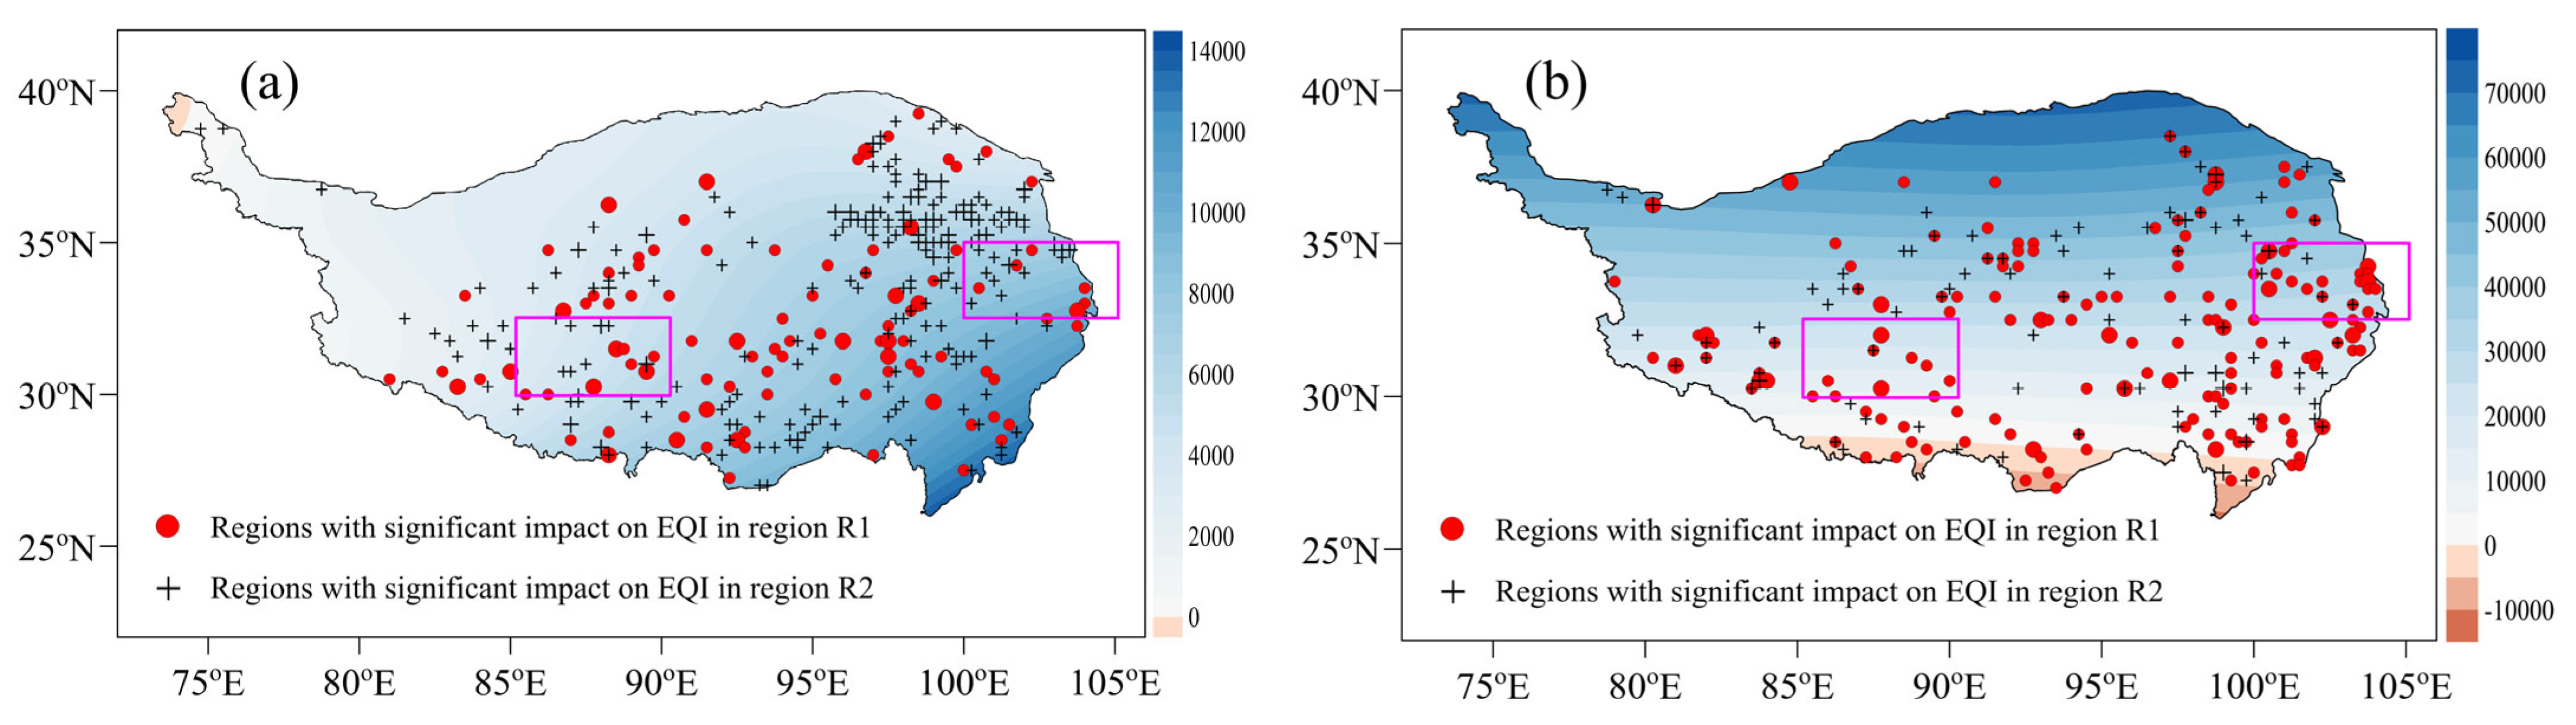
Figure 8 shows the correlations of the annual EQI with IVarea, EMI, SMI, and WI. The results indicate that IVarea is significantly and positively correlated with the EQIs in most grasslands and shrub areas, and it is significantly and negatively correlated with the EQIs in the southwestern part of grasslands and evergreen broad-leaved forests. The correlations with the WI are similar to those with IVarea. The EQI shows a significant positive correlation with the EMI in some coniferous and evergreen broad-leaved forests, and it has a significant negative correlation with the SMI in the east part of grasslands, shrubs, and sparse shrubs. The area proportions of the significant impact of different circulation factors on the EQIs are similar in R1, which are all between 10% and 25%. Specifically, the area proportions of the significant impact of IVarea on the EQI in R1 and R2 are the largest, accounting for 16.8% and 21.4%, respectively. The EQI in 12.8% of region R1 is significantly affected by the SMI, but the significantly influenced area in R2 only accounts for 8.4%. The WI has a significant impact on the EQI in 20.2% of region R2, but the significantly influenced area of the WI on the EQI is relatively small in R1. The areas of the EMI that significantly influence the EQI account for about 12.0% in both R1 and R2 (
Table 4).
4. Discussion
- a.
Effects of climate change on vegetation ecological quality
The partial correlation analysis between the EQI of different vegetation types and the standardized meteorological elements suggests that the impact of precipitation variations on vegetation growth is markedly greater than that of temperature. The impact of precipitation variations shows differences between the south and the north, and it is more complex than the impact of annual average temperature. Except for mixed forests, annual rainfall is a significantly influential factor for the EQI of all the vegetation types, and the significantly influenced range of rainfall is 2–16% larger than that of annual average temperature. In the northeast of the TP, high temperatures and more rainfall are greatly conducive to the increase in vegetation ecological quality. The vegetation types with a relatively significant response of EQI variations to rainfall variation are deciduous broad-leaved forests and evergreen coniferous forests, and the significantly influenced areas are 20–30%. Rainfall variation can interpret about 30% of EQI variations in deciduous broad-leaved forests and evergreen coniferous forests. In mixed forests and deciduous broad-leaved forests, EQI variations have a relatively significant response (positive correlation) to temperature, the significantly impacted areas are 15–30%. In addition, temperature variations can explain 20–40% of the EQI variations in these areas. Note that, in the southwest, high temperatures are not favorable for the improvement of vegetation ecological quality.
- b.
Effects of circulation systems on vegetation ecological quality
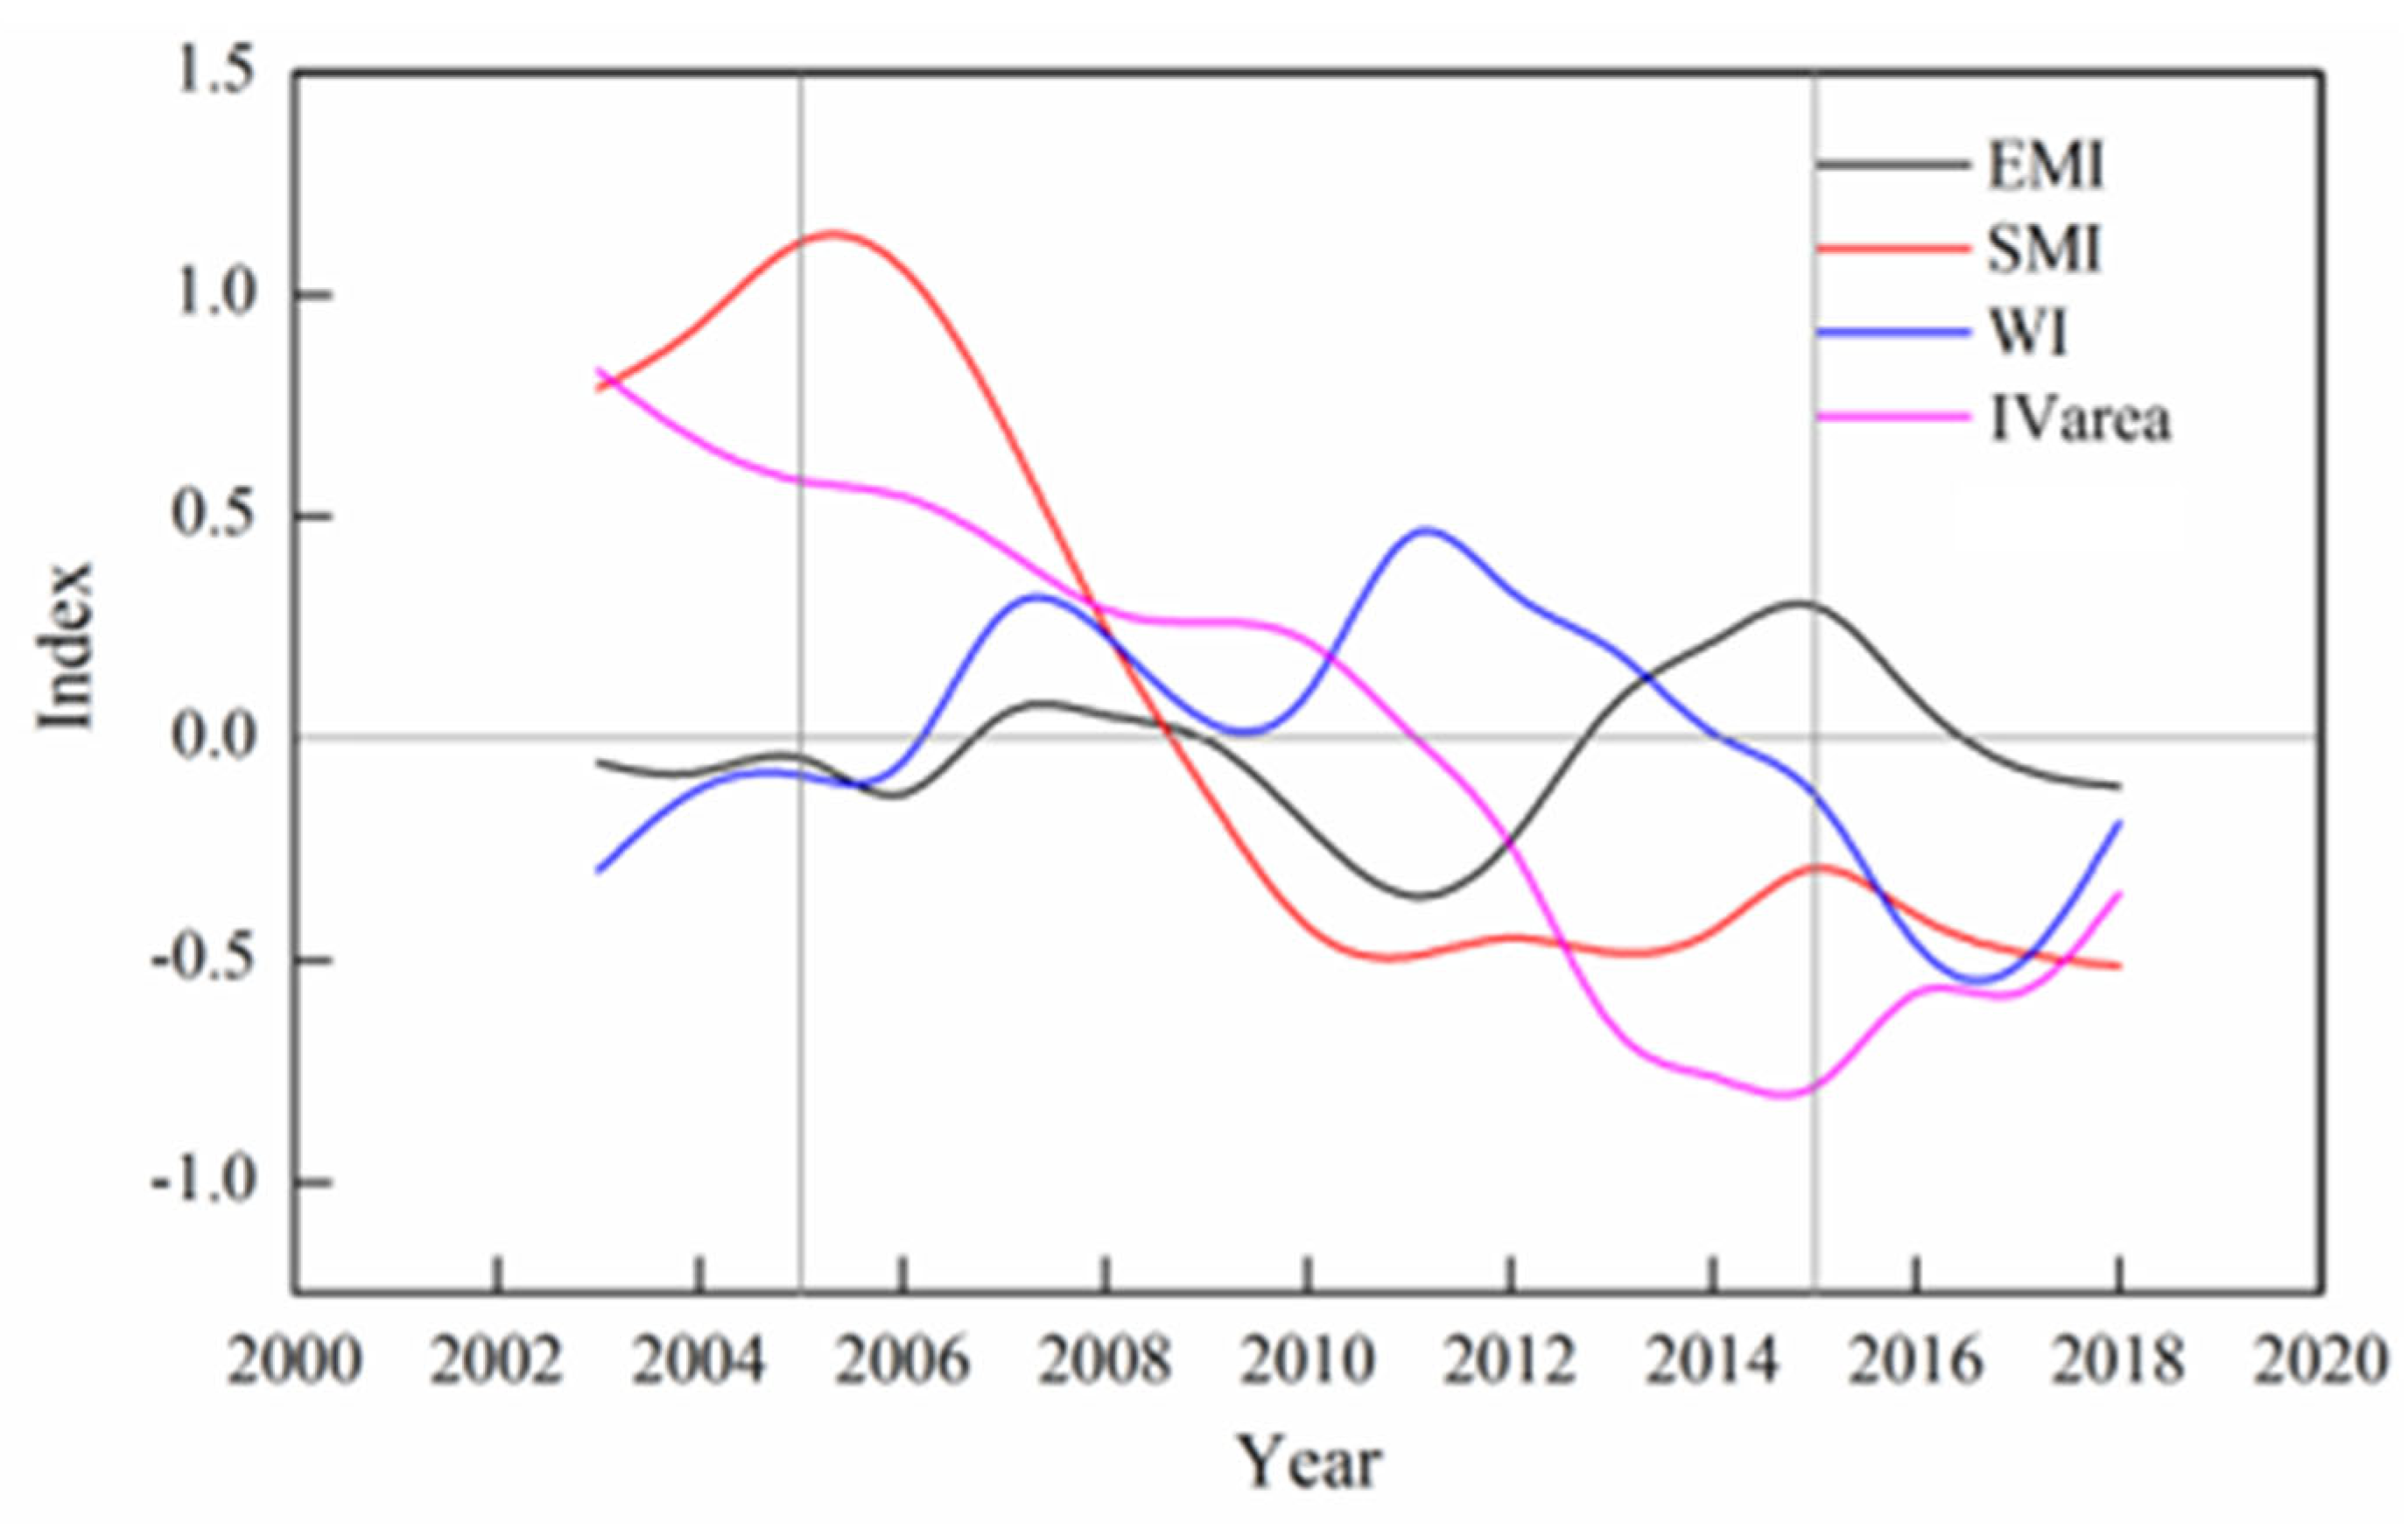
Water vapor transport variations on the TP have a certain effect on the ecological quality of regional vegetation, which may be caused by the adjustment of circulation systems under the background of global climate warming. The five-year moving averages of different circulation indexes (
Figure 9) illustrate that the four indexes change from stable state to fluctuations around 2007. Around 2015, relatively obvious variations can also be found. Specifically, the meridional water vapor transport in the central and southern TP shows a relatively significant influence on the vegetation ecological quality in R1, but the influence of zonal water vapor transport is not obvious. However, the vegetation ecological quality in R2 is mainly affected by the meridional water vapor transport variation in the northeast and the zonal water vapor flux transport in the west (
Figure 10).
- c.
Limitations of EQI.
(1) Seasonality: potential biases caused by aggregating monthly NPP/FVC into annual values, especially in regions with strong monsoon-driven growth cycles. Future mitigation strategies: adopting seasonal EQI sub-indices.
(2) Cloud cover: Residual cloud contamination in FVC estimates despite using MODIS composite products, particularly in humid margins.
Validation with ground-based phenology cameras and microwave remote sensing data (e.g., SMAP) in future work.
(3) Plant phenology: EQI’s inability to distinguish species-specific phenological responses, which may homogenize ecological interpretations. Integration of hyperspectral data and trait-based modeling to address this gap.
- d.
Biodiversity or ecosystem services.
Recent advances highlight that synthesis bridges this gap by demonstrating that plant diversity not only directly enhances ecosystem functions but also amplifies multifunctionality through cascading effects on higher trophic levels, as evidenced by large-scale biodiversity experiments across temperate grasslands and subtropical forests. This multi-trophic interdependence holds particular relevance for the Tibetan Plateau (TP), where rising vegetation ecological quality (EQI) in central grasslands—driven by warming-wetting trends—correlates with increased productivity and habitat suitability for keystone herbivores like procapra picticaudata [
38].
Existing studies have systematically assessed the carbon source-sink dynamics of the Tibetan Plateau—the world’s largest alpine permafrost region—and its feedback mechanisms to climate change, addressing a critical gap in understanding carbon cycling in high-altitude ecosystems. By integrating multi-source data (observations from 32 monitoring sites, controlled experiments, and model simulations), this research provides the first quantification of the plateau’s net carbon sink capacity (130.0 ± 53.6 Tg C yr
−1), revealing a magnitude four times greater than previous estimates, and identifies peak carbon sequestration efficiency in high-altitude ecosystems (~4000 m). These findings challenge the conventional assumption that permafrost carbon emissions dominate the plateau’s carbon balance, demonstrating instead that vegetation carbon sequestration driven by warming–wetting trends significantly outweighs permafrost carbon loss risks. This is particularly evident under synchronized summer hydrothermal conditions, where high-altitude regions exhibit systematically stronger temperature-driven carbon fixation rates compared to winter respiratory carbon losses, highlighting the amplifying effect of seasonal hydrothermal coupling on carbon sink efficacy [
37].
5. Conclusions
From 2001 to 2020, the Tibetan Plateau (TP) exhibited an overall improvement in vegetation ecological quality (EQI: 0.8 decade−1), with 65.6% of areas showing gains—most pronounced in sparse grasslands and mixed forests. Spatial heterogeneity was striking: southeastern evergreen coniferous forests achieved “good” EQI levels but faced degradation risks in 50% of their areas, while northwestern sparse shrubs demonstrated rapid recovery (92.6% increasing trends, 42.1% significant). Degradation hotspots clustered in central-southern grasslands and western shrublands. This study pioneers the integration of EQI with monsoon indices (EMI/SMI) and westerly dynamics (WI), resolving ambiguities in prior single-index assessments of alpine ecosystems.
Warming (0.18 °C decade⁻¹) and wetting (27.5 mm decade⁻¹ precipitation) dominated EQI trends but exhibited divergent regional impacts. Eastern forests thrived under warming-enhanced productivity and monsoon-driven rainfall (93.5% of mixed forests linked to precipitation increases), whereas western grasslands suffered moisture stress exacerbated by weakened meridional water vapor flux in R2 (30–32.5° N, 85–90° E), where 20.2% of areas showed WI-driven EQI declines. These findings directly inform conservation strategies: R1 (32.5–35° N, 100–105° E), a warming-wetting hotspot, requires targeted afforestation to amplify carbon sequestration, while R2 necessitates drought-resilient grazing policies and hydrological restoration. The demonstrated coupling between monsoon intensity (EMI/SMI) and EQI trends further enhances climate forecasting models for vegetation responses.
While EQI advances holistic ecosystem assessment, limitations include reliance on remote sensing without ground-truthed biodiversity metrics and insufficient scenario modeling beyond observed warming thresholds (~2.0 °C). Future work should integrate dynamic vegetation models under IPCC scenarios and quantify anthropogenic pressures through socio-ecological frameworks.
By linking EQI trends to atmospheric dynamics, this study positions the TP as a critical negative feedback system to climate warming. To safeguard its role as Asia’s “Water Tower”, we urge embedding EQI trends into the TP National Park Cluster management and UN Sustainable Development Goals. Technological synergy—combining satellite monitoring with AI-driven early-warning systems—which could further track circulation-driven EQI fluctuations, ensuring adaptive ecosystem governance.
In summary, our study demonstrates that the enhancement of the vegetation ecological quality index (EQI) in sparse grasslands and mixed forests underscores the necessity of land management practices aimed at sustaining these positive trends. The divergent temperature–EQI relationships observed across different regions emphasize the critical need for spatially explicit land-use planning, which should include protective measures for eastern forests and warming-mitigation strategies for southern grasslands. Furthermore, a comprehensive understanding of atmospheric circulation patterns and monsoon indices is essential for predicting changes in vegetation quality. This knowledge can inform the establishment of early-warning systems and proactive management approaches. Targeted conservation efforts and climate-adaptive practices are vital for regions vulnerable to degradation. Overall, these findings provide a scientific basis for developing region-specific, climate-resilient land use and conservation strategies, thereby contributing to the sustainable management of the fragile ecosystems found on the Tibetan Plateau.
Author Contributions
Conceptualization, T.M.; Methodology, J.L., G.Z. and Q.Z.; Software, T.M. and X.L.; Validation, J.L. and F.F.; Formal analysis, J.L., T.M., Q.Z., J.A. and X.L.; Resources, J.L.; Data curation, J.A., F.F. and H.D.; Writing—original draft, J.L. and T.M.; Writing—review & editing, G.Z.; Visualization, J.L. and T.M.; Project administration, J.L. and G.Z.; Funding acquisition, G.Z. All authors have read and agreed to the published version of the manuscript.
Funding
This work was funded by the Second Tibetan Plateau Comprehensive Research Project (2019QZKK0106), Longyuan Youth Talent of Gansu Province (GSLQ-QX202201), and The China Meteorological Administration youth meteorological talent program in 2024.
Data Availability Statement
Conflicts of Interest
The authors declare no conflicts of interest.
References
- Chen, D.L.; Xu, B.Q.; Yao, T.D.; Guo, Z.T.; Cui, P.; Chen, F.H.; Zhang, R.H.; Zhang, X.Z.; Zhang, Y.L.; Fan, J.; et al. Assessment of past, present and future environmental changes on the Tibet Plateau. Chin. Sci. Bull 2015, 60, 3025–3035. [Google Scholar] [CrossRef]
- Yao, T.D. Tackling on environmental changes in Tibetan Plateau with focus on water, ecosystem and adaptation. Sci. Bull. 2019, 64, 417. [Google Scholar] [CrossRef]
- Yue, X.; Zhang, L.X.; Zhou, D.C.; Yue, J.; Liu, L.L. Ecological vulnerability and its driving forces of the Qinghai-Xizang Plateau based on the net primary productivity of vegetation. Sci. Geogr. Sin. 2024, 44, 140–148. [Google Scholar]
- Chen, X.L.; Yuan, L.; Ma, Y.M.; Chen, D.L.; Su, Z.B.; Cao, D.B. A doubled increasing trend of evapotranspiration on the Tibetan Plateau. Sci. Bull. 2024, 69, 1980–1990. [Google Scholar] [CrossRef]
- Diao, C.; Liu, Y.; Zhao, L.; Zhuo, G.; Zhang, Y.Q. Regional-scale vegetation-climate interactions on the Qinghai-Tibet Plateau. Ecol. Inform. 2021, 65, 101413. [Google Scholar] [CrossRef]
- Piao, S.; Liu, Q.; Chen, A.; Janssens, I.A.; Fu, Y.; Dai, J.; Liu, L.; Lian, X.U.; Shen, M.; Zhu, X. Plant phenology and global climate change: Current progresses and challenges. Glob. Change Biol. 2019, 25, 1922–1940. [Google Scholar] [CrossRef]
- Zhou, T.; Zhang, Y.S.; Gao, H.F.; Zhang, T.; Ma, Y.Z. Relationship between vegetation index and ground surface temperature on the Tibetan Plateau alpine grassland. J. Glaciol. Geocryol. 2015, 37, 58–69. [Google Scholar] [CrossRef]
- Chen, S.T.; Guo, B.; Yang, F.; Han, B.M.; Fan, Y.W.; Yang, X.; He, T.L.; Liu, Y.; Yang, W.N. Spatial and temporal patterns of NPP and its response to climate change in the Qinghai-Tibet Plateau from 2000 to 2015. J. Nat. Resour. 2020, 35, 2511–2527. [Google Scholar] [CrossRef]
- Guo, E.; Wang, Y.; Wang, C.; Sun, Z.; Bao, Y.; Mandula, N.; Jirigala, B.; Bao, Y.; Li, H. NDVI indicates long-term dynamics of vegetation and its driving forces from climatic and anthropogenic factors in mongolian plateau. Remote Sens. 2021, 13, 688. [Google Scholar] [CrossRef]
- Liu, M.X.; Jiao, J.; Pan, J.H.; Song, J.Y.; Che, Y.D.; Li, L.R. Spatial and temporal patterns of planting NPP and its driving factors in Qinghai Province. Acta Ecol. Sin. 2020, 40, 5306–5317. [Google Scholar]
- Zhang, Y.; Qi, W.; Zhou, C.; Ding, M.; Liu, L.; Gao, J.; Bai, W.; Wang, Z.; Zheng, D. Spatial and temporal variability in the net primary production of alpine grassland on the Tibetan Plateau since 1982. J. Geogr. Sci. 2014, 24, 269–287. [Google Scholar] [CrossRef]
- Liu, J.; Ji, Y.H.; Zhou, G.S.; Zhou, L.; Lv, X.M.; Zhou, M.Z. Temporal and spatial variations of net primary productivity (NPP) and its climate driving effect in the Qinghai-Tibet Plateau, China from 2000 to 2020. J. Appl. Ecol. 2022, 33, 1533–1538. [Google Scholar]
- Han, B.H.; Zhou, B.R.; Yan, Y.Q.; Shi, M.M.; Su, S.L.; Zhao, H.H.; Niu, D.C.; Fu, H. Analysis of vegetation coverage change and its driving factors over Tibetan Plateau from 2000 to 2008. Acta Agrestia Sin. 2019, 27, 1651–1658. [Google Scholar]
- Chen, Y.; Ji, D.; Moore, J.C.; Hu, J.; He, Y. Observational constraint on the contribution of surface albedo feedback to the amplified Tibetan Plateau surface warming. J. Geophys. Res. 2022, 127, e2021JD036085. [Google Scholar] [CrossRef]
- Xu, J.; Chen, H.L.; Shang, S.S.; Yang, H.; Zhu, G.F.; Liu, X.W. Response of net primary productivity of Tibetan Plateau vegetation to climate change based on CEVSA model. Arid Land Geogr. 2020, 43, 592–601. [Google Scholar]
- Tan, Q.T.; Chen, J.J.; Yang, Y.P.; Zhao, X.Y.; Zhou, G.Q.; You, H.T.; Han, X.W. Spatiotemporal variations of vegetation and its response to topography and climate in the source region of the Yellow River. China Environ. Sci. 2021, 41, 3832–3841. [Google Scholar]
- Zhuo, G.; Chen, S.R.; Zhou, B. Spatio-temporal variation of vegetation coverage over the Tibetan Plateau and its responses to climatic factors. Acta Ecol. Sin. 2018, 38, 3208–3218. [Google Scholar] [CrossRef]
- da Silva, R.G.; dos Santos, A.R.; Pelúzio, J.B.; Fiedler, N.C.; Juvanhol, R.S.; de Souza, K.B.; Branco, E.R. Vegetation trends in a protected area of the Brazilian Atlantic forest. Ecol. Eng. 2021, 162, 106180. [Google Scholar] [CrossRef]
- Chen, J.J. Research on change of fractional vegetation cover of alpine grassland and its environmental impact factors on the Qinghai-Tibetan Plateau. Acta Geod. Cartogr. Sin. 2020, 49, 533. [Google Scholar]
- Liu, J.H.; Gao, J.X.; Wang, W.J. Variations of vegetation coverage and its relations to global climate changes on the Tibetan Plateau during 1981–2005. J. Mountain Sci. 2013, 31, 234–242. [Google Scholar]
- Zhao, Q.Q.; Li, J.H.; Zhang, G.Q.; Shi, Y. Vegetation changes and their causes in the Yellow River basin under the background of climate change. Clim. Environ. Res. 2022, 27, 157–169. [Google Scholar] [CrossRef]
- Chen, C.; Wang, Y.M.; Li, Y.Y.; Zhou, S. Vegetation changes and influencing factors in different climatic regions of Yellow River basin from 1982 to 2015. J. Changjiang River Sci. Res. Inst. 2022, 39, 56–62, 81. [Google Scholar] [CrossRef]
- Qian, S.; Yan, H.; Wu, M.X.; Cao, Y.; Xu, L.L.; Cheng, L. Dynamic monitoring and evaluation model for spatio-temporal change of comprehensive ecological quality of vegetation. Acta Ecol. Sin. 2020, 40, 6573–6583. [Google Scholar]
- Cao, Y.; Sun, L.; Chen, Z.X.; Yan, H.; Qian, S. Dynamic changes of vegetation ecological quality in the Yellow River Basin and its response to extreme climate during 2000–2020. Acta Ecolo. Sin. 2022, 42, 4524–4535. [Google Scholar] [CrossRef]
- Zhang, Y.M.; Lu, Y.; Sun, G.L.; Li, L.; Zhang, Z.H.; Zhou, X.G. Dynamic changes in vegetation ecological quality in the Tarim Basin and its response to extreme climate during 2000–2022. Forests 2024, 15, 505. [Google Scholar] [CrossRef]
- Bohner, J. General climatic controls and topoclimatic variations in Central and High Asia. Boreas 2006, 35, 279–295. [Google Scholar] [CrossRef]
- Pei, H.W.; Liu, M.Z.; Jia, Y.G.; Zhang, H.J.; Li, Y.L.; Xiao, Y.X. The trend of vegetation greening and its drivers in the agropastoral ecotone of northern China, 2000–2020. Ecol. Indic. 2021, 129, 108004. [Google Scholar] [CrossRef]
- Li, M.M.; Wu, B.F.; Yan, C.Z.; Zhou, W.F. Estimation of vegetation fraction in the upper basin of Miyun Reservoir by remote sensing. Recour. Sci. 2004, 26, 153–159. [Google Scholar] [CrossRef]
- Xu, L.L.; Qian, S.; Zhao, X.L.; Hao, Y. Spatio-temporal variation of vegetation ecological quality and its response to climate change in Rocky desertification areas in southwest China during 2000–2020. J. Resour. Ecol. 2022, 13, 27–33. [Google Scholar]
- Zhao, G.J.; Huang, G.; Wu, R.G.; Tao, W.C.; Gong, H.N.; Qu, X.; Hu, K.M. A new upper-level circulation index for the East Asian summer monsoon variability. J. Clim. 2015, 28, 9977–9996. [Google Scholar] [CrossRef]
- HJ 1171-2021; Technical Specification for Investigation and Assessment of National Ecological Status—Ecosystem Patterns Assessment. Ministry of Ecology and Environment: Beijing, China, 2021.
- Li, J.P.; Zeng, Q.C. A new monsoon index, its interannual variability and relation with monsoon precipitation. Clim. Environ. Res. 2005, 10, 351–365. [Google Scholar] [CrossRef]
- Wang, Y.; Li, D.L. Variation of the Tibetan Plateau summer monsoon under the background of global warming and its impact on the climate in southwestern China. Acta Meteorol. Sin. 2015, 73, 910–924. [Google Scholar] [CrossRef]
- Li, W.L.; Wang, K.L.; Fu, S.M.; Jiang, H. The interrelationship between regional westerly index and the water vapor budget in Northwest China. J. Glaciol. Geocryol. 2008, 30, 28–34. [Google Scholar] [CrossRef]
- Jiang, W.G.; Yuan, L.H.; Wang, W.J.; Cao, R.; Zhang, Y.F.; Shen, W.M. Spatio-temporal analysis of vegetation variation in the Yellow River Basin. Ecol. Indic. 2015, 51, 117–126. [Google Scholar] [CrossRef]
- Feng, X.J.; Tian, J.; Wang, Y.X.; Wu, J.J.; Liu, J.; Ya, Q.; Li, Z.S. Spatio-temporal variation and climatic driving factors of vegetation coverage in the Yellow River Basin from 2001 to 2020 based on kNDVI. Forests 2023, 14, 620. [Google Scholar] [CrossRef]
- Wei, D.; Qi, Y.; Ma, Y.; Wang, X.; Ma, W.; Gao, T.; Huang, L.; Zhao, H.; Zhang, J.; Wang, X. Plant uptake of CO2 outpaces losses from permafrost and plant respiration on the Tibetan Plateau. Proc. Natl. Acad. Sci. USA 2021, 118, e2015283118. [Google Scholar] [CrossRef]
- Li, Y.; Schuldt, A.; Ebeling, A.; Eisenhauer, N.; Huang, Y.Y.; Albert, G.; Albracht, C.; Amyntas, A.; Bonkowski, M.; Bruelheide, H.; et al. Plant diversity enhances ecosystem multifunctionality via multitrophic diversity. Nat. Ecol. Evol. 2024, 8, 2037–2047. [Google Scholar] [CrossRef]
Figure 1.
Geographic location and elevation of the Tibetan Plateau (TP) and the distributions of ground-based meteorological stations and vegetation types on the TP.
Figure 1.
Geographic location and elevation of the Tibetan Plateau (TP) and the distributions of ground-based meteorological stations and vegetation types on the TP.
Figure 2.
Multi-year average of the (a) NPP and (b) FVC on the TP from 2001 to 2020.
Figure 2.
Multi-year average of the (a) NPP and (b) FVC on the TP from 2001 to 2020.
Figure 3.
(a) Annual variation, (b) multi-year average, (c) variation trend, and (d) future variation of the vegetation ecological quality index (EQI) on the TP from 2001 to 2020.
Figure 3.
(a) Annual variation, (b) multi-year average, (c) variation trend, and (d) future variation of the vegetation ecological quality index (EQI) on the TP from 2001 to 2020.
Figure 4.
(a) Climate tendency rates and (b) significance levels (p < 0.05) of the standardized EQIs for different vegetation types and their varied area percentages on the TP from 2001 to 2020.
Figure 4.
(a) Climate tendency rates and (b) significance levels (p < 0.05) of the standardized EQIs for different vegetation types and their varied area percentages on the TP from 2001 to 2020.
Figure 5.
Correlation coefficients of (a) annual average temperature and (b) precipitation, and the significance test results.
Figure 5.
Correlation coefficients of (a) annual average temperature and (b) precipitation, and the significance test results.
Figure 6.
Proportions (%) of the significantly impacted area of the standardized annual average temperature (a) and annual rainfall (b) variations on the EQIs of different vegetation types, and the partial correlations of the EQIs of different vegetation types with (c) the annual average temperature and (d) the annual precipitation.
Figure 7.
Vertical integrals of zonal and meridional water vapor fluxes in regions (a,c,e) R1 and (b,d,f) R2. The positive and negative zonal water vapor fluxes indicate the eastward and westward transport, respectively, and the positive and negative meridional water vapor fluxes indicate the northward and southward transport, respectively.
Figure 8.
Partial correlation analysis of the annual EQI on the TP with (a) the vorticity area (IVarea), (b) East Asian summer monsoon index (EMI), (c) South Asian summer monsoon index (SMI), and (d) westerly index (WI) on the TP.
Figure 8.
Partial correlation analysis of the annual EQI on the TP with (a) the vorticity area (IVarea), (b) East Asian summer monsoon index (EMI), (c) South Asian summer monsoon index (SMI), and (d) westerly index (WI) on the TP.
Figure 9.
Five-year moving average of the IVarea, EMI, SMI, and WI from 2001 to 2020.
Figure 9.
Five-year moving average of the IVarea, EMI, SMI, and WI from 2001 to 2020.
Figure 10.
The regions where the average values of water vapor fluxes integrated vertically in the (a) latitude direction and (b) meridian direction, as well as the regions where the changes in water vapor fluxes integrated vertically upward in the latitude direction and (b) meridian direction have a significant impact on the EQI of R1 and R2 regions from 2001 to 2020.
Table 1.
Grades of vegetation ecological quality index (EQI) on the Tibetan Plateau (TP).
Table 1.
Grades of vegetation ecological quality index (EQI) on the Tibetan Plateau (TP).
| Grades | Good | Relatively Good | Medium | Relatively Poor | Poor |
|---|
| EQI range | EQI ≥ 75 | 55 ≤ EQI < 75 | 35 ≤ EQI < 55 | 20 ≤ EQI < 35 | EQI < 20 |
Table 2.
Trend classification criteria.
Table 2.
Trend classification criteria.
| Trend Type | Conditions |
|---|
| Persistent Degradation | Sen’s slope < 0 AND p < 0.01 AND Hu > 0.5 |
| Persistent Improvement | Sen’s slope > 0 AND p < 0.01 AND Hu > 0.5 |
| Future Degradation | (Sen’s slope < 0 AND p ≥ 0.01 AND Hu > 0.5) OR (Sen’s slope > 0 AND p < 0.01 AND Hu < 0.5) |
| Future Improvement | (Sen’s slope > 0 AND p ≥ 0.01 AND Hu > 0.5) OR (Sen’s slope < 0 AND p < 0.01 AND Hu < 0.5) |
Table 3.
Persistent variation trend of future vegetation ecological quality on the TP.
Table 3.
Persistent variation trend of future vegetation ecological quality on the TP.
| β (Trend) | Hurst | Variation | Area Percentage (%) |
|---|
| β < 0 | 0 < Hu < 0.5 | Improvement trend | 35.5 |
| β < 0 | 0.5 < Hu < 1 | Persistent degradation trend | 5.9 |
| | Hu = 0.5 | Remain stable | 28.9 |
| β > 0 | 0 < Hu < 0.5 | Degradation trend | 15.8 |
| β > 0 | 0.5 < Hu < 1 | Persistent improvement trend | 13.9 |
Table 4.
Variation characteristics of water vapor fluxes in different regions and the areas with significant impact of circulation factors and meteorological factors on EQIs.
Table 4.
Variation characteristics of water vapor fluxes in different regions and the areas with significant impact of circulation factors and meteorological factors on EQIs.
| Circulation Analysis | R1 | R2 |
|---|
| Rectangular range | 32.5–35° N, 100–105° E | 30–32.5° N, 85–90° E |
| Vegetation type | Mixed forests, deciduous broad-leaved forests, shrubs and evergreen broad-leaved forests, | Grasslands |
| Trend of zonal water vapor flux (kg m−1 s−2) | 6491.3 | 4749.2 |
| Trend of meridional water vapor flux (kg m−1 s−2) | 576.1 | 5375.6 |
| Significant impact range of IVarea on EQI (%) | 16.8% | 24.1% |
| Significant impact range of EMI on EQI (%) | 11.2% | 13.3% |
| Significant impact range of SMI on EQI (%) | 12.8% | 8.4% |
| Significant impact range of WI on EQI (%) | 11.7% | 20.2% |
| Disclaimer/Publisher’s Note: The statements, opinions and data contained in all publications are solely those of the individual author(s) and contributor(s) and not of MDPI and/or the editor(s). MDPI and/or the editor(s) disclaim responsibility for any injury to people or property resulting from any ideas, methods, instructions or products referred to in the content. |
© 2025 by the authors. Licensee MDPI, Basel, Switzerland. This article is an open access article distributed under the terms and conditions of the Creative Commons Attribution (CC BY) license (https://creativecommons.org/licenses/by/4.0/).


 ,
, 
