Abstract
An experimental evaluation of water productivity and footprint was carried out in a Mediterranean greenhouse tomato crop irrigated with different blends of desalinated seawater (DSW) for two different growing media: soil and soilless culture. Total and commercial water productivity values (expressed in terms of kg of fruit/m3 of water) and water footprint were calculated from empirical data on water consumption and crop yields. Regarding the growing media, the results of the experiment showed that the soilless culture had significantly lower water productivity and a higher water footprint, mainly due to the greater water consumption in these systems. These findings seem to indicate that fostering closed-loop soilless systems with water and nutrient recirculation is highly beneficial for improving the efficiency and sustainability of these soilless systems. The salinity of the irrigation water blends did not seem to have a significant influence on water productivity and water footprint. Nevertheless, treatments with higher DSW fractions and better quality showed slightly better productivity values and lower water footprints than those with higher salinity. These findings seem to support the fact that the conjunctive use of DSW and conventional water, within the range proposed in this study, is a favorable option from both economic and environmental perspectives.
1. Introduction
The province of Almería in southern Spain has one of the largest greenhouse areas in the world, covering approximately 32,827 hectares [1]. In addition, intensive greenhouse horticulture has become one of the most active socioeconomic drivers of the region. Nevertheless, due to the arid climate of the Spanish Mediterranean basin, this critical agricultural sector faces both water shortage and quality issues, which may jeopardize its sustainability. The increasing extraction of water from aquifers for irrigating greenhouse crops, along with the rising return of highly salinized irrigation water, has led to the depletion and salinization of said aquifers [2]. This process has severely impacted crop yields, as highlighted by various studies. The effect of increasing salinity on crop yields has been widely documented by different research works. The Maas and Hoffman model [3] assumes a linear relationship between the relative yield reduction and the root-zone salinity (ECe) when ECe exceeds a specific threshold that depends on the crop sensibility to the salinity. This model was validated by research work carried out in a soilless tomato crop grown under a Mediterranean greenhouse [4].
The use of DSW has been proposed as a rational solution to increase the availability of quality water resources, ensuring crop yields and the sustainability of agricultural production systems. It is not surprising that Spain’s Mediterranean basin hosts the majority of the county’s seawater desalination plants, accounting for 74% of Spain’s total desalination capacity (1,670,000 m3·día−1), with over 54% of this capacity allocated to agricultural purposes [5].
Several studies have shown that crop yields, especially for crops more sensitive to salinity, can substantially increase with the addition of DSW [6]. Furthermore, it is also well documented that reducing irrigation water salinity by incorporating DSW can enhance the quality of certain agricultural products [7,8].
In addition to its agronomic advantages, the use of DSW also offers notable environmental benefits. Increased use of DSW can aid in the recovery of overexploited aquifers by decreasing water withdrawals and irrigation water returns. Furthermore, it can reduce the saline content of the latter. Nevertheless, efficient management of irrigation using blends of DSW and conventional water is required to achieve the desired goals of increasing farmers’ profitability and guaranteeing the sustainability of the system while restoring overexploited aquifers.
However, other researchers have analyzed the potential agronomic impacts of the progressive replacement of the irrigation water with desalinated seawater (DSW) on the main crops of southeastern Spain. These authors recognize the above-mentioned beneficial impacts, but they also highlight some detrimental effects of this replacement. Among them, there are the risks of phytotoxicity, due to the increase in boron concentration, and soil alkalinization caused by the imbalance between monovalent and divalent cations in the DSW. They also reported a slight increase in the cost of fertilization. These authors concluded that the blended use of DSW with conventional resources seems the most recommendable option [9]. Water productivity is a suitable index for assessing the efficiency of irrigation water use, while water footprint is recommended for evaluating the sustainability of the system. Water footprint (WF) is defined as the volume of freshwater used, either directly or indirectly, throughout the growing cycle to produce a unit of crop yield. This concept was first introduced by Hoekstra from the UNESCO-IHE Institute for Water Education [10]. The methodology for calculating WF was developed by the Water Footprint Network (WFN), which has published the Water Footprint Assessment Manual [11]. According to this methodology, WF should include the total water consumption—either direct (used in the production process) or indirect (used to produce goods and services involved in the production process)—and distinguish between various types of water. Blue water refers to freshwater applied to crops via irrigation systems; green water pertains to precipitation falling on land and stored in the soil and eventually used by crops; and grey water denotes the volume of freshwater required to assimilate the load of pollutants based on natural background concentrations and existing ambient water quality standards.
Several researchers have developed mathematical models to optimize irrigation and fertigation management using blends of DSW and conventional waters [12,13]. However, to calibrate and validate these models, it is necessary to perform experiments to evaluate the agronomic response of crops, input productivity, and water footprints to properly adjust the model parameters. Such experiments enable the empirical validation of these models and facilitate practical recommendations for irrigation and fertigation management.
The aim of this study is to experimentally analyze the effect of three different DSW blends, with varying salinity levels, and two cropping systems (soil and soilless) on water consumption, water productivity, and water footprints in the production process.
2. Materials and Methods
2.1. Experimental Facility and Design
The tests were carried out in a greenhouse located in the experimental farm of the University of Almería (UAL-ANECOOP Foundation). This experimental farm is in the municipality of Almería in the southeast of Spain, in the Mediterranean basin (2°17′ L.O. and 36°51′ L.N.), at an elevation of 90 m above sea level.
The experimental farm has approximately 5 ha of greenhouses with different structures and equipment. The experiment was conducted over the course of three years in Greenhouse U8 (Figure 1). It is a light plastic-covered greenhouse, also known as an Almería-type greenhouse. It is oriented east to west and has an area of 1935 m2, a maximum height of 4.7 m in the upper part of the roof and 3.4 m in the lower part of the roof. The greenhouse has roof windows with a total ventilation area of 4% and side windows along the perimeter with a total ventilation area of 12.9%. The covering material is a white, three-layer thermal plastic with a thickness of 200 μm and a recommended duration of 3 years.
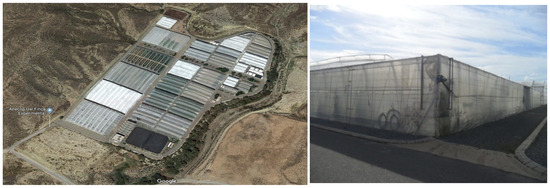
Figure 1.
Layout of the experimental UAL-ANECOOP farm (left). Experimental U8 greenhouse (right).
The experimental design was based on a randomized block design with two factors: the salinity of the water blends and the type of growing media. Regarding the first factor, three salinity levels were evaluated. Treatment T1 served as the control treatment and was irrigated with 100% desalinated seawater (DSW). The DSW, sourced from the Carboneras desalination plant, had an electrical conductivity (EC) of approximately 0.5 dS m−1. The other treatments consisted of two different water blends with EC levels of 1.5 and 3 dS m−1, corresponding to treatments T2 and T3, respectively. These EC values were chosen to cover the most common range of variation in the water salinity in the Campo de Níjar area, since the aim of the study was to reflect the usual management practices of commercial greenhouse farms in this area The second factor was the growing media, composed of two different treatments representative of the predominant cropping systems in Almería: soil (S) and soilless culture (H).
This experimental design resulted in a total of six treatments, each replicated three times, for a total of eighteen experimental units randomly distributed in the greenhouse. The experimental layout is depicted in Figure 2.
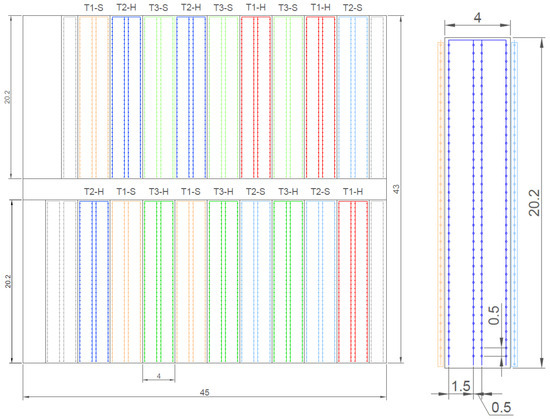
Figure 2.
Layout of the greenhouse and experimental units (irrigation laterals of the experimental treatments are depicted in different colors, whereas those of the border units are depicted in grey).
The actual cropping area of the greenhouse was 1454.4 m2, with each experimental unit covering 78 m2 and each treatment spanning 234 m2. The layout was composed of paired crop rows separated by 0.5 m, with a lane between paired rows measuring 1.5 m in width. Plants were spaced 0.5 m apart within each row, resulting in a crop density of 2 plants/m2. Accordingly, there were a total of 39 plants per row and 156 plants per treatment. Irrigation was carried out using a drip irrigation system equipped with one emitter per plant, delivering 3 Lh−1.
The soil used was artificial layered sandy soil, characteristic of greenhouse systems in Almería. This soil was composed of a 10 cm superficial layer of sand, a 10 mm layer of manure, and a 50 cm deep medium-textured layer (medium loam) placed on the natural bed. The soilless crop was grown in coconut fiber bags composed of 70% coconut and 30% chip. Each 100 cm long bag housed two plants with a substrate volume of 20 L. The substrate bags were leveled using a cork base, which facilitated drainage and prevented waterlogging. Coconut fiber is one of the most common substrates used in the area along with rockwool. It has practical advantages as compared with rockwool, such as its higher water-holding capacity.
All treatments were fertigated with a balanced nutrient solution proposed by Sonneveld and Straver [14]. Fertilizer proportions were calculated using precision fertigation equipment, tailored to the specific nutrient concentrations of the irrigation water in each quality treatment. The calculation procedure followed in this work was proposed by Urrestarazu, M. [15]. The final solution compositions are shown in Table 1.

Table 1.
Target nutrient solution by Sonneveld and Straver.
2.2. Net Crop Water Requirements and Irrigation Management
The method used in this work to estimate crop evapotranspiration (ETc) was proposed by the Food and Agriculture Organization of the United Nations (FAO) [16]. According to this methodology, ETc can be estimated as a function of reference evapotranspiration, which is a measure of the evaporative demand of the environment, and the crop coefficient (Kc). The crop coefficient accounts for the influence of the crop canopy (Equation (1)).
The reference evapotranspiration was calculated using a radiation method adjusted to the Mediterranean greenhouse conditions [17] (Equation (2)).
where b is an experimental coefficient dependent on the day of the year, and Rs,i is the net radiation inside the greenhouse. Since indoor net radiation data were unavailable for this study, they were estimated using outdoor data provided by the Níjar Weather Station, located near the experimental site, https://www.juntadeandalucia.es/agriculturaypesca/ifapa/riaweb/web/estacion/4/11 (accessed on 10 March 2025)) [18]. Indoor radiation values were simulated from the outdoor values by accounting for the transmissivity of the greenhouse covering. An average transmissivity coefficient of 0.65 was applied, based on the type and duration of the plastic sheet and the inclination of solar rays during the growing season.
Daily Kc values for the tomato crop were calculated using a model developed at the Palmerillas Research Center (La Mojonera, Almería, Spain). This model estimates daily Kc values based on the Accumulated Thermal Time (ATT), which is influenced by the maximum and minimum temperatures and the sensitivity of the crop to temperature [19,20,21].
Irrigation scheduling for each growing media followed standard procedures commonly practiced in the area. The approach was based on fixed water amounts and variable time intervals. In the case of the soil cropping system, irrigation timing was determined using a tensiometer, and irrigation was applied when water potential reached 20–30 kPa. The irrigation duration was set to 30 min per application, which resulted in a water application of 3 L m−2/irrigation. This duration was calculated to replenish soil moisture to field capacity and supply a target leaching fraction (LF), calculated as a function of the electrical conductivity of the irrigation water (ECR) and the crop’s salinity tolerance [20,22]. The latter was expressed in terms of maximum electrical conductivity allowable in the saturated extract (ECe) (Equation (3)).
For substrate culture, due to the low water-holding capacity of the substrate, shorter and more frequent irrigations were applied, with a higher LF fraction required (LF values exceeding 25% to guarantee suitable saline conditions within the substrate). Irrigation duration was reduced to 5 min per application, and the number of irrigations was determined by the leaching fraction. Additional irrigations were introduced when the target leaching fraction was not achieved, and vice versa. The electrical conductivity of the leachates was also monitored, and additional irrigations were applied when the EC values exceeded those of the input nutrient solution by 1 dS m−1.
2.3. Plant Material
The crop used in this experiment was a short-autumn-cycle tomato, grown from September to March over three consecutive years. The plant material consisted of Ramyle RZ F1 (74-207) tomatoes, developed by Rijk Zwaan Ibérica S.A (Almería, Spain). This variety is a round, canary-type tomato with a red coloration, suitable for harvesting either in bunches or as loose fruits. The plants exhibit vigorous growth, provide ample leaf coverage, yield medium- to medium–large-caliber (M-MM) fruits. The bunches are uniform, and the fruits are characterized by their firmness and extended commercial shelf life.
2.4. Experimental Measurements and Procedure
The experiment was conducted over the course of three growing cycles (C1, C2, and C3). The plantation dates for every crop cycle were 10 September 2018, for the first one, and 11 September 2019 and 2020 for the remaining two cycles. The final dates of the crop were 26 February 2019, 21 February 2020, and 9 March 2021 for crop cycles C1, C2, and C3, respectively. Table 2 shows the basic information of these three crop cycles.
Table 2.
Experimental crop cycles.
In the experiment, the total irrigation volume was calculated based on the irrigation duration set by the irrigation controller, the discharge per emitter, and numbers of emitters per m2.
The water composition was managed using individual tanks designed to supply the three quality treatments. Water blends were prepared in these tanks to obtain the target quality, and the final EC, after the addition of fertilizers, was verified by collecting samples from the discharge of the emitters.
The fruit yield for each experimental unit was weighed separately during each harvest. An EKS Premium electronic scale (E.K.S. Spain, S.A, Barcelona, Spain) was used for this purpose, offering an accuracy of 10 g and a maximum capacity of 40 kg. Non-commercial yield was assessed by separately weighing the fruits that did not meet the required commercial quality standards.
2.5. Productivity and Water Footprint Indices
Water productivity was estimated using the experimental values of water and fertilizer consumption, along with the measured total and commercial yield values. For this purpose, total and commercial water productivity indices were defined, as expressed in Equation (4).
where WPT and WPC represent the total and commercial water productivity, respectively; VR is the volume of water applied per unit area , while YT and Yc denote total and commercial yields , respectively.
To analyze the sustainability and efficiency of the treatments considered in this research, the water footprint was assessed. This research focused exclusively on the direct irrigation water applied to the crop during the growing cycle. According to the definitions, the following equations were used to calculate the various types of water footprints:
- Blue Water Footprint: Calculated as a function of the total irrigation water applied () and the crop yield (Equation (5)).
- Green Water Footprint: This was equal to zero, as the crop was cultivated in a greenhouse where no rainfall water was collected.
- Grey Water Footprint: Biological control techniques were employed in this experiment; therefore, no pesticides or other chemicals were applied. Consequently, the most restrictive case for calculating the grey water footprint was diffuse pollution caused by nitrate leaching, and it was calculated using Equation (6).
According to the Council Directive 91/676/EEC of 12 December 1991 on the protection of waters against pollution caused by nitrates from agricultural sources [23] and Directive (EU) 2020/2184 of the European Parliament and Council of 16 December 2020 on the quality of water intended for human consumption (recast) [24], the maximum allowable nitrate concentration is 50 . Regarding the natural concentration of nitrates, aquifers in this area are significantly impacted by human activities, making it impossible to determine the actual natural nitrate concentration. According to Hoekstra [11], when natural concentrations are not precisely known, it can be assumed for simplicity to be zero.
2.6. Statistical Analysis
To analyze the relationships between water productivity, footprint, and the factors considered in this study—namely, the DSW mix and growing media—a multifactor analysis of variance was performed using the statistical software Statgraphics 19 Centurion© (Version 19.7.01) [25]. This procedure identifies significant factors by performing F-tests on the ANOVA table. Fisher’s least significant difference (LSD) procedure was used to discriminate among means, with a 5.0% risk of labeling each pair of means as significantly different when the actual difference was zero.
3. Results
3.1. Water Consumption
The crop cycles analyzed in this study are depicted in Table 2.
The irrigation water requirements were estimated using the proposed methodology. Figure 3a shows the calculated ETo over the course of the three experimental years, while Figure 3b depicts the progression of the estimated ETc.
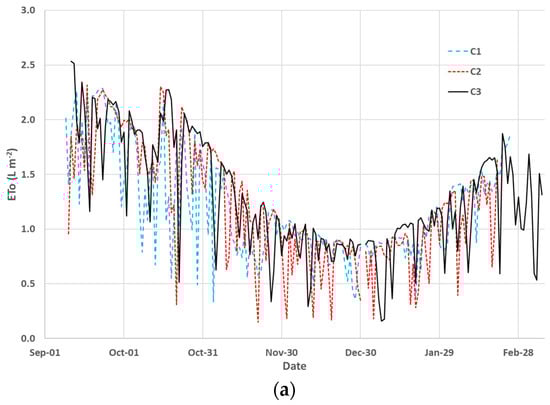
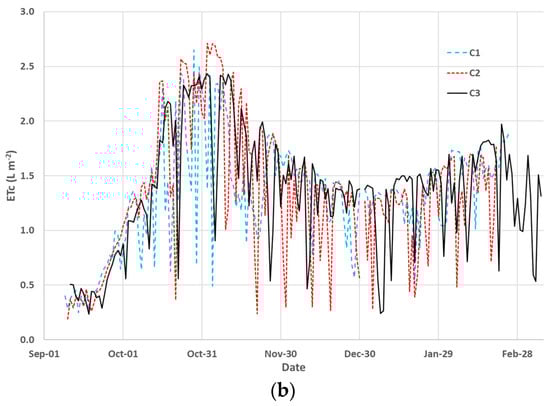
Figure 3.
Estimated reference (ETo) (a) and crop (ETc) (b) evapotranspiration values for every crop cycle.
The calculated net irrigation water ranged from 217.5 in the second cycle and 245 and 245.3 in the third cycle. The average net irrigation water across the three experimental years was 228.8 (Table 3).
Table 3.
Irrigation water consumption (in L m−2) for every treatment and growing cycle.
Table 3 also shows the water consumption for each treatment and cycle, along with the accumulated net water requirements for each crop cycle. Water consumption was considerably higher in the substrate culture treatments compared to the soil culture systems due to the higher leaching fraction required to maintain optimal saline levels in the substrate solution. Figure 3 shows the evolution of the irrigation water needs over the course of the growing season. Maximum irrigation water needs occurred in autumn when the plants completed their canopy development. The irrigation water consumption also varied across seasons depending on the specific weather conditions and duration of the crop cycle (Table 2).
3.2. Crop Yield
The yields obtained in each treatment over the three experimental years are shown in Table 4. It is important to bear in mind that this research was not a laboratory experiment but a real field-scale one. The interannual variability in several uncontrollable variables, such as weather conditions and crop management issues, made the crop yield vary across seasons. One of the most important contributing factors is the incidence of pests and diseases. Our team performed a research work in this experiment to analyze the effect of the different treatments on the incidence of some prevalent tomato diseases and their contribution to the differences in yields observed among treatments [26]. This study focused on two diseases: powdery mildew (Leveillula taurica), with a lower disease incidence in the tomato plants grown in soil and in the plants irrigated with decreasing salinity treatments, and crown and root rot in tomato (Fusarium f. sp. radicis-lycopersici), with a lower incidence in the tomato plants grown in soil and a higher incidence in the tomato plants grown in coconut substrate. The growing cycle was also another significant contributing factor. Crop yields in a spring–summer cycle are considerably higher than in an autumn–winter cycle due to the finest weather conditions, but the yield variability is also higher due to the higher incidence of pests and diseases during this cycle. To cope with interannual variability, in this research, we chose exclusively autumn–winter cycles. One of the most important factors affecting crop yield is the duration of the growing cycle. As depicted in Table 2, the planting dates were similar in all the three crop cycles, but the duration of the crop cycles varied from one year to another. The longer the growing cycle, the higher the crop yields because the number of harvests increases. As is shown in Table 4, the most productive year (C3) was also that with the longer duration. Nevertheless, in a field experiment, it is highly complicated to control all the variables involved in the production process, so it is difficult to make out the main factors involved in this interannual variability.
Table 4.
Crop yields (in kg m−2) for every treatment and growing cycle.
The average crop yields, both total and commercial, were slightly higher in the soilless culture compared to the soil culture. The only exception to this trend occurred during the third year of the experiment. Additionally, the average yields increased slightly as the salinity of the irrigation water decreased, indicating higher blends of DSW.
3.3. Water Productivity
The results of the ANOVA analysis indicated that the growing media had a significant effect on water productivity. Specifically, the growing media significantly influenced commercial productivity during growing cycles C1 and C2 and total productivity during cycles C2 and C3, as indicated by p-values of less than 0.05 in all these cases. Conversely, the water quality treatments generally did not have a significant effect on total water productivity, except commercial productivity in cycle C3.
Figure 4 presents the averages of commercial (a) and total (b) water productivity for the different water quality treatments. Productivity values averaged approximately 20 for total productivity and 15 for commercial productivity. Water productivity slightly decreased as the salinity of the water treatments increased, although these differences were not significant in most cases, except during the third crop cycle and for total productivity. This effect can be attributed to slightly higher yields observed in the treatments with lower salinity and their reduced water consumption.
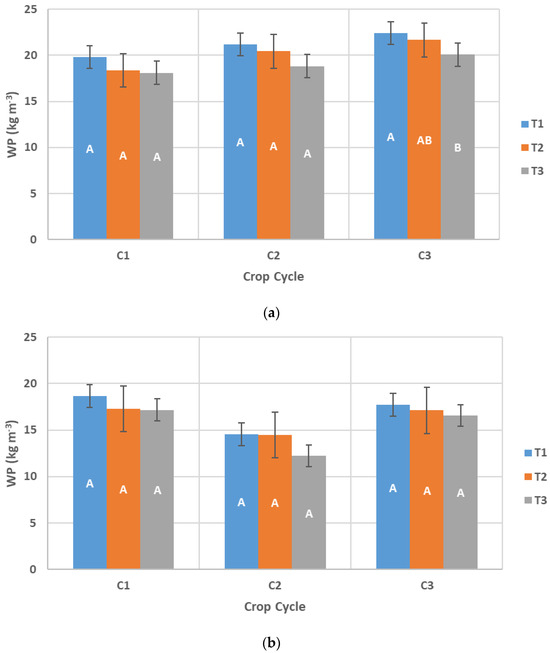
Figure 4.
Total (a) and commercial (b) water productivity values (WP) for every water mix treatment and crop cycle (letters indicate different homogeneous groups).
Regarding the growing media, the soil culture yielded both higher total and commercial productivity compared to the substrate culture (Figure 5). These differences were statistically significant in all cases, except during the third crop cycle. This outcome can be attributed to the fact that although the yields were slightly higher in substrate culture, this system required considerably more water consumption due to the higher leaching fractions required.
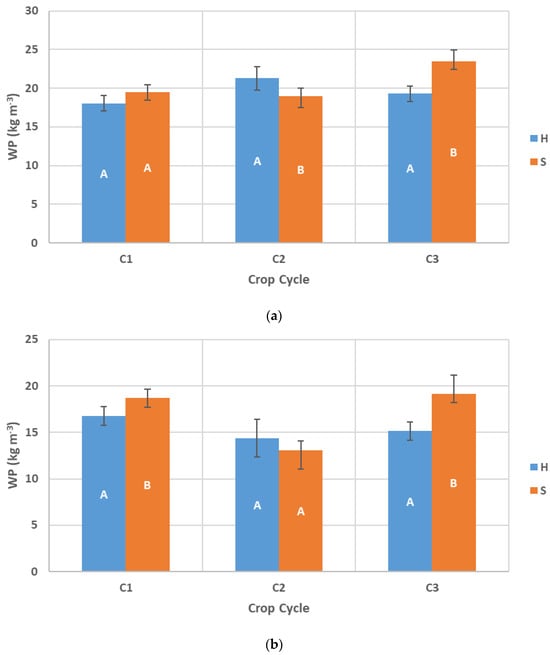
Figure 5.
Total (a) and commercial (b) water productivity valus (WP) for both growing media and every crop cycle (letters indicate different homogeneous groups).
3.4. Water Footprints
The results of the ANOVA analysis revealed that both factors, growing media and water quality, had a significant effect on total and commercial water footprints. The growing media had a significant effect on both total and commercial water footprints across the three years of study, while water quality was significant in two out of the three years (crop cycles C2 and C3).
Figure 6 shows the average blue, green, and grey water footprint distributions based on the water quality treatments (a) and growing media (b). The average water footprints were approximately 200 for the soilless culture and were slightly higher than 100 for the soil culture. Both water footprints are relatively low compared to other agricultural products or the same crop grown in open-field conditions [27].
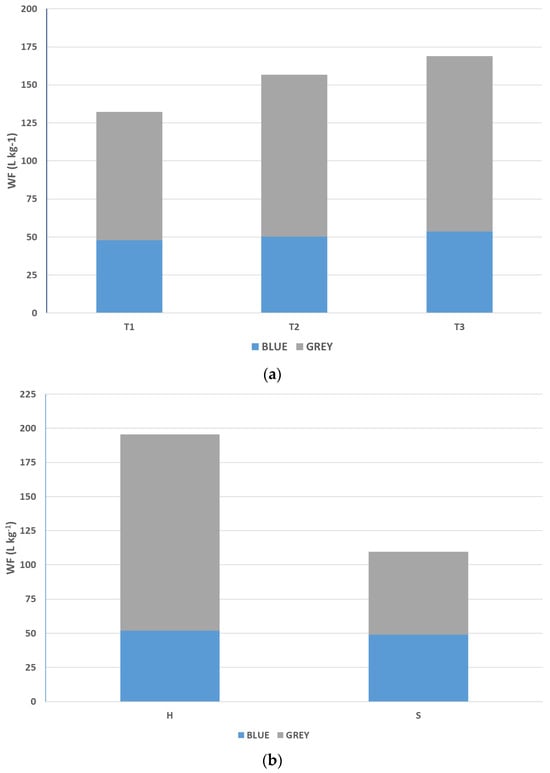
Figure 6.
Average blue, green, and grey water footprint distribution as a function of the quality treatments (a) and growing media (b).
The green water footprint was zero in all cases, as the crops were grown in a greenhouse and no direct rainfall fell on the crops. Furthermore, precipitation that fell on the greenhouse roof was not collected, though rainfall in this area is minimal.
A noteworthy finding is that the grey water footprint had a considerably higher contribution to the total water footprint than the blue water footprint. Grey water footprints depend mainly on the concentration of nitrates in the nutrient solution and on the nitrate leaching fraction. The concentration of nitrates in the target nutrient solution applied to all the treatments was 10.25 [14]. This is the reason why the leaching fractions were considerably higher in the soilless treatments (leaching fraction of 22% on average) than in the soil treatments (leaching fraction of 10% on average). Considering the concentration of nitrates in the nutrient solution and the specific leaching fraction of every treatment, the grey water footprints were then calculated by applying Equation (6).
Figure 7 presents the total (a) and commercial (b) water footprints as influenced by the water quality treatments. As depicted in Figure 7a, water footprints increased with higher salinity levels in the treatments. This trend can be attributed to slightly lower yields, greater water consumption, and higher salt concentrations in the nutrient solution. Treatment T1, irrigated with DSW, exhibited the lowest water footprint, averaging approximately 150 .
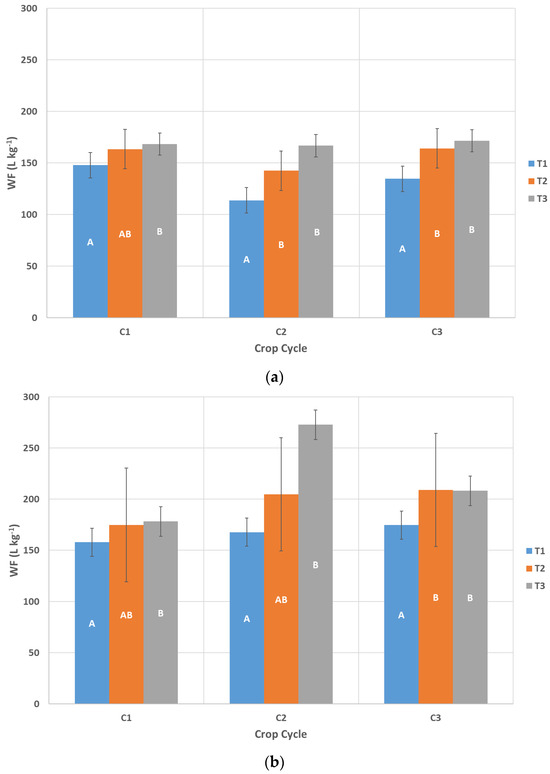
Figure 7.
Total (a) and commercial (b) water footprint (WF) means and 95% least mean squares for every salinity treatment and crop cycle (letters indicate different homogeneous groups).
Figure 8 shows the total (a) and commercial (b) water footprints as influenced by the two types of growing media. When considering the growing media, the soilless culture exhibited the highest WF across all crop cycles, with these differences being statistically significant in every instance. This outcome can be attributed to the greater water consumption and higher leaching fractions required in this growing system.
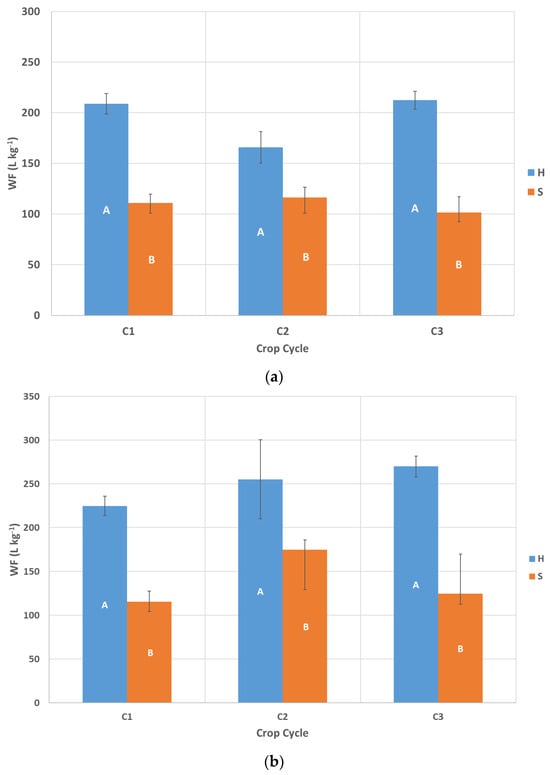
Figure 8.
Total (a) and commercial (b) water footprint (WF) means and 95% least mean squares for every growing media and crop cycle (letters indicate different homogeneous groups).
These results suggest that although substrate culture is a modern technique offering effective control of crop development, higher yields, and good fruit quality, its efficiency and sustainability require improvement. Encouraging the reuse of leachates is advisable, as this allows for water and nutrients to be recovered. Such recirculation and reuse practices align with the principles of the circular economy and can help reduce the environmental impact of substrate culture. Further research into this technique is strongly recommended.
4. Discussion
Water productivity was significantly influenced by the growing media, but it was not significantly affected by the water quality. Nevertheless, it was noted that water productivity slightly decreased as the salinity of the water treatments increased. This effect can be attributed to the slightly higher yields observed in the treatments with lower salinity and their reduced water consumption. This fact was reported by other authors, who found beneficial agronomic impacts of reducing water salinity for a DSW blend at least up to 50%. The use of a higher percentage of DSW blend did not have noticeable agronomic effect, but it had both detrimental environmental and economic impacts. The environmental impact was caused by the higher specific energy consumption, whereas the economic impact was due to the higher cost of DSW. These authors concluded that the combined use of DSW with traditional resources is the most efficient option from a multidisciplinary point of view [28].
On the other hand, both factors, growing media and water quality, had a significant effect on total and commercial water footprints. Water footprints of a tomato crop grown on Mediterranean greenhouses are low compared to other vegetable crops grown in open-field conditions or to other animal or processed food products [27].
The contribution of the grey water footprint to the total water footprint was considerable, particularly in an open-loop soilless system without recirculation of leachates like the one tested in this research. This fact explains that the grey water footprint was higher in the soilless treatments than in the soil ones, as depicted in Figure 6b. The recirculation and reuse of leachates in closed-loop soilless systems are also highly recommendable techniques to improve the efficiency and sustainability of soilless cultivation. The results found in this work agree with those found in other research works. Some researchers noted that the transformation of soilless culture from open to close-loop system produced better results in terms of water use efficiency while maintaining the quality of the yield [29]. In other research work, the water footprint (WF) of chicory crop (Cichorium intybus L. var. silvestre) grown in different cropping systems was assessed and compared. These authors found that the highest water productivity (lowest water footprint) was obtained in a closed-loop system (33.70 kg m−3) while the lowest water productivity was achieved in an open-loop system (21.84 kg m−3) [30]. Other researchers concluded that closed hydroponic systems had water productivity values of up to 96% and nutrients values of up to 97% as compared to open hydroponic systems [31].
Another efficient measure to lower the grey water footprint is to implement efficient fertigation programming methods aimed at diminishing fertilizer application. Some researchers have pointed out that in open soilless systems, a reduction in the concentration of fertilizers applied to nutrient solutions considerably decreased nitrate leaching, thus reducing the grey water footprint and the risk of nitrate pollution [32,33].
5. Conclusions
An experimental research work was carried out over three years to evaluate the effect of varying blends of desalinated seawater (DSW) with different salinity levels and two types of growing media, soil and soilless culture, on the efficiency and sustainability of the system. Two indices were used to measure water use efficiency and sustainability: water productivity (WP) and water footprint (WF).
The growing media emerged as the main factor influencing both WP and WF. The soilless (substrate) culture had lower WP and higher WF values compared to the soil culture. This discrepancy was attributed to the higher water consumption and leaching fraction required by the soilless culture. Although crop yields were slightly higher in the soilless system, they did not offset the increased water use and drainage. From the perspective of WP and WF, soil culture seems to be more favorable than open soilless systems.
The implementation of closed soilless culture systems with leachate recirculation and nutrient and water reuse is highly recommended as a technique to improve the efficiency and sustainability of soilless systems. However, soilless systems in most commercial greenhouse farms are usually less efficient and sustainable than open-loop ones since the management of leachates, their disinfection, and their reinjection to the nutrient solution is a highly complex problem at a farm scale. Further research into these systems is also strongly encouraged to remove these drawbacks and encourage the transformation of closed-loop systems to open-loop ones.
The quality of the water solution did not have a significant impact on WP and WF. WP values were slightly lower and WF values were slightly higher as the salinity levels in the treatments increased; however, these differences were not significant in most cases. This finding suggests that the conjunctive use of DSW and conventional water, in proportions within the range used in this study, can be implemented without significantly altering the productivity and sustainability of the system. If the objective is to maximize productivity and sustainability, a higher proportion of DSW is recommended.
The experimental results obtained in this study have practical applications and are being used to calibrate and validate DSW blending and fertigation management models (e.g., Garum or Irriblend-DSW models). These models aid farmers in making informed decisions regarding DSW and conventional water blends, as well as fertigation management practices that maximize economic benefits and reduce the environmental impact of agricultural processes.
Author Contributions
Conceptualization, J.R., J.M. and D.L.V.; methodology, J.R., J.M. and P.M.M.; validation, J.R., J.M., C.G., A.A.P. and P.M.M.; investigation, J.R., J.M., C.G., A.A.P. and P.M.M.; resources, J.R., J.M. and D.L.V.; data curation, J.R., J.M., C.G., A.A.P. and P.M.M.; writing—original draft preparation, J.R., J.M. and P.M.M.; writing—review and editing, J.R., J.M., C.G., A.A.P., D.L.V. and P.M.M.; supervision, J.R.; project administration, J.R. and J.M.; funding acquisition, J.R., J.M. and D.L.V. All authors have read and agreed to the published version of the manuscript.
Funding
This research was funded by the Ministry of Science and Innovation of Spain, grant number PID2020-118492RB-C21.
Data Availability Statement
The data presented in this study are available upon reasonable request from the corresponding author.
Conflicts of Interest
The authors declare no conflicts of interest.
Abbreviations
The following abbreviations are used in this manuscript:
| DSW | Desalinated sea water |
| UNESCO-IHE | United Nations Education, Science, and Culture Organization—Institute for Water Education (Delft, The Netherlands) |
| WF | Water footprint |
| WFN | Water footprint network |
| WP | Water productivity |
References
- Cajamar. Análisis de La Campaña Hortofrutícola. In Campaña 2021/2022; Análisis de Campaña; Cajamar: Almería, Spain, 2022. [Google Scholar]
- Sánchez, J.A.; Reca, J.; Martínez, J. Irrigation Water Management in a Mediterranean Greenhouse District: Irrigation Adequacy Assessment. Irrig. Drain. 2015, 64, 299–313. [Google Scholar] [CrossRef]
- Maas, E.V.; Hoffman, G.J. Crop Salt Tolerance—Current Assessment. J. Irrig. Drain. Div. 1977, 103, 115–134. [Google Scholar] [CrossRef]
- Magán, J.J.; Gallardo, M.; Thompson, R.B.; Lorenzo, P. Effects of Salinity on Fruit Yield and Quality of Tomato Grown in Soil-Less Culture in Greenhouses in Mediterranean Climatic Conditions. Agric. Water Manag. 2008, 95, 1041–1055. [Google Scholar] [CrossRef]
- García-Rubio, M.A.; Guardiola, J. Desalination in Spain: A Growing Alternative for Water Supply. Int. J. Water Resour. Dev. 2012, 28, 171–186. [Google Scholar] [CrossRef]
- Flowers, T.J.; Ragab, R.; Malash, N.; Gawad, G.A.; Cuartero, J.; Arslan, A. Sustainable Strategies for Irrigation in Salt-Prone Mediterranean: SALTMED. Agric. Water Manag. 2005, 78, 3–14. [Google Scholar] [CrossRef]
- Antolinos, V.; Sánchez-Martínez, M.J.; Maestre-Valero, J.F.; López-Gómez, A.; Martínez-Hernández, G.B. Effects of Irrigation with Desalinated Seawater and Hydroponic System on Tomato Quality. Water 2020, 12, 518. [Google Scholar] [CrossRef]
- Balibrea, M.E.; Cayuela, E.; Artés, F.; Pérez-Alfocea, F. Salinity Effects on Some Postharvest Quality Factors in a Commercial Tomato Hybrid. J. Hortic. Sci. 1997, 72, 885–892. [Google Scholar] [CrossRef]
- Martínez-Álvarez, V.; Imbernón-Mulero, A.; Maestre-Valero, J.F.; Ben Abdallah, S.; Gallego-Elvira, B. Agronomic Analysis of the Replacement of Conventional Agricultural Water Supply by Desalinated Seawater as an Adaptive Strategy to Water Scarcity in South-Eastern Spain. Agronomy 2023, 13, 2878. [Google Scholar] [CrossRef]
- Hoekstra, A.; Hung, P.Q. Virtual Water Trade: A Quantification of Virtual Water Flows between Nations in Relation to International Crop Trade. Water Sci. Technol. 2002, 49, 203–209. [Google Scholar]
- Hoekstra, A.Y. The Water Footprint Assessment Manual: Setting the Global Standard; Routledge: London, UK, 2011. [Google Scholar]
- Reca, J.; Trillo, C.; Sánchez, J.A.; Martínez, J.; Valera, D. Optimization Model for On-Farm Irrigation Management of Mediterranean Greenhouse Crops Using Desalinated and Saline Water from Different Sources. Agric. Syst. 2018, 166, 173–183. [Google Scholar] [CrossRef]
- Gallego-Elvira, B.; Reca, J.; Martin-Gorriz, B.; Maestre-Valero, J.F.; Martínez-Alvarez, V. Irriblend-DSW: A Decision Support Tool for the Optimal Blending of Desalinated and Conventional Irrigation Waters in Dry Regions. Agric. Water Manag. 2021, 255, 107012. [Google Scholar] [CrossRef]
- Sonneveld, C.; Straver, N.A. Nutrient Solutions for Vegetables and Flowers Grown in Water or Substrates; Research Station for Floriculture and Glasshouse Vegetables: Naaldwijk, The Netherlands, 1988. [Google Scholar]
- Urrestarazu, M. Tratado de Cultivo Sin Suelo; Mundi-Prensa: Madrid, Spain, 2004; ISBN 978-84-8476-139-6. [Google Scholar]
- Allen, R.G.; Pereira, L.S.; Raes, D.; Smith, M. Crop Evapotranspiration-Guidelines for Computing Crop Water Requirements-FAO Irrigation and Drainage Paper 56. FAO Rome 1998, 300, D05109. [Google Scholar]
- Fernández, M.D.; Bonachela, S.; Orgaz, F.; Thompson, R.; López, J.C.; Granados, M.R.; Gallardo, M.; Fereres, E. Measurement and Estimation of Plastic Greenhouse Reference Evapotranspiration in a Mediterranean Climate. Irrig. Sci. 2010, 28, 497–509. [Google Scholar] [CrossRef]
- IFAPA (Instituto Andaluz de Investigación y Formación Agraria, Pesquera, Alimentaria y de la Producción Ecológica) Red de Información Agroclimática de Andalucía (RIA). Available online: https://www.juntadeandalucia.es/agriculturaypesca/ifapa/riaweb/web/ (accessed on 10 March 2025).
- Bonachela, S.; González, A.M.; Fernández, M.D. Irrigation Scheduling of Plastic Greenhouse Vegetable Crops Based on Historical Weather Data. Irrig. Sci. 2006, 25, 53–62. [Google Scholar] [CrossRef]
- Fernández, M.D.; Orgaz, F.; Fereres, E.; López, J.; Céspedes, A.; Pérez, J.; Bonachela, S.; Gallardo, M. Programación Del Riego de Cultivos Hortícolas Bajo Invernadero En El Sudeste Español; Caja Rural: Almería, Spain, 2001. [Google Scholar]
- Orgaz, F.; Fernández, M.; Bonachela, S.; Gallardo, M.; Fereres, E. Evapotranspiration of Horticultural Crops in an Unheated Plastic Greenhouse. Agric. Water Manag. 2005, 72, 81–96. [Google Scholar] [CrossRef]
- González, M.; Céspedes López, A.; González Céspedes, A. PrHo V.2, 0: Programa de Riego Para Cultivos Hortícolas En Invernadero. Ser. Las Palmerillas-Cuad. Téc. 2008. Available online: https://www.plataformatierra.es/innovacion/prho-v-20-programa-de-riego-para-cultivos-horticolas-en-invernadero (accessed on 10 March 2025). (In Spanish).
- Directive, C. Others Concerning the Protection of Waters against Pollution Caused by Nitrates from Agricultural Sources. Official Journal. 1991, p. 375. Available online: https://www.researchgate.net/publication/312458052_Council_Directive_91676EEC_of_12_December_1991_concerning_the_protection_of_waters_against_pollution_caused_by_nitrates_from_agricultural_sources (accessed on 10 March 2025).
- European Union (EU). Directive (EU) 2020/2184 of the European Parliament and of the Council of 16 December 2020 on the Quality of Water Intended for Human Consumption (Recast). Dir. EU 2020, 53, 1–62. Available online: http://data.europa.eu/eli/dir/2020/2184/oj (accessed on 10 March 2025).
- Statgraphics Technologies, Inc. Statgraphics® Centurion 19. User Manual; Statgraphics Technologies, Inc.: The Plains, VA, USA, 2020. [Google Scholar]
- Ávalos-Sánchez, E.; López-Martínez, A.; Molina-Aiz, F.D.; Reca, J.; Marín-Membrive, P.; Valera-Martínez, D.L. Effect of Different Substrates, and Irrigation with Water with Different Saline Concentrations, on the Development of Tomato Fungal Diseases in an Almería-Type Greenhouse. Agronomy 2022, 12, 1050. [Google Scholar] [CrossRef]
- Mekonnen, M.; Hoekstra, A. The Green, Blue and Grey Water Footprint of Crops and Derived Crop Products. Hydrol. Earth Syst. Sci. Discuss. 2011, 15, 1577–1600. [Google Scholar] [CrossRef]
- Martínez-Alvarez, V.; Imbernón-Mulero, A.; Gallego-Elvira, B.; Soto-García, M.; Maestre-Valero, J.F. Multidisciplinary Assessment of the Agricultural Supply of Desalinated Seawater in South-Eastern Spain. Desalination 2023, 548, 116252. [Google Scholar] [CrossRef]
- Putra, P.A.; Yuliando, H. Soilless Culture System to Support Water Use Efficiency and Product Quality: A Review. Agric. Agric. Sci. Procedia 2015, 3, 283–288. [Google Scholar] [CrossRef]
- Fayezizadeh, M.R.; Ansari, N.A.Z.; Albaji, M.; Khaleghi, E. Effects of Hydroponic Systems on Yield, Water Productivity and Stomatal Gas Exchange of Greenhouse Tomato Cultivars. Agric. Water Manag. 2021, 258, 107171. [Google Scholar] [CrossRef]
- Atzori, G.; Guidi Nissim, W.; Caparrotta, S.; Santantoni, F.; Masi, E. Seawater and Water Footprint in Different Cropping Systems: A Chicory (Cichorium intybus L.) Case Study. Agric. Water Manag. 2019, 211, 172–177. [Google Scholar] [CrossRef]
- Thompson, R.B.; Gallardo, M.; Rodríguez, J.S.; Sánchez, J.A.; Magán, J.J. Effect of N Uptake Concentration on Nitrate Leaching from Tomato Grown in Free-Draining Soilless Culture under Mediterranean Conditions. Sci. Hortic. 2013, 150, 387–398. [Google Scholar] [CrossRef]
- Cedeño, J.; Magán, J.J.; Thompson, R.B.; Fernández, M.D.; Gallardo, M. Reducing Nutrient Loss in Drainage from Tomato Grown in Free-Draining Substrate in Greenhouses Using Dynamic Nutrient Management. Agric. Water Manag. 2023, 287, 108418. [Google Scholar] [CrossRef]
Disclaimer/Publisher’s Note: The statements, opinions and data contained in all publications are solely those of the individual author(s) and contributor(s) and not of MDPI and/or the editor(s). MDPI and/or the editor(s) disclaim responsibility for any injury to people or property resulting from any ideas, methods, instructions or products referred to in the content. |
© 2025 by the authors. Licensee MDPI, Basel, Switzerland. This article is an open access article distributed under the terms and conditions of the Creative Commons Attribution (CC BY) license (https://creativecommons.org/licenses/by/4.0/).