Article

TQVGModel: Tomato Quality Visual Grading and Instance Segmentation Deep Learning Model for Complex Scenarios

School of Mechanical and Automotive Engineering, Guangxi University of Science and Technology, Liuzhou 545006, China
*
Author to whom correspondence should be addressed.
Agronomy 2025, 15(6), 1273; https://doi.org/10.3390/agronomy15061273
Submission received: 18 April 2025 / Revised: 19 May 2025 / Accepted: 20 May 2025 / Published: 22 May 2025

Abstract

:
To address the challenges of poor instance segmentation accuracy, real-time performance trade-offs, high miss rates, and imprecise edge localization in tomato grading and harvesting robots operating in complex scenarios (e.g., dense growth, occluded fruits, and dynamic viewing conditions), an accurate, efficient, and robust visual instance segmentation network is urgently needed. This paper proposes TQVGModel (Tomato Quality Visual Grading Model), a Mask RCNN-based instance segmentation network for tomato quality grading. First, TQVGModel employs a multi-branch IncepConvV2 backbone, reconstructed via ConvNeXt architecture and large-kernel convolution decomposition, to enhance instance segmentation accuracy while maintaining real-time performance. Second, the Class Balanced Focal Loss is adopted in the classification branch to prioritize sparse or challenging classes, reducing the miss rates in complex scenes. Third, an Enhanced Sobel (E-Sobel) operator integrates boundary prediction with an edge loss function, improving edge localization precision for quality assessment. Additionally, a quality grading subsystem is designed to automate tomato evaluation, supporting subsequent harvesting and growth monitoring. A high-quality benchmark dataset, Tomato-Seg, is constructed for complex-scene tomato instance segmentation. Experiments show that the TQVGModel-Tiny variant achieves an 80.05% mAP (7.04% higher than Mask R-CNN), with 33.98 M parameters (10.2 M fewer) and 53.38 ms inference speed (16.6 ms faster). These results demonstrate TQVGModel’s high accuracy, real-time capability, reduced miss rates, and precise edge localization, providing a theoretical foundation for tomato grading and harvesting in complex environments.

1. Introduction

Tomatoes are globally cultivated vegetable crops prized for their nutritional value and flavor [1]. Currently, tomato harvesting remains predominantly manual, lacking systematic quality grading. This approach is labor-intensive, time-consuming, and inconsistent in quality control, underscoring the need for automated grading and harvesting robots [2,3]. However, the complex harvesting environments—characterized by dense growth, fruit occlusion, and varying fields of view—pose significant challenges for visual perception systems. Achieving high-accuracy and real-time instance segmentation for tomato quality grading under such conditions remains a critical unsolved problem [4].
The core challenge lies in balancing accuracy and computational efficiency in complex scenarios. Existing methods struggle with occlusions, edge localization, and generalization across diverse field conditions [5,6,7]. While deep learning (e.g., CNNs) has surpassed traditional techniques [8], current approaches either prioritize speed (e.g., YOLO [9], SSD [10]) at the cost of accuracy or achieve precision (e.g., Mask R-CNN) with prohibitive computational overhead. For instance, region-free detectors like YOLOv8 [11] lack fine-grained segmentation, while region-based methods [12,13] degrade in dense occlusions [14,15]. Recent enhancements (e.g., attention mechanisms [16,17]) further exacerbate computational demands, hindering real-time deployment.
To address these gaps, this study proposes TQVGModel, a novel instance segmentation network based on Mask R-CNN, tailored for tomato quality grading. Our objectives are to improve accuracy in occluded and complex scenes via multi-branch feature extraction (IncepConvV2) and self-supervised training (FCMAE), enhance real-time performance through optimized architecture design, refine edge localization using an E-Sobel operator and edge loss, and integrate a vision-based grading subsystem for automated quality evaluation.
Prior work on this subject falls into two categories: region-free (e.g., YOLO [9], DSE-YOLO [18]) and region-based (e.g., Mask R-CNN [13]) methods. While the former enables real-time detection [11,19], it lacks precision for grading; the latter offers pixel-wise segmentation but suffers dense occlusions [14]. Hybrid approaches (e.g., attention-augmented Mask R-CNN [16]) improve robustness but increase computational costs. Our work bridges these trade-offs by improving Mask R-CNN’s efficiency and accuracy, specifically for tomato grading. The main contributions of this study are as follows:
(1)
This study proposes TQVGModel, a novel network based on Mask R-CNN, which incorporates a multi-branch reconstructed IncepConvV2 as the feature extraction network and utilizes the FCMAE self-supervised training strategy. This approach enhances the network’s adaptability to occlusions, improving both instance segmentation accuracy and real-time performance in complex scenarios.
(2)
The Class-Balanced Focal Loss [20] function is introduced in the class branch of the network to mitigate the challenges of sparse tomato samples and complex background instance segmentation during training. This enables TQVGModel to focus more on tomato samples that are few in number and difficult to segment, thereby improving overall in-stance segmentation accuracy and reducing missed detections.
(3)
In the mask branch, the enhanced E-Sobel (Enhanced Sobel) operator is used to fuse the predicted boundary information of the target, combined with an edge loss function guidance mechanism. This enables TQVGModel to focus more on the edge information of the tomato instance segmentation, improving edge localization accuracy, and providing key discriminative data for evaluating tomato quality in the grading subsystem.
(4)
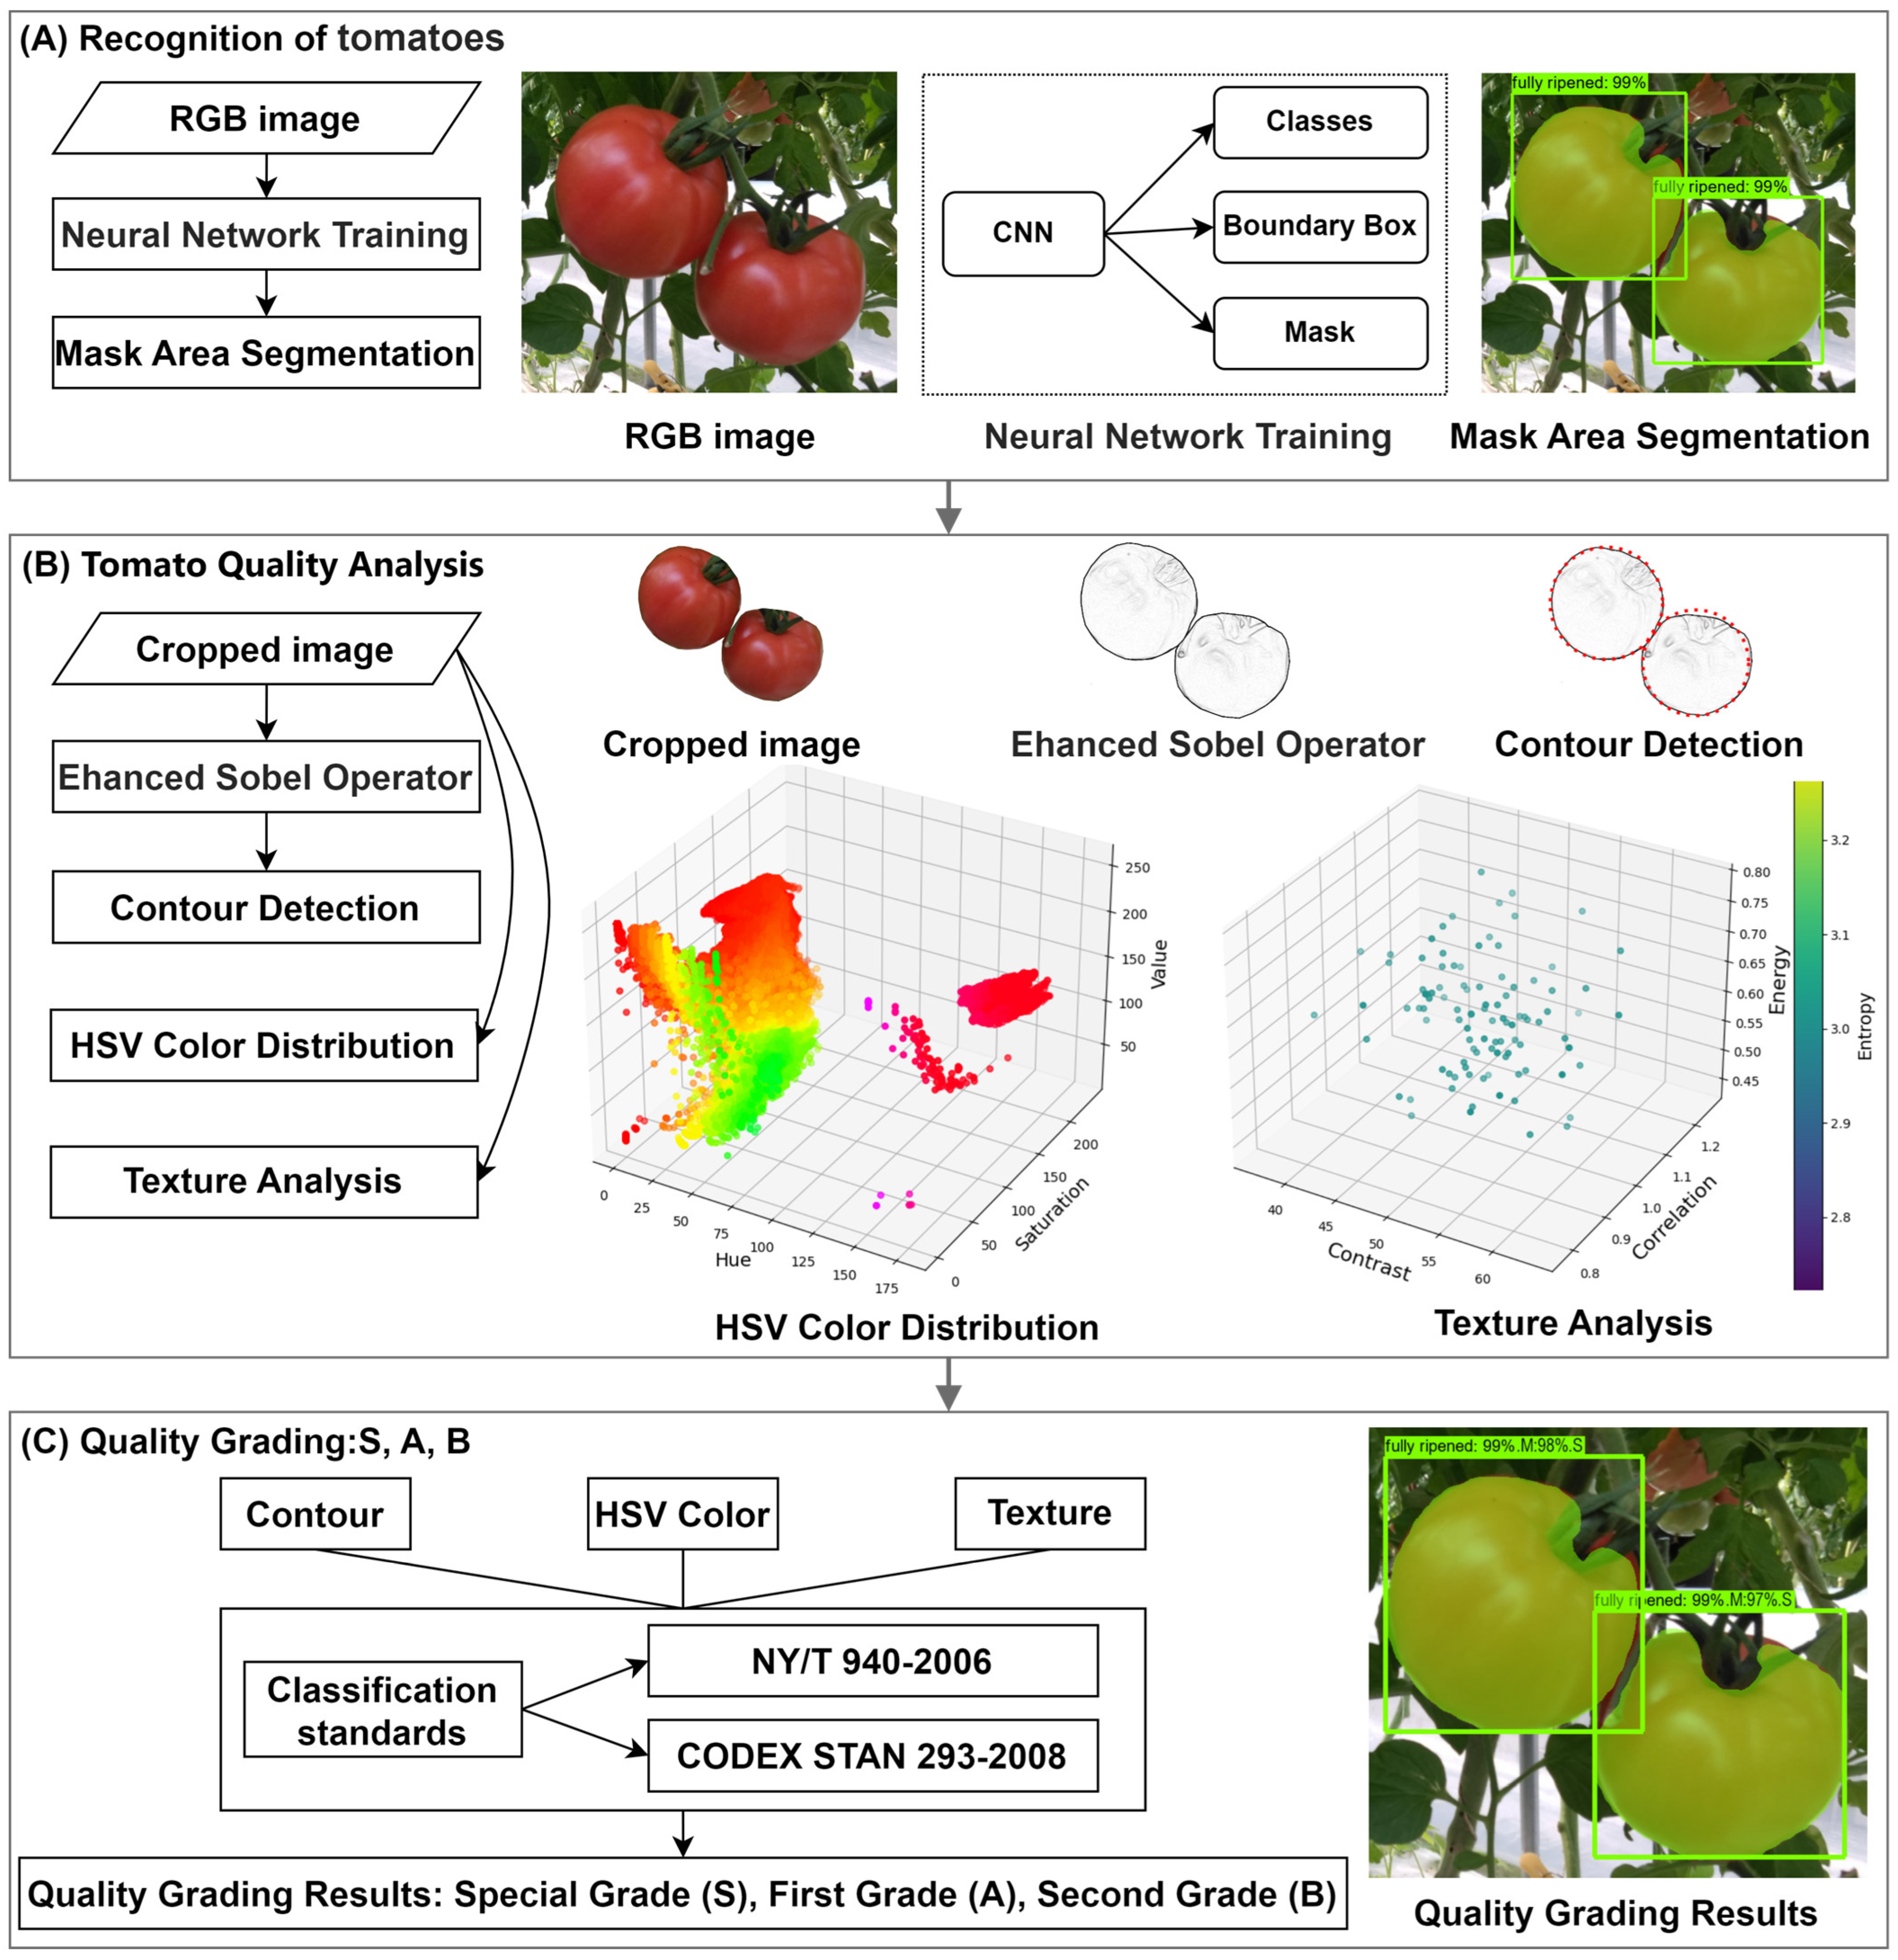
We present a vision-based tomato quality grading subsystem that enables automated quality evaluation, offering decision-making support for subsequent graded harvesting by agricultural robots and crop growth monitoring.
(5)
A tomato image instance segmentation dataset for complex scenarios is constructed to provide key data support for research related to tomato grading instance segmentation and harvesting.
The paper is structured as follows: Section 2 details the dataset composition, sample preparation, and the architecture of TQVGModel; Section 3 describes the experimental de-sign and parameter settings; Section 4 presents results and analysis; and Section 5 concludes with future directions.

2. Materials and Methods

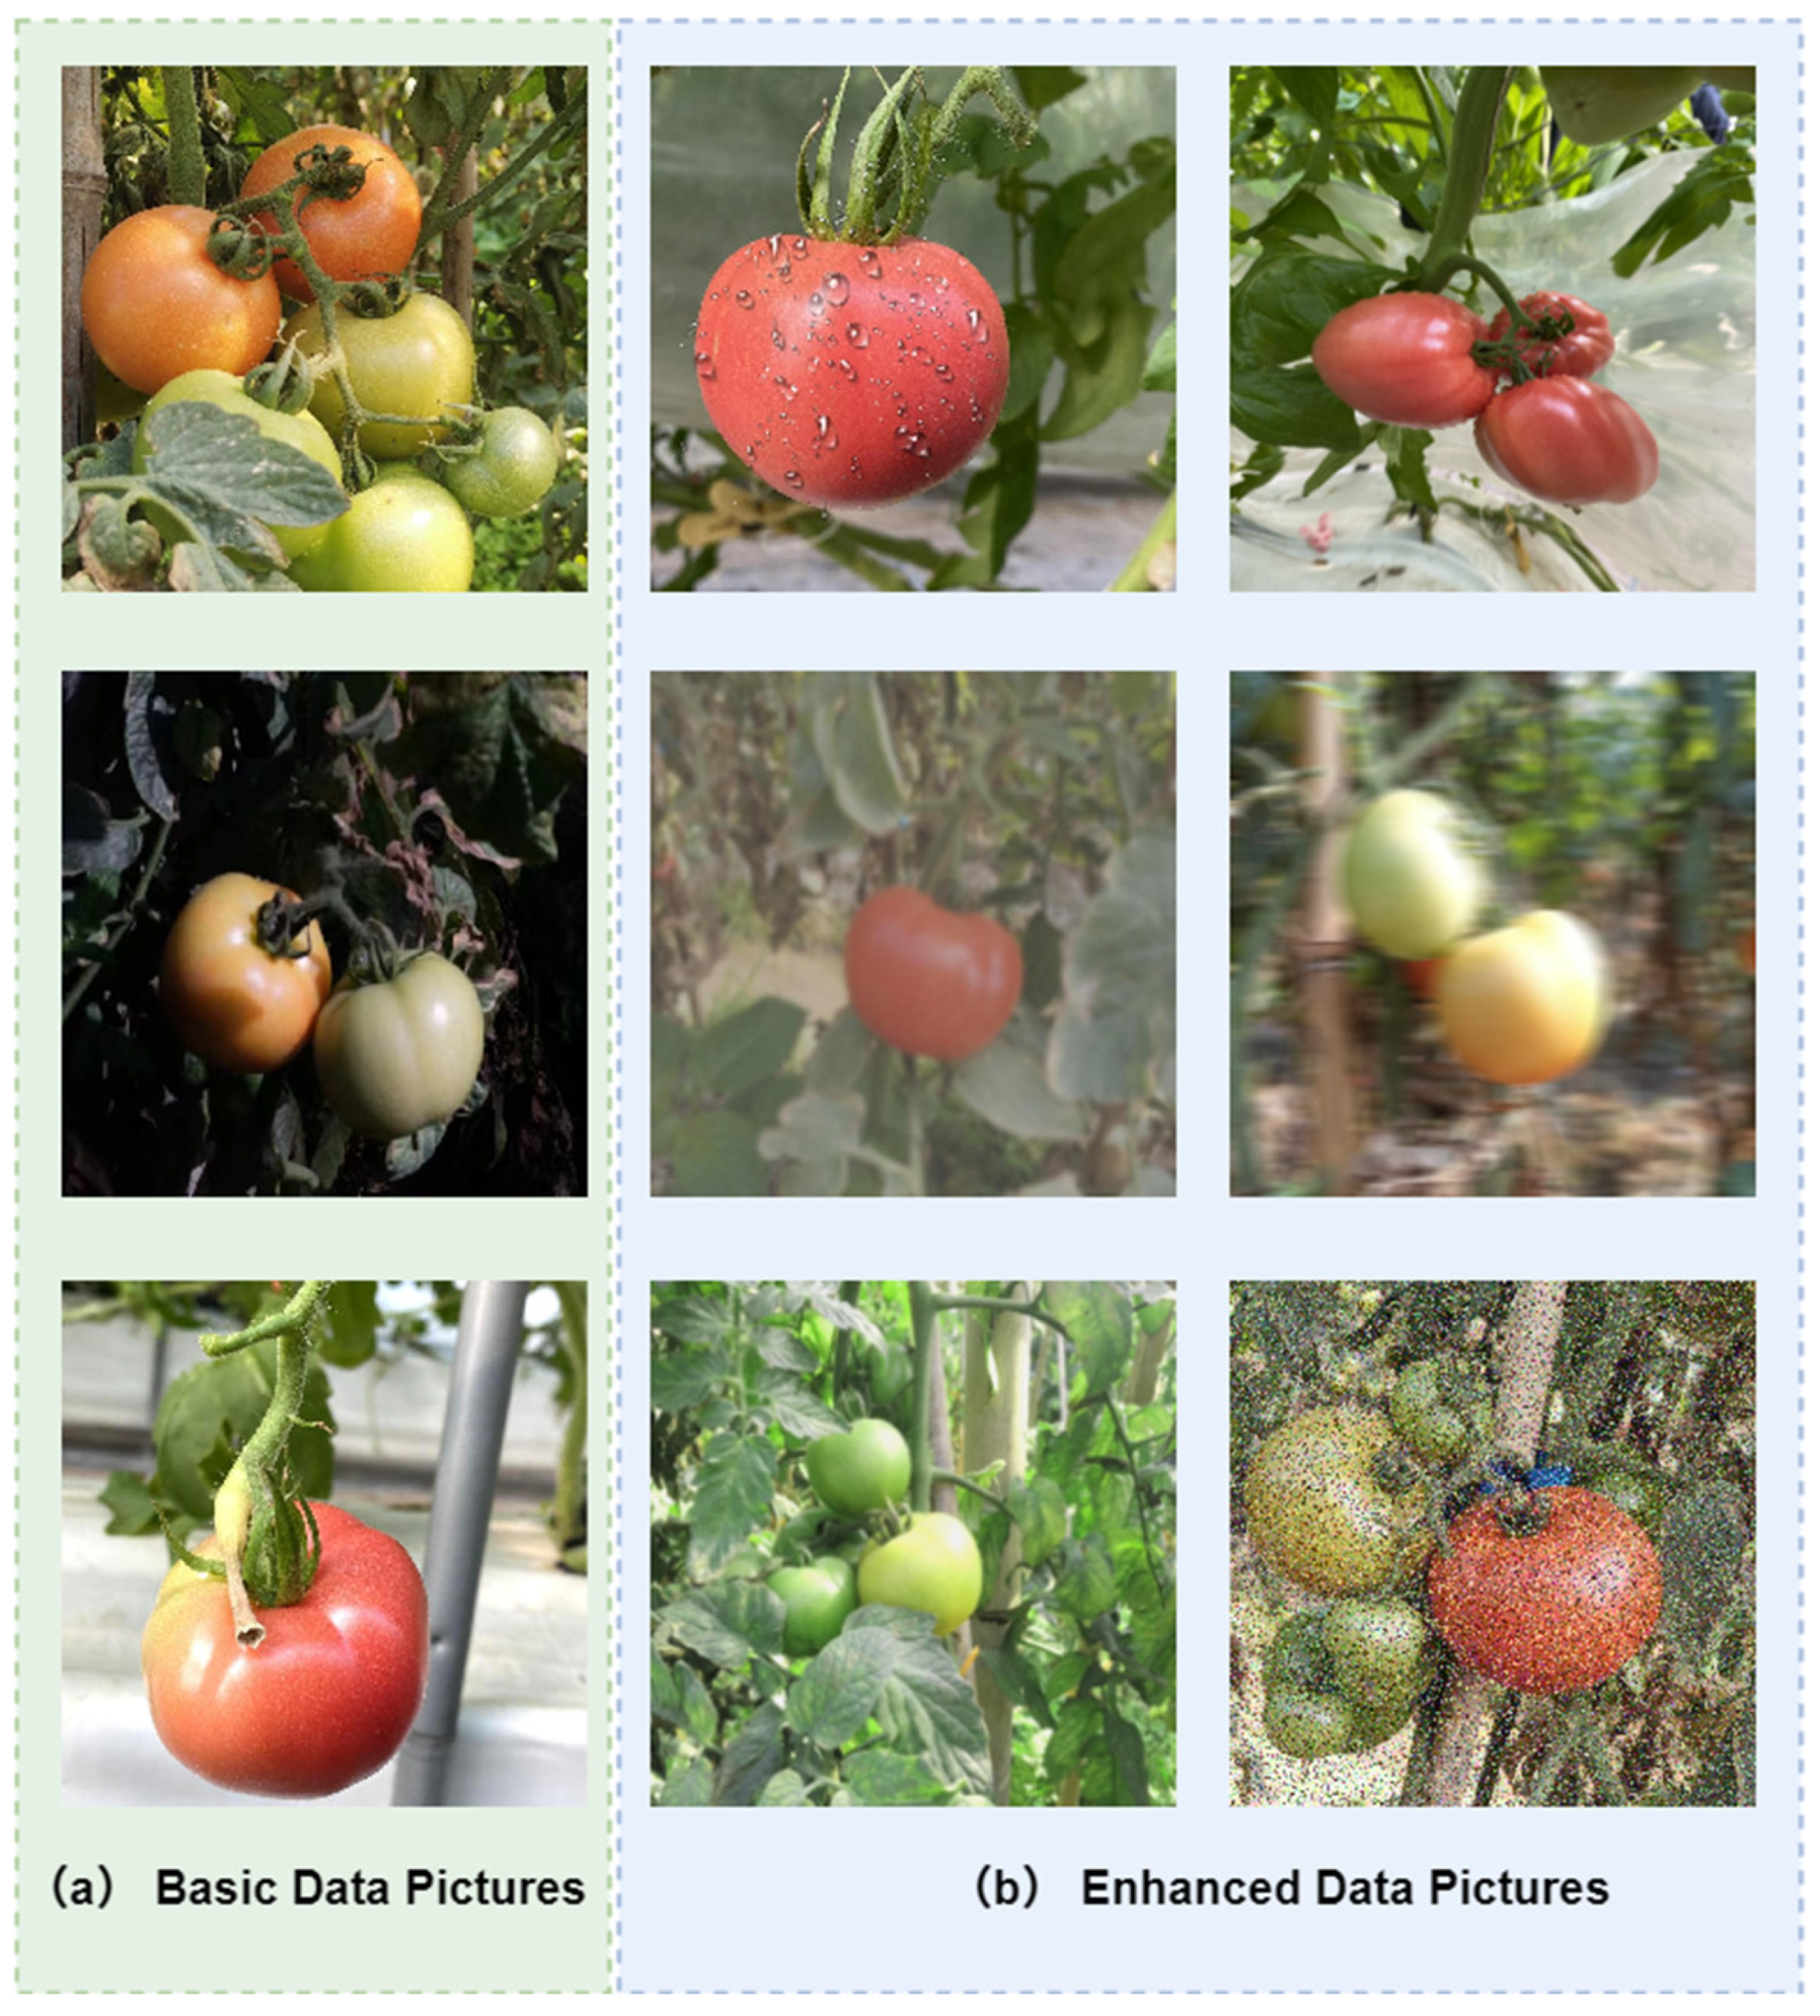
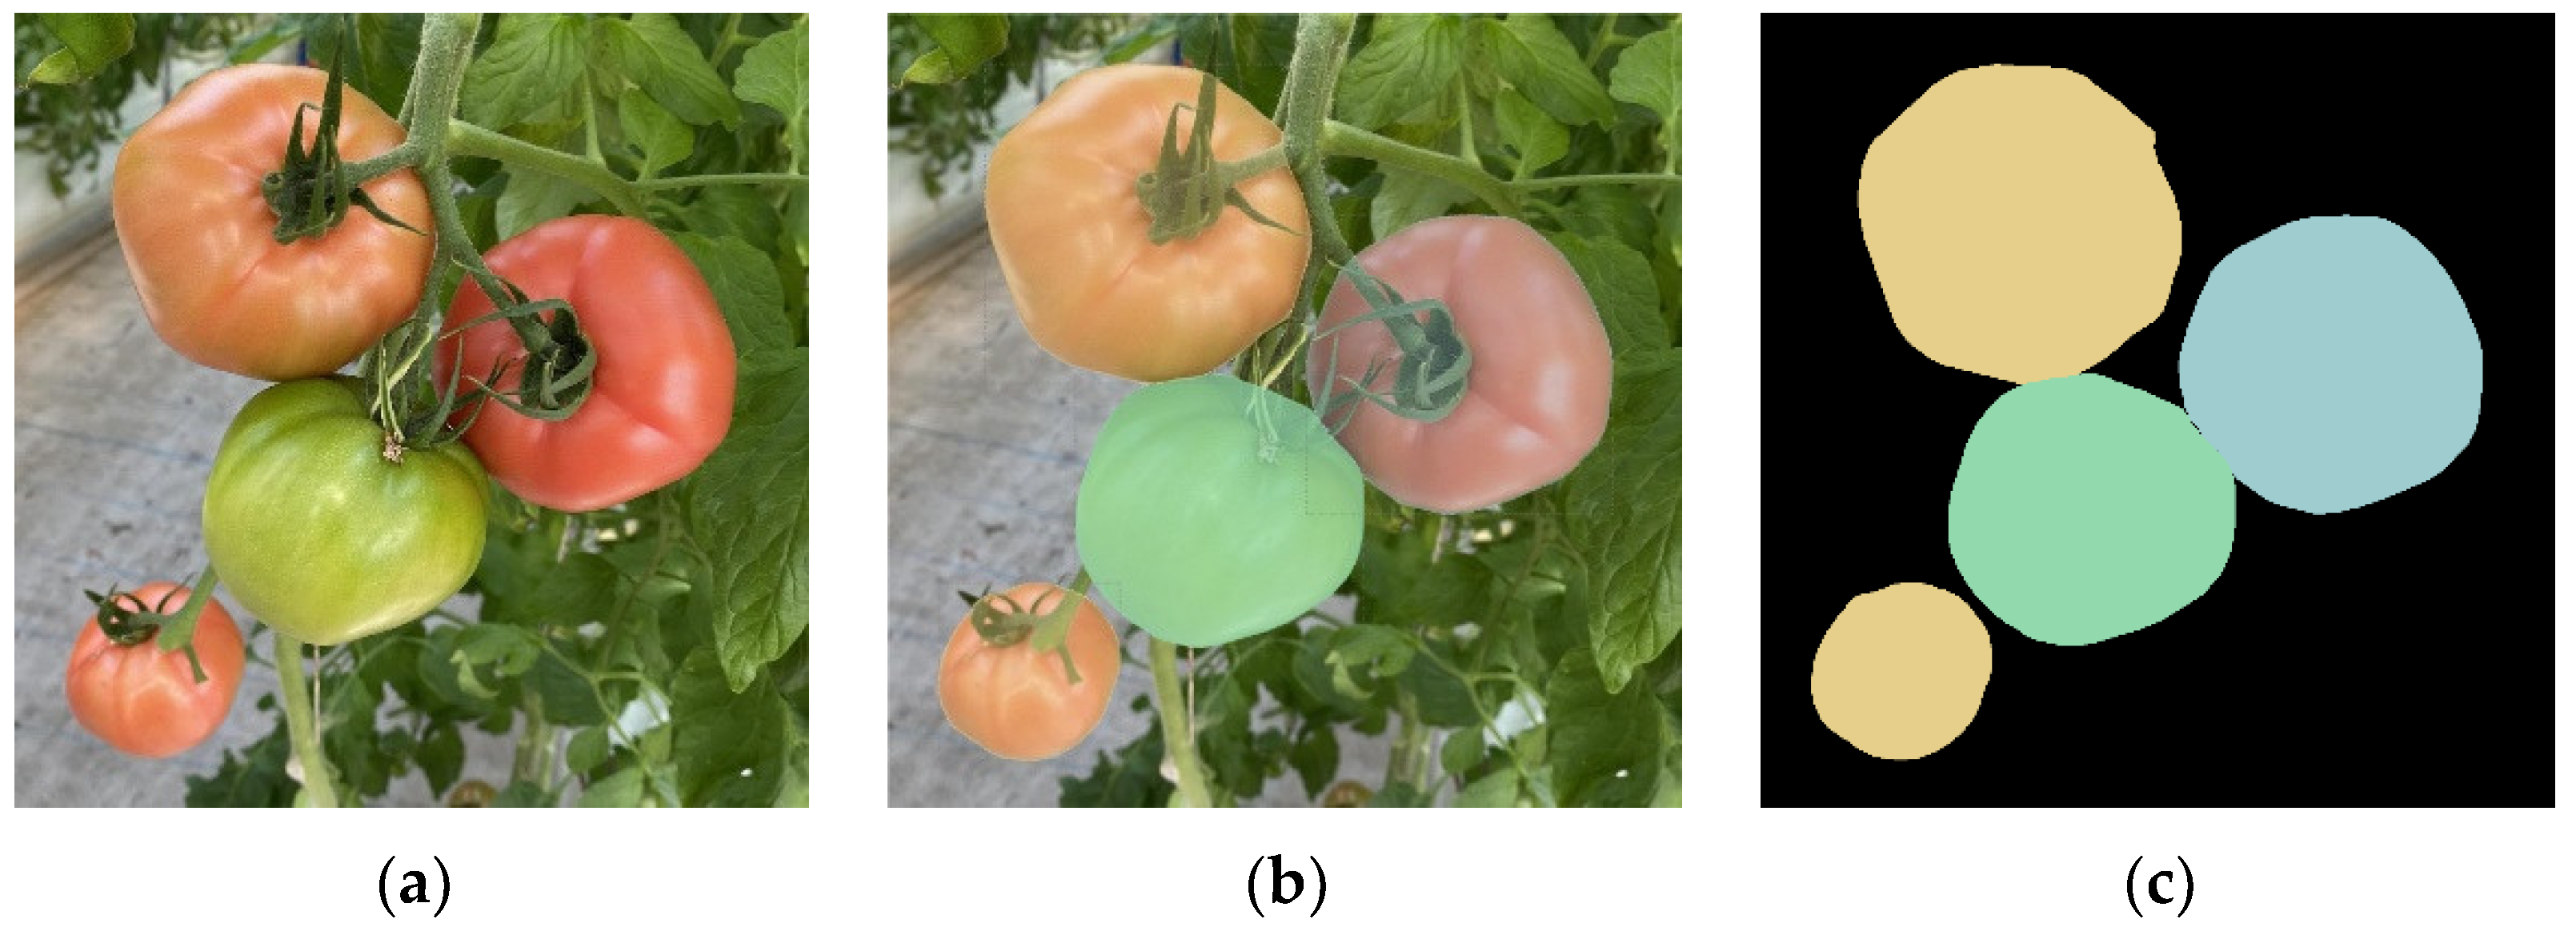
2.1. Dataset Sample Composition and Creation

The tomato dataset images consist of two main parts, as shown in Figure 1a,b: the base image data and the augmented image data. The base image data include self-collected images and supplementary images. The self-collected images were taken from a plantation in Sanhuang Town, Yongfu County, Guilin City, Guangxi Zhuang Autonomous Region, China, with the collection period in October 2023. A total of 1578 tomato images were collected for this study, with a subset captured using a mirrorless camera and the remainder acquired using an Intel RealSense D455 device. All images were uniformly resized to 1920 × 1080 resolution in JPG format, with synchronized depth maps provided for fruit dimension analysis. The image acquisition protocol employed multi-angle, non-fixed shooting methods, with the collected image data encompassing diverse complex scenarios including single-fruit, multi-fruit, occluded, and wide-field-of-view conditions.
Image acquisition was systematically conducted during both daytime (including sunny, cloudy, and rainy conditions) and nighttime with supplemental lighting to comprehensively cover natural and artificial illumination scenarios. This dual-phase approach ensures robust model performance under varying light intensities, critical for 24/7 harvesting operations. Following the methodology of Li et al. (2024), who demonstrated the effectiveness of mixed lighting datasets for pitaya fruit detection [21], we further augmented the dataset with flipped, brightness-adjusted, and cropped-spliced images. This enhances the model’s adaptability to diverse tomato varieties and complex field conditions (e.g., occlusions, uneven lighting), while maintaining high precision in detection tasks. The supplementary data were sourced from the publicly available Labor_tomato_big dataset [22], comprising 442 images with an original resolution of 3024 × 4032. Following the data selection criteria and standards established for this study, all 442 images met the requirements and were uniformly resized to 1920 × 1080 resolution. According to the research by Wang et al. [23], fruits in natural environments are often obstructed by branches and leaves, which can impact instance segmentation accuracy. Therefore, the dataset was constructed by incorporating images that include occluded scenarios. To enhance the generalization capability of the network and prevent overfitting, this study employs data augmentation techniques to expand a subset of the images. The augmentation of tomato images is performed using two distinct approaches: traditional augmentation methods and deep learning-based augmentation methods [24]. Traditional augmentation primarily involves rotation, Gaussian noise, contrast enhancement, brightness variation, motion blur, fog, and Mosaic data augmentation techniques. The specific effects are shown in the augmented images in Figure 1b. Through the aforementioned processing pipeline, we ultimately established the Tomato-Seg dataset comprising a total of 2220 images. The dataset composition includes 1578 self-collected images, 442 supplementary images from the public Labor_tomato_big dataset, and 200 augmented images. Following an 8:1:1 ratio partitioning scheme, the dataset was divided into 1776 images for training, 222 for validation, and 222 for testing.
The dataset in this study adheres to the COCO 2017 format. For classification, the harvest color standards and widely accepted market classification methods were adopted. Based on the surface color characteristics indicative of tomato ripeness, the tomatoes were initially categorized into three groups: fully ripened, half ripened, and green. Subsequently, in accordance with the Chinese National Standard NY/T 940-2006 and the international standard CODEX STAN 293-2008, ripe tomatoes were further classified into premium (S), first grade (A), and second grade (B) quality levels. The tomato regions in the images were manually annotated using polygonal labels with the coco-annotator software, generating JSON files in the COCO format. Representative examples of annotations for each tomato category are illustrated in Figure 2. During the annotation process, a comprehensive manual annotation strategy was implemented, ensuring that all visible tomatoes, including those partially occluded, were annotated. The visible portions of the tomatoes were identified and labeled based on human visual assessment.

2.2. Challenges of Mask R-CNN for Tomato Instance Segmentation in Complex Scenes

Mask R-CNN, a two-stage instance segmentation model based on Faster R-CNN, consists of ResNet50 (backbone), RPN, bounding box regression, classification, and mask prediction networks. However, deeper layers increase computational costs, especially for high-resolution, dense targets (e.g., tomatoes), reducing real-time performance and edge segmentation accuracy. Due to insufficient fusion of features at different scales during the feature extraction stage [25], accurate segmentation of occluded areas is often challenging, with missed detections being a common issue [26,27].
Additionally, in terms of loss function design, Mask R-CNN uses a multi-task loss function, including classification loss, bounding box regression loss, and pixel-level mask loss. Under conditions of class imbalance [28], severe target occlusion, and complex backgrounds [29], the weight distribution between the classification and instance segmentation tasks, especially across different sample categories, is unbalanced, affecting overall instance segmentation performance. Furthermore, since the mask loss is only applied to candidate regions, the network lacks global information support when processing edge pixels, leading to reduced instance segmentation accuracy, particularly in complex backgrounds where edge details are weak [30,31]. These potential issues impact the instance segmentation capability of Mask R-CNN in complex scenarios. These limitations collectively degrade instance segmentation accuracy by 12–15% in real-world greenhouse environments compared to controlled conditions [32], highlighting the need for architecture improvements specific to agricultural applications.
Tomatoes of different grades vary significantly in market value, demand, and classification standards. Traditional manual sorting (often repeated) ensures accuracy but is inefficient and costly [33]. An automated multi-feature grading system is needed to improve efficiency, reduce labor costs, and enhance grading consistency.

2.3. Network Design

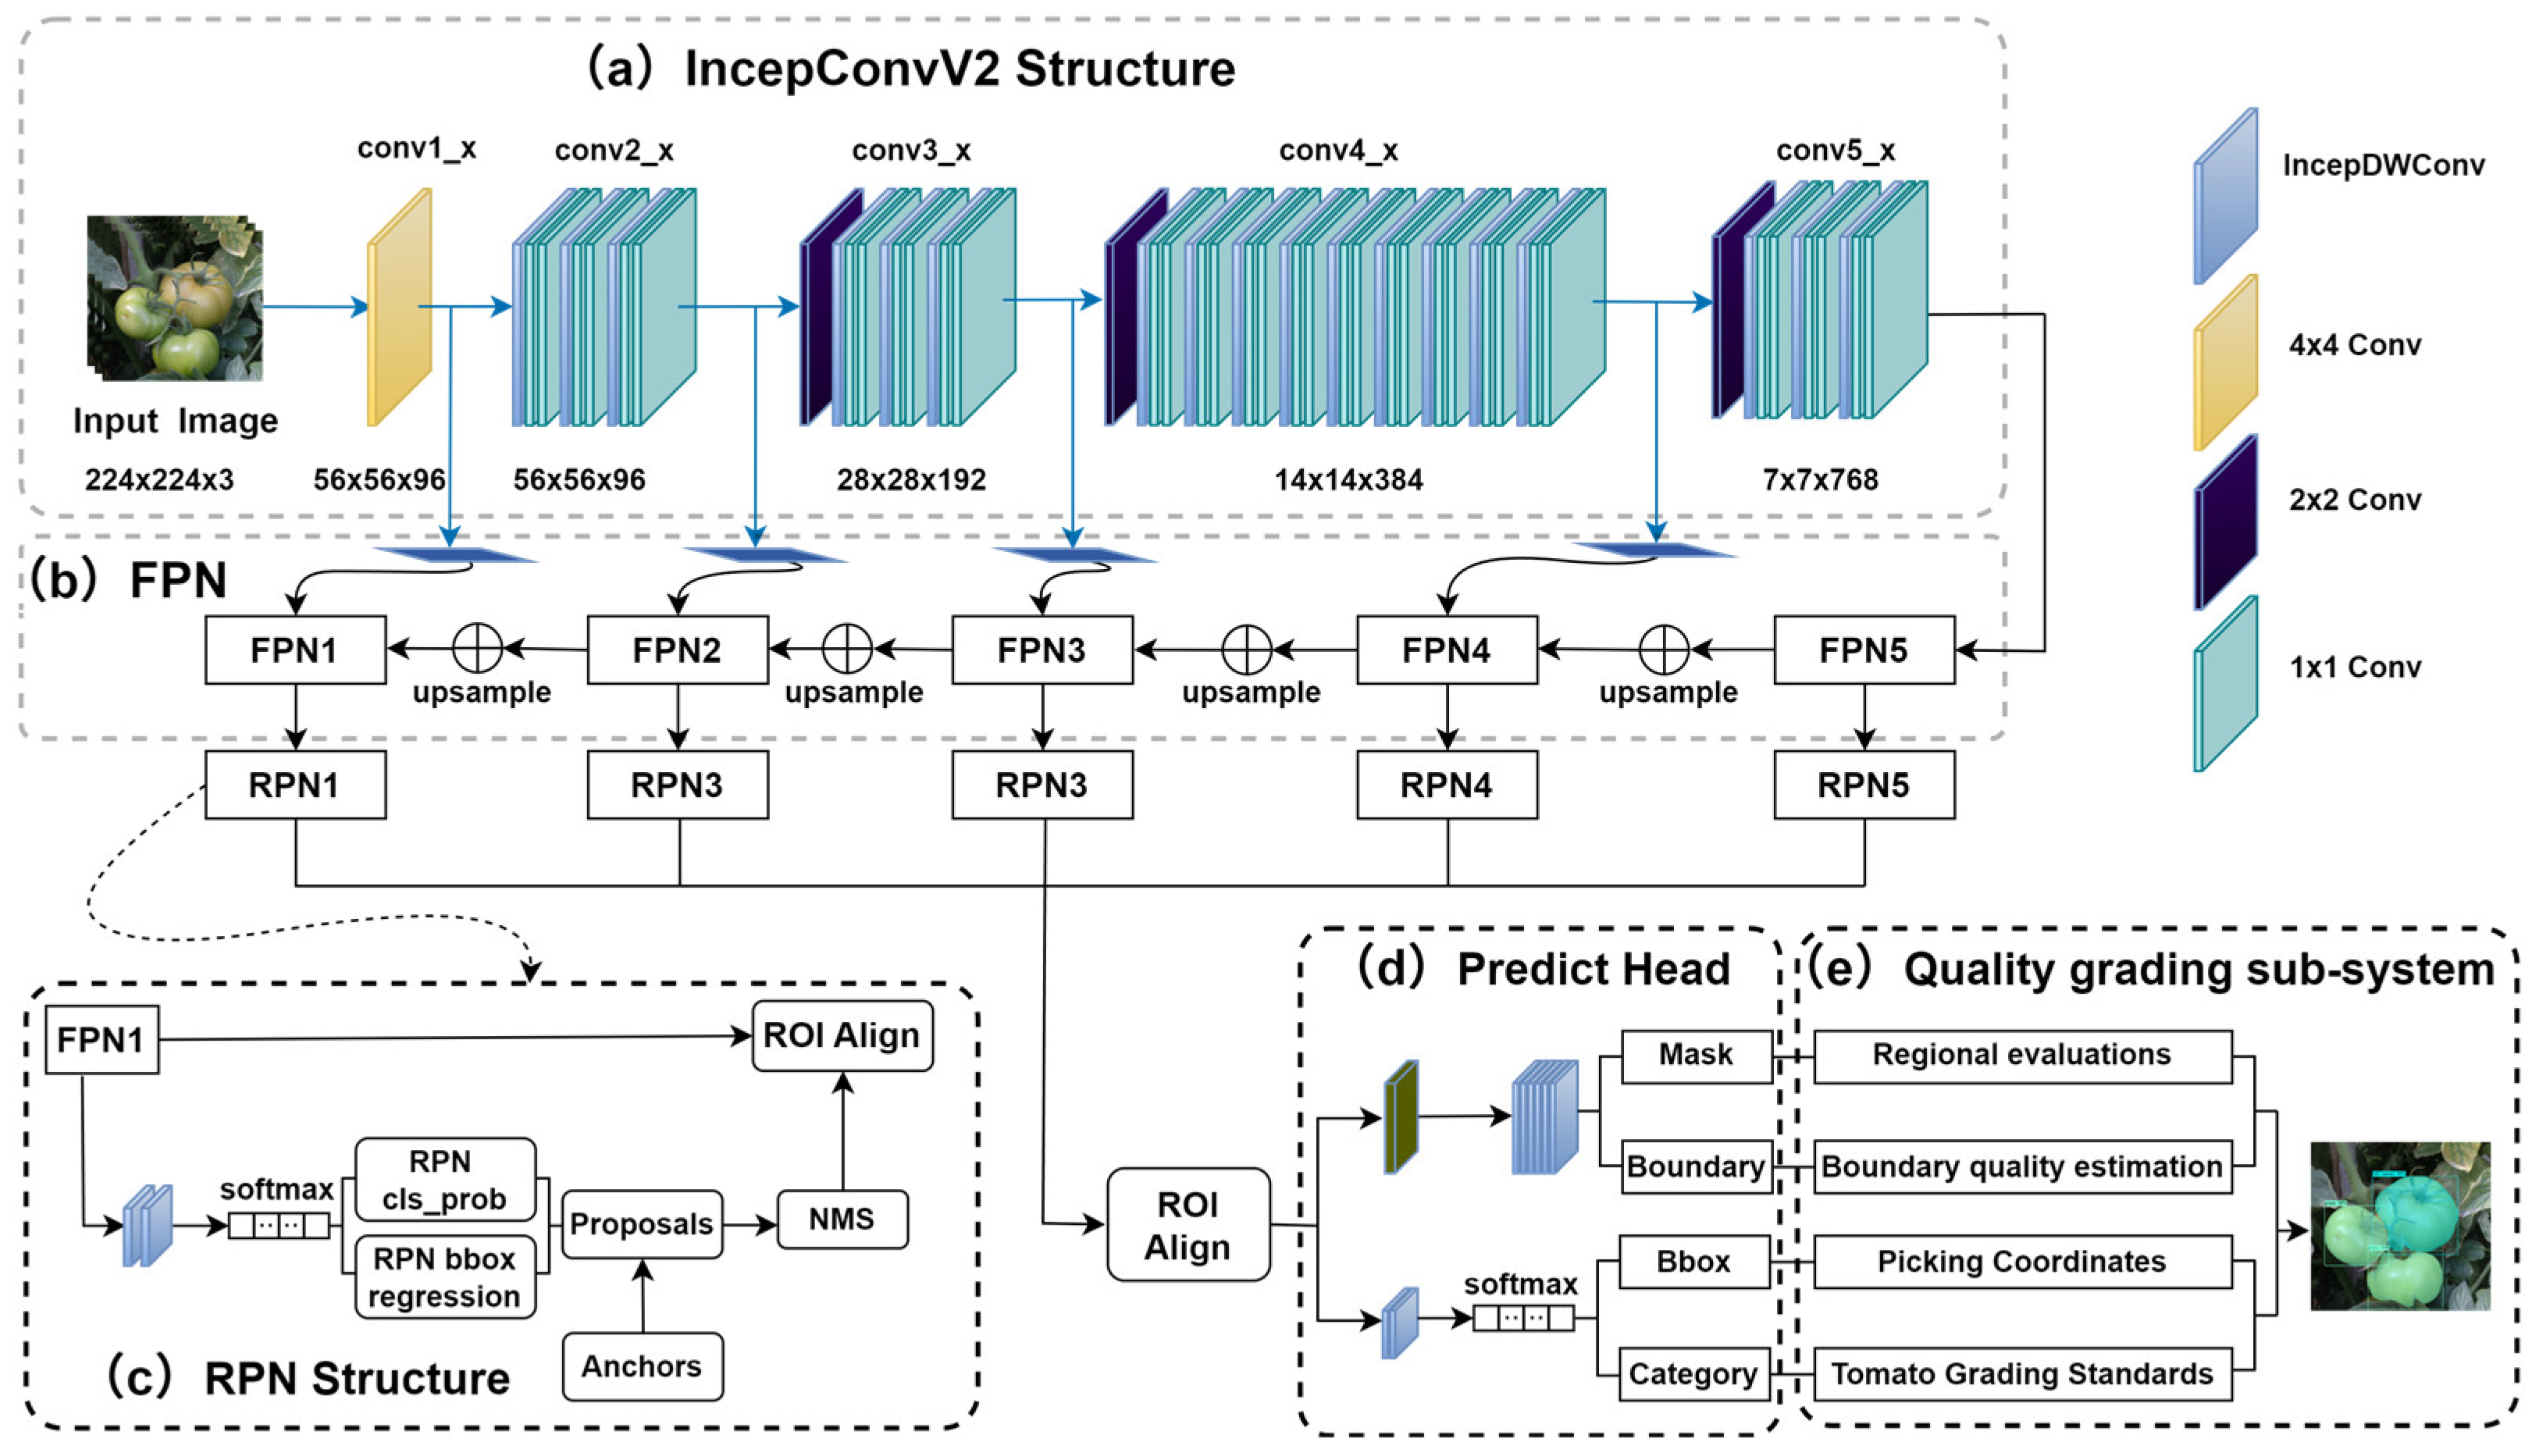
2.3.1. TQVGModel Overall Structure

To address the challenges in tomato grading instance segmentation using the Mask R-CNN network, particularly those arising from dense growth, fruit occlusion, and varying field conditions, this study proposes a novel, high-precision, and efficient tomato quality visual grading instance segmentation network, termed TQVGModel (Tomato Quality Visual Grading Model). The detailed architecture of TQVGModel is illustrated in Figure 3. It comprises five main components: (a) the IncepConvV2 backbone network, (b) the FPN (feature pyramid network), (c) the RPN (region proposal network), (d) the predict head branch, and (e) the quality grading subsystem.
TQVGModel combines an IncepConvV2-FPN backbone with FCMAE-based self-supervised mask training for robust feature extraction, balancing speed and accuracy. The FCMAE strategy enhances occlusion handling, while the class-balanced focal loss in the predict head prioritizes sparse and complex samples, improving segmentation accuracy and reducing missed detections.
To improve TQVGModel performance for tomato edge segmentation in complex scenarios, we integrate the E-Sobel operator into the predict head, adding a dedicated boundary prediction branch. By integrating a loss function guidance mechanism, this approach enables the network to prioritize edge features, thereby improving edge segmentation accuracy in challenging conditions.
For the tomato quality grading task, the visual grading subsystem developed in this study integrates ripeness category information, fruit edge information, and mask region information to generate quality grading results for ripe tomatoes. This subsystem provides a foundation for automated grading and harvesting, contributing to the advancement of precision agricultural management.

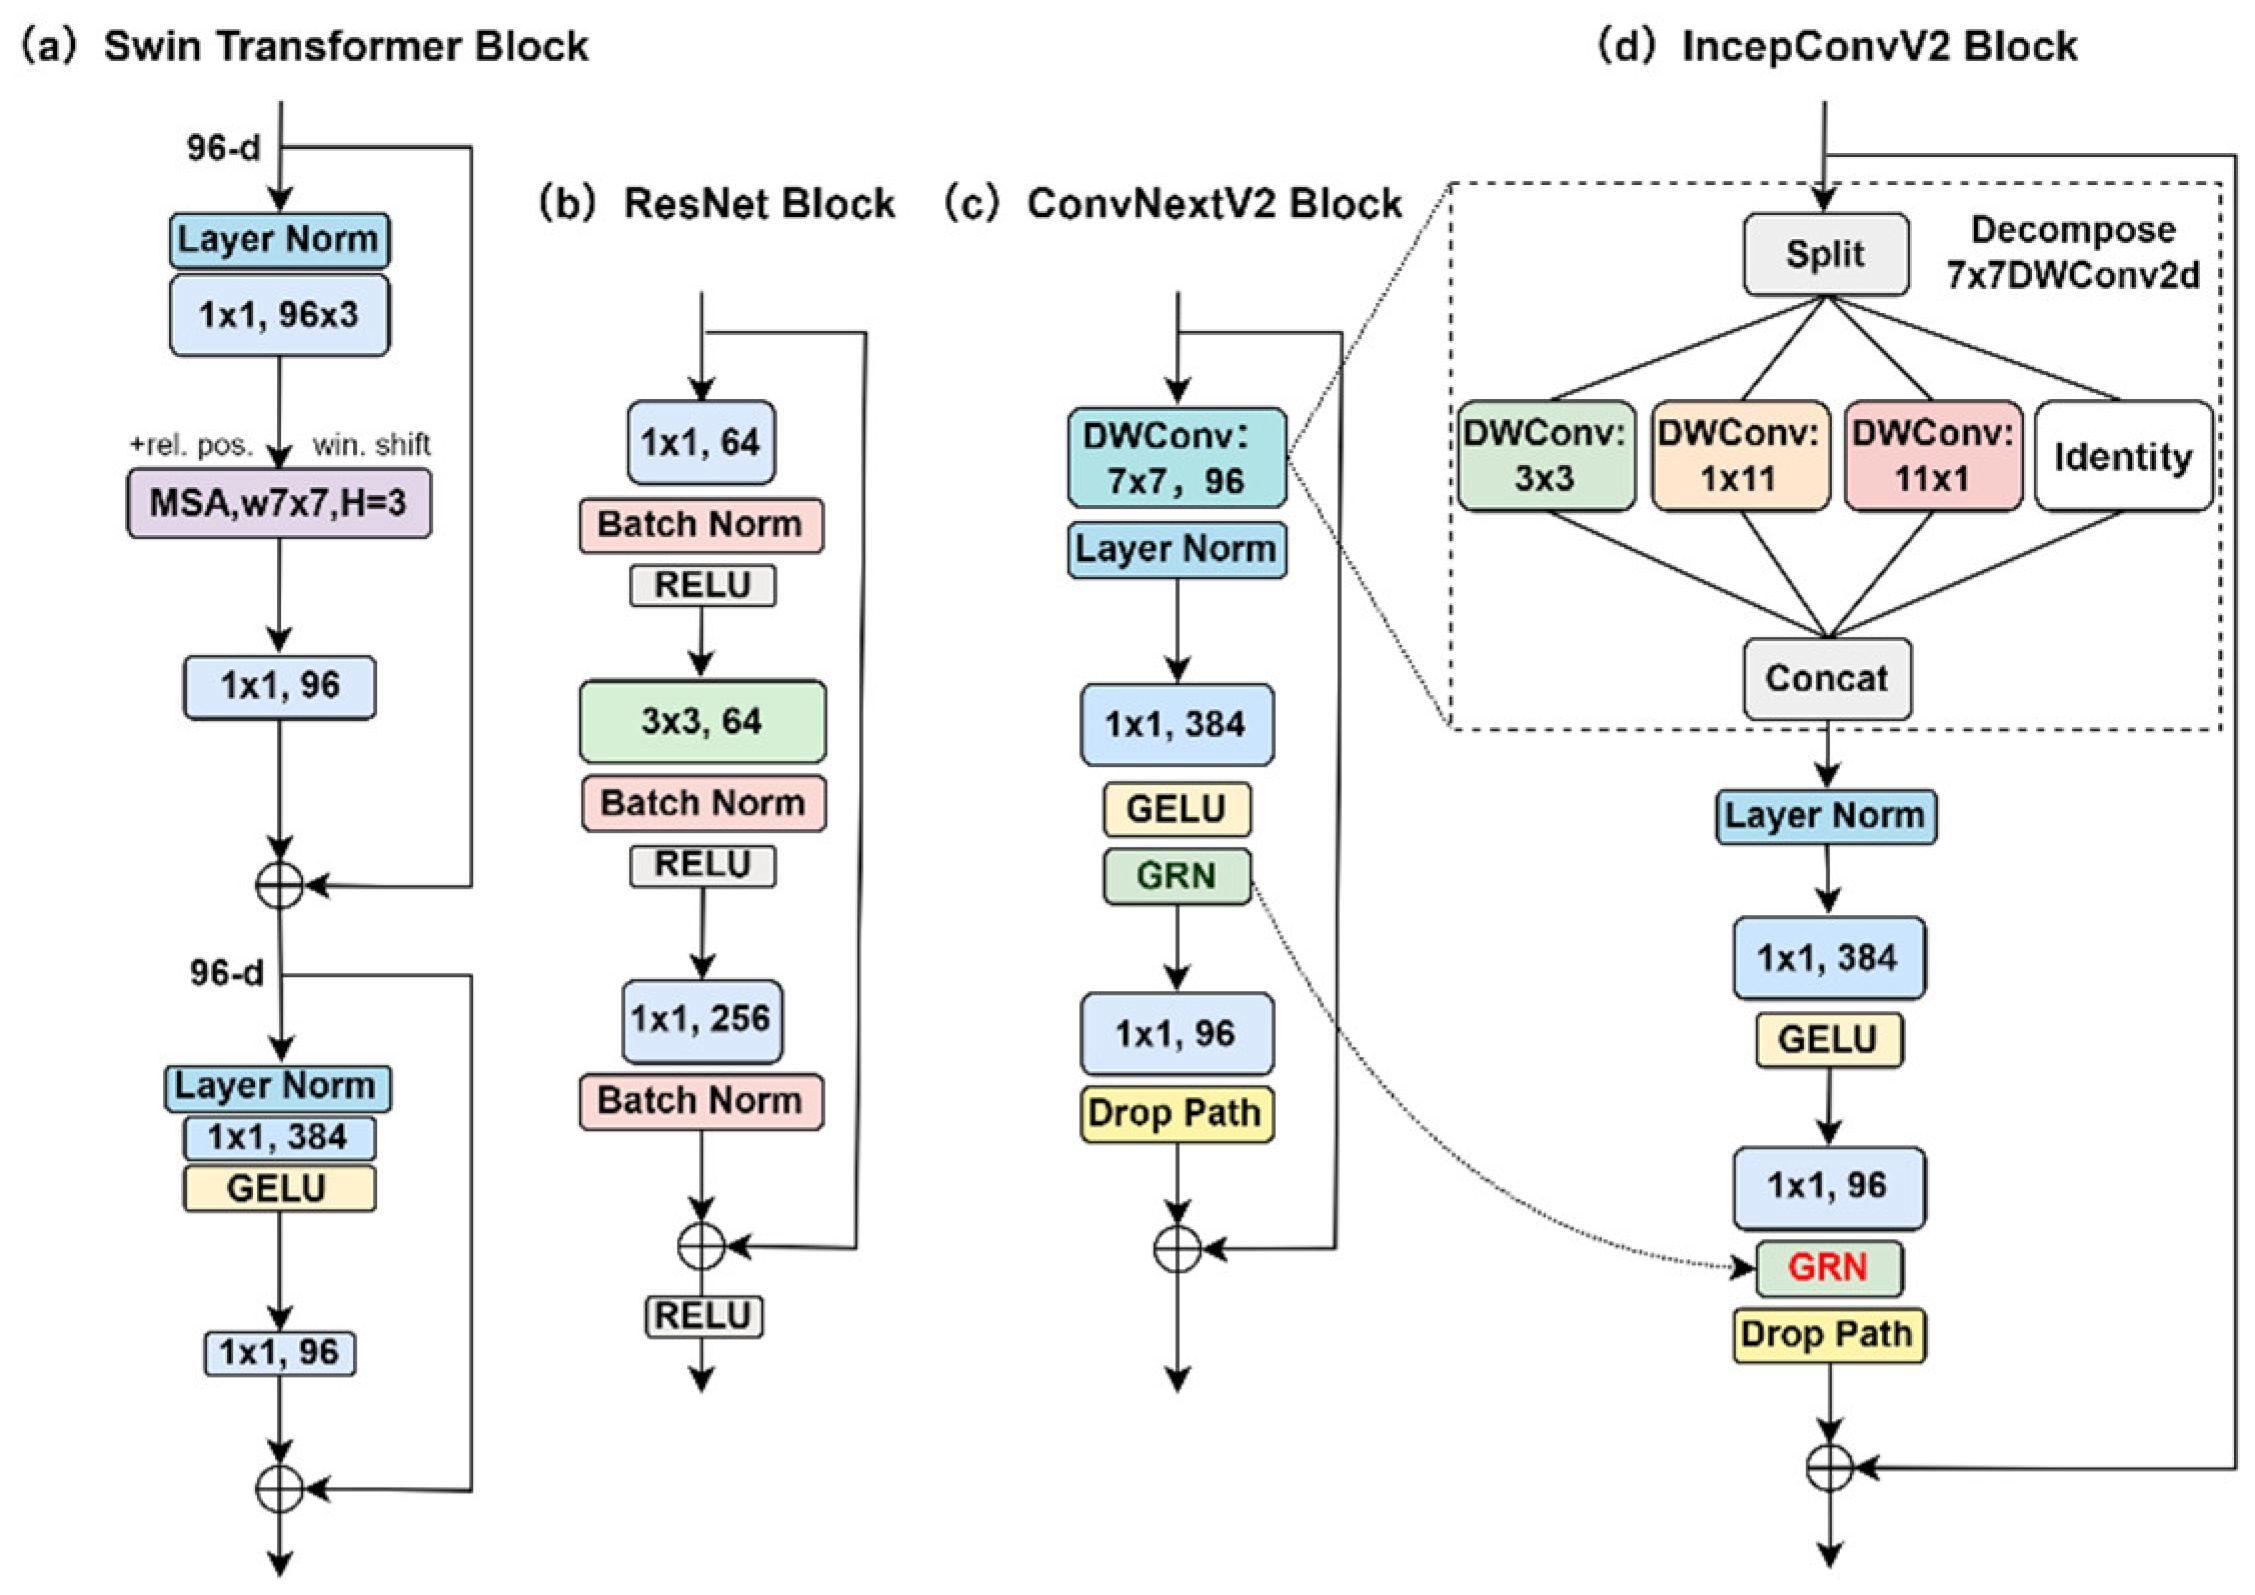
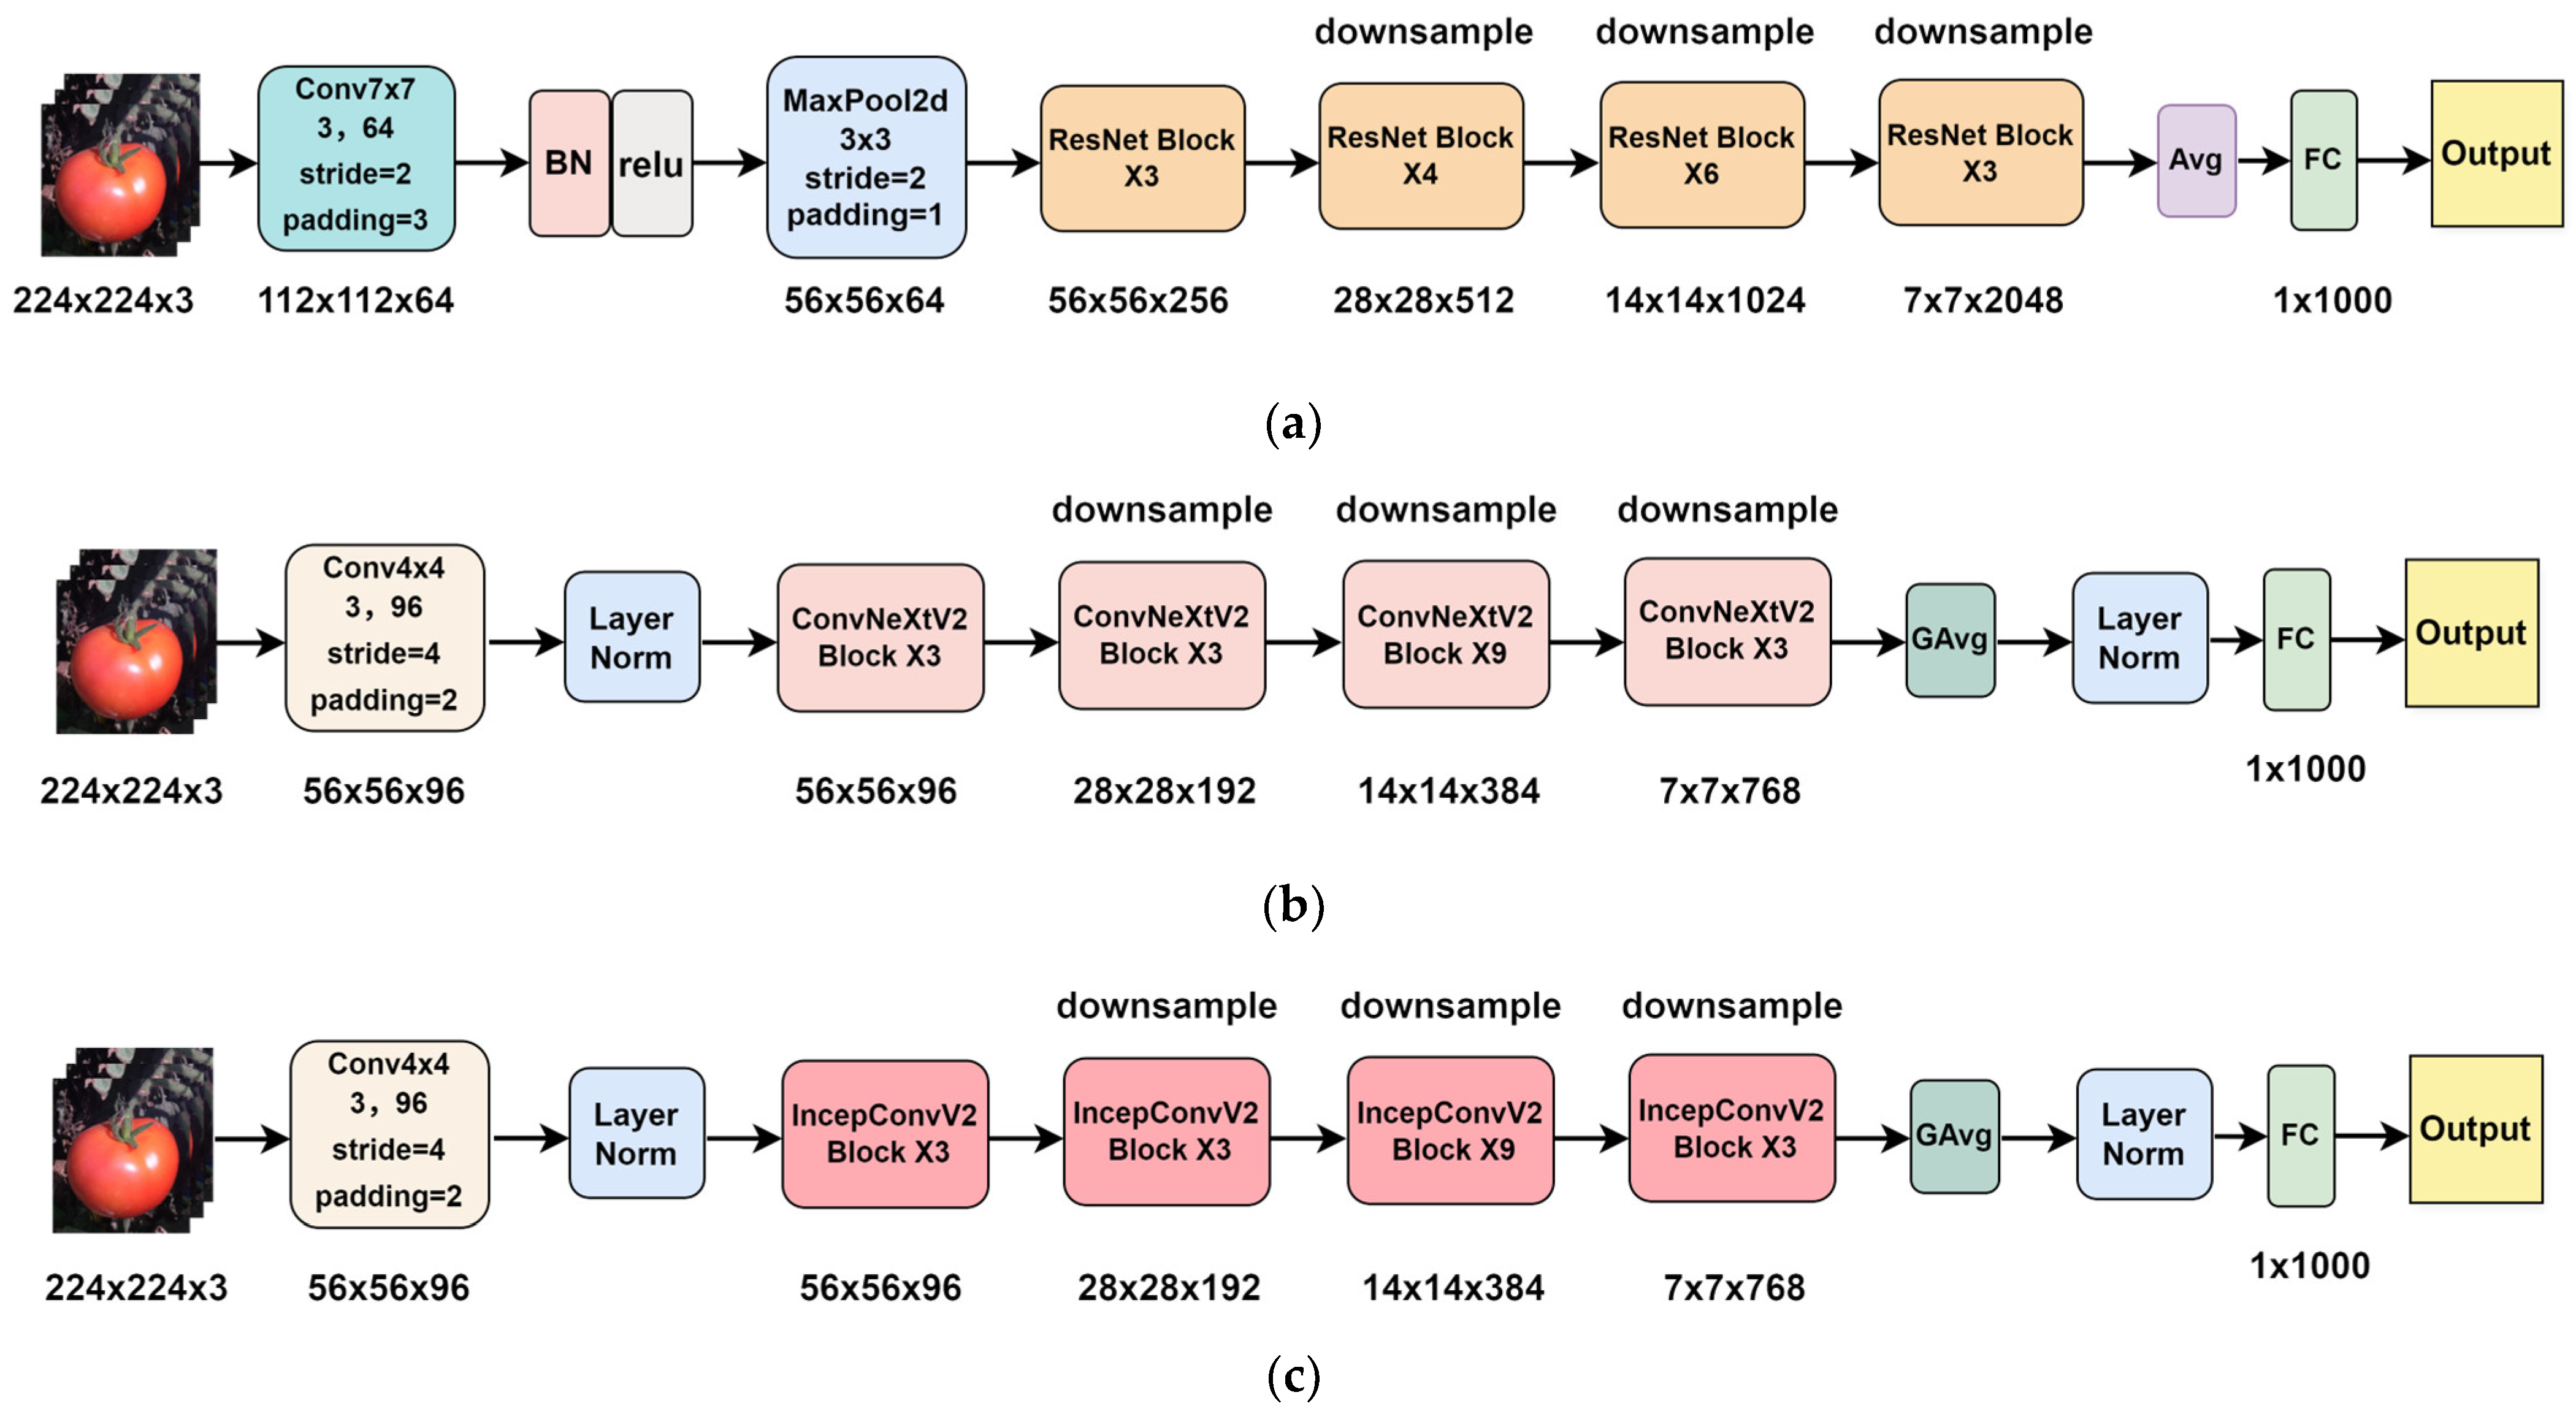
2.3.2. IncepConvV2 Network Structure

ResNet [34] uses residual blocks and skip connections to solve gradient vanishing in deep networks. However, its feature extraction and computational efficiency are increasingly insufficient for modern needs, especially in resource-limited tomato harvesting robots requiring both high accuracy and real-time performance.
To address these challenges, ConvNeXt introduces a series of modern improvements to enhance the performance of the ResNet architecture [35]. The ConvNeXt block adopts a Transformer-inspired design with 7 × 7 convolution kernels (vs. ResNet’s 3 × 3) for better tomato feature extraction. It uses depth-wise separable convolutions to reduce computation, replaces BN with LayerNorm, and employs GELU activation for enhanced nonlinearity and training stability.
Woo et al. [36] proposed ConvNeXtV2 (Figure 4c), enhancing ConvNeXt with MAE self-supervised learning, GRN, and removing LayerScale to boost feature extraction. While improving TQVGModel’s accuracy, these upgrades increase computational complexity and parameters, challenging real-time deployment on resource-limited devices.
To address the challenges posed by ConvNeXt-series feature extraction networks in resource-constrained environments—where the visual systems of tomato grading and harvesting robots require real-time performance and efficient device deployment—while retaining the accuracy advantages of ConvNeXtV2, this study incorporates the concepts of large-kernel decomposition and multi-branch reconstruction proposed by InceptionNeXt [37]. The 7 × 7 depth-wise convolution kernels (depth-wise convolution) in ConvNeXtV2 are decomposed into multiple smaller convolution kernels, forming a new feature extraction network named IncepConvV2. As illustrated in Figure 4d (IncepConvV2 Block), the 7 × 7 large kernel is decomposed into four parallel branches: a small square convolution kernel (e.g., 3 × 3), two orthogonal strip-shaped convolution kernels (e.g., 1 × 7 and 7 × 1), and identity mapping. This decomposition strategy significantly reduces computational overhead in harvesting scenarios while preserving the feature extraction accuracy of ConvNeXtV2. By applying large-kernel decomposition to optimize feature extraction, IncepConvV2 achieves substantial memory access reduction for agricultural robot vision systems. This advancement improves edge-device operational efficiency while boosting the overall training and inference performance of TQVGModel.
We found placing GRN in early layers impaired nonlinear feature extraction. In IncepConvV2, we moved GRN to the final output layer (Figure 4d), normalizing only the module’s output feature map. This preserves feature consistency while minimizing information loss, improving extraction stability.
Based on the above analysis, integrating IncepConvV2 into TQVGModel effectively addresses the challenge of balancing accuracy and real-time performance in the visual systems of tomato grading and harvesting robots under constrained computational resources. Furthermore, IncepConvV2 provides eight distinct versions with varying sizes to accommodate the requirements of different scenarios. With additional stacked layers, the network achieves stronger capabilities in feature extraction and nonlinear representation. For example, as illustrated in Figure 5c, IncepConvV2-Tiny employs a depth structure of (3, 3, 9, 3).
This adaptability enables IncepConvV2 to accommodate a wide spectrum of requirements, ranging from lightweight devices (e.g., embedded systems) in practical tomato harvesting scenarios to high-performance computing environments in smart agriculture cloud systems. As shown in Table 1, the IncepConvV2 series establishes a comprehensive computational efficiency hierarchy through eight variants with parameter scales spanning from 3.7 M (Atto version) to 650 M (Huge version). Specifically, the Atto and other compact versions are designed for mobile harvesting robots, featuring minimal computational resource demands, whereas the Large and Huge variants are optimized for cloud-based multi-task analysis—supporting simultaneous visual tasks such as pest/disease detection, maturity classification, and yield prediction while maintaining marginal accuracy loss. The inherent modular architecture design ensures efficient computational resource utilization, allowing dynamic adaptation to diverse scenarios and tasks through configurable kernel combinations and channel compression ratios.

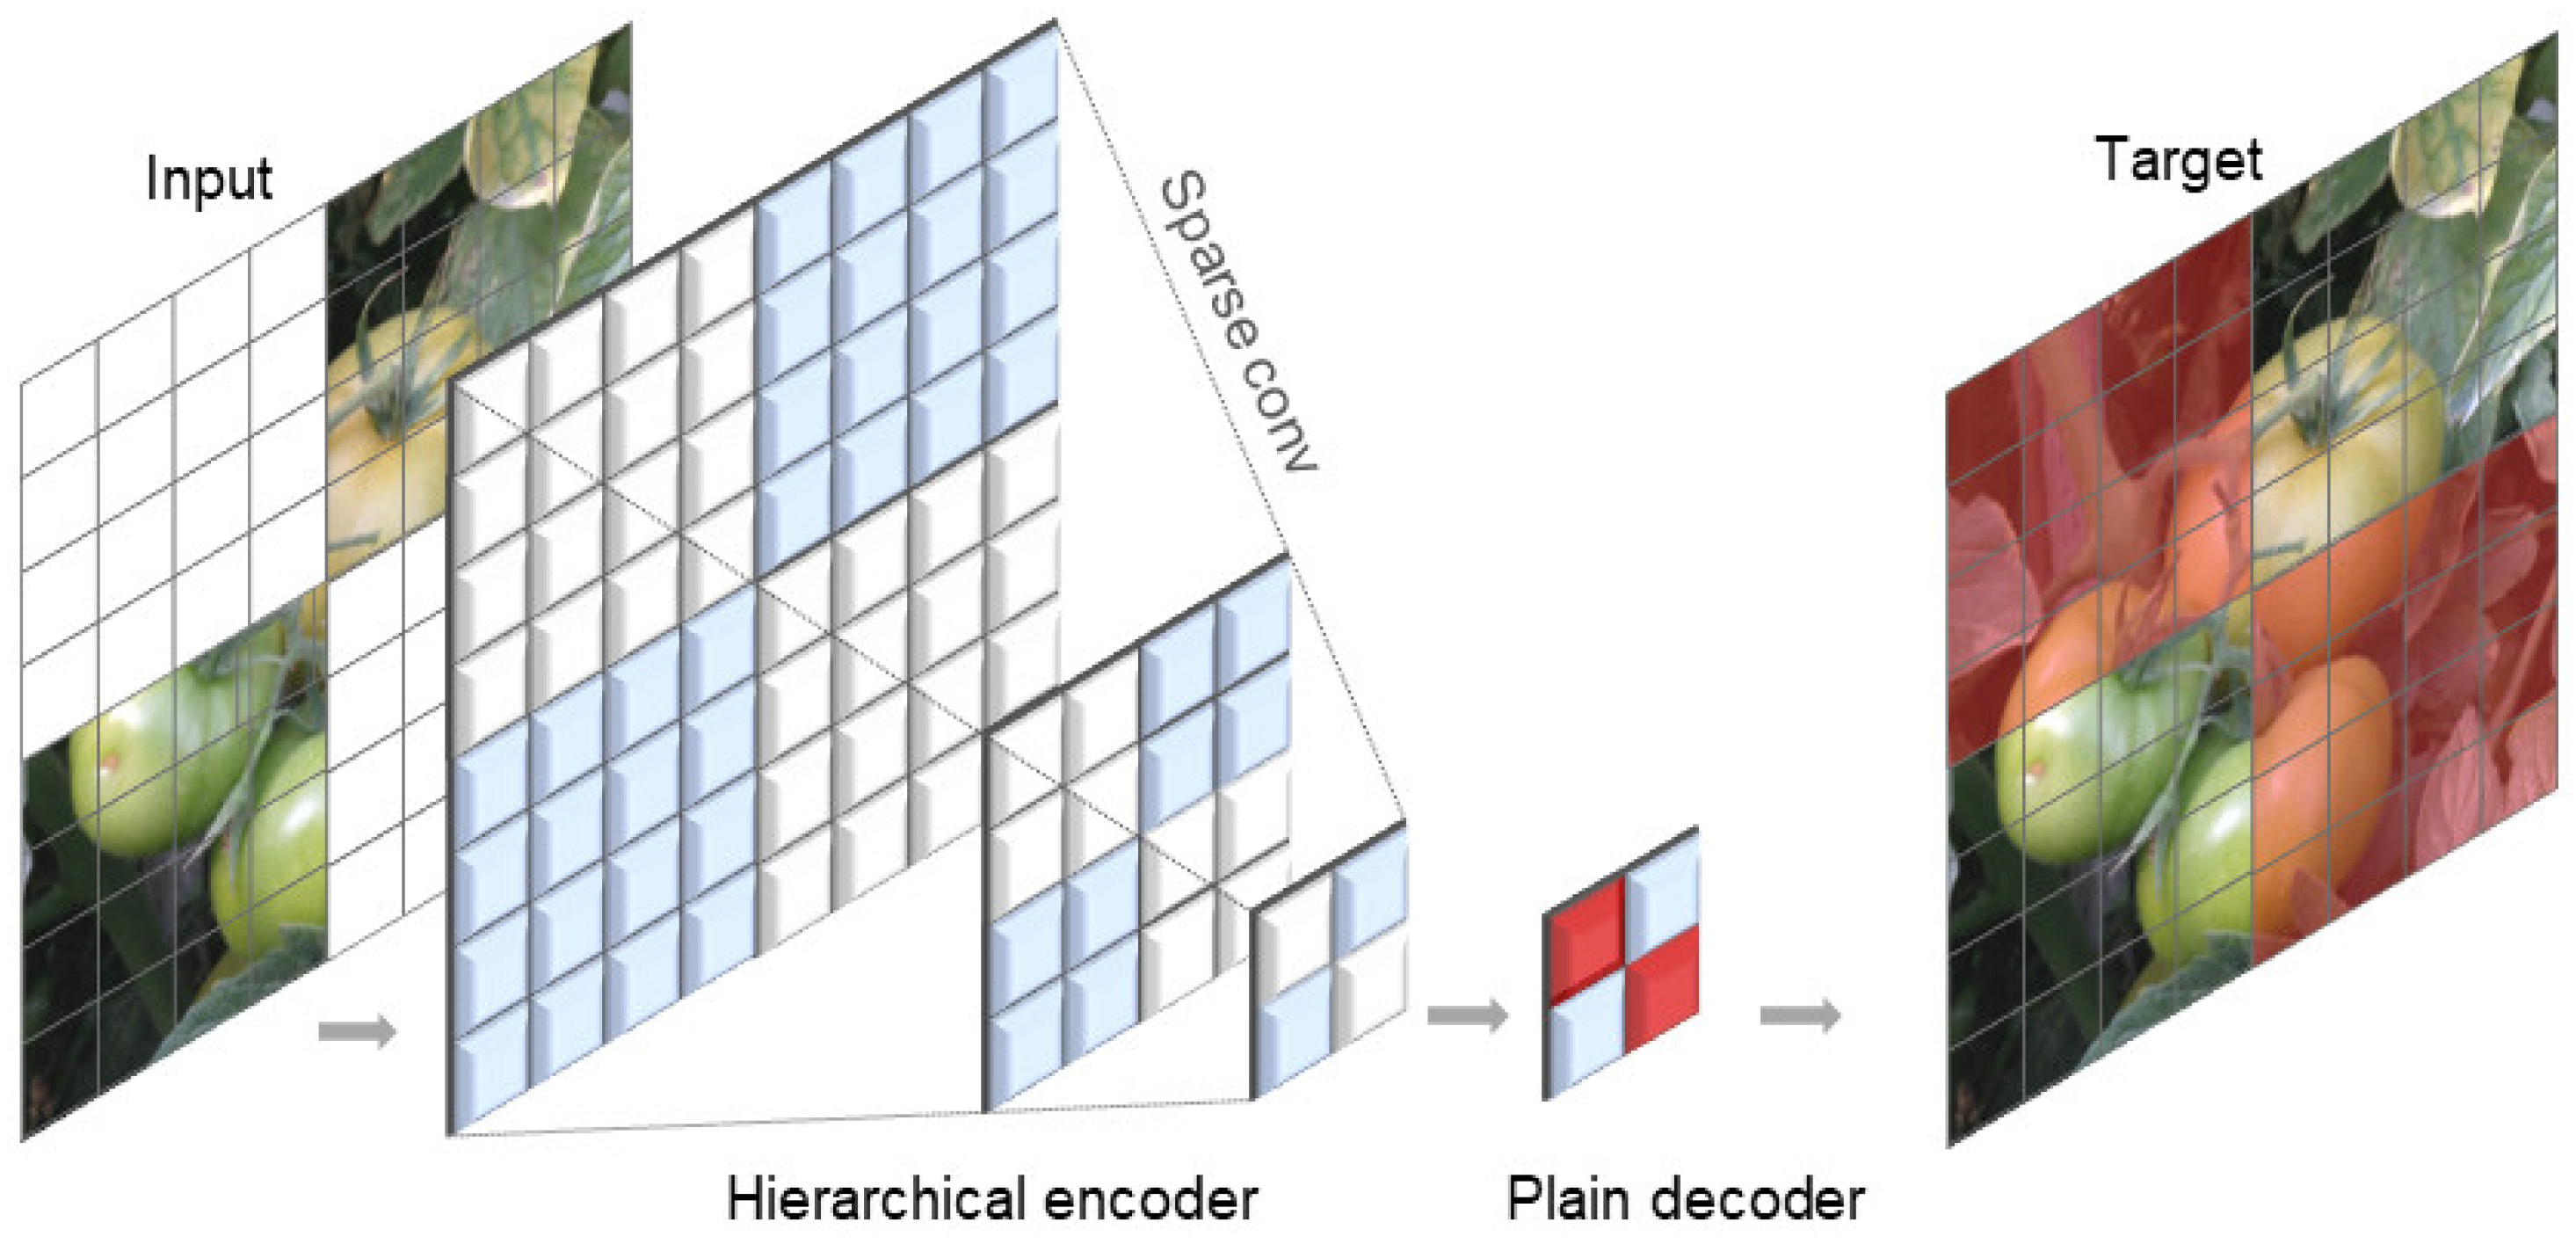
2.3.3. FCMAE Structure

In automated tomato harvesting, occlusion from leaves and self-occlusion among fruits significantly challenge robotic vision systems. Inspired by the masked autoencoding strategy in NLP (e.g., BERT/GPT), where models predict masked content to improve textual comprehension, we adapt this approach to enhance occlusion handling in vision systems. Masked Autoencoders (MAEs)—general-purpose denoising autoencoders in computer vision—randomly mask image regions during training, forcing the network to reconstruct missing areas. This method strengthens feature extraction (via the encoder) and image reconstruction (via the decoder), improving robustness in heavily occluded harvesting scenarios [38].
As illustrated in Figure 6, during the image masking phase for tomato scene inputs, 50% of the image is randomly masked, and hierarchical convolutional designs are utilized for feature downsampling at different stages. In the feature extraction phase, the IncepConvV2 network serves as the encoder. In the image reconstruction phase, a lightweight IncepConvV2 module acts as the decoder to reconstruct the tomato scene images and compute the loss for the masked regions. This process strengthens feature learning in the network while improving performance for occluded scene recognition.

2.3.4. Network Loss Function

During network training, a certain level of uncertainty and error typically exists between predicted values and ground truth values. The role of the loss function is to iteratively minimize this error, ensuring that the predicted values converge as closely as possible to the ground truth. In the Mask R-CNN network, the loss function comprises three components, as expressed in Equation (1) [39]: Classification Loss, Bounding Box Regression Loss, and Mask Loss. The Classification Loss evaluates the discrepancy between predicted and ground truth classes, typically employing Cross-Entropy Loss. The Bounding Box Regression Loss quantifies the difference between predicted and ground truth bounding boxes, utilizing the Smooth L1 Loss, as defined in Equations (5) and (6) [13]. The Mask Loss assesses the divergence between the predicted binary mask and the ground truth mask, employing Binary Cross-Entropy Loss.
In this study, the proposed TQVGModel addresses the class imbalance problem common in agricultural datasets by replacing the standard Cross-Entropy Loss in the classification module with Class-Balanced Focal Loss (CBFL, Equation (2) [20]). The rationale for this replacement is threefold: (1) Standard Cross-Entropy Loss treats all samples equally, leading to bias towards dominant classes; (2) CBFL introduces a weighting factor (1 − β)/(1 − βn) that reduces the impact of frequent classes while increasing the weight of rare classes; (3) it incorporates a focusing parameter γ that down-weights easy-to-classify samples, allowing the model to concentrate on hard samples during training.
Additionally, Edge Loss (Equation (7)) [40] is introduced on top of the original loss functions of Mask R-CNN. The combined effect of these modifications significantly improves performance in complex tomato harvesting scenarios: the Class-Balanced Focal Loss places greater emphasis on sparse tomato sample categories and assigns higher weights to samples that are difficult to segment, while the Edge Loss enhances boundary accuracy. This dual approach reduces the missed detection rate and improves instance segmentation accuracy, particularly for occluded and immature tomatoes that are typically underrepresented in training datasets [20]. The corresponding formulas are as follows:
L o s s t o t a l = L c l s b + L b b o x + L m a s k + α L e d g e
L c l s b = C B ( n t ) α t ( 1 p t ) γ log ( p t )
C B ( n t ) = 1 β 1 β n t
α t = 1 n t
where C B ( n t ) : class balancing factor based on the effective sample size; p t : the predicted probability of the network for the true class t; α t : weight for class t; γ : adjustment factor for easy and hard-to-classify samples, ranging from 0 to 5, where a higher value indicates more attention to difficult-to-classify samples. When γ = 0, it degenerates into cross-entropy loss; β : smooth parameter for the class balancing factor, which tends to 1. In our experiments, we use 0.999; n t represents the number of samples for class t.
L b b o x = i x , y , w , h s m o o t h L 1 t i t i * )
s m o o t h L 1 ( x ) = 0.5 x 2   if x < 1 x 0.5   otherwise  
In the formula, s m o o t h L 1 represents the smooth loss function; t i  and  t i * represent the predicted bounding box parameters and the actual bounding box parameters, respectively; x, y, w, h represent the center coordinates and size of the target bounding box.
L e d g e = 1 N i = 1 N ( S o b e l M ^ i t o t a l S o b e l M i t o t a l ) 2
where L e d g e represents the edge prediction loss function; S o b e l M ^ i t o t a l   and S o b e l M i t o t a l represent the predicted and actual boundary edges, respectively; N represent the total number of pixels in the image.

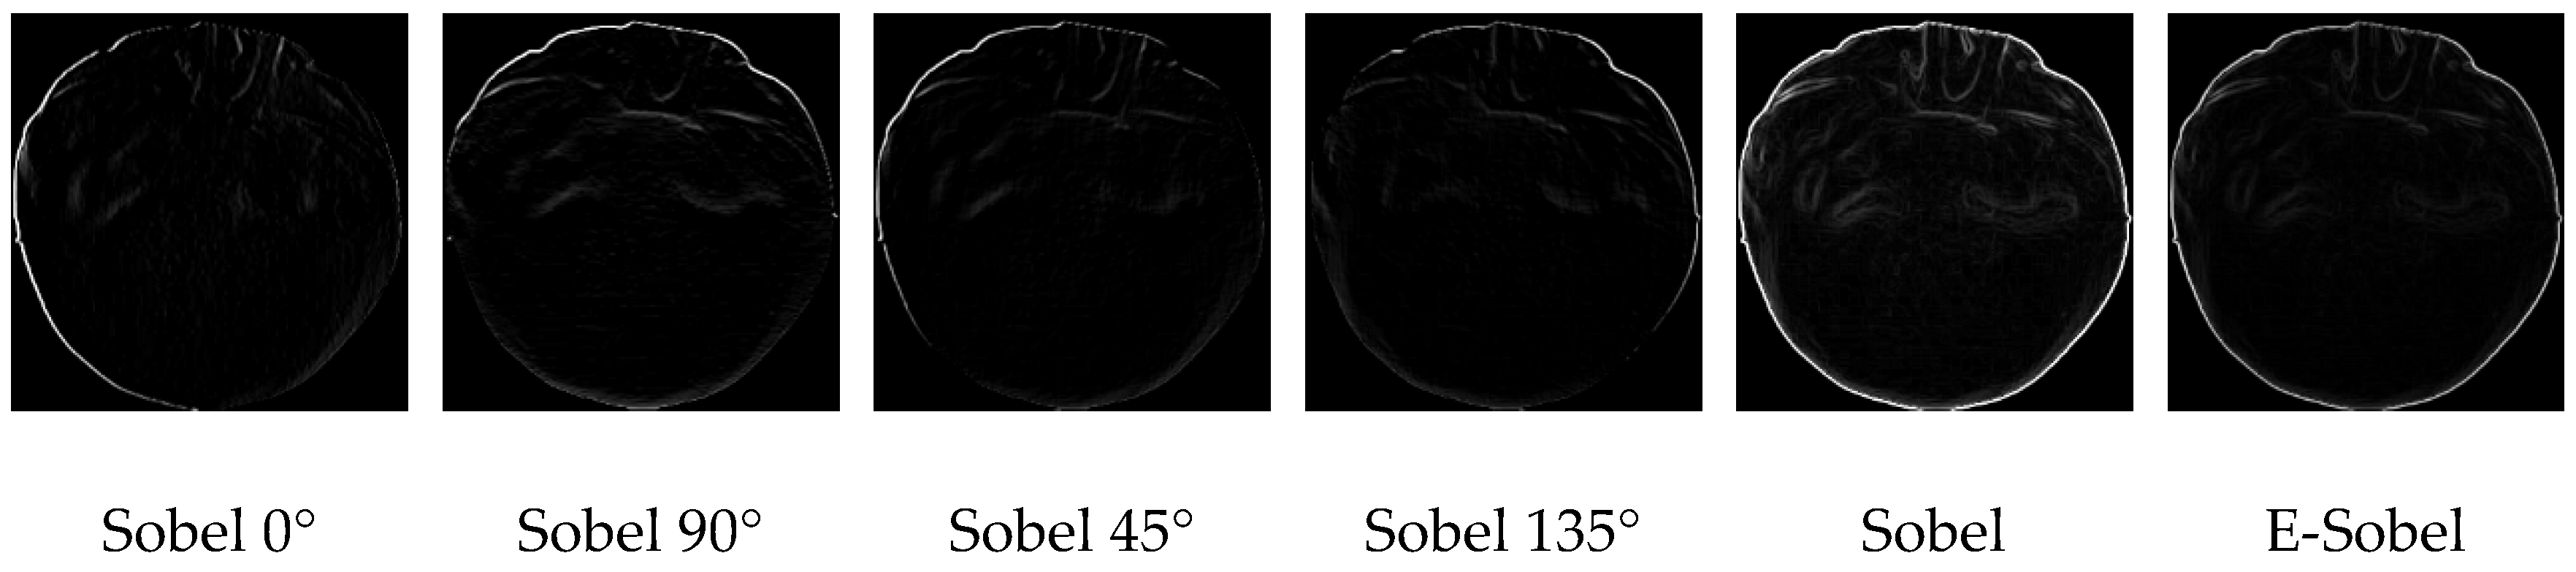
2.3.5. E-Sobel Operator

To address the issue of imprecise edge detail segmentation and localization in the visual instance segmentation process of tomato grading and harvesting robots, this study introduces the E-Sobel (Enhanced Sobel) operator and an edge loss feedback mechanism. The Sobel operator is used to extract the edges of the segmentation target, and combined with the L e d g e edge loss function (Equation (7)), the loss is calculated relative to the ground truth annotated boundaries. This loss value guides the network to focus on edge information, thereby improving network accuracy.
The traditional Sobel operator is a classic edge detection algorithm that uses two 3 × 3 convolution kernels, as shown in Equations (8) and (9) [40], to calculate horizontal and vertical gradients, respectively. However, the Sobel operator relies solely on gradient information in two directions, making it relatively weak in handling image noise interference, which leads to the loss of details, as illustrated in Figure 7.
To address this limitation, the E-Sobel operator extends the traditional Sobel operator by adding gradient calculations in the 45° and 135° directions, as shown in Equations (10) and (11) [40]. This improvement enables the E-Sobel operator to more accurately capture the edge information of tomatoes in the scene and perform better in noise suppression. It significantly enhances the accuracy, robustness, and noise resistance of edge segmentation.
This study introduces an edge loss mechanism in the mask branch [41]. First, the labeled image is converted into a binary segmentation map of the crop, i.e., the target mask. The predicted mask output from the mask branch and the target mask are then used as inputs and convolved with the E-Sobel operator to extract edge information [42], as shown in Equation (12). The mean squared error of the convolution results is computed to obtain the edge loss L e d g e , as expressed in Equation (7).
G x = 1 0 1 2 0 2 1 0 1
G y = 1 2 1 0 0 0 1 2 1
G x y = 0 1 2 1 0 1 2 1 0
G y x = 2 1 0 1 0 1 0 1 2
S o b e l ( M ) t o t a l = ( M × G x ) 2 + ( M × G y ) 2 + ( M × G x y ) 2 + ( M × G y x ) 2

2.3.6. Grading Subsystem

To establish an automated tomato grading framework, this study developed a quality assessment subsystem leveraging multi-modal feature fusion. As illustrated in Figure 8A, the system initiates with instance segmentation using TQVGModel, followed by contour extraction via an Enhanced Sobel operator. Geometric regularity is quantified through ellipse fitting-based axis ratio analysis, implementing maturity-adaptive thresholds where green tomatoes require near-circular shapes (axis ratio > 0.85) while ripened specimens accommodate natural deformation with relaxed criteria (axis ratio > 0.7).
Chromatic evaluation employs a dual color-space strategy combining HSV and LAB analyses, specifically designed to address lighting variability and biological pigmentation complexity in agricultural settings. The HSV space (Hue–Saturation–Value) is optimal for detecting mature tomato redness due to its physiological relevance: the 0–10° and 170–180° hue thresholds align with lycopene’s spectral reflectance to identify healthy red regions, while value/saturation channels mitigate illumination artifacts by separating brightness from chromaticity, and a twofold decay suppression ratio effectively eliminates decayed areas. Conversely, LAB space’s perceptually uniform color distances and decoupled luminance (L*) enhance chlorophyll quantification in green tomatoes, where the a-channel’s sensitivity to green–red opponency (threshold > 120 units) reliably quantifies chlorophyll retention even under shadowed or uneven lighting. This hybrid approach compensates for singular color-space limitations—HSV’s vulnerability to brightness fluctuations and LAB’s weaker hue discrimination. Texture characterization integrates uniform local binary patterns with 8-neighbor radius-1 sampling and grayscale variance measurements to capture surface homogeneity characteristics.
The composite quality metric Q is formulated through maturity-specific weighted summation:
Q = 0.4 C + 0.3 S + 0.3 T     ( R i p e n e d )   0.2 C + 0.5 S + 0.3 T     ( G r e e n )   0.3 C + 0.4 S + 0.3 T     ( I n t e r m e d i a t e )  
where C, S, and T denote normalized color, shape, and texture scores, respectively. Adaptive grading thresholds assign S-class for ripened specimens exceeding Q > 0.6 and green instances surpassing Q > 0.65, with robustness validated under 30% occlusion tolerance. Implemented on NVIDIA Jetson AGX Xavier hardware, the system processes 512 × 512 resolution inputs at 11.8 frames per second, achieving real-time grading performance as visualized in Figure 8B.
Finally, the sub-system outputs comprehensive quality levels for ripe tomatoes: Special Grade (S), First Grade (A), and Second Grade (B), as shown in Figure 8C. By integrating multiple features, this classification sub-system provides a comprehensive and accurate method for assessing tomato quality. This advanced system substantially enhances the performance of automated tomato classification by leveraging cutting-edge image processing algorithms. As the most reliable data foundation, it enables subsequent precision grading and robotic harvesting operations with unprecedented accuracy and efficiency.

2.4. Experimental Design

2.4.1. Network Training

The hardware and software configurations for network training and testing are detailed in Table 2. To enhance instance segmentation accuracy, this study employs a transfer learning approach to initialize the network parameters. Through this initialization, the network achieves more efficient learning, reduced overfitting, and improved generalization for tomato grading and instance segmentation in challenging conditions.
TQVGModel was initially trained on the ImageNet-21K dataset for 300 epochs, with the optimal weights selected as pretrained weights once the network stabilized. Before training, the K-means clustering algorithm determined four basic anchor box sizes, which were scaled to match tomato sizes in various scenarios, enhancing instance segmentation and localization accuracy. During training, the network underwent 60 epochs with a batch size of 4, using the SGD + Momentum optimizer (momentum: 0.9, weight decay: 0.0001). The initial learning rate of 0.002 was gradually increased via a Warmup strategy, followed by Cosine Annealing for updates, with decay starting after the 25th epoch (decay factor: 0.1). Network parameters and performance metrics were saved and evaluated after each epoch using the pycocotools library.

2.4.2. Network Evaluation

This study evaluates instance segmentation performance using standard metrics: precision (P, true positives among predicted positives), recall (R, true positives among actual positives), average precision (AP, per-category grading ability), mean average precision (mAP, AP averaged across categories), and the F1-score (harmonic mean of P and R for balanced performance assessment).
Additionally, the study utilizes Average Inference Time (ms) and Parameter Count (Params) to evaluate hardware performance requirements. Average Inference Time quantifies the mean processing time per test sample, whereas Parameter Count reflects the complexity of the network architecture. The corresponding calculation formulas are as follows:
P = T P T P + F P
R = T P T P + F N
A P = 0 1 P ( R ) d R
m A P = 1 n c 1 = 1 n c A P i
F 1 - s c o r e = 2 × R × P R + P
where TP is the number of correctly segmented tomatoes; FP is the number of incorrectly segmented tomatoes; FN is the number of missed tomatoes.

3. Results

3.1. Experimental Results

The loss curves during the training process, along with the mAP, recall, and F1-score metrics on the validation set, are shown in Figure 9.
As shown in Figure 9a, the comparison of the loss curves between TQVGModel and Mask R-CNN indicates that TQVGModel, which uses Class-Balanced Focal Loss as the classification loss function, requires more training epochs to achieve network convergence. Compared to Mask R-CNN, TQVGModel effectively mitigates issues of excessive loss and instability during the training process, significantly improving convergence and enhancing network stability.
Figure 9b–d present the instance segmentation accuracy, recall, and F1-score on the validation set for different versions of TQVGModel and Mask R-CNN, respectively. The results clearly show that TQVGModel outperforms the original Mask R-CNN network across all performance metrics, demonstrating superior instance segmentation performance.

3.2. Ablation Experiment Results

Ablation experiments are widely used in complex neural networks to assess the impact of specific substructures, training strategies, or parameters on network performance, playing a crucial role in neural network architecture design. As TQVGModel is an extension of Mask R-CNN, the original Mask R-CNN framework is adopted as the baseline for ablation experiments in this study. To evaluate the performance of the proposed TQVGModel series, ablation experiments were conducted to validate the contributions of IncepConvV2, CB Loss, and the E-Sobel operator. The results of these experiments on the test set are presented in Table 3.
Mask R-CNN-A uses the IncepConvV2-Tiny backbone, Mask R-CNN-B integrates IncepConvV2-Tiny with Class-Balanced (CB) Focal Loss, and TQVGModel combines IncepConvV2-Tiny, CB Focal Loss, and the E-Sobel operator. Compared to Mask R-CNN, Mask R-CNN-A improves mAP by 3.91%, recall by 4.99%, and F1-score by 4.5%. Mask R-CNN-B further enhances mAP by 1.67%, recall by 3.79%, and F1-score by 2.8% over Mask R-CNN-A. TQVGModel surpasses Mask R-CNN-B with a 2.48% increase in mAP, 0.98% in recall, and 1.69% in F1-score. The results show that the IncepConvV2-Tiny backbone significantly boosts instance segmentation accuracy while reducing network parameters. CB Loss addresses precision issues from class imbalance, increases focus on complex backgrounds, and lowers missed detections. The E-Sobel operator enhances edge segmentation quality, improving performance in complex scenarios.
Compared with the original network, TQVGModel achieves significant improvements of 8.06% in mAP, 9.76% in recall, and 8.99% in F1-score, while reducing parameters by 10.3 million. Ablation studies verify that TQVGModel maintains balanced precision and recall, confirming its effectiveness.
Figure 10 presents comparative instance segmentation results of test set images across different network architectures. Tomato instance segmentation performance is visualized using color-coded bounding boxes, where A1-A3 denote the ground truth tomato counts requiring accurate instance segmentation in each image set. The instance segmentation results are displayed as follows: B1-B3 represent Mask R-CNN outputs, C1-C3 show Mask R-CNN-A results and D1-D3 correspond to Mask R-CNN-B and TQVGModel, respectively.
Key observations reveal that replacing the backbone network with IncepConvV2 yields significant performance improvements, particularly in complex dense tomato clustering scenarios. Compared to the baseline Mask R-CNN, the modified architecture demonstrates substantially enhanced detection accuracy, as evidenced by the increased true positive counts in C1-C3. However, certain limitations persist, including classification errors and false positives where background regions are misidentified as tomatoes.
To address these issues, Mask R-CNN-B incorporates CB Loss, which effectively mitigates missed detections and classification errors in challenging environments, as demonstrated by the improved results in D1-D3. Notably, TQVGModel builds upon Mask R-CNN-B by integrating E-Sobel operators for edge information extraction. This enhancement achieves dual benefits: (1) maintaining superior edge segmentation precision under conditions of heavy occlusion and fruit clustering, and (2) reducing missed detections in complex scenarios, as clearly illustrated in E1-E3.
To evaluate the performance of the IncepConvV2 backbone network used in the proposed TQVGModel series, comparative experiments were conducted with IncepConvV2, ConvNeXtV2, Swin Transformer, ResNet, and EfficientV2 as the feature extraction backbones for Mask R-CNN. The results of these comparative experiments on the test set are shown in Figure 11. The experimental results demonstrate that using the IncepConvV2 series as the backbone for TQVGModel significantly enhances instance segmentation performance with relatively lower computational cost. Additionally, it effectively meets the demands of various application scenarios.

3.3. Experimental Result Analysis

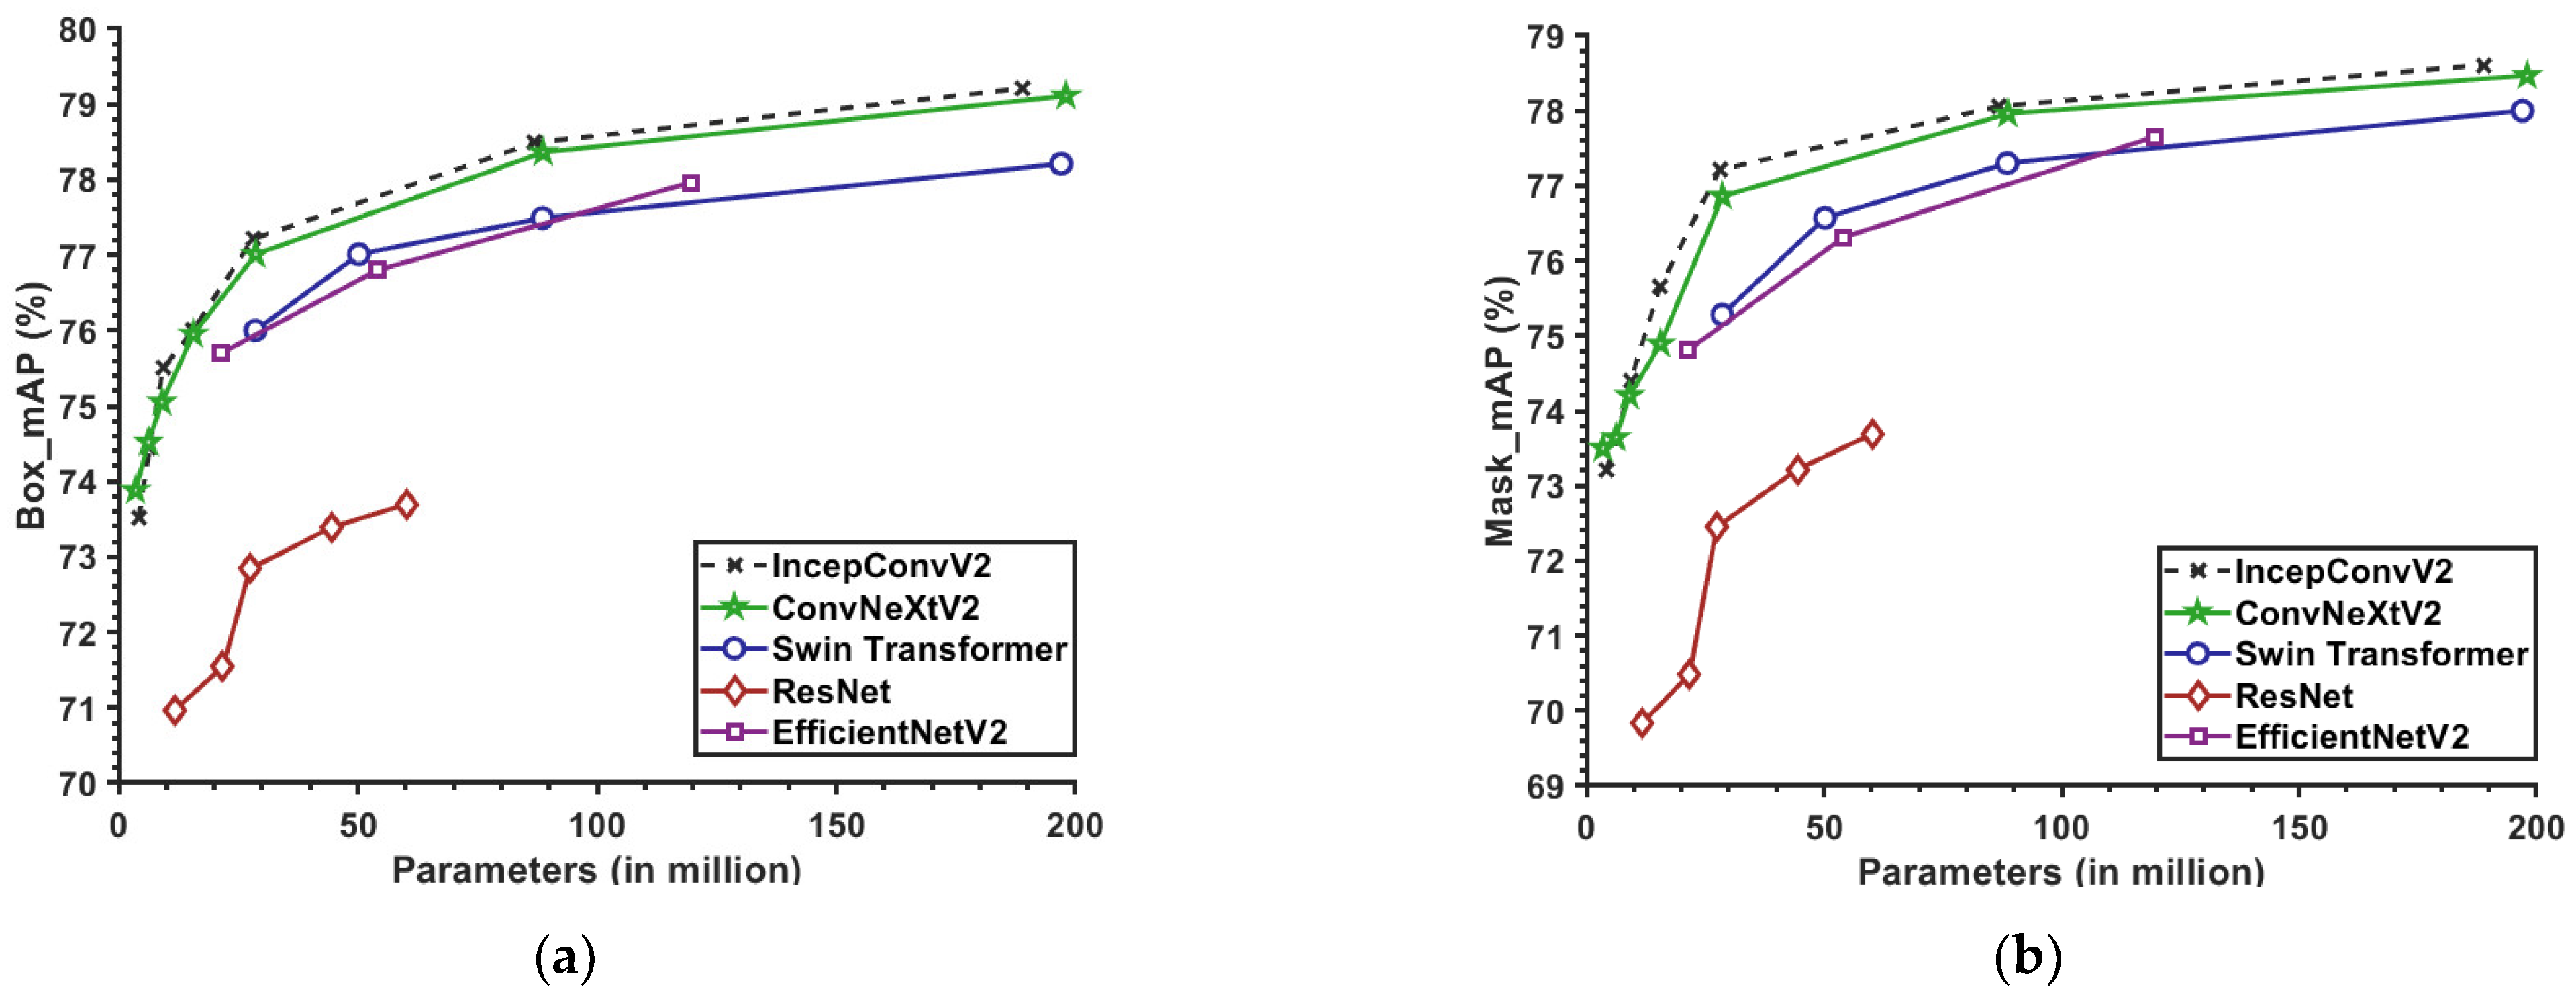
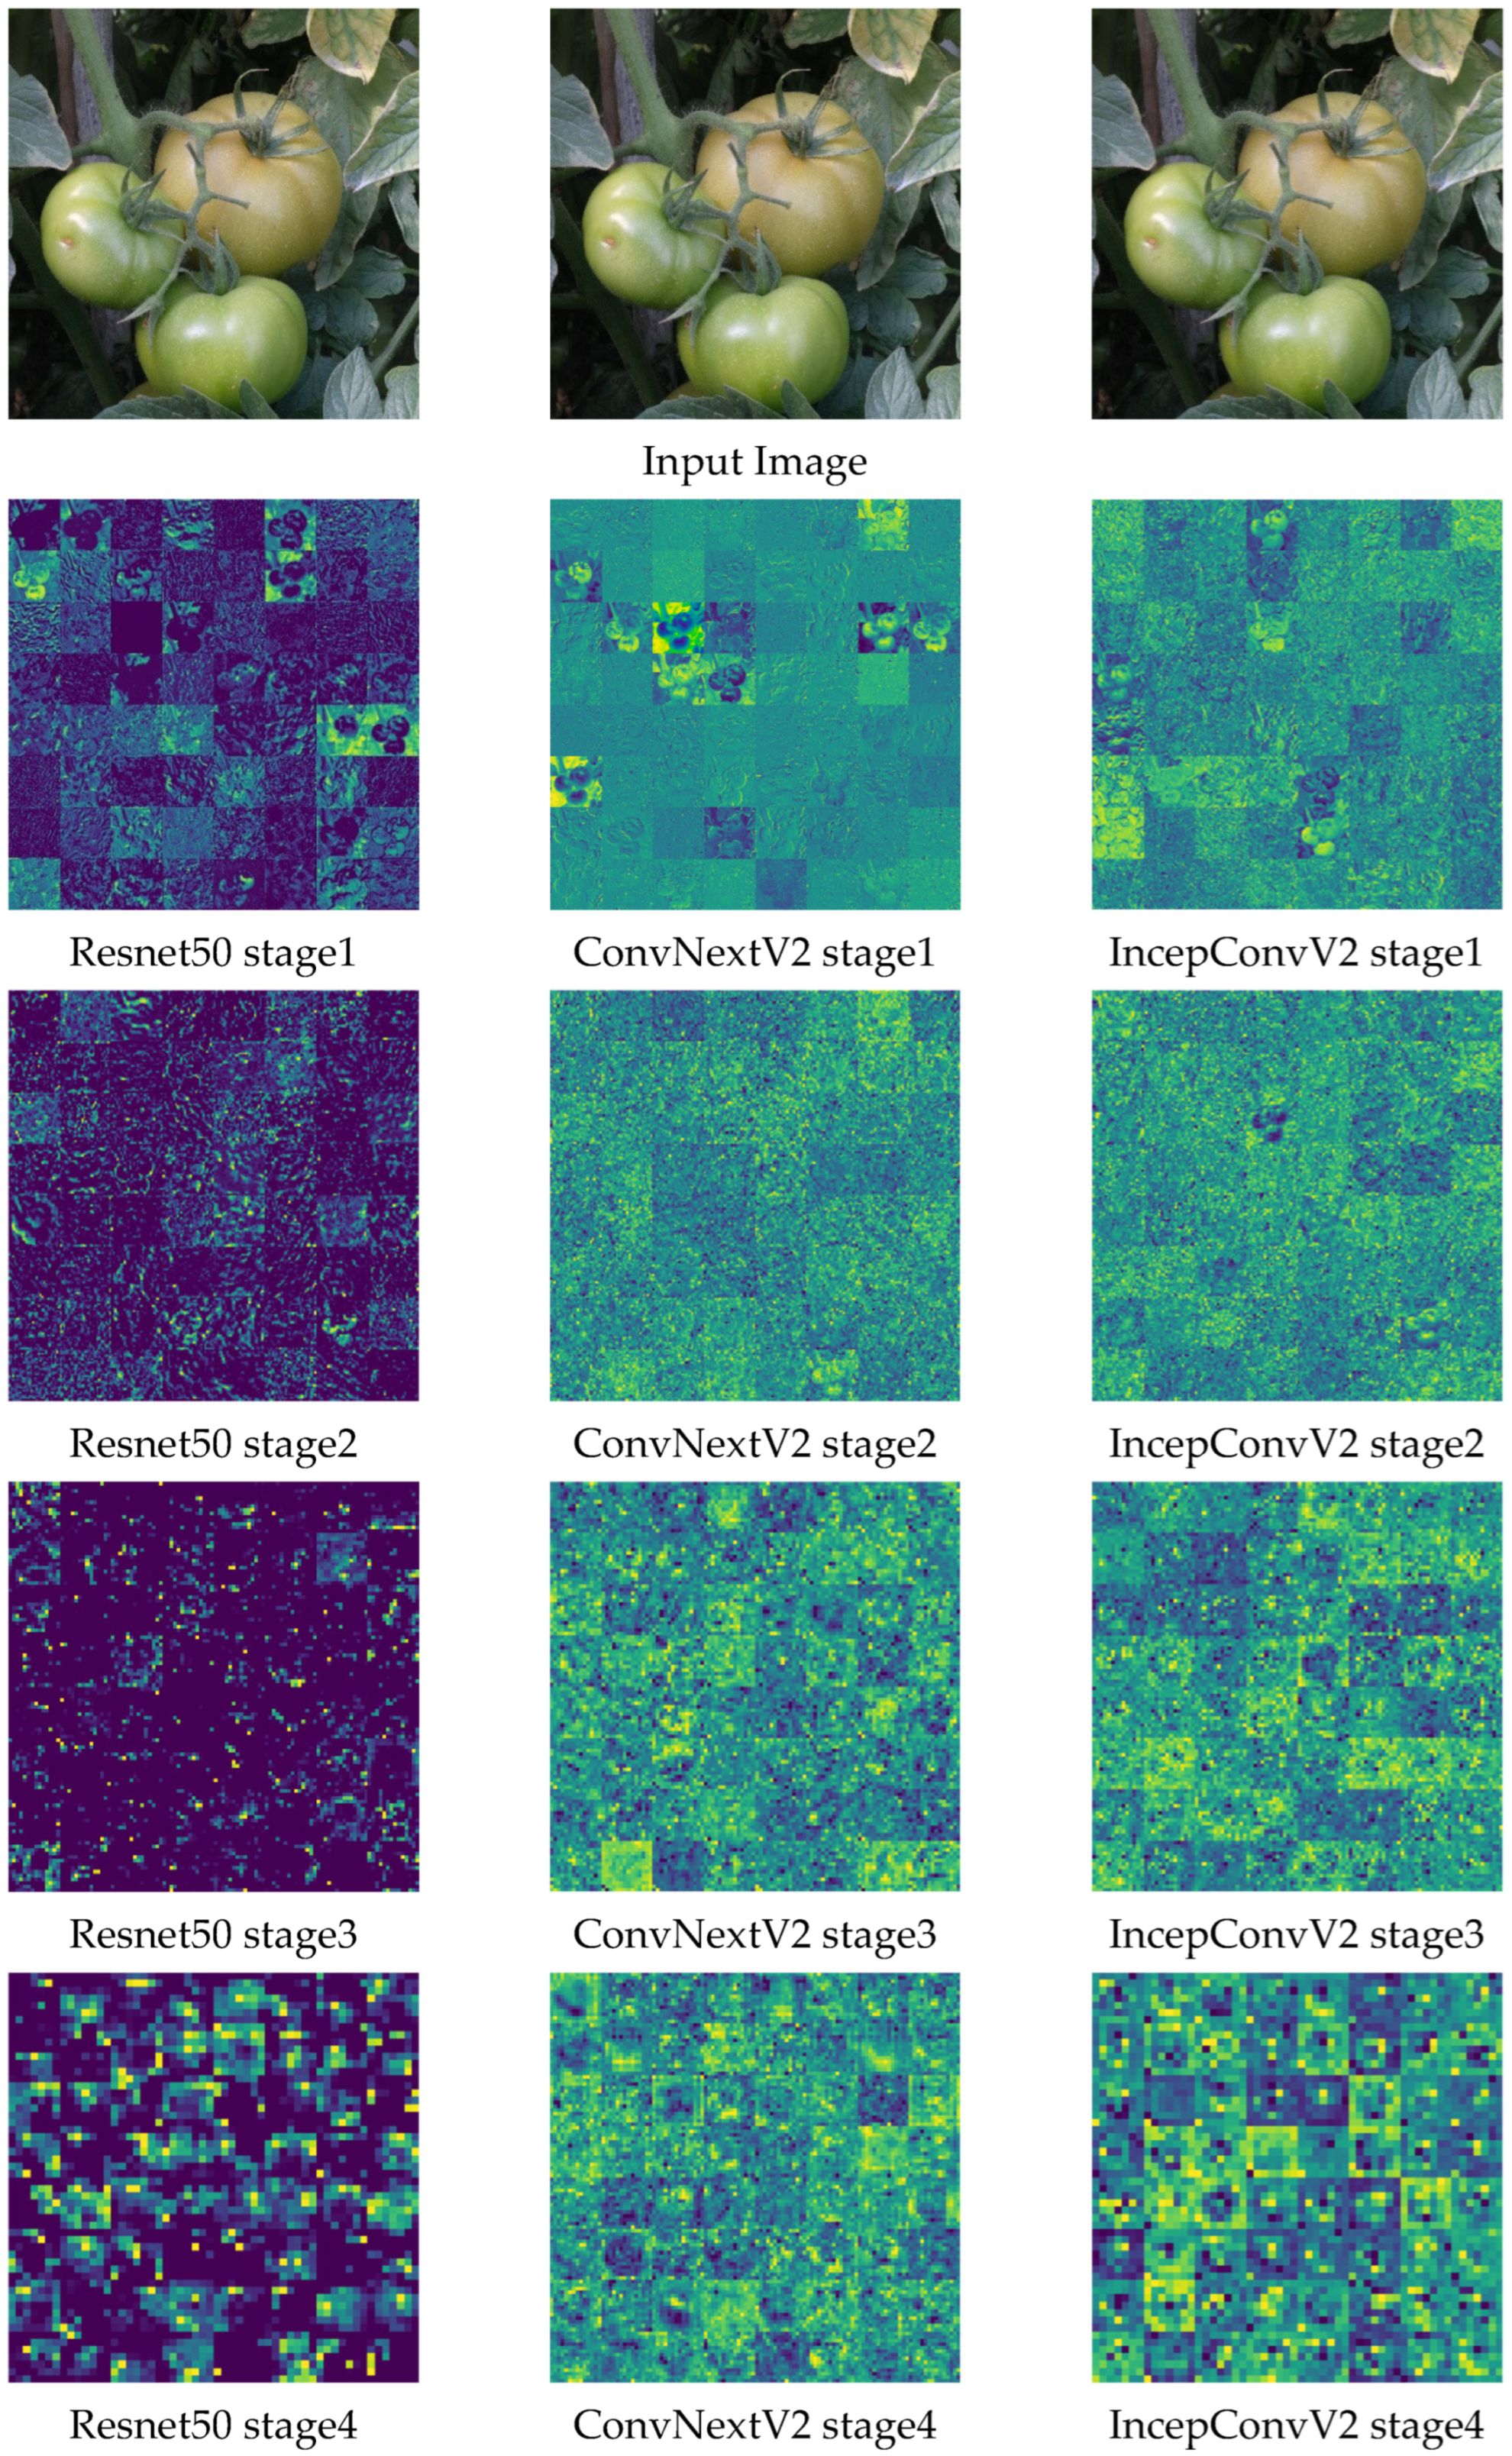
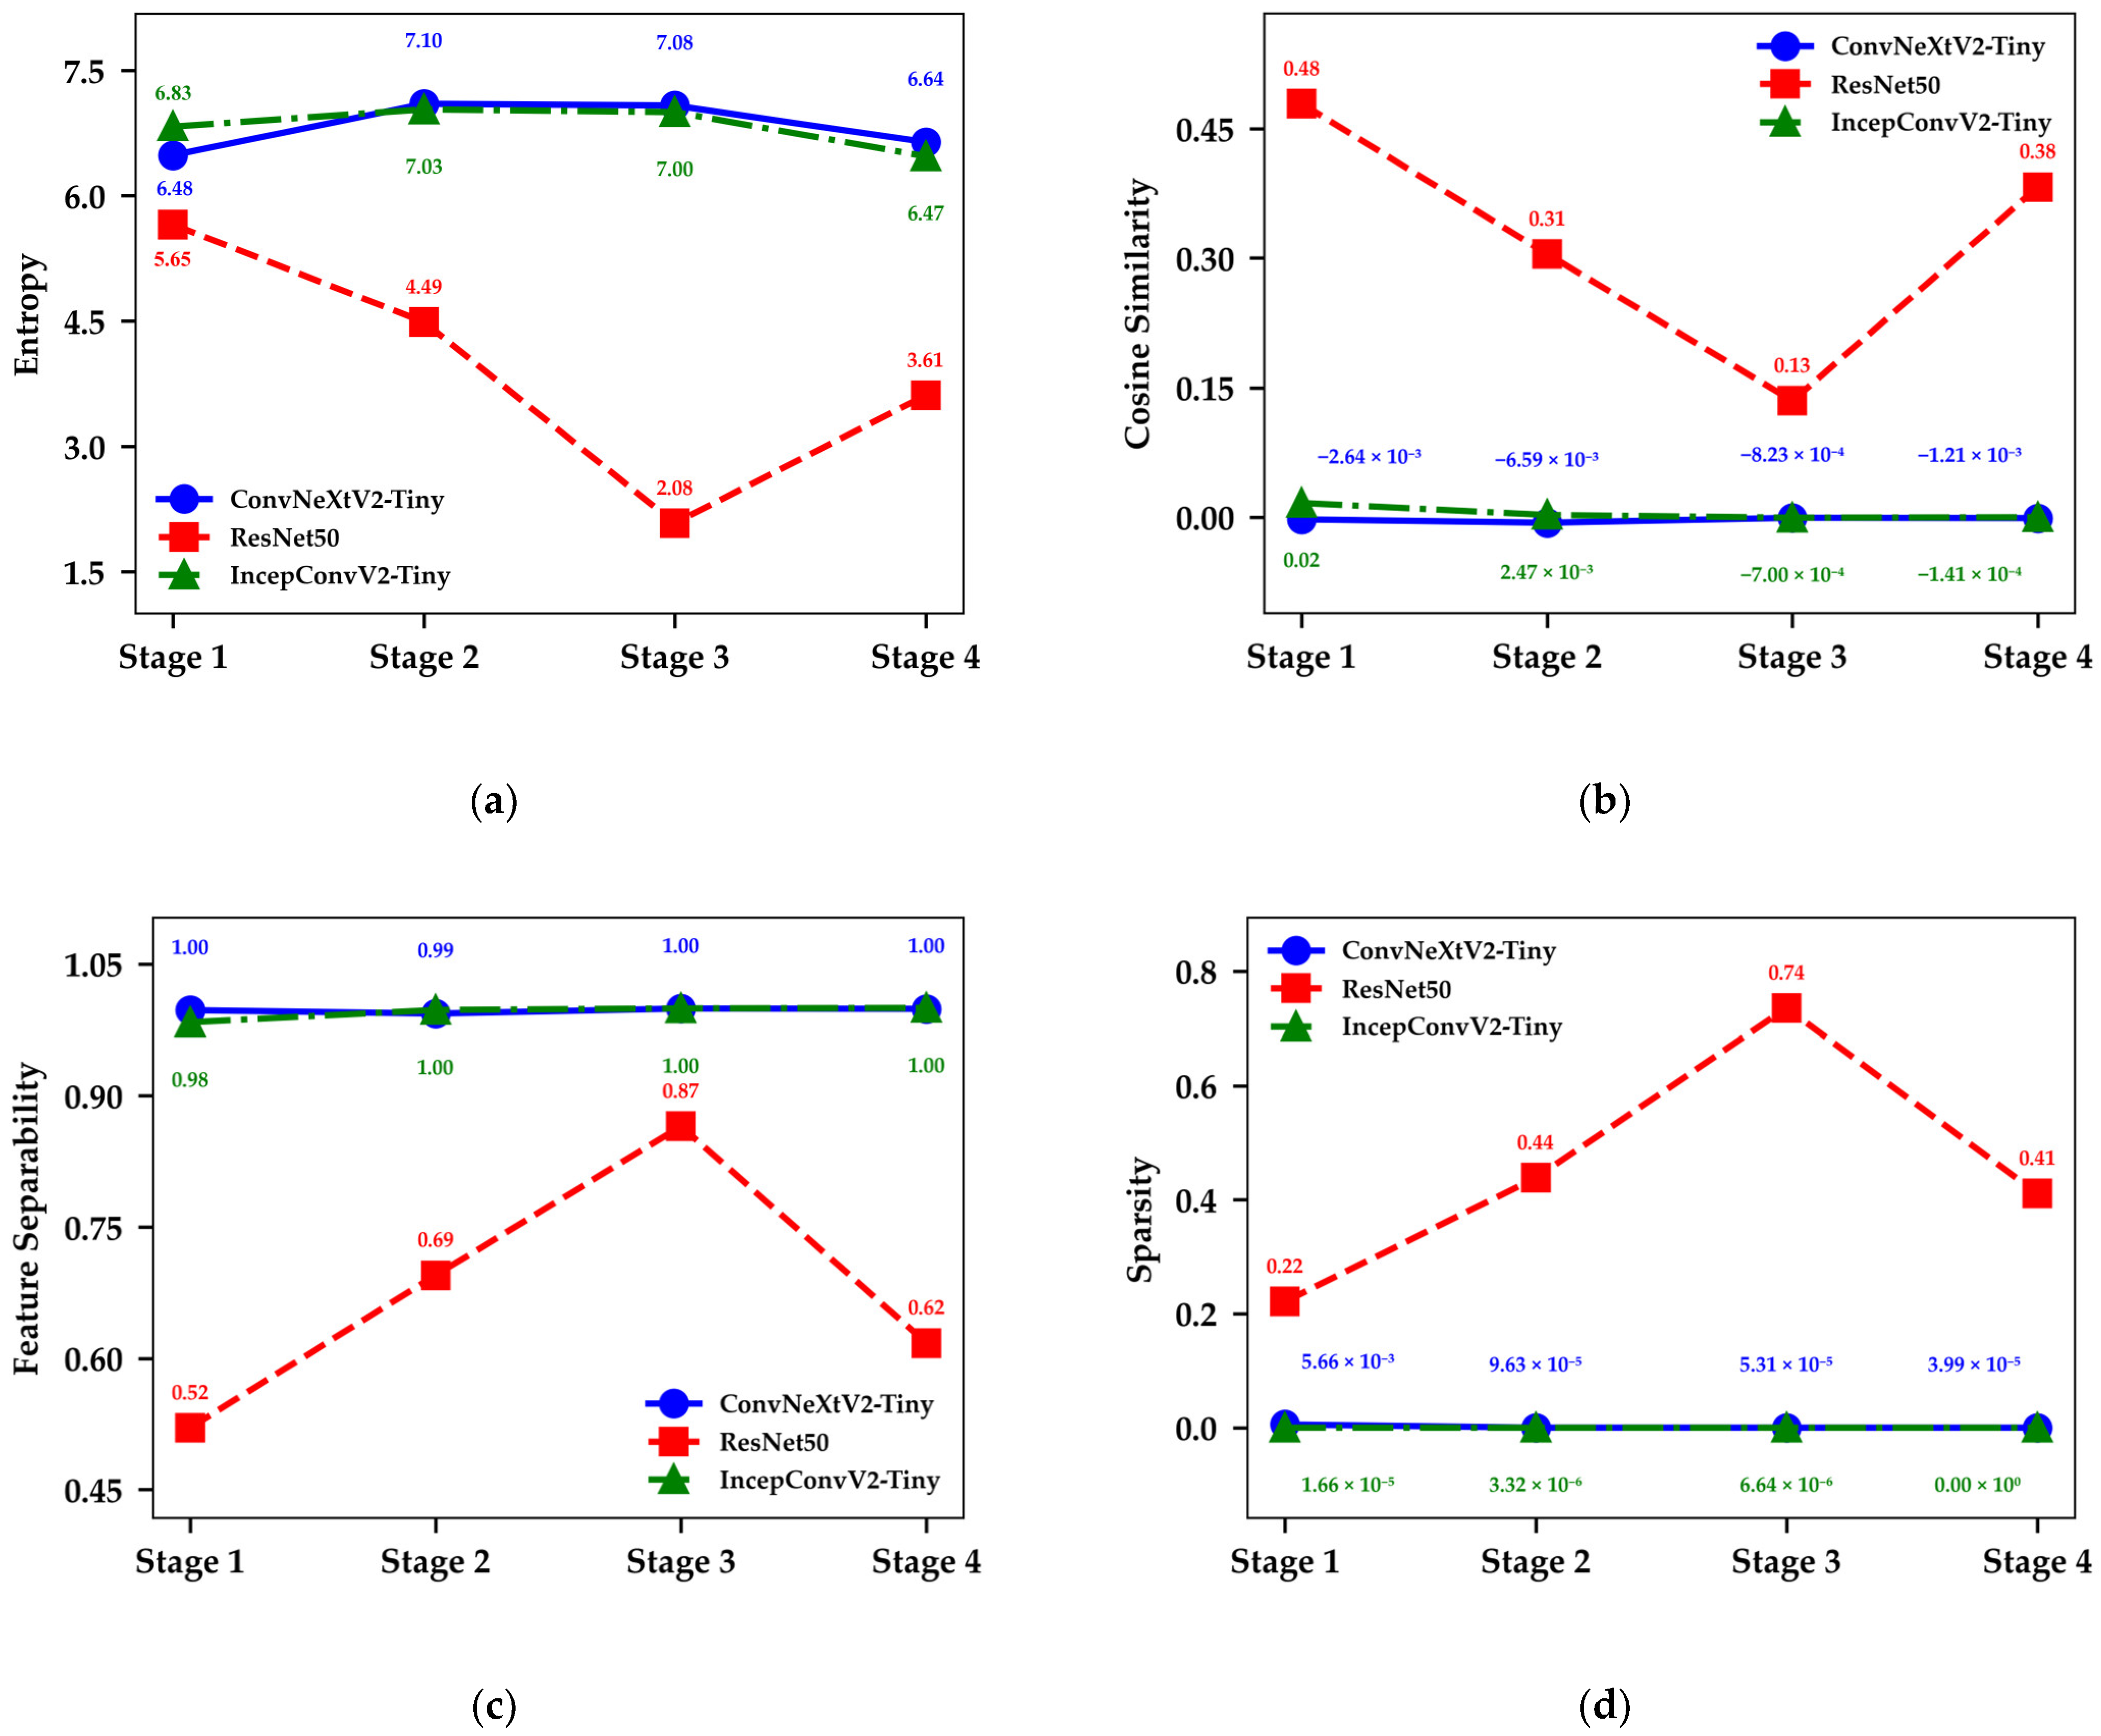
3.3.1. Performance Analysis of the IncepConvV2 Backbone Network

As an advanced convolutional neural network, IncepConvV2 exhibits exceptional feature extraction capabilities that substantially improve TQVGModel performance. To better understand the features and patterns extracted at different levels, we analyzed the channel feature maps in detail, revealing how the network responds to input data. Figure 12 presents the channel feature map output by ResNet50, ConvNextV2-Tiny, and IncepConvV2-Tiny across four stages, normalized and displayed in an 8 × 8 grid for visualization.
The quality of these feature maps was evaluated based on four key metrics: entropy, inter-channel independence (cosine similarity), feature separability, and sparsity [43]. High entropy reflects richer information and greater variation in feature maps, indicating strong network capability for complex feature extraction, whereas low entropy corresponds to limited information content. Lower cosine similarity indicates greater inter-channel independence, promoting better feature differentiation, while higher values may introduce redundancy. Strong feature separability improves model generalization by effectively discriminating between input samples, whereas weak separability suggests suboptimal feature learning. Increased sparsity—characterized by more near-zero activations—can indicate efficient learning. An optimal feature map should demonstrate high entropy and separability, along with low cosine similarity and sparsity, ensuring robust recognition and classification performance. The results indicate that IncepConvV2 optimally balances these characteristics, leading to substantial improvements in TQVGModel effectiveness.
Comparative analysis demonstrates IncepConvV2’s superior feature extraction capabilities over ResNet50: (1) higher feature entropy (Figure 13a) indicates richer information and more uniform distributions; (2) near-zero/negative cosine similarity (Figure 13b) confirms stronger channel independence; (3) feature separability approaching 1 (Figure 13c) shows better class discrimination; (4) reduced sparsity reflects denser feature encoding for finer detail preservation.
In summary, IncepConvV2 outperforms ResNet50 in information richness, feature independence, and feature separability, showcasing superior feature extraction and representation capabilities. This makes it highly suitable for complex tasks requiring robust feature handling.

3.3.2. Effectiveness Analysis of Class-Balanced Focal Loss

To validate the performance enhancement of our optimized Class-Balanced Focal Loss strategy on the tomato dataset, particularly for improving detection and instance segmentation recall of minority-class samples and complex-background instances, we conducted systematic experiments to verify its effectiveness. The investigation focused on how parameter γ—which modulates loss weighting between hard and easy samples—affects network performance. Using Mask R-CNN with an IncepConvV2-Tiny backbone as the baseline model, we performed controlled experiments on a class-imbalanced dataset with challenging backgrounds. Through methodical γ-value tuning, we evaluated model performance using key metrics including mAP, recall, F1-score, and training time on validation sets.
As evidenced by the detection results in Figure 10 (D1–D3) and the quantitative metrics in Table 4, proper γ-value adjustment significantly reduces both missed detections and false positives during model inference, thereby improving recall by 3.47% and F1-score by 3.21%. However, excessively high γ values decrease precision by 2.98% while increasing training time by 19.69%. Our multi-metric evaluation demonstrates that model performance can be substantially enhanced while maintaining training time increments below 10%. Comparative experiments with control groups confirm that the Class-Balanced Focal Loss effectively mitigates class-imbalance-induced detection errors (including misses and false alarms) in complex backgrounds, with γ = 1.5 identified as the optimal configuration.

3.3.3. Analysis of Enhanced Sobel Operator Performance

The experimental results demonstrate that the introduction of the Enhanced Sobel operator and the edge loss function significantly improves the instance segmentation accuracy of Mask R-CNN in complex backgrounds, as illustrated in Figure 14b,c. The enhanced algorithm captures subtle gradient variations at target edges more precisely, particularly in low-contrast regions such as tomato fruits and occluded background objects. Meanwhile, the edge loss function effectively suppresses background noise interference by explicitly constraining the geometric consistency between predicted masks and ground-truth edges. Furthermore, the multi-task collaborative training strategy, which combines instance segmentation with edge optimization, enhances the model’s robustness to occlusion and overlapping scenarios, resulting in more continuous and tightly fitting instance segmentation boundaries that align with the actual contours. This improvement validates the effectiveness of the edge enhancement strategy in preserving fine details for instance segmentation tasks.

3.4. Multi-Scenario Application Analysis

To validate the instance segmentation performance under complex conditions such as diverse tomato morphologies, dense growth patterns, occlusions, and varying fields of view, the test set was further categorized, and relevant images were added to construct these challenging scenarios. Based on this, the performance was compared with four mainstream image instance segmentation algorithms: SOLO V2 [44], YOLACT [45], YOLO V8-Seg [46], and Mask R-CNN.
The instance segmentation metric results are presented in Table 5. Using the test set, TQVGModel achieved an average precision (AP) of 80%, surpassing all other instance segmentation algorithms. TQVGModel demonstrated superior accuracy in scenarios involving dense tomato clusters, severe occlusions, and varying lighting conditions, indicating its robustness for tomato grading and instance segmentation across diverse environments. Under wide-field conditions, TQVGModel achieved superior performance with mAP improvements of 7.48% over SOLOv2, 8.58% over YOLACT, 7.04% over YOLOv8-Seg, and 6.74% over Mask R-CNN. This improvement validates the effectiveness of integrating IncepConvV2, Class-Balanced Loss (CB Loss), and the E-Sobel operator in enhancing segmentation performance.
To assess its feasibility for harvesting robots, TQVGModel-Atto was evaluated. It achieved an mAP of 75.03%, with a parameter size of 24.78 M and an instance segmentation speed of 45.24 ms. TQVGModel-Atto demonstrated superior performance with mAP improvements of 2.46% over SOLOv2, 3.62% over YOLACT, 2.02% over YOLOv8-Seg, and 1.72% over Mask R-CNN. The architecture achieved significant parameter reductions of 61.87 M versus SOLOv2, 12.05 M versus YOLACT, and 19.4 M versus Mask R-CNN. In instance segmentation speed, TQVGModel-Atto processed frames 15.08 ms faster than SOLOv2 and 24.74 ms faster than Mask R-CNN, while maintaining a slight advantage over YOLACT and YOLOv8-Seg. These results confirm that TQVGModel-Atto achieves high accuracy and real-time performance, meeting the demands for real-time tomato grading and instance segmentation in complex harvesting scenarios.

4. Discussion

4.1. Interpretation of Results in Context

The proposed TQVGModel demonstrates significant improvements over existing methods across four key aspects of tomato instance segmentation and grading in complex agricultural scenarios. First, in terms of segmentation accuracy, TQVGModel-Tiny achieves an 80.05% mAP—a 7.04% increase over Mask R-CNN—validating the efficacy of our multi-branch IncepConvV2 backbone in enhancing feature representation for dense, occluded fruits. Second, the model substantially improves computational efficiency, reducing parameters by 10.2 M (23.1% decrease) and accelerating inference by 16.6 ms (23.7% faster), which addresses the critical real-time performance requirements of harvesting robots. Third, the integration of Class-Balanced Focal Loss mitigates miss rates by dynamically prioritizing underrepresented or challenging samples, particularly under dynamic viewing conditions. Finally, the E-Sobel edge optimization explicitly refines boundary localization, resolving the historical challenge of imprecise edge prediction for quality grading. These advancements collectively confirm that our architectural innovations—IncepConvV2 for accuracy, loss reweighting for robustness, and edge-aware training for localization—effectively bridge the gap between theoretical design and practical deployment in complex agricultural environments.
Our findings align with prior studies highlighting the limitations of region-free detectors (e.g., YOLO, SSD) in handling occlusions and precise edge segmentation [18,19,47]. While these methods excel in speed, their accuracy drops significantly in complex scenes, as observed by Sapkota et al. [11]. In contrast, the region-based approach used in TQVGModel, which incorporates large-kernel decomposition and emphasizes edge detail processing, bridges the gap between speed and precision. This finding supports the conclusions in the work by Chowdhury and colleagues [16] regarding the importance of spatial and channel attention mechanisms for agricultural image instance segmentation.

4.2. Training Efficiency and Computational Cost Analysis

The training efficiency of TQVGModel was evaluated under the hardware configuration detailed in Table 1. Key observations from our experiments are summarized as follows:
Impact of Image Resolution: Training on the high-resolution Tomato-Seg dataset (1920 × 1080) required approximately 6.1 h for 60 epochs with a batch size of 4, achieving optimal performance at γ = 1.5 in the Class-Balanced Focal Loss (Table 4). However, when tested on the higher-resolution Labor_tomato_big dataset (3024 × 4032), the per-epoch training time increased by ~60% compared to the 1920 × 1080 baseline, accompanied by a significant rise in GPU memory consumption. This demonstrates that high-resolution images incur substantial computational overhead, underscoring the need for careful resolution selection to balance model performance and training costs. This observation aligns with the findings of Verk et al. (2025) in their latest research [48].
Effect of Dataset Scale: The total training time for the ImageNet-21K pretraining phase was 72 h (300 epochs), highlighting the computational demands of large-scale datasets. In contrast, the optimized IncepConvV2 backbone reduced training time by 25% compared to standard Mask R-CNN implementations when processing the 2220-image dataset, showcasing its superior efficiency in handling mid-scale datasets.
Overhead of Loss Function Tuning: The γ-value tuning in the Class-Balanced Focal Loss introduced only ≤10% additional training time (Table 4), demonstrating that minor computational overhead can yield significant performance improvements. This underscores the efficiency of hyperparameter optimization in our framework.

4.3. Implications for Robotic Harvesting Systems

The grading subsystem integrated into TQVGModel provides actionable insights for automated harvesting robots, addressing a critical gap in prior work that focused solely on detection [19,23]. By combining mask-based quality assessment with real-time performance, our system enables robots to make harvesting decisions based on ripeness and defects, advancing beyond bounding-box-level solutions [49,50]. This aligns with industry demands for non-destructive, standardized grading (e.g., OECD/USDA) while overcoming the computational bottlenecks of transformer-based methods [51].
The success of the E-Sobel operator in improving edge accuracy highlights the critical role of geometric precision for quality grading, which has been identified as a significant challenge in previous studies [14,15]. Unlike variants of Mask R-CNN that compromise processing speed to achieve higher accuracy [16], the lightweight design of TQVGModel guarantees its practical deployment on platforms with limited computational resources, meeting an essential requirement for field robotics applications.

4.4. Limitations and Future Directions

While TQVGModel demonstrates robust performance in complex agricultural scenarios, several limitations warrant discussion. First, its accuracy under extreme lighting variations (e.g., glare, shadows) remains unvalidated, suggesting the need for adaptive illumination normalization techniques in future work. Second, although the Tomato-Seg dataset covers diverse occlusion patterns, its scope is currently limited to single-crop (tomato) environments; expanding it to mixed-crop scenarios (e.g., tomato-pepper co-cultivation) could improve generalization across cultivars and crops. Additionally, the model’s current design does not explicitly account for morphological differences between tomato cultivars (e.g., size, color, texture), which may affect grading precision—a direction that requires further study. For real-world deployment, future efforts will integrate TQVGModel with robotic manipulators and 3D pose estimation for closed-loop harvesting, alongside neural architecture search (NAS) to automate backbone optimization for field-specific conditions. Crucially, while the proposed framework is tailored for tomatoes, its modular design (e.g., Class-Balanced Focal Loss, E-Sobel edge optimization) holds promise for adaptation to other crops, provided cultivar-specific adjustments are made to the grading subsystem.

5. Conclusions

To address the challenges of instance segmentation, real-time performance, missed detections, and edge localization in tomato grading and harvesting under complex conditions, this study proposes TQVGModel—a high-precision solution robust to diverse morphologies, occlusions, and dynamic fields of view. The model’s IncepConvV2 backbone, Class-Balanced Focal Loss, and E-Sobel operator collectively improve segmentation accuracy (80.05% mAP), speed (16.6 ms faster than Mask R-CNN), and edge precision, enabling reliable deployment in agricultural robotics. However, limitations remain, including sensitivity to extreme lighting and a current focus on single-crop (tomato) scenarios; future work will test adaptive illumination methods and extend the framework to mixed-crop environments (e.g., tomato-pepper systems) to enhance generalization. For practical adoption, we will integrate TQVGModel with robotic manipulators, 3D pose estimation, and cultivar-specific grading modules, while exploring neural architecture search for field-optimized backbones. Although designed for tomatoes, the model’s modular architecture shows promise for adaptation to other crops, pending task-specific adjustments. These advancements will bridge the gap between laboratory validation and real-world agricultural automation.

Author Contributions

Conceptualization, P.C. and K.W.; methodology, P.C. and K.W.; software, J.L. and P.C.; validation, P.C., K.W., J.L. and T.L.; formal analysis, Y.X. and T.L.; investigation, K.W. and J.L.; resources, K.W., J.L. and Y.X.; data curation, K.W.; writing—original draft preparation, P.C. and K.W.; writing—review and editing, J.L. and B.X.; visualization, P.C. and K.W.; supervision, J.L. and B.X.; project administration, K.W.; funding acquisition, P.C. All authors have read and agreed to the published version of the manuscript.

Funding

This research was supported by the Guangxi Natural Science Foundation Project (Grant No. 2025GXNSFHA069199), the China Central Financial Services to Guide Local Science and Technology Development Fund Project (Grant No. ZY19183003), and the Guangxi Key R&D Project of China (Grant No. AB20058001), and Welding Omission Detection of Vehicle Body Studs Based on Convolutional Neural Network (Grant No. GKYC202203).

Data Availability Statement

Tomato-Seg dataset will be made available on request from the corresponding author.

Conflicts of Interest

The authors declare no conflicts of interest.

References

  1. Saha, K.K.; Weltzien, C.; Bookhagen, B.; Zude-Sasse, M. Chlorophyll Content Estimation and Ripeness Detection in Tomato Fruit Based on NDVI from Dual Wavelength LiDAR Point Cloud Data. J. Food Eng. 2024, 383, 112218. [Google Scholar] [CrossRef]
  2. Li, T.; Sun, M.; He, Q.; Zhang, G.; Shi, G.; Ding, X.; Lin, S. Tomato Recognition and Location Algorithm Based on Improved YOLOv5. Comput. Electron. Agric. 2023, 208, 107759. [Google Scholar] [CrossRef]
  3. Zheng, S.; Liu, Y.; Weng, W.; Jia, X.; Yu, S.; Wu, Z. Tomato Recognition and Localization Method Based on Improved YOLOv5n-Seg Model and Binocular Stereo Vision. Agronomy 2023, 13, 2339. [Google Scholar] [CrossRef]
  4. Bhargava, A.; Bansal, A. Fruits and Vegetables Quality Evaluation Using Computer Vision: A Review. J. King Saud Univ.-Comput. Inf. Sci. 2021, 33, 243–257. [Google Scholar] [CrossRef]
  5. Guo, F.; Qin, W.; Fu, X.; Tao, D.; Zhao, C.; Li, G. A Novel Method for Online Sex Sorting of Silkworm Pupae (Bombyx mori) Using Computer Vision Combined with Deep Learning. J. Sci. Food Agric. 2025, 105, 4232–4240. [Google Scholar] [CrossRef]
  6. Liu, L.; Li, Z.; Lan, Y.; Shi, Y.; Cui, Y. Design of a Tomato Classifier Based on Machine Vision. PLoS ONE 2019, 14, e0219803. [Google Scholar] [CrossRef]
  7. Li, Y. Research and Application of Deep Learning in Image Recognition. In Proceedings of the 2022 IEEE 2nd International Conference on Power, Electronics and Computer Applications (ICPECA), Shenyang, China, 21–23 January 2022; pp. 994–999. [Google Scholar]
  8. Chuquimarca, L.E.; Vintimilla, B.X.; Velastin, S.A. A Review of External Quality Inspection for Fruit Grading Using CNN Models. Artif. Intell. Agric. 2024, 14, 1–20. [Google Scholar] [CrossRef]
  9. Redmon, J.; Divvala, S.; Girshick, R.; Farhadi, A. You Only Look Once: Unified, Real-Time Object Detection. In Proceedings of the 2016 IEEE Conference on Computer Vision and Pattern Recognition (CVPR), Las Vegas, NV, USA, 27–30 June 2016; pp. 779–788. [Google Scholar]
  10. Liu, W.; Anguelov, D.; Erhan, D.; Szegedy, C.; Reed, S.; Fu, C.-Y.; Berg, A.C. SSD: Single Shot MultiBox Detector. In Computer Vision—ECCV 2016; Leibe, B., Matas, J., Sebe, N., Welling, M., Eds.; Springer International Publishing: Cham, Switzerland, 2016; pp. 21–37. [Google Scholar]
  11. Sapkota, R.; Ahmed, D.; Karkee, M. Comparing YOLOv8 and Mask R-CNN for Instance Segmentation in Complex Orchard Environments. Artif. Intell. Agric. 2024, 13, 84–99. [Google Scholar] [CrossRef]
  12. Ren, S.; He, K.; Girshick, R.; Sun, J. Faster R-CNN: Towards Real-Time Object Detection with Region Proposal Networks. IEEE Trans. Pattern Anal. Mach. Intell. 2017, 39, 1137–1149. [Google Scholar] [CrossRef]
  13. He, K.; Gkioxari, G.; Dollár, P.; Girshick, R. Mask R-CNN. IEEE Trans. Pattern Anal. Mach. Intell. 2020, 42, 386–397. [Google Scholar] [CrossRef]
  14. Wang, C.; Ding, F.; Wang, Y.; Wu, R.; Yao, X.; Jiang, C.; Ling, L. Real-Time Detection and Instance Segmentation of Strawberry in Unstructured Environment. Comput. Mater. Contin. 2024, 78, 1481–1501. [Google Scholar] [CrossRef]
  15. Haggag, S.; Veres, M.; Tarry, C.; Moussa, M. Object Detection in Tomato Greenhouses: A Study on Model Generalization. Agriculture 2024, 14, 173. [Google Scholar] [CrossRef]
  16. Chowdhury, M.; Reza, M.N.; Jin, H.; Islam, S.; Lee, G.-J.; Chung, S.-O. Defective Pennywort Leaf Detection Using Machine Vision and Mask R-CNN Model. Agronomy 2024, 14, 2313. [Google Scholar] [CrossRef]
  17. Cong, P.; Li, S.; Zhou, J.; Lv, K.; Feng, H. Research on Instance Segmentation Algorithm of Greenhouse Sweet Pepper Detection Based on Improved Mask RCNN. Agronomy 2023, 13, 196. [Google Scholar] [CrossRef]
  18. Wang, Y.; Yan, G.; Meng, Q.; Yao, T.; Han, J.; Zhang, B. DSE-YOLO: Detail Semantics Enhancement YOLO for Multi-Stage Strawberry Detection. Comput. Electron. Agric. 2022, 198, 107057. [Google Scholar] [CrossRef]
  19. Shi, R.; Li, T.; Yamaguchi, Y. An Attribution-Based Pruning Method for Real-Time Mango Detection with YOLO Network. Comput. Electron. Agric. 2020, 169, 105214. [Google Scholar] [CrossRef]
  20. Cui, Y.; Jia, M.; Lin, T.-Y.; Song, Y.; Belongie, S. Class-Balanced Loss Based on Effective Number of Samples. In Proceedings of the 2019 IEEE/CVF Conference on Computer Vision and Pattern Recognition (CVPR), Long Beach, CA, USA, 16–20 June 2019; pp. 9260–9269. [Google Scholar]
  21. Li, H.; Gu, Z.; He, D.; Wang, X.; Huang, J.; Mo, Y.; Li, P.; Huang, Z.; Wu, F. A Lightweight Improved YOLOv5s Model and Its Deployment for Detecting Pitaya Fruits in Daytime and Nighttime Light-Supplement Environments. Comput. Electron. Agric. 2024, 220, 108914. [Google Scholar] [CrossRef]
  22. Camacho, J.; Morocho-Cayamcela, M.E. Mask R-CNN and YOLOv8 Comparison to Perform Tomato Maturity Recognition Task. In TICEC 2023, Proceedings of the Conference on Information and Communication Technologies of Ecuador, Cuenca, Ecuador, 18–20 October 2023; Springer Nature: Cham, Switzerland, 2023; pp. 382–396. ISBN 978-3-031-45437-0. [Google Scholar]
  23. Wang, B.; Li, M.; Wang, Y.; Li, Y.; Xiong, Z. A Smart Fruit Size Measuring Method and System in Natural Environment. J. Food Eng. 2024, 373, 112020. [Google Scholar] [CrossRef]
  24. Kaur, P.; Khehra, B.S.; Mavi, E.B.S. Data Augmentation for Object Detection: A Review. In Proceedings of the 2021 IEEE International Midwest Symposium on Circuits and Systems (MWSCAS), Lansing, MI, USA, 8–11 August 2021; pp. 537–543. [Google Scholar]
  25. Fang, S.; Zhang, B.; Hu, J. Improved Mask R-CNN Multi-Target Detection and Segmentation for Autonomous Driving in Complex Scenes. Sensors 2023, 23, 3853. [Google Scholar] [CrossRef]
  26. Chu, P.; Li, Z.; Lammers, K.; Lu, R.; Liu, X. Deep Learning-Based Apple Detection Using a Suppression Mask R-CNN. Pattern Recognit. Lett. 2021, 147, 206–211. [Google Scholar] [CrossRef]
  27. Yu, Y.; Zhang, K.; Yang, L.; Zhang, D. Fruit Detection for Strawberry Harvesting Robot in Non-Structural Environment Based on Mask-RCNN. Comput. Electron. Agric. 2019, 163, 104846. [Google Scholar] [CrossRef]
  28. Wu, J.; Song, L.; Wang, T.; Zhang, Q.; Yuan, J. Forest R-CNN: Large-Vocabulary Long-Tailed Object Detection and Instance Segmentation. In Proceedings of the 28th ACM International Conference on Multimedia, Seattle, WA, USA, 12–16 October 2020; Association for Computing Machinery: New York, NY, USA, 2020; pp. 1570–1578. [Google Scholar]
  29. Wang, D.; He, D. Fusion of Mask RCNN and Attention Mechanism for Instance Segmentation of Apples under Complex Background. Comput. Electron. Agric. 2022, 196, 106864. [Google Scholar] [CrossRef]
  30. Jia, W.; Wei, J.; Zhang, Q.; Pan, N.; Niu, Y.; Yin, X.; Ding, Y.; Ge, X. Accurate Segmentation of Green Fruit Based on Optimized Mask RCNN Application in Complex Orchard. Front. Plant Sci. 2022, 13, 955256. [Google Scholar] [CrossRef] [PubMed]
  31. Tang, C.; Chen, H.; Li, X.; Li, J.; Zhang, Z.; Hu, X. Look Closer to Segment Better: Boundary Patch Refinement for Instance Segmentation. In Proceedings of the 2021 IEEE/CVF Conference on Computer Vision and Pattern Recognition (CVPR), Nashville, TN, USA, 20–25 June 2021; pp. 13921–13930. [Google Scholar]
  32. Long, C.-F.; Yang, Y.-J.; Liu, H.-M.; Su, F.; Deng, Y.-J. An Approach for Detecting Tomato Under a Complicated Environment. Agronomy 2025, 15, 667. [Google Scholar] [CrossRef]
  33. Arakeri, M.P.; Lakshmana. Computer Vision Based Fruit Grading System for Quality Evaluation of Tomato in Agriculture Industry. Procedia Comput. Sci. 2016, 79, 426–433. [Google Scholar] [CrossRef]
  34. He, K.; Zhang, X.; Ren, S.; Sun, J. Deep Residual Learning for Image Recognition. In Proceedings of the 2016 IEEE Conference on Computer Vision and Pattern Recognition (CVPR), Las Vegas, NV, USA, 27–30 June 2016; pp. 770–778. [Google Scholar]
  35. Liu, Z.; Mao, H.; Wu, C.-Y.; Feichtenhofer, C.; Darrell, T.; Xie, S. A ConvNet for the 2020s. In Proceedings of the 2022 IEEE/CVF Conference on Computer Vision and Pattern Recognition (CVPR), New Orleans, LA, USA, 18–24 June 2022; pp. 11966–11976. [Google Scholar]
  36. Woo, S.; Debnath, S.; Hu, R.; Chen, X.; Liu, Z.; Kweon, I.S.; Xie, S. ConvNeXt V2: Co-Designing and Scaling ConvNets with Masked Autoencoders. In Proceedings of the 2023 IEEE/CVF Conference on Computer Vision and Pattern Recognition (CVPR), Vancouver, BC, Canada, 17–24 June 2023; pp. 16133–16142. [Google Scholar]
  37. Yu, W.; Zhou, P.; Yan, S.; Wang, X. InceptionNeXt: When Inception Meets ConvNeXt. In Proceedings of the 2024 IEEE/CVF Conference on Computer Vision and Pattern Recognition (CVPR), Seattle, WA, USA, 16–22 June 2024; pp. 5672–5683. [Google Scholar]
  38. He, K.; Chen, X.; Xie, S.; Li, Y.; Dollár, P.; Girshick, R. Masked Autoencoders Are Scalable Vision Learners. In Proceedings of the 2022 IEEE/CVF Conference on Computer Vision and Pattern Recognition (CVPR), New Orleans, LA, USA, 18–24 June 2022; pp. 15979–15988. [Google Scholar]
  39. Cheng, T.; Wang, X.; Huang, L.; Liu, W. Boundary-Preserving Mask R-CNN. In Computer Vision–ECCV 2020; Springer: Cham, Switzerland, 2020. [Google Scholar]
  40. Wang, S.; Sun, G.; Zheng, B.; Du, Y. A Crop Image Segmentation and Extraction Algorithm Based on Mask RCNN. Entropy 2021, 23, 1160. [Google Scholar] [CrossRef]
  41. Zimmermann, R.S.; Siems, J.N. Faster Training of Mask R-CNN by Focusing on Instance Boundaries. Comput. Vis. Image Underst. 2019, 188, 102795. [Google Scholar] [CrossRef]
  42. Tian, R.; Sun, G.; Liu, X.; Zheng, B. Sobel Edge Detection Based on Weighted Nuclear Norm Minimization Image Denoising. Electronics 2021, 10, 655. [Google Scholar] [CrossRef]
  43. Zeiler, M.D.; Fergus, R. Visualizing and Understanding Convolutional Networks. In Computer Vision—ECCV 2014; Fleet, D., Pajdla, T., Schiele, B., Tuytelaars, T., Eds.; Springer International Publishing: Cham, Switzerland, 2014; pp. 818–833. [Google Scholar]
  44. Wang, X.; Zhang, R.; Kong, T.; Li, L.; Shen, C. SOLOv2: Dynamic and Fast Instance Segmentation. In Advances in Neural Information Processing Systems; Curran Associates, Inc.: Red Hook, NY, USA, 2020; Volume 33, pp. 17721–17732. [Google Scholar]
  45. Bolya, D.; Zhou, C.; Xiao, F.; Lee, Y.J. YOLACT: Real-Time Instance Segmentation. In Proceedings of the 2019 IEEE/CVF International Conference on Computer Vision (ICCV), Seoul, Republic of Korea, 27 October–2 November 2019; pp. 9156–9165. [Google Scholar]
  46. Reis, D.; Kupec, J.; Hong, J.; Daoudi, A. Real-Time Flying Object Detection with YOLOv8. arXiv 2024, arXiv:2305.09972v2. [Google Scholar]
  47. Miao, Z.; Yu, X.; Li, N.; Zhang, Z.; He, C.; Li, Z.; Deng, C.; Sun, T. Efficient Tomato Harvesting Robot Based on Image Processing and Deep Learning. Precis. Agric. 2023, 24, 254–287. [Google Scholar] [CrossRef]
  48. Verk, J.; Hernavs, J.; Klančnik, S. Using a Region-Based Convolutional Neural Network (R-CNN) for Potato Segmentation in a Sorting Process. Foods 2025, 14, 1131. [Google Scholar] [CrossRef] [PubMed]
  49. Xiao, Y.; Tian, Z.; Yu, J.; Zhang, Y.; Liu, S.; Du, S.; Lan, X. A Review of Object Detection Based on Deep Learning. Multimed. Tools Appl. 2020, 79, 23729–23791. [Google Scholar] [CrossRef]
  50. Ruiz-Santaquiteria, J.; Bueno, G.; Deniz, O.; Vallez, N.; Cristobal, G. Semantic versus Instance Segmentation in Microscopic Algae Detection. Eng. Appl. Artif. Intell. 2020, 87, 103271. [Google Scholar] [CrossRef]
  51. Liu, Z.; Lin, Y.; Cao, Y.; Hu, H.; Wei, Y.; Zhang, Z.; Lin, S.; Guo, B. Swin Transformer: Hierarchical Vision Transformer Using Shifted Windows. In Proceedings of the 2021 IEEE/CVF International Conference on Computer Vision (ICCV), Montreal, BC, Canada, 11–17 October 2021; pp. 9992–10002. [Google Scholar]
Figure 1. Composition of dataset images. (a) Base dataset: 1578 self-collected + 442 from Labor_tomato_big; (b) data augmentation (220 images): boosts generalization and reduces overfitting.
Agronomy 15 01273 g001
Figure 2. Tomato image instance segmentation annotations. (a) Tomato RGB sample images; (b) instance segmentation annotated images of tomatoes; (c) mask images of tomato fruit regions.
Agronomy 15 01273 g002
Figure 3. TQVGModel architecture diagram. (a) IncepConvV2 for feature extraction; (b) FPN for multi-scale feature fusion; (c) RPN for region proposal generation; (d) prediction head for output generation; (e) tomato quality classification module.
Agronomy 15 01273 g003
Figure 4. IncepConvV2 block design diagram. (a) Architectural diagram of the Swin Transformer block; (b) Resnet block design architecture diagram; (c) ConvNeXtV2 block design architecture diagram; (d) IncepConvV2 block design architecture diagram.
Agronomy 15 01273 g004
Figure 5. Backbone network architecture diagram. (a) ResNet50 backbone network architecture; (b) ConvNxtV2-Tiny backbone network architecture; (c) the architecture of our IncepConvV2-Tiny backbone network.
Agronomy 15 01273 g005
Figure 6. FCMAE network architecture diagram.
Agronomy 15 01273 g006
Figure 7. E-Sobel operator effect diagram.
Agronomy 15 01273 g007
Figure 8. Tomato quality visual grading flowchart. (A) Tomato training and recognition process; (B) Tomato quality analysis process; (C) Quality grading results.
Agronomy 15 01273 g008
Figure 9. Performance metric parameters during training. (a) Loss curve during training; (b) mAP curve on validation set during training; (c) network recall rate curve during training; (d) network F1-score curve during training.
Agronomy 15 01273 g009
Figure 10. Ablation module effect comparison.
Agronomy 15 01273 g010aAgronomy 15 01273 g010bAgronomy 15 01273 g010cAgronomy 15 01273 g010dAgronomy 15 01273 g010e
Figure 11. Performance of backbone networks with different parameter sizes. (a) Box mAP of different backbone network series; (b) mask mAP of different backbone network series.
Agronomy 15 01273 g011
Figure 12. Backbone network channel feature maps, the black areas represent feature activation intensity, where darker shades indicate fewer effective features. The yellow zones denote feature oversaturation, while the green regions signify normal feature activation.
Agronomy 15 01273 g012
Figure 13. Comparison of feature metrics at different stages for different backbone networks. (a) Network entropy values at different stages; (b) network cosine similarity at different stages; (c) network feature separability at different stages; (d) network sparsity at different stages.
Agronomy 15 01273 g013
Figure 14. Demonstration of edge segmentation quality improvement using Enhanced Sobel operator. (a) Fully ripened tomato RGB sample images; (b) segmentation quality visualization of Mask r-CNN without Enhanced Sobel operator implementation; (c) segmentation quality visualization of Mask r-CNN with Enhanced Sobel operator integration.
Agronomy 15 01273 g014
Table 1. IncepConvV2 series network structure table.
ModelDepthsDimsParameters (M)
IncepConvV2-Atto(2, 2, 6, 2)(40, 80, 160, 320)3.7 M
IncepConvV2-Femto(2, 2, 6, 2)(48, 96, 192, 384)6.4 M
IncepConvV2-Pico(2, 2, 6, 2)(64, 128, 256, 512)9.3 M
IncepConvV2-Nano(2, 2, 8, 2)(80, 160, 320, 640)15.5 M
IncepConvV2-Tiny(3, 3, 9, 3)(96, 192, 384, 768)28 M
IncepConvV2-base(3, 3, 27, 3)(128, 256, 512, 1024)87 M
IncepConvV2-Large(3, 3, 27, 3)(192, 384, 768, 1536)189 M
IncepConvV2-huge(3, 3, 27, 3)(256, 512, 1024, 2048)650 M
Table 2. Hardware and software configuration.
Hardware or SoftwareConfiguration
CPUIntel i9-10900K
RAM24 GB
SSD1024 GB
GPUNVIDIA GeForce GTX 3090Ti 24 GB
Development environmentPython3.8, Pytorch2.0.1, CUDA12.6
Table 3. Ablation experiment results, where √ indicates the module is used and × denotes the module is excluded.
ModelIncepConvV2CB LossE-SobelmAPRecallF1-ScoreParams
Mask R-CNN×××72.45%66.05%69.10%44.18 M
Mask R-CNN-A××76.36%71.04%73.60%33.88 M
Mask R-CNN-B×78.03%74.83%76.40%33.88 M
TQVGModel80.51%75.81%78.09%33.98 M
Table 4. The impact of different γ values in the loss function on model performance.
Experiment Numberγ ValuemAP (%)Recall (%)F1-Score (%)Training Time (h)
10.575.12%71.36%73.19%5.5382
21.077.47%72.89%75.11%5.8567
31.578.03%74.83%76.40%6.1097
42.076.81%72.73%73.93%6.5692
52.575.98%72.94%74.43%6.7776
63.075.05%72.29%73.64%7.3125
Table 5. Performance parameters of different image instance segmentation algorithms.
Segmentation AlgorithmTotal Parameters (M)Average Inference Time (ms)mAP%
SOLO V286.67 M60.3272.57%
YOLACT36.83 M31.4371.41%
YOLOV8s-Seg11.4 M25.5673.01%
Mask R-CNN44.18 M69.9873.31%
TQVGModel-Atto24.78 M45.2475.03%
TQVGModel-Tiny33.98 M53.3880.05%
Disclaimer/Publisher’s Note: The statements, opinions and data contained in all publications are solely those of the individual author(s) and contributor(s) and not of MDPI and/or the editor(s). MDPI and/or the editor(s) disclaim responsibility for any injury to people or property resulting from any ideas, methods, instructions or products referred to in the content.

