

Optimizing Stem Strength and Yield Stability by Combining Controlled-Release Nitrogen Fertilizer and Urea Application Across Different Sowing Dates
 ,
,  ,
, 
 ,
,  and
and 
Abstract
1. Introduction
2. Materials and Methods
2.1. Planting Location and Experimental Materials
2.2. Experimental Design and Planting Management
2.3. Sampling and Determination
2.3.1. Grain Yield and Yield Components
2.3.2. Plant Morphological Characteristics
2.3.3. Morphological Traits of the Second Internode
2.3.4. Lodging Resistance Trait
2.4. Statistical Analysis
3. Results
3.1. Grain Yield
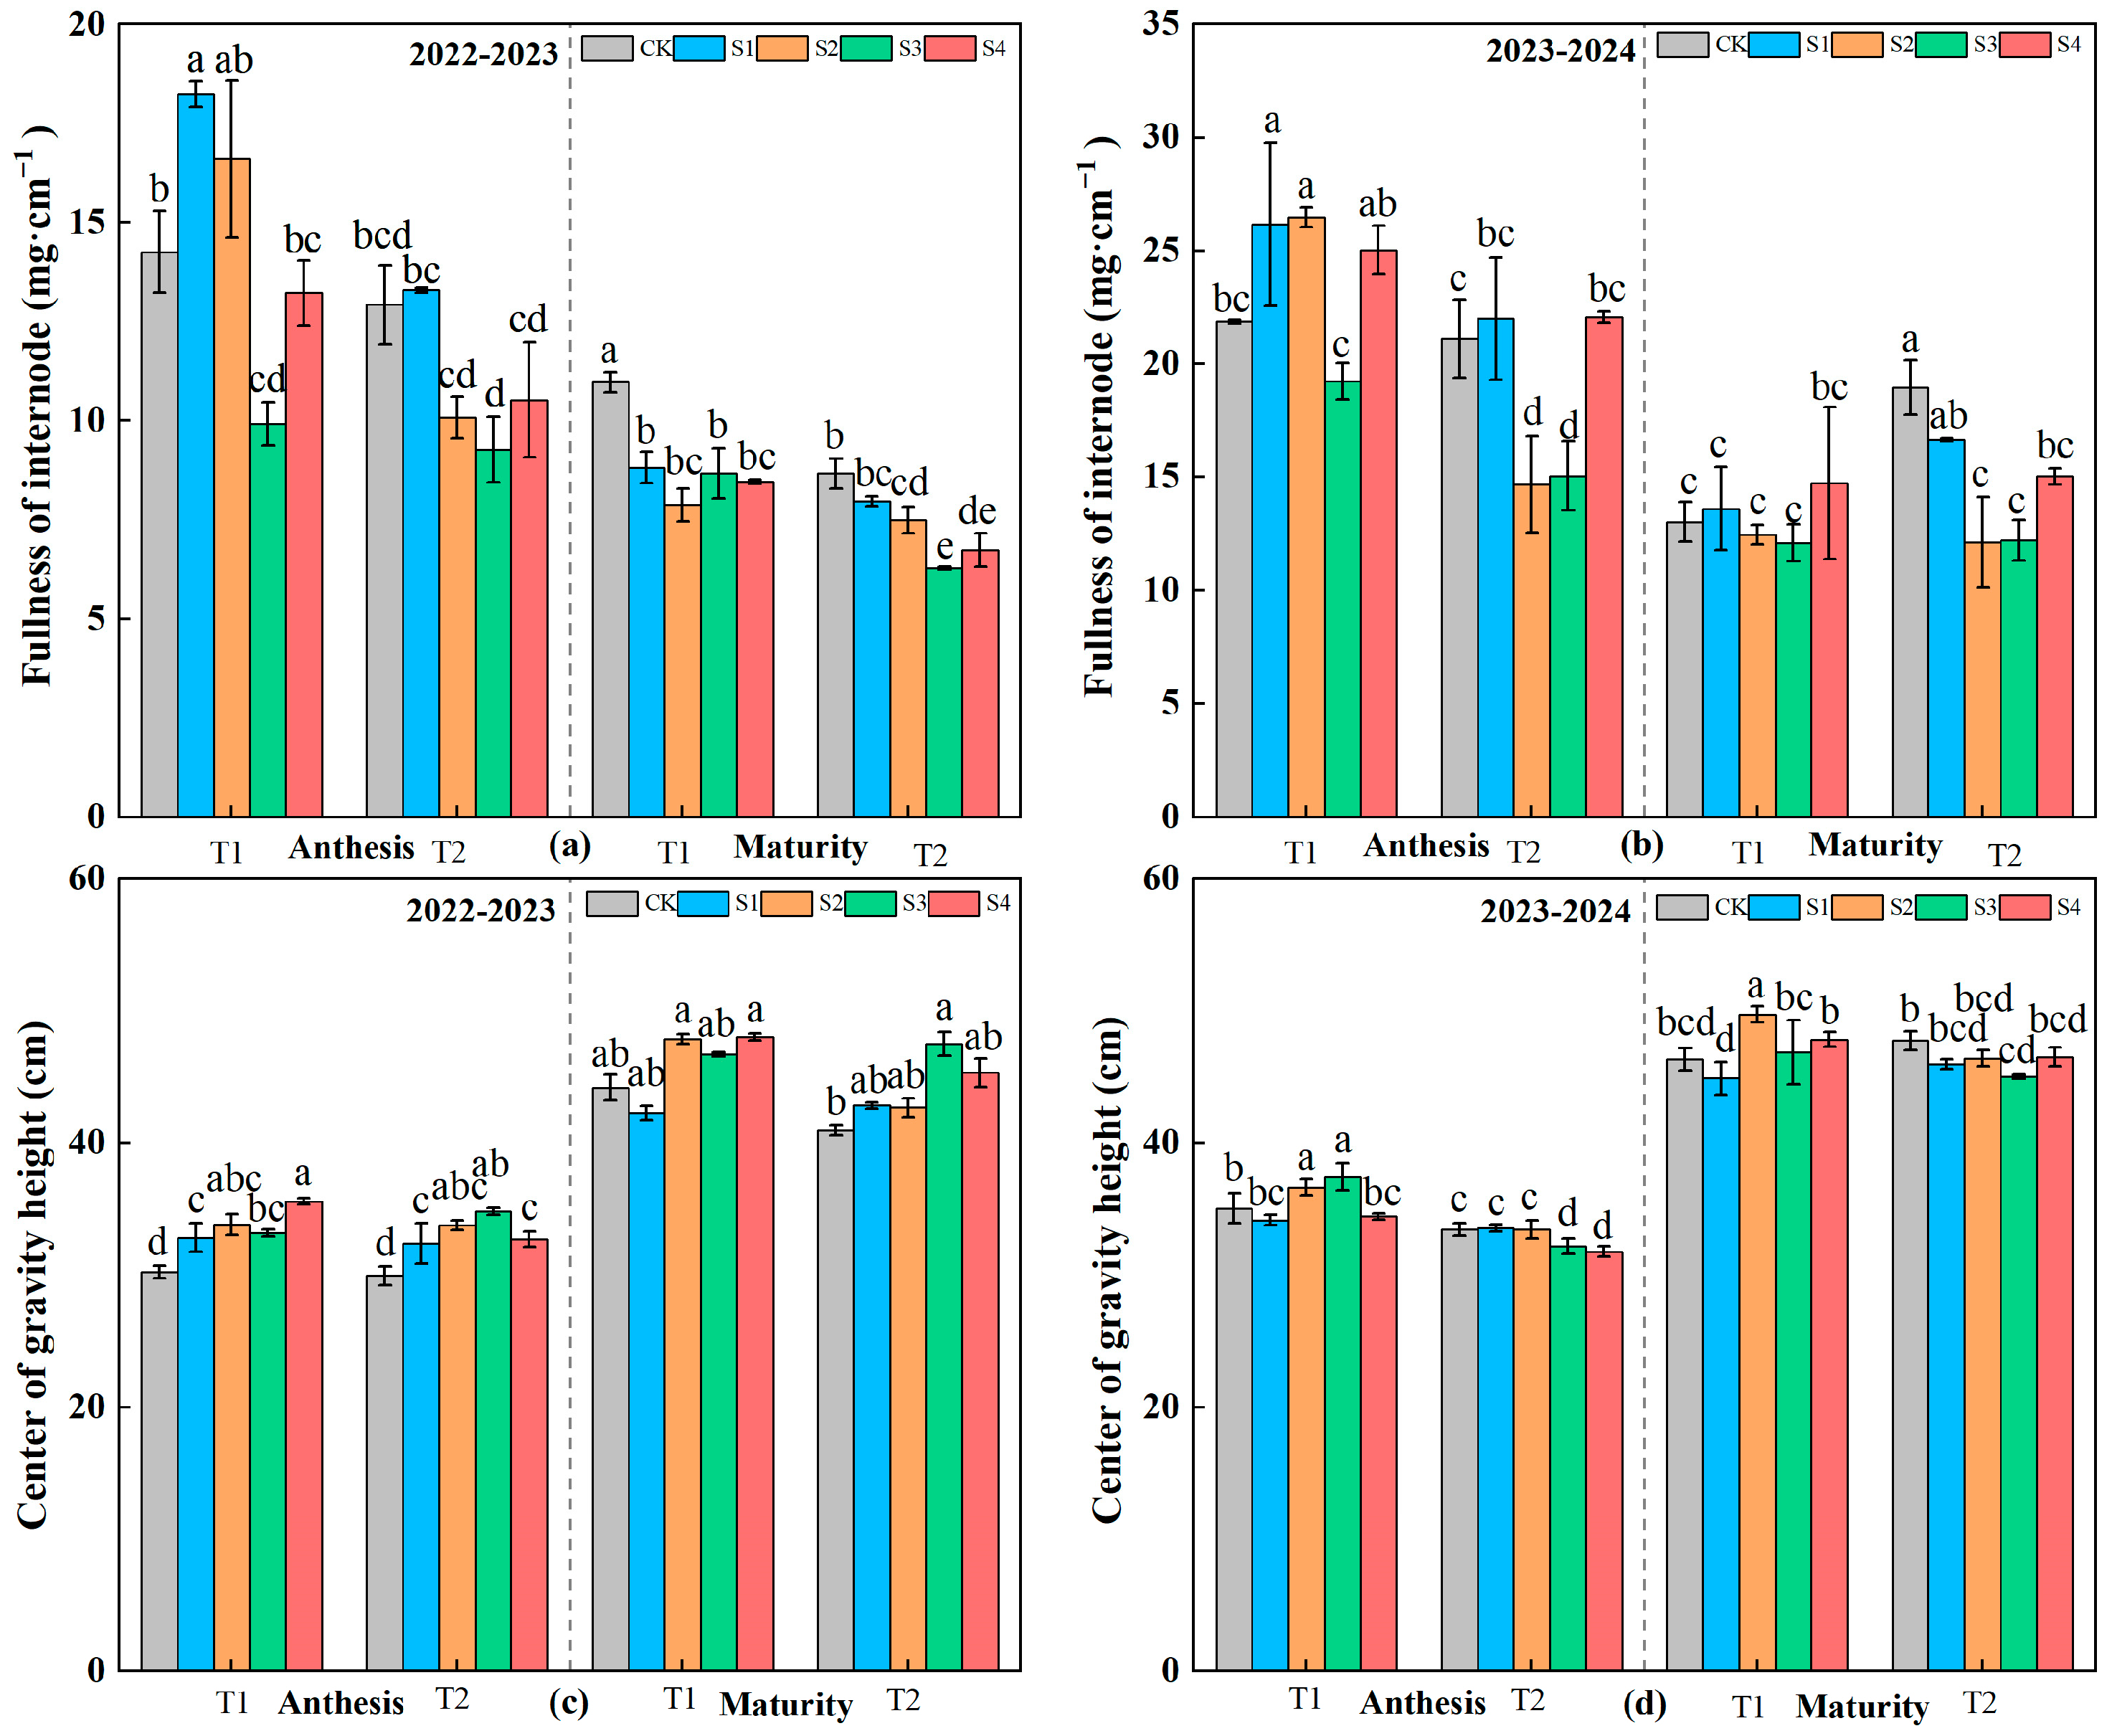
3.2. Morphological Characteristics
3.3. Traits of the Second Internode
3.4. Lodging Resistance Trait
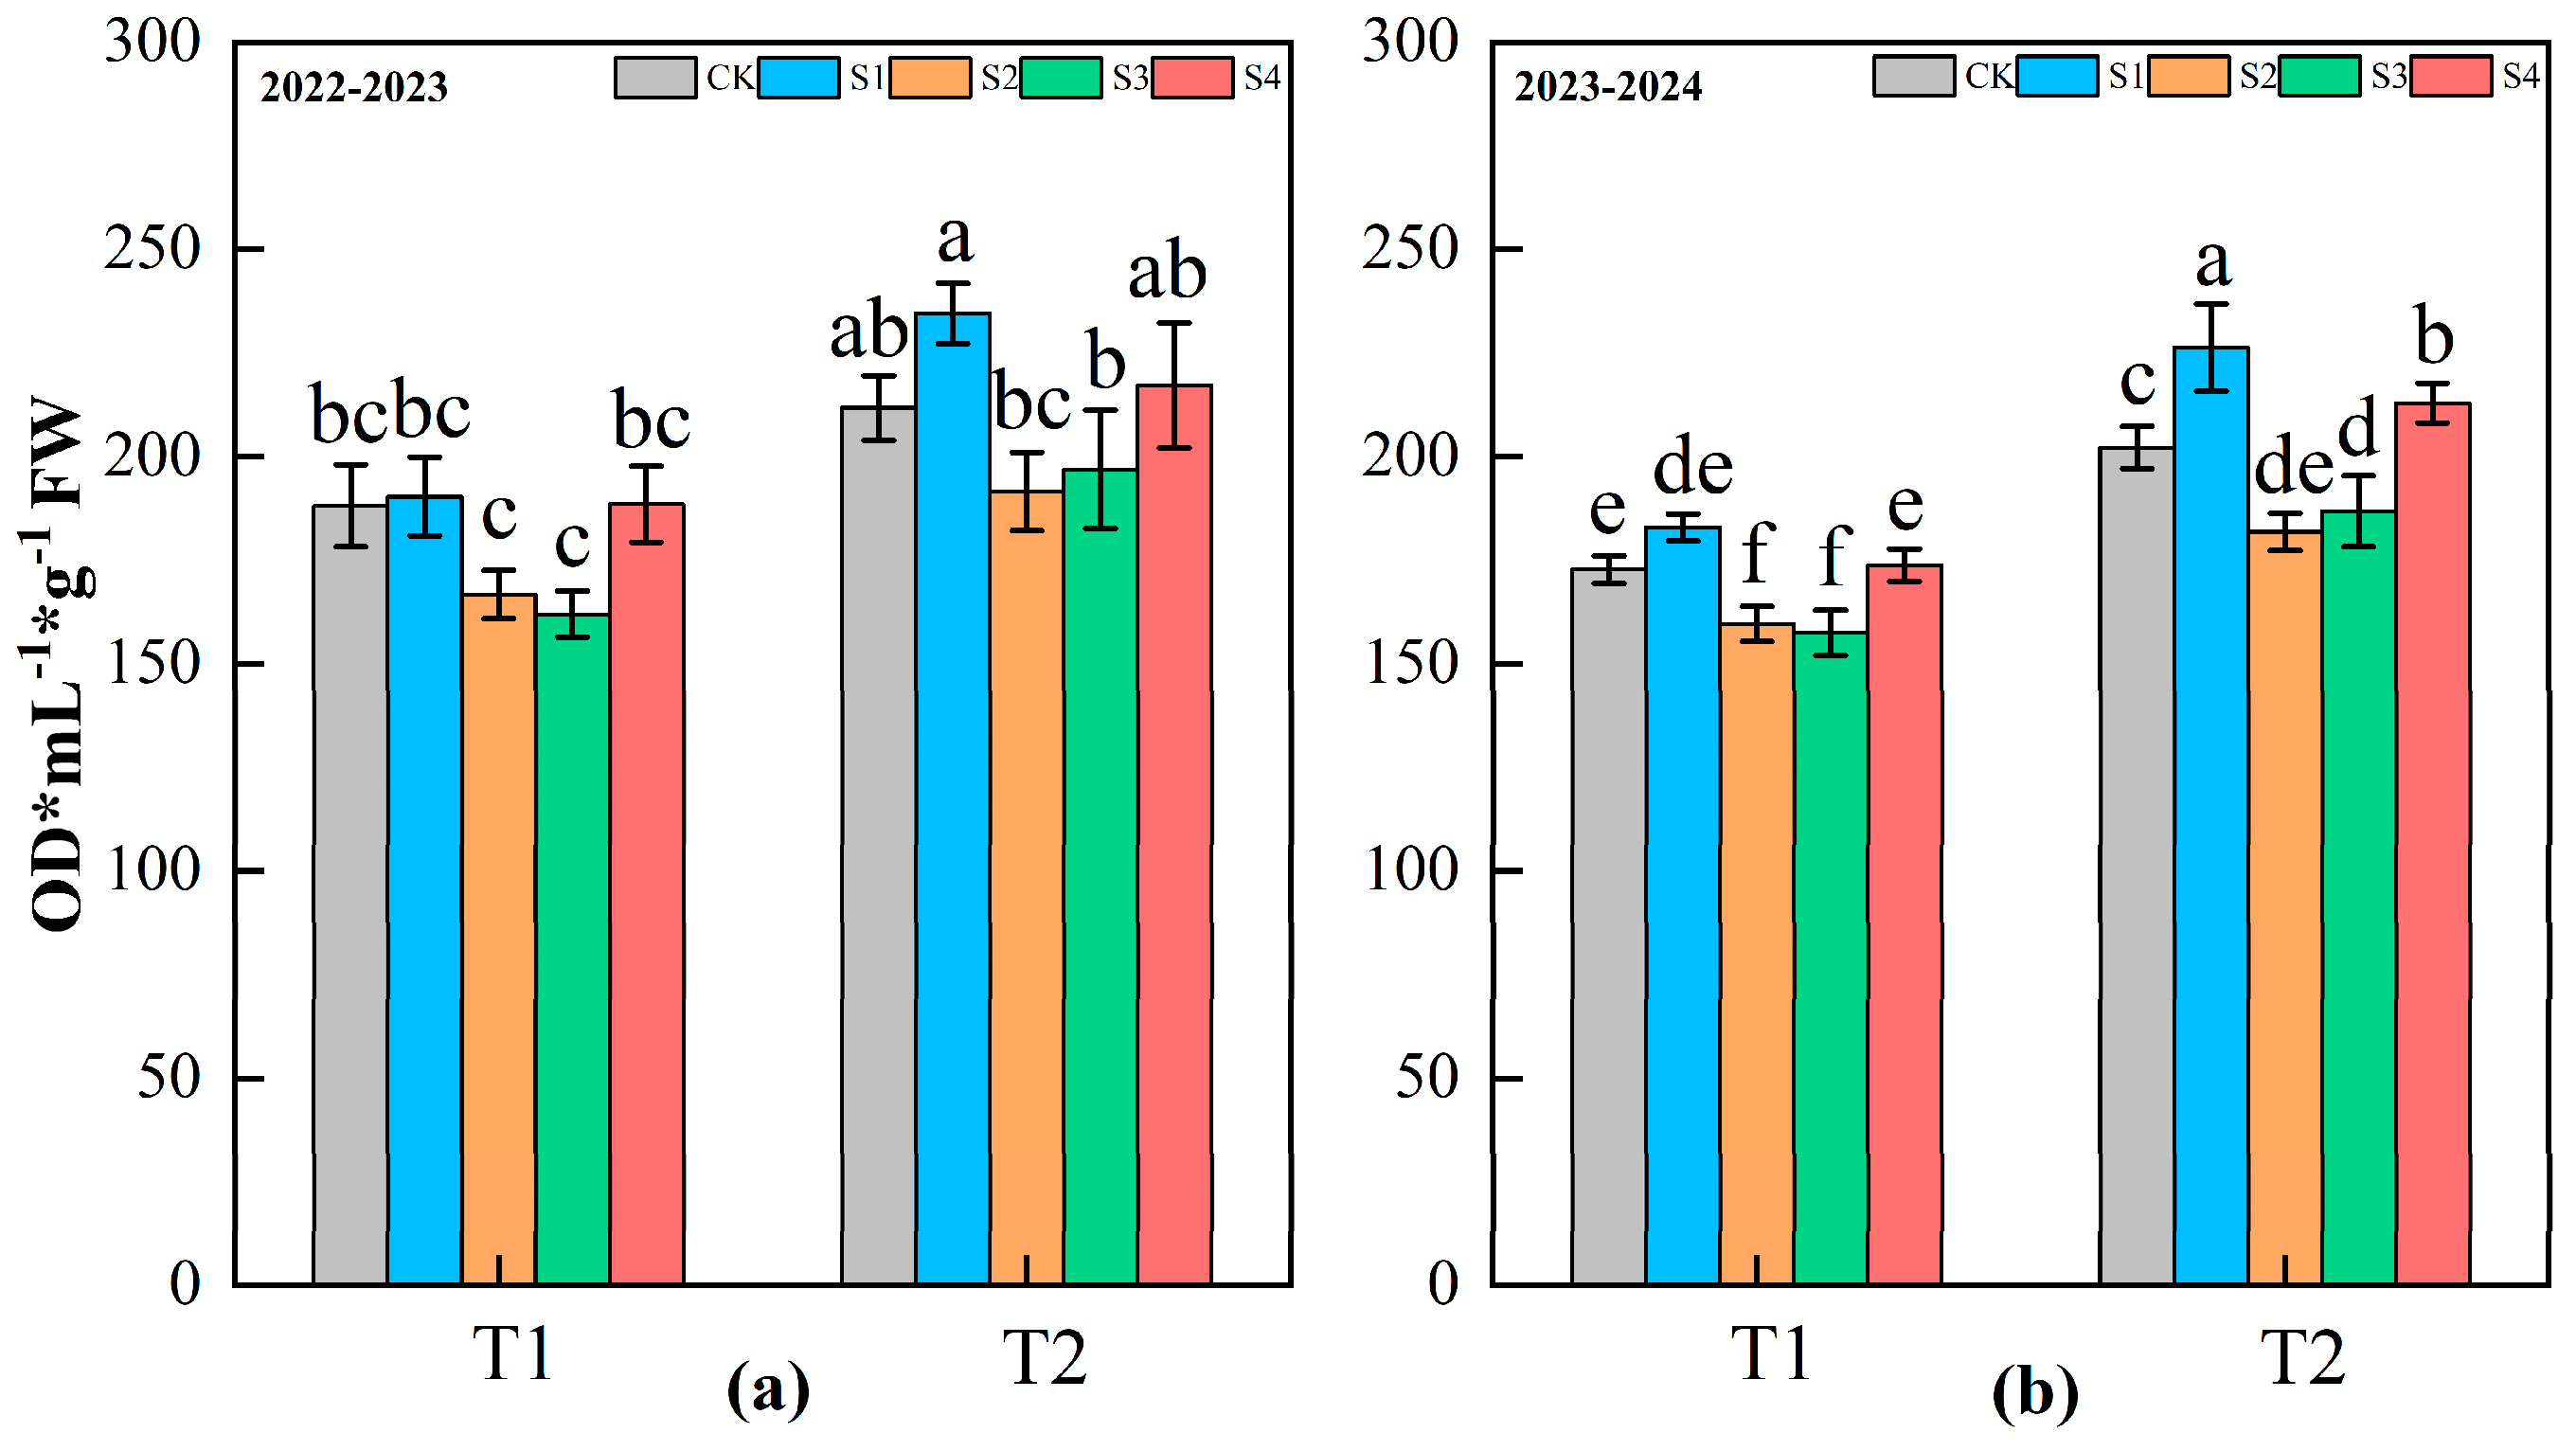
3.5. Lignin Content
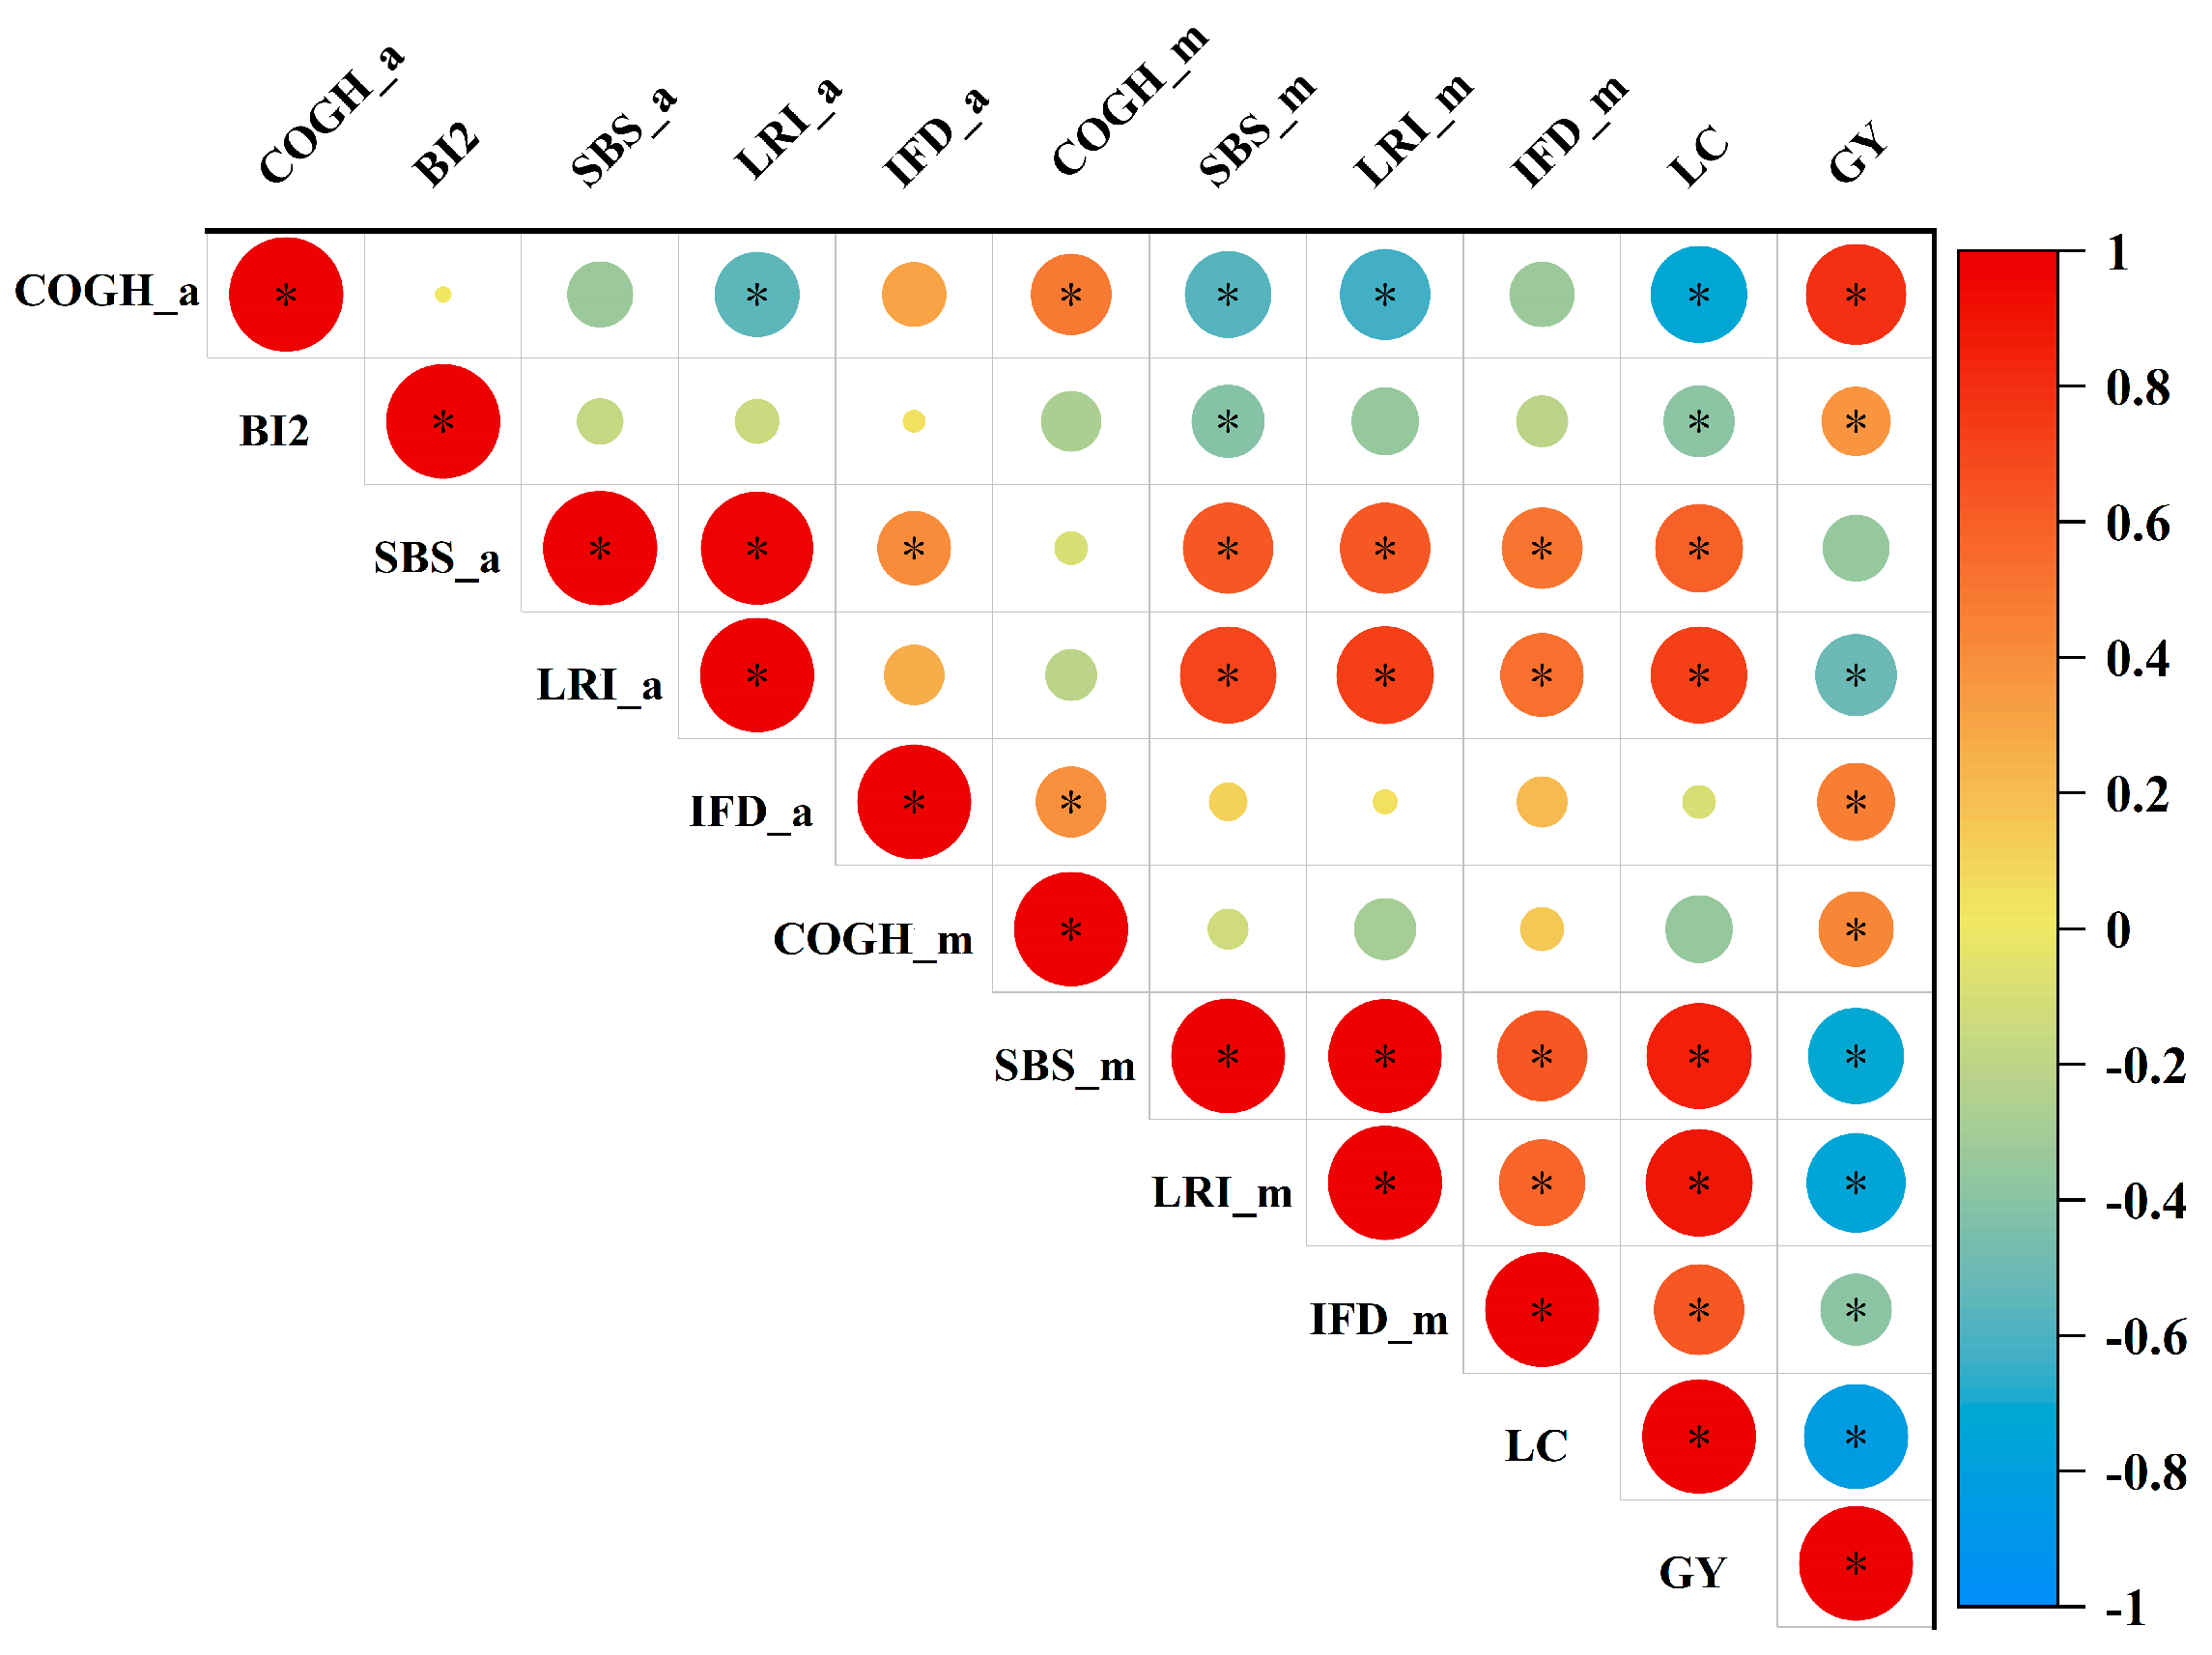
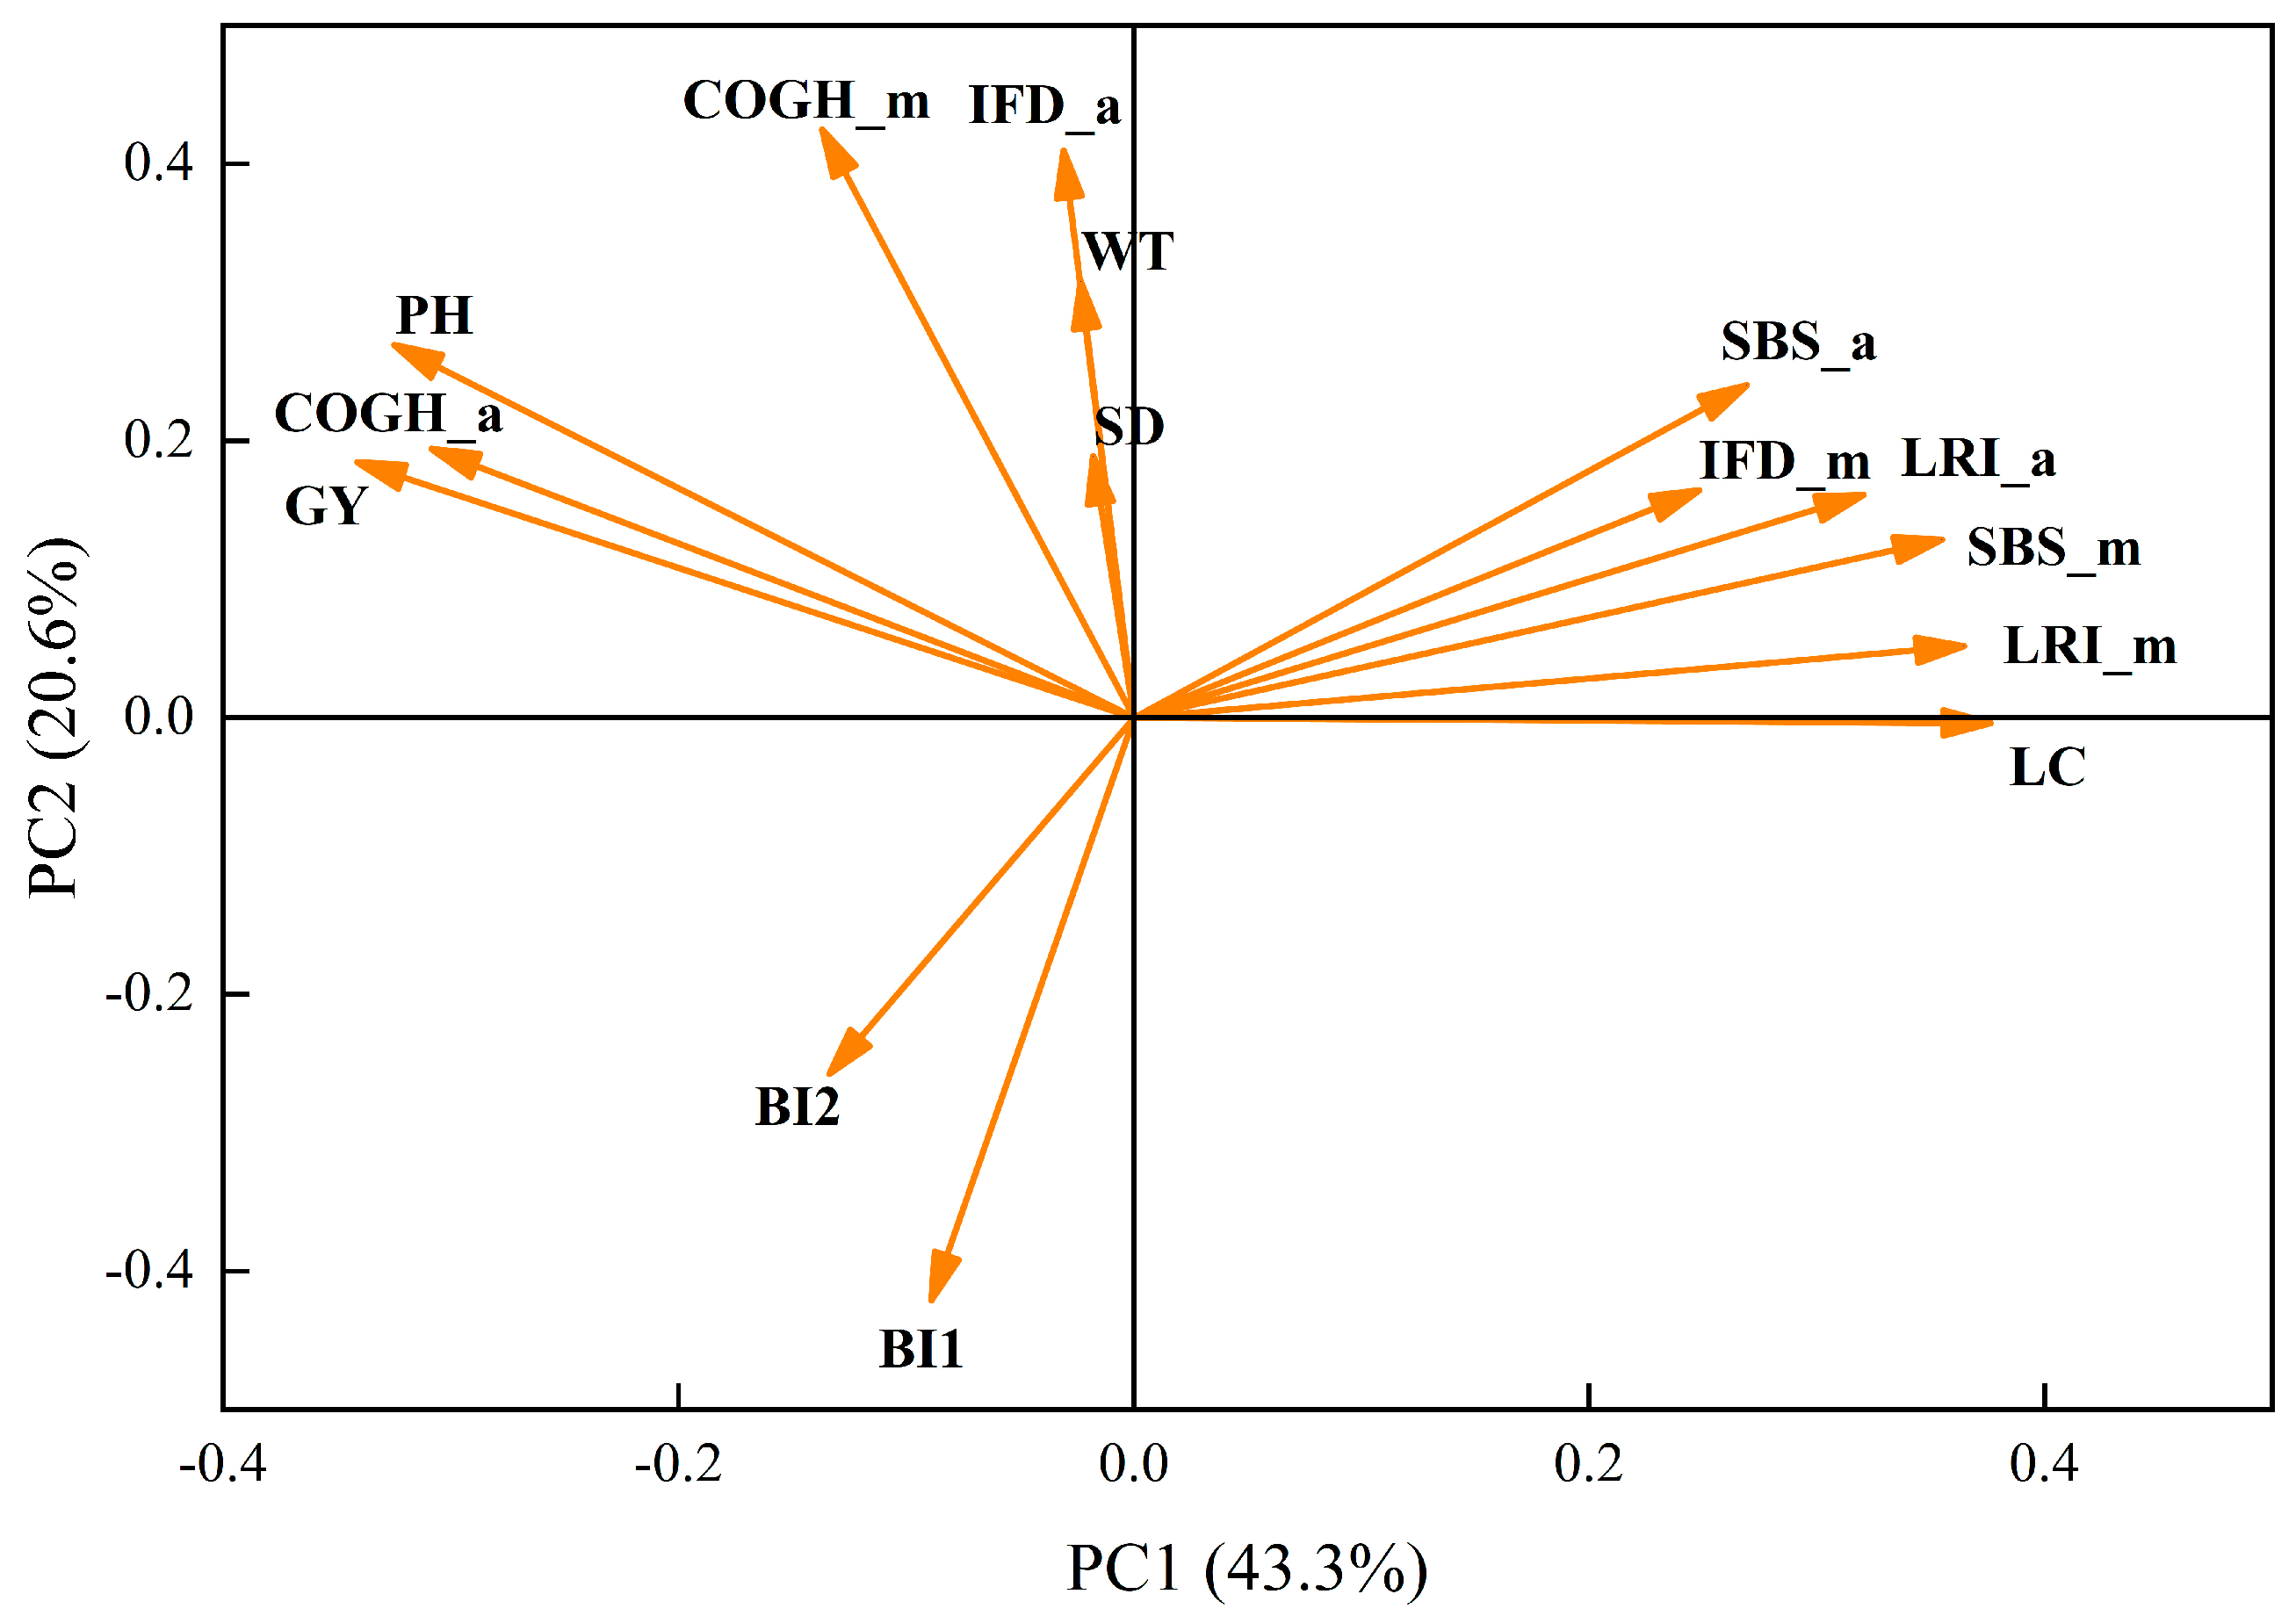
3.6. Correlation and Principal Component Analysis (PCA)
0.382X11 + 0.388X12 + 0.277X13 + 0.394X14
0.083X11 + 0.001X12 + 0.121X13 − 0.049X14
0.023X11 − 0.013X12 + 0.112X13 − 0.092X14
4. Discussion
4.1. Relationship Between Stem Characteristics and Lodging
4.2. Effects of Sowing Time and Fertilization Application Regimes on Lodging Resistance
4.3. Comprehensive Evaluation of Yield and Lodging Resistance
5. Conclusions
Author Contributions
Funding
Data Availability Statement
Conflicts of Interest
Abbreviations
| CRNF | Controlled-release nitrogen fertilizer |
| NUE | Nitrogen use efficiency |
| LRI | Lodging resistance index |
| GCH | Gravity center height |
| ST | Stem diameter |
| IFD | Internode filling degree |
References
- Pan, W.L.; Kidwell, K.K.; McCracken, V.A.; Bolton, R.P.; Allen, M. Economically optimal wheat yield, protein and nitrogen use component responses to varying n supply and genotype. Front. Plant Sci. 2020, 10, 1790. [Google Scholar] [CrossRef] [PubMed]
- United Nations, Department of Economic and Social Affairs. World Population Prospects: The 2024 Revision; Population Division; UN Department of Economic and Social Affairs: New York, NY, USA, 2024; Available online: https://population.un.org/wpp (accessed on 11 January 2025).
- Food and Agriculture Organization of the United Nations; International Fund for Agricultural Development; UNICEF; World Food Programme; World Health Organization. The State of Food Security and Nutrition in the World 2024; FAO: Rome, Italy, 2024. [Google Scholar]
- Wheeler, T.; von Braun, J. Climate change impacts on global food security. Science 2013, 341, 508–513. [Google Scholar] [CrossRef]
- Liu, S.; Mo, X.; Lin, Z.; Xu, Y.; Ji, J.; Wen, G.; Richey, J. Crop yield responses to climate change in the Huang-Huai-Hai Plain of China. Agric. Water Manag. 2010, 97, 1195–1209. [Google Scholar] [CrossRef]
- Neupane, D.; Adhikari, P.; Bhattarai, D.; Rana, B.; Ahmed, Z.; Sharma, U.; Adhikari, D. Does climate change affect the yield of the top three cereals and food security in the world? Earth 2022, 3, 45–71. [Google Scholar] [CrossRef]
- Qian, Y.; Zhao, Z.; Cao, Y.; Ma, Q.; Zhu, N.; Song, L.; Zhu, M.; Li, C.; Ding, J.; Guo, W.; et al. Renewal of wheat cultivars enhances ozone resistance in yield but detrimentally impacts quality: A survey of Chinese wheat. Front. Plant Sci. 2025, 15, 1526846. [Google Scholar] [CrossRef] [PubMed]
- Xiao, D.; Moiwo, J.P.; Tao, F.; Yang, Y.; Shen, Y.; Xu, Q.; Liu, J.; Zhang, H.; Liu, F. Spatiotemporal variability of winter wheat phenology in response to weather and climate variability in China. Mitig. Adapt. Strat. Gl. 2015, 10, 1191–1202. [Google Scholar] [CrossRef]
- Manfron, G.; Delmotte, S.; Busetto, L.; Hossard, L.; Ranghetti, L.; Brivio, P.A.; Boschetti, M. Estimating inter-annual variability in winter wheat sowing dates from satellite time series in Camargue, France. Int. J. Appl. Earth Obs. 2017, 57, 190–201. [Google Scholar] [CrossRef]
- Xiao, D.; Tao, F.; Liu, Y.; Shi, W.; Wang, M.; Liu, F.; Zhang, S.; Zhu, Z. Observed changes in winter wheat phenology in the North China Plain for 1981–2009. Int. J. Biometeorol. 2013, 57, 275–285. [Google Scholar] [CrossRef]
- Sofield, I.; Evans, L.T.; Cook, M.G.; Wardlaw, I.F. Factors influencing the rate and duration of grain filling in wheat. Aust. J. Plant Physiol. 1977, 4, 785–797. [Google Scholar] [CrossRef]
- Shah, A.N.; Tanveer, M.; Rehman, A.U.; Anjum, S.A.; Iqbal, J.; Ahmad, R. Lodging stress in cereal–effects and management: An overview. Environ. Sci. Pollut. R. 2017, 24, 5222–5237. [Google Scholar] [CrossRef] [PubMed]
- Cai, T.; Peng, D.; Wang, R.; Jia, X.; Qiao, D.; Liu, T.; Jia, Z.; Wang, Z.; Ren, X. Can Intercropping or mixed cropping of two genotypes enhance wheat lodging resistance? Field Crops Res. 2019, 239, 10–18. [Google Scholar] [CrossRef]
- Wang, X.; Zhang, J.; Wang, X.; Hu, Y.; Ren, X.; Jia, Z.; Liu, T.; Wang, Z.; Cai, T. Non-uniform wheat population distribution enhances wheat yield and lodging resistance synchronously. Eur. J. Agron. 2023, 152, 127033. [Google Scholar] [CrossRef]
- Zheng, M.; Chen, J.; Shi, Y.; Li, Y.; Yin, Y.; Yang, D.; Luo, Y.; Pang, D.; Xu, X.; Li, W.; et al. Manipulation of lignin metabolism by plant densities and its relationship with lodging resistance in wheat. Sci. Rep. 2017, 7, 41805. [Google Scholar] [CrossRef]
- Khush, G.S. Green revolution: Preparing for the 21st century. Genome 1999, 42, 646–655. [Google Scholar] [CrossRef] [PubMed]
- Qian, Y.; Ma, Q.; Ren, Z.; Zhu, G.; Zhu, X.; Zhou, G. Optimizing the growth of silage maize by adjusting planting density and nitrogen application rate based on farmers’ conventional planting habits. Agronomy 2023, 13, 2785. [Google Scholar] [CrossRef]
- Donaldson, E.; Schillinger, W.F.; Dofing, S.M. Straw Production and grain yield relationships in winter wheat. Crop Sci. 2001, 41, 100–106. [Google Scholar] [CrossRef]
- Guertal, E.A. Preplant slow-release nitrogen fertilizers produce similar bell pepper yields as split applications of soluble fertilizer. Agron. J. 2000, 92, 388–393. [Google Scholar] [CrossRef]
- Hu, C.; Sadras, V.O.; Lu, G.; Zhang, P.; Han, Y.; Liu, L.; Xie, J.; Yang, X.; Zhang, S. A global meta-analysis of split nitrogen application for improved wheat yield and grain protein content. Soil. Till. Res. 2021, 213, 105111. [Google Scholar] [CrossRef]
- Shakoor, A.; Xu, Y.; Wang, Q.; Chen, N.; He, F.; Zuo, H.; Yin, H.; Yang, X.; Ma, Y.; Yang, S. Effects of fertilizer application schemes and soil environmental factors on nitrous oxide emission fluxes in a rice-wheat cropping system, east China. PLoS ONE 2018, 13, e0202016. [Google Scholar] [CrossRef]
- Gao, X.; Li, C.; Zhang, M.; Wang, R.; Chen, B. Controlled release urea improved the nitrogen use efficiency, yield and quality of potato (Solanum tuberosum L.) on silt loamy soil. Field Crops Res. 2015, 181, 60–68. [Google Scholar] [CrossRef]
- Ahmad, S.; Nadeem, M.Y.; Gao, S.; Li, Q.; Ding, Y.; Liu, Z.; Jiang, Y.; Li, W.; Li, G. Subsurface placement of controlled-release blended fertilizers mitigates ammonia volatilization by promoting nitrogen transformation in rice fields. Agric. Ecosyst. Environ. 2025, 386, 109624. [Google Scholar] [CrossRef]
- Lyu, Y.; Yang, X.; Pan, H.; Zhang, X.; Cao, H.; Ulgiati, S.; Wu, J.; Zhang, Y.; Wang, G.; Xiao, Y. Impact of fertilization schemes with different ratios of urea to controlled release nitrogen fertilizer on environmental sustainability, nitrogen use efficiency and economic benefit of rice production: A study case from Southwest China. J. Clean Prod. 2021, 293, 126198. [Google Scholar] [CrossRef]
- Yang, Y.; Zhang, M.; Zheng, L.; Cheng, D.; Liu, M.; Geng, Y. Controlled release urea improved nitrogen use efficiency, yield, and quality of wheat. Agron. J. 2011, 103, 479–485. [Google Scholar] [CrossRef]
- Li, W.; Ahmad, S.; Liu, D.; Gao, S.; Wang, Y.; Tao, W.; Chen, L.; Liu, Z.; Jiang, Y.; Li, G.; et al. Subsurface banding of blended controlled-release urea can optimize rice yields while minimizing yield-scaled greenhouse gas emissions. Crop J. 2023, 11, 914–921. [Google Scholar] [CrossRef]
- Guo, L.; Ning, T.; Nie, L.; Li, Z.; Lal, R. Interaction of deep placed controlled-release urea and water retention agent on nitrogen and water use and maize yield. Eur. J. Agron. 2016, 75, 118–129. [Google Scholar] [CrossRef]
- Zhang, G.; Zhao, D.; Liu, S.; Liao, Y.; Han, J. Can controlled-release urea replace the split application of normal urea in China? A meta-analysis based on crop grain yield and nitrogen use efficiency. Field Crops Res. 2022, 275, 108343. [Google Scholar] [CrossRef]
- Ma, Q.; Wang, M.; Zheng, G.; Yao, Y.; Tao, R.; Zhu, M.; Ding, J.; Li, C.; Guo, W.; Zhu, X. Twice-split application of controlled-release nitrogen fertilizer met the nitrogen demand of winter wheat. Field Crops Res. 2021, 267, 108163. [Google Scholar] [CrossRef]
- Hu, Q.; Jiang, W.; Ma, Z.; Cheng, S.; Liu, G.; Gu, D.; Zhang, H.; Wei, H. One-time mixed nitrogen fertilizers application enhances yield and eating quality of late-maturing medium japonica rice in the Yangtze River Delta. Agronomy 2024, 13, 3047. [Google Scholar] [CrossRef]
- Zhou, T.; Cui, R.; Shu, C.; Zhu, K.; Zhang, W.; Zhang, H.; Liu, L.; Wang, Z.; Gu, J.; Yang, J. Combining urea and controlled release nitrogen fertilizer to enhance lodging resistance of rice (Oryza sativa L.) by altering accumulation of silicon and cell wall polymers at high yielding levels. Field Crops Res. 2024, 315, 109459. [Google Scholar] [CrossRef]
- Cheng, S.; Xing, Z.; Tian, C.; Weng, W.; Hu, Q.; Zhang, H. Optimization of one-time fertilization scheme achieved the balance of yield, quality and economic benefits of direct-seeded rice. Plants 2023, 12, 2047. [Google Scholar] [CrossRef]
- Luo, M.; Liu, Y.; Li, J.; Gao, T.; Wu, S.; Wu, L.; Lai, X.; Xu, H.; Hu, H.; Ma, Y. Effects of straw returning and new fertilizer substitution on rice growth, yield, and soil properties in the Chaohu Lake Region of China. Plants 2024, 13, 444. [Google Scholar] [CrossRef] [PubMed]
- Kumar, S.; Khanna, M. Distributional heterogeneity in climate change impacts and adaptation: Evidence from Indian agriculture. Agric. Econ. 2023, 54, 147–160. [Google Scholar] [CrossRef]
- Grosse-Heilmann, M.; Cristiano, E.; Deidda, R.; Viola, F. Durum wheat productivity today and tomorrow: A review of influencing factors and climate change effects. Resour. Environ. Sustain. 2024, 17, 100170. [Google Scholar] [CrossRef]
- Bassu, S.; Asseng, S.; Motzo, R.; Giunta, F. Optimising sowing date of durum wheat in a variable mediterranean environment. Field Crop Res. 2009, 111, 109–118. [Google Scholar] [CrossRef]
- Kourat, T.; Smadhi, D.; Madani, A. Modeling the Impact of Future Climate Change Impacts on Rainfed Durum Wheat Production in Algeria. Climate 2022, 10, 50. [Google Scholar] [CrossRef]
- Wen, P.; Wei, Q.; Zheng, L.; Rui, Z.; Niu, M.; Gao, C.; Guan, X.; Wang, T.; Xiong, S. Adaptability of wheat to future climate change: Effects of sowing date and sowing rate on wheat yield in three wheat production regions in the North China Plain. Sci. Total Environ. 2023, 901, 165906. [Google Scholar] [CrossRef]
- Chen, X.; Liu, Q.; Zheng, B.; Li, J. Optimized Phosphorus Application Enhances Wheat Stem Lodging Resistance Under Spring Low-Temperature Stress. Plants 2024, 13, 2980. [Google Scholar] [CrossRef]
- Shah, F.; Li, Z.; Fu, M.; Li, C.; Wu, W. Mitigating wheat lodging through varietal selection and nitrogen management. Food Energy Secur. 2025, 14, e70071. [Google Scholar] [CrossRef]
- Khan, A.; Ahmad, A.; Ali, W.; Hussain, S.; Ajayo, B.S.; Raza, M.A.; Kamran, M.; Te, X.; al Amin, N.; Ali, S.; et al. Optimization of plant density and nitrogen regimes to mitigate lodging risk in wheat. Agron. J. 2021, 112, 2535–2551. [Google Scholar] [CrossRef]
- Stapper, M.; Fischer, R. Genotype, sowing date and plant spacing influence on high-yielding irrigated wheat in southern New South Wales. II. Growth, yield and nitrogen use. Aust. J. Agric. Res. 1990, 41, 1021. [Google Scholar] [CrossRef]
- Li, B.; Gao, F.; Ren, B.; Dong, S.; Liu, P.; Zhao, B.; Zhang, J. Lignin metabolism regulates lodging resistance of maize hybrids under varying planting density. J. Integr. Agric. 2021, 20, 2077–2089. [Google Scholar] [CrossRef]
- Mu, H.; Wang, Z.; Sun, L.; Huang, Y.; Song, Y.; Zhang, R.; Wu, Z.; Fu, K.; Duan, J.; Kang, G.; et al. Optimizing nitrogen fertilization and planting density management enhances lodging resistance and wheat yield by promoting carbohydrate accumulation and single spike development. Crop Sci. 2024, 64, 3461–3479. [Google Scholar] [CrossRef]
- Dai, X.; Wang, Y.; Dong, X.; Qian, T.; Yin, L.; Dong, S.; Chu, J.; He, M. Delayed sowing can increase lodging resistance while maintaining grain yield and nitrogen use efficiency in winter wheat. Crop J. 2017, 5, 541–552. [Google Scholar] [CrossRef]
- Gulino, D.; Lopes, M.S. Phenological adaptation of wheat varieties to rising temperatures: Implications for yield components and grain quality. Plants 2024, 13, 2929. [Google Scholar] [CrossRef] [PubMed]
- Yin, L.; Dai, X.; He, M. Delayed sowing improves nitrogen utilization efficiency in winter wheat without impacting yield. Field Crops Res. 2018, 221, 90–97. [Google Scholar] [CrossRef]
- Eickhout, B.; Bouwman, A.F.; van Zeijts, H. The role of nitrogen in world food production and environmental sustainability. Agric. Ecosyst. Environ. 2006, 116, 4–14. [Google Scholar] [CrossRef]
- Li, C.; Chang, Y.; Luo, Y.; Li, W.; Jin, M.; Wang, Y.; Cui, H.; Sun, S.; Li, Y.; Wang, Z. Nitrogen regulates stem lodging resistance by breaking the balance of photosynthetic carbon allocation in wheat. Field Crops Res. 2023, 296, 108908. [Google Scholar] [CrossRef]
- Mangin, A.; Heuschele, J.; Brûlé-Babel, A.; Flaten, D.; Wiersma, J.; Lawley, Y. Rapid in situ nondestructive evaluation of lodging risk in dryland agronomic wheat research. Agron J. 2022, 114, 2822–2829. [Google Scholar] [CrossRef]
- Ma, Q.; Sun, Q.; Zhang, X.; Li, F.; Ding, Y.; Tao, R.; Zhu, M.; Ding, J.; Li, C.; Guo, W.; et al. Controlled-release nitrogen fertilizer management influences grain yield in winter wheat by regulating flag leaf senescence post-anthesis and grain filling. Food Energy Secur. 2022, 11, e361. [Google Scholar] [CrossRef]
- Mizuta, K.; Araki, H.; Takahashi, T. Shifting timing of intensive nitrogen topdressing later to the stem-elongation phase reduced lower internodes length and lodging risk of wheat. Plant Prod Sci. 2020, 23, 427–435. [Google Scholar] [CrossRef]
- Gao, Y.; Jiang, H.; Wu, B.; Niu, J.; Li, Y.; Guo, F.; Wang, L.; Blakney, A.J.C. The effects of planting density on lodging resistance, related enzyme activities, and grain yield in different genotypes of oilseed flax. Crop Sci. 2018, 58, 2613–2622. [Google Scholar] [CrossRef]
- Zhang, G.; Zhao, D.; Fan, H.; Liu, S.; Liao, Y.; Han, J. Combining controlled-release urea and normal urea with appropriate nitrogen application rate to reduce wheat stem lodging risk and increase grain yield and yield stability. J. Integr. Agric. 2023, 22, 3006–3021. [Google Scholar] [CrossRef]
- Zhu, N.; Qian, Y.; Song, L.; Yu, Q.; Sheng, H.; Li, Y.; Zhu, X. Regulating leaf photosynthesis and soil microorganisms through controlled-release nitrogen fertilizer can effectively alleviate the stress of elevated ambient ozone on winter wheat. Int. J. Mol. Sci. 2024, 25, 9381. [Google Scholar] [CrossRef]
- Ma, Q.; Tao, R.; Jia, W.; Zhu, M.; Ding, J.; Li, C.; Guo, W.; Zhou, G.; Zhu, X. Split application of polymercoated urea combined with common urea improved nitrogen efficiency without sacrificing wheat yield and benefits while saving 20% nitrogen input. Front. Plant Sci. 2024, 15, 1321900. [Google Scholar] [CrossRef]


| Items | Soil Properties | Year | |
|---|---|---|---|
| 2022 | 2023 | ||
| Soil basic fertility | Organic matter (g kg−1) | 23.1 | 21.7 |
| Alkali-hydrolyzable nitrogen (mg kg−1) | 131.0 | 116.1 | |
| Available phosphorus (mg kg−1) | 18.9 | 16.8 | |
| Available potassium (mg kg−1) | 80.0 | 89.2 | |
| pH | 6.7 | 7.8 | |
| Treatment | Growth Period | ||||
|---|---|---|---|---|---|
| Sowing | Tillering | Regreening | Jointing | Booting | |
| CK | 50% U | 10% U | 20% U | 20% U | |
| S1 | 100% SCU | ||||
| S2 | 60% SCU | 40% SCU | |||
| S3 | 60% SCU | 40% U | |||
| S3 | 60% SCU | 40% U | |||
| S4 | 60% (50%SCU + 50%U) | 40% (50%SCU + 50%U) | |||
| Time | Treatment | 2022–2023 | 2023–2024 | ||||
|---|---|---|---|---|---|---|---|
| Basal Internode Length (cm) | Plant Height (cm) | Basal Internode Length (cm) | Plant Height (cm) | ||||
| I | II | I | II | ||||
| T1 | CK | 3.64 ± 0.42 ab | 6.21 ± 0.10 de | 69.47 ± 2.59 cd | 4.81 ± 0.35 a | 8.53 ± 0.13 a | 74.05 ± 0.95 c |
| S1 | 3.73 ± 0.53 a | 6.3 ± 0.51 cde | 75.12 ± 2.47 ab | 4.92 ± 0.50 a | 7.92 ± 0.24 abc | 71.6 ± 0.34 d | |
| S2 | 3.33 ± 0.28 abc | 6.54 ± 0.03 bcd | 76.02 ± 2.33 ab | 4.72 ± 0.21 a | 6.66 ± 0.28 ef | 79.87 ± 0.55 a | |
| S3 | 3.41 ± 0.52 abc | 6.66 ± 0.37 bc | 74.54 ± 3.11 b | 4.885 ± 0.33 a | 7.69 ± 0.23 bcd | 77.57 ± 1.01 b | |
| S4 | 3.35 ± 0.31 abc | 7.33 ± 0.30 a | 78.61 ± 2.11 a | 4.65 ± 0.17 a | 8.18 ± 0.44 ab | 73.09 ± 0.59 c | |
| T2 | CK | 3.01 ± 0.01 abc | 5.90 ± 0.45 ef | 61.75 ± 1.23 e | 3.29 ± 0.16 c | 7.23 ± 0.25 de | 69.45 ± 1.35 ef |
| S1 | 3.21 ± 0.39 abc | 5.68 ± 0.54 f | 66.89 ± 3.37 cd | 3.24 ± 0.48 c | 6.53 ± 0.43 f | 68.92 ± 0.46 ef | |
| S2 | 2.77 ± 0.22 c | 6.04 ± 0.08 ef | 69.95 ± 2.58 c | 3.86 ± 0.02 bc | 7.09 ± 0.11 def | 70.29 ± 0.63 e | |
| S3 | 2.74 ± 0.38 c | 6.75 ± 0.07 b | 70.52 ± 0.87 c | 4.3 ± 0.58 ab | 7.75 ± 0.81 bcd | 68.14 ± 0.78 f | |
| S4 | 2.95 ± 0.03 bc | 6.15 ± 0.15 de | 66.11 ± 1.54 d | 3.39 ± 0.17 c | 7.32 ± 0.25 cd | 69.01 ± 0.72 ef | |
| T | ns | ** | ** | ** | ** | ** | |
| F | ns | ** | ** | ns | ** | ** | |
| T×F | ns | ** | ns | ns | ** | ** | |
| Time | Treatment | 2022–2023 | 2023–2024 | ||||||
|---|---|---|---|---|---|---|---|---|---|
| Anthesis | Maturity | Anthesis | Maturity | ||||||
| Breaking Strength (N) | Lodging Resistant Index | Breaking Strength (N) | Lodging Resistant Index | Breaking Strength (N) | Lodging Resistant Index | Breaking Strength (N) | Lodging Resistant Index | ||
| T1 | T1CK | 8.83 ± 0.13 bcd | 29.19 ± 4.46 b | 8.70 ± 0.21 a | 19.68 ± 0.47 ab | 11.04 ± 1.29 ab | 31.57 ± 4.45 ab | 6.56 ± 0.29 cd | 14.14 ± 0.38 ef |
| T1S1 | 9.95 ± 0.49 ab | 30.32 ± 2.91 ab | 7.00 ± 0.28 abc | 16.56 ± 0.66 a–d | 11.43 ± 1.3 7 ab | 33.49 ± 4.40 a | 7.64 ± 0.60 b | 17.03 ± 1.54 cd | |
| T1S2 | 7.31 ± 0.27 d | 21.61 ± 3.96 c | 5.89 ± 0.37 bc | 12.29 ± 0.68 cd | 10.32 ± 0.62 bc | 28.16 ± 1.84 b | 6.82 ± 0.54 bcd | 13.72 ± 1.16 f | |
| T1S3 | 7.33 ± 1.66 d | 22.07 ± 2.23 c | 5.24 ± 0.30 c | 11.21 ± 0.63 d | 7.82 ± 0.91 d | 20.90 ± 2.57 c | 6.27 ± 0.21 d | 13.38 ± 0.25 f | |
| T1S4 | 7.54 ± 0.88 cd | 21.19 ± 1.23 c | 5.86 ± 1.11 bc | 12.20 ± 2.25 d | 9.11 ± 0.47 cd | 26.41 ± 1.29 b | 7.19 ± 0.35 bcd | 15.04 ± 0.90 def | |
| T2 | T2CK | 8.62 ± 0.35 bcd | 28.77 ± 2.46 b | 8.85 ± 1.71 a | 21.61 ± 4.17 a | 11.88 ± 0.22 ab | 35.51 ± 1.16 a | 9.02 ± 0.11 a | 18.89 ± 0.08 bc |
| T2S1 | 11.23 ± 0.97 a | 34.62 ± 3.56 a | 7.73 ± 0.17 abc | 18.04 ± 1.65 abc | 12.16 ± 1.16 a | 36.19 ± 3.22 a | 9.90 ± 0.81 a | 21.55 ± 1.9 a | |
| T2S2 | 9.97 ± 0.91 ab | 29.49 ± 1.37 ab | 5.76 ± 0.84 cd | 13.49 ± 1.33 cd | 9.16 ± 0.29 cd | 27.40 ± 1.03 b | 6.94 ± 0.13 bcd | 14.95 ± 0.23 def | |
| T2S3 | 11.31 ± 0.49 a | 32.46 ± 2.73 ab | 5.88 ± 1.07 cd | 12.35 ± 2.02 cd | 8.55 ± 0.37 d | 26.58 ± 1.63 b | 7.29 ± 0.23 bc | 16.19 ± 0.16 de | |
| T2S4 | 9.27 ± 1.06 bc | 28.28 ± 1.59 b | 6.43 ± 0.26 bcd | 14.18 ± 0.25 bcd | 11.39 ± 1.11 ab | 35.85 ± 3.53 a | 9.55 ± 1.01 a | 20.52 ± 2.13 ab | |
| T | * | ** | ns | ns | * | ** | ** | ** | |
| F | * | * | * | ** | ** | ** | ** | ** | |
| T×F | ns | ns | ns | ns | ns | ns | ** | * | |
| Treatment | F1 | F2 | F3 | Synthesis Score | Ranking |
|---|---|---|---|---|---|
| T2S1 | 3.75 | 0.40 | −0.64 | 1.53 | 1 |
| T2S4 | 3.01 | 0.65 | −0.15 | 1.35 | 2 |
| T2CK | 2.56 | 0.68 | −0.17 | 1.17 | 3 |
| T1S1 | 0.41 | −0.79 | 1.93 | 0.27 | 4 |
| T1S2 | −2.30 | 4.02 | −0.77 | −0.21 | 5 |
| T1S4 | −1.33 | 0.02 | 2.26 | −0.22 | 6 |
| T1CK | −1.34 | −0.45 | 1.31 | −0.46 | 7 |
| T2S3 | −0.21 | −2.36 | −1.20 | −0.75 | 8 |
| T2S2 | −0.74 | −1.55 | −1.83 | −0.88 | 9 |
| T1S3 | −3.81 | −0.63 | −0.73 | −1.80 | 10 |
Disclaimer/Publisher’s Note: The statements, opinions and data contained in all publications are solely those of the individual author(s) and contributor(s) and not of MDPI and/or the editor(s). MDPI and/or the editor(s) disclaim responsibility for any injury to people or property resulting from any ideas, methods, instructions or products referred to in the content. |
© 2025 by the authors. Licensee MDPI, Basel, Switzerland. This article is an open access article distributed under the terms and conditions of the Creative Commons Attribution (CC BY) license (https://creativecommons.org/licenses/by/4.0/).
Share and Cite
Qian, Y.; Sarfraz, U.; Bian, H.; Ma, Q.; Gu, X.; Li, F.; Li, Y.; Zhu, M.; Li, C.; Ding, J.; et al. Optimizing Stem Strength and Yield Stability by Combining Controlled-Release Nitrogen Fertilizer and Urea Application Across Different Sowing Dates. Agronomy 2025, 15, 1253. https://doi.org/10.3390/agronomy15051253
Qian Y, Sarfraz U, Bian H, Ma Q, Gu X, Li F, Li Y, Zhu M, Li C, Ding J, et al. Optimizing Stem Strength and Yield Stability by Combining Controlled-Release Nitrogen Fertilizer and Urea Application Across Different Sowing Dates. Agronomy. 2025; 15(5):1253. https://doi.org/10.3390/agronomy15051253
Chicago/Turabian StyleQian, Yinsen, Umair Sarfraz, Huawen Bian, Quan Ma, Xiaoqi Gu, Fujian Li, Ying Li, Min Zhu, Chunyan Li, Jinfeng Ding, and et al. 2025. "Optimizing Stem Strength and Yield Stability by Combining Controlled-Release Nitrogen Fertilizer and Urea Application Across Different Sowing Dates" Agronomy 15, no. 5: 1253. https://doi.org/10.3390/agronomy15051253
APA StyleQian, Y., Sarfraz, U., Bian, H., Ma, Q., Gu, X., Li, F., Li, Y., Zhu, M., Li, C., Ding, J., Guo, W., & Zhu, X. (2025). Optimizing Stem Strength and Yield Stability by Combining Controlled-Release Nitrogen Fertilizer and Urea Application Across Different Sowing Dates. Agronomy, 15(5), 1253. https://doi.org/10.3390/agronomy15051253