Article

Soil-Available Nitrogen and Phosphorus and Their Temporal Stability in the Tibetan Grasslands

Lhasa Plateau Ecosystem Research Station, Key Laboratory of Ecosystem Network Observation and Modeling, Institute of Geographic Sciences and Natural Resources Research, Chinese Academy of Sciences, Beijing 100101, China
*
Author to whom correspondence should be addressed.
These authors contributed equally to this study.
Agronomy 2025, 15(5), 1255; https://doi.org/10.3390/agronomy15051255
Submission received: 13 March 2025 / Revised: 4 May 2025 / Accepted: 18 May 2025 / Published: 21 May 2025
(This article belongs to the Section Grassland and Pasture Science)

Abstract

:
Uncertainties regarding the responses of soil-available nitrogen and phosphorus (i.e., ammonium nitrogen, NH4+–N; nitrate nitrogen, NO3–N; available phosphorus, AP) to global changes pose significant challenges to predicting future shifts in plant productivity and livestock development in alpine ecosystems, where these nutrients are critical limiting factors. This study aimed to (1) compare the relative contributions of climate warming, precipitation change, and radiation change on soil-available nitrogen and phosphorus; (2) reveal the decoupling relationships between nutrient contents and their temporal stability; and (3) compare the sensitivity of nutrient contents and their temporal stability. We conducted a regional-scale analysis on soil profiles of 0–10 and 10–20 cm through random forest models across alpine grasslands on the Tibetan Plateau (2000–2020), integrating climate datasets (temperature, precipitation, and radiation) and a normalized difference vegetation index. Temporal stability indicated the reciprocal of the coefficient of variation. Trend analyses were used to quantify the change rate of the nutrient contents and their temporal stability. Three key findings emerged. First, radiation change can exert stronger effects on soil-available nitrogen and phosphorus for some cases. Second, both the contents and temporal stability of NH4+–N, NO3–N, and AP increased in 13.62–25.80% of grasslands but decreased in 18.74–41.80%. Additionally, 18.71–52.03% of areas showed nutrient increases coupled with decreased temporal stability (while being vice versa in 10.28–26.29%). Third, the relative change in temporal stability exhibited greater ranges (−3081.02% to 3852.73%) than those of the nutrient contents (−355.95% to 947.56%). Therefore, radiation change should be valued in regulating the variations in soil NH4+–N, NO3–N, and AP. The changes in the contents of NH4+–N, NO3–N, and AP were not always in sync with the changes in their temporal stability. Stability metrics may better reflect ecosystem vulnerability to global change. All these findings underscore the importance of radiation changes and concurrently considering soil-available nitrogen and phosphorus contents and their temporal stability.

1. Introduction

In soil ecological research, temporal stability typically refers to the ability of soil nutrients (such as available nitrogen and phosphorus) to remain relatively constant within a specific time frame. The temporal stability of soil nutrients is a crucial factor in understanding how soil nitrogen and phosphorus cycling respond to environmental changes, particularly in nutrient-limited alpine ecosystems [1]. As integral components of biogeochemical cycles, soil ammonium nitrogen (NH4+–N), nitrate nitrogen (NO3–N), and available phosphorus (AP) not only control grassland productivity but also determine ecosystem resilience through their temporal stability patterns [2,3]. Previous studies have made significant advances in documenting the spatio-time patterns of soil NH4+–N, NO3–N, and AP [4,5], yet three critical gaps persist. First, clarifying the relationships between soil-available nutrients and their temporal stability is essential for accurately predicting and managing the long-term stability of soil systems. However, their relationships remain nebulous, with uncertainty regarding whether they are synergistic or a trade-off (i.e., decoupling of content and stability). Additionally, it is not well understood how this relationship might shift under different external disturbances (e.g., climate change vs. human activities). Second, the sensitivity comparison between soil-available nutrient contents and their temporal stability to global change remains unresolved (i.e., stability–response asymmetry) [6,7]. Third, previous studies have primarily explored the impact of climate variables on soil-available nutrients from the perspective of climate change and mean climatic conditions [8,9,10], with little attention given to the temporal stability of climate variables. This oversight may lead to inaccurate predictions of soil-available nutrient changes. Therefore, a deeper investigation into the relationships between soil-available nutrients and their temporal stability is crucial for accurately predicting and managing ecosystem changes and ensuring the long-term stability of soil nutrients.
The Tibetan Plateau, a vast expanse dominated by alpine grasslands and a quintessential representative of global alpine ecosystems, serves as a unique testing ground for studying nutrient stability. Its extreme climate creates pronounced nutrient interannual variability. High-altitude radiation intensifies photochemical nutrient transformations. These characteristics make the plateau an ideal system to investigate how nutrient stability responds to global changes. Extensive studies have been conducted to explore the responses and driving mechanisms of soil NH4+–N, NO3–N, and AP to external disturbances in Tibetan Plateau grasslands [11,12]. However, most previous studies were conducted at single-site or transect scales [13,14], limiting their ability to capture regional-scale patterns. Simultaneously, there are currently no published studies on the responses of the contents of soil NH4+–N, NO3–N, and AP, particularly their temporal stability in response to climate change and human activities, across the entire alpine grasslands of the Tibetan Plateau. Additionally, earlier studies on soil element changes have primarily focused on the impacts of climate warming and precipitation change [15,16], often overlooking the influence of radiation change. In reality, radiation can affect soil physical and chemical properties through various pathways [17,18,19]. Therefore, further in-depth investigation into the temporal stability of the contents of soil NH4+–N, NO3–N, and AP and their driving factors across the alpine grasslands on the Tibetan Plateau is crucial for understanding ecosystem dynamics and implementing effective conservation and management strategies.
Given these knowledge gaps, this study addressed three specific mechanistic questions that previous plateau-scale investigations have not resolved. First, driver dominance: it quantified whether radiation change exerted stronger effects than warming/precipitation on both the contents and temporal stability of soil NH4+–N, NO3–N, and AP, which is a critical unknown given radiation’s direct photochemical effects on nutrient mineralization [17,18,19]. Second, dynamic coupling: it identified relationships between the contents of these elements and their temporal stability—a novel framework for predicting ecosystem tipping points. Third, response hierarchy: it determined if nutrient contents or their temporal stability showed higher sensitivity to climate change and human disturbances to resolve the debated “content-stability sensitivity paradox”.

2. Materials and Methods

2.1. Data

We used monthly meteorological data (temperature, precipitation, and radiation) from 145 weather stations on the Tibetan Plateau from 2000 to 2020 and performed spatial interpolation with the Anusplin software 4.2 at a resolution of 1 km × 1 km across the Tibetan grassland regions. As validated in previous studies [20], this precision level is sufficient for subsequent analyses. The raster data of the growing season temperature (GST), growing season precipitation (GSP), and growing season radiation (GSRad) were generated using the mean function in the terra package of the R 4.4.2 software, based on monthly temperature, precipitation, and radiation data during the period from May to September—the core growing season for Tibetan alpine grasslands. The raster images of the mean values and standard deviations for the GST, GSP, and GSRad over three-year sliding windows were calculated using the mean and stdev functions in the same package, yielding 19 pairs of climate-variable raster data. Temporal stability metrics for these three climate variables (with a three-year window) were then derived from these raster pairs using Equation (1).
S t a b i l i t y = M e a n S D
Here, S t a b i l i t y , M e a n , and S D represent the temporal stability, mean value, and standard deviation of each soil variable within a specified time range.
The sens.slope function from the trend package in the R 4.4.2 software was used to calculate the change rates of the GST, GSP, and GSRad (ΔGST, ΔGSP, and ΔGSRad) based on 21 years of climate data. We also calculated the change rates of the temporal stability of the GST, GSP, and GSRad ( Δ S t a b i l i t y G S T , Δ S t a b i l i t y G S P , and Δ S t a b i l i t y G S R a d ) using the sens.slope function of the trend package of the R 4.4.2 software based on the temporal stability of climatic variables within the previously mentioned three-year time window. The spatial-averaged (the global function of the terra package) ΔGST, ΔGSP, and ΔGSRad were 0.03 °C yr−1 (from −0.04 to 0.12 °C yr−1), 1.73 mm yr−1 (from −16.58 to 17.10 mm yr−1), and −4.57 MJ m−2 yr−1 (from −25.82 to 12.94 MJ m−2 yr−1), respectively. That is, the spatial-averaged GST and GSP increased by 0.63 °C (from −0.82 to 2.40 °C) and 34.59 mm (from −331.60 to 341.96 mm), but the GSRad decreased by 91.43 MJ m−2 (from −516.43 to 258.72 MJ m−2) during the past 21 years (2000–2020). Based on the change rates of each concerned climate variable (ΔGST, ΔGSP), the value of the concerned variable in 2000, and the time interval from 2000 to 2020 (i.e., 20), we can obtain the raster image data of the relative change in the GSP and GSRad (Equation (2)). The spatial-averaged GSP increased by 16.88%, while the GSRad decreased by 2.83%.
R C = Δ × T I I N I T
where R C is the relative change in a specific variable, Δ is the change rate of the specific variable, T I is the time interval ( T I = 20 for variable itself, T I = 18 for variable stability), and I N I T is the first value of the data sequence which is used to calculate to Δ .
The monthly normalized difference vegetation index (MOD13A3, 1 km × 1 km) for 2000–2020 was downloaded, and the annual NDVImax was extracted using the max function in terra. Masking with alpine grassland shapefiles isolated NDVImax for the target regions. We also calculated the change rate of NDVImax (ΔNDVImax), the change rate of the temporal stability of NDVImax ( Δ S t a b i l i t y N D V I m a x ), and the mean values of NDVImax (MNDVImax) in 2000–2020. The calculations of ΔNDVImax, Δ S t a b i l i t y N D V I m a x   , and MNDVImax were also performed on the R 4.4.2 software (sens.slope function of the trend package and the mean function of the terra package, respectively).
By employing the previously developed random forest models [21] incorporating the variables of monthly air temperature, precipitation, and radiation, we generated the raster image data for the monthly average soil nitrate nitrogen, ammonium nitrogen, and available phosphorus at the depths of 0–10 cm and 10–20 cm under solo-climate change scenarios (C) during the period from May to September in 2000–2020 across the alpine grasslands of the Tibetan Plateau. By employing the other random forest models [21] incorporating NDVImax, monthly air temperature, precipitation, and radiation, we also obtained the raster image data for these soil indicators under the combined influence of climate change and human activities (C+H). The above random forest models had relatively high accuracies (the absolute value of the relative biases was less than 9%). Based on the above-mentioned soil-available nutrient variables at the monthly scale, the raster image data of the average soil-available nutrient variables during the growing season of each year from 2000 to 2020 were obtained by using the mean function in the terra package of the R software (R4.4.2). Using Equation (3), we calculated the raster image data for these soil indicators under the influence of solo-human activities (H) during the growing season of each year from 2000 to 2020.
φ x =   γ x η x
where φ x represents the influence of human activities on the content of soil element, γ x represents the content of the soil element under the combined effects of climate change and human activities, and η x represents the content of the soil variable under the single effect of climate change.
Based on Equation (1), we calculated the temporal stability of soil-available nitrogen and phosphorus using a three-year sliding time window. Then, according to Equation (2), we calculated the relative changes in soil-available nitrogen and phosphorus (RC_NH4+–N, RC_NO3–N, and RC_AP) and their temporal stability (RC_StabilityNH4, RC_StabilityNO3, and RC_StabilityAP).

2.2. Statistical Analyses

The spatially aggregated metrics (mean, min, max) for the nutrient and stability relative changes were computed for both soil depths using terra::global (Table 1 and Table 2). The area proportions of increasing/decreasing trends, along with their within-category averages, were also quantified. Overlay analysis classified regions into four categories: content and stability increasing (CITSI), content decreasing/stability increasing (CDTSI), both decreasing (CDTSD), and content increasing/stability decreasing (CITSD), with area proportions tabulated (Table 3). The spatial distributions of relative changes and categorical classifications were mapped using ArcMap 10.2 (Figure 1, Figure 2, Figure 3, Figure 4, Figure 5, Figure 6, Figure 7, Figure 8 and Figure 9). Structural equation modeling (SEM) via the sem function in lavaan (R 4.4.2) quantified the direct/indirect effects of explanatory variables. Under climate-only scenarios, predictors included the geographic position (longitude, latitude, elevation), the GST, the GSP, the GSRad, their change rates (ΔGST, ΔGSP, ΔGSRad), and the stability change rates (ΔStability_GST, ΔStability_GSP, ΔStability_GSRad). For the C+H and H scenarios, NDVImax, ΔNDVImax, and ΔStability_NDVImax were added as predictors. Sensitivity comparisons between the nutrient contents and their stability were simplified by directly contrasting their relative changes, as both variables experience identical disturbance intensities at each pixel, obviating complex disturbance intensity calculations.

3. Results

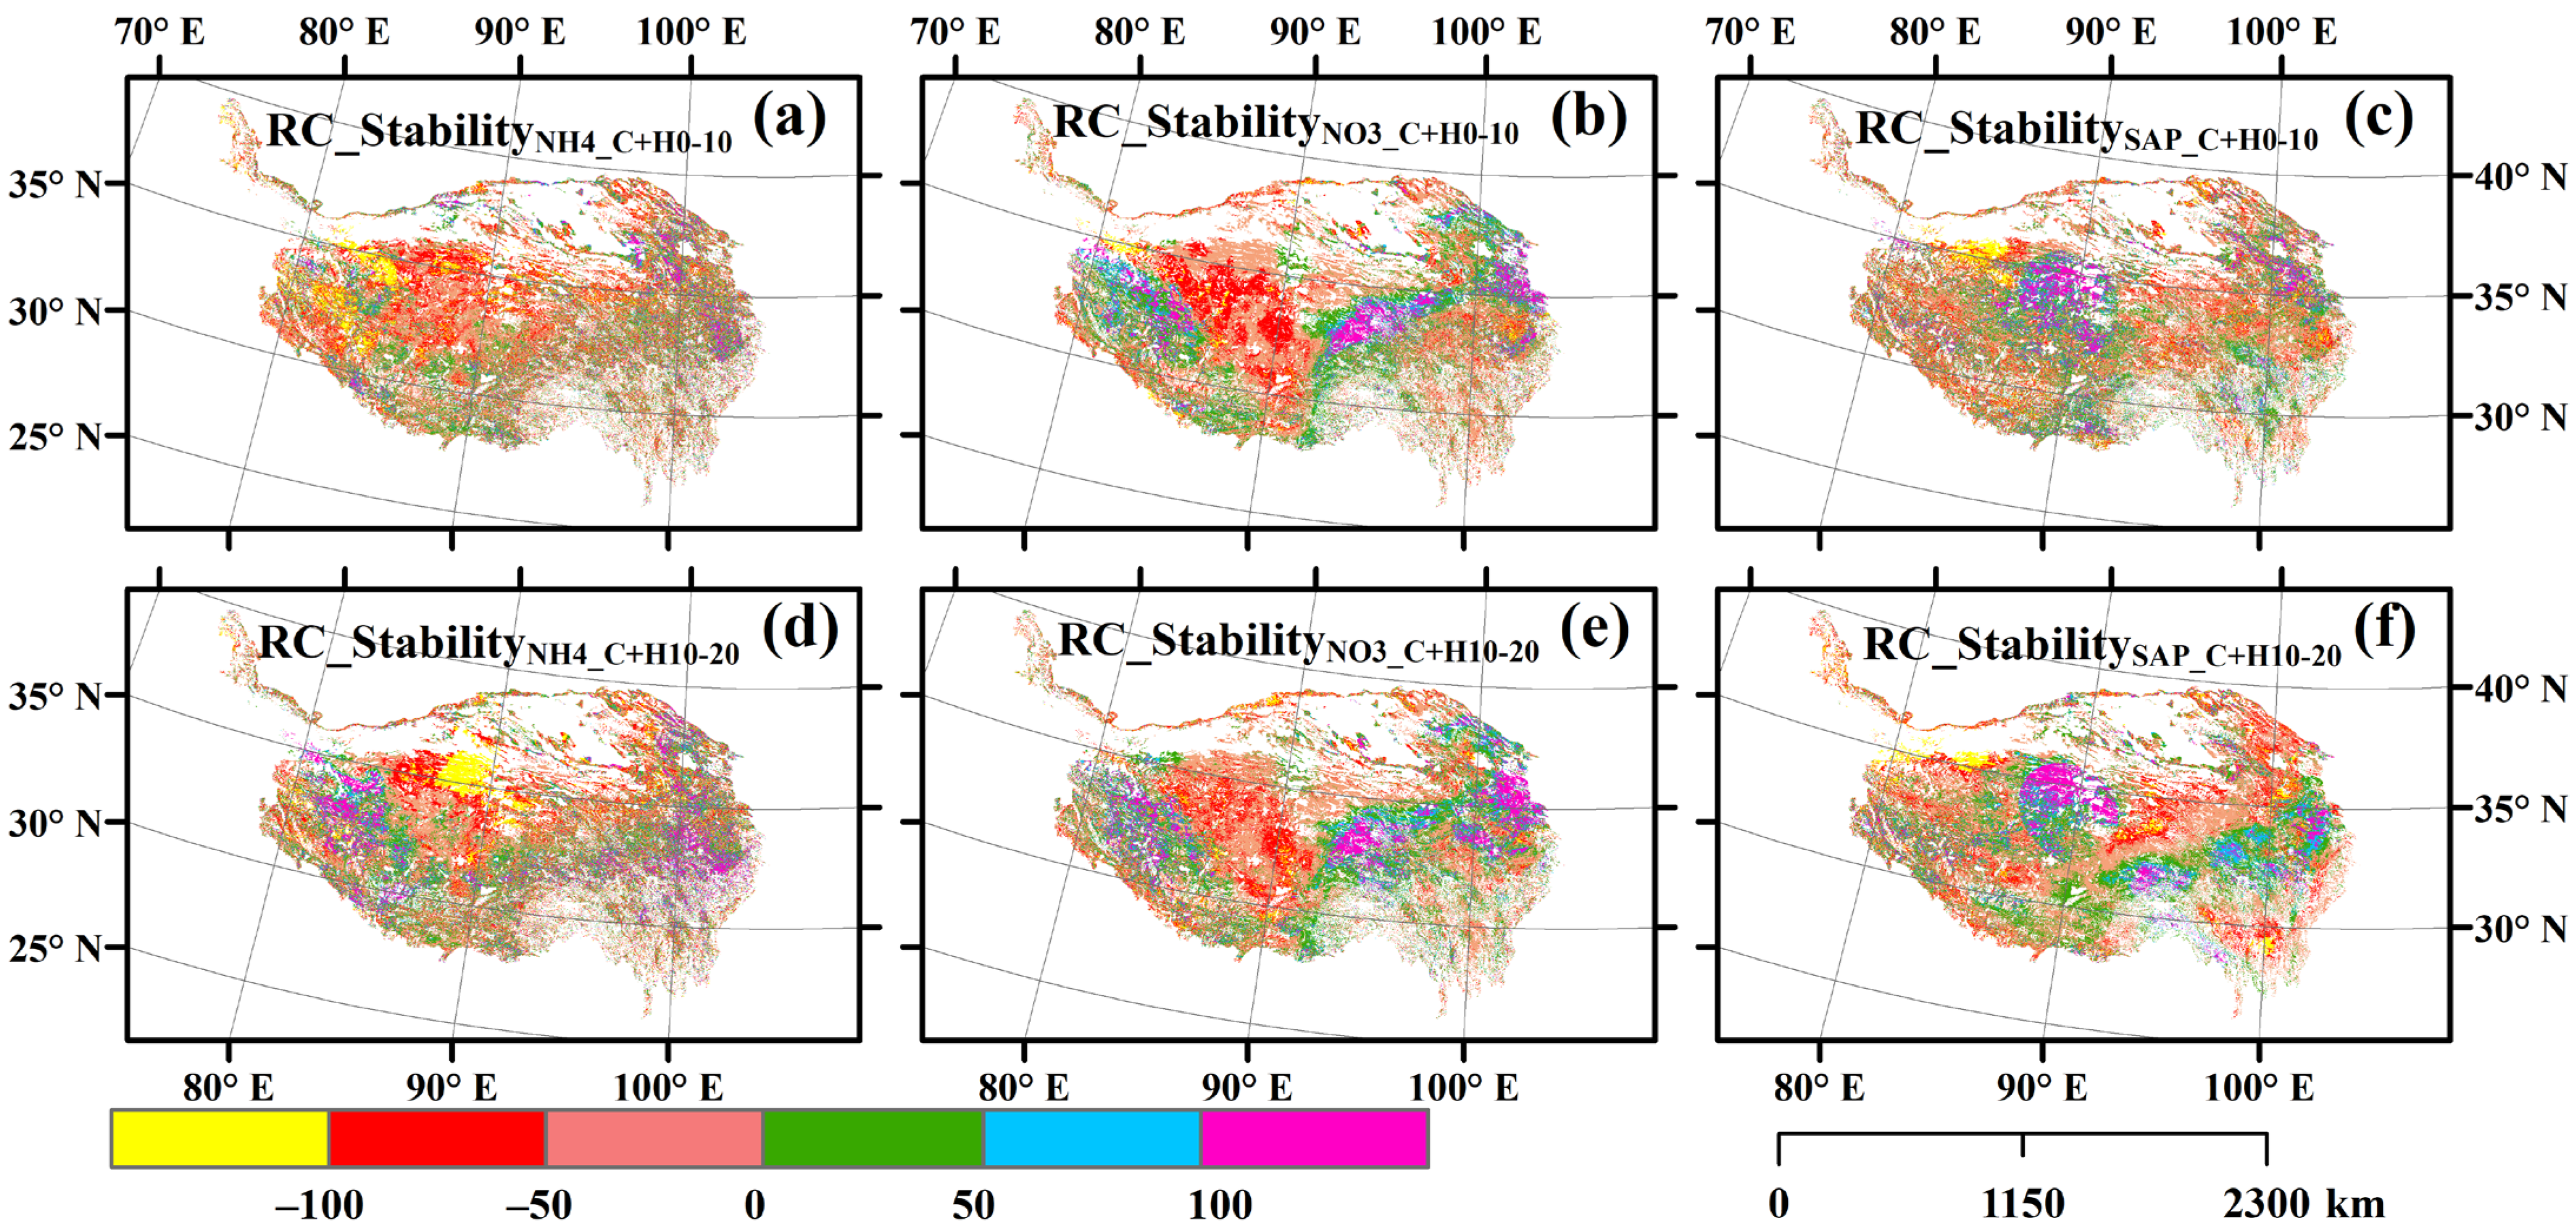
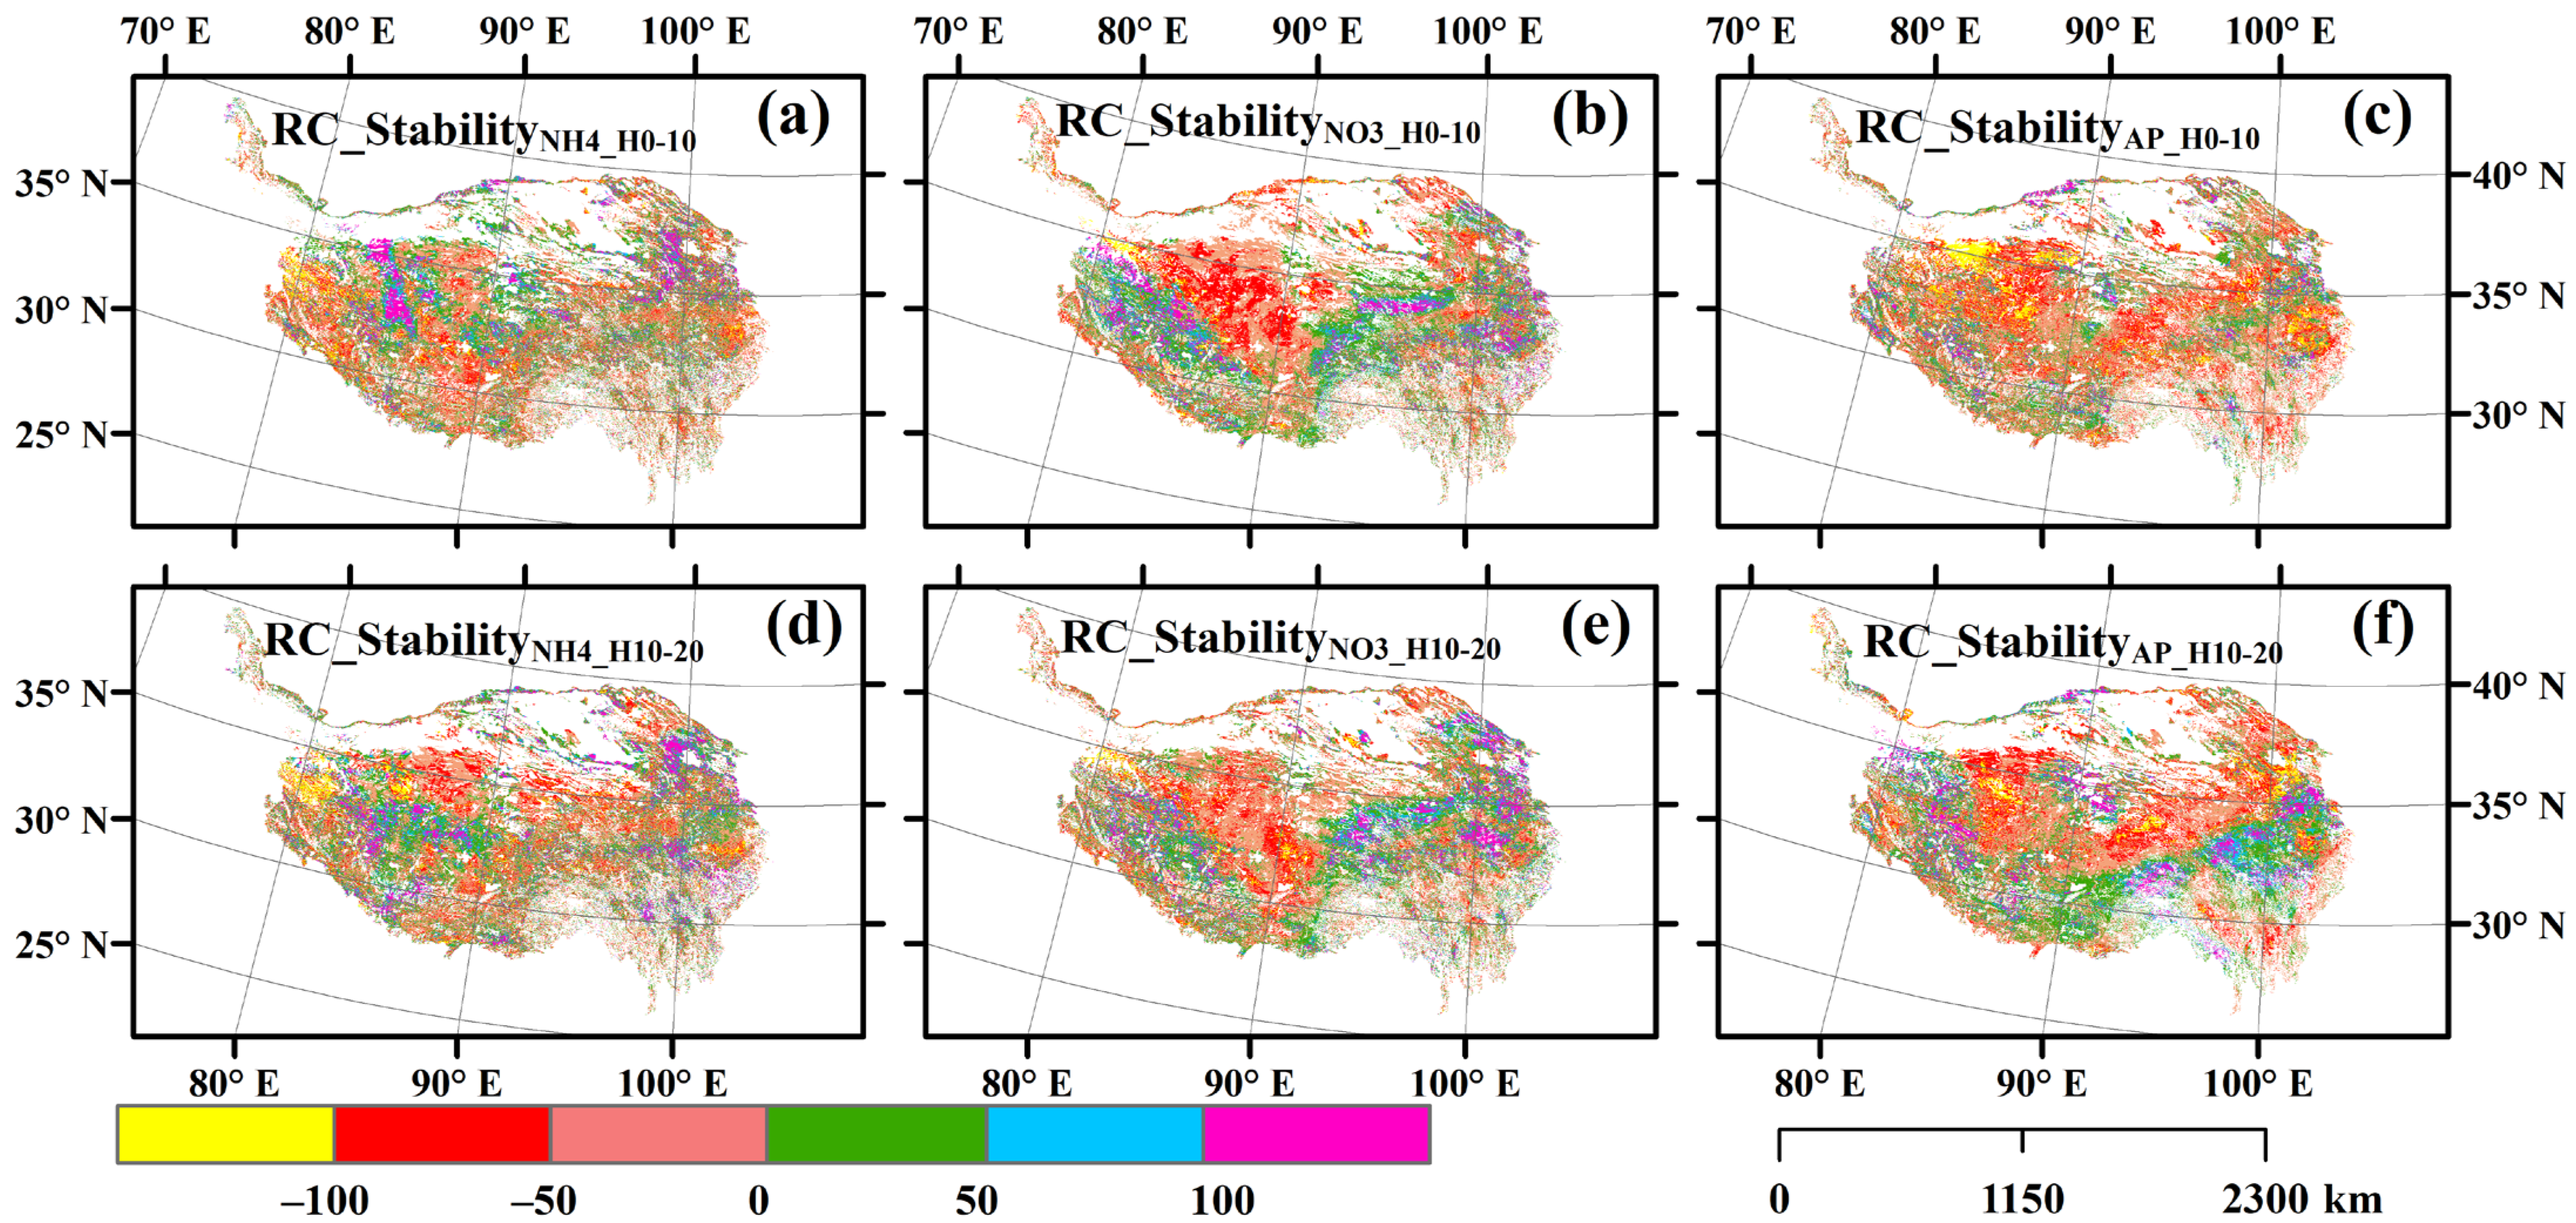
3.1. The Relative Contributions of Climate Warming, Precipitation Change, and Radiation Change

The GSRad, Δ G S R a d , and Δ S t a b i l i t y G S R a d directly influenced the relative changes in soil-available nitrogen and phosphorus and their temporal stability (Figures S1–S6). These factors also exerted indirect effects through cascading impacts on the GST or NDVImax, Δ G S T or Δ N D V I m a x , and Δ S t a b i l i t y G S T   or Δ S t a b i l i t y N D V I m a x (Figures S1–S6). Notably, ΔGSRad often had stronger effects than ΔGST or ΔGSP in specific scenarios (Figures S1–S6). For example, the net impact path coefficients (direct impact path coefficient + indirect impact path coefficient) of Δ G S R a d , Δ G S P , and Δ G S T on the relative change in soil ammonium nitrogen at 10–20 cm were 0.44, −0.18, and −0.14, respectively (Figure S2b).

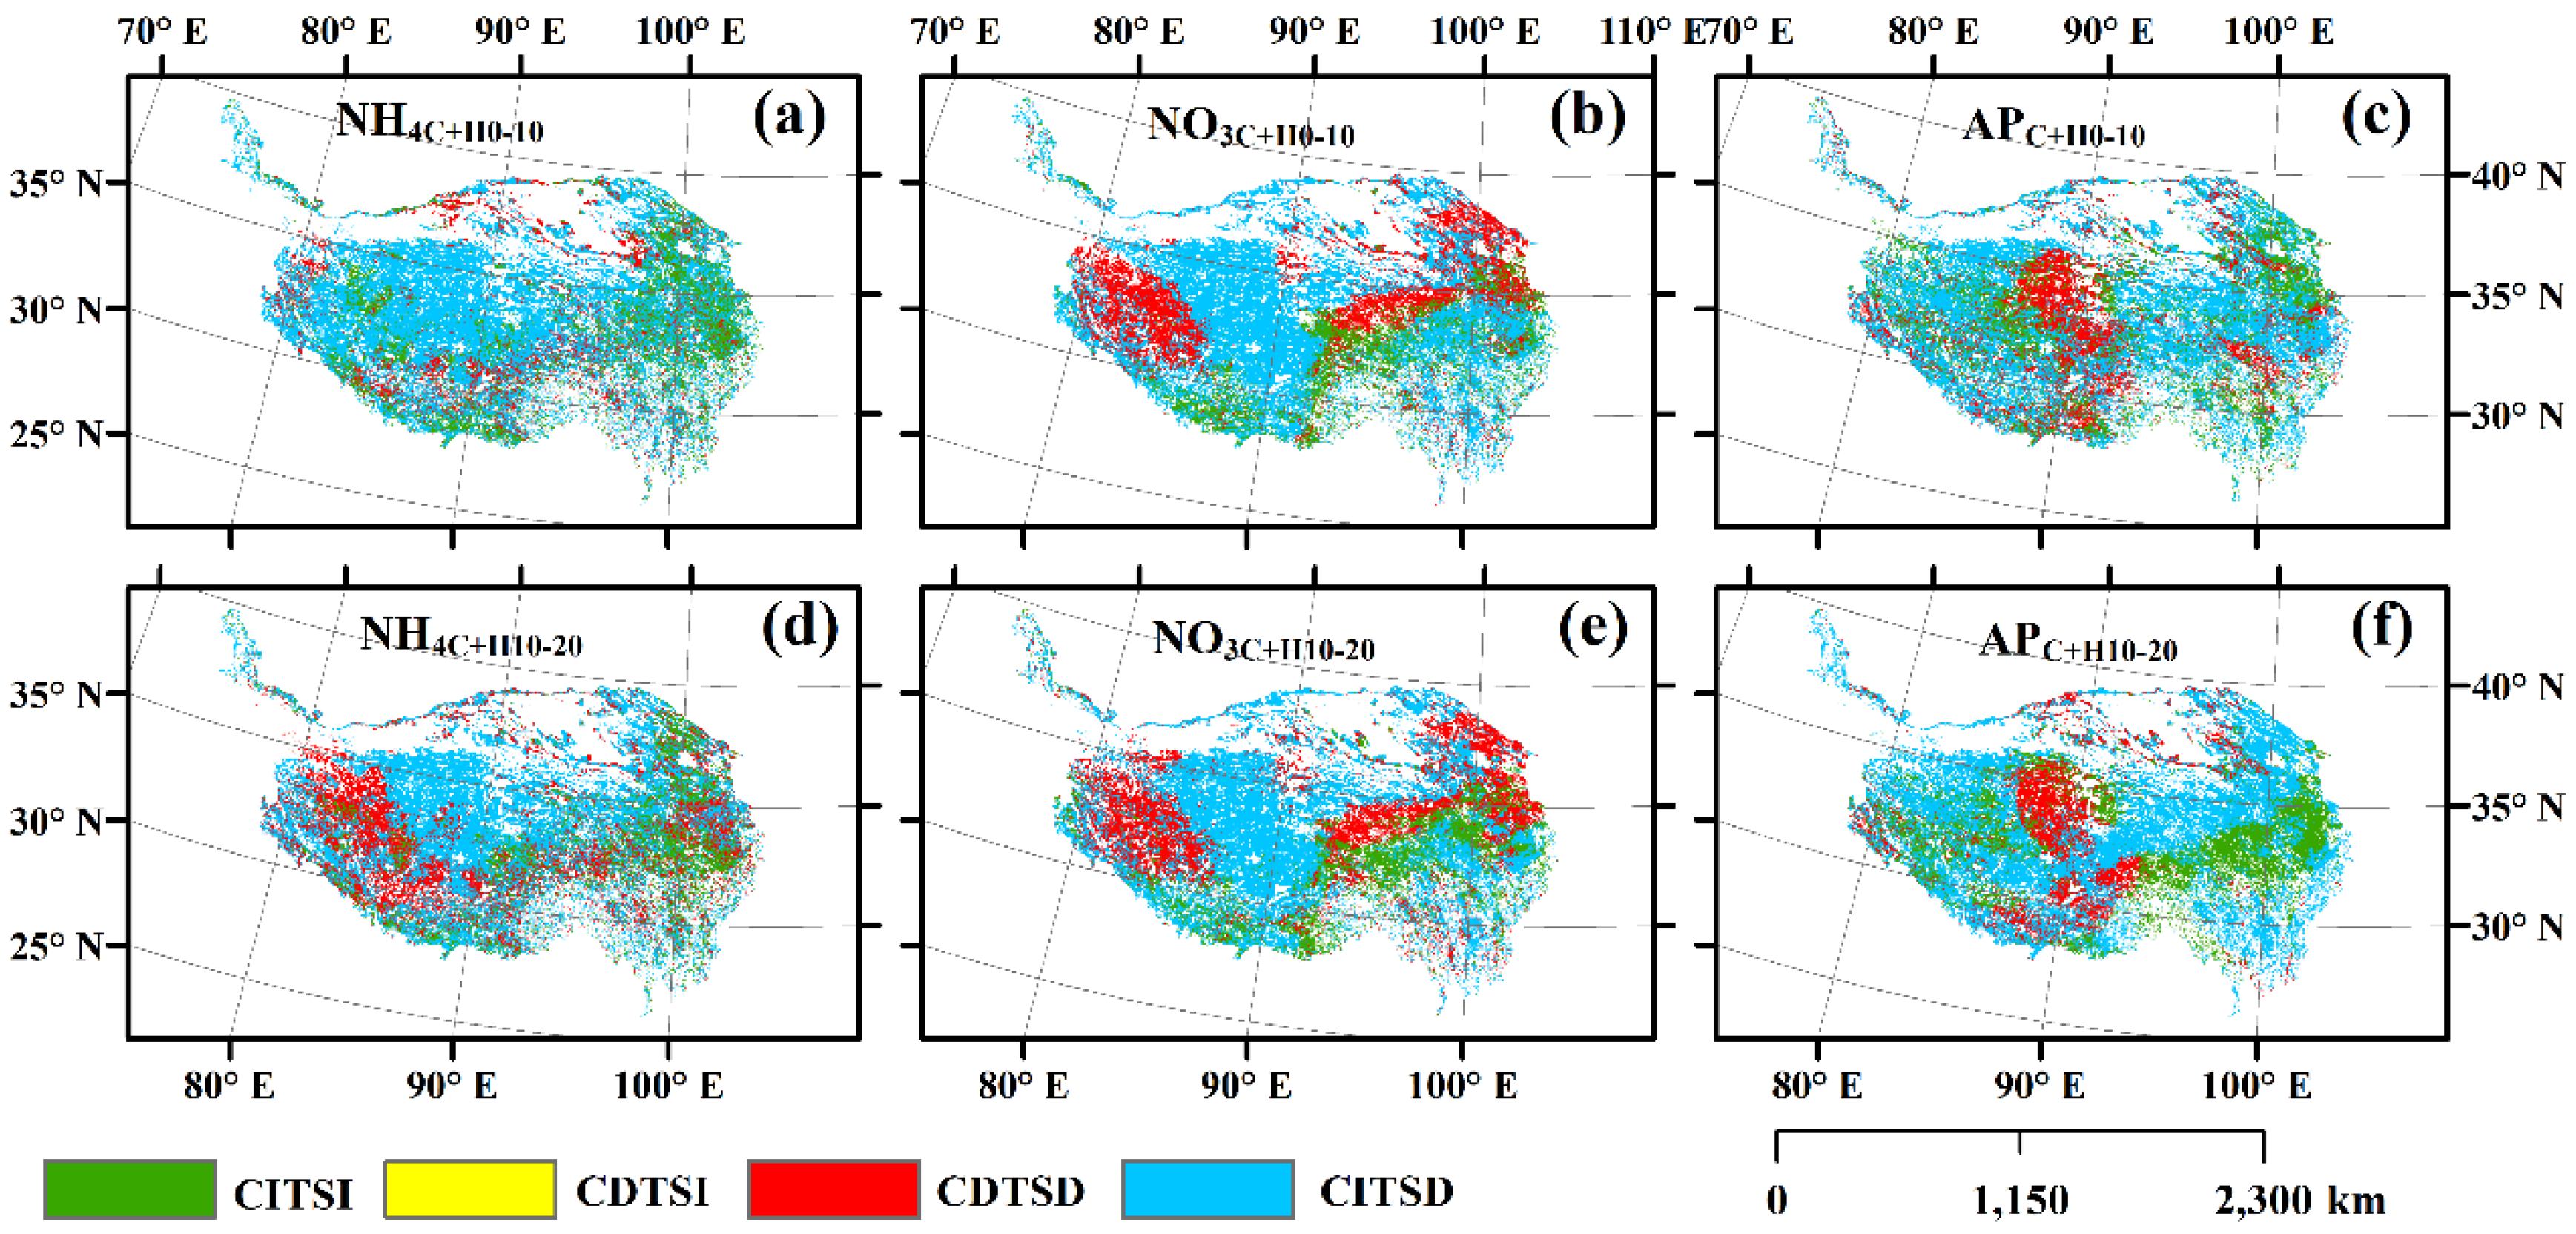
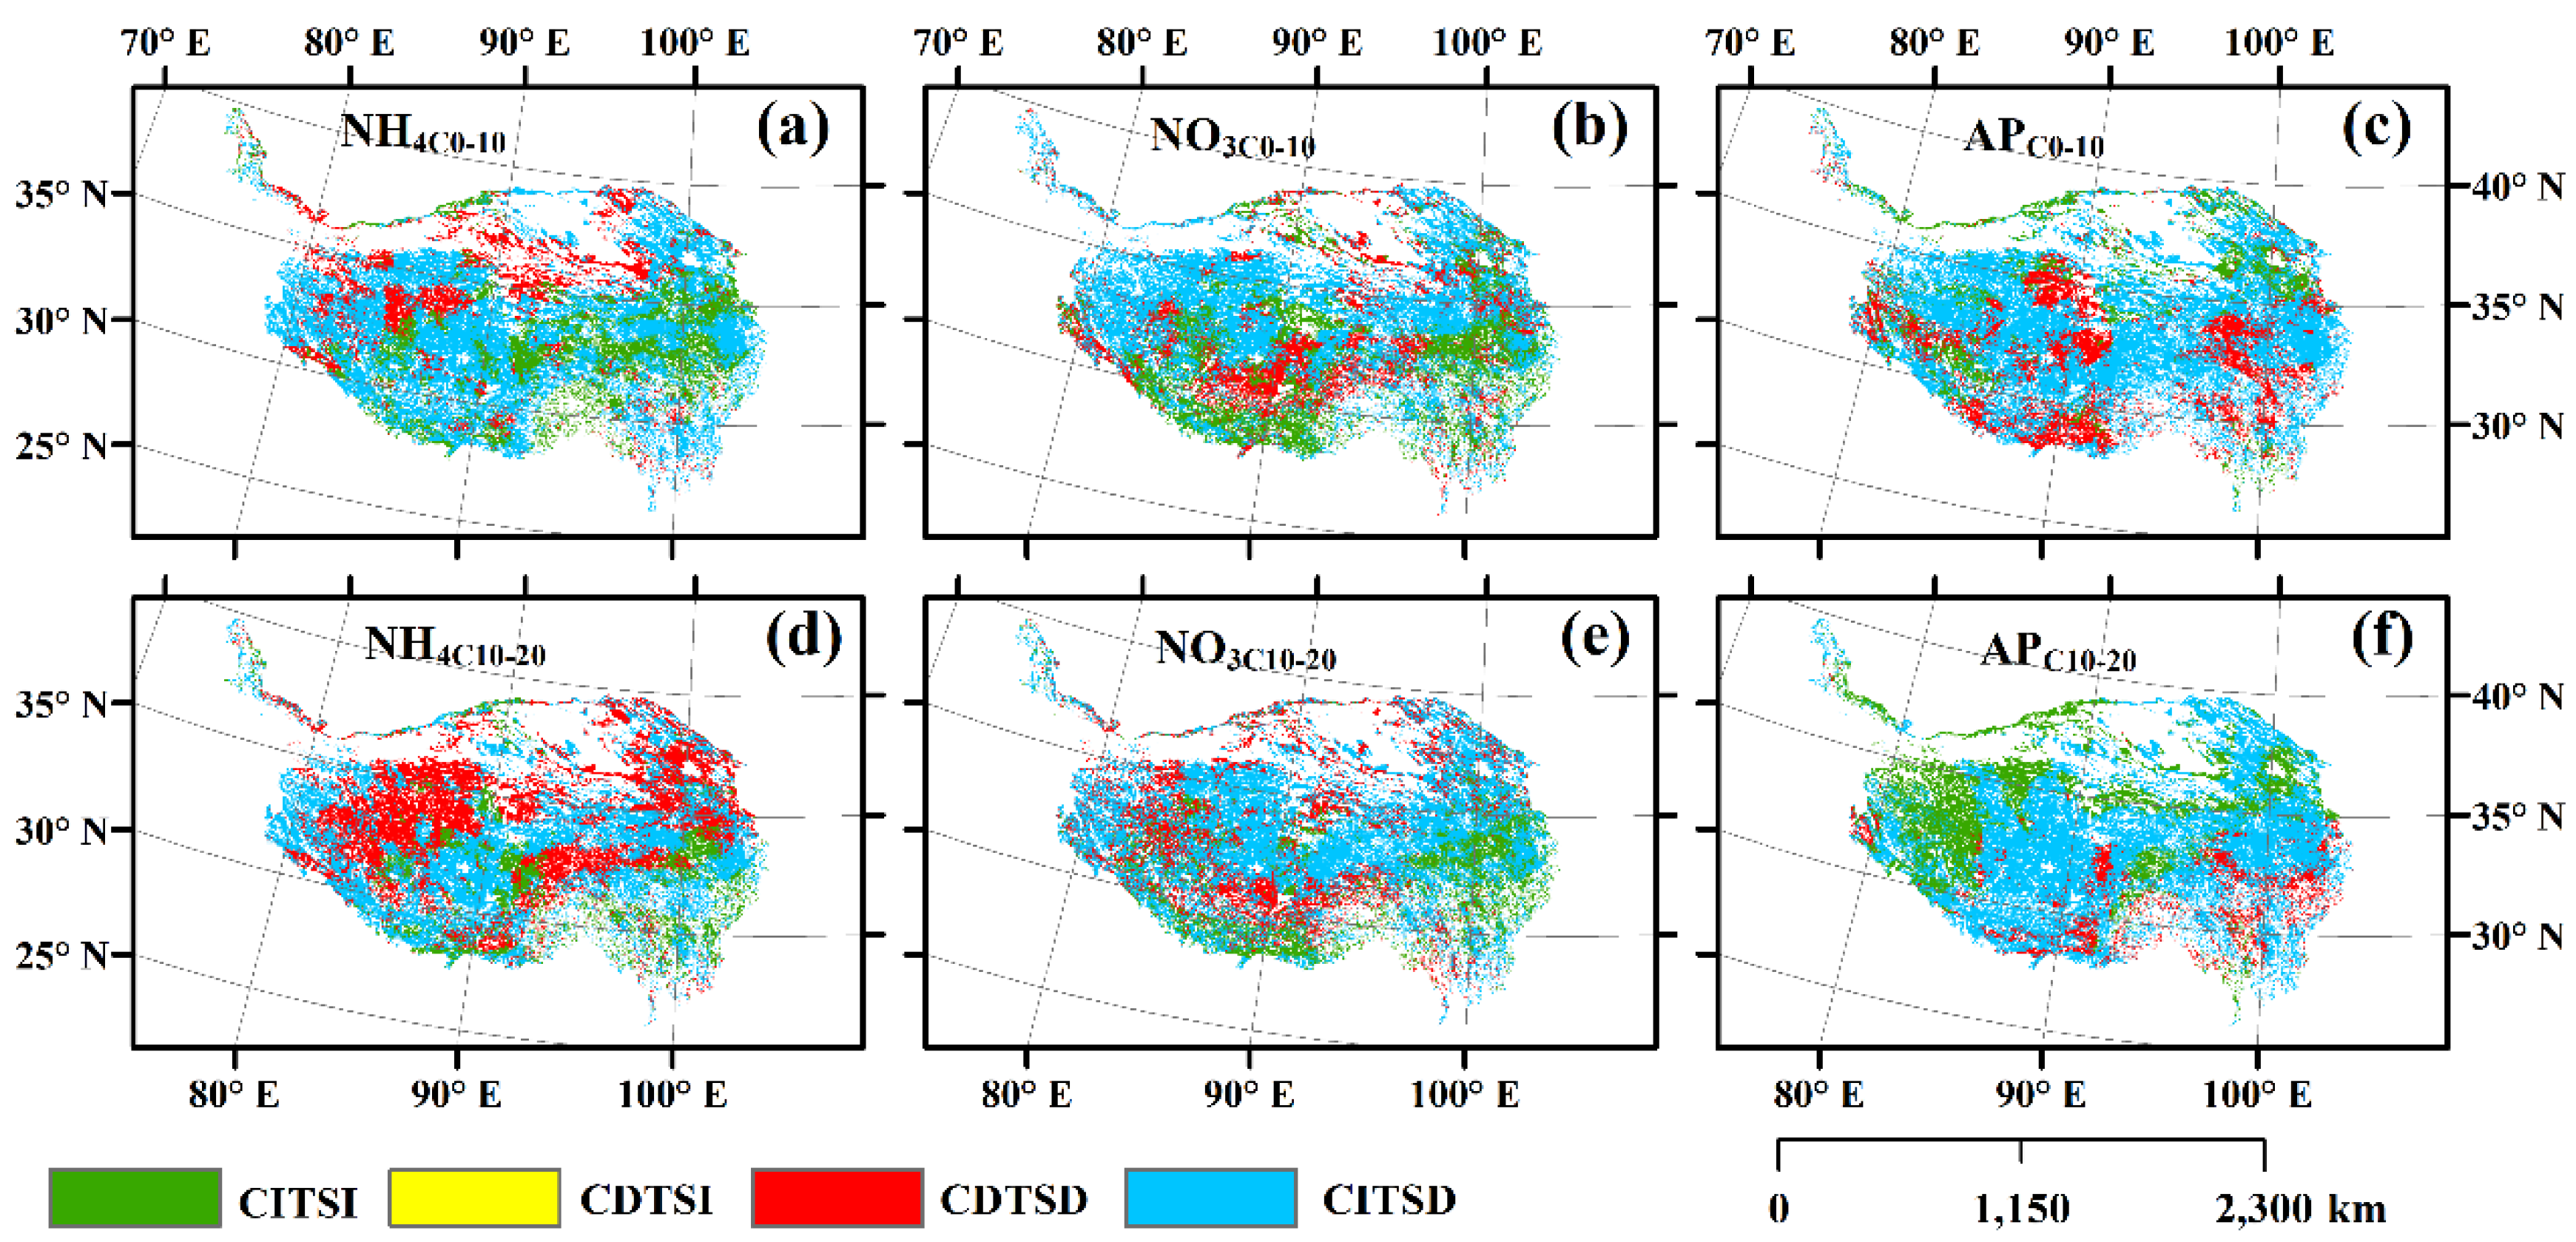
3.2. The Relationship Between Relative Changes in Soil-Available Nitrogen and Phosphorus and Their Temporal Stability

The proportions of the areas where soil available nitrogen and phosphorus decreased were different from those of the areas where their time stability decreased (Table 1 and Table 2). Similarly, increases in nutrient contents were not congruent with increases in their stability (Table 1 and Table 2). The above-mentioned phenomenon indirectly reflected that there should be trade-off relationships between soil-available nitrogen and phosphorus and their temporal stability in some areas. This discrepancy suggested trade-off relationships between nutrient dynamics and stability in many regions, further validated by spatial distribution maps (Figure 1, Figure 2, Figure 3, Figure 4, Figure 5 and Figure 6). For example, across most of the northern Tibetan Plateau under combined climate–human impacts, 0–10 cm soil ammonium nitrogen increased, but its temporal stability decreased (Figure 1a and Figure 4a). Quantitatively, 40.36–62.09% of grasslands exhibited trade-offs (nutrient stability decreased as contents increased, or vice versa), while the remaining areas showed synergistic responses (Table 3). Specifically, 10.06–37.75% of grasslands had decreasing nutrients but increasing stability, and 16.36–52.03% showed increasing nutrients with decreasing stability (Table 3). These trade-offs/synergies displayed distinct spatial patterns, highlighting regional heterogeneity in disturbance responses (Figure 7, Figure 8 and Figure 9).

3.3. Comparisons of Sensitivity Between Soil-Available Nitrogen and Phosphorus and Their Temporal Stability

The minimum and maximum relative changes in temporal stability far exceeded those in nutrient contents (Table 1 and Table 2). For example, the absolute range of stability changes (e.g., −3081.02% to 3852.73%) was an order of magnitude larger than the nutrient content changes (e.g., −355.95% to 947.56%) (Table 1 and Table 2). Spatially averaged stability changes also had higher absolute values than nutrient changes in most cases (Table 1 and Table 2). From the spatial distribution maps (Figure 1, Figure 2, Figure 3, Figure 4, Figure 5 and Figure 6), the relative changes in soil-available nitrogen and phosphorus for most pixels fell within ±50%. In contrast, regarding the relative changes in the temporal stability of soil-available nitrogen and phosphorus, there were a large number of pixels for which the absolute value of the relative changes exceeded 50% (Figure 1, Figure 2, Figure 3, Figure 4, Figure 5 and Figure 6).

4. Discussion

Radiation changes exerted direct effects on the relative changes in soil-available nitrogen and phosphorus and their temporal stability, with greater effects than climate warming and precipitation change in many cases (Figures S1–S6). This aligns with prior research [22], attributable to three coupled mechanisms. First, reduced radiation (declines in the GSRad and its temporal stability) exerted negative feedback on climate warming (changes in the GST and its stability) (Figures S1–S6). Diminished solar radiation weakened surface heat accumulation, partially offsetting the thermal effects of rising air temperatures and regulating nutrient/stability dynamics. Second, the radiation–vegetation–nutrient coupling pathway (Figures S1–S6). Radiation variability directly controlled NDVImax dynamics and its temporal stability via photochemical constraints on alpine vegetation productivity [22], with altered NDVImax patterns cascading to regulate soil nutrient availability. Third, there was a precipitation–radiation trade-off (Figures S1–S6). Increased precipitation (ΔGSP) reduced surface radiation input through enhanced cloud cover, creating the hydro-thermal rebalancing that influenced the nutrient retention capacity.
The relationship between the relative changes in soil-available nitrogen and phosphorus and their temporal stability was not uniform, encompassing synergistic (both increasing/decreasing) or trade-off (one increasing as the other decreases) dynamics (Figure 7, Figure 8 and Figure 9, Table 3). This complexity arises from multiple factors. First, the soil buffering capacity—the ability to resist nutrient fluctuations via physical (adsorption/desorption), chemical (ion exchange), and biological (microbial uptake) processes [23]—acts as a stabilizing force. For example, increased nutrient inputs (e.g., yak urine deposition) are rapidly absorbed by plants/microorganisms, dampening variability [24]. Second, there are the precipitation-driven nutrient dynamics: While increased precipitation elevates wet nitrogen/phosphorus deposition [25], reduced rainfall frequency with extreme events [26,27] introduces variability. Intense rainfall can leach nutrients beyond root zones, overwhelming the buffering capacity and decreasing stability, illustrating that stability is a dynamic interplay between the buffering capacity and disturbance intensity. Third, the geographic heterogeneity in soil properties (texture, organic matter, moisture) across regions/depths influences nutrient retention/release [28]. For example, high-clay soils, with a stronger ion-exchange capacity, maintain higher stability under steady conditions, whereas sandy soils with a low buffering capacity exhibit greater vulnerability to fluctuations, even under mild disturbances.
Contrary to expectations, the sensitivity of soil-available nitrogen/phosphorus stability to global changes was not consistently lower than that of their contents—indeed, it often exceeded the content sensitivity (Table 1 and Table 2, Figure 1, Figure 2, Figure 3, Figure 4, Figure 5 and Figure 6). This stems from several mechanisms. First, while direct disturbances initially impact the nutrient contents [29,30], cumulative long-term disturbances disproportionately affect stability. Even if the short-term content changes are minimal, gradual shifts in climatic variability can erode temporal stability [31]. Second, rapid nutrient responses to acute events (e.g., heavy rain leaching) drive content sensitivity, whereas chronic climate fluctuations exert stronger effects on stability, particularly when variability amplitudes increase [29]. Third, there are the biological–abiotic feedbacks: organisms (plants, microbes) rapidly utilize available nutrients [32], making contents sensitive to short-term disturbances, but ecosystem-scale feedbacks (e.g., altered microbial communities under warming) [33] create lagged effects that destabilize long-term patterns. Fourth, spatial heterogeneity in soil/topographic/climatic conditions amplifies stability sensitivity [34]. External disturbances exacerbate this heterogeneity [22], making temporal stability a more responsive metric of ecosystem stress than absolute nutrient levels.

5. Conclusions

This study represents the first comprehensive assessment of the dynamic interplay between soil-available nitrogen and phosphorus and their temporal stability across the entire Tibetan alpine grasslands, advancing our understanding of alpine soil nutrient dynamics through three novel discoveries. First, radiation change emerged as a critical driver: it exerted direct effects on soil-available nitrogen/phosphorus and, in specific scenarios, surpassed the influences of climate warming and precipitation change—a finding that contrasts with prior research focusing primarily on temperature/precipitation, thereby highlighting radiation as an underestimated factor in alpine ecosystems.
Second, the relationships between the nutrient content changes and stability were non-linear and context-dependent, with synergistic (CITSI: 12.40–25.80% of areas; CDTSD: 18.74–41.80% of areas) and trade-off (CITSD: 16.36–52.03% of areas; CDTSI: 10.06–37.75% of areas) patterns. This heterogeneity underscores the need for spatially explicit models to capture ecosystem responses.
Critically, the temporal stability of soil nutrients may exhibit greater sensitivity to external disturbances than absolute contents, with stability change rates (−3081% to +3852%) far exceeding content change ranges (−356% to +948%) across the plateau. This suggests stability metrics may serve as more effective indicators of ecosystem stress than static nutrient levels alone.
These findings have three practical implications for high-altitude nutrient management: (1) incorporate radiation metrics into predictive models of alpine soil health, as traditional temperature/precipitation frameworks may underestimate nutrient dynamics; (2) prioritize degraded zones (18.74–41.80% of areas with declining content and stability) for targeted restoration strategies; and (3) redefine monitoring protocols to integrate temporal stability alongside absolute nutrient levels in soil health assessments.

Supplementary Materials

The following supporting information can be downloaded at https://www.mdpi.com/article/10.3390/agronomy15051255/s1, Figure S1: Structural equation model, showing the direct and indirect effects of geography position (longitude, latitude, elevation), mean climate conditions and maximum normalized difference vegetation index (GSP, GSRad, GST and NDVImax), the change rate of growing season precipitation, radiation, temperature and maximum normalized difference vegetation index (ΔGSP, ΔGSRad, ΔGST and ΔNDVImax), and the change rate of the temporal stability of growing season precipitation, radiation, temperature and maximum normalized difference vegetation index (ΔStabilityGSP, ΔStabilityGSRad, ΔStabilityGST, ΔStabilityNDVImax) on the relative changes of the contents of soil (a) ammonium nitrogen (NH4+–N) at 0–10 cm, (b) NH4+–N at 10–20 cm, (c) nitrate nitrogen (NO3–N) at 0–10 cm, (d) NO3–N at 10–20 cm, (e) available phosphorus (AP) at 0–10 cm and (f) AP at 10–20 cm caused by the combined effects of climate change and human activities in 2000–2020; Figure S2: Structural equation model, showing the direct and indirect effects of geography position (longitude, latitude, elevation), mean climate conditions (GSP, GSRad, GST), the change rate of growing season precipitation, radiation and temperature (ΔGSP, ΔGSRad, ΔGST), and the change rates of the temporal stability of growing season precipitation, radiation and temperature (ΔStabilityGSP, ΔStabilityGSRad, ΔStabilityGST) on the relative changes of the contents of soil (a) ammonium nitrogen (NH4+–N) at 0–10 cm, (b) NH4+–N at 10–20 cm, (c) nitrate nitrogen (NO3–N) at 0–10 cm, (d) NO3–N at 10–20 cm, (e) available phosphorus (AP) at 0–10 cm and (f) AP at 10–20 cm caused by the single effect of climate change in 2000–2020. Figure S3: Structural equation model, showing the direct and indirect effects of geography position (longitude, latitude, elevation), mean climate conditions and maximum normalized difference vegetation index (GSP, GSRad, GST and NDVImax), the change rate of growing season precipitation, radiation, temperature and maximum normalized difference vegetation index (ΔGSP, ΔGSRad, ΔGST and ΔNDVImax), and the change rate of the temporal stability of growing season precipitation, radiation, temperature and maximum normalized difference vegetation index (ΔStabilityGSP, ΔStabilityGSRad, ΔStabilityGST, ΔStabilityNDVImax) on the relative changes of the contents of soil (a) ammonium nitrogen (NH4+–N) at 0–10 cm, (b) NH4+–N at 10–20 cm, (c) nitrate nitrogen (NO3–N) at 0–10 cm, (d) NO3–N at 10–20 cm, (e) available phosphorus (AP) at 0–10 cm and (f) AP at 10–20 cm caused by the single effect of human activities in 2000–2020. Figure S4: Structural equation model, showing the direct and indirect effects of geography position (longitude, latitude, elevation), mean climate conditions and maximum normalized difference vegetation index (GSP, GSRad, GST and NDVImax), the change rate of growing season precipitation, radiation, temperature and maximum normalized difference vegetation index (ΔGSP, ΔGSRad, ΔGST and ΔNDVImax), and the change rate of the temporal stability of growing season precipitation, radiation, temperature and maximum normalized difference vegetation index (ΔStabilityGSP, ΔStabilityGSRad, ΔStabilityGST, ΔStabilityNDVImax) on the relative changes of the temporal stabilities of soil (a) ammonium nitrogen (NH4+–N) at 0–10 cm, (b) NH4+–N at 10–20 cm, (c) nitrate nitrogen (NO3–N) at 0–10 cm, (d) NO3–N at 10–20 cm, (e) available phosphorus (AP) at 0–10 cm and (f) AP at 10–20 cm caused by the combined effects of climate change and human activities in 2000–2020. Figure S5: Structural equation model, showing the direct and indirect effects of geography position (longitude, latitude, elevation), mean climate conditions (GSP, GSRad, GST), the change rate of growing season precipitation, radiation and temperature (ΔGSP, ΔGSRad, ΔGST), and the change rate of the temporal stability of growing season precipitation, radiation and temperature (ΔStabilityGSP, ΔStabilityGSRad, ΔStabilityGST) on the relative changes of the temporal stabilities of soil (a) ammonium nitrogen (NH4+–N) at 0–10 cm, (b) NH4+–N at 10–20 cm, (c) nitrate nitrogen (NO3–N) at 0–10 cm, (d) NO3–N at 10–20 cm, (e) available phosphorus (AP) at 0–10 cm and (f) AP at 10–20 cm caused by the single effect of climate change in 2000–2020. Figure S6: Structural equation model, showing the direct and indirect effects of geography position (longitude, latitude, elevation), mean climate conditions and maximum normalized difference vegetation index (GSP, GSRad, GST and NDVImax), the change rate of growing season precipitation, radiation, temperature and maximum normalized difference vegetation index (ΔGSP, ΔGSRad, ΔGST and ΔNDVImax), and the change rate of the temporal stability of growing season precipitation, radiation, temperature and maximum normalized difference vegetation index (ΔStabilityGSP, ΔStabilityGSRad, ΔStabilityGST, ΔStabilityNDVImax) on the relative changes of the temporal stabilities of soil (a) ammonium nitrogen (NH4+–N) at 0–10 cm, (b) NH4+–N at 10–20 cm, (c) nitrate nitrogen (NO3–N) at 0–10 cm, (d) NO3–N at 10–20 cm, (e) available phosphorus (AP) at 0–10 cm and (f) AP at 10–20 cm caused by the single effect of human activities in 2000–2020.

Author Contributions

Writing—original draft preparation, G.Z., R.D. and G.F.; writing—review and editing, G.Z., R.D., W.S. and G.F. All authors have read and agreed to the published version of the manuscript.

Funding

This research was funded by the Xizang Autonomous Region Science and Technology Project [XZ202401ZY0074, XZ202501ZY0086, QYXTZX-RKZ2025-03-1, XZ202401JD0029, XZ202501ZY0056]; the Tibet Autonomous Region Science and Technology Plan—Central Government Guidance Fund for Local S&T Development Projects [RKZ2024ZYYDDFXM-02]; and the Lhasa Science and Technology Plan Project [LSKJ202422].

Data Availability Statement

The data that support the findings of this study are available from the corresponding author upon request.

Conflicts of Interest

The authors declare no conflicts of interest.

References

  1. Ding, R.; Qin, Y.; Li, T.Y.; Fu, G. Exploring spatiotemporal dynamics in temporal stability of soil carbon, nitrogen, phosphorus, and pH in Tibetan grasslands. Geoderma 2024, 451, 117062. [Google Scholar] [CrossRef]
  2. Mahaut, L.; Choler, P.; Denelle, P.; Garnier, E.; Thuiller, W.; Kattge, J.; Lemauviel-Lavenant, S.; Lavorel, S.; Munoz, F.; Renard, D.; et al. Trade-offs and synergies between ecosystem productivity and stability in temperate grasslands. Glob. Ecol. Biogeogr. 2023, 32, 561–572. [Google Scholar] [CrossRef]
  3. Liu, J.S.; Li, X.F.; Ma, Q.H.; Zhang, X.; Chen, Y.; Isbell, F.; Wang, D.L. Nitrogen addition reduced ecosystem stability regardless of its impacts on plant diversity. J. Ecol. 2019, 107, 2427–2435. [Google Scholar] [CrossRef]
  4. Zelnik, Y.R.; Arnoldi, J.F.; Loreau, M. The Impact of Spatial and Temporal Dimensions of Disturbances on Ecosystem Stability. Front. Ecol. Evol. 2018, 6, 224. [Google Scholar] [CrossRef]
  5. Yang, G.J.; Hautier, Y.; Zhang, Z.J.; Lu, X.T.; Han, X.G. Decoupled responses of above- and below-ground stability of productivity to nitrogen addition at the local and larger spatial scale. Glob. Change Biol. 2022, 28, 2711–2720. [Google Scholar] [CrossRef] [PubMed]
  6. Wang, Y.; Ren, Z.; Ma, P.P.; Wang, Z.M.; Niu, D.C.; Fu, H.; Elser, J.J. Effects of grassland degradation on ecological stoichiometry of soil ecosystems on the Qinghai-Tibet Plateau. Sci. Total Environ. 2020, 722, 137910. [Google Scholar] [CrossRef]
  7. Dolezal, J.; Fibich, P.; Altman, J.; Leps, J.; Uemura, S.; Takahashi, K.; Hara, T. Determinants of ecosystem stability in a diverse temperate forest. Oikos 2020, 129, 1692–1703. [Google Scholar] [CrossRef]
  8. Sha, Z.Y.; Xie, Y.C.; Tan, X.C.; Bai, Y.F.; Li, J.; Liu, X.F. Assessing the impacts of human activities and climate variations on grassland productivity by partial least squares structural equation modeling (PLS-SEM). J. Arid Land 2017, 9, 473–488. [Google Scholar] [CrossRef]
  9. Zhang, T.; Zhang, Y.J.; Xu, M.J.; Zhu, J.T.; Chen, N.; Jiang, Y.B.; Huang, K.; Zu, J.X.; Liu, Y.J.; Yu, G.R. Water availability is more important than temperature in driving the carbon fluxes of an alpine meadow on the Tibetan Plateau. Agric. For. Meteorol. 2018, 256, 22–31. [Google Scholar] [CrossRef]
  10. Zhang, X.Z.; Shen, Z.X.; Fu, G. A meta-analysis of the effects of experimental warming on soil carbon and nitrogen dynamics on the Tibetan Plateau. Appl. Soil Ecol. 2015, 87, 32–38. [Google Scholar] [CrossRef]
  11. Wang, C.; Long, R.; Wang, Q.; Jing, Z.; Shang, Z.; Ding, L. Distribution of organic matter, nitrogen and phosphorus along an altitude gradient and productivity change and their relationships with environmental factors in the Alpine meadow. Acta Prataculturae Sin. 2005, 14, 15–20. [Google Scholar]
  12. Tian, L.M.; Zhao, L.; Wu, X.D.; Hu, G.J.; Fang, H.B.; Zhao, Y.H.; Sheng, Y.; Chen, J.; Wu, J.C.; Li, W.P.; et al. Variations in soil nutrient availability across Tibetan grassland from the 1980s to 2010s. Geoderma 2019, 338, 197–205. [Google Scholar] [CrossRef]
  13. Du, Y.G.; Ke, X.; Guo, X.W.; Cao, G.M.; Zhou, H.K. Soil and plant community characteristics under long-term continuous grazing of different intensities in an alpine meadow on the Tibetan plateau. Biochem. Syst. Ecol. 2019, 85, 72–75. [Google Scholar] [CrossRef]
  14. Jiang, L.L.; Wang, S.P.; Pang, Z.; Wang, C.S.; Meng, F.D.; Lan, Z.C.; Zhou, X.Q.; Li, Y.M.; Zhang, Z.H.; Luo, C.Y.; et al. Abiotic and biotic controls of soil dissolved organic nitrogen along a precipitation gradient on the Tibetan plateau. Plant Soil 2021, 459, 65–78. [Google Scholar] [CrossRef]
  15. He, Y.C.; Sun, J.; Xiong, J.N.; Shang, H.; Wang, X. Patterns, Dynamics, and Drivers of Soil Available Nitrogen and Phosphorus in Alpine Grasslands across the QingZang Plateau. Remote Sens. 2022, 14, 4929. [Google Scholar] [CrossRef]
  16. Wang, Z.; Wang, J.; Huang, L.; Shao, M.A. Patterns and driving factors of soil nutrient stoichiometry under three land use types in the alpine region of Tibet, China. J. Soils Sediments 2024, 24, 901–913. [Google Scholar] [CrossRef]
  17. Closa, I.; Irigoyen, J.J.; Goicoechea, N. Microclimatic conditions determined by stem density influence leaf anatomy and leaf physiology of beech (Fagus sylvatica L.) growing within stands that naturally regenerate from clear-cutting. Trees-Struct. Funct. 2010, 24, 1029–1043. [Google Scholar] [CrossRef]
  18. Li, R.; Zhao, L.; Ding, Y.J.; Shen, Y.P.; Du, E.J.; Liu, G.Y. The Effect of Global Radiation Budget on Seasonal Frozen Depth in the Tibetan Plateau. J. Glaciol. Geocryol. 2009, 31, 422–430. [Google Scholar]
  19. Méndez, M.S.; Martinez, M.L.; Araujo, P.I.; Austin, A.T. Solar radiation exposure accelerates decomposition and biotic activity in surface litter but not soil in a semiarid woodland ecosystem in Patagonia, Argentina. Plant Soil 2019, 445, 483–496. [Google Scholar] [CrossRef]
  20. Fu, G.; Sun, W.; Li, S.; Zhang, J.; Yu, C.; Shen, Z. Modeling aboveground biomass using MODIS images and climatic data in grasslands on the Tibetan Plateau. J. Resour. Ecol. 2017, 8, 42–49. [Google Scholar]
  21. Sun, W.; Qi, H.; Li, T.; Qin, Y.; Fu, G.; Han, F.; Wang, S.; Pan, X. Modelling soil ammonium nitrogen, nitrate nitrogen and available phosphorus using normalized difference vegetation index and climate data in Xizang’s grasslands. Sustainability 2024, 16, 4695. [Google Scholar] [CrossRef]
  22. Zhang, G.; Fu, G. Changes in soil organic carbon, total nitrogen and total phosphorus in 2000–2020 and their driving mechanisms in Tibetan alpine grasslands. Glob. Planet. Change 2024, 239, 104484. [Google Scholar] [CrossRef]
  23. Cotrufo, M.F.; Ranalli, M.G.; Haddix, M.L.; Six, J.; Lugato, E. Soil carbon storage informed by particulate and mineral-associated organic matter. Nat. Geosci. 2019, 12, 989–994. [Google Scholar] [CrossRef]
  24. Tonn, B.; Porath, I.; Lattanzi, F.A.; Isselstein, J. Urine effects on grass and legume nitrogen isotopic composition: Pronounced short-term dynamics of delta N-15. PLoS ONE 2019, 14, e0210623. [Google Scholar] [CrossRef]
  25. Nergui, T.; Evans, R.D.; Adam, J.C.; Chung, S.H. Relationships between the El Nino-Southern Oscillation, precipitation, and nitrogen wet deposition rates in the contiguous United States. Glob. Biogeochem. Cycles 2016, 30, 1712–1724. [Google Scholar] [CrossRef]
  26. Zhang, W.; Shou, S.W.; Yang, J.H.; Liu, J. Analysis on Change of Precipitation Extreme Values in Flood Season over Northwest China in Recent 45 Years. J. Arid Land Resour. Environ. 2007, 21, 126–132. [Google Scholar]
  27. Liu, M.; Shen, Y.J.; Qi, Y.Q.; Wang, Y.F.; Geng, X.X. Changes in Precipitation and Drought Extremes over the Past Half Century in China. Atmosphere 2019, 10, 203. [Google Scholar] [CrossRef]
  28. Li, S.; Wang, K. Seasonal Distribution of Soil Nutrients and Their Response to the Plant Diversity of Karst Mountain Grassland. J. Soil Water Conserv. 2016, 30, 199–205. [Google Scholar]
  29. Hu, W.J.; Tan, J.R.; Shi, X.R.; Lock, T.R.; Kallenbach, R.L.; Yuan, Z.Y. Nutrient addition and warming alter the soil phosphorus cycle in grasslands: A global meta-analysis. J. Soils Sediments 2022, 22, 2608–2619. [Google Scholar] [CrossRef]
  30. Ren, H.Y.; Kang, J.; Yuan, Z.Y.; Xu, Z.W.; Han, G.D. Responses of nutrient resorption to warming and nitrogen fertilization in contrasting wet and dry years in a desert grassland. Plant Soil 2018, 432, 65–73. [Google Scholar] [CrossRef]
  31. He, Y.L.; Wang, J.S.; Tian, D.; Quan, Q.; Jiang, L.; Ma, F.F.; Yang, L.; Zhang, F.Y.; Zhou, Q.P.; Niu, S.L. Long-term drought aggravates instability of alpine grassland productivity to extreme climatic event. Ecology 2022, 103, e3792. [Google Scholar] [CrossRef] [PubMed]
  32. Chen, H.; Wen, X.; Zeng, J.; Pu, T.; Yang, W.; Wang, X. Effects of Combined Applications of Nitrogen and Phosphorus on Soil Enzyme Activities and Soil Available Nutrition in Maize -soybean Relay Intercropping System. Acta Agric. Boreali-Sin. 2020, 35, 133–143. [Google Scholar]
  33. Roshan, A.; Biswas, A. Fire-induced geochemical changes in soil: Implication for the element cycling. Sci. Total Environ. 2023, 868, 161714. [Google Scholar] [CrossRef] [PubMed]
  34. Collins, S.L.; Avolio, M.L.; Gries, C.; Hallett, L.M.; Koerner, S.E.; La Pierre, K.J.; Rypel, A.L.; Sokol, E.R.; Fey, S.B.; Flynn, D.F.B.; et al. Temporal heterogeneity increases with spatial heterogeneity in ecological communities. Ecology 2018, 99, 858–865. [Google Scholar] [CrossRef]
Figure 1. Spatial distribution of the relative changes in soil ammonium nitrogen (NH4+–N), nitrate nitrogen (NO3–N), and available phosphorus (AP) simultaneously driven by climate change and human activities. (a) NH4+–N at 0–10 cm (RCNH4_C+H0–10), (b) NO3–N at 0–10 cm (RCNO3_C+H0–10), (c) AP at 0–10 cm (RCAP_C+H0–10), (d) NH4+–N at 10–20 cm (RCNH4_C+H10–20), (e) NO3–N at 10–20 cm (RCNO3_C+H10–20), and (f) AP at 10–20 cm (RCAP_C+H10–20).
Agronomy 15 01255 g001
Figure 2. Spatial distribution of the relative changes in soil ammonium nitrogen (NH4+–N), nitrate nitrogen (NO3–N), and available phosphorus (AP) driven solely by climate change. (a) NH4+–N at 0–10 cm (RCNH4_C0–10), (b) NO3–N at 0–10 cm (RCNO3_C0–10), (c) AP at 0–10 cm (RCAP_C0–10), (d) NH4+–N at 10–20 cm (RCNH4_C10–20), (e) NO3–N at 10–20 cm (RCNO3_C10–20), and (f) AP at 10–20 cm (RCAP_C10–20).
Agronomy 15 01255 g002
Figure 3. Spatial distribution of the relative changes in soil ammonium nitrogen (NH4+–N), nitrate nitrogen (NO3–N), and available phosphorus (AP) driven solely by human activities. (a) NH4+–N at 0–10 cm (RCNH4_H0–10), (b) NO3–N at 0–10 cm (RCNO3_H0–10), (c) AP at 0–10 cm (RCAP_H0–10), (d) NH4+–N at 10–20 cm (RCNH4_H10–20), (e) NO3–N at 10–20 cm (RCNO3_H10–20), and (f) AP at 10–20 cm (RCAP_H10–20).
Agronomy 15 01255 g003
Figure 4. Spatial distribution of the relative changes in the temporal stability of soil ammonium nitrogen (NH4+–N), nitrate nitrogen (NO3–N), and available phosphorus (AP) driven simultaneously by climate change and human activities. (a) NH4+–N at 0–10 cm (RC_StabilityNH4_C+H0–10), (b) NO3–N at 0–10 cm (RC_StabilityNO3_C+H0–10), (c) AP at 0–10 cm (RC_StabilityAP_C+H0–10), (d) NH4+–N at 10–20 cm (RC_StabilityNH4_C+H10–20), (e) NO3–N at 10–20 cm (RC_StabilityNO3_C+H10–20), and (f) AP at 10–20 cm (RC_StabilityAP_C+H10–20).
Agronomy 15 01255 g004
Figure 5. Spatial distribution of the relative changes in the temporal stability of soil ammonium nitrogen (NH4+–N), nitrate nitrogen (NO3–N), and available phosphorus (AP) driven solely by climate change. (a) NH4+–N at 0–10 cm (RC_StabilityNH4_C0–10), (b) NO3–N at 0–10 cm (RC_StabilityNO3_C0–10), (c) AP at 0–10 cm (RC_StabilityAP_C0–10), (d) NH4+–N at 10–20 cm (RC_StabilityNH4_C10–20), (e) NO3–N at 10–20 cm (RC_StabilityNO3_C10–20), and (f) AP at 10–20 cm (RC_StabilityAP_C10–20).
Agronomy 15 01255 g005
Figure 6. Spatial distribution of the relative changes in the temporal stability of soil ammonium nitrogen (NH4+–N), nitrate nitrogen (NO3–N), and available phosphorus (AP) solely driven by human activities. (a) NH4+–N at 0–10 cm (RC_StabilityNH4_H0–10), (b) NO3–N at 0–10 cm (RC_StabilityNO3_H0–10), (c) AP at 0–10 cm (RC_StabilityAP_H0–10), (d) NH4+–N at 10–20 cm (RC_StabilityNH4_H10–20), (e) NO3–N at 10–20 cm (RC_StabilityNO3_H10–20), and (f) AP at 10–20 cm (RC_StabilityAP_H10–20).
Agronomy 15 01255 g006
Figure 7. Spatial distribution in which both the content and temporal stability of soil ammonium nitrogen (NH4+–N), nitrate nitrogen (NO3–N), and available phosphorus (AP) change, driven by the combined effects of climate change and human activities. (a) NH4+–N at 0–10 cm (NH4C+H0–10), (b) NO3–N at 0–10 cm (NO3C+H0–10), (c) AP at 0–10 cm (APC+H0–10), (d) NH4+–N at 10–20 cm (NH4C+H10–20), (e) NO3–N at 10–20 cm (NO3C+H10–20), and (f) AP at 10–20 cm (APC+H10–20). CITSI: both the content and temporal stability increase; CDTSI: the content decreases while the temporal stability increases; CDTSD: both the content and temporal stability decrease; CITSD: the content increases while the temporal stability decreases.
Agronomy 15 01255 g007
Figure 8. Spatial distribution in which both the content and temporal stability of soil ammonium nitrogen (NH4+–N), nitrate nitrogen (NO3–N), and available phosphorus (AP) change, driven by the single effect of climate change. (a) NH4+–N at 0–10 cm (NH4C0–10), (b) NO3–N at 0–10 cm (NO3C0–10), (c) AP at 0–10 cm (APC0–10), (d) NH4+–N at 10–20 cm (NH4C10–20), (e) NO3–N at 10–20 cm (NO3C10–20), and (f) AP at 10–20 cm (APC10–20). CITSI: both the content and temporal stability increase; CDTSI: the content decreases while the temporal stability increases; CDTSD: both the content and temporal stability decrease; CITSD: the content increases while the temporal stability decreases.
Agronomy 15 01255 g008
Figure 9. Spatial distribution patterns in which both the content and temporal stability of soil ammonium nitrogen (NH4+–N), nitrate nitrogen (NO3–N), and available phosphorus (AP) change, driven by the single effect of human activities. (a) NH4+–N at 0–10 cm (NH4H0–10), (b) NO3–N at 0–10 cm (NO3H0–10), (c) AP at 0–10 cm (APH0–10), (d) NH4+–N at 10–20 cm (NH4H10–20), (e) NO3–N at 10–20 cm (NO3H10–20), and (f) AP at 10–20 cm (APH10–20). CITSI: both the content and temporal stability increase; CDTSI: the content decreases while the temporal stability increases; CDTSD: both the content and temporal stability decrease; CITSD: the content increases while the temporal stability decreases.
Agronomy 15 01255 g009
Table 1. The area ratio of the increase and decrease in soil-available nitrogen and phosphorus and their spatial average values and the maximum, minimum, and mean values of all pixels. C+H: climate change and human activities; C: climate change; H: human activities.
Soil DepthScenesVariablesDecreaseIncreaseAcross All Pixels
Area Ratio (%)MeanArea Ratio (%)MeanMinimumMaximumMean
0–10C+HRC_StabilityNH4_C+H0–1040.44−9.3659.5616.78−256.73369.886.21
RC_StabilityNO3_C+H0–1057.53−21.3642.4717.63−93.38151.66−4.80
RC_StabilityAP_C+H0–1042.98−6.3657.028.01−60.9678.831.84
CRC_StabilityNH4_C0–1047.22−12.1552.7814.12−57.1384.631.72
RC_StabilityNO3_C0–1051.17−5.3448.836.44−28.2945.460.41
RC_StabilityAP_C0–1064.51−13.4235.4910.13−77.7474.94−5.06
HRC_StabilityNH4_H0–1040.65−14.3759.3520.17−216.85485.616.13
RC_StabilityNO3_H0–1061.57−20.1238.4317.80−84.04158.88−5.55
RC_StabilityAP_H0–1030.08−9.3769.9214.98−74.62129.467.66
10–20C+HRC_StabilityNH4_C+H10–2066.30−12.9833.7016.01−355.95511.87−3.21
RC_StabilityNO3_C+H10–2059.41−18.8740.5917.57−106.29157.24−4.08
RC_StabilityAP_C+H10–2033.69−8.5966.3115.88−59.72111.547.64
CRC_StabilityNH4_C10–2070.02−14.4429.988.88−178.58164.35−7.45
RC_StabilityNO3_C10–2060.37−6.2039.625.93−47.4471.16−1.39
RC_StabilityAP_C10–2044.13−8.8555.8715.86−49.30125.984.95
HRC_StabilityNH4_H10–2045.48−11.5254.5220.49−317.93947.565.93
RC_StabilityNO3_H10–2059.90−17.0940.1018.38−111.44144.16−2.86
RC_StabilityAP_H10–2042.39−13.0057.6117.89−92.54127.254.79
Table 2. The area ratio of the increase and decrease in the temporal stability of soil-available nitrogen and phosphorus and their spatial average values and the maximum, minimum, and mean values of all pixels. C+H: climate change and human activities; C: climate change; H: human activities.
Soil DepthScenesVariablesDecreaseIncreaseAcross All Pixels
Area Ratio (%)MeanArea Ratio (%)MeanMinimumMaximumMean
0–10C+HRC_StabilityNH4_C+H0–1068.51−53.3531.4963.09−3081.023852.73−16.68
RC_StabilityNO3_C+H0–1061.52−39.9338.4863.77−1324.641955.08−0.03
RC_StabilityAP_C+H0–1059.28−45.3340.7269.68−1404.242248.191.50
CRC_StabilityNH4_C0–1060.85−37.4339.1545.88−970.251170.72−4.81
RC_StabilityNO3_C0–1055.49−42.4144.5172.35−1084.251716.378.67
RC_StabilityAP_C0–1064.89−41.1635.1148.79−544.661649.93−9.58
HRC_StabilityNH4_H0–1058.61−43.5041.3965.32−2238.862598.691.54
RC_StabilityNO3_H0–1058.03−41.9741.9762.16−1230.51525.901.74
RC_StabilityAP_H0–1072.03−51.4427.9754.35−980.601340.81−21.86
10–20C+HRC_StabilityNH4_C+H10–2059.19−53.4440.8180.99−1695.252631.091.42
RC_StabilityNO3_C+H10–2058.02−38.1941.9869.73−1360.421422.817.12
RC_StabilityAP_C+H10–2060.60−42.3839.4063.94−1334.381973.22−0.49
CRC_StabilityNH4_C10–2048.64−36.4251.3665.86−981.281483.5516.11
RC_StabilityNO3_C10–2060.80−44.1239.2060.81−1566.91550.42−2.99
RC_StabilityAP_C10–2063.92−36.4236.0849.00−1178.441014.69−5.61
HRC_StabilityNH4_H10–2056.66−46.5543.3468.38−1496.571698.803.26
RC_StabilityNO3_H10–2057.86−40.1642.1464.95−1049.032465.674.13
RC_StabilityAP_H10–2059.70−46.2940.3061.39−1172.731661.63−2.90
Table 3. The proportion of the areas of relative changes in both soil-available nitrogen and phosphorus and their temporal stability. C+H: climate change and human activities; C: climate change; H: human activities.
Soil DepthScenesVariablesCITSICDTSICDTSDCITSD
0–10C+HNH4+-NC+H0-1019.2312.2528.1940.33
NO3-NC+H0-1015.3723.1234.4127.11
APC+H0-1021.6819.0323.9535.34
CNH4+-NC0-1022.0417.1230.1130.74
NO3-NC0-1024.8919.6231.5623.93
APC0-1012.4022.7141.8023.09
HNH4+-NH0-1024.7316.6524.0034.62
NO3-NH0-1016.6625.3136.2621.77
APH0-1017.9010.0620.0252.03
10–20C+HNH4+-NC+H10-2015.5325.2741.0218.17
NO3-NC+H10-2016.3925.6033.8124.20
APC+H10-2024.4514.9418.7441.86
CNH4+-NC10-2013.6237.7532.2816.36
NO3-NC10-2016.7722.4437.9422.86
APC10-2025.8010.2833.8530.08
HNH4+-NH10-2024.3918.9426.5430.13
NO3-NH10-2015.8526.2933.6124.25
APH10-2024.9215.3827.0132.69
CITSI: both the content and temporal stability increase; CDTSI: the content decreases while the temporal stability increases; CDTSD: both the content and temporal stability decrease; CITSD: the content increases while the temporal stability decreases.
Disclaimer/Publisher’s Note: The statements, opinions and data contained in all publications are solely those of the individual author(s) and contributor(s) and not of MDPI and/or the editor(s). MDPI and/or the editor(s) disclaim responsibility for any injury to people or property resulting from any ideas, methods, instructions or products referred to in the content.

