1. Introduction
In recent decades, China’s citrus industry has experienced rapid development, with the planting area continuously expanding [
1]. Citrus pests and diseases have long been major constraints on citrus growth and development, significantly affecting yield and quality, and posing a serious threat to the citrus industry [
2]. Therefore, creating an accurate, efficient, and automated approach for detecting pests and diseases in citrus is essential for effective management and for promoting the long-term sustainability of the citrus sector.
Traditional citrus pest and disease detection methods rely heavily on manual observation, which is labor-intensive, requires substantial human resources, and is prone to subjective bias, resulting in low detection efficiency [
3]. To improve both accuracy and efficiency, automated detection systems based on deep learning and computer vision have emerged as a research hotspot in recent years [
4]. By collecting image data of plants and analyzing it through deep learning models, these systems can significantly enhance the precision and efficiency of pest and disease detection, enabling real-time monitoring of large-scale agricultural areas [
5]. The application of such technologies not only reduces dependence on manual inspection but also improves the accuracy of pest control, thereby decreasing the use of chemical pesticides, mitigating environmental pollution, and promoting sustainable agricultural development [
6]. Traditional machine learning methods, such as the Color Co-occurrence Method (CCM), analyze crop texture and color features in a straightforward manner and are typically evaluated under controlled laboratory conditions [
7]. For example, Sharif et al. [
8] enhanced input images and extracted feature points using an optimized weighted segmentation method and finally used a multi-class support vector machine (M-SVM) to classify citrus diseases based on selected features. However, traditional machine learning techniques often struggle in complex environments due to occlusion, varying lighting conditions, and other external interferences. They typically suffer from long processing times and poor robustness, making them insufficient for practical use in real-world scenarios [
9].
With the rise of artificial intelligence and the rapid development of deep learning technologies, significant breakthroughs have been achieved in image classification and object detection. Convolutional Neural Networks (CNNs) have demonstrated tremendous potential in image recognition tasks [
10]. These technologies have been widely applied in agricultural pest and disease detection, enabling automated and accurate identification by training models to recognize specific features of pests and diseases [
11]. Among the many deep learning models, the YOLO (You Only Look Once) series has become one of the most preferred object detection frameworks due to its high-speed real-time detection capabilities [
12]. YOLO models can simultaneously perform object localization and classification through a single forward pass, greatly improving detection efficiency [
13]. In agriculture, in particular, the high efficiency of YOLO models makes them highly valuable for real-time monitoring of pests and diseases [
14].
Although the YOLO series has achieved remarkable results in citrus pest and disease detection, challenges remain in detection accuracy under complex backgrounds, in the detection of small objects, and in robustness against occlusion [
15]. To address these issues, researchers have proposed various targeted improvements. Zhang et al. [
16] enhanced YOLOv4 by introducing a multi-scale feature fusion module, which improved the model’s ability to detect small objects and increased its robustness in complex environments. Similarly, Hu et al. [
17] improved YOLOv5 using techniques such as data augmentation and transfer learning, thereby enhancing the model’s generalization ability across different environments and achieving promising results in citrus pest and disease detection tasks. In addition, Xu et al. [
18] applied convolutional layer pruning in YOLOv4-Tiny to reduce parameter count and adopted efficient computation strategies that significantly improved detection speed, enabling real-time performance on resource-constrained devices. Li et al. [
19] proposed a lightweight strategy that integrated loss function optimization and attention mechanisms, effectively reducing redundant computation, enhancing real-time capability, and maintaining high detection accuracy even in low-power environments. However, despite the benefits of lightweight strategies in reducing computational complexity, limitations such as insufficient generalization and suboptimal small-object detection accuracy remain. To address these limitations, researchers have also explored methods such as multi-task learning and ensemble learning to further improve YOLO’s performance in citrus pest and disease detection. For example, Song et al. [
20] proposed a multi-task learning framework based on YOLOv5 that integrated object detection, image classification, and segmentation tasks, thereby improving the overall effectiveness of pest and disease identification. Meanwhile, the introduction of ensemble learning strategies has contributed to improved model stability and accuracy. By combining multiple YOLO models, ensemble learning effectively reduces the bias of individual models and enhances adaptability and robustness across various environments [
21]. Soeb et al. [
22] introduced a tea leaf pest and disease dataset and demonstrated the superior performance of YOLOv7 in object detection and recognition. Dai et al. [
23] improved YOLOv8 to significantly enhance accuracy and robustness in citrus disease detection, offering a feasible direction for developing more lightweight and efficient models. Recent studies have shown that YOLOv11 achieves the fastest detection and image processing speed in complex orchard environments [
24], and its performance surpasses that of many current mainstream models across various domains [
25,
26]. In summary, although numerous excellent modules and network architectures have been developed for crop pest and disease recognition, these approaches still commonly face challenges such as limited accuracy, simplified background settings, and large model sizes. Hence, it is crucial to enhance these techniques to effectively identify citrus pests and diseases amid challenging, ever-changing environments.
This paper proposes a high-precision and lightweight citrus pest and disease detection model named YOLOv11-RDTNet. Based on improvements to the YOLOv11 architecture, the proposed model addresses the limitations of detection performance in complex orchard environments. It enhances both the accuracy and speed of recognition while being lightweight. The model demonstrates significant effectiveness in the intelligent identification of citrus pests and diseases and offers valuable insights for the efficient detection of pests and diseases in other crops.
2. Materials and Methods
2.1. Materials
2.1.1. Data Acquisition
Diseased plants typically exhibit visible damage or alterations on leaves, stems, flowers, or fruits. In most cases, each type of plant pest or disease presents distinct symptoms that enable accurate identification based on visual characteristics. Among these plant parts, leaves are often the earliest to show signs of infection, making them a critical indicator for diagnosing plant abnormalities. Therefore, this study focused on citrus leaves as the primary research subject to investigate the diagnosis and identification of citrus pests and diseases.
To train and evaluate the proposed YOLOv11-RDTNet model for citrus pest and disease detection, a dedicated image dataset was constructed. The data for this study were collected in Lantian Village, No. 888, Xitang Fairy Tale Town, Aotou Town, Conghua District, Guangzhou City, Guangdong Province, China (latitude: 23.64241° N, longitude: 113.50641° E). Images of citrus leaves were captured using a smartphone under natural field conditions. To ensure diversity in the dataset, photos were taken at different times of day—between 9:00–12:00 a.m. and 2:00–5:00 p.m.—on sunny days, at a fixed distance of approximately 8 cm from the leaf surface. The dataset encompassed a wide range of lighting conditions, weather variations, and complex background scenarios. Additionally, particular attention was paid to capturing partially occluded leaves and small targets, in order to better simulate real-world detection challenges and improve model robustness in practical agricultural environments. The final dataset consisted of 1382 annotated images, covering five categories of citrus pests and diseases: anthracnose, canker, yellow vein disease, coal pollution disease, and leaf miner moth. The number of images per category was relatively balanced to ensure both diversity and representativeness of the dataset. Representative samples of each pest and disease type are shown in
Figure 1.
The Xiaomi 13 smartphone was utilized to photograph the visuals, each featuring a 1920 × 1080 pixel resolution and stored as JPG files. Precise annotations were performed on each infected leaf image using the LabelImg 1.8.6 tool, and the annotation results were saved in XML format to ensure compatibility with various algorithm requirements. The dataset was randomly divided into training, testing, and validation sets at a ratio of 8:1:1. The dataset split details are shown in
Table 1.
2.1.2. Data Enhancement
To enhance the generalization ability of the citrus pest and disease detection model, reduce its reliance on specific data features, and improve its adaptability to complex environments and diverse targets, a systematic data augmentation process was applied to the dataset in this study. Data augmentation involves applying various transformations to the original images to increase the diversity of training samples, effectively mitigating overfitting and improving the model’s robustness in real-world scenarios. A total of eight augmentation techniques were used to expand the dataset, including: random lighting adjustment [
27], horizontal flipping, contrast variation [
28], Gaussian noise [
29], salt-and-pepper noise [
30], saturation adjustment [
31], random scaling, and mosaic augmentation.
(1) Random lighting simulates variations in illumination conditions by randomly adjusting image brightness; (2) horizontal flipping simulates different shooting angles by randomly rotating images horizontally; (3) random contrast adjustment alters pixel brightness differences to generate high-contrast or low-contrast images, simulating image quality changes caused by camera settings or lighting; (4) Gaussian noise mimics sensor noise or blurring by randomly adding Gaussian noise, enhancing model robustness to low-quality images; (5) salt-and-pepper noise simulates extreme noise caused by sensor malfunction or signal interference, improving the model’s stability in noisy environments; (6) random saturation adjustment produces grayscale to highly saturated image variations, enhancing adaptability to color diversity; (7) random scaling simulates targets of varying sizes by randomly resizing target areas, improving multi-scale detection performance; and (8) mosaic augmentation stitches four different images into one, combining multiple targets and diverse backgrounds within a single image, thereby further expanding the diversity of training data and improving generalization in complex scenes.
Figure 2 showcases how data augmentation impacted the dataset. The final collection included a total of 12,438 images, made up of 11,056 augmented versions and 1382 original images, ensuring that there was no overlap between the training and validation groups. At that stage, the dataset compilation was complete.
2.2. YOLOv11-RDTNet Improvement
2.2.1. New Object Detection Algorithm: YOLOv11
YOLOv11 is the latest generation of object detection algorithms developed by Ultralytics. Building upon previous versions of the YOLO series, it introduces substantial improvements in both network architecture and training methodology, significantly enhancing detection speed, accuracy, and efficiency [
32]. In addition to traditional object detection, YOLOv11 extends its functionality to a variety of computer vision tasks, including instance segmentation, pose estimation, oriented object detection, image classification, and object tracking. As illustrated in
Figure 3, YOLOv11 adopts an improved backbone and neck design that greatly enhances feature extraction capabilities. The backbone utilizes a series of convolutional and deconvolutional layers, combined with residual connections and bottleneck structures, to reduce model complexity while maintaining strong performance. The neck, situated between the backbone and head, is responsible for feature fusion and enhancement, further boosting detection capability. Furthermore, YOLOv11 introduces new feature extraction modules such as C3K2 and C2PSA. The C3K2 module replaces the C2f module in YOLOv8 by using two small convolutional kernels (kernel size 2) instead of a single large kernel, improving computational efficiency while preserving feature representation. The C2PSA module incorporates a spatial attention mechanism that enhances the model’s focus on key regions, significantly improving the detection of small and overlapping objects. By refining the model’s ability to selectively attend to regions of interest, YOLOv11 outperforms previous versions in scenarios requiring fine-grained object recognition. It also retains the SPPF module from YOLOv8 to facilitate multi-scale feature fusion and further optimize inference speed. With a refined architecture and optimized training strategy, YOLOv11 achieves a better balance between speed and accuracy, demonstrating higher mean Average Precision (mAP) on the COCO dataset, faster inference, and fewer parameters compared to earlier versions. Owing to the incorporation of the C2PSA module, its performance on small and densely packed targets is notably enhanced [
33]. With robust cross-environment adaptability and support for diverse vision tasks, YOLOv11 proves to be a powerful tool for real-time computer vision applications across mobile and cloud-based platforms. Therefore, it was selected as the baseline model in this study.
2.2.2. Robust Feature Downsampling Module: RDF
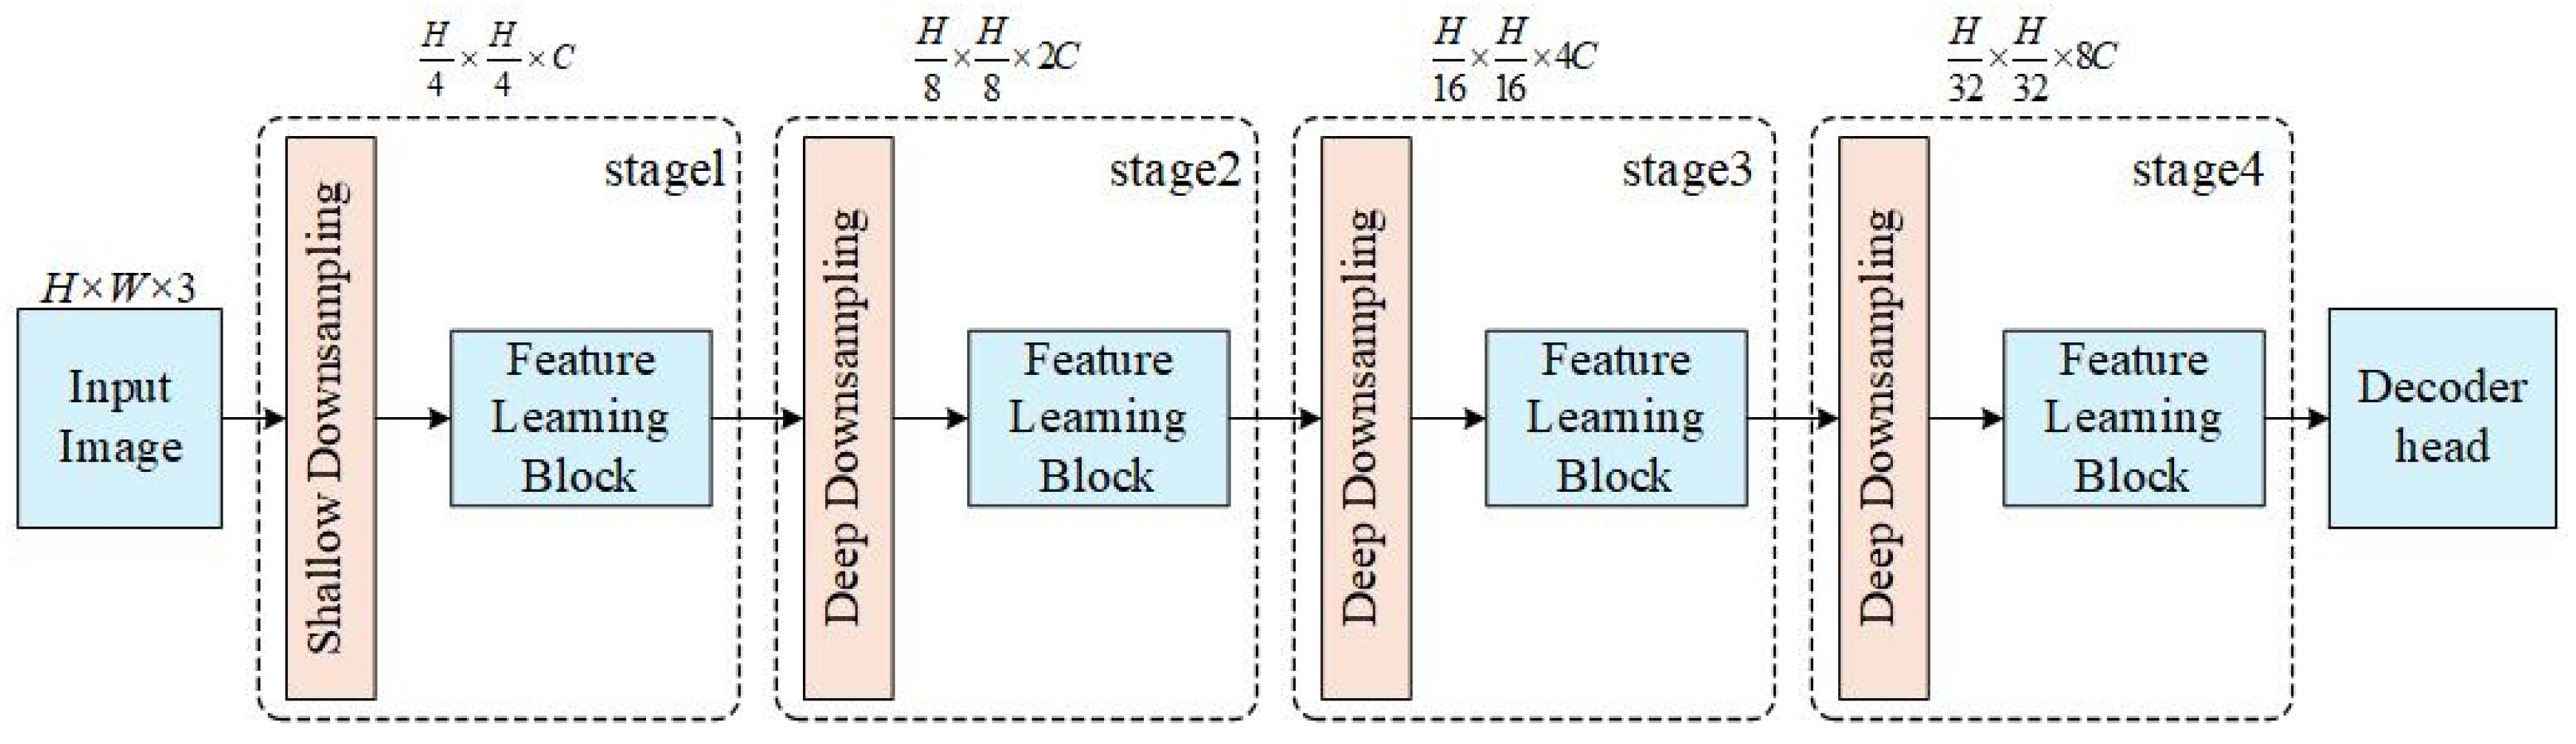
Robust Feature Downsampling (RFD) is a novel and general-purpose downsampling module [
34]. It has two variants: Shallow RFD (SRFD) and Deep RFD (DRFD), designed to optimize different stages of feature extraction and enhance feature robustness. Compared to conventional downsampling modules, RFD integrates multi-path downsampling features to improve the representational capability of feature maps while minimizing information loss.
Figure 4 shows RFD’s framework utilizing three distinct downsampling methods: convolutional, slicing-based, and max pooling. Each of these techniques offers unique characteristics and advantages, collectively contributing to the powerful performance of the RFD module.
The SRFD (Shallow Robust Feature Downsampling) module is specifically designed to process shallow feature maps and primarily consists of two key components: a feature enhancement layer and slice downsampling. The convolution layer in the feature enhancement stage extracts additional information from the input, thereby boosting the feature maps’ expressive power. Subsequently, the initial feature maps undergo slice-based downsampling, thereby retaining key details from the original dataset. This method preserves shallow features’ minute details while reducing data loss. In contrast, the DRFD (Deep Robust Feature Downsampling) module is designed to handle more complex feature maps by employing a variety of downsampling techniques. These methods include convolutional downsampling, max-pooling reduction, and slice-based downsampling, ensuring robust feature extraction across different layers. These techniques are combined to extract more robust and highly discriminative deep features, thus significantly improving the model’s overall performance in complex tasks. Convolutional downsampling preserves key texture information through filtering operations, max-pooling downsampling enhances local invariance by selecting maximum values in local regions, and slice downsampling reduces redundant information while retaining key features by processing the feature map in slices. By integrating these methods, the DRFD module not only maintains the structural integrity of feature maps but also ensures that critical details are not lost, thereby increasing the granularity of feature maps and further enhancing the model’s accuracy and robustness.
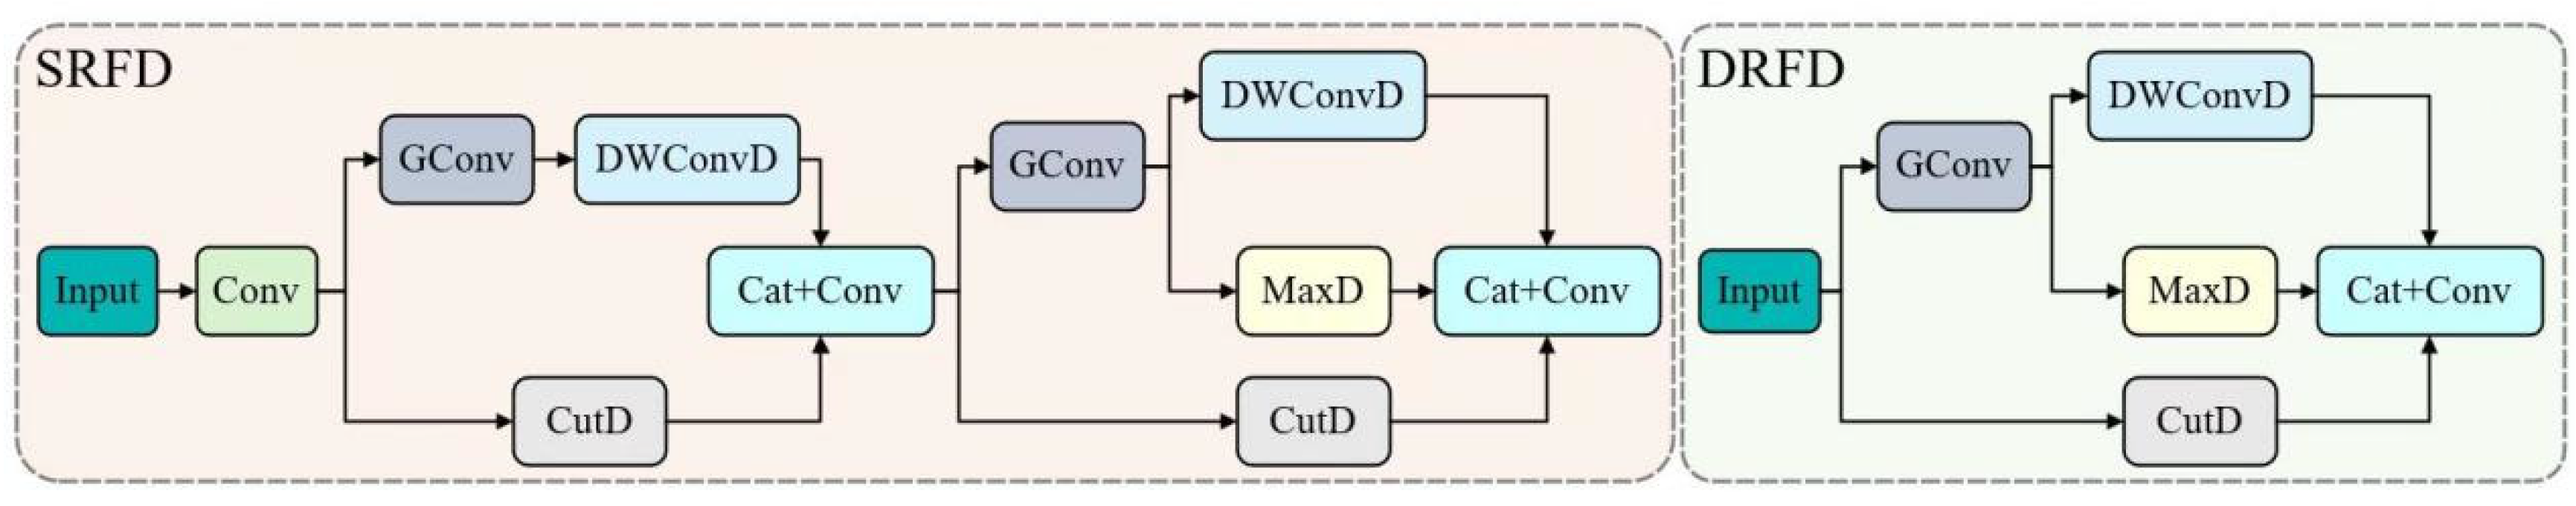
Figure 5 provides a comprehensive breakdown of the SRFD and DRFD architectures, highlighting key components: GConv (group convolution), DWConvD (Depthwise Separable Convolution Downsampling), CutD (slice downsampling), and MaxD (max-pooling downsampling). Each element plays a distinct role in the overall framework [
35]. Unlike traditional downsampling methods such as single convolution or pooling operations (as used in models like YOLOv5 and YOLOv8), the RFD module adopts a three-path fusion structure (convolution + slicing + max pooling) to retain more spatial structural information. Compared to similar structures like SPPF, the RFD module emphasizes robust downsampling and is specifically designed with shallow (SRFD) and deep (DRFD) branches to accommodate different receptive fields. Originally proposed in [
35] for remote sensing object detection, we are the first to introduce this structure to orchard pest and disease small-object detection, with structural adaptations and retraining, verifying its effectiveness in complex agricultural environments.
2.2.3. Dynamic Group Shuffle Transformer: DGST
To improve the accuracy and efficiency of object detection, researchers have continuously explored new network architectures and algorithms. The Dynamic Group Shuffle Transformer (DGST) was proposed under this background as an innovative technique [
36]. As shown in
Figure 6, the DGST module combines the ideas of Dynamic Group Convolution and Shuffle Transformer. Dynamic Group Convolution is a flexible convolutional operation that can dynamically adjust the grouping strategy according to the characteristics of the input data. Moreover, it can automatically adjust the number of groups based on task complexity, thus balancing computational cost and model performance. The Shuffle Transformer is an improved algorithm based on the Transformer architecture. It enhances the model’s generalization capability by applying a shuffle operation to the input sequence, enabling the model to better learn the intrinsic structure of the input data. The core concept of the DGST module adopts a 3:1 partition strategy, in which one-third of the module performs group convolution and channel shuffle operations. By replacing the fully connected layer with convolutional operations to achieve similar functionality, the original neck module is substituted. This design not only reduces computational requirements but also aligns better with the characteristics of convolutional neural networks, potentially offering superior performance for the model. By integrating the concepts of dynamic group convolution and shuffle transformation, DGST enhances the model’s feature extraction and representation capabilities, improving the accuracy and efficiency of object detection. At the same time, this design reduces computational demand and model size, providing better overall performance. The DGST module integrates the concepts of dynamic group convolution and the Shuffle Transformer. Unlike the static group convolutions used in ShuffleNet or MobileNet, DGST employs a dynamic allocation strategy, allowing the grouping structure to adapt to task variations, while the shuffle mechanism enhances cross-group information flow. Although this idea is inspired by lightweight network designs in [
36], we are the first to introduce it into the YOLOv11 architecture and tailor it specifically for object detection through structural pruning and lightweight optimization. This enhancement improves the representation capability for small-object detection while maintaining model efficiency. To our knowledge, this design has not yet been applied in agricultural pest and disease detection scenarios.
2.2.4. Task Align Dynamic Detection Head: TADDH
The Task Align Dynamic Detection Head (TADDH) is an innovative technique in the field of computer vision and deep learning that has demonstrated significant advantages in object detection tasks [
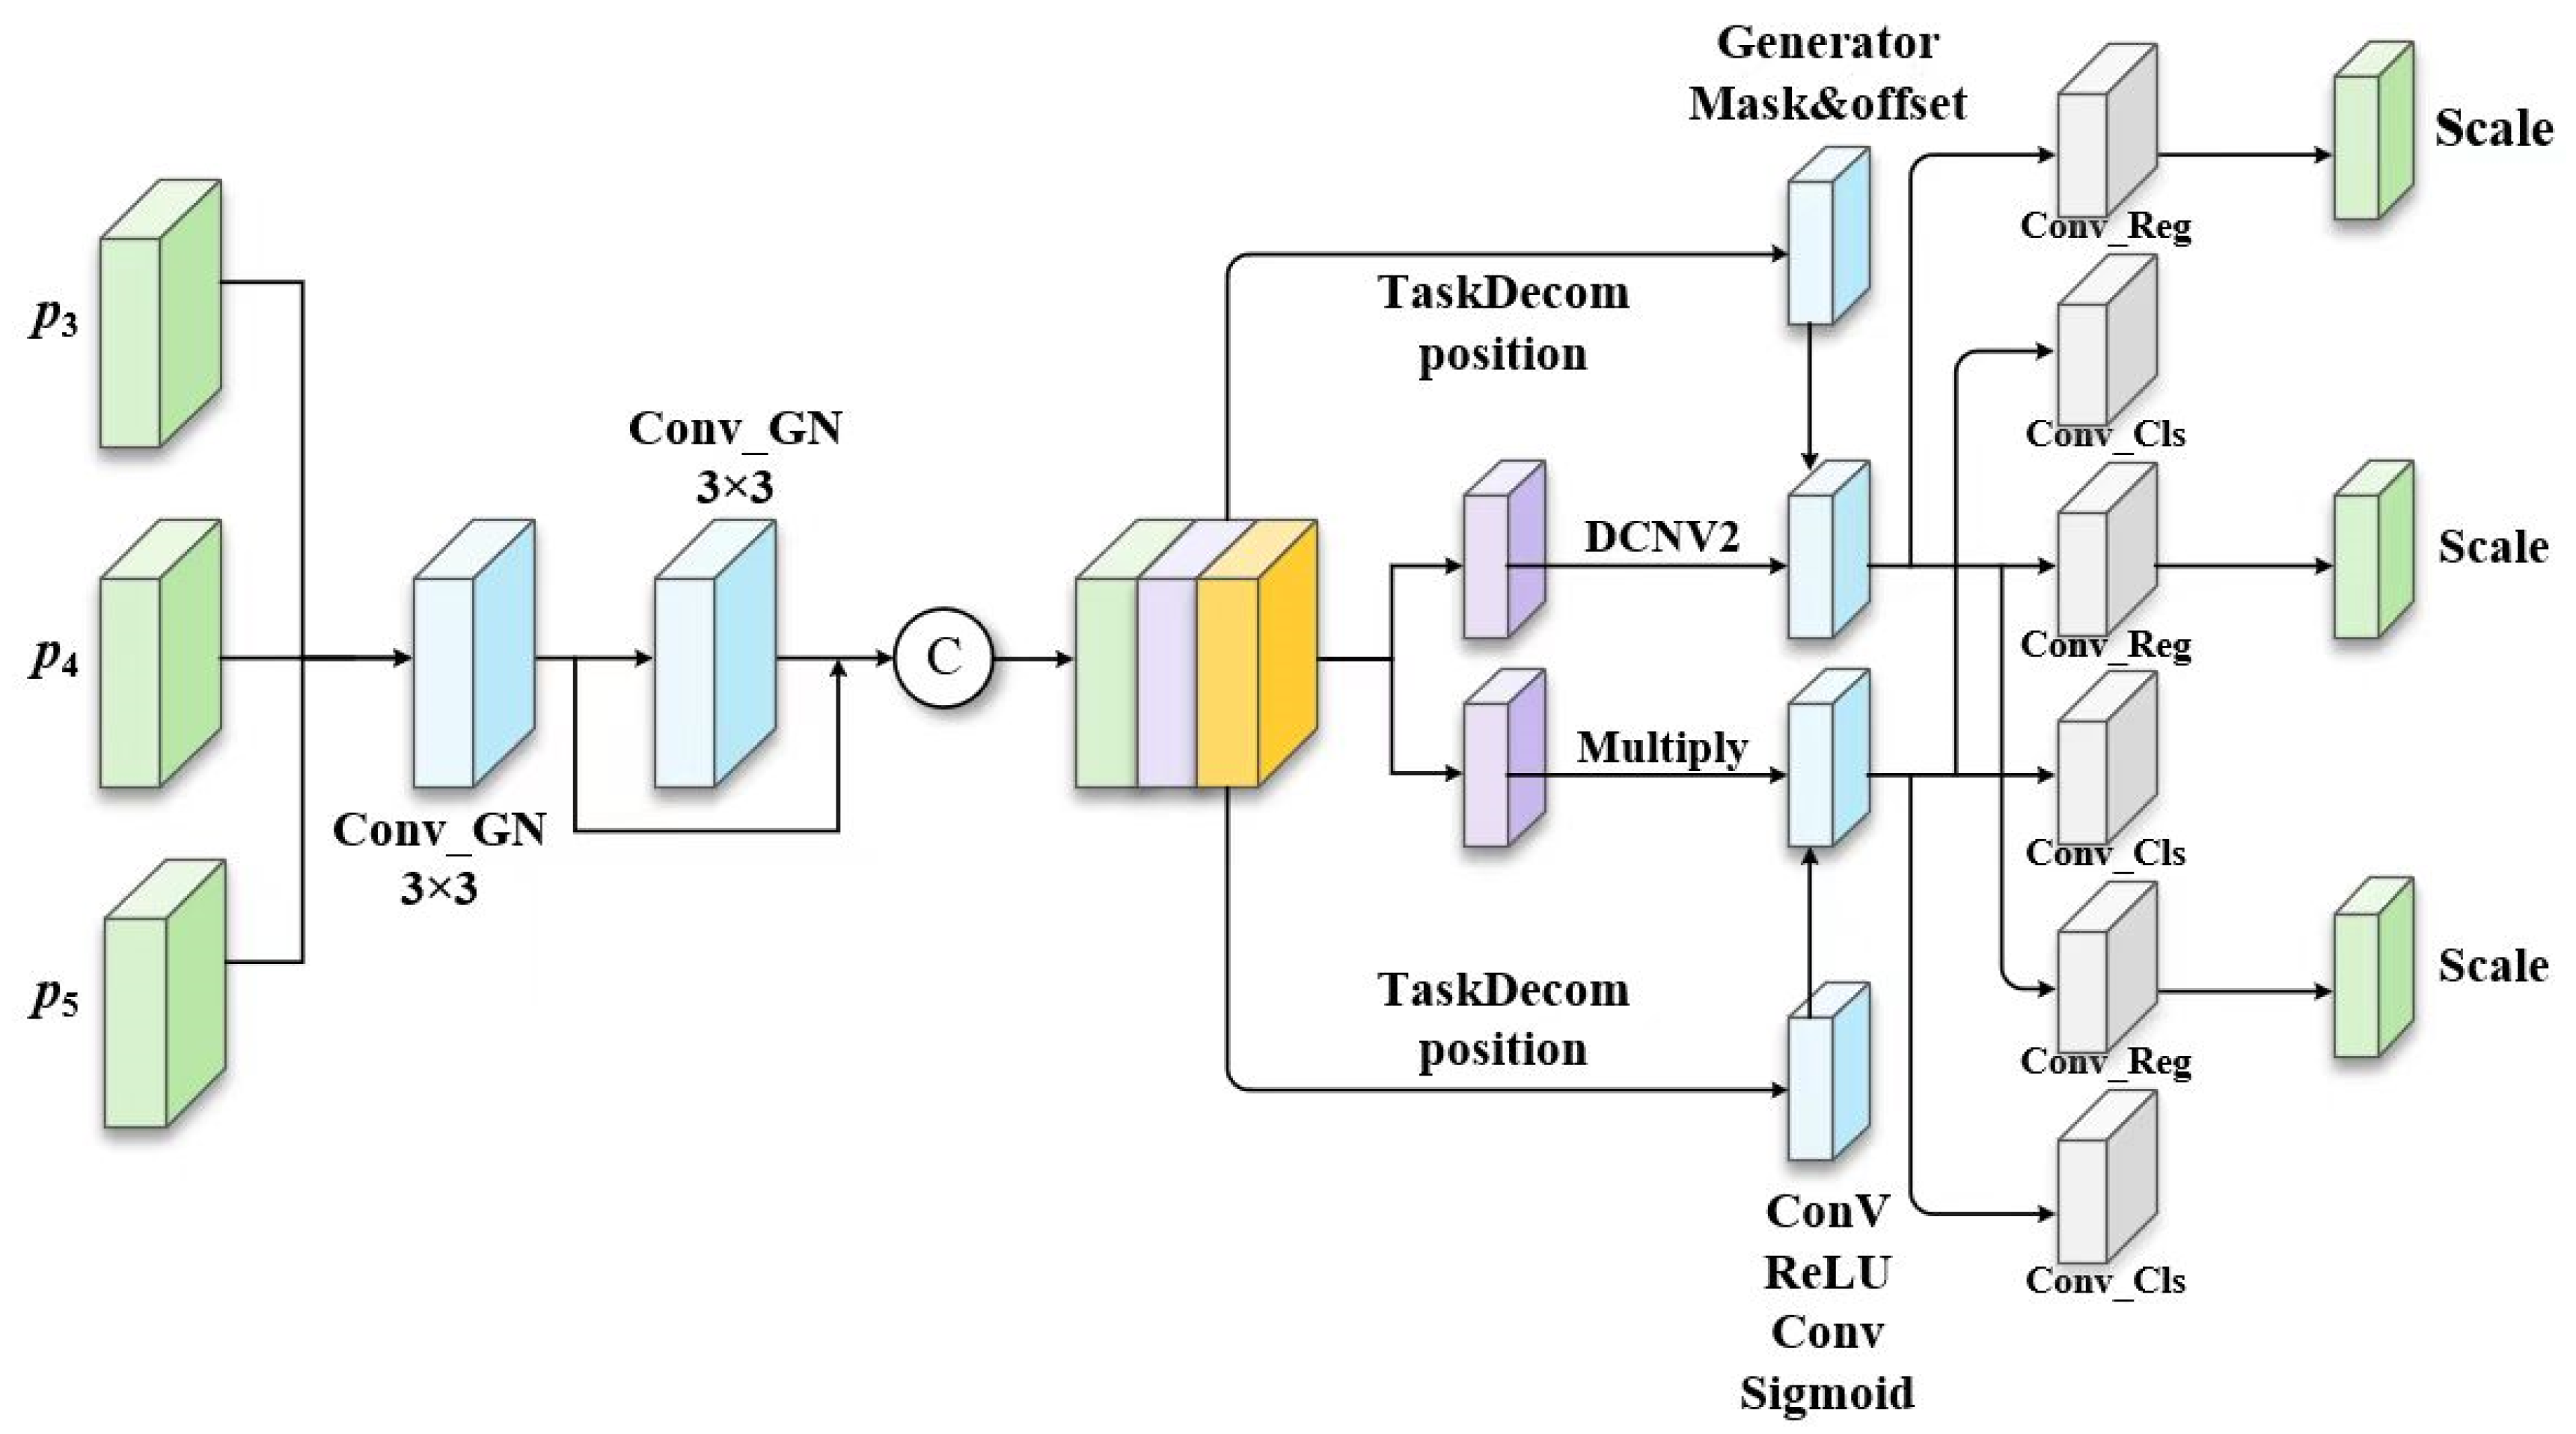
37]. It was proposed to address the inconsistency between the localization and classification tasks, which are often handled independently in conventional object detection models. Such separation can result in accurate localization but incorrect classification, or vice versa. The TADDH dynamically aligns these two tasks to improve the overall performance of the model. As illustrated in
Figure 7, the TADDH employs shared convolutional layers to substantially reduce the number of parameters, making the model lighter and more suitable for deployment on resource-constrained devices. To accommodate the varying object scales targeted by different detection heads, it introduces a scale adjustment layer that adapts the resolution of the feature maps. An interactive feature learner, utilizing multiple convolutional layers, extracts and amalgamates representations for intertask interactions. In the localization branch, the TADDH integrates these interactive features with DCNv2 (Deformable Convolutional Network v2) to generate the necessary offsets and modulation masks for deformable sampling. In the classification branch, the interactive features enable dynamic feature selection. DCNv2 enhances standard deformable convolution with multi-level offset learning, enabling flexible sampling across multi-scale feature maps. Its modulation mechanism dynamically adjusts sampling positions and intensities, improving the network’s adaptability. By promoting effective interaction between the localization and classification branches, TADDH enhances both tasks’ precision and robustness, thereby significantly improving detection accuracy.
In
Figure 7, the Task Decomposition module is designed to divide the concatenated features into task-specific representations. Based on this, the calculated task interaction features are utilized to perform both object classification and localization tasks simultaneously, allowing mutual awareness between the two. Consequently, the integrated interaction features inherently result in some level of contention between the paired tasks, given the single-branch architectural design. This is primarily because classification and localization focus on different objectives and therefore rely on different types of features, such as varying levels of abstraction and receptive fields. To address this issue, we introduced a layer attention mechanism that dynamically computed task-specific features across hierarchical levels, enabling more precise task decomposition and improving the coordination between classification and localization.
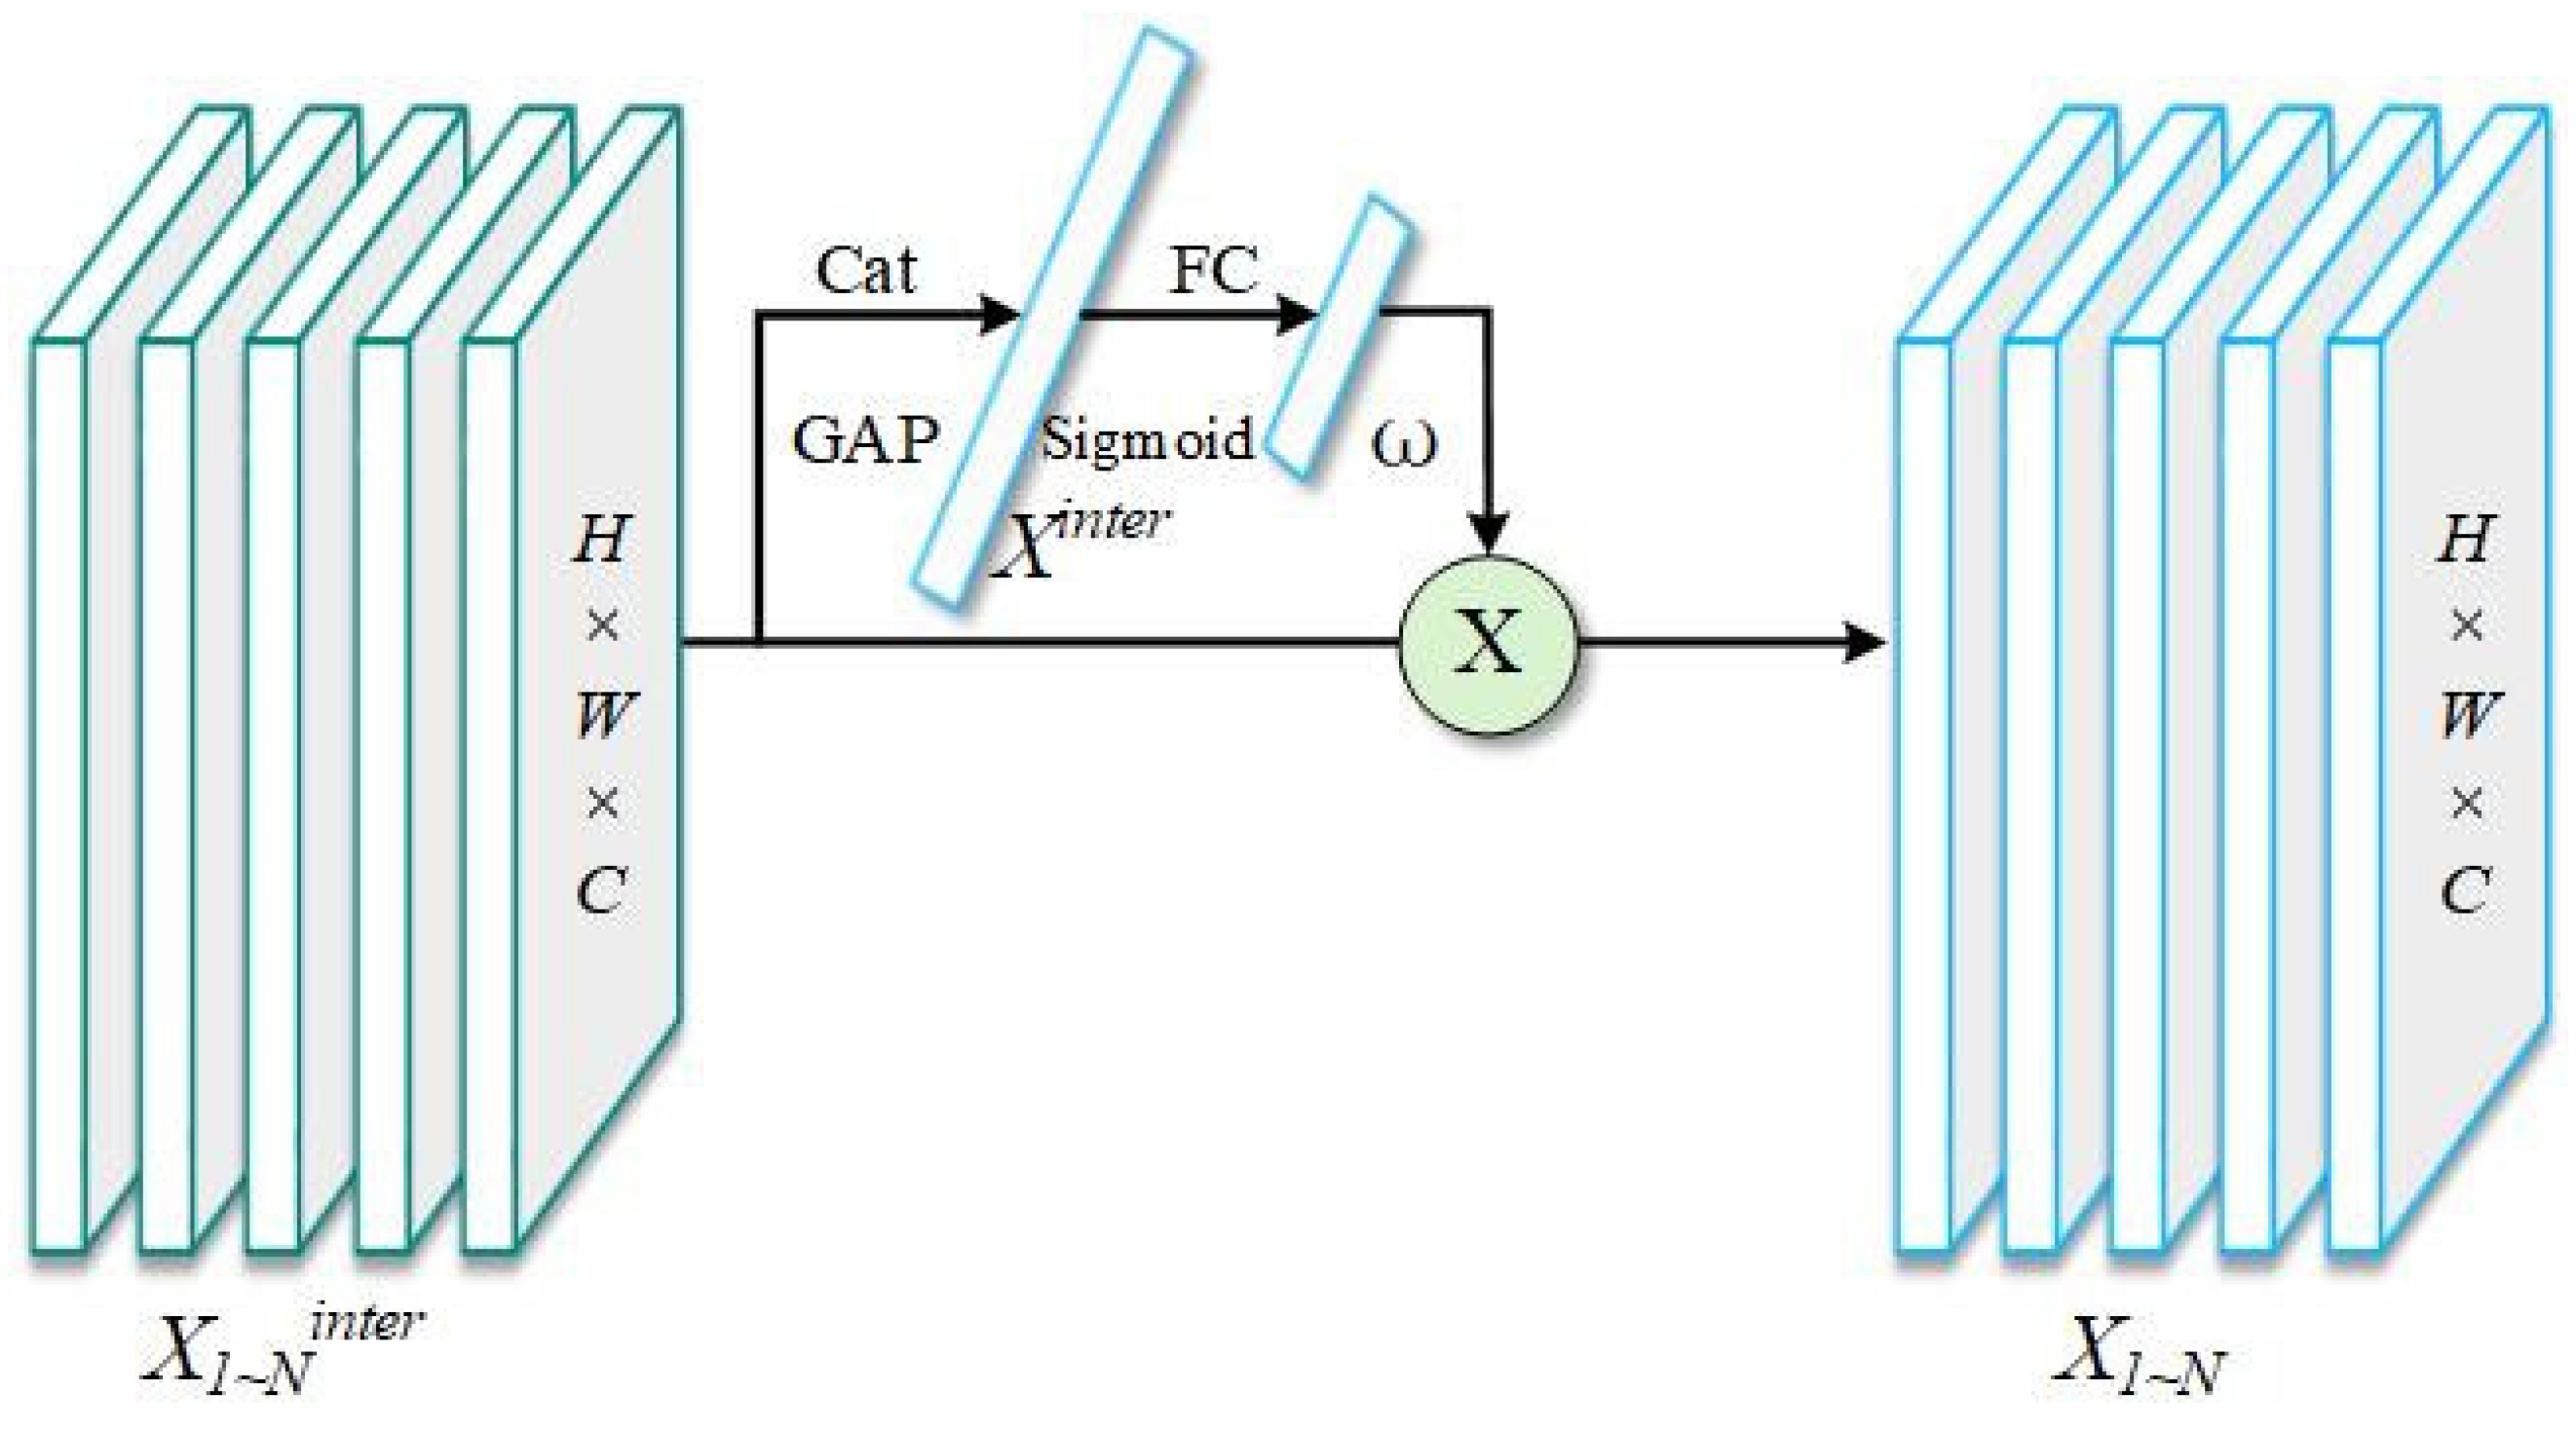
In the context of
Figure 8, there are two tasks: classification and localization. To compute the task-specific features for each of these tasks, a layer attention mechanism was introduced. The core idea behind this mechanism was that the interactions between different feature layers could provide valuable insights into the relationship between tasks, thereby facilitating the extraction of features specific to each task. The task-specific features were computed using Equation (1).
Among them,
represents the
element of the learned layer attention weights. It is computed based on the cross-layer task interaction features using Equation (2) and is capable of perceiving and recording the dynamic interactions between different layers.
Among them, and represent two fully connected layers, denotes the sigmoid activation function. is the result obtained by performing average pooling on , while is obtained by performing a concatenate operation on .
This method not only focuses on information from individual network layers but also analyzes feature interactions across different layers to gain a deeper understanding of intertask relationships, thereby enabling the extraction of more accurate and effective task-specific features. The design of TADDH is inspired by the concept of task alignment and deformable convolution (DCNv2). Unlike the original detection head in YOLOv8, we introduced a task-interactive feature fusion mechanism that modelled the features required for localization and classification separately through a layer attention mechanism, while using lightweight shared convolutions to reduce the number of parameters. Compared with existing detection heads (such as YOLOHead in YOLOv5 and the Decoupled Head in YOLOv8), the TADDH is not only more lightweight in structure but also better suited for multi-scale feature alignment, significantly improving detection accuracy for small-scale disease targets. Our implementation was based on the work of Zhong et al. [
37] in power equipment detection, but we adapted and optimized it specifically for the pest and disease detection scenario.
2.2.5. YOLOv11-RDTNet Model
This study introduces the YOLOv11-RDTNet, a streamlined and effective citrus pest and illness identification system derived from the YOLOv11 framework. In the backbone, the model integrates shallow and deep Robust Feature Downsampling (SRFD and DRFD) modules. Additionally, the original C3k2 modules in both the backbone and neck are replaced with a Dynamic Grouping and Shuffling Transformer (DGST) module. Finally, a Task-Aligned Dynamic Detection Head (TADDH) is employed in place of the original detection head. As depicted in
Figure 9, the YOLOv11-RDTNet model consists of five main components: input, backbone, neck, head, and output.
The proposed model incorporates a series of carefully designed components to enhance detection performance under complex conditions. The input layer employs several data augmentation methods, like altered lighting and contrast variations, to mimic pest and illness visuals across varied lighting contexts. These augmentations significantly improve the model’s adaptability to diverse lighting environments and its robustness against complex backgrounds and noise interference. In the backbone, the RFD (Robust Feature Downsampling) modules—comprising shallow (SRFD) and deep (DRFD) variants—are introduced as plug-and-play downsampling units. These modules integrate multi-path downsampling features to improve the expressive capacity of feature maps while minimizing information loss. Feature downsampling is a critical step in image processing, as it reduces computational cost, accelerates processing, and enables the model to learn more abstract and representative features. The unique design of the RFD modules ensures deeper downsampling while preserving rich feature information. Moreover, the original C3k2 modules in both the backbone and neck are replaced with the DGST (Dynamic Grouping and Shuffling Transformer) module, which divides input feature maps into multiple groups and performs group-wise convolution operations independently, thus improving the model’s capacity to identify detailed local characteristics. In the head, the model adopts a novel Task-Aligned Dynamic Detection Head (TADDH), which introduces a dynamic alignment mechanism to promote the coordination between classification and localization tasks during training. By incorporating feature fusion and optimization strategies, the model effectively combines features of different scales and levels, achieving enhanced detection capability in complex scenes while significantly reducing the number of parameters and model size, thus improving both robustness and generalization.
2.3. Training Environment and Evaluation Metrics
The YOLOv11 model was trained using the PyTorch 2.5.1 deep learning framework. The testing platform was a deep learning server equipped with an NVIDIA GeForce RTX 3090 GPU (24 GB VRAM), a 14-core Intel (R) Xeon (R) Gold 6330 CPU (2.00 GHz), CUDA version 12.4, and 50 GB of memory. To ensure consistency of experimental conditions, no pre-trained weights were used. The model was trained for 300 epochs with a batch size of 16. The SGD optimizer was adopted with a learning rate set to 0.01. The loss function used consisted of the three built-in components of YOLOv11: box_loss, cls_loss, and dfl_loss.
To select the optimal model, this study employed mean average precision (mAP), precision (P), recall (R), frames per second (FPS), and parameter count (parameters/M) as evaluation metrics to compare and assess model performance.
In Equations (3) and (4), TP, FP, and FN represent true positives, false positives, and false negatives, respectively. TP refers to the number of citrus pest and disease instances correctly identified by the model, FP refers to the number of non-citrus pest and disease instances incorrectly identified as positive, and FN refers to the number of citrus pest and disease instances missed by the model. Precision measures the proportion of true positives relative to all detections, and recall is the proportion of true positives compared to all annotated examples.
In Equation (5), AP refers to the area under the precision–recall (PR) curve. In Equation (6), mAP is the average of AP scores per category, with N indicating the total classes in the dataset. With the dataset featuring 5 citrus pest and disease categories, the sample size was N = 5.
In addition, the inference speed (FPS) of all models was measured on the same hardware platform. The input image resolution was uniformly set to 640 × 640, and the batch size was set to 1 to ensure fair comparison under single-image input conditions. The measured inference time included only the forward pass, excluding data preprocessing and post-processing, in order to maximize the comparability of FPS values. All models were tested with their default configurations, without any additional acceleration plugins or unofficial optimization strategies, to ensure the consistency and transparency of the evaluation. The FPS was calculated as the reciprocal of the average inference time per image, and the standard deviation was recorded to reflect the stability of the runtime performance.
In this article, GenAI tools were used solely for translating and polishing the manuscript, with no other applications.
4. Discussion
The YOLOv11-RDTNet model was evaluated on the test dataset and compared with seven state-of-the-art object detection models, demonstrating outstanding performance across multiple metrics. (1) The proposed model achieved an mAP50 of 87%, which represented improvements of 4.8%, 8.2%, 5.0%, 5.2%, 5.4%, 15.2%, and 12.4% over YOLOv11n, YOLOv10n, YOLOv9t, YOLOv8n, YOLOv5s, Faster R-CNN, and SSD, respectively. These results indicate that YOLOv11-RDTNet offers superior precision in citrus pest and disease recognition tasks. (2) In terms of parameter efficiency and model compactness, YOLOv11-RDTNet reduced the parameter count by 40.3% compared to the original YOLOv11, with the total model size compressed to just 3.4 MB. This highlights the model’s potential for lightweight deployment, as it substantially reduces parameter volume and computational complexity while maintaining high performance. Consequently, YOLOv11-RDTNet significantly enhances computational efficiency and reduces resource consumption, enabling efficient operation on resource-limited platforms such as mobile and embedded devices. These features make the model highly practical for real-world agricultural applications.
Zhu et al. [
38] proposed a multi-model fusion network (MMFN) for citrus leaf disease detection based on model ensemble and transfer learning. Although their model achieved a high classification accuracy of 98.68%, it was trained on a publicly available dataset with a simple and repetitive background, which limited its applicability in complex real-world environments. Apacionado et al. [
39] attempted to detect sooty mold on citrus leaves in complex scenarios using YOLOv7, but the model only achieved an mAP of 74.4%. In contrast, the YOLOv11-RDTNet model proposed in this study not only performed effectively in complex backgrounds but also demonstrated high detection precision, showcasing its superior performance. Furthermore, Yan et al. [
40] introduced a citrus disease classification model based on an improved ConvNeXt architecture; however, the model was limited to detecting only three types of diseases and suffered from a large size and high parameter count, resulting in slow detection speeds that were unsuitable for deployment on mobile devices. Compared with these existing methods, the YOLOv11-RDTNet model overcomes the aforementioned limitations, maintaining high accuracy in complex environments while remaining lightweight and efficient. This makes it a practical and effective solution for pest and disease management in citrus production and offers valuable support for promoting sustainable agricultural development.
In agricultural practice, the proposed model can be integrated into smart agriculture management platforms to enable early warning of citrus pests and diseases, precision pesticide application, and digital management. This would effectively reduce economic losses caused by pests and diseases, minimize the use of chemical pesticides, and improve fruit quality and yield. Furthermore, the design concept of this model can be extended to the identification of pests and diseases in other crops, providing a technical foundation for building a universal and efficient crop health monitoring system. Therefore, the outcomes of this study have strong potential for practical application and hold significant importance for promoting intelligent and precision agriculture.
5. Conclusions
In this study, we proposed an innovative model named YOLOv11-RDTNet for the detection of citrus pests and diseases under complex environmental conditions. The model incorporated three major enhancements. First, the traditional convolutional downsampling module was replaced with the RDF downsampling module, which leveraged a recursive structure and dense connections to improve multi-scale feature fusion, thereby enhancing the model’s adaptability and detection accuracy in challenging scenarios. Second, the original C3k2 module was substituted with the DGST module, which effectively addressed issues such as leaf occlusion, background clutter, and multi-scale lesion detection, while maintaining a lightweight architecture. Third, the standard detection head was replaced with the TADDH detection head, which not only boosted detection precision but also significantly reduced the model’s parameter count and computational complexity. Consequently, YOLOv11-RDTNet significantly enhanced computational efficiency and reduced resource consumption, enabling efficient operation on resource-limited platforms such as mobile and embedded devices. These features make the model highly practical for real-world agricultural applications.
Although the proposed model demonstrated significant advantages in citrus pest and disease detection and showed great application potential, there are still some limitations to address. Specifically: ① Lack of cross-regional independent validation: The model was trained and tested on the same dataset split, without evaluation on independent images from different regions or years. As a result, the model’s robustness and stability under diverse external data conditions require further validation. ② Challenges under complex and extreme conditions: although multiple mechanisms were introduced in this study to enhance detection capability in complex backgrounds, the model still faced challenges in scenarios with extreme lighting, severe occlusion, or the coexistence of multiple diseases. ③ Limited coverage of pest and disease types: The current dataset includes only five common types—anthracnose, canker, yellow vein disease, coal pollution disease, and leaf miner moth. Other agriculturally significant pests and viral diseases, such as citrus rust mite and psyllids, are not yet included. This limits the model’s ability to recognize more complex and diverse pest and disease systems in real-world applications. Based on the above limitations, future research will focus on the following directions: First, the context-learning mechanism is critical for enabling the model to effectively handle complex and dynamic environments. At present, the model’s detection performance remains limited under extreme lighting conditions or in cluttered backgrounds. To address this issue, future research could explore more efficient context modeling approaches. For example, incorporating Graph Neural Networks (GNNs) may enhance the model’s global understanding of the pest occurrence environment by leveraging their powerful capability to model relationships between nodes. Alternatively, improvements to current attention mechanisms could help the model more accurately capture key features, thereby maintaining high detection accuracy even in complex scenarios. Second, multi-scale feature fusion plays a crucial role in improving the precision of pest and disease detection. However, existing methods exhibit limitations in cross-domain adaptation and few-shot learning settings. To overcome these challenges, future work may focus on developing dynamic weighting strategies for multi-scale features, allowing the model to flexibly adjust the importance of each scale based on varying detection needs and environmental conditions. This would enhance the model’s adaptability and robustness. Moreover, the introduction of meta-learning techniques presents a promising direction; by enabling the model to quickly adapt to new environments with limited data, it can significantly improve generalization performance across diverse conditions. With the implementation of these improvements, it is reasonable to expect a significant enhancement in overall model performance. This would not only provide strong technical support for the development of smart agriculture but also assist farmers in managing citrus pests and diseases more efficiently, thereby reducing production costs and increasing agricultural output. More importantly, it would contribute to the sustainable development of agriculture and support the implementation of rural revitalization strategies.


