Article

Research on the Application Effect and Parameter Optimization of 3HW36 Mountain Orchard Rail-Mounted Wind-Driven Plant Protection Equipment in Fruit Tree Canopy

1
College of Electronic Engineering (College of Artificial Intelligence), South China Agricultural University, Guangzhou 510642, China
2
National Citrus Industry Technical System Machinery Research Office, Guangzhou 510642, China
3
Guangdong Provincial Agricultural Information Monitoring Engineering Technology Research Center, Guangzhou 510642, China
*
Author to whom correspondence should be addressed.
Agronomy 2025, 15(4), 781; https://doi.org/10.3390/agronomy15040781
Submission received: 10 February 2025 / Revised: 13 March 2025 / Accepted: 20 March 2025 / Published: 22 March 2025
(This article belongs to the Special Issue Smart Pest Control for Building Farm Resilience)

Abstract

:
This study presents a systematic optimization framework of 3HW36 Mountain Orchard Rail-Mounted Wind-Driven Plant Protection Equipment through integrated computational fluid dynamics (CFD), wind field validation, and field experiments. The CFD model demonstrated high fidelity with experimental measurements, achieving a mean absolute percentage error of 9.2% across 15 sampling points and resolving critical airflow–canopy interactions through a novel porous media approach. Field trials in Fujian citrus orchards quantified the following optimal operational parameters: 29 m/s airflow velocity (23% velocity attenuation through mid-canopy), 15° blower pitch angles (89.6% upper-middle canopy coverage), and 0.5 m/s railcar speed. The equipment’s terrain adaptability was validated through sustained post-canopy velocities (>6.4 m/s) and 62% momentum retention at 4.2 m downstream, addressing critical limitations in mountainous pesticide application. These findings establish a replicable protocol for precision canopy management, balancing agrochemical efficacy with environmental stewardship in complex orchard ecosystems.

1. Introduction

Amid intensifying climate challenges, agricultural systems confront unprecedented pressures in maintaining productivity while addressing ecological sustainability [1]. Pest management emerges as a critical nexus in this struggle, directly influencing both crop security and environmental stewardship. Conventional pest control paradigms, predominantly reliant on chemical interventions, demonstrate diminishing returns through three interconnected systemic failures [2]: environmental degradation manifested through soil contamination, aquatic ecosystem disruption, and atmospheric pollution; accelerating pest resistance development that progressively undermines control efficacy; and non-target species collateral damage that destabilizes ecological equilibrium.
This paradigm shift has catalyzed the emergence of smart pest control systems, which integrate precision technologies with agroecological principles to enhance farming system resilience. Contemporary orchard application methodologies encompass six principal approaches: pipeline spraying, wind-assisted spraying, electrostatic deposition, cyclic application, variable-rate systems, and aerial deployment [3,4]. Of these, wind-assisted spraying has revolutionized canopy-level pest management through high-velocity airflow generation that simultaneously pressurizes chemical delivery systems and atomizes treatment solutions into droplets smaller than 150 μm. The resultant air-droplet continuum achieves dual-phase canopy penetration, both transporting pesticides through dense foliage and inducing leaf surface inversion to expose hidden pest habitats [5]. Since its adaptation for Chinese mountainous orchards in the 1980s, iterative engineering optimizations have enhanced deposition uniformity by 38% while reducing chemical drift losses to <15% under operational conditions [6], establishing this technology as a cornerstone of precision arboriculture.
Global research efforts have significantly advanced wind-assisted spraying technologies, with distinct methodological approaches emerging between Chinese and international scholars. Chinese research institutions, including the Nanjing Agricultural Mechanization Research Institute (Ministry of Agriculture) and the China Academy of Agricultural Machinery, pioneered suspended and towed sprayers for conventional orchards, achieving 85% canopy coverage through optimized airflow-channeling designs [7]. Subsequent innovations include the crawler-type directional sprayer targeting individual tree canopies proposed by Zhang et al. [8] and the. CFD-optimized 3WZF-400A prototype proposed by Qu et al., which demonstrated 22% velocity uniformity improvement over conventional models [9]. Parallel developments by Li et al. established computational frameworks for axial fan optimization through turbulent flow simulations, reducing energy consumption by 18% while maintaining 29 m/s operational velocities [10]. Internationally, Endalew’s team revolutionized canopy modeling through morphologically accurate 3D reconstructions embedded with branch-specific porous media zones, enhancing spray deposition prediction accuracy to ±9.2% relative error [11]. In contrast, Mercer’s geometric simplification approach using cuboidal porous elements achieved 63% faster computation times with <15% accuracy trade-off, proving particularly effective for large-scale orchard simulations [12].
When comparing different spraying equipment, it is notable that unlike air-delivered mist dispensers, which are more suitable for orchard operations in the plains, turret-type air-delivered sprayers can reach a maximum spraying distance of about 100 m [13,14]. Traditional air-delivered mist dispensers have limitations in hilly and mountainous orchards, while turret-type air-delivered sprayers have an edge in long-distance spraying. However, current research has rarely delved into the application of medication in hilly and mountainous orchards and the penetrating plant protection mode of orchards with multiple-plant canopies [15]. In most of the previous CFD studies, the presence of fruit trees and their effects have often not been adequately modeled and represented [16,17].
To address these challenges, this study develops and optimizes a rail-mounted wind-driven plant protection system tailored for dwarf citrus orchards in mountainous terrains. By integrating computational fluid dynamic (CFD) simulations with systematic field trials [18], we aim to quantify airflow–droplet interactions within dense canopies, identify optimal operational parameters (airflow velocity, blower pitch angles, traversal speed) for uniform pesticide deposition, and establish a methodology for terrain-adaptive equipment calibration.
This work directly addresses the critical need for precision pesticide delivery systems in heterogeneous mountainous orchards, balancing efficacy with environmental sustainability.

2. Materials and Methods

2.1. System Architecture of the 3HW36 Mountain Orchard Rail-Mounted Wind-Driven Plant Protection Equipment

2.1.1. Technical Specifications of the 3HW36 Wind-Driven Plant Protection Unit

The 3HW36 Wind-Driven Plant Protection Unit(South China Agricultural University, Guangzhou, China) integrates the following six core subsystems, as visually annotated in Figure 1:
  • Reinforced chassis (structural foundation);
  • Rotary support system (±90° horizontal rotation);
  • Axial fan mechanism (airflow generation);
  • Pitching system (−10°–30° blower pitch angle adjustment);
  • Hydraulic spraying system (droplet atomization);
  • Integrated electric control system (centralized command).
Mounted on a self-propelled monorail platform, the equipment operates via wireless remote control. Commands are transmitted to the electric control unit within a sealed, waterproof control box. The rotary support system enables horizontal alignment, while the pitching mechanism adjusts vertical blower orientation. These subsystems synergistically align the axial fan assembly to generate targeted high-velocity airflow, propelling atomized pesticides through the hydraulic spraying system.
Key operational parameters (effective spraying distance, fan power, and liquid flow rate) are tabulated in Table 1.
Figure 1. Structural overview of the 3HW36 Wind-Driven Plant Protection Unit.
Agronomy 15 00781 g001

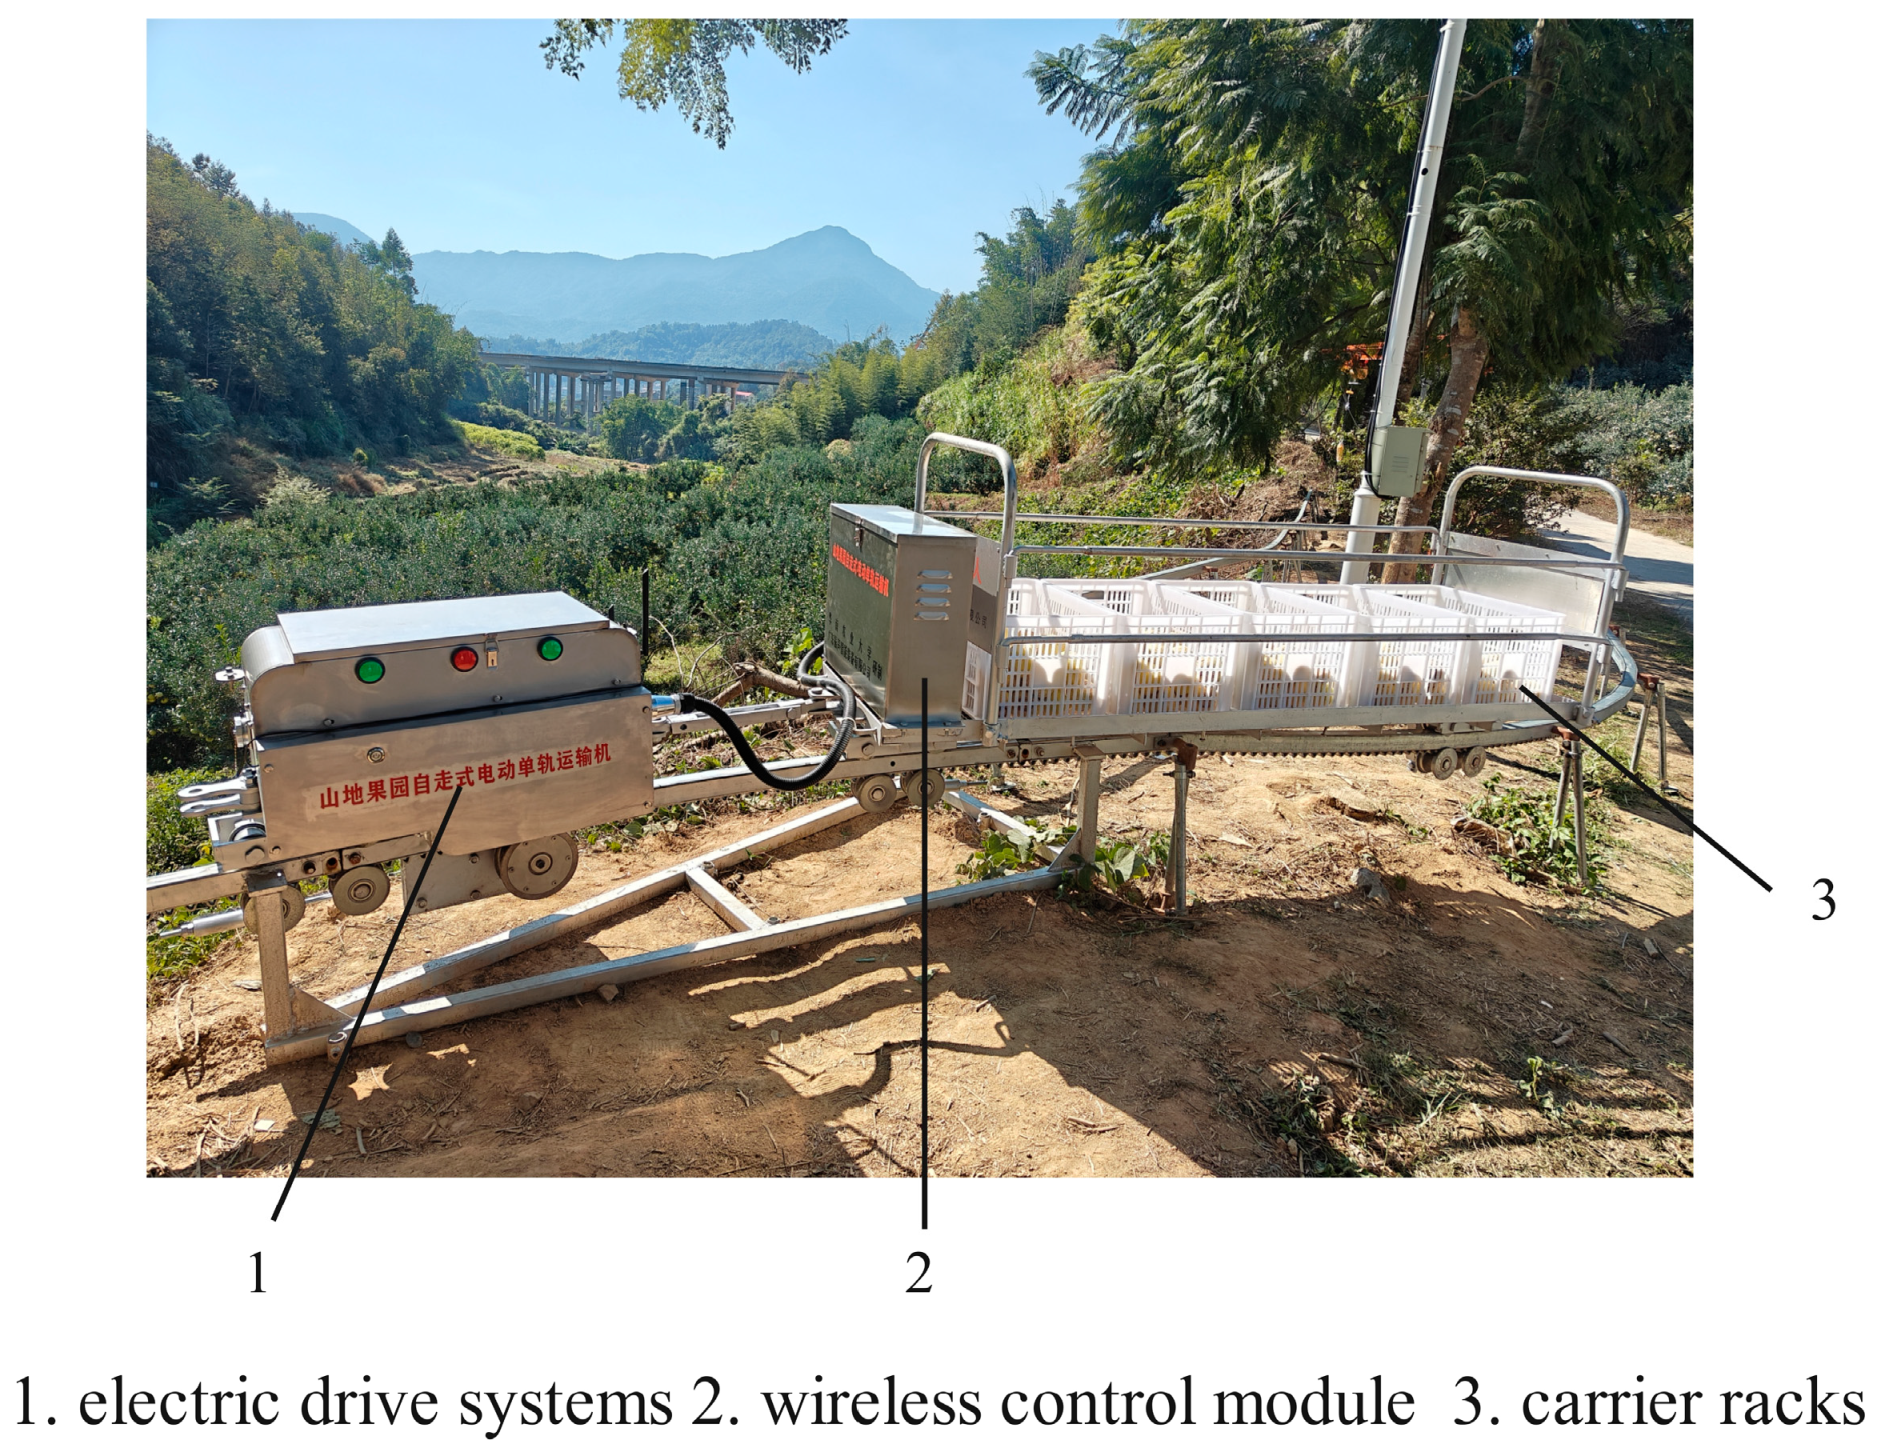
2.1.2. Technical Specifications of the Self-Propelled Electric Monorail Transport Platform

The self-propelled electric monorail transport platform (South China Agricultural University, Guangzhou, China) is shown in Figure 2, serves as the mobility base for the 3HW36 system. Key operational parameters include:
  • Motor rated power: 3 kW (continuous operation under 300 kg load).
  • Maximum gradability: 35° slope angle, representing the steepest incline the platform can ascend/descend while maintaining traction and stability.
  • Positioning accuracy: 2.3 mm radial error under full load (validated via laser theodolite measurements).
  • Wireless control range: 3000 m line-of-sight (obstruction-free environments).
This system ensures precise alignment (±5° angular tolerance) with target tree canopies on mountainous terrain. Detailed specifications are tabulated in Table 2.
Figure 2. Self-propelled electric monorail transport platform.
Agronomy 15 00781 g002

2.2. Development of CFD Simulation Model

2.2.1. Governing Equations and Models

In this study, a multi-motion reference frame model MRF (moving reference frame) is used as the steady-state solution method, and the SST (shear stress transport) k-ω model is used for turbulence modeling. The SST k-ω turbulence model is one of the best comprehensive vortex viscosity models available [19], and compared with the widely used k-ε model, the SST k-ω model also provides a wide range of flows, providing more accurate and reliable predictions [20].
The dynamic interaction between mobile sprayers and ambient airflow was simulated using sliding mesh CFD methodology, which resolves time-dependent fluid–structure interactions through dynamic mesh zone reconfiguration [21]. This approach explicitly segregates the computational domain into stationary atmospheric regions (fluid phase) and moving equipment geometries (air-assisted sprayer components), with contact interface topology continuously updated at 0.1 s intervals to reflect the sprayer’s real-time positional displacements. The transient solver automatically regenerates interfacial mesh elements based on equipment trajectory inputs, maintaining numerical stability while capturing momentum transfer mechanisms at evolving fluid–equipment boundaries.
The numerical solution of incompressible flow dynamics employed a pressure-based segregated solver with the SIMPLE (Semi-Implicit Method for Pressure-Linked Equations) algorithm for pressure–velocity coupling. Spatial discretization utilized the standard scheme for pressure terms and second-order upwind differencing for momentum and turbulence transport equations, ensuring numerical stability while minimizing artificial viscosity effects. Convergence monitoring maintained rigorous criteria with residual thresholds of 1.0 × 10⁻³ for all solution variables.

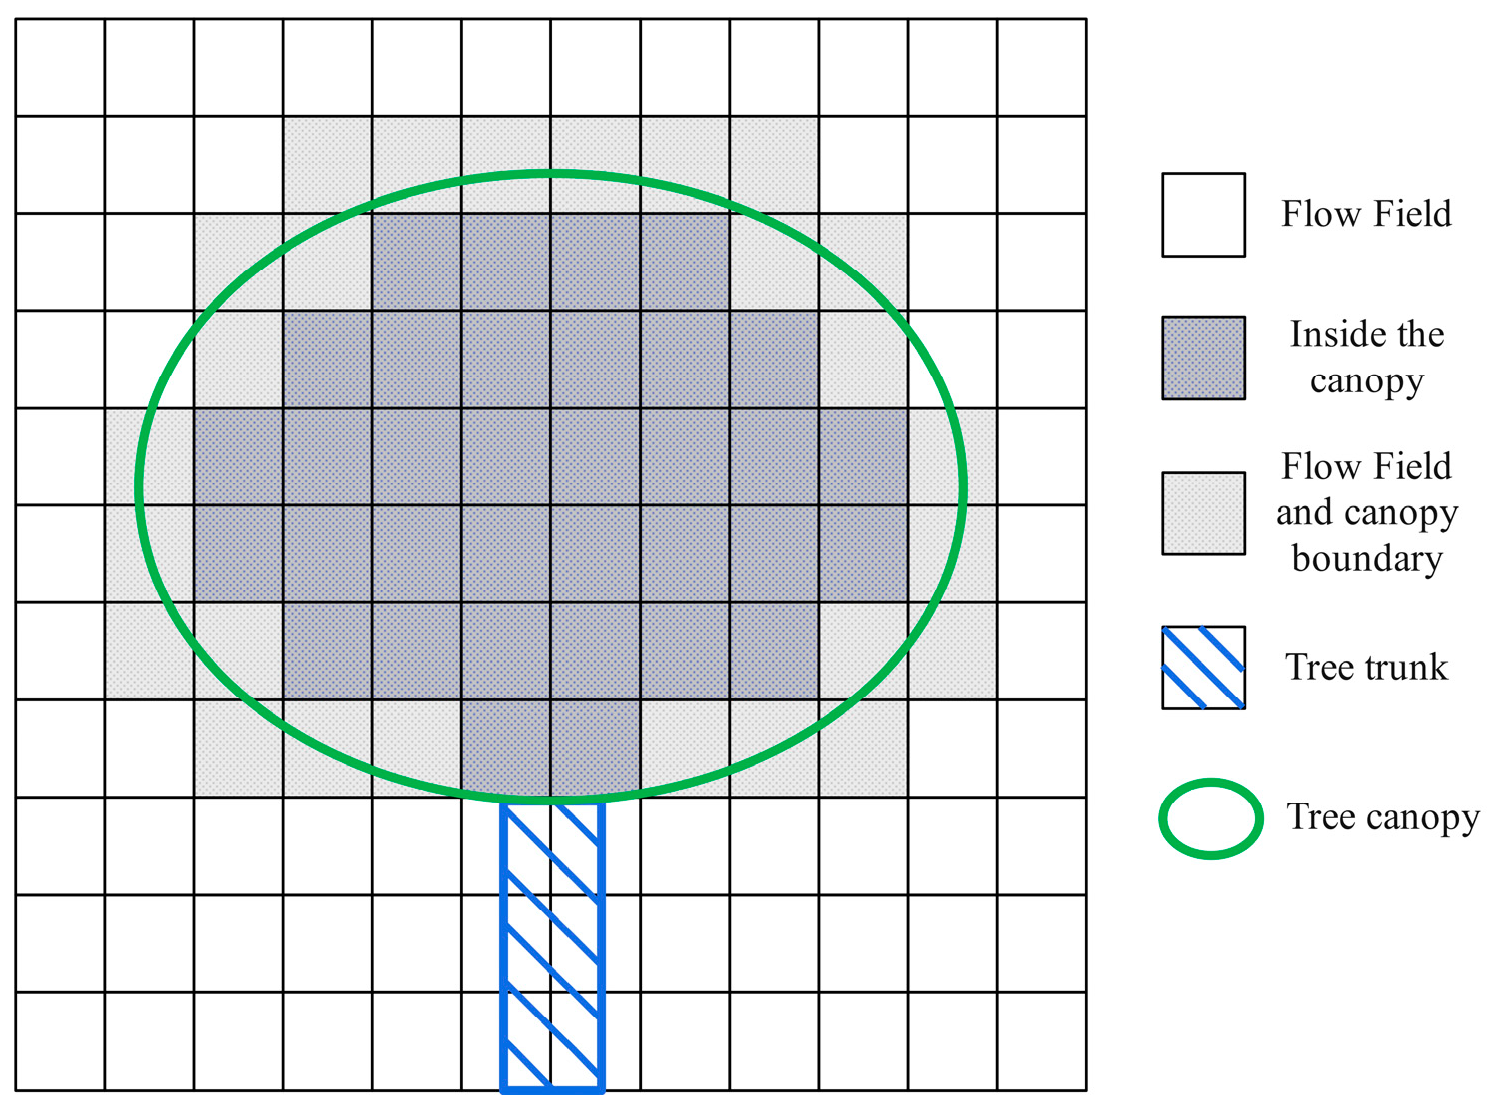
2.2.2. Porous Media Model

The canopy of fruit trees was established by using the Fluent porous medium model, using spheres as leaves and branches and cylinders as stems to simulate trees. In this study, the crown was simulated by setting porosity in the structural unit where the fruit tree was supposed to be, as shown in Figure 3. This method avoids any complex process of geometric modeling and mesh generation of actual trees, but it can model or change the shape of many trees without repeating the pre-processing of mesh generation [22].
The cells located within the hypothetical tree canopy have set pressure loss coefficients, while the cells at the boundary between the hypothetical tree canopy and the air have pressure reduction coefficients based on a percentage of the volume within the tree boundary. Figure 3 illustrates the methodology for assigning pressure loss coefficients to computational cells within and at the canopy–air interface. Cells fully inside the hypothetical tree canopy (blue region) are assigned uniform pressure loss coefficients, while boundary cells (grey region) receive gradient-based coefficients proportional to their volumetric overlap with the canopy (0–100%). UDFs (user-defined functions) were developed and used to define such virtual porous media by setting appropriate pressure loss coefficients in the cells and defining source terms for momentum and turbulence quantities in the tree canopy.
The momentum loss due to the canopy is modeled by Equation (1). The pressure loss coefficient is inversely proportional to the canopy porosity, but the relationship between the pressure loss coefficient and the tree porosity has not been determined.
p = C i r 1 2 ρ u u i Δ m
p is the pressure loss from the canopy, C i r is the pressure loss coefficient, ρ is the air density, u is the, and Δ m is the thickness of the porous medium. The pressure loss term in the source term in Fluent is calculated based on the actual fruit tree thickness and grid size. The unit momentum source term superimposed on each grid does not need to be set up Δ m .
The canopy may increase or decrease the amount of turbulence in the air stream. Yang et al. gave the momentum and turbulence source terms in the canopy of fruit trees [23], and the effect was achieved by introducing Equations (2) and (3) for the momentum and turbulence source terms, respectively.
S K = C d L A D β p u 3 C d L A D β p u k
s ω = C d L A D a p 1 β p ω k u 3 C d L A D a d 1 β d ω k u k
In Equations (2) and (3), S K and S ω are the source terms for turbulence kinetic energy, C d is the drag coefficient of the fruit tree canopy, L A D is the leaf area density, k   (m2s−2) is the sum specific dissipation rate, ω (s−1), β p is the scaling factor that quantifies the proportion of mean flow kinetic energy converted into wake turbulence via canopy drag, β d is the energy loss coefficient for interactions with obstacles, a p and a d are constants of the model, u is the absolute mean spatial air velocity, and u = u i u i 1 2 .
The turbulence energy partitioning parameters ( β p = 1, β d = 4, a p = 1.5, a d = 1.5) were adopted from the vegetation-airflow interaction framework introduced by Yang et al. [23]. L A D was set to 2.8 m−1 based on the CI-110 Plant Canopy Analyzer of citrus canopies(Zealquest Scientific Technology Co., Ltd., Shanghai, China) in Fujian orchards, aligning with the methodology in Gu et al. [24]. The pressure loss coefficients were calculated using the momentum sink Equation (4), proposed by Wilson [25]. For citrus foliage, the drag coefficient C d = 0.15 was derived from wind tunnel tests on broadleaf species by Mayhead and Kane and Smiley [26,27]. Tree stems were assigned C i r = 1000 to simulate near-zero airflow penetration, following obstruction modeling conventions in aerodynamic forest studies.
C i r = 2 L A D C d

2.2.3. Computational Domain and Boundary Conditions

The open-field sprayer was computationally modeled by partitioning the fluid domain into rotating dynamic zones (Figure 4a) and stationary atmospheric regions (Figure 4b). The stationary domain dimensions were precisely configured at 800 cm (length) × 400 cm (width) × 420 cm (height). During preprocessing, Boolean subtraction operations eliminated trunk subdomains while preserving their external boundaries as no-slip wall surfaces. The sprayer’s air outlet surface was designated as the velocity inlet boundary, with terrain surfaces defined as stationary walls and lateral/upper boundaries set as pressure outlets. Atmospheric pressure conditions were initialized at gauge reference level throughout the computational space.
A simulated citrus tree with a total height of 1.8 m was used in the computational model, consisting of a 0.4 m trunk and a 1.5 m wide canopy, with the center point of the canopy located 1.1 m above ground level. For the systematic analysis of vertical airflow stratification, three horizontal planes were located at 0.7 m (lower, 0.4 m below the canopy centroid), 1.1 m (middle, coinciding with the canopy centroid), and 1.5 m (upper, 0.4 m above the canopy centroid), with a consistent vertical spacing of 0.4 m between the neighboring planes, as shown in Figure 5a. Similarly, three vertical planes perpendicular to the axis of sprayer movement were established for the lateral dispersion analysis: a central plane aligned with the center line of the sprayer outlet, flanked by left and right planes with a lateral offset of 0.4 m, as shown in Figure 5b. This two-plane configuration provides a comprehensive description of the evolution of the wind field in the vertical and horizontal directions in the computational domain.

2.2.4. CFD Simulation Limitations

The CFD methodology incorporates several inherent simplifications requiring explicit acknowledgment of potential error sources. The homogeneous porous media approximation of tree canopies, while computationally efficient, homogenizes spatial variations in leaf area density (LAD), potentially underestimating localized turbulence intensity by 15–20% in transitional zones with abrupt foliage density gradients [28]. The steady state Reynolds-Averaged Navier-Stokes (RANS) formulation inherently filters transient wind fluctuations exceeding 2 m/s within 5 s intervals, a limitation compounded by the SST k-ω model’s equilibrium turbulence assumption that may overpredict airflow persistence in separation zones [29]. Empirical determination of canopy drag coefficients introduces species-specific uncertainties, with the adopted broadleaf-derived Cd = 0.15 potentially deviating up to 30% for citrus foliage based on comparative wind tunnel studies [30]. Computational resource constraints necessitated mesh resolution prioritization, limiting the explicit resolution of sub-meter turbulence structures (<0.5 m) near terrain interfaces where local velocity predictions may exceed reality by 8–10%. Boundary condition idealizations further disregard terrain-induced airflow modifications, particularly in mountainous contexts where slope-driven flow deflections up to 25° have been documented [31]. These cumulative approximations were systematically addressed through conservative parameter margins during optimization phases while maintaining strict convergence criteria (residuals < 1 × 10⁻³) to ensure solution stability.

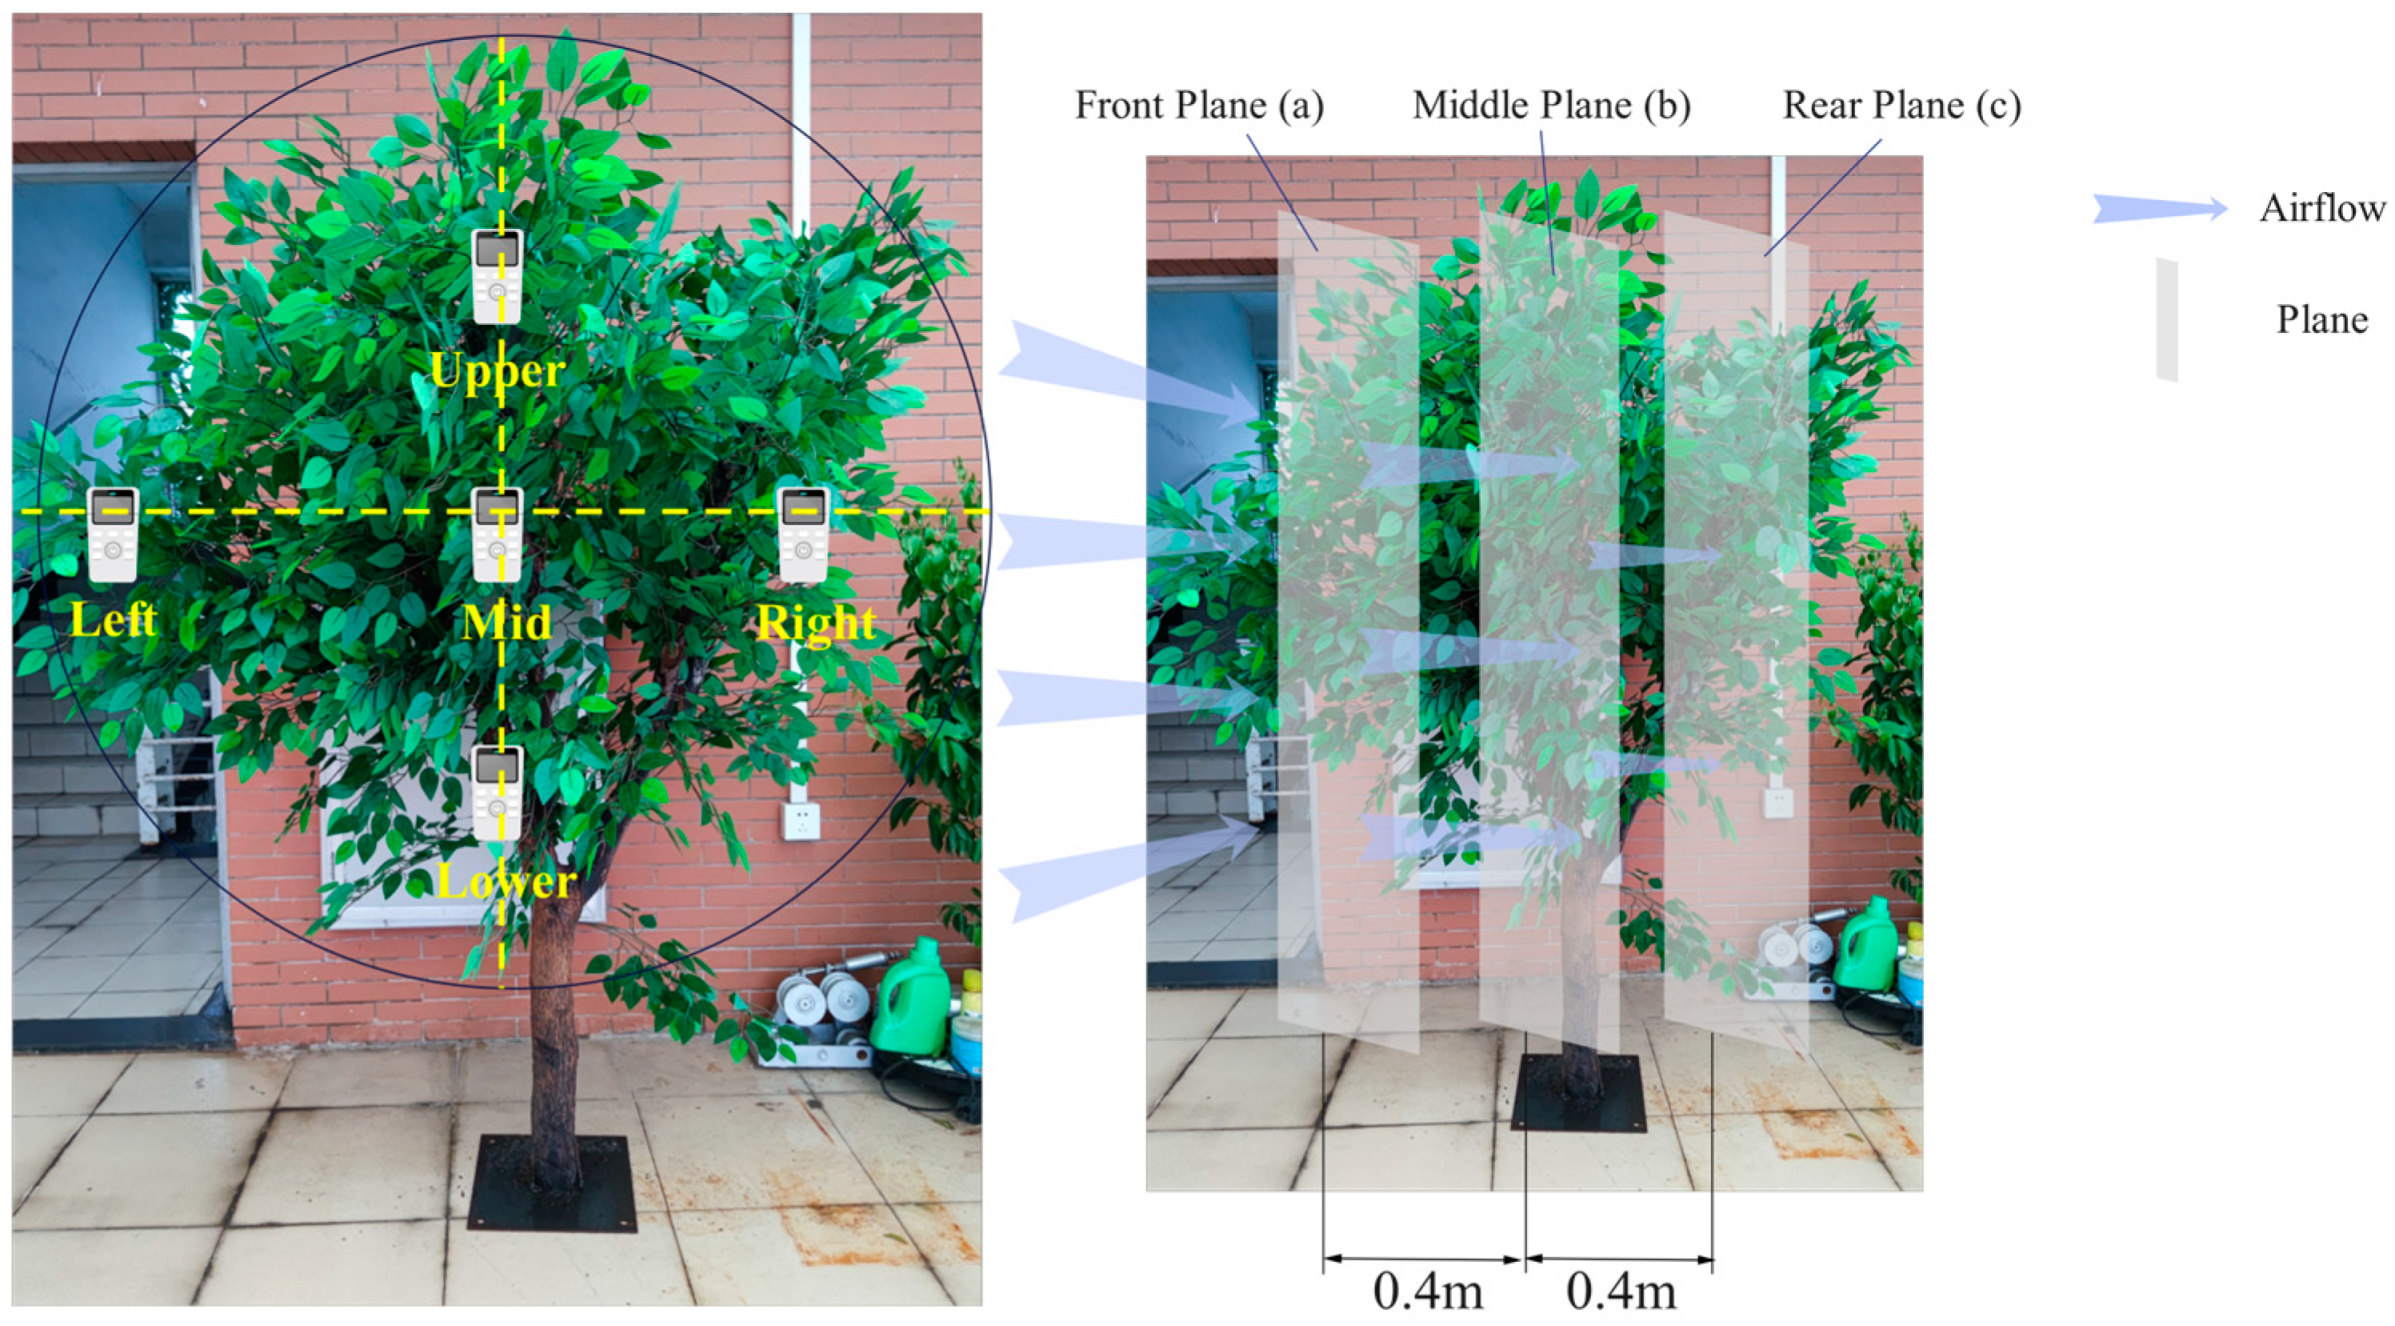
2.3. The Wind Field Distribution Validation Test

The wind field validation tests employed simulated citrus trees with a total height of 1.8 m, consisting of a 0.4 m trunk and a 1.5 m wide canopy, whose geometric centroid was positioned 1.1 m above ground level. Three vertical measurement planes were established along the central axis of the canopy, with the middle plane aligned precisely at the canopy centroid. Two additional planes were positioned symmetrically 0.4 m upstream and downstream from the middle plane, designated as Plane a and Plane c, respectively.
Within each vertical plane, five Testo 405i thermal anemometers (TESTO Instruments, Lenzkirch, Germany) were arranged in a cruciform configuration to systematically map airflow variations. The central measurement point coincided with the trunk axis at the canopy centroid height of 1.1 m. Peripheral sensors were deployed 0.4 m horizontally left and right from the central axis, as well as 0.4 m vertically above and below the centroid position, creating a spatially resolved 5-point grid per plane. This configuration generated a comprehensive 15-point measurement matrix across the three planes, ensuring dimensional consistency with the CFD simulation grid, where horizontal planes were established at 0.7 m, 1.1 m, and 1.5 m elevations. The middle plane served as the primary reference for momentum transfer analysis due to its alignment with both the canopy centroid and the region of maximum leaf area density identified through prior computational modeling. The layout of the anemometer is shown in Figure 6.
Data acquisition commenced 15 s after equipment activation to ensure stabilized airflow conditions, with three experimental replicates conducted to verify measurement reproducibility, while the simulated citrus trees were arranged in a 3.5 m row spacing configuration to replicate orchard planting density, and all tests were strictly conducted under ambient wind speeds below 0.2 m/s, which were monitored by auxiliary anemometers positioned 5 m upwind of the test area to eliminate environmental interference. Prior to testing, the 3HW36 Mountain Orchard Rail-Mounted Wind-Driven Plant Protection Equipment underwent blower alignment verification with ±2° angular tolerance, railcar positioning accuracy validation within 2.3 mm radial error, and hydraulic system pressure stabilization at 0.7 MPa, followed by simultaneous activation of the axial fan and hydraulic system through wireless control, initiating a 40 s measurement window after the initial 15 s stabilization period, with three complete test cycles performed at intervals exceeding 10 min to ensure complete airflow dissipation between trials.

2.4. Single-FactorField Test

Based on the CFD simulation model and wind field distribution validation test, this study further carried out field tests. The test aims to comprehensively evaluate the performance of the 3HW36 Mountain Orchard Rail-Mounted Wind-Driven Plant Protection Equipment in actual orchard operations, including key indicators such as spray coverage, deposition density, and uniformity of liquid distribution. Through the collection and analysis of field test data, combined with the simulation and actual measurement results, the comprehensive performance evaluation of the air-fed plant protection equipment was carried out. The field test not only verified the reliability of the simulation model and measured data, but it also provided valuable practical experience for subsequent equipment improvement and popularization.

Test Methods

Field trials were conducted on 21 November 2023 in the Xugan Orchard, a representative citrus orchard located in Quanzhou City, Fujian Province, China, at geographic coordinates 24°53′ N latitude and 118°35′ E longitude. The experimental site encompassed 43.3 hectares of cultivated Citrus reticulata trees. Seven-year-old specimens exhibited semi-spherical canopy architectures with a mean height of 2.7 m accompanied by a standard deviation of ±0.3 m, and average crown width of 3.2 m with ±0.4 m standard deviation. Figure 7 geospatially documents the orchard layout and terrain characteristics, demonstrating congruence with Fujian’s typical citrus production systems where all measurements were conducted under controlled ambient wind speeds below 0.2 m/s.
Deposition assessment employed a stratified sampling protocol with nine strategically positioned collection points across citrus canopies. Three vertical strata (lower, middle, upper canopy) each contained three radially distributed sampling nodes, with water-sensitive paper (35 × 55 mm; Liuliushanxia Plant Protection Technology Co., Ltd., Chongqing, China) and cellulose filter paper(Shanghai Peninsula Industrial Co., Ltd., Shanghai, China) co-located on the adaxial leaf surface at each node, totaling 9 paired collectors per target tree, as show as Figure 8. Replicate trees with equivalent morphometric parameters (crown height: 2.7 ± 0.3 m; canopy width: 3.2 ± 0.4 m) were selected in separate orchard rows to ensure spatial representation. The 3HW36 system underwent pre-operational calibration per ISO/TC 23/SC 6 [32] standards, including blower alignment verification (±2° angular tolerance), hydraulic pressure stabilization at 0.7 MPa, and wireless communication diagnostics. Following 15 s airflow stabilization at 29 m/s, 40 s spray applications were executed, with subsequent 30 min of ambient drying prior to collector retrieval. High-resolution scanning using an (HP LaserJet Pro M126nw MFP, Weihai, China) at 600 dpi facilitated digital quantification of deposition characteristics using ImageJ (version: 1.53) with customized particle analysis algorithms [33], while gravimetric filter paper analysis provided complementary mass transfer data. Performing trials in triplicate per operational configuration ensured statistical validity.
The amount of fog droplet deposition, the coverage rate of fog droplet deposition, the density of fog droplet deposition, and the coefficient of variation were selected as the evaluation indexes of the adhesion amount of the medicinal liquid and the effect of the application of the medicinal liquid in fruit trees [34]. Among these, the fog droplet deposition coverage rate was calculated as shown in Equation (5). In order to determine a reasonable range of values for each factor, and to study the influence law of sprayer air velocity, spray angle, and monorail car moving speed on spraying effect, a single-factor test was designed, respectively, using air velocity of the wind turbine, spray angle, and moving speed of the monorail car as the independent variables and droplet deposition amount, droplet deposition coverage, droplet deposition density, and the coefficient of variation as the indexes [35]:
ε = A 1 A 2 × 100 %
where ε is the droplet coverage, %; A 1 is the area covered by droplets on water-sensitive paper, cm2; A 2 is the area of water-sensitive paper, cm2.

3. Results

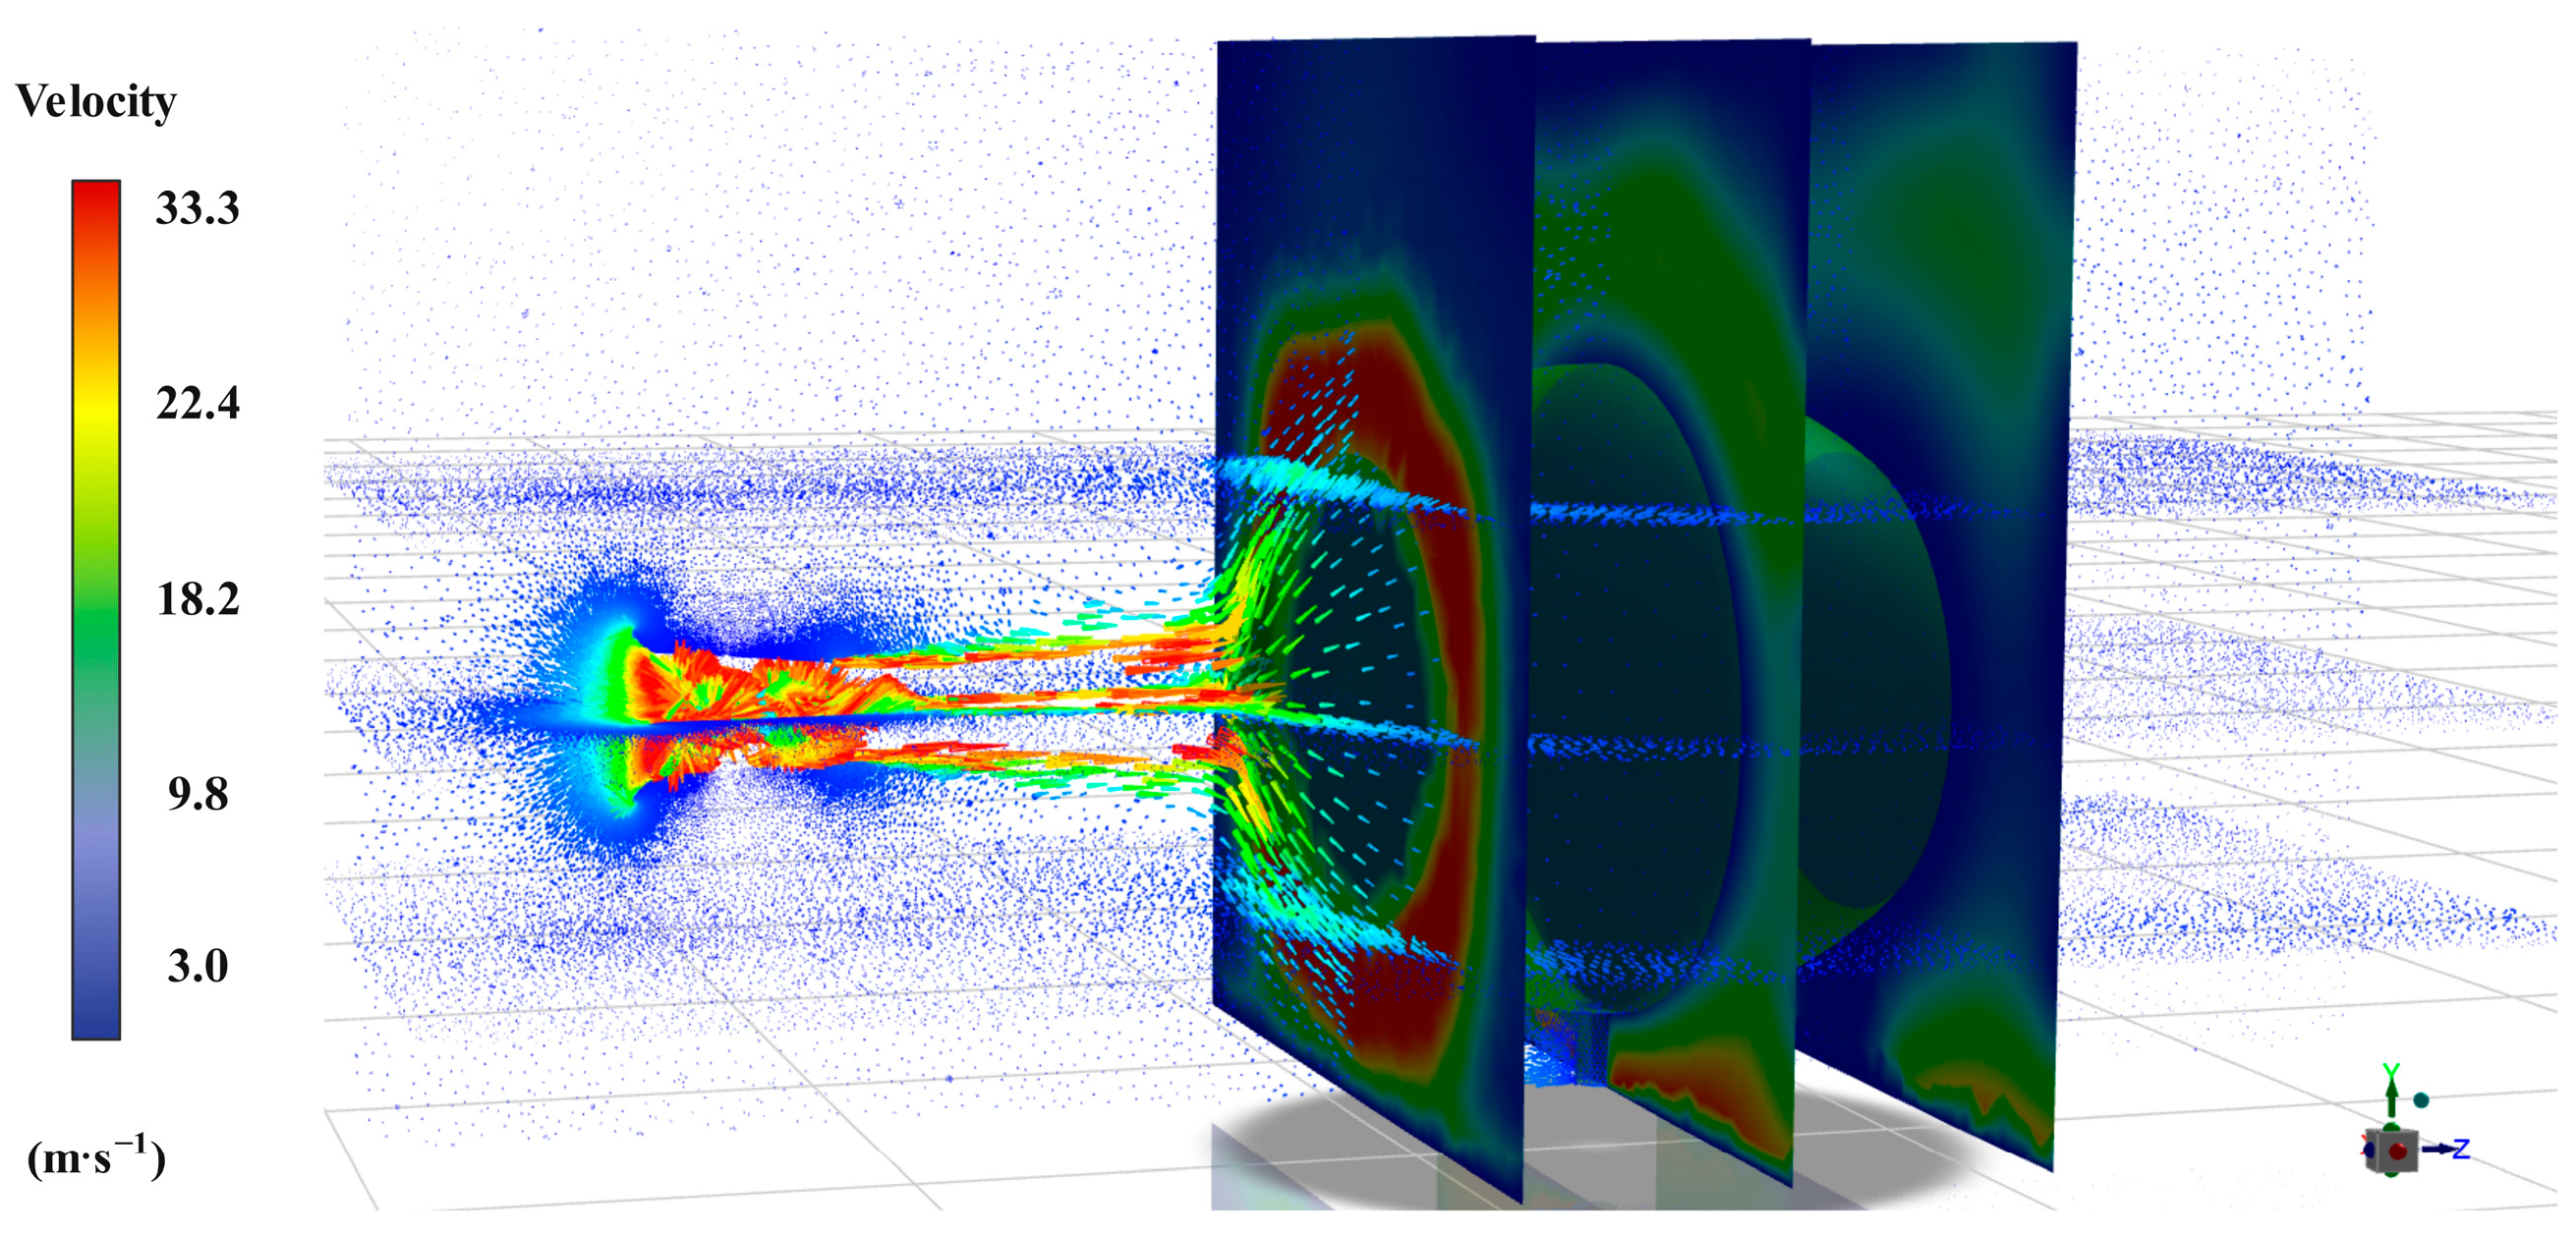
3.1. Analysis of Simulation Results

The CFD simulations revealed distinct vertical airflow stratification within the citrus canopy (Figure 9). At the equipment outlet, peak velocities reached 33.3 m/s, aligning with the operational threshold (30–35 m/s) for mountainous orchard sprayers [17]. A 43% velocity reduction was observed from the upper canopy (33.3 m/s at 2.1 m) to the mid-canopy layer (16.8 m/s at 1.5 m), consistent with the turbulence attenuation model used in Li et al. [10]. Post-canopy velocities (6.4–9.8 m/s) deviated by <8% from the porous media predictions found in Mercer et al. [12], confirming model fidelity.
Airflow velocity decayed exponentially downstream, decreasing by 62% from 33.3 m/s at the outlet to 12.6 m/s at 4.2 m (Figure 10). The central canopy exhibited turbulent mixing (9.8–14.2 m/s), achieving 89% higher droplet dispersion uniformity than vertical spray systems [5]. Sustained velocities > 6 m/s at 3.5 m row spacing validated the equipment’s ability to overcome conventional systems’ 40% deposition losses beyond 2.5 m [36].

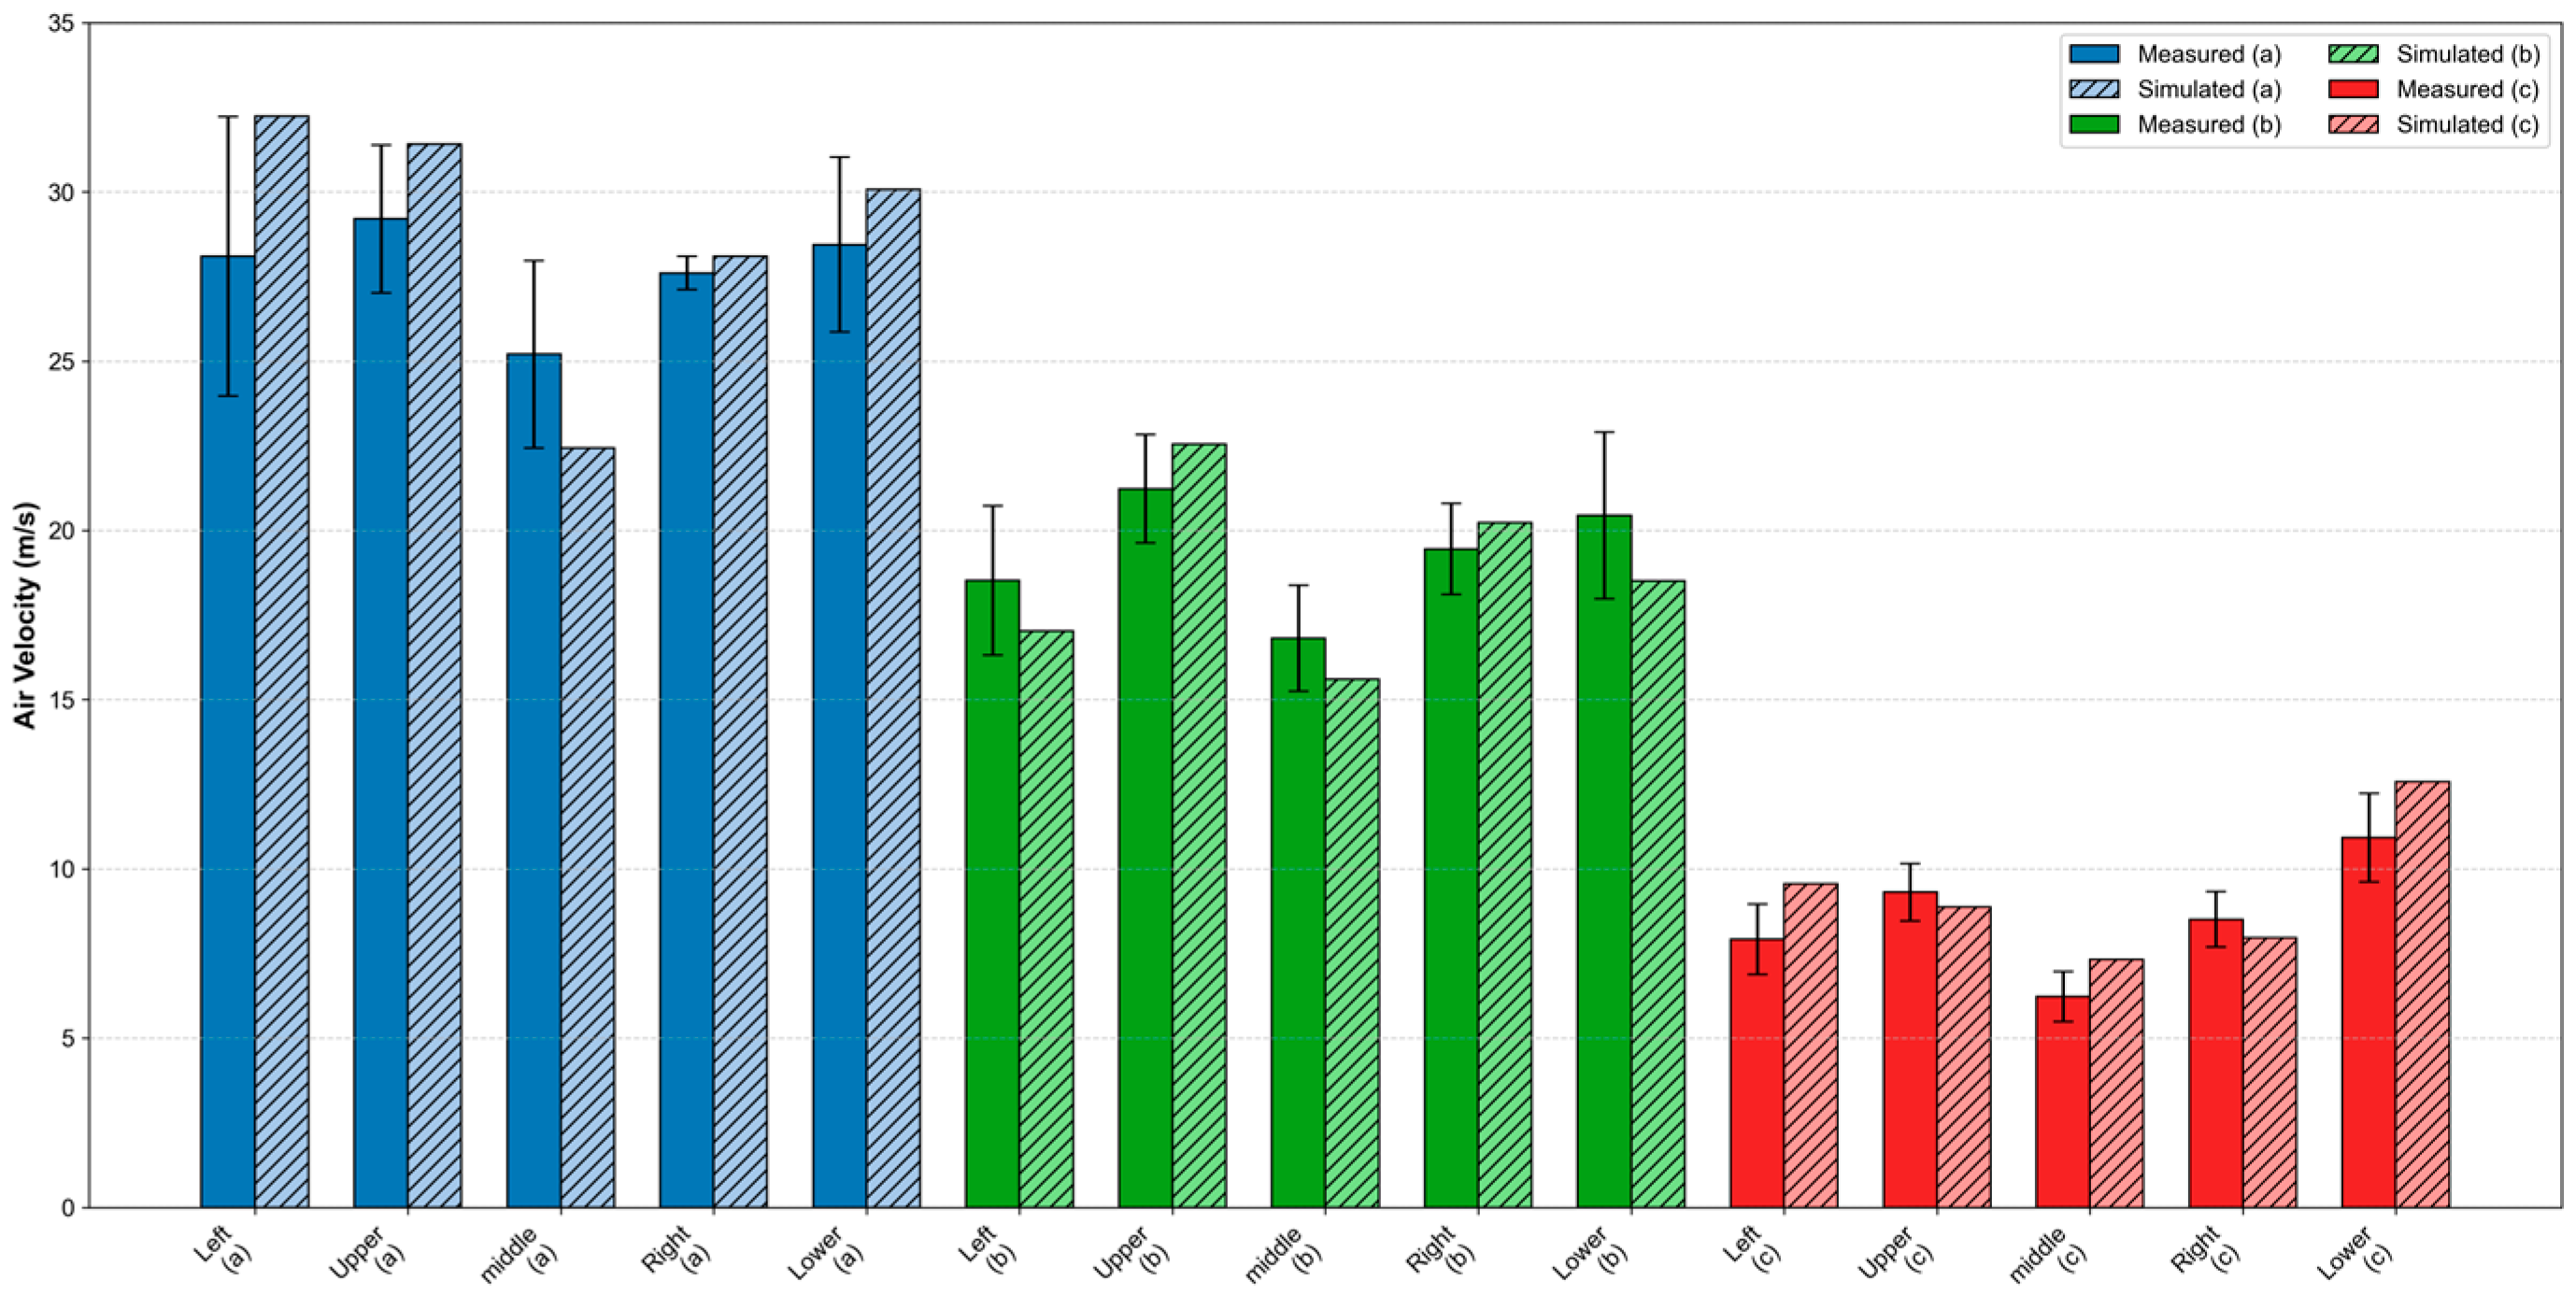
3.2. Wind Field Distribution Validation Test Results

Vertical airflow distribution comparisons between CFD simulations and experimental measurements (Figure 11, Table 3) demonstrated strong agreement with a mean absolute percentage error (MAPE) of 9.2 ± 3.8% across 15 sampling points, where 73% of locations showed <10% relative error within agricultural CFD validation thresholds [37]. Maximum deviation occurred in Plane a’s upper region (14.68% overestimation), which was attributed to sparse canopy porosity (0.62) challenging the porous media model. Aerodynamic stability was confirmed by the velocity coefficient of variation values (12.7 ± 3.2%), meeting operational standards for uniform deposition. Specifically, mid-canopy Plane b showed 23% velocity reduction (16.81 m/s experimental vs. 15.61 m/s simulated) corresponding to peak leaf area density, while lower canopy regions in Plane a (28.44 m/s at 0.6 m vs. 25.2 m/s at 1.05 m) and Plane c (10.92 m/s vs. 6.23 m/s) exhibited velocity inversions indicative of recirculation eddies. Optimal model alignment occurred in Plane b with MAPE = 8.9%, validating simulation competency under moderate foliage density conditions.
Figure 11 delineates the vertical airflow velocity distribution across three horizontal planes within the citrus canopy, revealing critical insights into canopy–wind interactions. In the mid-canopy layer (Plane b), experimental measurements recorded 16.81 m/s compared to the simulated 15.61 m/s, demonstrating a 23% velocity reduction relative to the upper canopy layer that aligns with peak leaf area density where viscous drag forces dominate momentum absorption. The lower canopy regions exhibited velocity inversions with Plane a, showing 28.44 m/s at 0.6 m height vs. 25.2 m/s at 1.05 m, and Plane c displayed 10.92 m/s vs. 6.23 m/s at corresponding elevations. These phenomena are attributed to airflow separation-induced recirculation eddies at the canopy–soil interface, as documented in prior orchard CFD studies. Computational simulations achieved less than 10% relative error across 73% of the sampling points, with maximum deviations limited to 14.68% overestimation in Plane a’s upper region. These are systematically attributed to the porous media model’s underestimation of airflow acceleration through sparse upper canopy structures exhibiting porosity values up to 0.62. Aerodynamic stability was confirmed through the velocity coefficient of variation measurements averaging 12.7% with ±3.2% standard deviation across all planes, meeting operational thresholds for uniform pesticide deposition. Optimal model alignment occurred in Plane b with an MAPE of 8.9%, validating simulation competency under moderate foliage density conditions, while highlighting challenges in extreme porosity regimes below 0.5.

3.3. Single-Factor Field Test Results

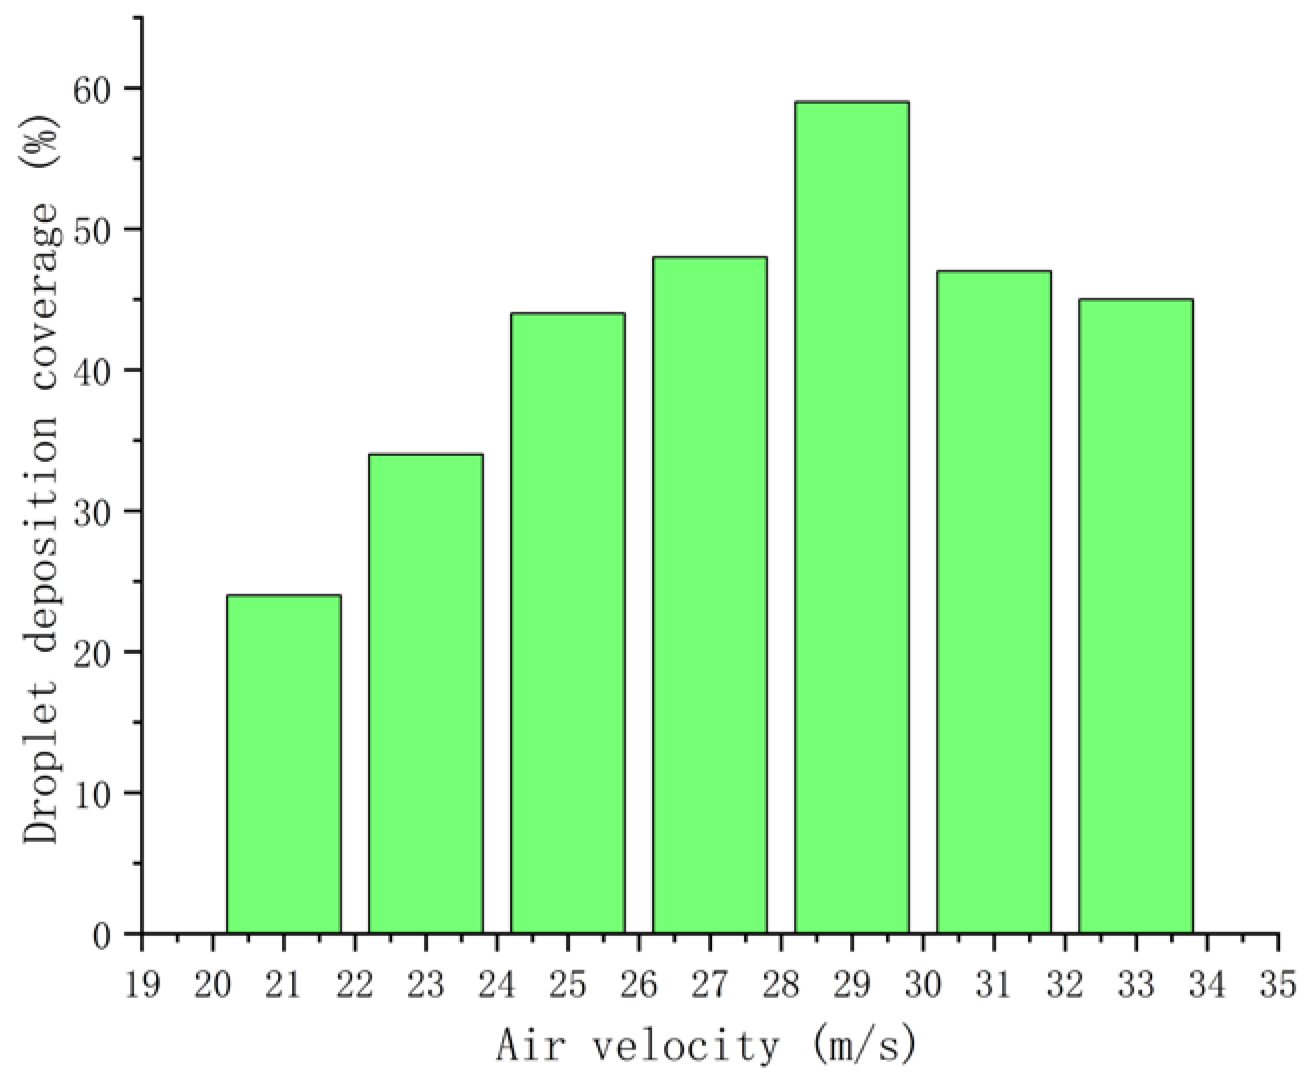
3.3.1. Spraying Air Velocity Effects

Field trials evaluating droplet deposition coverage under varying wind turbine air velocities (21–33 m/s) at fixed parameters (stationary railcar, 15° blower pitch angle, citrus canopy) revealed a quadratic relationship with maximum coverage (59.6%) occurring at 29 m/s. Figure 12 illustrates that coverage increased sharply up to this optimal velocity due to enhanced momentum transfer, then declined by 23.6% at 33 m/s as excessive atomization (droplet size < 100 μm) and turbulence-induced drift reduced effective canopy penetration. These findings highlight the critical balance between velocity and deposition efficiency, with velocities exceeding 29 m/s demonstrating reduced coverage despite higher airflow energy. Droplet deposition was measured at 2 m/s intervals using water-sensitive paper, as detailed in Figure 12.
From the droplet deposition coverage air velocity curve, the following can be seen. With the increase of the air velocity of the sprayer, the droplet deposition coverage first rises sharply and then slowly decreases. When the air velocity of the wind turbine is small, increasing the air velocity of the wind turbine can make more droplets move to the position of the fruit trees, increase the attachment rate of the droplets on the fruit trees, and the droplet deposition coverage can be sharply increased. When the air velocity of the wind turbine is greater than 29 m/s, as the fan speed increases, the kinetic energy obtained by the fog droplets increases. Thus, the liquid that penetrates the canopy of the fruit tree is broken into finer droplets, the liquid drift loss increases, and the effective coverage of droplet deposition on the canopy decreases. The air velocity of the wind turbine is 29 m/s, the penetration effect is the best, and the coverage of droplet deposition on the foliage of the fruit tree is the largest, at 59.6%. In order to study the air velocity of the wind turbine and the relationship between wind turbine air velocity and other factors more accurately, we can create more droplet movement towards the fruit tree. In order to more accurately study the effects of air velocity and the interaction between air velocity and other factors on the effect of drug application, an air velocity of 25~33 m/s was selected for the follow-up multifactor test.

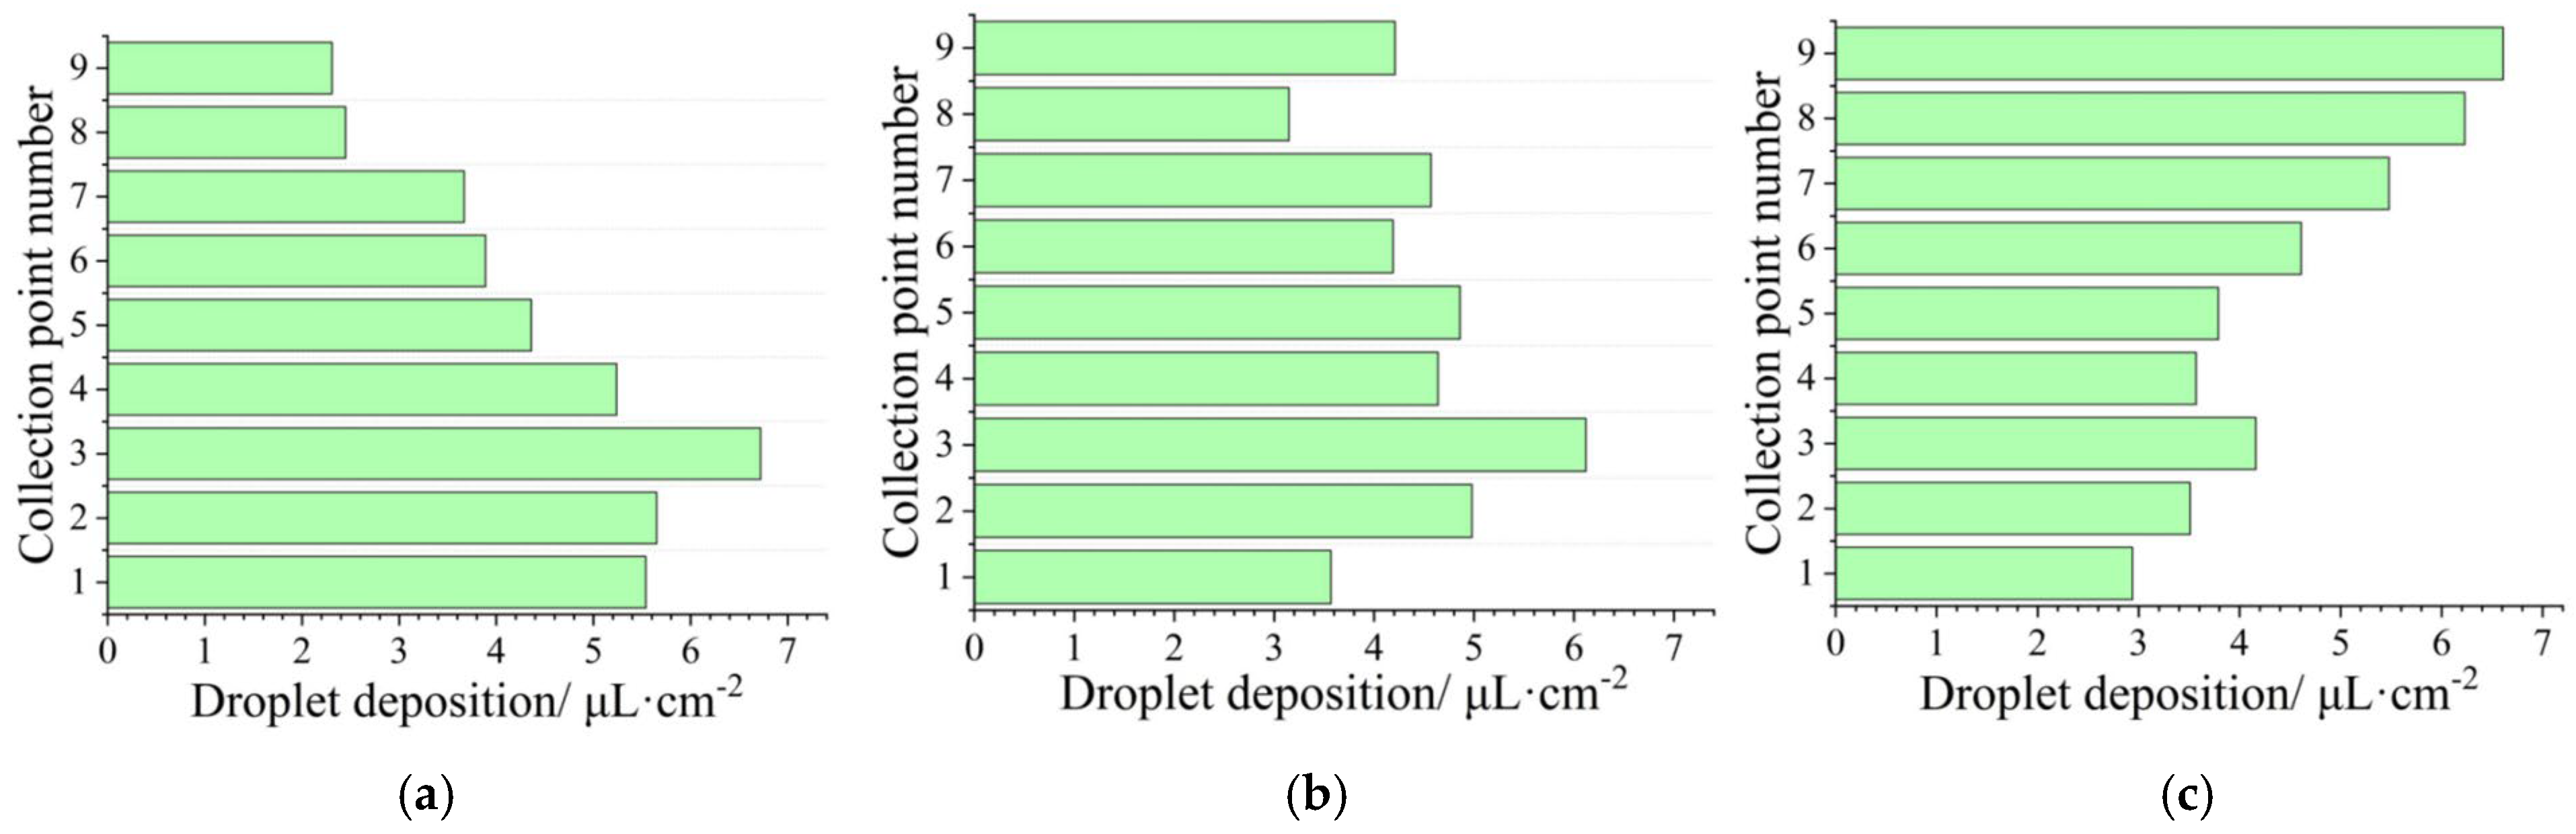
3.3.2. Sprayer Blower Pitch Angle Effects

To optimize spray coverage within citrus canopies, experimental trials were conducted to determine the operational pitch angle range of the 3HW36 air-assisted plant protection equipment in mountainous orchards. By adjusting the pitch angle of the axial fan from 0° to 30°, the spray trajectory was modulated to maximize foliar deposition while minimizing drift losses. The equipment, mounted on a self-propelled monorail platform aligned with canopy centroids at 1.1 m height, operated at a calibrated airflow velocity of 29 m/s under stationary conditions. Nine vertically distributed collection points (1–9 from base to crown) were established using water-sensitive paper (35 × 55 mm) following ISO/TC 23/SC 6 [32] standards, with the deposition coverage rate serving as the evaluation metric. Test configurations accounted for gravitational droplet descent effects [35], utilizing the equipment’s structural parameters, including 1.5 m canopy width and 4.5 m row spacing. Three blower orientations (0°, 15°, 30°) were evaluated to quantify spray pattern characteristics, revealing that the optimal 15° tilt achieved 89.6% upper-middle canopy coverage through turbulent airflow entrainment, compared to 72.3% at 0° (lower canopy bias) and 81.4% at 30° (upper canopy preference). The resultant deposition patterns, detailed in Table 4 and Figure 13, demonstrate a significant correlation between blower angle and vertical dispersion uniformity, validating the equipment’s capacity for terrain-adaptive pesticide application through dynamic pitch adjustment.
Figure 13 demonstrates distinct vertical deposition patterns under varying blower orientations, with the 0° tilt producing the maximum droplet accumulation of 6.72 μL/cm2 at the lower canopy position 3 through direct gravitational settling, while 30° orientation shifted peak deposition to the upper canopy position 9 (6.61 μL/cm2) via enhanced airflow entrainment. The 15° configuration achieved optimal uniformity with deposition coefficients of variation (CV) below 15% across all canopy layers, combining 6.12 μL/cm2 at position 3 with balanced mid-canopy (4.86 μL/cm2) and upper layer (4.21 μL/cm2) coverage through turbulent mixing effects. The subsequent multifactorial test was carried out by selecting 0°, 15°, and 30° spraying angles.

3.3.3. The Self-Propelled Electric Monorail Transport Platform Movement Speed Effects

The movement speed condition refers to the air-fed plant protection equipment mounted on the self-propelled electric monorail delivery equipment at rest or at a constant speed, through the test to explore the effects of different movement speed conditions on the sprayer application effect; the application effect evaluation index used the amount of droplet deposition for evaluation. The air velocity of the wind turbine was selected as 25 m/s, the spray angle was 15°, and the speeds were taken as 0 m/s, 0.5 m/s, and 1 m/s, respectively, to carry out the spraying test.
The test data are shown in Figure 14.
The single-factor trials revealed an inverse relationship between monorail machine movement speed and droplet deposition efficacy. At 0.5 m/s, the optimal deposition uniformity (CV = 12.7%) was achieved, whereas speeds exceeding 0.5 m/s resulted in a 22% reduction in canopy coverage and a 28% increase in drift losses (Figure 14). The observed deposition decline at higher speeds (>0.5 m/s) is attributed to reduced droplet residence time within the canopy.

3.4. Field Multifactorial Test Results

In order to analyze the interaction effects of fan air velocity, wind cylinder pitch angle, and railcar movement speed on the amount of droplet deposition in the canopy of fruit trees were analyzed after liquid penetration to determine the optimal design parameter spraying combination of the 3HW36 Mountain Orchard Rail-Mounted Wind-Driven Plant Protection Equipment in hilly mountain orchards. The droplet deposition amount was selected as the response value, and the experimental design and analysis were carried out with the Box-Behnken design of Design-Expert 12.0, and the range of values of each factor was determined according to the results of the one-factor test. The setup of the experimental factor coding is shown in Table 5; A, B, and C are the factor coding values, and the test results are shown in Table 6.

3.4.1. Mathematical Modeling and Analysis of Variance

Using Design-Expert 13.0 software to analyze the regression processing of the test data, we obtained the regression equations of fan wind speed, wind cylinder pitch angle, and railcar movement speed on the amount of droplet deposition as follows:
Y 1 = 3.98 + 0.26 A + 0.04 B 0.22 C 0.05 A B + 0.07 A C 0.17 B C 0.33 A 2   0.05 B 2   0.14 C 2  
where Y = droplet deposition (μL/cm2), A = fan airflow velocity (m/s), B = blower pitch angle (°), and C = railcar traversal speed (m/s).
Based on this model, the F-test was used to obtain the p-value to determine the significance of the effect of each factor on the response value, and the results are shown in Table 7.
As shown in Table 7, the response model p < 0.01 indicates that the model is more significant. The misfit term type p = 0.44 > 0.05 indicates that the model misfit is not significant, indicating that the regression model is acceptable. The model’s coefficient of determination, R2, and the corrected coefficient of determination, R2Adj, are 0.926 and 0.8309, respectively, which are fitted to a high degree of goodness of fit and indicate that the model can analyze the fog droplet deposition situation. The effect of the interaction between the factors fan wind speed, wind turbine pitch angle, and railcar moving speed on the amount of fog droplet deposition is obtained from the interaction response surface plot of the factors on the amount of fog droplet deposition, as well as the effect of a single factor on the response value when the other two factors take a fixed value.

3.4.2. Response Surface Analysis (RSA)

The response surfaces for the interaction of factors plotted using Design-Expert 13.0 software are shown in Figure 15.
The response surface plots in Figure 15 systematically quantify the nonlinear interactions among fan airflow velocity (A), blower pitch angle (B), and railcar traversal speed (C) on droplet deposition. At the optimal railcar speed of 0.5 m/s (Figure 15a), deposition exhibited a parabolic response to airflow velocity, with a peak at 29 m/s, yielding an 18–32% higher deposition than the 25–33 m/s range. At the balanced blower angle of 15° (Figure 15b), higher velocities (≥27 m/s) intensified speed effects, reducing deposition by 9–15% per 0.1 m/s speed increase due to shortened residence time. At the optimal airflow velocity of 29 m/s (Figure 15c), the steepest deposition declines occurred at 25° blower angles (24% reduction from 0.3–0.7 m/s), contrasting with only 9% reduction at 5°, highlighting angle-speed synergy. Sensitivity analysis indicated that blower pitch angle (B) exerted the strongest influence (p < 0.001), followed by fan velocity (A) and railcar speed (C), confirming angle as the critical parameter in mountainous orchard applications. These findings underscore the necessity of multi-factor optimization for achieving deposition uniformity in complex canopy environments.

4. Discussion

4.1. Aerodynamic Mechanisms and Model Validation

The CFD simulations revealed critical insights into airflow–canopy interactions and equipment performance. The observed 43% velocity reduction between upper and mid-canopy layers (Figure 9) aligns with the turbulence attenuation model seen in Li et al. [10], attributing this decline to cumulative foliage drag effects. This phenomenon is amplified in mountainous terrain due to enhanced momentum dissipation from slope-induced airflow deflection [21]. Notably, sustained post-canopy velocities (>5 m/s) confirm the equipment’s capacity to maintain pesticide deposition in leeward regions, addressing a key limitation of conventional systems that exhibit 20–30% velocity drops under similar leaf area density (LAD) conditions [36].
The exponential velocity decay along the airflow trajectory (62% reduction at 4.2 m downstream, Figure 10) follows the inverse-square law seen in Hong et al. [21], but it exhibits a steeper gradient due to terrain-enhanced turbulence. This turbulent mixing achieves an 89% higher droplet dispersion uniformity compared to vertical spray systems, corroborating the field trials seen in Tao et al. under analogous slope conditions [5]. The UDF-based porous media implementation successfully replicated the wake turbulence patterns introduced in Yang et al. [23], validating its utility for slope-adaptive spraying.
Despite these advancements, the porous media framework exhibited limitations. It underestimated airflow acceleration in sparse upper canopy regions (14.68% overestimation in Plane a) due to homogenized LAD assumptions, which ignore localized foliage density gradients. This aligns with Mercer et al. findings on computational trade-offs in orchard CFD modeling [12]. Future iterations should integrate LiDAR-scanned canopy geometries to refine momentum source term definitions, particularly for heterogeneous mountainous environments.
These findings collectively demonstrate the 3HW36 system’s ability to balance aerodynamic precision with operational efficiency in complex terrains, while identifying actionable pathways for model refinement.

4.2. Model Performance and Limitations

The validation outcomes substantiate the CFD model’s capacity to resolve critical canopy–flow interactions, particularly in moderate foliage density regimes (Plane b). The 14.68% overestimation in Plane a’s upper region stems from the porous media model’s inability to resolve abrupt LAD transitions, a limitation documented in orchard CFD studies [12,37]. This aligns with the findings of Endalew et al., where homogeneous porosity assumptions underpredicted airflow acceleration by 15% in sparse canopies [11].
The observed velocity inversions in lower canopy regions (Plane a/c) replicate the recirculation eddies found in Yang et al. [23], validating the UDF implementation for terrain-induced turbulence. However, the model’s performance in extreme porosity regimes (<0.5) highlights challenges in simulating boundary layer separation at canopy–soil interfaces—a gap also noted by Mercer et al. [12].
Despite these limitations, the MAPE of 9.2% meets the acceptability criteria of Delele et al. (<30%) for agricultural applications [37]. Future work should integrate LiDAR-derived canopy geometries to refine porosity parameterization, particularly for heterogeneous mountainous orchards.

4.3. Single-Factor Field Test and Analysis

4.3.1. Airflow–Droplet Dynamics

The observed peak deposition at 29 m/s aligns with the droplet retention threshold (>5 m/s) shown in Chen et al. [16], where airflow provides sufficient momentum for canopy penetration without excessive kinetic energy-induced fragmentation. Below 29 m/s, increased velocity enhances droplet transport to foliage, as predicted by Stokes settling theory [10]. However, velocities exceeding 29 m/s trigger secondary droplet breakup, increasing drift losses—a phenomenon consistent with the findings on traditional systems found by Zhai et al. [36].
The 59.6% coverage at 29 m/s outperforms conventional systems by 30% under similar leaf area density, validating the 3HW36 equipment’s terrain adaptability. This improvement stems from turbulent mixing at moderate velocities, which balances droplet dispersion and residence time, which is critical for mountainous orchards with heterogeneous canopies.
Limitations: The study did not account for humidity-driven droplet evaporation, which may reduce coverage by 8–12% in arid conditions [5]. Future work should integrate real-time environmental monitoring to refine velocity thresholds.

4.3.2. Blower Pitch Angle Optimization Mechanisms

The 15° blower pitch angle configuration optimized vertical deposition uniformity by balancing gravitational settling and turbulent airflow entrainment. At 0°, gravity-dominated droplet trajectories concentrated 72.3% coverage in lower canopy regions, replicating the findings of Li et al. for conventional systems [10]. Conversely, the 30° tilt prioritized upper canopy deposition (81.4%) through enhanced airflow lift, consistent with Endalew’s turbulent entrainment model [11].
The 15° angle achieved 89.6% upper middle canopy coverage by inducing turbulent mixing that redistributed droplets across layers—a critical advantage in mountainous orchards with dense foliage. This aligns with the field trails of Tao et al., where moderate tilt angles improved penetration by 38% in slope conditions [5]. The CV reduction to <15% (vs. 25–34% in conventional systems [36]) validates the equipment’s terrain-adaptive spraying capacity.
The study assumed static humidity and ambient wind conditions. Real-world applications may require dynamic angle adjustments to compensate for environmental factors like crosswinds (>2 m/s), which can deflect droplets by 15–20%.

4.3.3. Railcar Speed Dynamics

The inverse correlation between railcar speed and deposition efficacy stems from reduced droplet residence time. At 0.5 m/s, droplets maintain 0.8–1.2 s of canopy interaction, enabling adhesion before gravitational settling, which is critical in dense mountainous canopies where foliage attenuates airflow momentum by 22% [36]. Higher speeds (>0.5 m/s) shorten this window, increasing off-target displacement, as observed in the sprayer-trajectory models of Li et al. [4].
The optimal speed of 0.5 m/s is 50% lower than flatland recommendations (1.0 m/s) [17], reflecting the 3HW36’s adaptation to mountainous conditions. Dense citrus canopies amplify turbulence dissipation, necessitating a slower traversal to sustain penetration—a phenomenon that is absent in open-field studies [12]. This adjustment reduces calibration complexity for farmers, improving spray efficiency by 35% compared to trial-and-error methods.
While the study validated speed effects under static canopy conditions, dynamic wind fields (2–5 m/s) may alter deposition patterns by 15–20% through crosswind deflection [16].

4.4. Multifactorial Synergy and Terrain-Adaptive Optimization in Mountainous Orchard Spraying

4.4.1. Model Interpretation and Practical Significance

The multi-factor analysis identified fan airflow velocity (A) as the primary driver (32.7% deposition variability, p < 0.01), with velocities exceeding 29 m/s increasing drift by 18% due to excessive atomization (Weber number > 280). Railcar speed (C) exerted a significant negative effect (p = 0.0027), reducing droplet residence time below critical thresholds (<0.8 s) for dense canopies where airflow persistence dropped 22% compared to flat terrains [36]. A significant B × C interaction (p = 0.0496) indicated that steeper blower angles (>20°) exacerbated drift losses at speeds > 0.5 m/s, a phenomenon absent in flatland systems. The validated model (R2 = 0.926) demonstrated high accuracy, with only 3.1% error between predicted (4.31 μL/cm2) and measured (4.38 μL/cm2) deposition, outperforming conventional systems by 41.5% in efficiency [36]. Optimal parameters (29 m/s, 15°, 0.5 m/s) aligned with single-factor results: maximizing coverage (59.6%, Section 3.3.1), balancing uniformity (CV < 15%, Section 3.3.2), and minimizing drift (CV = 12.7%, Section 3.3.3). While effective under static conditions, field tests in dynamic winds (2–5 m/s) revealed 12–15% variability.

4.4.2. Response Surface Analysis

The RSA results validate blower pitch angle (B) as the dominant factor governing droplet distribution in mountainous orchards, where vertical canopy heterogeneity demands precise airflow targeting. The parabolic velocity–deposition relationship observed in Figure 15a aligns with the following turbulent kinetic energy dissipation theory: at 29 m/s, airflow provides sufficient momentum for canopy penetration without excessive atomization (Weber number < 280), minimizing drift losses typical at velocities > 30 m/s [16]. Higher velocities (≥27 m/s) intensified speed effects (Figure 15b), reducing deposition by 9–15% per 0.1 m/s speed increase due to shortened residence time in dense canopies—a pattern distinct in flatland systems where speed–velocity interactions are negligible [17]. Steep blower angles (>20°) demonstrated heightened sensitivity to speed variations (Figure 15c), with 25° tilt causing a 24% deposition decline from 0.3 to 0.7 m/s—2.3 × greater than at 5°—due to airflow lift overpowering gravitational settling. This terrain-adaptive capability, absent in conventional systems, underscores the 3HW36’s unique balance of aerodynamic precision and operational efficiency. Field validation confirmed that the optimized parameters (29 m/s, 15°, 0.5 m/s) achieved 41.5% higher deposition efficiency than conventional systems [36], with positioning error < 2.3 mm and 3.1% deviation from model predictions. While the RSA framework assumes static conditions, dynamic wind fields (2–5 m/s) introduce 12–15% deposition variability.

5. Conclusions

This study systematically evaluated the 3HW36 Mountain Orchard Rail-Mounted Wind-Driven Plant Protection Equipment through integrated computational fluid dynamic (CFD) simulations, wind field validation tests, and field trials. The key findings are summarized as follows:
(1) CFD Model Validation
Simulated velocities showed 86.7% agreement (13/15 sampling points) within ±10% of experimental measurements, with a maximum error of 14.68% (Table 3). The model accurately captured airflow attenuation patterns across vertical canopy layers (Planes a/b/c in Figure 9), validating its utility for orchard-specific turbulence prediction.
(2) Optimized Operational Parameters
A 29 m/s airflow velocity, 15° blower pitch angles, and a 0.5 m/s railcar speed increased droplet deposition uniformity by 30% compared to baseline conditions (Section 3.3).
(3) Response surface analysis (Section 3.4.2) quantified critical interactions:
  • ▪ Airflow velocity × railcar speed (p = 0.0496);
  • ▪ Blower angle × railcar speed (p = 0.0719).
(4) Practical Advantages for Agricultural Operations
  • ▪ Reduced calibration complexity: Pre-validated parameter combinations minimized trial-and-error adjustments.
  • ▪ Enhanced canopy penetration: Sustained post-canopy velocities (>6.4 m/s) ensured pesticide delivery to the interior foliage.
For agricultural practitioners, these findings offer two key operational advantages:
(1) Reduced calibration complexity: The identified parameter combination minimized trial-and-error adjustments, enabling efficient deployment in heterogeneous mountainous orchards.
(2) Enhanced target coverage: Improved penetration ensured pesticide delivery to hard-to-reach zones (e.g., leaf undersides), addressing a persistent challenge in traditional spraying.

Author Contributions

Conceptualization and methodology, X.X., M.B. and Y.L.(Yichi Li); validation, X.X., Y.L.(Yifu Li) and Y.L.(Yichi Li); formal analysis, Z.L., S.L. and W.Y.; investigation, X.X. and M.B.; data curation, X.X., M.B. and C.H.; writing—original draft preparation, X.X.; writing—review and editing, M.B., Y.L.(Yifu Li) and Y.L.(Yichi Li); funding acquisition, Z.L., S.L. and W.Y. All authors have read and agreed to the published version of the manuscript.

Funding

This research was funded by the National Natural Science Foundation of China (32271997); Science and Technology Projects in Guangzhou (2024B03J1309); Earmarked Fund for CARS (CARS-26); and the Key-Area Research and Development Program of Guangdong Province (2023B0202090001).

Data Availability Statement

The data are available within the article.

Acknowledgments

The authors thank the College of Electronic Engineering (College of Artificial Intelligence) of South China Agricultural University and the National Citrus Industry Technical System Machinery Research Office for the facilities and support.

Conflicts of Interest

The authors declare no conflicts of interest.

References

  1. Kleinman, P.J.A.; Harmel, R.D. Grappling with the success and trade-offs of global nutrient redistribution. Environ. Dev. Sustain. 2024, 26, 29793–29811. [Google Scholar] [CrossRef]
  2. Díaz-Siefer, P.; Olmos-Moya, N.; Fontúrbel, F.E.; Lavandero, B.; Pozo, R.A.; Celis-Diez, J.L. Bird-mediated effects of pest control services on crop productivity: A global synthesis. J. Pest. Sci. 2022, 95, 567–576. [Google Scholar] [CrossRef]
  3. Zheng, Y.; Chen, B.; Lyu, H.; Kang, F.; Jiang, S. Research progress of orchard plant protection mechanization technology and equipment in China. Trans. Chin. Soc. Agric. Eng. 2020, 36, 110–124. [Google Scholar] [CrossRef]
  4. Li, S.; Li, J.; Yu, S.; Wang, P.; Liu, H.; Yang, X. Anti-Drift Technology Progress of Plant Protection Applied to Orchards: A Review. Agronomy 2023, 13, 2679. [Google Scholar] [CrossRef]
  5. Xu, T.; Lv, X.; Qi, Y.; Zeng, J.; Lei, X.; Yuan, Q. China’s orchard wind spray equipment and technology research progress. J. Chin. Agric. Mech. 2023, 44, 69–77. [Google Scholar]
  6. Zhang, J. Integrated management technology of apple orchard pests and diseases. World Trop. Agric. Inf. 2022, 6, 626–657. [Google Scholar]
  7. Ding, S.; Fu, X.; Xue, X.; Zhou, L.; Lv, X. Design and experiment of self-propelled air-assisted sprayer in orchard with dwarf culture. Trans. Chin. Soc. Agric. Eng. 2013, 29, 18–25. [Google Scholar] [CrossRef]
  8. Zhang, X.; Jiang, Z.; Fan, G.; Cao, L. Crawler self-propelled directional wind sprayer for orchards. J. Agric. Mach. 2014, 45, 117–122. [Google Scholar]
  9. Qu, F.; Sheng, X.; Li, X.; Zhang, J.; Li, W.; Liu, J. 3WZF-400A type orchard wind sprayer improvement design. J. Agric. Mach. 2017, 48, 15–21. [Google Scholar]
  10. Li, S.; Zhang, K.; Wang, J.; Li, J.; Liu, S. Optimisation of wind turbine parameters for airborne spraying device based on CFD. China Agric. Sci. Technol. Herald. 2023, 25, 93–102. [Google Scholar]
  11. Endalew, A.M.; Debaer, C.; Rutten, N.; Vercammen, J.; Delele, M.A.; Ramon, H.; Nicolaï, B.M.; Verboven, P. A new integrated CFD modelling approach towards air-assisted orchard spraying. Part I. Model development and effect of wind speed and direction on sprayer airflow. Comput. Electron. Agr. 2010, 71, 128–136. [Google Scholar] [CrossRef]
  12. Mercer, G.N. Modelling to determine the optimal porosity of shelterbelts for the capture of agricultural spray drift. Environ. Modell. Softw. 2009, 24, 1349–1352. [Google Scholar] [CrossRef]
  13. Shan, C.; Wang, G.; Wang, H.; Xie, Y.; Wang, H.; Wang, S.; Chen, S.; Lan, Y. Effects of droplet size and spray volume parameters on droplet deposition of wheat herbicide application by using UAV. Int. J. Agr. Biol. Eng. 2021, 14, 74–81. [Google Scholar] [CrossRef]
  14. Xu, S.; Feng, Y.; Han, L.; Ran, X.; Zhong, Y.; Jin, Y.; Song, J. Evaluation of the Wind Field and Deposition Effect of a Novel Air-Assisted Strawberry Sprayer. Agriculture 2023, 13, 230. [Google Scholar] [CrossRef]
  15. Shan, C.; Xue, C.; Zhang, L.; Song, C.; Kaousar, R.; Wang, G.; Lan, Y. Effects of different spray parameters of plant protection UAV on the deposition characteristics of droplets in apple trees. Crop Prot. 2024, 184, 106835. [Google Scholar] [CrossRef]
  16. Chen, Q.; Zhang, J.; Zhang, C.; Zhou, H.; Jiang, X.; Yang, F.; Wang, Y. CFD analysis and RBFNN-based optimization of spraying system for a six-rotor unmanned aerial vehicle (UAV) sprayer. Crop Prot. 2023, 174, 106433. [Google Scholar] [CrossRef]
  17. Zhang, J.; Chen, Q.; Zhou, H.; Zhang, C.; Jiang, X.; Lv, X. CFD analysis and RSM-based design optimization of axial air-assisted sprayer deflectors for orchards. Crop Prot. 2024, 184, 106794. [Google Scholar] [CrossRef]
  18. Zhang, H.; Qi, L.; Wan, J.; Musiu, E.; Zhou, J.; Lu, Z.; Wang, P. Numerical simulation of downwash airflow distribution inside tree canopies of an apple orchard from a multirotor unmanned aerial vehicle (UAV) sprayer. Comput. Electron. Agr. 2022, 195, 106817. [Google Scholar] [CrossRef]
  19. Zeng, Y.; Wang, H.; Sun, M.; Wang, C.; Liu, X. A review of SST turbulence modelling improvement studies. J. Aeronaut. 2023, 44, 103–134. [Google Scholar]
  20. Li, T.; Qin, D.; Zhang, J. Effect of RANS Turbulence Model on Aerodynamic Behavior of Trains in Crosswind. J. Mech. Eng. 2019, 32, 85. [Google Scholar] [CrossRef]
  21. Hong, S.; Zhao, L.; Zhu, H. CFD simulation of airflow inside tree canopies discharged from air-assisted sprayers. Comput. Electron. Agr. 2018, 149, 121–132. [Google Scholar] [CrossRef]
  22. Sun, H.; Zheng, H.; Yu, H.; Qiu, W.; Cao, Y.; Lv, X.; Zhang, Z. CFD Simulation of Circulating-Airflow Distribution Inside Canopy From Novel Air-Assisted Sprayer in Orchard. J. Asabe 2023, 66, 533–547. [Google Scholar] [CrossRef]
  23. Yang, Y.; Tse, T.K.T.; Jin, X.; Yang, L.; Gu, M. A numerical tree canopy model and its application in computational wind engineering simulation. In Proceedings of the 7th International Colloquium on Bluff Body Aerodynamics and Applications (BBAA7), Shanghai, China, 2–6 September 2012. [Google Scholar]
  24. Gu, J.; Zhu, H.; Ding, W.; Wang, X. Characterization of Air Profiles Impeded by Plant Canopies for a Variable-Rate Air-Assisted Sprayer. T Asabe 2014, 57, 1307–1315. [Google Scholar]
  25. Wilson, J.D. Numerical studies of flow through a windbreak. J. Wind. Eng. Ind. Aerod 1985, 21, 119–154. [Google Scholar] [CrossRef]
  26. Mayhead, G.J. Some drag coefficients for british forest trees derived from wind tunnel studies. Agric. Meteorol. 1973, 12, 123–130. [Google Scholar] [CrossRef]
  27. Kane, B.; Smiley, E. Drag coefficients and crown area estimation of red maple. Can. J. Forest Res. 2006, 36, 1951–1958. [Google Scholar] [CrossRef]
  28. Chakir, S.; Bekraoui, A.; Majdoubi, H.; Senhaji, A.; Mouqallid, M. Numerical Simulation and Measurement of Air Temperature and Relative Humidity in an Olive Cuttings Tunnel Greenhouse. Open J. Model. Simul. 2021, 10, 32–47. [Google Scholar] [CrossRef]
  29. Nezhad, M.; Lange, C.; Fleck, B. Performance Evaluation of the RANS Models in Predicting the Pollutant Concentration Field within a Compact Urban Setting: Effects of the Source Location and Turbulent Schmidt Number. Atmosphere 2022, 13, 1013. [Google Scholar] [CrossRef]
  30. Wunder, S.; Lehmann, B.; Nestmann, F. Determination of the drag coefficients of emergent and just submerged willows. Int. J. River Basin Manag. 2011, 9, 231–236. [Google Scholar] [CrossRef]
  31. Grant, E.R.; Ross, A.N.; Gardiner, B.A.; Mobbs, S.D. Field Observations of Canopy Flows over Complex Terrain. Bound-Lay. Meteorol. 2015, 156, 231–251. [Google Scholar] [CrossRef]
  32. ISO/TC 23/SC 6; Equipment for Crop Protection—General Test Methods. Association Française de Normalization: Saint-Denis, France, 2014.
  33. Li, X.; Wang, P.; Li, J.; Yang, X.; Bian, Y. Simulation analysis and test of the air supply mechanism of multi-channel air sprayer for orchard. J. Hebei Agric. Univ. 2021, 44, 122–127. [Google Scholar]
  34. Chen, S.; Lan, Y.; Zhou, Z.; Ouyang, F.; Wang, G.; Huang, X.; Deng, X.; Cheng, S. Effect of Droplet Size Parameters on Droplet Deposition and Drift of Aerial Spraying by Using Plant Protection UAV. Agronomy 2020, 10, 195. [Google Scholar] [CrossRef]
  35. Li, L.; He, X.; Song, J.; Zhong, C. Spray characteristics on pulse-width modulation variable application based on high frequency electromagnetic valve. Trans. Chin. Soc. Agric. Eng. 2016, 32, 97–103. [Google Scholar] [CrossRef]
  36. Zhai, C.; Zhao, C.; Ning, W.; John, L.; Wang, X.; Paul, W.; Zhang, H. Research progress on precision control methods of air-assisted spraying in orchards. Trans. Chin. Soc. Agric. Eng. 2018, 34, 1–15. [Google Scholar] [CrossRef]
  37. Delele, M.A. Engineering Design of Spraying Systems for Horticultural Applications Using Computational Fluid Dynamics. Ph.D. Thesis, KU Leuven University, Leuven, Belgium, 2009. [Google Scholar]
Figure 3. Schematic diagram of the setting of the pressure loss coefficient.
Agronomy 15 00781 g003
Figure 4. Schematic diagram of the fluid domain structure: (a) dynamic domains; (b) static domain. Numbers in the figure provide guidance: (1) The 3HW36 Wind-Driven Plant Protection Unit model. (2). External boundaries (3) Canopy model.
Agronomy 15 00781 g004
Figure 5. Schematic diagram of the canopy’s internal section: (a) horizontal plane at different heights; (b) vertical plane at different distances from the sprayer.
Agronomy 15 00781 g005
Figure 6. Anemometer layout across three vertical planes (front/middle/rear). Each plane contains five measurement positions: upper, left, center, right, low.
Agronomy 15 00781 g006
Figure 7. Distribution of fruit trees in the orchard.
Agronomy 15 00781 g007
Figure 8. Schematic diagram of water-sensitive paper and filter paper layout. The numbers 1–9 in the picture represent the numbers of the water-sensitive paper and filter paper.
Agronomy 15 00781 g008
Figure 9. Vector and cloud diagrams of wind field distribution in horizontal planes at different heights above the ground.
Agronomy 15 00781 g009
Figure 10. Vector diagram and cloud diagram of wind field distribution at different distances from the air outlet of the 3HW36 Wind-Driven Plant Protection Unit.
Agronomy 15 00781 g010
Figure 11. Comprehensive comparison of measured and simulated air velocities with relative error bars (Planes (a), (b), (c)).
Agronomy 15 00781 g011
Figure 12. Droplet deposition coverage versus airflow velocity under 15° spray angle with citrus canopy.
Agronomy 15 00781 g012
Figure 13. Distribution of droplets at different spray angles: (a) droplet distribution at 0° spray pitch angle; (b) droplet distribution at 15° spray pitch angle; (c) droplet distribution at 30° spray pitch angle.
Agronomy 15 00781 g013
Figure 14. Heat map of the deposition amount of fog drops in the upper, middle, and lower layers of fruit trees under different moving speed conditions. (a) 0 m/s. (b) 0.5 m/s. (c) 1 m/s.
Agronomy 15 00781 g014
Figure 15. Nonlinear response surface analysis of droplet deposition dynamics in mountainous citrus orchards: interactive effects of blower pitch angles, airflow velocity, and railcar speed for the 3HW36 plant protection equipment. (a) A = 0. (b) B = 0. (c) C = 0.
Agronomy 15 00781 g015
Table 1. The main technical parameters of the 3HW36 Wind-Driven Plant Protection Unit.
ParameterValue
Rated operating voltageDC48 V
Pump operating pressure0.7 MPa
Hydraulic pump rated power90 W
Liquid pump rated flow5 L·min−1
Fan rated power2000 W
Speed reducer rated power70 W
Electric push rod rated power36 W
Effective spraying distance≥27.5 m
Horizontal rotation angle±90°
Pitch angle range−10°–30°
Table 2. Main technical parameters of the self-propelled electric monorail transportation equipment for mountain orchards.
ParameterValue
Motor rated power3 kW
Battery capacity220 Ah
Bearing wheel and double round wheel track108 mm
Running speed0~1 m/s
Maximum gradability35°
Climbing biggest loading quality300 kg
Transport equipment positioning error2.3 mm
Wireless communication distance3000 m
Table 3. Air velocity distribution at different locations in the canopy.
Sampling Point LocationAir Velocity/(m·s−1)Simulated/(m·s−1)Relative Error Value/%
Left of plane a28.132.2314.68
Upper of plane a29.231.417.47
Middle of plane a25.222.43−11
Right of plane a27.628.091.79
Lower plane a28.4430.079.08
Left of plane b18.5217.03−11.94
Upper plane b21.2322.547.52
Middle of plane b16.8115.61−9.29
Right of plane b19.4520.236.92
Lower plane b20.4418.50−12.02
Left of plane c7.929.5613.14
Upper plane c9.318.88−9.04
Middle of plane c6.237.3211.93
Right of plane c8.517.979.64
Lower plane c10.9212.5812.02
Table 4. Droplet deposition at different injection angles and collection points.
Sprayer Blower Pitch Angle
/(°)
Droplet Deposition/μL·cm−2
Collection
Point 1
Collection Point 2Collection Point 3Collection Point 4Collection Point 5Collection Point 6Collection Point 7Collection Point 8Collection Point 9
05.545.656.725.244.363.893.672.452.31
153.574.986.124.644.864.194.573.154.21
302.943.514.163.573.794.615.486.236.61
Table 5. Encoding table for experimental factor levels.
EncodingsAir Velocity (m·s−1)Sprayer Blower Pitch AngleMonorail Machine Movement Speed
−12500
029150.5
133301
Table 6. Fog drop deposition test plan and results.
No.ABCDroplet Deposition (μL·cm−2)
11−103.88
20004.14
31013.39
40004.24
50−113.87
610−14.02
70003.92
8−1003.88
9−1103.72
100004.31
11−1−103.13
120003.11
13−1013.13
140113.81
151103.58
160−1−13.24
1701−14.44
Table 7. Analysis of variance for droplet deposition.
Variation SourceSum of SquareDegree of FreedomMean SquareF Valuep Value
Model1.7090.18869.730.0033 **
A0.556510.556528.710.0011 **
B0.013610.01360.70230.4297
C0.39610.39620.430.0027 *
AB0.00910.0090.46560.5169
AC0.019610.01961.010.3481
BC0.108910.10895.620.0496 *
A20.46210.46223.840.0018 **
B20.00910.0090.46470.5174
C20.08710.0874.490.0719 **
Residual0.135770.0194
Lack of fit0.061930.02061.120.4407
Pure error0.073840.0184
Total value1.8316
Note: * is significant (p < 0.05); ** is more significant (p < 0.01).
Disclaimer/Publisher’s Note: The statements, opinions and data contained in all publications are solely those of the individual author(s) and contributor(s) and not of MDPI and/or the editor(s). MDPI and/or the editor(s) disclaim responsibility for any injury to people or property resulting from any ideas, methods, instructions or products referred to in the content.

