Article

Using Machine Learning to Assess the Effects of Biochar-Based Fertilizers on Crop Production and N2O Emissions in China

1
Nanjing Institute of Environmental Sciences, Ministry of Ecology and Environment, Nanjing 210042, China
2
Institute of Soil and Fertilizer & Resources and Environment, Jiangxi Academy of Agricultural Sciences, Nanchang 330200, China
3
Institute of Eco-environmental Research, Zhejiang University of Science and Technology, Hangzhou 310023, China
4
State Key Laboratory for Ecological Security of Regions and Cities, Ningbo Observation and Research Station, Institute of Urban Environment, Chinese Academy of Sciences, Xiamen 361021, China
5
Institute of Soil and Environmental Science, Pir Mehr Ali Shah Arid Agriculture University, Rawalpindi 46300, Pakistan
*
Author to whom correspondence should be addressed.
Agronomy 2025, 15(5), 1238; https://doi.org/10.3390/agronomy15051238
Submission received: 18 April 2025 / Revised: 14 May 2025 / Accepted: 16 May 2025 / Published: 19 May 2025
(This article belongs to the Special Issue New Pathways Towards Carbon Neutrality in Agricultural Systems)

Abstract

:
The growing global population and increasing agricultural demands have made nitrogen fertilizers essential for modern agriculture. However, nearly 50% of applied nitrogen fertilizers are lost to the environment, causing pollution and greenhouse gas (GHG) emissions. Biochar-based fertilizers (BBFs), combining biochar with chemical fertilizers, enhance nutrient efficiency, boost crop yields, and reduce N2O emissions. However, comprehensive field studies on BBF impacts remain limited. This study uses a global dataset of BBF field experiments to build predictive models with three machine learning algorithms for crop yields and N2O emissions, and to assess BBFs’ potential to increase yields and mitigate emissions in China’s major crops. The artificial neural network (ANN) model outperformed random forest (RF) and support vector machine (SVM) in predicting N2O emissions (R2: 0.99; EF: 0.99), while all models showed high accuracy for crop yields (R2, EF: 0.98–0.99). Variable importance analysis revealed that BBF C/N and BBF N/Mineral N explained 4.25% and 3.95% of yield variation, and 3.19% and 0.55% of N2O emission variation, respectively. BBFs could increase China’s major crop yields by 4.3–5.0% and reduce N2O emissions by 3.7–6.3%, based on simulations. Challenges like high costs and limited adaptability persist, necessitating optimized production, standardized protocols, and expanded trials.

1. Introduction

Using nitrogen fertilizers is fundamental to modern agriculture, underpinning high crop yields and global food security. By 2050, the global population is expected to rise by 2 to 3 billion, significantly increasing the demand for nitrogen fertilizers and agricultural land [1,2]. At current technological levels, the global average nitrogen use efficiency hovers around 47%, suggesting that nearly half of the applied nitrogen is lost to the environment [3]. These losses result in cascading environmental issues, including atmospheric N2O emissions, aquatic eutrophication, and soil acidification [4,5,6]. Enhancing nutrient management to tackle this “nitrogen dilemma” has emerged as a vital sustainability challenge for achieving climate-smart agriculture and promoting sustainable agricultural development [7,8].
Biochar, a stable carbon-rich material produced through the pyrolysis of biomass under oxygen-limited conditions, has garnered attention for its potential to mitigate climate change and enhance agricultural productivity [9]. Over a century timescale, approximately 70% of its initial carbon remains intact, positioning biochar as a viable strategy for significant carbon dioxide removal [10,11]. To maximize benefits and minimize risks, biochar should be produced under certified standards such as IBI to ensure quality and safety [12]. Recent studies indicate that combining biochar soil amendment with energy recovery during production could transform China’s staple crop production systems from a net carbon source to a net carbon sink [13]. Biochar application has also been shown to improve crop yields by an average of 10 to 16% globally, primarily by enhancing soil fertility through increased nutrient retention and promoting beneficial soil microbial activity [14,15,16]. However, high production costs (USD 270–700 Mg−1) and substantial field application rates (2.5–20 Mg ha−1) limit the economic viability of biochar [13,17]. Even when incorporating dual economic incentives from carbon markets (USD 8.75 Mg−1 CO2-eq) and the potential benefits of yield enhancement, most biochar application scenarios demonstrate limited economic feasibility [18,19].
Biochar-based fertilizers (BBFs), as a combination of biochar and conventional mineral fertilizers, represent an innovative solution to this challenge. BBFs reduce reliance on mineral fertilizers and address the economic constraints associated with large-scale biochar implementation as found in the previous studies [20,21]. The porous structure and high cation exchange capacity of biochar limit the rapid dissolution and release of mineral fertilizers, thereby improving nutrient use efficiency and enhancing soil structure [22]. A meta-analysis by Melo et al. demonstrates that applying BBFs consistently enhances nitrogen fertilizer use efficiency and elevates crop yields by 4 to 19% compared to conventional mineral fertilizers [23].
N2O is a formidable GHG, exhibiting a global warming potential 298-fold greater than CO2 over a century [24]. Approximately 1% of applied nitrogen fertilizers is converted into N2O, underscoring its role as a major contributor to agricultural emissions [25]. While BBFs have gained attention as a sustainable alternative to conventional mineral fertilizers, studies quantifying their potential for N2O reduction remain limited. Recent field experiments at limited sites indicate that BBFs can alter N2O emissions by −23% to +8% compared to conventional fertilizers, highlighting their variable efficacy across diverse conditions [26,27,28]. This knowledge gap poses a significant barrier to integrating BBFs within climate-smart agriculture frameworks, limiting their potential to contribute to carbon mitigation strategies. Machine learning addresses the multicollinearity limitation of traditional regression and achieves robust modeling of complex systems through nonlinear fitting, providing a novel solution to this challenge [29,30,31]. Compared to single-model approaches, the integration of multiple machine learning algorithms leverages the complementary strengths of various methods, thereby reducing prediction bias, enhancing model robustness, and significantly improving overall performance [32,33,34].
This study addresses these gaps by compiling a global dataset of field experiments to monitor GHG emissions from BBF applications and conducted a comprehensive analysis. We hypothesize that machine learning algorithms can effectively capture the nonlinear interactions among BBF properties, environmental factors, and management practices to predict the N2O emission reduction and yield enhancement potential of BBFs. The objectives of this study were to: (1) develop statistical models for crop yield and N2O emissions under BBF, quantifying its key drivers, and (2) evaluate BBF’s potential to enhance yield and mitigate N2O emissions in China’s staple crops.

2. Materials and Methods
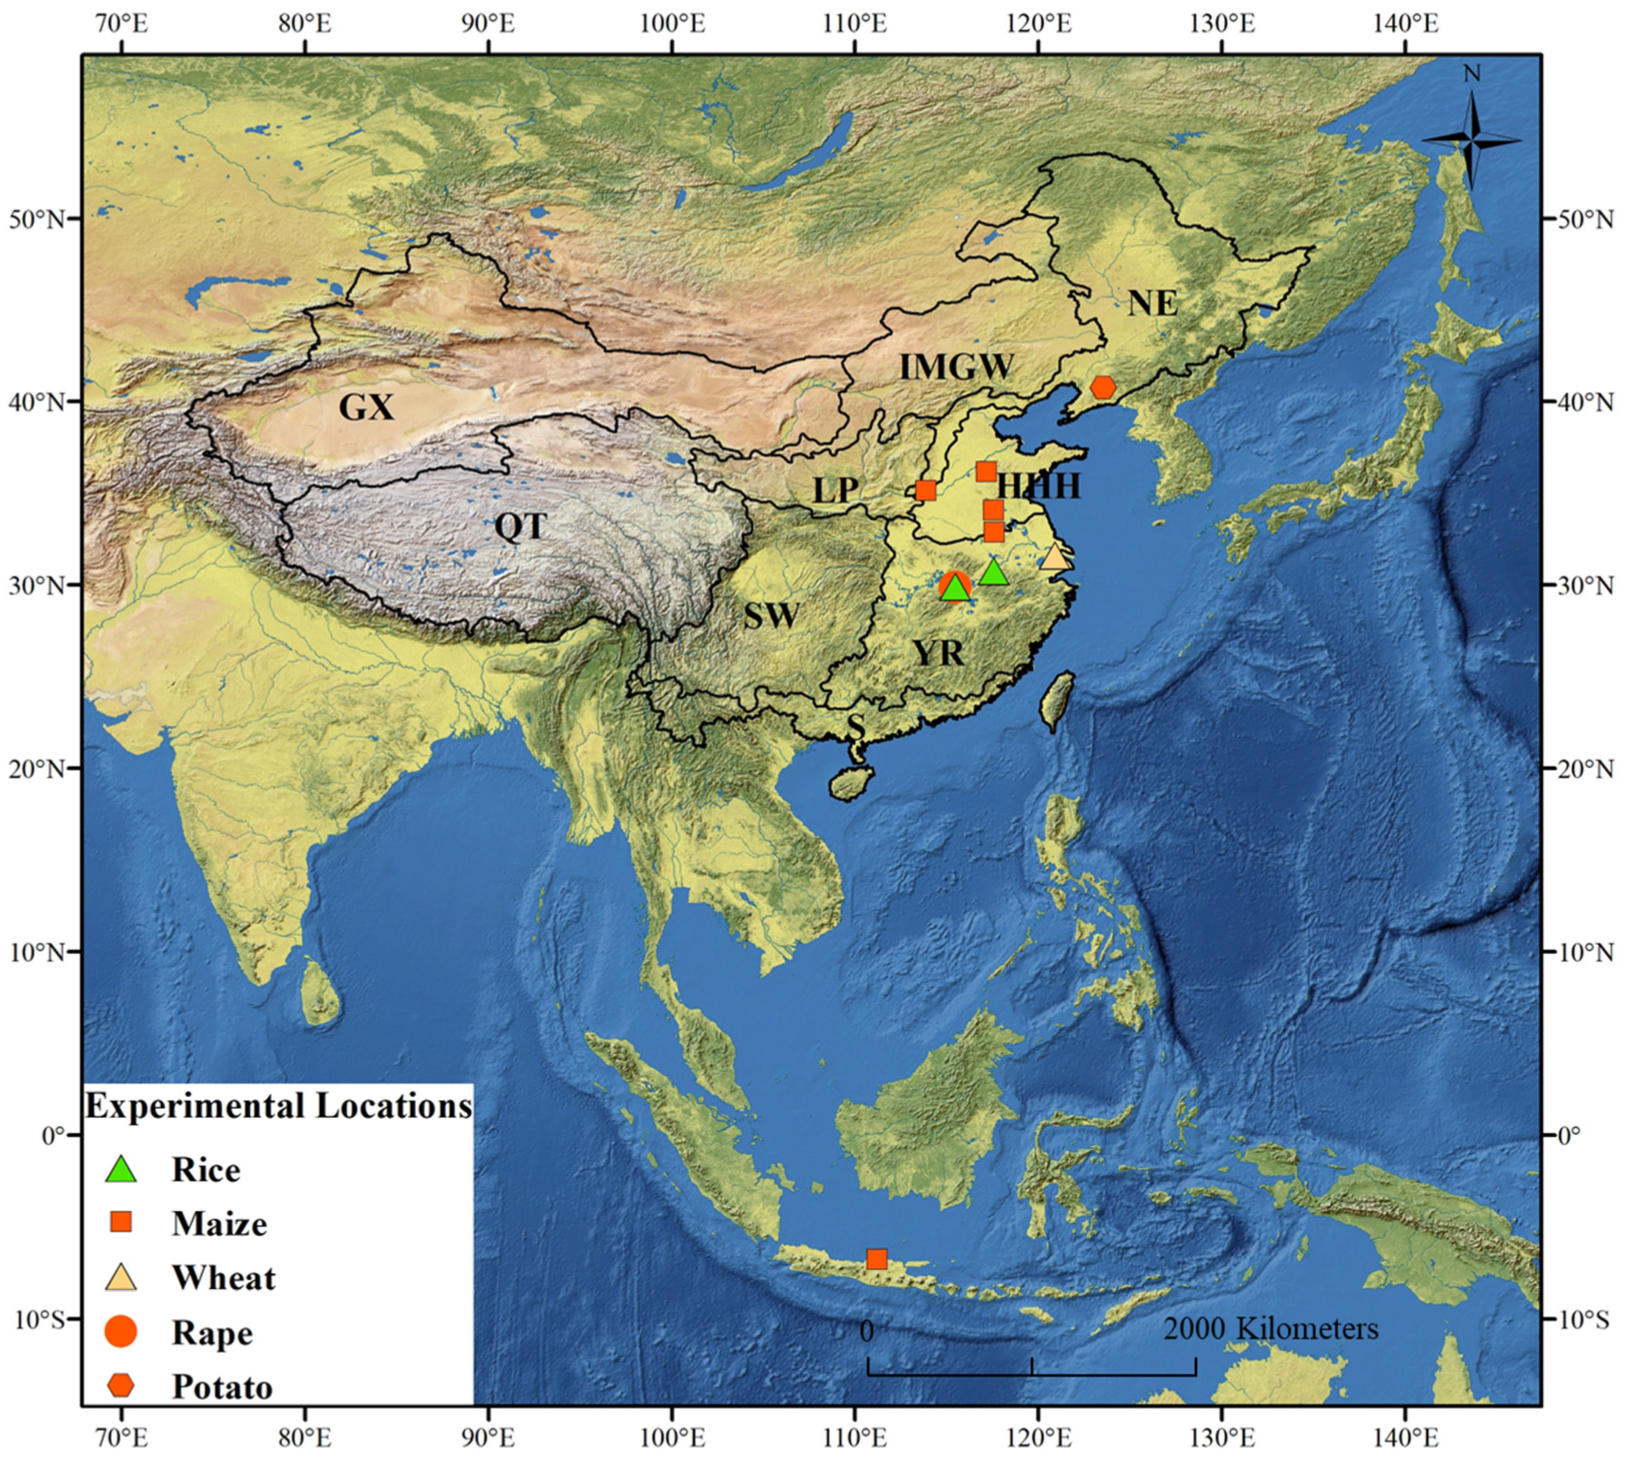
2.1. Data Sources

A systematic literature review was performed using the search strategy {(“biochar-based fertilizer” OR “biochar compound fertilizer” OR “biochar fertilizer”) AND (“N2O” OR “GHG”)} across the China National Knowledge Infrastructure (CNKI) and Web of Science databases. Studies were screened based on the following inclusion criteria to ensure data quality and relevance: (1) Field-scale experiments investigating staple crops, excluding pot-based studies; (2) experimental designs incorporating both BBF treatment groups and suitable control groups; (3) GHG flux measurements covering complete crop growth cycles with a minimum sampling frequency of every two weeks; (4) documentation of geographic coordinates or site locations for each experimental site; (5) comprehensive agricultural management records, including crop rotation patterns, planting/harvest dates, and fertilization schedules; and (6) detailed records of soil properties and BBF characteristics. Following strict screening based on the above criteria, 50 qualifying datasets from 10 globally distributed sites (field experiments conducted 2012–2021) were selected, spanning 9 Chinese agricultural regions and 1 Indonesian site (Figure 1; Supplementary Materials). The soils of the experimental sites primarily include Calcaric Aqui-alluvic Primisols (distributed in alluvial plains), Brown Soils (distributed in upland slopes), and Paddy Soils (distributed in lowland rice systems) under the Chinese Soil Taxonomy (CST), along with Aeric Endoaquepts under the USDA Soil Taxonomy (Supplementary Materials).
The database included five staple crops: rice, maize, wheat, rapeseed, and potato. Three major staple crops (wheat, rice, and maize) account for 86% of the dataset. Soil organic carbon (SOC) content and pH were retained as explanatory variables, while parameters such as soil clay content and bulk density were excluded due to incomplete metadata documentation. The limitation for biochar characterization, as specific surface area, cation exchange capacity, particle size, and pyrolysis temperature were not fully recorded across studies. In this study, two key variables related to BBFs were considered: (1) the proportion of chemical nitrogen from BBFs in the total chemical nitrogen input (BBF N/Mineral N) and (2) the carbon-to-chemical nitrogen ratio of BBFs (BBF C/N).
Climatic variables were incorporated, including mean daily temperature (°C) and precipitation (mm) during the crop growing season. Meteorological data were obtained from the Resource and Environment Science and Data Center (http://www.resdc.cn, accessed on 12 November 2024) for Chinese sites and the National Oceanic and Atmospheric Administration (https://www.noaa.gov, accessed on 13 November 2024) for international locations. Spatial interpolation was performed using Thiessen polygon tessellation in ArcGIS, with climate variables extracted via georeferenced site coordinates.

2.2. Machine Learning

To predict crop yield and N2O emissions, we employed three widely recognized machine learning algorithms: artificial neural network (ANN), random forest (RF), and support vector machine (SVM), which have been proven effective in accurately predicting greenhouse gas emissions and crop yields at both site and regional scales [33,34,35,36]. These algorithms were chosen based on their unique capabilities. For example, ANN excels in modeling complex nonlinear relationships, RF provides interpretable feature importance and resistance to overfitting, and SVM is an effective tool in high-dimensional spaces. Additionally, the RF model offers the advantage of analyzing variable importance [32,34].
Variable selection was performed using a backward stepwise elimination method, beginning with all candidate variables and iteratively removing non-significant predictors to enhance model parsimony. This strategy ensured that only the most influential variables were included in the final models. Hyperparameter optimization was systematically executed for each algorithm to maximize predictive accuracy (Supplementary Materials). Model performance was evaluated using a comprehensive set of metrics, including root mean square error (RMSE), modeling efficiency (EF), and relative bias (E) by the methodology of Smith et al. [37]. Given the limited size of the dataset, an independent validation dataset was not utilized, and validation was carried out using the modeling dataset itself to ensure a rigorous evaluation of the models.

2.3. Marginal Benefit Analysis

Marginal effect analysis is a quantitative method used to evaluate the incremental impact of changes in input variables on system outputs. This approach has been widely utilized to assess the benefits and marginal returns of specific interventions in agricultural and environmental systems [32,38]. In this study, we applied marginal effect analysis to systematically investigate the influence of BBF characteristics (BBF N/Mineral N and BBF C/N) on crop yield and N2O emissions. Simulations were conducted using three machine learning models, with all input variables set based on the mean values of the dataset to ensure that the observed effects are representative of typical field conditions.

2.4. Model Application

We simulated the high-spatial-resolution distribution patterns of crop yield increases and N2O emission reductions for China’s major staple crops under the BBF application. The spatial distribution of wheat, rice, and maize cultivation areas were obtained from the EarthStat database [39]. We assumed that the spatial distribution of planting areas for each major staple crop remained unchanged, and the total planting area in each province was aligned with the 2018th provincial statistics from the China Rural Statistical Yearbook [40]. Soil properties, including SOC and pH, were derived from the Harmonized World Soil Database [41]. To incorporate climatic conditions during the crop growing season, we obtained sowing/transplanting and harvesting dates from the official agricultural calendar formulated by the Chinese Ministry of Agriculture [42]. The resolution of all spatial data was standardized to 5 × 5 min.
The BBF substitution scenario considered replacing only the basal fertilizer component rather than the entire conventional mineral fertilizer application. The ratio of basal to topdressing fertilizer for China’s major staple crops was determined based on the study by Wang et al., which was used to calculate the key parameter BBF N/Mineral N [43]. The carbon contents (%) in BBFs were determined by the Chinese agricultural industry standards for Biochar-Based Fertilizers (NY/T3041-2016 [44]), which enabled the calculation of the BBF C/N. The total nitrogen fertilizer input in the BBF substitution scenario was consistent with that in the conventional management scenario. The percentage change of yield and N2O emissions was calculated for each grid cell (5 × 5 min resolution) and each agriculture region by using the following formula:
C h a n g e ( % ) = ( B B F v a l u e C o n v e n t i o n a l v a l u e C o n v e n t i o n a l v a l u e ) × 100
All data processing, modeling, calculations, and result visualization were performed using R software (version 3.6.1). The machine learning algorithms of RF, SVM, and ANN were implemented using the R packages “randomForest”, “e1071”, and “neuralnet”, respectively. Uncertainty quantification was conducted using the R package “RFinfer”. Spatial mappings were generated by ArcMap 10.6 version.

3. Results

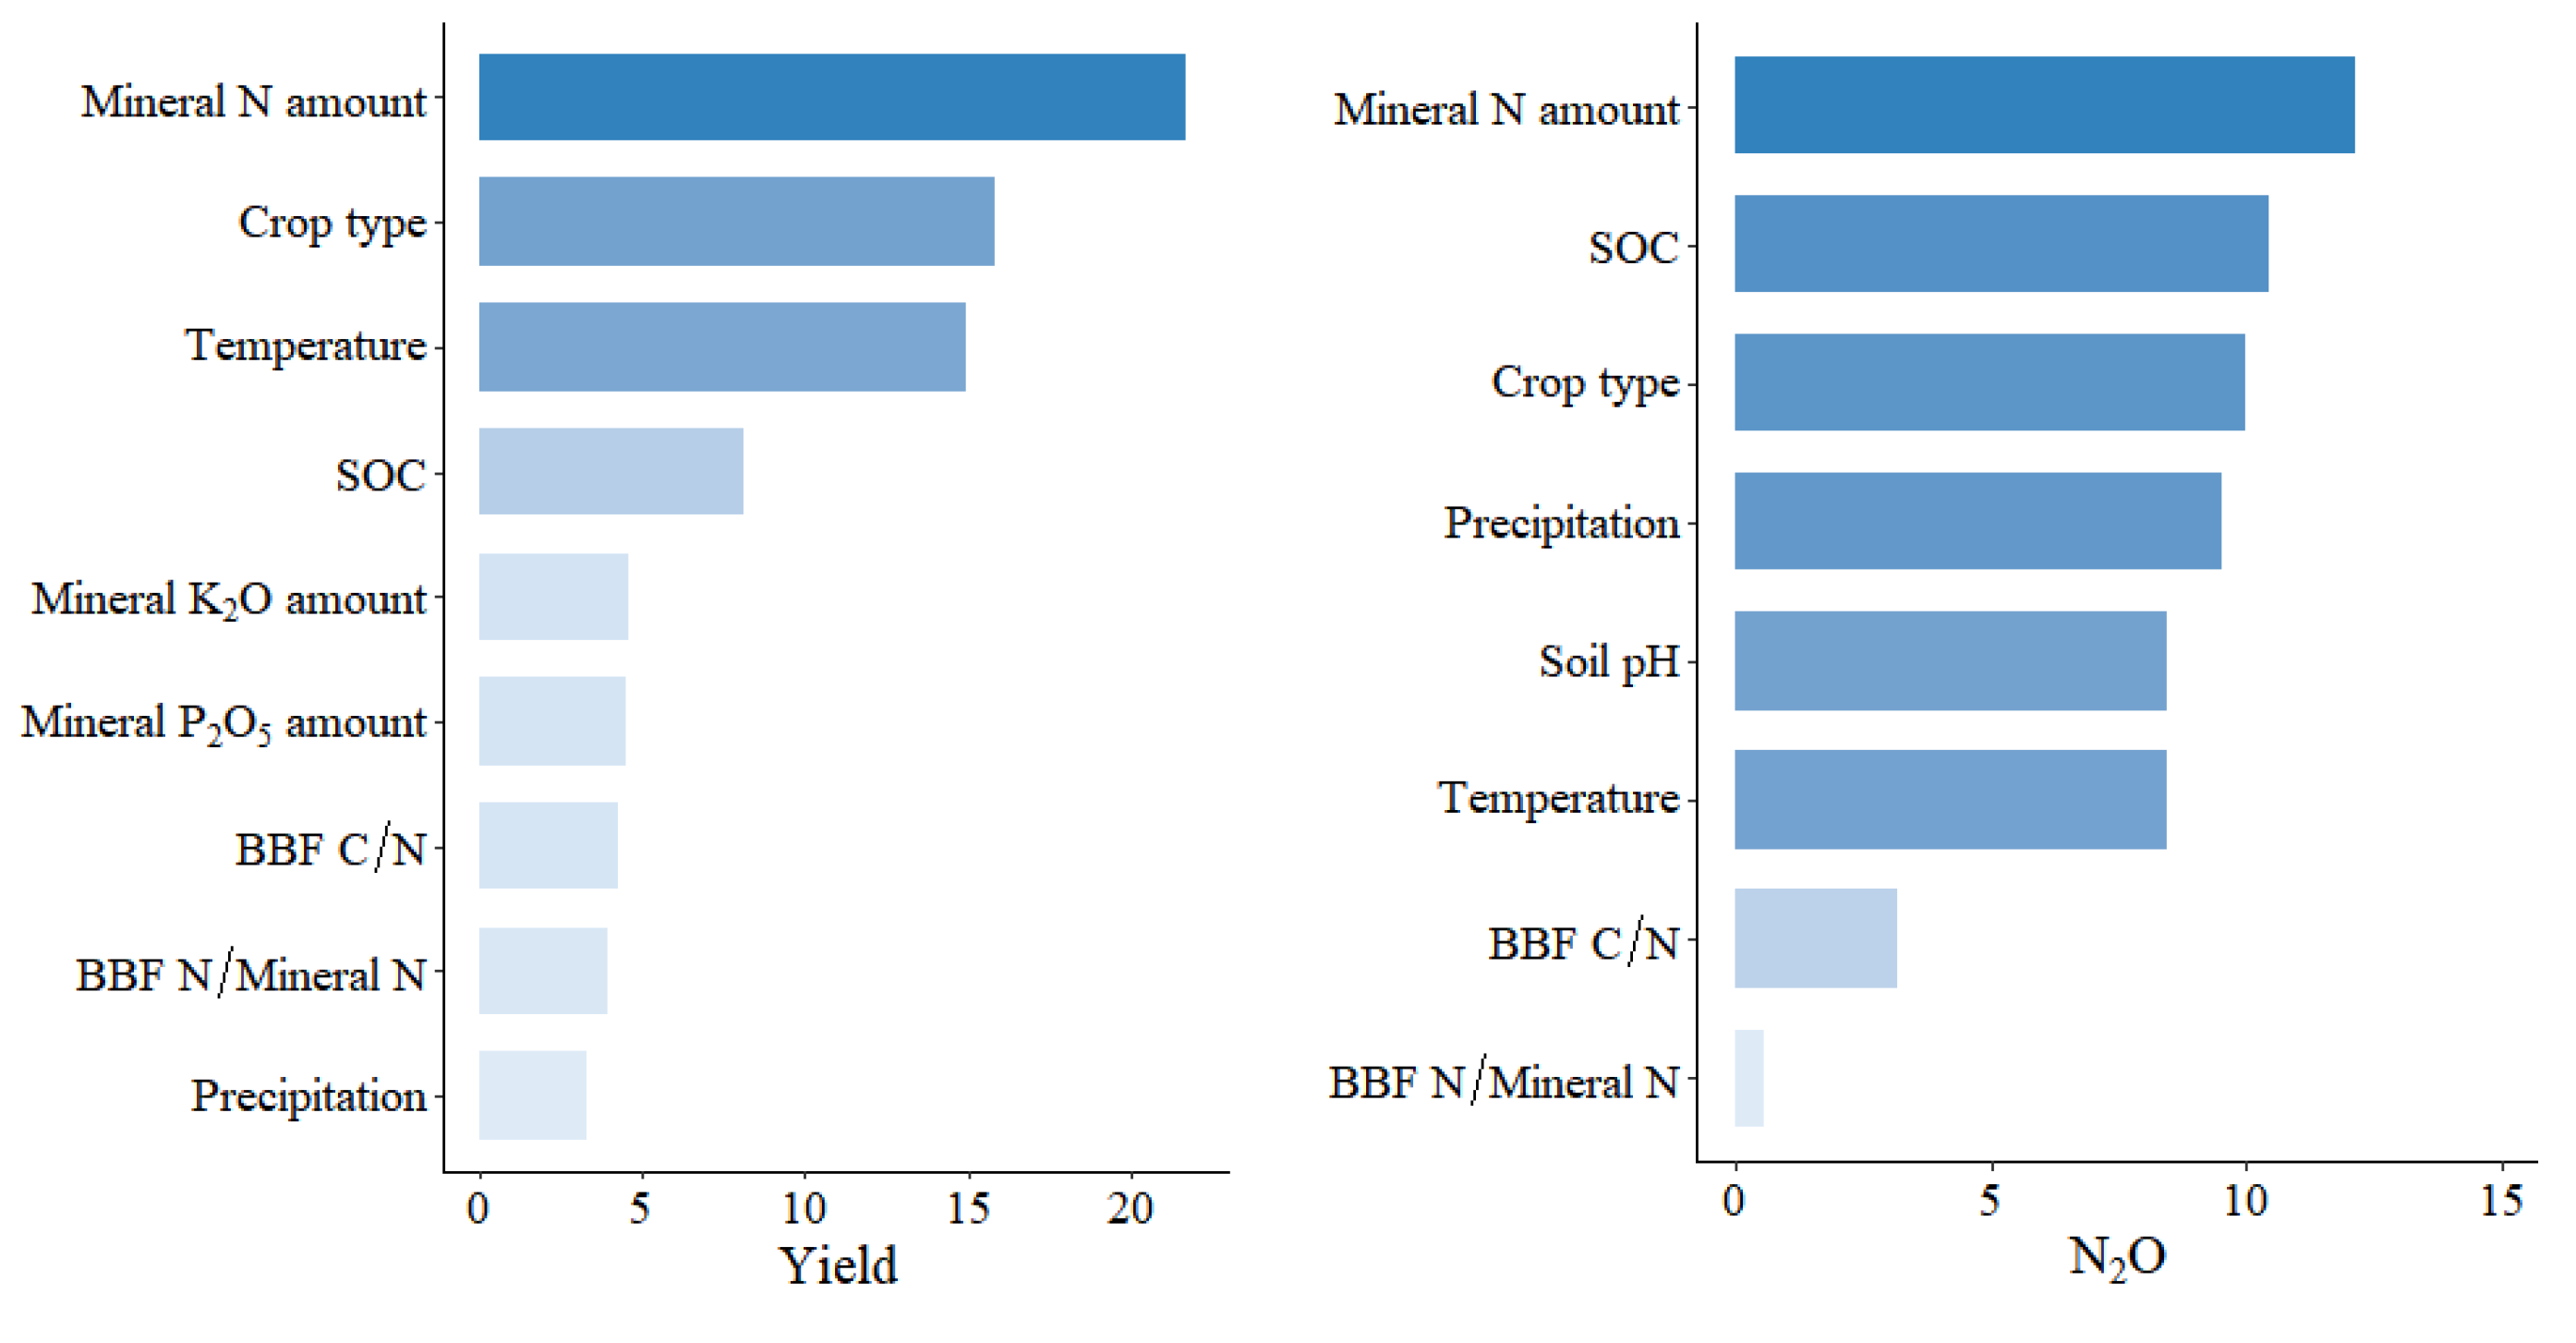
3.1. Model Performance and Variable Importance

All three machine learning models demonstrated strong predictive performance for crop yield, with R2 and model efficiency (EF) values ranging from 0.98 to 0.99 and root mean square error (RMSE) values between 0.33 and 0.44 Mg/ha (Figure 2; Supplementary Materials). The models also exhibited minimal relative deviations, ranging from −0.19% to −2.79% (Supplementary Materials). For N2O emissions, the artificial neural network (ANN) model outperformed the other models, achieving an R2 of 0.99, and EF of 0.99, and RMSE of 0.24 kg N2O/ha, with a relative deviation of −1.18% (Figure 2; Supplementary Materials). In contrast, the support vector machine (SVM) model showed slightly lower performance in terms of R2, RMSE, and EF, while the random forest (RF) model exhibited a higher relative deviation of −20.4% (Supplementary Materials). These results indicated that the ANN model demonstrated the highest performance in predicting crop yield and N2O emissions under BBF applications.
In the crop yield prediction model, key variables that contributed significantly included the amount of mineral N, crop type, mean growing season temperature, SOC, and the application rates of potassium (K2O) and phosphorus (P2O5) fertilizers (Figure 3). Variable importance analysis using the RF model revealed that the amount of mineral N was the most influential variable, contributing 21.69% to the model’s explanatory power, followed by crop type (15.84%), mean growing season temperature (14.98%), and SOC (8.12%). In contrast, the BBF C/N and BBF N/Mineral N variables accounted for only 4.25% and 3.95% of the variation in crop yield, respectively.
In the N2O emission prediction model, key variables included crop type, SOC, soil pH, mean temperature and precipitation during the growing season, total nitrogen fertilizer application, BBF C/N, and BBF N/Mineral N (Figure 3). Importance analysis revealed that total nitrogen fertilizer application was the most influential variable, contributing 12.2% to the model’s explanatory power. Soil properties (SOC and pH) and meteorological variables (mean temperature and precipitation during the growing season) collectively accounted for 18.9% and 17.9%, respectively. Meanwhile, BBF C/N and BBF N/Mineral N contributed only 3.19% and 0.55%, respectively, highlighting their relatively minor role in N2O emissions.

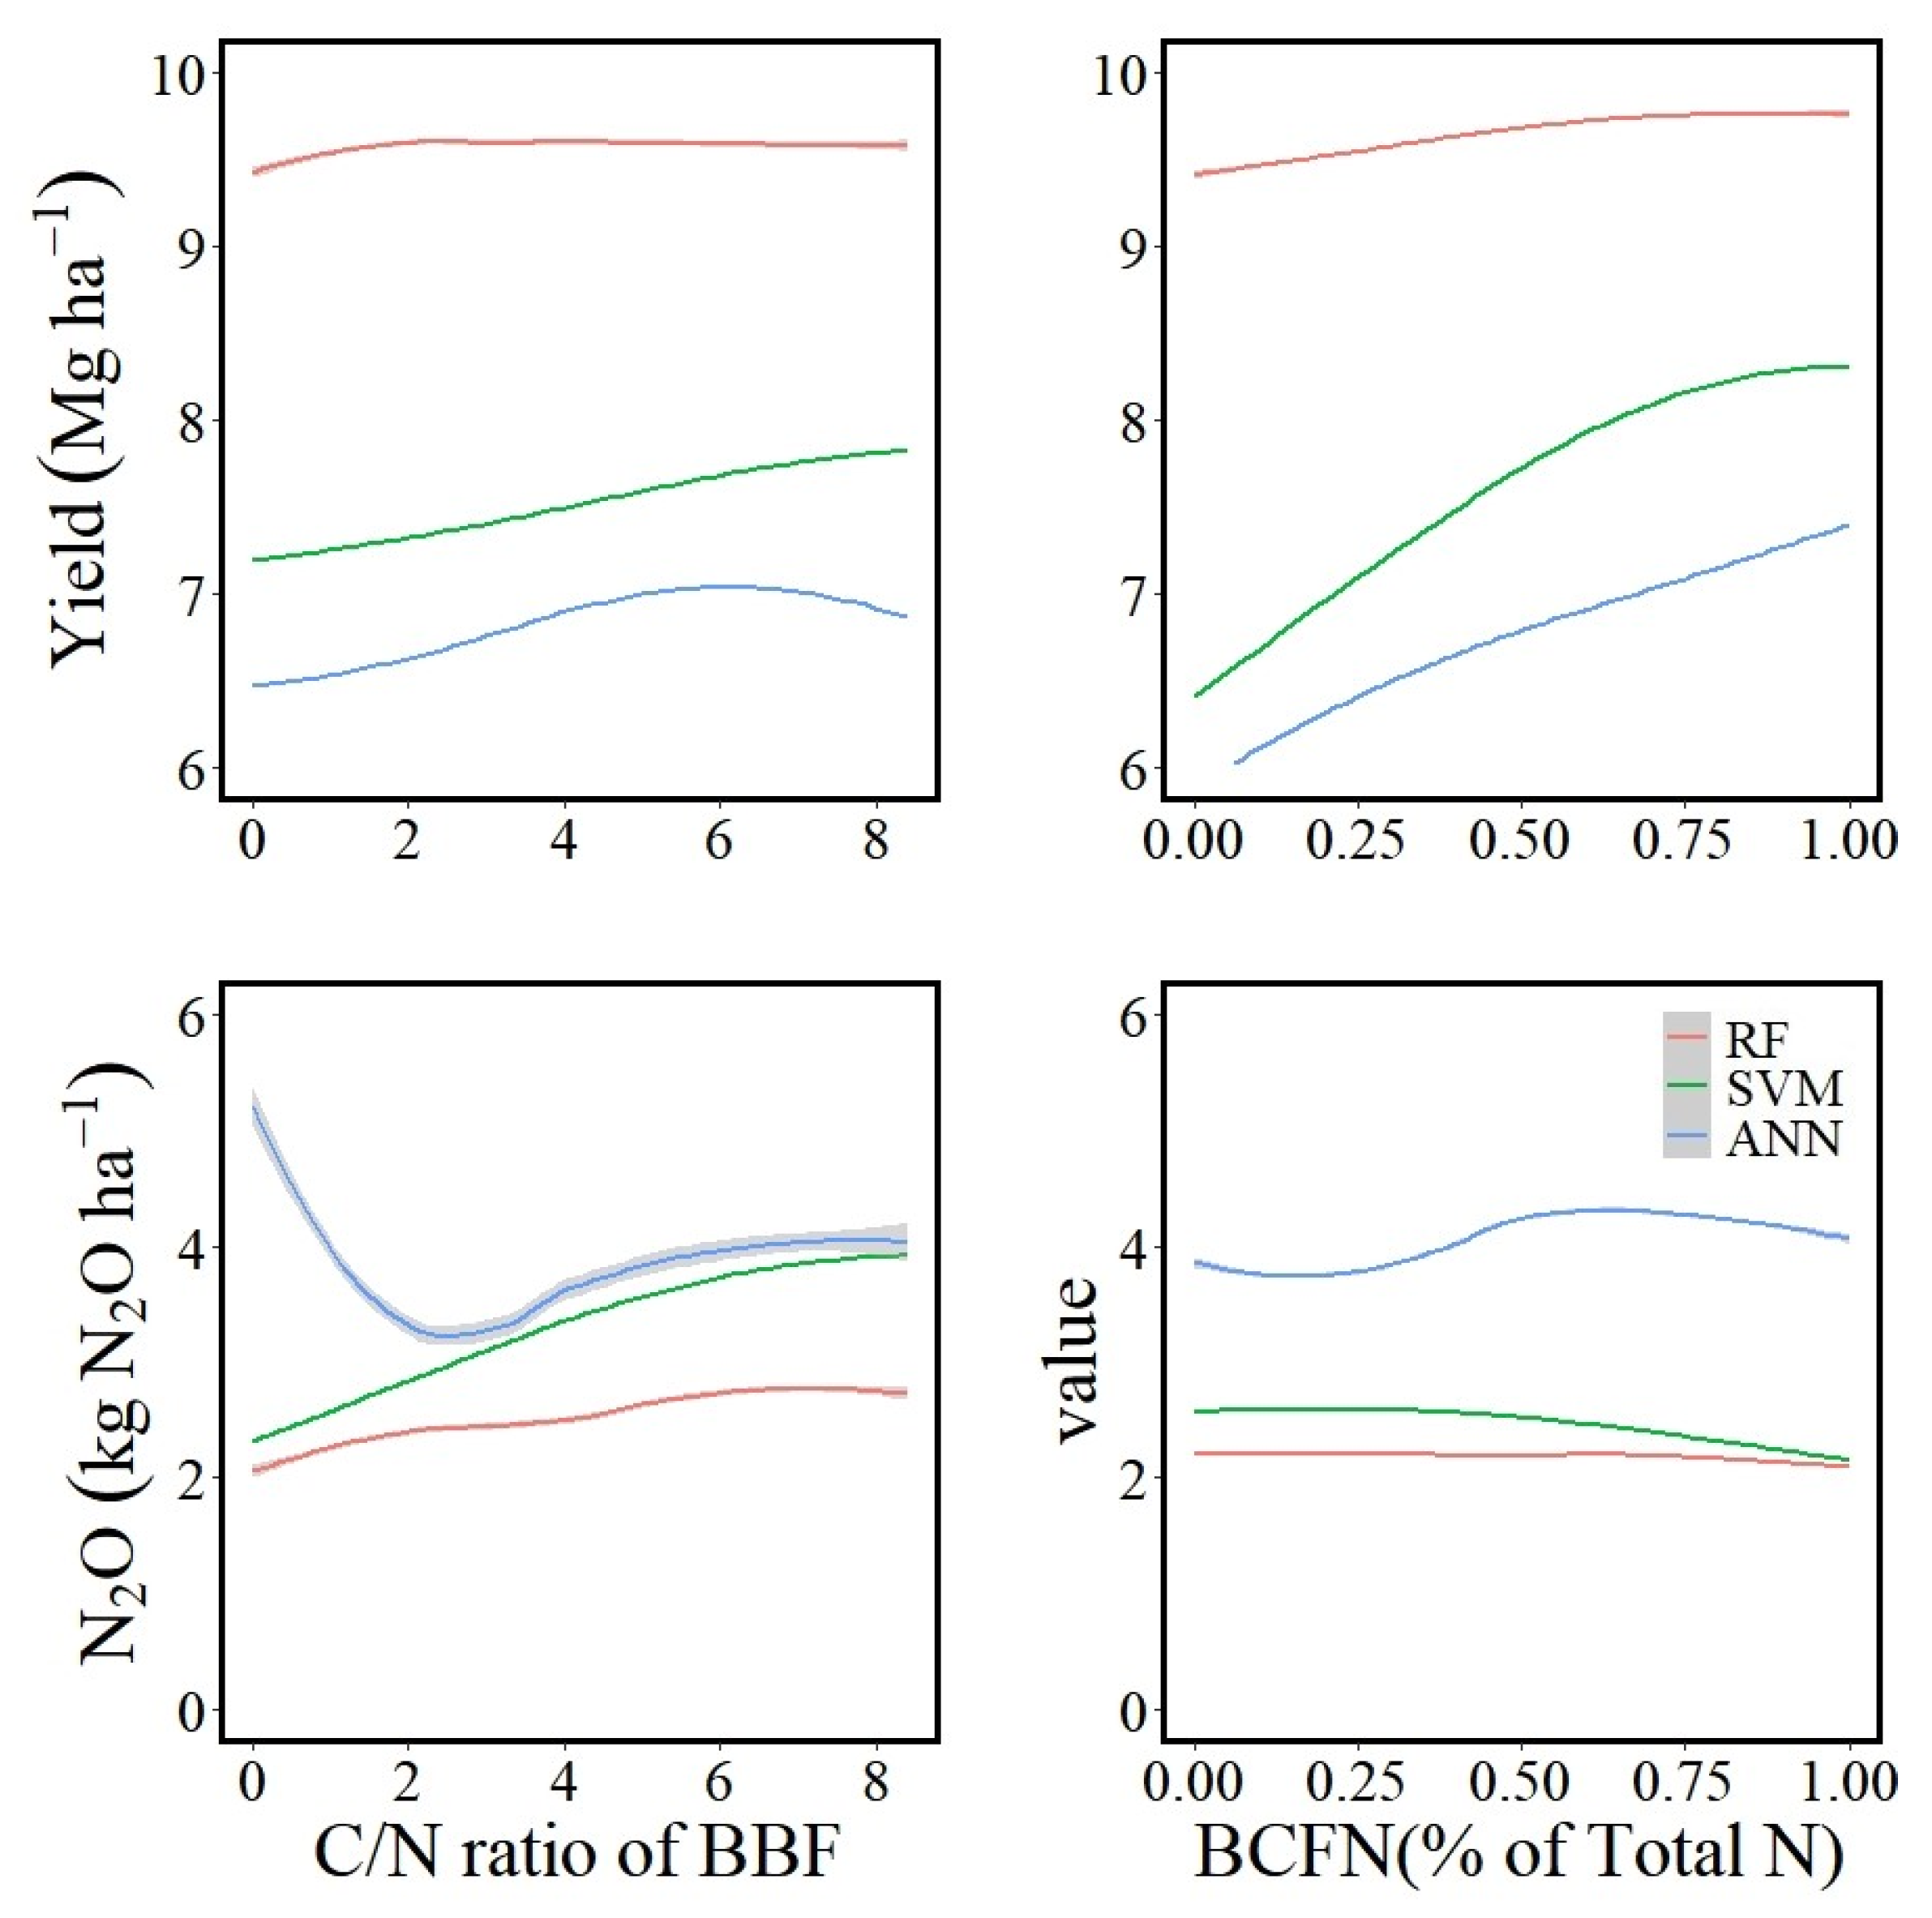
3.2. Impact of BBF on Crop Yield and N2O Emissions

Marginal effects analysis revealed consistent trends across the three models for crop yield as shown in Figure 3. The BBF C/N variable demonstrated a significant positive correlation with crop yield, indicating that a higher proportion of biomass-derived carbon in BBFs enhances crop productivity. Similarly, the BBF N/Mineral N variable exhibited a continuous upward trend, contributing to yield improvement exceeding that of the BBF C/N variable. These results described the importance of nitrogen source composition in BBFs for determining crop yield.
For N2O emissions, the models exhibited distinct response patterns (Figure 3). The ANN model showed a nonlinear trend of “initial decline followed by an increase”, while the RF and SVM models indicated a steady rise in N2O emissions with increasing BBF C/N. In contrast, the marginal effects of the BBF N/Mineral N on N2O emissions were minimal across all models (Figure 4).

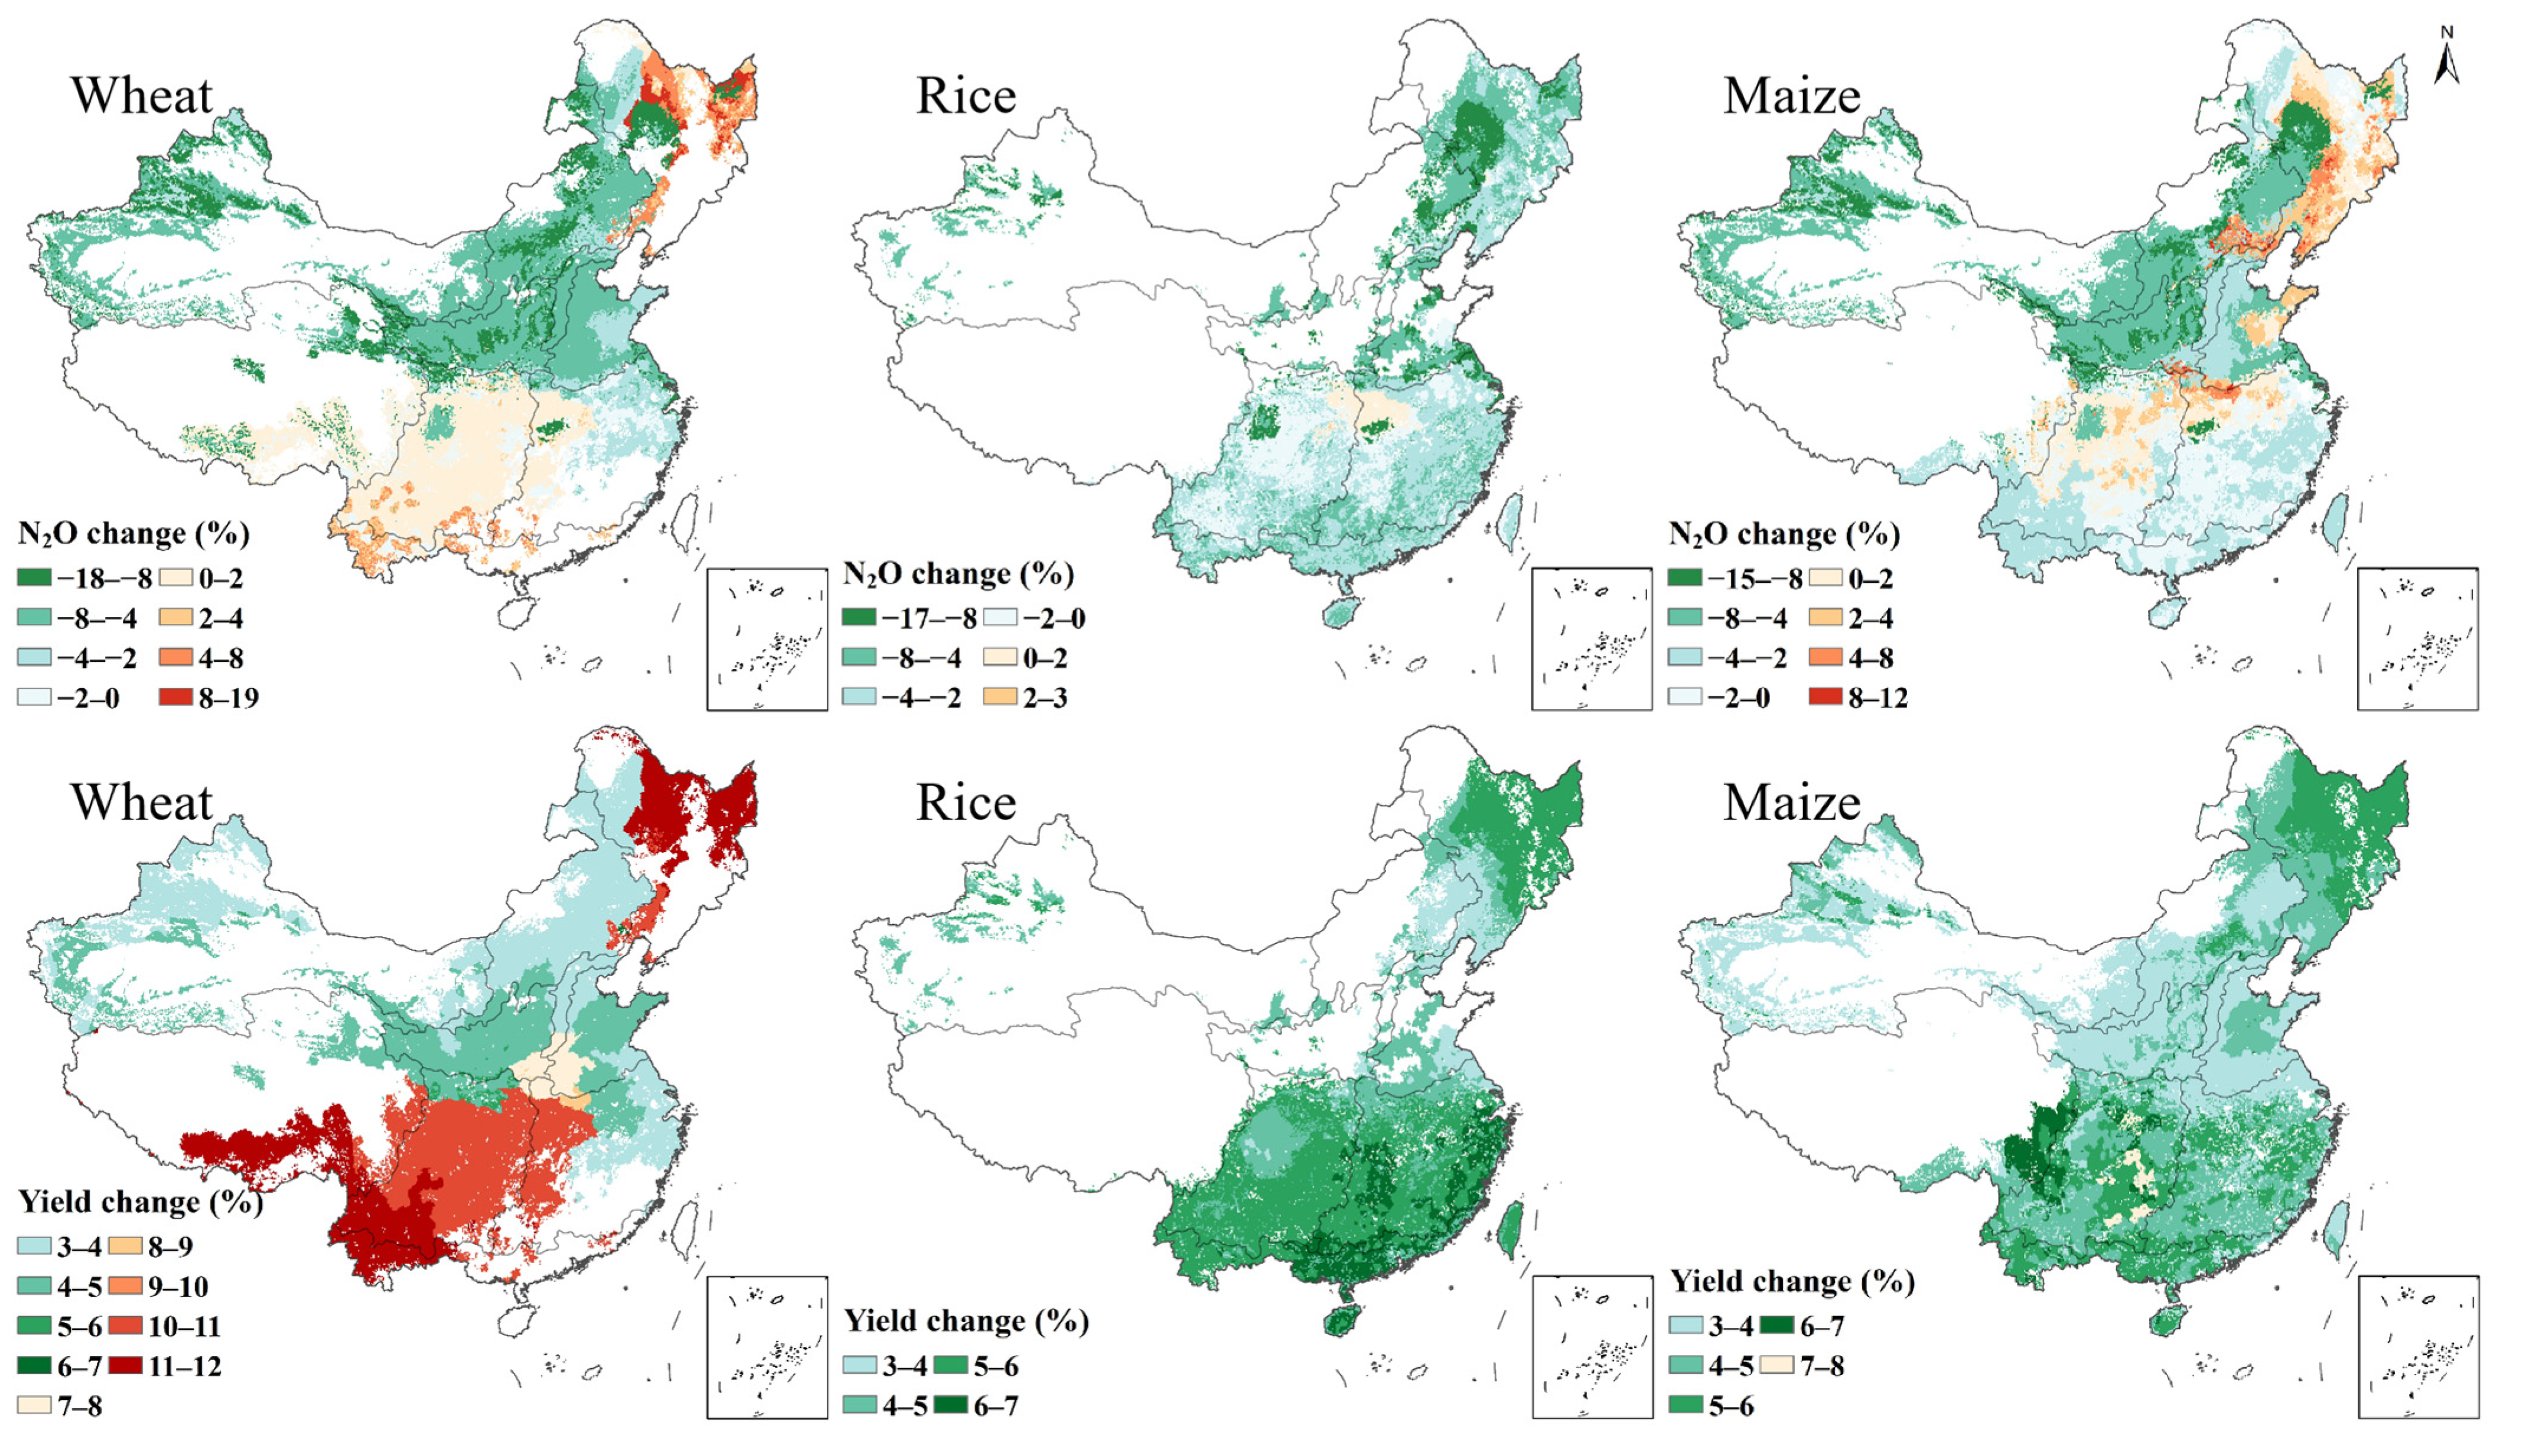
3.3. Crop Productivity and N2O Emissions Reduction Under BBF Application

We employed RF models for high-spatial-resolution simulations to ensure robust results, balancing moderate accuracy and overfitting resistance. Based on the model simulations, substituting conventional mineral fertilizers with BBF can increase the average yield of the three major crops (wheat, rice, and maize) by 4.3% to 5.0%, while simultaneously reducing N2O emissions by 3.7% to 6.3% (Table 1).
The simulation results revealed significant spatial heterogeneity in the effects of BBF substitution across different agricultural regions and crop types (Figure 5). In various agricultural regions, replacing conventional mineral fertilizers with BBF significantly enhanced wheat yields by 4.3 to 11.5%, rice yields by 3.9 to 5.5%, and maize yields by 3.8 to 4.8%. Notably, the S and SW agricultural regions demonstrated the highest yield increases for the three staple crops (4.8 to 11.5%) compared to other agricultural regions. Regarding N2O emissions, all agricultural regions experienced reductions, except for a slight increase (1.4%) in wheat N2O emissions in the S agricultural region. The NE agricultural region exhibited the most pronounced decrease in N2O emissions, ranging from 3.5% to 7.0%. Furthermore, spatial uncertainty analysis revealed that the predicted N2O emission reductions under BBF substitution exhibited substantially greater variability (0.8–104.0%) compared to crop yield enhancements (0.2–31.1%) across China’s agricultural regions (Figure 6).

4. Discussion

4.1. Mechanisms for Enhancing Crop Yield and Reducing N2O Emissions Through BBF Application

Applying biochar alone, without additional fertilization, generally does not significantly enhance crop yield [45]. However, when biochar was combined with mineral fertilizers to create BBFs, nitrogen use efficiency markedly improved, resulting in considerable yield increases; this enhancement can be attributed to several key mechanisms. First, the hydrophobic characteristics of biochar prevent excessive nutrient diffusion and leaching, thereby retaining more nutrients within the root zone [46]. Second, the high surface area and porous structure of biochar provide a robust cation exchange capacity (CEC), which boosts its ability to adsorb nitrate nitrogen and other essential nutrients, enhancing their availability to crops [11,47]. Previous studies indicate that biochar can improve soil structure, root development, and enhance nutrient uptake [48,49,50,51,52]. These effects contribute to increased crop productivity. Our experimental results showed a 4.3 to 5.0% increase in crop yields following replacing conventional mineral fertilizers with BBFs (Table 1). These findings were consistent with the global meta-analysis conducted by Melo et al., which reported an average yield increase of 6.0% (ranging from 0.3 to 12%) due to BBF application in temperate climates [23]. As the BBF C/N and BBF N/Mineral N ratios increased, the slow-release capacity of nitrogen fertilizers was significantly enhanced, effectively promoting higher crop yields.
Furthermore, BBFs demonstrate significant potential in mitigating N2O emissions by enhancing nitrogen use efficiency and reducing the conversion of applied nitrogen into N2O, primarily through their slow-release properties [26,53]. Specifically, as the BBF C/N ratio increases, the slow-release nitrogen capacity and nitrogen use efficiency improve, theoretically leading to a decline in N2O emission intensity. Among the three machine learning models employed in this study, only the ANN model, which exhibited the highest predictive accuracy for N2O emissions (R2: 0.99; EF: 0.99), captured this complex relationship. The ANN model revealed that N2O emissions reached their minimum at a BBF C/N ratio of approximately 2, after which emissions began to rise. This initial decline in emissions could be attributed to the improved slow-release properties and enhanced nitrogen use efficiency associated with higher BBF C/N ratios. However, the subsequent increase in emissions beyond a BBF C/N of 2 was likely driven by the higher biochar content in BBFs, which increases soil porosity and creates anaerobic microsites. These microsites promote denitrification processes, intensifying the conversion of urea to N2O [48,54]. Furthermore, samples with BBF C/N ratios > 2 in our dataset predominantly utilized fruit shell-derived biochar, exhibiting significantly lower surface areas than straw-based biochar. This reduced surface area may limit nutrient adsorption and slow-release efficiency, resulting in stronger nutrient release and a slight increase in N2O emissions [17,55]. In contrast, the marginal effects of the proportion of nitrogen derived from biochar relative to BBF N/Mineral N on N2O emissions were minimal across all models, likely due to the limited explanatory power of this variable in the N2O emission model. These findings described the crucial role of the BBF C/N variable in influencing N2O emissions. They emphasized the significance of employing advanced modeling techniques, such as ANN, to capture intricate nonlinear relationships that might be overlooked by other methods.

4.2. Opportunities and Challenges of BBF in Agriculture

In China, the annual application of mineral fertilizers in wheat, rice, and maize systems contributes approximately 21.30, 32.80, and 41.74 Gg N2O-N emissions, respectively, while simultaneously supporting grain production of 131, 212, and 257 Tg [40,56]. Combining the results from Table 1, substituting mineral fertilizers with BBF alternatives could reduce N2O-N emissions by 4.13 Gg and increase production by 27.75 Tg. We observed significant spatial heterogeneity in mitigation and yield enhancement resulting from BBF application. As demonstrated by the model structure in Figure 3, this spatial variability was driven by regional differences in nitrogen fertilizer application rates, climatic factors (growing season temperature and precipitation), and soil properties (SOC and pH). For instance, in the rice systems in 2018, the average growing season temperature in the NE agriculture region was 20.9 °C, while temperatures in the SW and S agriculture regions ranged from 21.0 to 24.6 °C [34]. The average nitrogen fertilizer application rate for rice in the N agriculture region (138.9 kg N ha−1) was only 64.6%, 66.4%, and 74.0% of those in the SW, YR, and S agriculture regions, respectively [57]. Furthermore, based on 4060 soil resampling datasets, Zhao et al. found that cropland soil carbon density in the N agriculture region (42.2 Mg C ha−1) was significantly higher than in the S agriculture region (21.0 Mg C ha−1) [58]. A global meta-analysis by Melo et al. found that BBFs had the highest crop yield enhancement potential in tropical regions, reaching up to 10% compared to temperate regions [23]. These findings emphasize that quantifying the agronomic and environmental benefits of BBF application requires consideration of region-specific nitrogen application rates, climatic conditions, and soil properties.
The hydrophobic nature of biochar leads to increased granulation energy consumption during BBF production compared to conventional compound fertilizers. A study by Sun et al. indicated that the energy required for granulating conventional compound fertilizers was 4.16 kWh t−1, whereas BBFs needed 7.48 kWh t−1 [59]. Nevertheless, the long-term carbon sequestration potential of biochar—retaining 70% of its carbon content in soil over a century—compensates for the additional energy consumption and associated emissions [59]. In paddy ecosystems, methane (CH4) is the primary GHG, accounting for 94% of the global warming potential in paddy fields [60]. Thus, assessing the potential of BBFs in paddy fields must focus on their effect on methane emissions. Research by Dong et al. showed that BBFs decrease CH4 emissions in rice paddies by 11.2% by modifying microbial communities, improving soil structure, and promoting methane-oxidizing bacteria [17]. However, further research is necessary to clarify the mechanisms and quantify the GHG mitigation potential of BBFs in rice cultivation.
Despite their environmental advantages, economic and technical challenges hinder the widespread adoption of BBFs. The production costs of BBFs exceed those of conventional mineral fertilizers due to higher biochar feedstock expenses and increased energy consumption during granulation [13,59]. Additionally, an underdeveloped supply chain limits their market accessibility and scalability [21]. Overcoming these barriers will necessitate innovations in production technology and policy support.
Technologically, BBFs have lower nitrogen content than conventional mineral fertilizers, which may limit their effectiveness as a primary nitrogen source in high-demand agricultural systems [61]. Moreover, the effects of BBFs on yield enhancement and emissions reduction show significant variability across different agricultural ecosystems and crop types. For example, a global meta-analysis by Melo et al. found no significant yield increase in wheat with BBFs, as yields varied between −11% and 28% [23]. Similarly, field trials in the North China Plain indicated that while BBFs improved maize yields and nitrogen use efficiency, their impact on N2O and carbon emissions was negligible [26]. These findings highlight the necessity for context-specific optimization of BBF formulations to meet the diverse requirements of various crops and environmental conditions.
Biochar has gained international recognition as a tool for carbon sequestration and GHG mitigation. The Intergovernmental Panel on Climate Change (IPCC) formally incorporated biochar into the 2019 revision of the IPCC 2006 Guidelines for National Greenhouse Gas Inventories [25]. In the European Union, Regulation (EU) 2019/1009 classified biochar as a component of fertilizer products, thereby facilitating its integration into EU-certified fertilizers [62]. In China, BBFs have been actively promoted as part of the top ten straw utilization technologies, supported by the establishment of industry standards such as Biochar-Based Fertilizers (NY/T 3041-2016 [44]), Biochar-Based Organic Fertilizers (NY/T 3618-2020), and Technical Specifications for Field Experiments on Biochar-Based Fertilizers (NY/T 4160-2022) [63]. These standards provide a framework for the standardized production and commercialization of BBFs. However, the lack of a unified international carbon trading methodology for biochar limits the economic incentives for its adoption in carbon markets. Although China relaunched its voluntary carbon trading market in 2023, agricultural applications (including BBFs) are not yet included [64]. Developing a standardized global carbon trading methodology and integrating BBFs into carbon markets are essential to fully realize the climate mitigation potential of biochar-based agricultural practices.

4.3. Limitations and Implication of This Study

This study represents the first systematic evaluation of the effects of BBFs on N2O emissions and crop yield. However, several critical limitations and uncertainties remain, highlighting the need for further investigation to direct future research priorities and inform evidence-based policy development.
First, the experimental data are primarily sourced from China, with a concentration of studies between latitudes 30° and 40° (Figure 1). This geographical bias limits the generalizability of the findings to other regions with differing climatic and soil conditions, such as tropical or arid ecosystems [23]. For instance, estimates for the S agricultural region suggest a 1.42% increase in N2O emissions with BBF substitution during wheat growth, possibly due to this region lacking experimental data, leading to significant uncertainty in the results (Table 1). Second, the physicochemical properties of biochar, including particle size, porosity, and surface area, play a crucial role in determining its nutrient adsorption and slow-release efficiency [65,66,67]. However, these parameters were inconsistently reported across studies, diminishing the explanatory power of biochar-related variables in our models. Third, the production methods of BBFs, such as in situ pyrolysis, coating, impregnation, and pelletization, significantly influence their nutrient release kinetics [26,68,69]. However, these granulation techniques were seldom documented in the available datasets, limiting our ability to assess their impact on crop yields and GHG emissions. Furthermore, our analysis focused on short-term impacts, primarily within a single growing season. However, BBFs exhibit slow-release properties that can affect soil nutrient dynamics over multiple seasons [70]. Finally, excluding soil clay content and bulk density limits the model’s ability to accurately predict crop yield and N2O emissions. For example, in many soils with high clay content, the impact of biochar on NH4⁺ adsorption may be inconsequential [71].
Long-term field experiments are necessary to quantify the cumulative effects of BBFs on crop productivity, soil health, and GHG gas emissions. Additionally, due to insufficient data, we could not evaluate the potential for BBFs to sustain crop yields and reduce emissions under scenarios of reduced total nitrogen input. Furthermore, the limited dataset size precluded allocating an independent validation set for a systematic evaluation of the model’s accuracy. The spatial uncertainty analysis of the predicted results further highlights how these limitations in data quality and quantity affect model performance and the reliability of our findings (Figure 6).
These limitations underscore significant knowledge gaps that must be addressed to unlock the full potential of BBFs in sustainable agriculture. Key priorities include (i) establishing standardized protocols for BBF production and characterization, (ii) expanding field trials to cover diverse agroecological conditions and cropping systems, (iii) integrating comprehensive physicochemical data into predictive models to enhance their accuracy, and (iv) conducting long-term studies to assess the cumulative benefits and trade-offs of BBFs. Tackling these challenges will provide a stronger evidence base for policy development and the global scaling-up of BBFs as a climate-smart agricultural practice.

5. Conclusions

In summary, this study draws the following conclusions: (1) Machine learning models accurately predicted crop yield and N2O emissions (R2 = 0.99), capturing nonlinear interactions among BBF properties, environmental factors, and management practices; (2) BBF C/N ratio and BBF N/Mineral N emerged as dominant drivers, explaining 4.25% and 3.95% of yield variation, 3.19% and 0.55% of N2O emission variation, respectively; (3) By inputting high-spatial-resolution data into the models, the average production of the three major crops in China increased by 4.3–5.0%, while N2O emissions decreased by 3.7–6.3%, with BBF application compared to conventional mineral fertilizer; (4) Regional variability in climate, soil characteristics, and nitrogen management practices drives the spatial heterogeneity in BBF efficacy for yield improvement and N2O mitigation; (5) Realizing BBF’s potential requires reducing high costs, optimizing formulations, expanding trials in diverse regions, and implementing coordinated policy support for large-scale adoption.

Supplementary Materials

The following supporting information can be downloaded at: https://www.mdpi.com/article/10.3390/agronomy15051238/s1, Dataset S1: Original literature dataset, model optimization parameters and performance; Code S1: R code for models; Code S2: Data file for R models. References [72,73,74,75,76,77] are cited in the Supplementary Materials.

Author Contributions

Conceptualization, Y.Z. and J.S.; methodology, Y.Z., J.S., Y.L., M.A. and L.Z.; software, Y.Z.; validation, Y.Z. and S.C.; formal analysis, S.C. and C.L.; investigation, S.C. and L.X.; resources, M.C.; data curation, Y.Z. and S.C.; writing—original draft preparation, Y.Z.; writing—review and editing, Y.Z., S.C., Y.L., L.X., C.L., M.A., X.J. and J.S.; visualization, Y.L. and L.X.; supervision, M.C., L.Z. and J.S.; project administration, X.J. and M.C.; funding acquisition, M.C and J.S. All authors have read and agreed to the published version of the manuscript.

Funding

This work was financially supported by the Natural Science Foundation of China (Grant No. 42407658) and the Basic Research Business Fund of the National Public Welfare Research Institutes (Grant No. GYZX240410). We also acknowledge funding from the “Carbon Peaking and Carbon Neutrality” projects (Grant Nos. ZX2023SZY059 and ZX2023SZY081) at the Nanjing Institute of Environmental Sciences, Ministry of Ecology and Environment, China.

Data Availability Statement

The original contributions presented in the study are included in the article. Further inquiries can be directed to the corresponding author.

Conflicts of Interest

The authors declare no conflicts of interest.

Abbreviations

The following abbreviations are used in this manuscript:
BBFsBiochar-based fertilizers
BBF N/Mineral NProportion of nitrogen from BBFs in the total nitrogen input
BBF C/NCarbon-to-nitrogen ratio of BBFs
RFRandom forest
SVMSupport vector machine
ANNArtificial neural network
SOCSoil organic carbon

References

  1. Foley, J.A.; Ramankutty, N.; Brauman, K.A.; Cassidy, E.S.; Gerber, J.S.; Johnston, M.; Mueller, N.D.; O’Connell, C.; Ray, D.K.; West, P.C.; et al. Solutions for a cultivated planet. Nature 2011, 478, 337–342. [Google Scholar] [CrossRef] [PubMed]
  2. Mueller, N.D.; Gerber, J.S.; Johnston, M.; Ray, D.K.; Ramankutty, N.; Foley, J.A. Closing yield gaps through nutrient and water management. Nature 2012, 490, 254–257. [Google Scholar] [CrossRef]
  3. Lassaletta, L.; Billen, G.; Grizzetti, B.; Anglade, J.; Garnier, J. 50 year trends in nitrogen use efficiency of world cropping systems: The relationship between yield and nitrogen input to cropland. Environ. Res. Lett. 2014, 9, 105011. [Google Scholar] [CrossRef]
  4. Shcherbak, I.; Millar, N.; Robertson, G.P. Global metaanalysis of the nonlinear response of soil nitrous oxide (N2O) emissions to fertilizer nitrogen. Proc. Natl. Acad. Sci. USA 2014, 111, 9199–9204. [Google Scholar] [CrossRef]
  5. Stevens, C.J. Nitrogen in the environment. Science 2019, 363, 578–580. [Google Scholar] [CrossRef]
  6. Tian, D.; Niu, S. A global analysis of soil acidification caused by nitrogen addition. Environ. Res. Lett. 2015, 10, 024019. [Google Scholar] [CrossRef]
  7. Zhang, W.; Cao, G.; Li, X.; Zhang, H.; Wang, C.; Liu, Q.; Chen, X.; Cui, Z.; Shen, J.; Jiang, R.; et al. Closing yield gaps in China by empowering smallholder farmers. Nature 2016, 537, 671–674. [Google Scholar] [CrossRef]
  8. Paustian, K.; Lehmann, J.; Ogle, S.; Reay, D.; Robertson, G.; Smith, P. Climate-smart soils. Nature 2016, 532, 49–57. [Google Scholar] [CrossRef]
  9. Chen, W.; Meng, J.; Han, X.; Lan, Y.; Zhang, W. Past, present, and future of biochar. Biochar 2019, 1, 75–87. [Google Scholar] [CrossRef]
  10. Woolf, D.; Lehmann, J.; Ogle, S.; Kishimoto-Mo, A.; McCinkey, B.; Baldock, J. Greenhouse gas inventory model for biochar additions to soil. Environ. Sci. Technol. 2021, 55, 14795–14805. [Google Scholar] [CrossRef]
  11. Lehmann, J.; Joseph, S. (Eds.) Biochar for Environmental Management: Science, Technology and Implementation; Taylor & Francis: Abingdon, UK, 2024. [Google Scholar]
  12. Carbon Standards. Production of Biochar. 2025. Available online: https://www.carbon-standards.com/en/standards/service-514~production-of-biochar.html (accessed on 12 May 2025).
  13. Xia, L.; Cao, L.; Yang, Y.; Liu, Y.; Smith, P.; Van Groenigen, J.W.; Lehmann, J.; Lal, R.; Butterbach-Bahl, K.; Kiese, R.; et al. Integrated biochar solutions can achieve carbon-neutral staple crop production. Nat. Food 2023, 4, 236–246. [Google Scholar] [CrossRef]
  14. Jeffery, S.; Verheijen, F.G.A.; van der Velde, M.; Bastos, A.C. A quantitative review of the effects of biochar application to soils on crop productivity using meta-analysis. Agric. Ecosyst. Environ. 2011, 144, 175–187. [Google Scholar] [CrossRef]
  15. Schmidt, H.P.; Kammann, C.; Hagemann, N.; Leifeld, J.; Bucheli, T.D.; Sánchez-Monedero, M.A.; Cayuela, M.L. Biochar in agriculture: A systematic review of 26 global meta-analyses. GCB Bioenergy 2021, 13, 1708–1730. [Google Scholar] [CrossRef]
  16. Arunrat, N.; Uttarotai, T.; Kongsurakan, P.; Sereenonchai, S.; Hatano, R. Bacterial Community Structure in Soils With Fire-Deposited Charcoal Under Rotational Shifting Cultivation of Upland Rice in Northern Thailand. Ecol. Evol. 2025, 15, e70851. [Google Scholar] [CrossRef]
  17. Dong, D.; Li, J.; Ying, S.; Wu, J.; Han, X.; Teng, Y.; Zhou, M.; Ren, Y.; Jiang, P. Mitigation of methane emission in a rice paddy field amended with biochar-based slow-release fertilizer. Sci. Total. Environ. 2021, 792, 148460. [Google Scholar] [CrossRef]
  18. Clare, A.; Shackley, S.; Joseph, S.; Hammond, J.; Bloom, A. Competing uses for China’s straw: The economic and carbon abatement potential of biochar. GCB Bioenergy 2014, 7, 1272–1282. [Google Scholar] [CrossRef]
  19. Bach, M.; Wilske, B.; Breuer, L. Current economic obstacles to biochar use in agriculture and climate change mitigation. Carbon Manag. 2016, 7, 183–219. [Google Scholar] [CrossRef]
  20. Pan, G.; Li, L.; Liu, X.; Cheng, K.; Bian, R.; Ji, C.; Zheng, J.; Zhang, X.; Zheng, J. Industrialization of biochar pyrolysis: A new option for straw burning ban and green agriculture of China. Sci. Technol. Rev. 2015, 33, 92–101, (In Chinese with English abstract). [Google Scholar]
  21. Ndoung, O.; Figueiredo, C.; Ramos, M. A scoping review on biochar-based fertilizers: Enrichment techniques and agro-environmental application. Heliyon 2021, 7, e08566. [Google Scholar] [CrossRef]
  22. Joseph, S.; Graber, E.R.; Chia, C.; Munroe, P.; Donne, S.; Thomas, T.; Nielsen, S.; Marjo, C.; Rutlidge, H.; Pan, G.; et al. Shifting paradigms: Development of high-efficiency biochar fertilizers based on nano-structures and soluble components. Carbon Manag. 2013, 4, 323–343.3. [Google Scholar] [CrossRef]
  23. Melo, L.C.A.; Lehmann, J.; Carneiro, J.S.S.; Camps-Arbestain, M. Biochar-based fertilizer effects on crop productivity: A meta-analysis. Plant Soil 2022, 472, 45–58. [Google Scholar] [CrossRef]
  24. IPCC. Climate Change 2013: The Physical Science Basis; Stocker, T.F., Qin, D., Plattner, G.K., Tignor, M., Allen, S.K., Boschung, J., Nauels, A., Xia, Y., Bex, V., Midgley, P.M., Eds.; Cambridge University Press: Cambridge, UK, 2013. [Google Scholar]
  25. IPCC. Chapter 5: Cropland land. In 2019 Refinement to the 2006 IPCC Guidelines for National Greenhouse Gas Inventories: Agriculture, Forestry and Other Land Use; Blain, D., Agus, F., Alfaro, M.A., Vreuls, H., Eds.; Intergovernmental Panel on Climate Change (IPCC): Geneva, Switzerland, 2019; Volume 5, p. 68. [Google Scholar]
  26. Zheng, J.; Han, J.; Liu, Z.; Xia, W.; Zhang, X.; Li, L.; Liu, X.; Bian, R.; Cheng, K.; Zheng, J.; et al. Biochar compound fertilizer increases nitrogen productivity and economic benefits but decreases carbon emission of maize production. Agric. Ecosyst. Environ. 2017, 241, 70–78. [Google Scholar] [CrossRef]
  27. Shi, W.; Bian, R.; Li, L.; Lian, W.; Liu, X.; Zheng, J.; Cheng, K.; Zhang, X.; Drosos, M.; Joseph, S.; et al. Assessing the impacts of biochar-blended urea on nitrogen use efficiency and soil retention in wheat production. GCB Bioenergy 2022, 14, 65–83. [Google Scholar] [CrossRef]
  28. Liu, C.; Liu, Y.; Gao, W.; Gao, K.; Sun, B.; Zhang, X.; Xia, S.; Liu, X.; Li, L.; Pan, G. The effect of chamber placement site on N2O emission under different fertilizer regimes from maize field. Agric. Ecosyst. Environ. 2023, 341, 108210. [Google Scholar] [CrossRef]
  29. Li, H.; Wu, Y.; Liu, S.; Xiao, J.; Zhao, W.; Chen, J.; Alexandrov, G.; Cao, Y. Decipher soil organic carbon dynamics and driving forces across China using machine learning. Glob. Change Biol. 2022, 28, 3394–3410. [Google Scholar] [CrossRef]
  30. Lam, S.; Pan, B.; Qin, A.; Chen, D. Advancing agroecosystem modelling of nitrogen losses with machine learning. Earth Crit. Zone 2024, 1, 100006. [Google Scholar] [CrossRef]
  31. Huang, B.Y.; Lü, Q.X.; Tang, Z.X.; Tang, Z.; Chen, H.P.; Yang, X.P.; Zhao, F.J.; Wang, P. Machine learning methods to predict cadmium (Cd) concentration in rice grain and support soil management at a regional scale. Fundam. Res. 2024, 4, 1196–1205. [Google Scholar] [CrossRef]
  32. Xu, X.; Ouyang, X.; Gu, Y.; Cheng, K.; Smith, P.; Sun, J.; Li, Y.; Pan, G. Climate change may interact with nitrogen fertilizer management leading to different ammonia loss in China’s croplands. Glob. Change Biol. 2021, 27, 6525–6535. [Google Scholar] [CrossRef]
  33. Guilpart, N.; Iizumi, T.; Makowski, D. Data-driven yield projections suggest large opportunities to improve Europe’s soybean self-sufficiency under climate change. Nat. Food. 2022, 3, 255–265. [Google Scholar] [CrossRef]
  34. Sun, J.; Chen, L.; Ogle, S.; Cheng, K.; Xu, X.; Li, Y.; Pan, G. Future climate change may pose pressures on greenhouse gas emission reduction in China’s rice production. Geoderma 2023, 440, 116732. [Google Scholar] [CrossRef]
  35. Glenn, A.J.; Moulin, A.P.; Roy, A.K. Soil nitrous oxide emissions from no-till canola production under variable rate nitrogen fertilizer management. Geoderma 2021, 385, 114857. [Google Scholar] [CrossRef]
  36. Crane-Droesch, A. Machine learning methods for crop yield prediction and climate change impact assessment in agriculture. Environ. Res. Lett. 2018, 13, 114003. [Google Scholar] [CrossRef]
  37. Smith, P.; Smith, J.; Powlson, D.; McGill, W.; Arah, J.; Chertov, O.; Coleman, K.; Franko, U.; Frolking, S.; Jenkinson, S.; et al. A comparison of the performance of nine soil organic matter models using datasets from seven long-term experiments. Geoderma 1997, 81, 153–225. [Google Scholar] [CrossRef]
  38. Moran, D.; Macleod, M.; Wall, E.; Eory, V.; McVittie, A.; Barnes, A.; Rees, R.; Topp, C.F.E.; Moxey, A. Marginal abatement cost curves for UK agricultural greenhouse gas emissions. J. Agric. Econ. 2010, 62, 93–118. [Google Scholar] [CrossRef]
  39. Monfreda, C.; Ramankutty, N.; Foley, J.A. Farming the planet: 2. Geographic distribution of crop areas, yields, physiological types, and net primary production in the year 2000. Glob. Biogeochem. Cycles 2008, 22, GB1022. [Google Scholar] [CrossRef]
  40. SBS (State Bureau of Statistics). China Rural Statistical Yearbook; China Statistics Press: Beijing, China, 2019. [Google Scholar]
  41. FAO/IIASA/ISRIC/ISS-CAS/JRC (2012) Harmonized World Soil Database; Version 1.2; FAO: Rome, Italy; IIASA: Luxemburg, 2012.
  42. Ministry of Agriculture and Rural Affairs of the People’s Republic of China. Information Calendar. 2025. Available online: http://zdscxx.moa.gov.cn:8080/nyb/pc/calendar.jsp (accessed on 6 November 2024). (In Chinese)
  43. Wang, J.; Ma, W.; Jiang, R.; Zhang, F. Analysis about amount and ratio of basal fertilizer and topdressing fertilizer on rice, wheat, maize in China. Chin. J. Sci. 2008, 02, 329–333, (In Chinese with English abstract). [Google Scholar]
  44. NY/T3041-2016; Biochar Based Fertilize. Ministry of Agriculture and Rural Affairs: Beijing, China, 2016.
  45. Ye, L.; Camp-Arbestain, M.; Shen, Q.; Lehmann, J.; Singh, B.; Sabir, M. Biochar effects on crop yields with and without fertilizer: A meta-analysis of field studies using separate controls. Soil Use. Manag. 2020, 36, 2–18. [Google Scholar] [CrossRef]
  46. Dong, D.; Wang, C.; Van Zwieten, L.; Wang, H.; Jiang, P.; Zhou, M.; Wu, W. An effective biochar-based slow-release fertilizer for reducing nitrogen loss in paddy fields. J. Soils. Sediments 2020, 20, 3027–3040. [Google Scholar] [CrossRef]
  47. Yang, J.; Li, H.; Zhang, D.; Wu, M.; Pan, B. Limited role of biochars in nitrogen fixation through nitrate adsorption. Sci. Total. Environ. 2017, 592, 758–765. [Google Scholar] [CrossRef]
  48. Gao, S.; Peng, Q.; Liu, X.; Xu, C. The effect of biochar and straw return on N2O emissions and crop yield: A three-year field experiment. Agriculture 2023, 13, 2091. [Google Scholar] [CrossRef]
  49. Shi, W.; Ju, Y.; Bian, R.; Li, L.; Joseph, S.; Mitchell, D.R.G.; Munroe, P.; Taherymoosavi, S.; Pan, G. Biochar bound urea boosts plant growth and reduces nitrogen leaching. Sci. Total. Environ. 2019, 701, 134424. [Google Scholar] [CrossRef] [PubMed]
  50. Chew, J.; Zhu, L.; Nielsen, S.; Graber, E.R.; Mitchell, D.R.G.; Horvat, J.; Mohammed, M.; Liu, M.; van Zwieten, L.; Donne, S.; et al. Biochar-based fertilizer: Supercharging root membrane potential and biomass yield of rice. Sci. Total. Environ. 2020, 713, 13643. [Google Scholar] [CrossRef] [PubMed]
  51. Liu, C.; Tian, J.; Chen, L.; He, Q.; Li, Y.; Bian, R.; Zheng, J.; Cheng, K.; Xia, S.; Zhang, X.; et al. Biochar boosted high oleic peanut production with enhanced root development and biological N fixation by diazotrophs in a sand-loamy Primisol. Sci. Total. Environ. 2024, 932, 173061. [Google Scholar] [CrossRef]
  52. Liu, C.; Shang, S.; Wang, C.; Tian, J.; Zhang, L.; Liu, X.; Bian, R.; He, Q.; Zhang, F.; Chen, L.; et al. Biochar amendment increases peanut production through improvement of the extracellular enzyme activities and microbial community composition in replanted field. Plants 2025, 14, 922. [Google Scholar] [CrossRef]
  53. Castejón-del Pino, R.; Sánchez-Monedero, M.A.; Sánchez-García, M.; Cayuela, M.L. Fertilization strategies to reduce yield-scaled N2O emissions are based on biochar and biochar-based fertilizers. Nutr. Cycl. Agroecosyst. 2024, 129, 491–501. [Google Scholar] [CrossRef]
  54. Pereira, V.V.; Morales, M.M.; Pereira, D.H.; de Rezende, F.A.; de Souza Magalhães, C.A.; de Lima, L.B.; Marimon-Junior, B.H.; Petter, F.A. Activated biochar-based organomineral fertilizer delays nitrogen release and reduces N2O emission. Sustainability 2022, 14, 12388. [Google Scholar] [CrossRef]
  55. Chen, Y.K. Effects of Nitrogen Fertilizer Types on Greenhouse Gas Emissions and Nitrogen Use Efficiency of Rice and Oilseed Rape Cropping System. Master’s Thesis, Huazhong Agricultural University, Wuhan, China, 2022. (In Chinese). [Google Scholar]
  56. Yue, Q.; Wu, H.; Sun, J.; Cheng, K.; Smith, P.; Hellier, J.; Xu, X.; Pan, G. Deriving emission factors and estimating direct nitrous oxide emissions for crop cultivation in China. Environ. Sci. Technol. 2019, 53, 10246–10257. [Google Scholar] [CrossRef]
  57. Sun, J.F. Model Construction and Prediction of Future Changes in Carbon Sequestration and Emission Reduction Potential of Paddy Fields in China. Doctoral Dissertation, Nanjing Agricultural University, Nanjing, China, 2022. (In Chinese). [Google Scholar]
  58. Zhao, Y.; Wang, M.; Hu, S.; Zhang, X.; Ouyang, Z.; Zhang, G.; Huang, B.; Zhao, S.; Wu, J.; Xie, D.; et al. Economics-and policy-driven organic carbon input enhancement dominates soil organic carbon accumulation in Chinese croplands. Proc. Natl. Acad. Sci. USA 2018, 115, 4045–4050. [Google Scholar] [CrossRef]
  59. Sun, J.; Zheng, J.; Cheng, K.; Ye, Y.; Zhuang, Y.; Pan, G. Quantifying carbon sink by biochar compound fertilizer project for domestic voluntary carbon trading in agriculture. Sci. Agric. Sin. 2018, 51, 4470–4484, (In Chinese with English abstract). [Google Scholar]
  60. Qian, H.; Zhu, X.; Huang, S.; Linquist, B.; Kuzyakov, Y.; Wassmann, R.; Minamikawa, K.; Martinez-Eixarch, M.; Yan, X.; Zhou, F.; et al. Greenhouse gas emissions and mitigation in rice agriculture. Nat. Rev. Earth Environ. 2023, 4, 716–732. [Google Scholar] [CrossRef]
  61. Puga, A.P.; Grutzmacher, P.; Cerri, C.E.P.; Ribeirinho, V.S.; Andrade, C.A. Biochar-based nitrogen fertilizers: Greenhouse gas emissions, use efficiency, and maize yield in tropical soils. Sci. Total. Environ. 2020, 704, 135375. [Google Scholar] [CrossRef] [PubMed]
  62. European Union. Regulation (EU) 2019/1009 of the European Parliament and of the Council of 5 June 2019 laying down rules on the making available on the market of EU fertilising products and amending Regulations (EC) No 1069/2009 and (EC) No 1107/2009. Off. J. Eur. Union 2019, L170, 1. [Google Scholar]
  63. General Office of the Ministry of Agriculture and Rural Affairs of the People’s Republic of China. Notice on Recommending and Issuing Ten Models of Straw Farming Utilization. 2017. Available online: http://www.moa.gov.cn/govpublic/KJJYS/201705/t20170503_5593248.htm (accessed on 3 February 2025). (In Chinese)
  64. Ministry of Ecology and Environment of the People’s Republic of China. Greenhouse Gas Control. 2025. Available online: https://www.mee.gov.cn/ywgz/ydqhbh/wsqtkz/ (accessed on 3 February 2025). (In Chinese)
  65. Mostafa, M.E.; Hua, S.; Wang, Y.; Su, S.; Hu, X.; Elsayedd, S.A.; Xiang, J. The significance of pelletization operating conditions: An analysis of physical and mechanical characteristics as well as energy consumption of biomass pellets. Renew. Sustain. Energy Rev. 2019, 105, 332–348. [Google Scholar] [CrossRef]
  66. Meng, J.; He, T.; Sanganyado, E.; Lan, Y.; Zhang, W.; Han, X.; Chen, W. Development of the straw biochar returning concept in China. Biochar 2019, 1, 139–149. [Google Scholar] [CrossRef]
  67. Wang, C.; Luo, D.; Zhang, X.; Huang, R.; Cao, Y.; Liu, G.; Zhang, Y.; Wang, H. Biochar-based slow-release of fertilizers for sustainable agriculture: A mini review. Environ. Sci. Ecotechnol. 2022, 10, 100167. [Google Scholar] [CrossRef]
  68. An, X.; Wu, Z.; Yu, J.; Ge, L.; Li, T.; Liu, X.; Yu, B. High-efficiency reclaiming phosphate from an aqueous solution by bentonite modified biochars: A slow release fertilizer with a precise rate regulation. ACS Sustain. Chem. Eng. 2020, 8, 6090–6609. [Google Scholar] [CrossRef]
  69. Sim, D.H.H.; Tan, I.A.W.; Lim, L.L.P.; Hameed, B.H. Encapsulated biochar-based sustained release fertilizer for precision agriculture: A review. J. Clean. Prod. 2021, 303, 127018. [Google Scholar] [CrossRef]
  70. Vejan, P.; Khadiran, T.; Abdullah, R.; Ahmad, N. Controlled release fertilizer: A review on developments, applications and potential in agriculture. J. Control. Release 2021, 339, 321–334. [Google Scholar] [CrossRef]
  71. Clough, T.J.; Condron, L.M.; Kammann, C.; Müller, C. A review of biochar and soil nitrogen dynamics. Agronomy 2013, 3, 275–293. [Google Scholar] [CrossRef]
  72. Yu, Z.P.; Yang, H.P.; Ji, L.C.; Wei, C.C.; Jiang, F.; Li, M.S.; Li, X.L.; Li, F.Y. Effects of biochar-based fertilizer addition on maize yield and greenhouse gas emission characteristics. J. Henan Agric. Univ. 2022, 56, 742–749, (In Chinese with English Summary). [Google Scholar]
  73. Li, Z.D.; Tao, J.S.; Li, L.Q.; Pan, G.X.; Liu, X.Y.; Zhang, X.H.; Zhang, J.F.; Zheng, J.W.; Wang, J.F.; Yu, X.Y. Effects of biochar-based fertilizers on wheat yield and greenhouse gas emissions. Chin. J. Soil Sci. 2015, 46, 177–183, (In Chinese with English Summary). [Google Scholar]
  74. Li, X. Effects of Biochar and Biochar-Based Fertilizers on Greenhouse Gas Emissions, Maize Growth, and Soil Properties. Master’s Thesis, Nanjing Agricultural University, Nanjing, China, 2013. (In Chinese with English Summary). [Google Scholar]
  75. Li, Q.; Chen, L.; Joseph, S.; Pan, G.; Li, L.; Zheng, J.; Zhang, H.; Zheng, J.; Yu, X.; Wang, J. Biochar compound fertilizer as an option to reach high productivity but low carbon intensity in rice agriculture of China. Carbon Manag. 2014, 5, 145–154. [Google Scholar]
  76. Pramono, A.; Adriany, T.A.; Susilawati, H.L.; Sutriadi, M.T. Global warming potential from maize cultivation as affected by organic and biochar coated urea fertilizer in rainfed lowlan. IOP Conf. Ser. Earth Environ. Sci. 2021, 733, 012144. [Google Scholar] [CrossRef]
  77. Li, J.W. Effects of Long-Term Application of Biochar and Biochar-Based Fertilizers on Soil N2O Emissions and Nitrogen Fixation; Shenyang Agricultural University: Shenyang, China, 2022; (In Chinese with English Summary). [Google Scholar]
Figure 1. Geographic distribution of field experiment sites for greenhouse gas emissions under BBF application (NE, Northeast; IMGW, Inner Mongolia and along the Great Wall; HHH, Huang–Huai–Hai; LP, Loess Plateau; YR, Yangtze River; SW, Southwest; S, South; QT, Qinghai–Tibet; GX, Gansu–Xinjiang).
Agronomy 15 01238 g001
Figure 2. Comparison of observed and simulated values for RF, SVM, and ANN models.
Agronomy 15 01238 g002
Figure 3. Contribution of each variable in random forest model.
Agronomy 15 01238 g003
Figure 4. Marginal effects of carbon and nitrogen contents in BBF on crop yield and N2O emissions.
Agronomy 15 01238 g004
Figure 5. Spatial distribution of crop yield and N2O emissions changes in China’s staple crops under BBF application.
Agronomy 15 01238 g005
Figure 6. Spatial distribution of uncertainty (95% confidence intervals) in crop yield and N2O emission under BBF application in China.
Agronomy 15 01238 g006
Table 1. Changes in crop production and N2O emissions across different agricultural regions in 2018.
Agricultural RegionWheatRiceMaize
N2O Change (%)Yield Change (%)N2O Change (%)Yield Change (%)N2O Change (%)Yield Change (%)
NE−6.954.31−5.605.47−3.504.69
YR−4.455.26−3.025.11−1.944.21
SW−2.178.57−3.684.71−1.534.84
S1.4211.49−2.775.36−2.474.80
Others−6.834.55−6.123.88−4.693.76
National−6.334.86−3.685.04−3.774.25
Note: NE, Northeast; YR, Yangtze River; SW, Southwest; S, South; “Others” refers to areas other than the main crop-producing areas mentioned above.
Disclaimer/Publisher’s Note: The statements, opinions and data contained in all publications are solely those of the individual author(s) and contributor(s) and not of MDPI and/or the editor(s). MDPI and/or the editor(s) disclaim responsibility for any injury to people or property resulting from any ideas, methods, instructions or products referred to in the content.

