Article

Predicting Nitrous Oxide Emissions from China’s Upland Fields Under Climate Change Scenarios with Machine Learning

1
Institute of Resource, Ecosystem and Environment of Agriculture, Nanjing Agricultural University, 1 Weigang, Nanjing 210095, China
2
Nanjing Institute of Environmental Sciences, Ministry of Ecology and Environment, Nanjing 210042, China
*
Author to whom correspondence should be addressed.
Agronomy 2025, 15(6), 1447; https://doi.org/10.3390/agronomy15061447
Submission received: 12 May 2025 / Revised: 6 June 2025 / Accepted: 11 June 2025 / Published: 13 June 2025
(This article belongs to the Special Issue New Pathways Towards Carbon Neutrality in Agricultural Systems)

Abstract

:
Upland fields are a significant source of N2O emissions. Thus, an accurate estimation of these emissions is essential. This study employed four classical modeling approaches—the Stepwise Regression Model, Decision Tree Regression, Support Vector Machine, and Random Forest (RF)—to simulate soil N2O emissions from Chinese upland fields. The upland crops considered in this study covered food crops, oil crops, cash crops, sugar crops, fruits, and vegetables, excluding flooded rice. Comparative analysis revealed that the RF algorithm performed the best, with the highest R2 at 0.66 and the lowest root mean square error at 0.008 kg N2O ha−1 day−1. The application rate of mineral nitrogen fertilizers, mean temperature during the growing season, and soil organic carbon content were the key driving factors in the N2O emission model. Utilizing the RF model, total N2O emissions from Chinese upland fields in 2020 were estimated at 183 Gg. Future projections under Representative Concentration Pathway (RCP) scenarios indicated a 2.80–5.92% increase in national N2O emissions by 2050 compared to 2020. The scenario analysis demonstrated that the proposed nitrogen reduction strategies fail to counteract climate-driven emission amplification. Under the combined scenarios of RCP8.5 and nitrogen reduction strategies, a net 4% increase in national N2O emissions was projected, highlighting the complex interplay between anthropogenic interventions and climate feedback mechanisms. This study proposes that future attention should be paid to the development of nitrogen optimization strategies under the impact of climate change.

1. Introduction

With a global warming potential 273 times that of carbon dioxide (CO2) over 100 years, nitrous oxide (N2O) ranks among one of the most potent greenhouse gases [1]. In addition to its significant contribution to global climate change, N2O is a major stratospheric ozone-depleting substance [2]. Evidence indicates that the agricultural sector is the largest anthropogenic source of N2O emissions, primarily due to the widespread use of nitrogen (N) fertilizers [3]. Projections suggest that by 2050, global N2O emissions from agricultural land will increase by approximately 50% compared to 2010 levels [4].
As a traditionally agricultural country, China has heavily relied on N fertilizers to enhance crop yields to meet the demands of a growing population and food security [5]. However, the inefficient use of N fertilizers has led to reduced N use efficiency, resulting in increased N losses through N2O emissions and other pathways, accounting for over 20% of global agricultural N2O emissions [6]. Upland cropping systems constitute the dominant farmland type in China, accounting for 82% of the national sown crop area. Compared to flooded paddy fields, which maintain predominantly anaerobic conditions, upland systems typically have aerobic soil conditions. This oxygen availability promotes nitrification, a microbial process that converts ammonium into nitrate. However, during transient periods of reduced oxygen (e.g., after rainfall or irrigation), partial denitrification occurs, where nitrate is incompletely reduced to N2O rather than dinitrogen gas (N2). Consequently, the fluctuating aerobic/anaerobic microsites in upland soils make them significant sources of N2O emissions [5,6]. Therefore, accurate quantification of N2O emissions from upland soils in China is crucial for the development of effective emission reduction policies.
N2O emissions from agricultural soils are primarily generated through nitrification and denitrification, and biochemical processes are governed by substrate availability, soil properties, and climate conditions [7,8]. Soils in different agricultural regions of China exhibit significant spatial heterogeneity. For instance, soils in the north tend to be alkaline, whereas those in the south are predominantly acidic. Furthermore, the texture of southern soils is generally more clayey and viscous compared to their northern counterparts. Agricultural management practices also play a crucial role in regulating N2O emissions [6]. Due to the interplay of these factors, N2O emission patterns exhibit substantial spatial heterogeneity at both regional and national scales. This spatial variability makes accurately estimating N2O emissions from China’s uplands particularly challenging.
The emission factor method, developed by the IPCC [9], is the most widely used approach for estimating greenhouse gas emissions at the national level. However, significant uncertainty remains in the application of emission factors for estimating cumulative N2O emissions on national or regional scales [10,11]. To address these uncertainties, some researchers have refined the emission factor algorithm by incorporating empirical model-corrected emission factors or developing region- and crop-specific emission factors [12,13]. However, several studies have shown that the relationship between N2O emissions and N input is nonlinear [14,15,16]. Moreover, climate variables and soil properties play crucial roles in determining N2O emissions that the emission factor method cannot fully capture [16].
Modeling approaches have been found to be effective in improving N2O emission estimates by incorporating climate, soil, and management variables [6,17,18]. Among these, process-based models and data-driven models are the two main types widely used. Process-based models simulate systems using mathematical equations derived from a scientific understanding of the underlying mechanisms, whereas data-driven models learn patterns and relationships directly from observed data using statistical or machine learning techniques. Process-based models, such as Denitrification–Decomposition (DNDC) and DayCent (the daily time step version of CENTURY), have been calibrated and validated using field measurements from the U.S.A, the UK, China, and others [19,20,21,22]. These models have been demonstrated to accurately simulate seasonal N2O emissions from farmland under various environmental and management conditions while capturing the dynamic daily variations in fluxes [23,24,25]. For example, Abdalla et al. [26] estimated the daily N2O fluxes of one arable field in Ireland using DNDC, and the results showed that this model was more sensitive and accurate with a high N input system, and the modeled EF values of arable fields were lower than IPCC default values [9]. DNDC was also used to simulate daily N2O fluxes for different crops with different management systems in southern Manitoba, Canada, although there are still other processes that need to be considered to improve the model’s accuracy [27]. Cheng et al. [28] validated the DayCent model using observational data from 97 sites and found strong agreement between the predicted and observed values. However, the model exhibited significant biases when simulating N2O emissions from upland crop systems. Consequently, the successful application of process-based models relies heavily on localized parameter calibration and validation. Moreover, the extensive and detailed input data required by these models pose a challenge, limiting their broader applicability.
Data-driven models simulate N2O emissions by integrating existing observational data and establishing statistical relationships between key environmental variables (independent variables) and the response variable (N2O emissions). Yue et al. [29] developed a data-driven model for estimating N2O emissions from Chinese croplands using multiple regression. However, validation of this model using independent sample data yielded an R2 of only 0.48. Machine learning (ML) algorithms excel at handling nonlinear relationships and complex variables, demonstrating high accuracy in both regression and classification tasks [30]. ML algorithms have been applied across various fields [31,32]. For instance, Sun et al. [33] estimated the rice yield and soil GHG emissions of Chinese paddies under different climate change scenarios based on ML models. ML offered higher accuracy than linear regression models by accounting for nonlinear relationships while requiring fewer input data than process-based models, thereby broadening its applicability. Additionally, since ML models are directly trained on observational data, they often achieve greater accuracy than process-based models in many cases. As a result, ML models provide an alternative method for estimating GHG emissions with improved accuracy.
To accurately estimate N2O emissions from Chinese uplands and predict future trends, this study identified the optimal ML algorithm for simulating N2O emissions and used it to evaluate the current state of emissions from Chinese upland crop production. Additionally, this study forecasted changes in the spatiotemporal patterns of N2O emissions under future climate change scenarios.

2. Materials and Methods

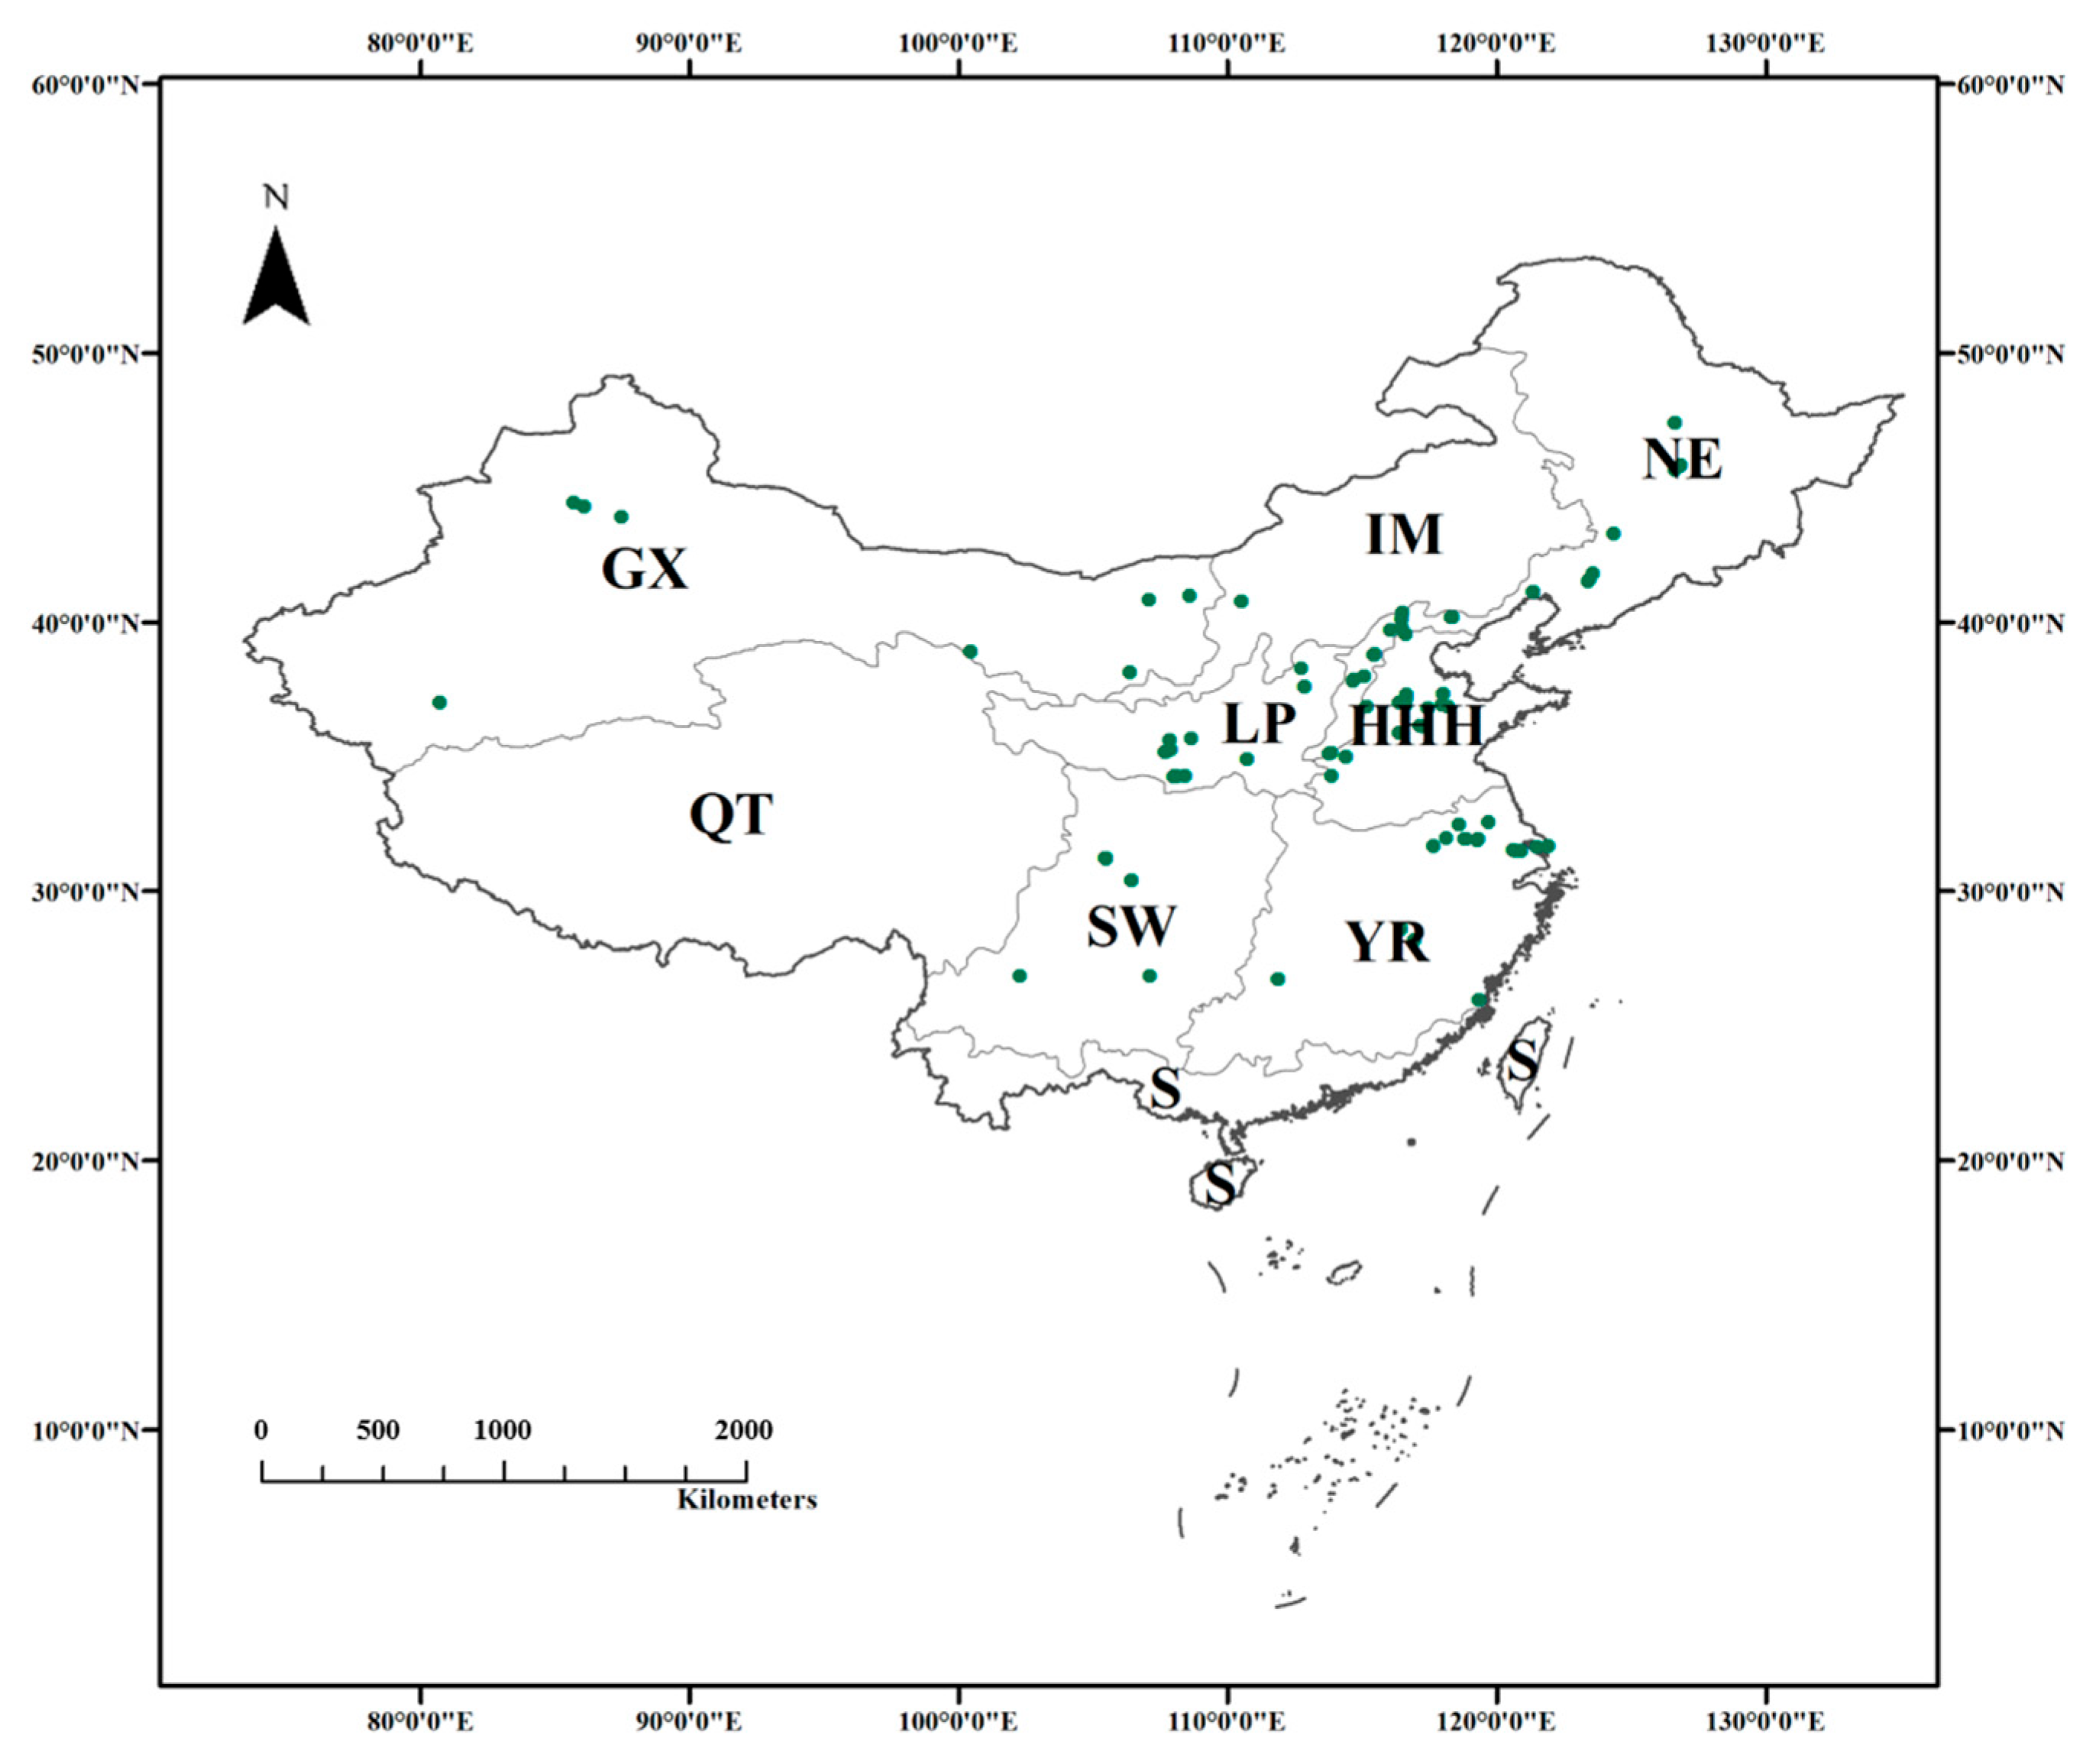
2.1. Data Collection for Model Development

The keywords “N2O”, “soil”, “cropland”, and “China” were used to search for peer-reviewed articles in the Web of Science and China National Knowledge Infrastructure databases. The following criteria were applied to select relevant studies: (i) only field experiments were included, while incubation and pot experiments were excluded; (ii) monitoring of N2O emissions had to cover the entire reproductive period of the crops; and (iii) essential information such as soil properties, climate data, experimental locations, and management details had to be provided. Data presented in graphs were extracted using the GetData Graph Digitizer software v2.5. In total, 900 sets of observations from 136 sites were collected to construct the database (Figure 1 and Figure S1).
The variables in the database included N2O emissions (kg ha−1), initial soil properties (soil organic carbon (SOC), g kg−1; soil pH; soil clay content, g kg−1; soil bulk density (BD), g cm−3); agricultural management (fertilizer type, including mineral, organic manure, and straw); N input rate, kg N ha−1; irrigation method (irrigation or rainfall); and climate data during the growth period (average precipitation, mm; average temperature, °C). The missing soil properties were obtained from the Harmonized World Soil Database (HWSD) v.1.2 using the specific coordinates of the experimental sites to fill in the gaps. Missing climate data were sourced from the Environmental Science Data Center (www.resdc.cn), and climate data for the crop growth periods were calculated for all experimental sites (Figure S2).

2.2. Spatial Database Sources

To simulate the spatial distribution of N2O emissions under current and future climate change, a series of spatial datasets was needed. China has nine terrestrial agricultural regions, including Gansu–Xinjiang (GX), Huang–Huai–Hai (HHH), Inner Mongolia and along the Great Wall (IM), the Loess Plateau (LP), the northeast (NE), Qinghai–Tibet (QT), the south (S), the southwest (SW), and the Yangtze River (YR). The N2O emissions from these nine agricultural regions and from croplands nationwide were estimated and predicted. The planting area data of various crops were obtained from Mueller et al. (2012) [34]. Crops were divided into six groups, which were grain crops (wheat and maize), oil-bearing crops (soybean, groundnut, and rapeseed), sugar crops (sugarcane and sugar beet), vegetables (vegetables and potatoes), fruits, and cash crops (cotton and tobacco). Data for N fertilizer application rates across the regions were obtained from the national statistics, providing data on the cultivated area and N fertilizer application rates of various crops at the provincial level [35]. The spatial raster data of the soil properties come from the HWSD.
The climate data in 2020 for the entire country were sourced from the Environmental Science Data Center (www.resdc.cn), which archives historical temperature and precipitation data for over 2000 stations (Figure S2). The future climate change scenarios considered in this study are based on the Representative Concentration Pathways (RCPs). There are four distinct RCP scenarios, RCP2.6, RCP4.5, RCP6.0, and RCP8.5, each representing different levels of radiative forcing, specifically, 2.6, 4.5, 6.0, and 8.5 W/m2, respectively [36]. For this research, the future daily temperature and precipitation data were derived from five General Circulation Models (GCMs): GFDL-ESM2M, HadGEM2-ES, IPSL-CM5A-LR, MIROC-ESM-CHEM, and NorESM1-M. These models were accessed through the Inter-Sectoral Impact Model Inter-Comparison Project (ISI–MIP). The spatial resolution of all data was standardized to 5′ × 5′.

2.3. Model Development

Given the varying growth periods of different crops, the mean daily N2O emissions, derived by dividing the total seasonal emissions by the number of days within each crop’s growth period, were taken as the dependent variable. Machine learning was employed to establish nonlinear models of N2O emissions. To determine the most suitable machine learning model, this study developed and compared four models: the Stepwise Regression Model (SRM), Support Vector Machine (SVM), Decision Tree Regression (DTR), and Random Forest (RF). SRM is an iterative process that systematically selects independent variables to be included in the final regression model [37]. SVM is a robust algorithm for classification and regression tasks, capable of constructing hyperplanes in high-dimensional or even infinite-dimensional spaces [38]. Both DTR and RF are based on decision tree predictors, with the key difference being that RF employs the ensemble method to improve prediction performance by aggregating results from multiple decision trees [39,40,41,42,43].
To train the machine learning models effectively, the database was randomly partitioned into a training set and a validation set in a 7:3 ratio. The training set was utilized to optimize the best parameters for each model, while the validation set was employed to assess the models’ generalizability [44]. This study relied on three key performance indicators to evaluate the models: R2, root-mean-square error (RMSE), and model efficiency (ME).
Prior to comparing models, it is crucial to ensure that each algorithm is optimized to its fullest potential, thereby guaranteeing a fair and objective evaluation. To achieve this, a combination of cross-validation and grid search was employed to determine the optimal parameters for the machine learning models. The cross-validation process involves partitioning the dataset into multiple mutually exclusive subsets, followed by repeated rounds of training and validation, which helps mitigate overfitting and bias. In conjunction with this, grid search systematically evaluates each possible parameter combination within a predefined range, identifying the optimal combination that yields the highest performance during cross-validation.
To enhance the model’s interpretability, variable importance analysis was conducted to determine the extent of the impact of different independent variables on the model. Marginal effect analysis was employed to identify the trend of the influence of a certain variable on nitrous oxide emissions. Marginal effect analysis entails systematically altering the values of a particular independent variable within model simulations, with all other independent variables held constant, to ascertain its influence on the dependent variables.

2.4. N2O Emission Simulation

The daily N2O fluxes per hectare for the year 2020 and under various RCPs for 2050 were estimated using the spatial datasets of variables included in our final models. Subsequently, the seasonal N2O emissions per hectare were determined by integrating the daily fluxes with the duration of the crop growing period. The emissions for each grid cell were derived by multiplying the emissions per unit area by the area under crop cultivation. The regional and national N2O emissions from upland fields were calculated by aggregating the emissions across all grid cells within their respective areas.
Excessive use of mineral N fertilizers contributes substantially to N2O emissions. Effective strategies to mitigate these emissions include reducing the application of mineral N fertilizers. Based on previous research, specific reduction rates for mineral N fertilizers were established for a variety of crops. These rates are as follows: wheat at 15%, corn at 16%, soybeans at 25%, peanuts at 50%, rapeseed at 16.7%, cotton at 20%, sugarcane at 40%, sugar beets at 50%, fruits at 34%, and vegetables at 20%.
All data calculations, model building, and predictive analyses were performed using R version 4.0. The machine learning models, SRM, DTR, SVM, and RF, were implemented with the R packages “rpart”, “e1071”, and “RandomForest”. Data statistics, visualization, and uncertainty calculations relied on the R packages “data.table”, “dplyr”, “ggplot2”, and “RFinfer”. All thematic maps were generated using ArcMap version 10.8.

3. Results

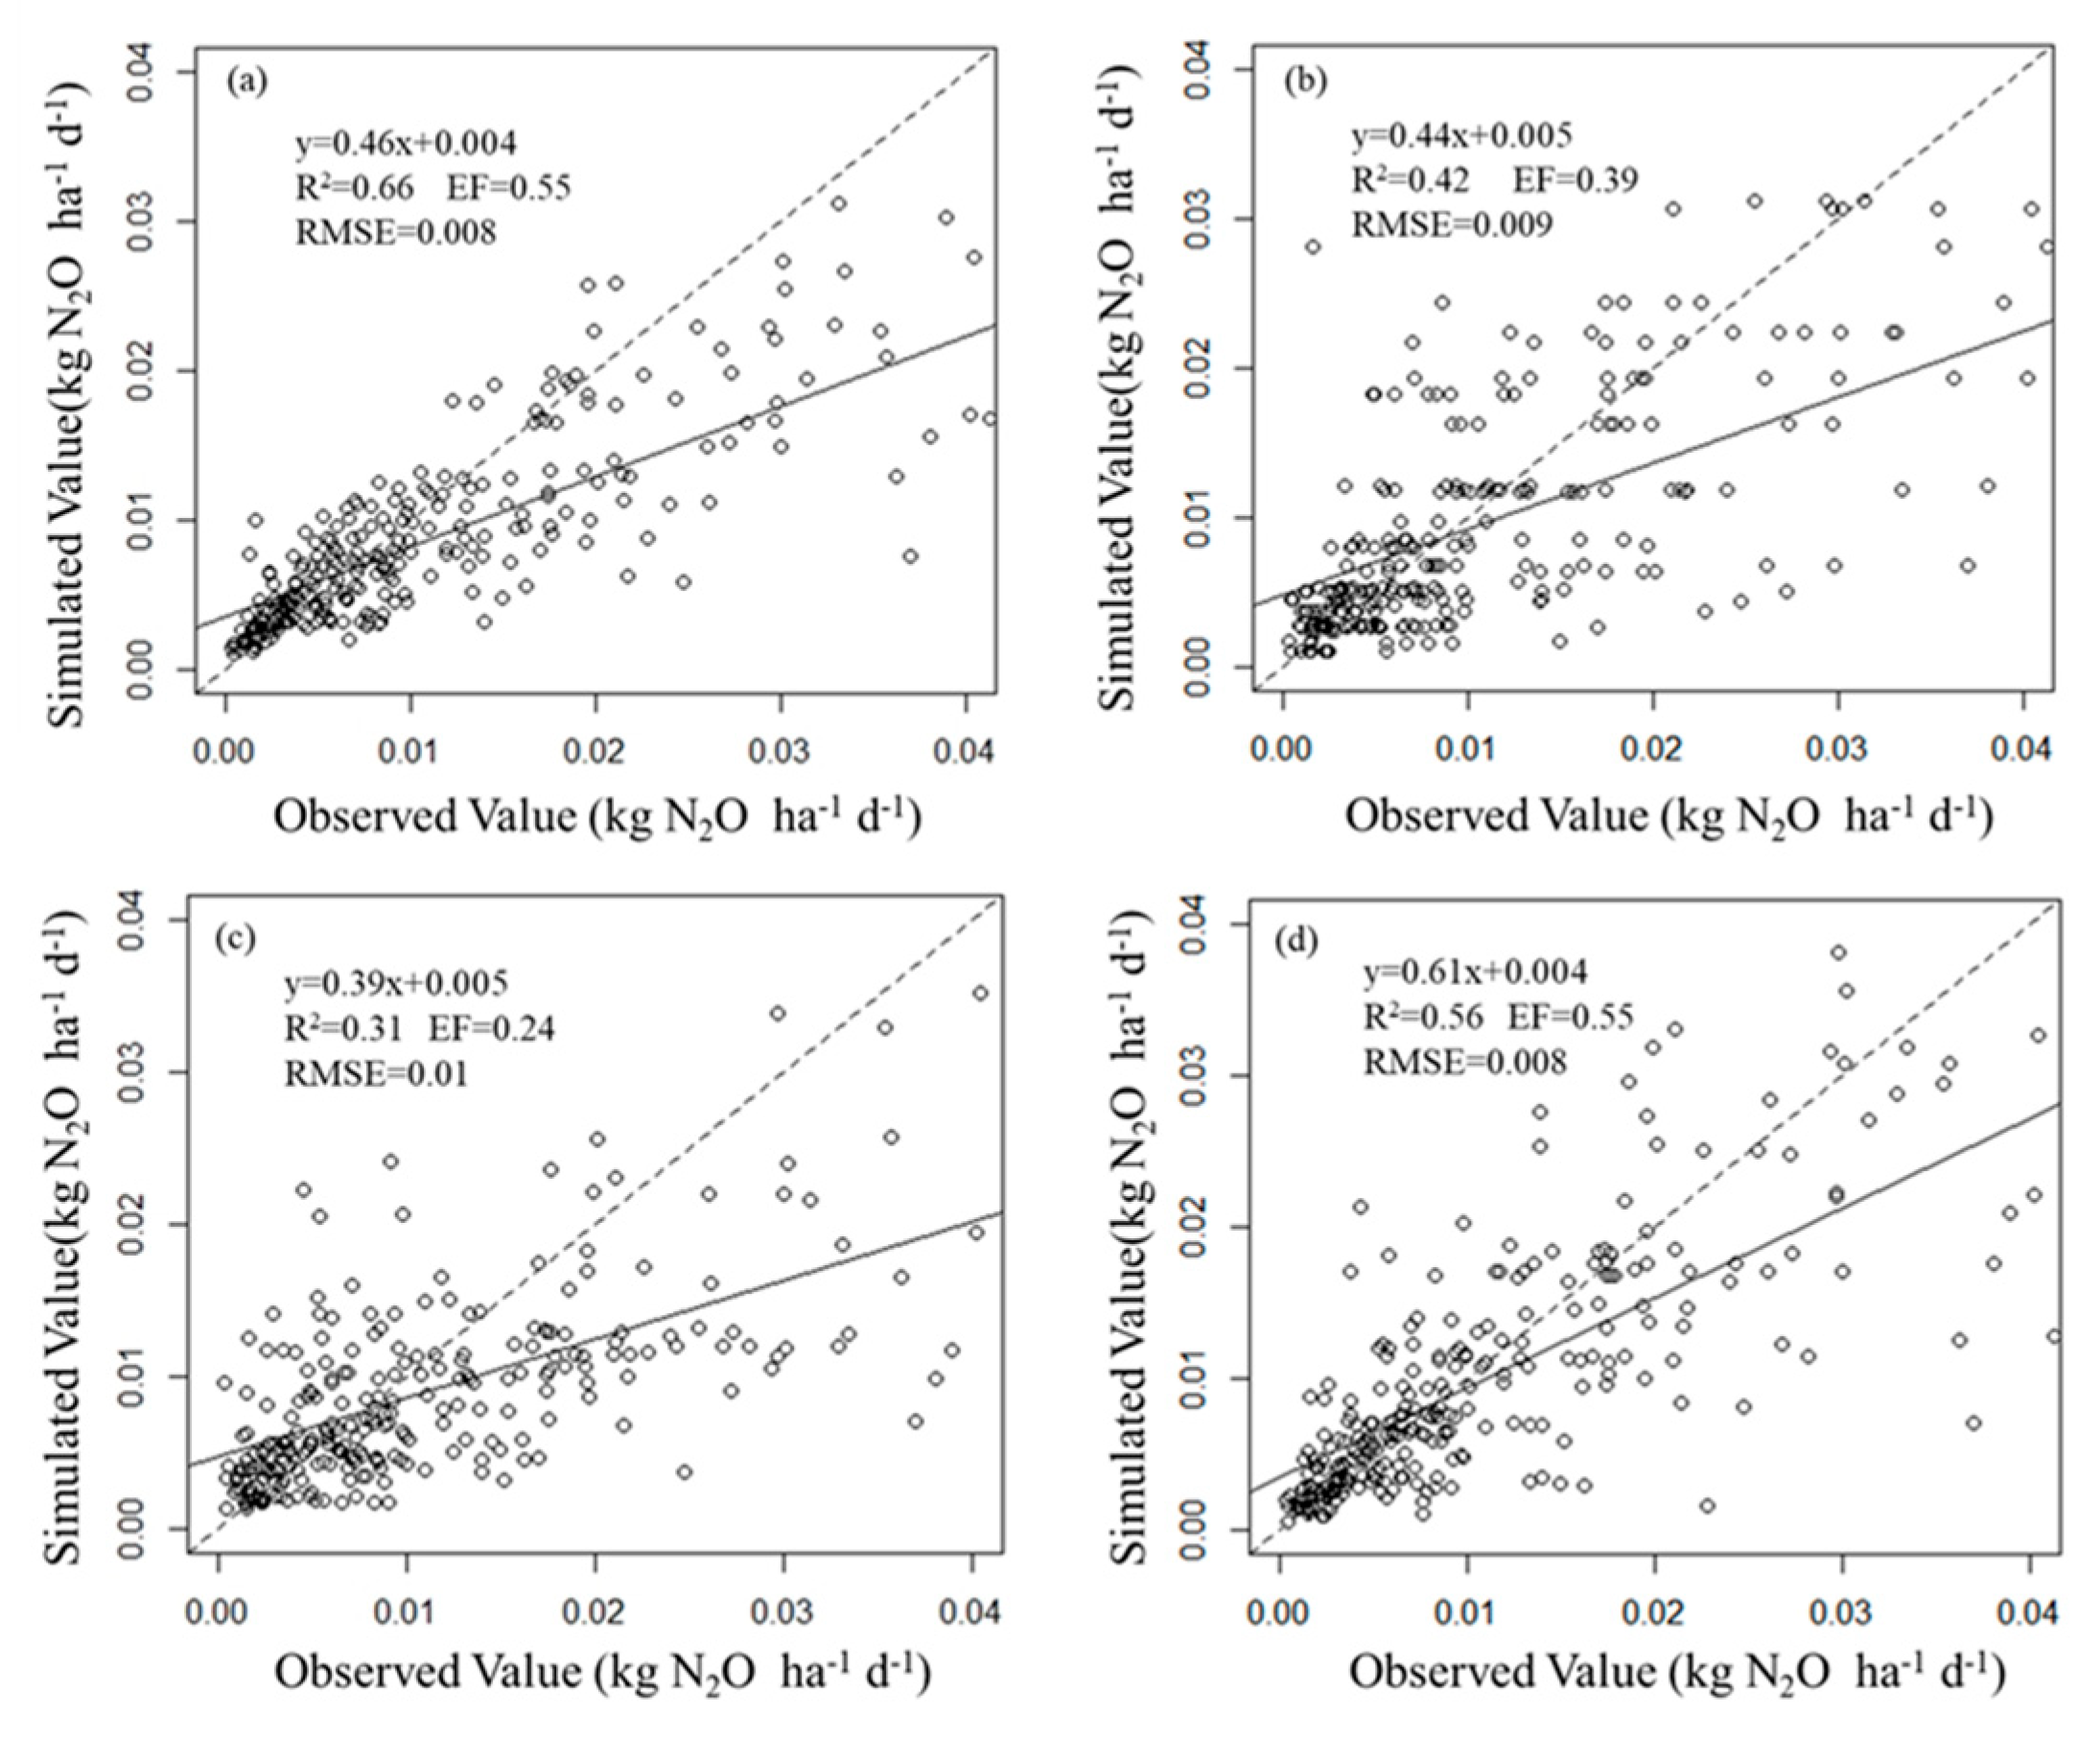
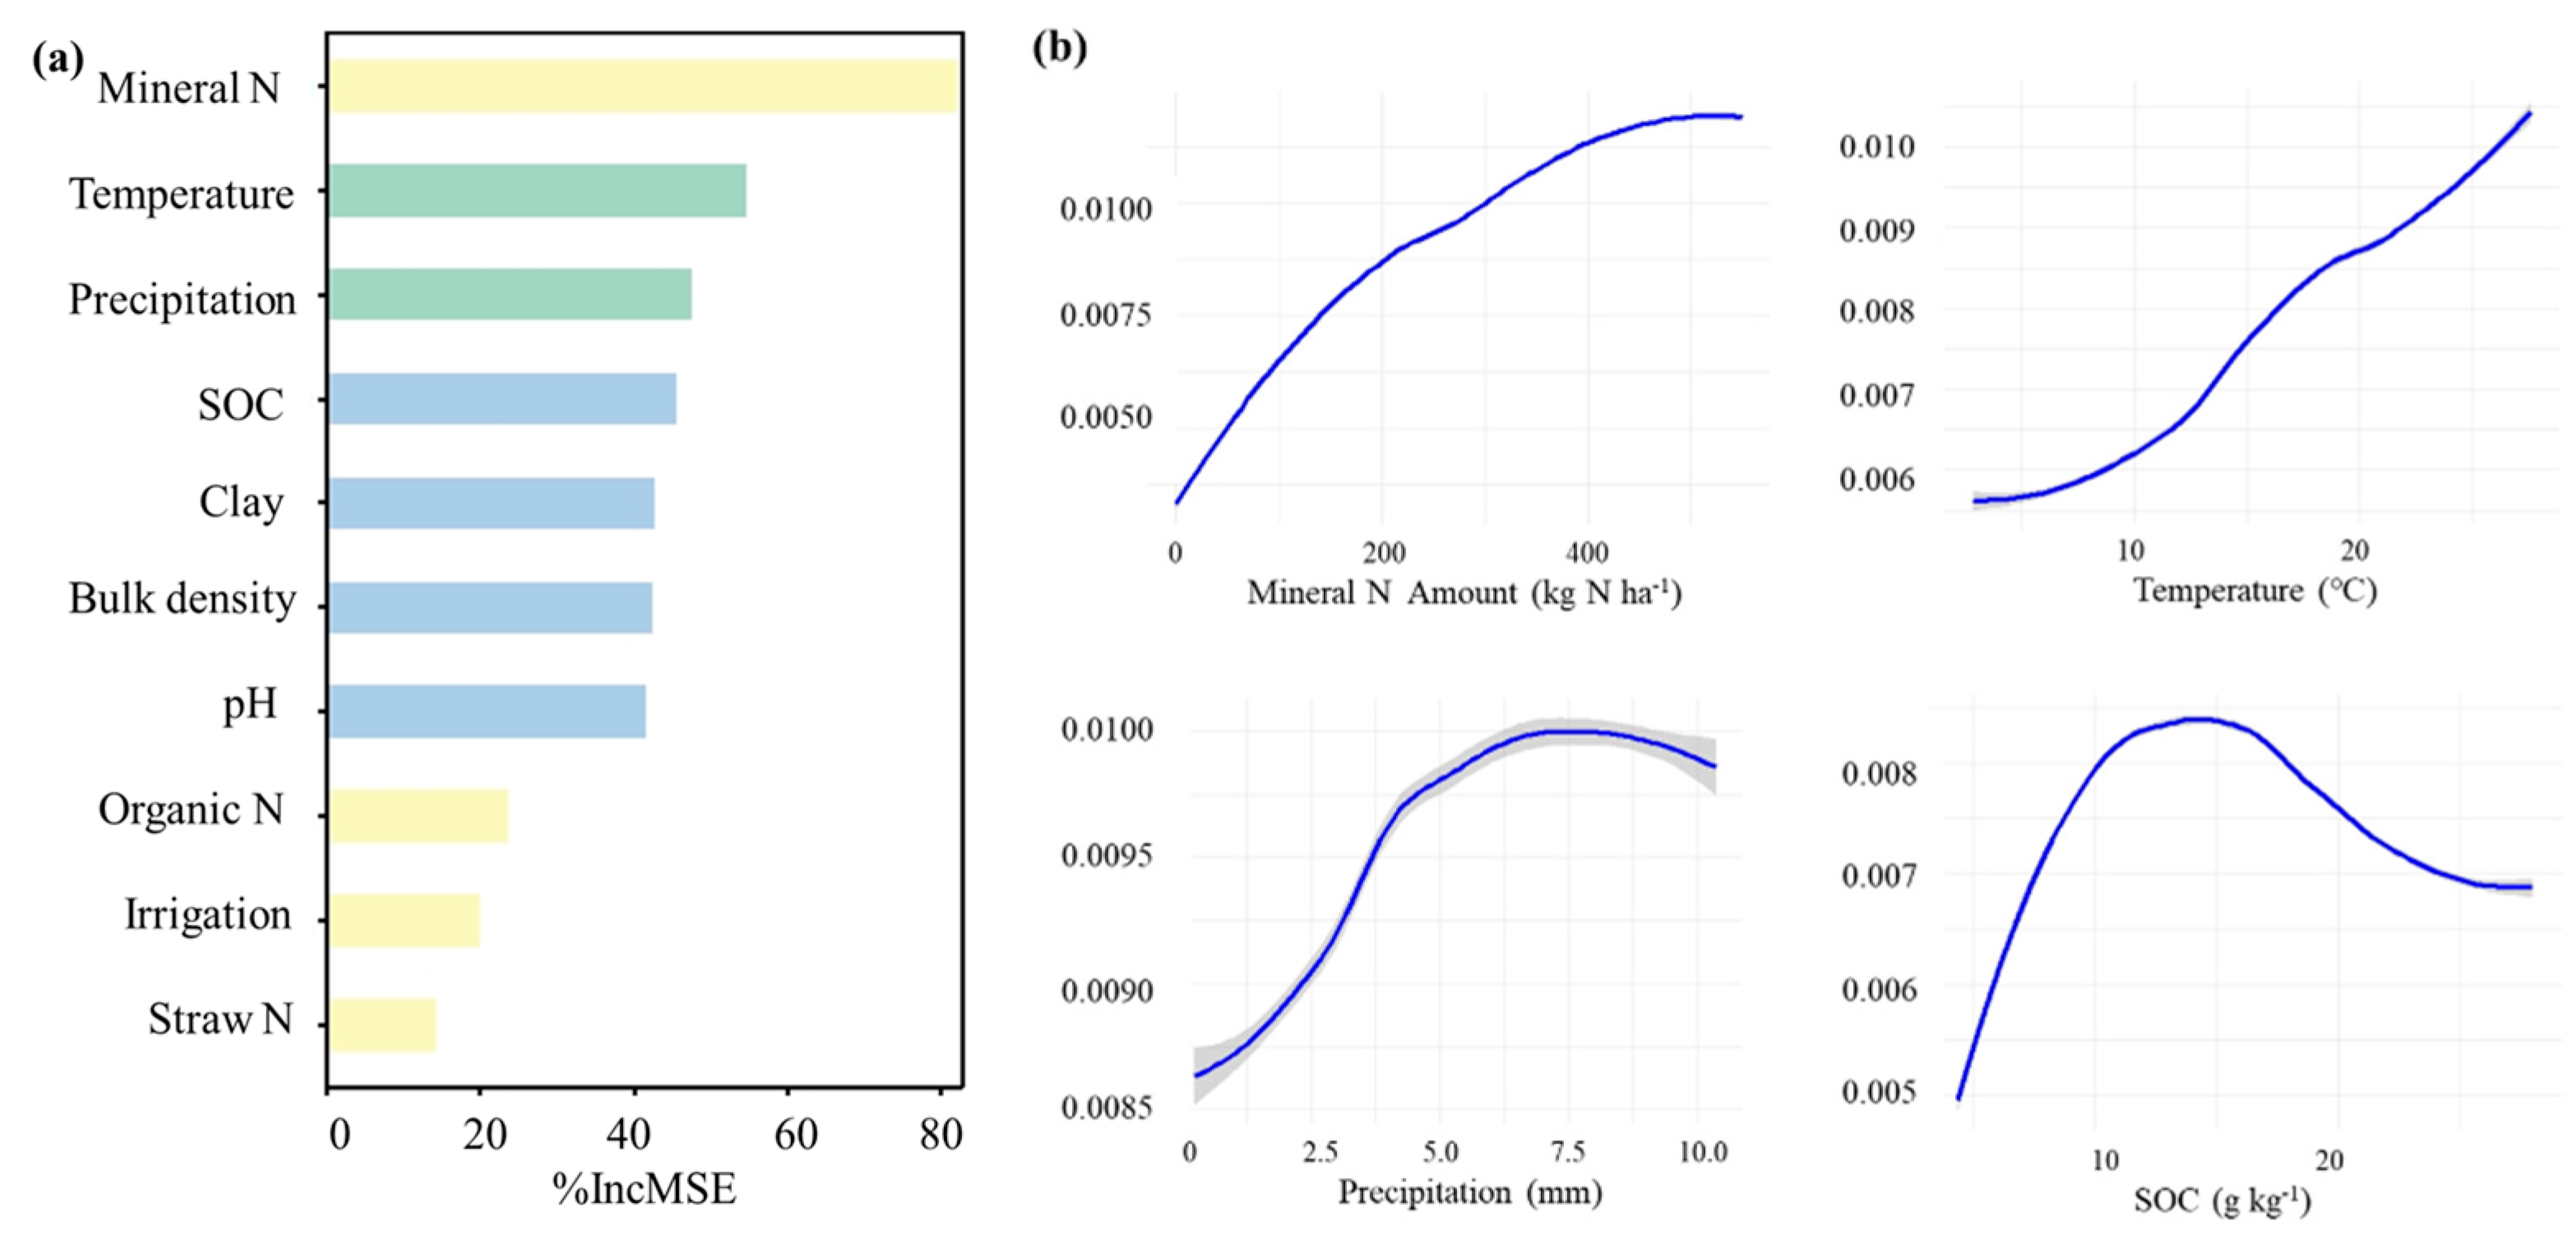
3.1. Model Performance and Interpretability

The four models underwent refinement to achieve their most effective results by fine-tuning parameters, as shown in Figure 2. The RF model excelled among them, boasting a higher coefficient of determination (R2) of 0.66 and a lower RMSE of 0.008 kg ha⁻1 compared with the other models. Due to these superior results, the RF model was chosen for use in this study to project N2O emissions from Chinese upland fields under both current and future climate scenarios.
Variable importance analysis revealed that mineral N fertilization rate was the most significant driver of N2O emissions from upland fields, with the highest percentage increase in the mean squared error (%IncMSE) value of 82.3% (Figure 3a). The climate variables showed higher importance in driving N2O emission than soil properties.
The emission of N2O consistently increased with the continuous application of mineral N fertilizer (Figure 3b). In contrast, the effect of straw incorporation on N2O emissions exhibited a negative relationship when the straw application was below 200 kg N ha−1, and the emissions did not increase further with the addition of straw N (Figure S3).
Variable importance analysis showed that the average temperature during the growing season is more influential than precipitation (Figure 3a). Overall, both the average temperature and precipitation during the growing season were positively correlated with N2O emissions. However, when the average precipitation exceeded 7.5 mm, N2O emissions did not change significantly.
Initial SOC had the greatest impact on soil N2O emissions compared to other soil properties. When SOC was below 15 g/kg, it was positively correlated with N2O emissions. However, when SOC exceeded 15 g/kg, N2O emissions tended to decrease gradually. Bulk density was found to be negatively correlated with N2O emissions. N2O emissions were highest when the soil was neutral. When the clay content was below 20%, N2O emissions were negatively correlated with clay content, but they became positively correlated when the clay content was higher. Compared to acidic soil conditions, neutral soils were more conducive to N2O emissions (Figure S3).

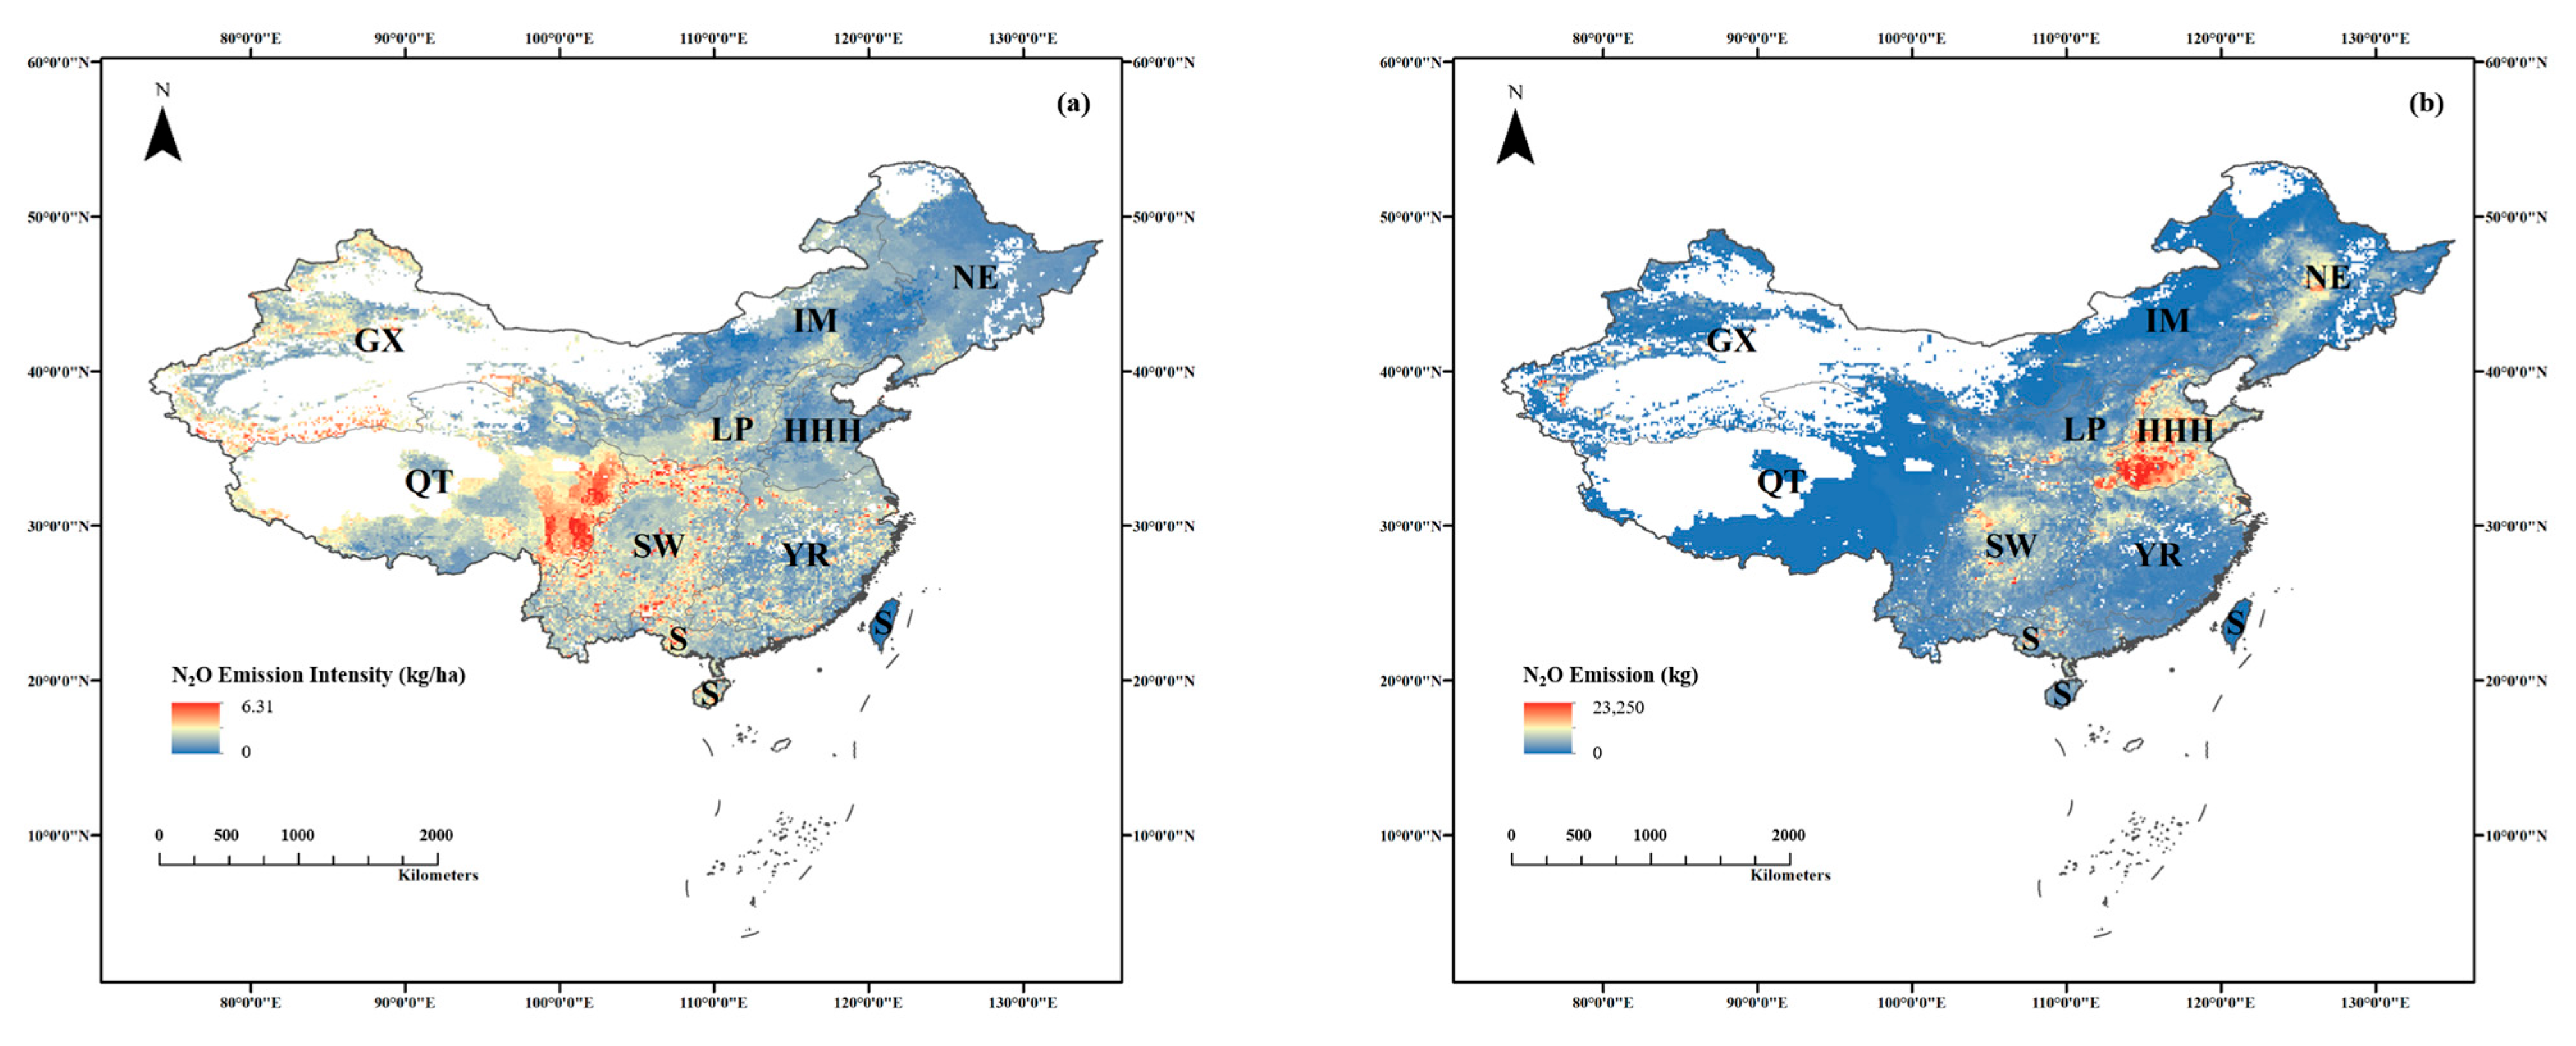
3.2. N2O Emissions from Upland Fields in 2020

Fruit cultivation exhibited the highest N2O emission intensity at 3.4 kg/ha, while soybean showed the lowest emission intensity at 0.76 kg/ha (Table 1). In total, N2O emissions from China’s upland fields reached 183 Gg, with an average emission intensity of 1.41 kg/ha, as presented in Table 1 and Table 2. Among various crop groups, grain crops had the highest N2O emissions, totaling 79.6 Gg; sugar crops had the lowest, at 3.78 Gg. Notably, maize cultivation accounted for the largest share of these emissions with 49.9 Gg, followed by sugar beet cultivation, which contributed the least with 0.27 Gg. Remarkably, fruit cultivation was a significant contributor to the total N2O emissions, emitting 43.1 Gg, which represented 23.6% of the overall emissions.
The spatial distribution of N2O emissions across the country displayed substantial heterogeneity, as depicted in Figure 4. In terms of agricultural regions, the QT and S regions boasted the highest N2O emission intensities at 2.37 kg/ha and 1.57 kg/ha, respectively. These intensities exceeded those of other regions surveyed, with the IM and NE regions showing the lowest emissions at 1.10 kg/ha and 1.16 kg/ha (Table 1). Regarding total emissions, the SW and HHH regions emerged as the leading emitters, contributing 38.4 Gg and 38.2 Gg, respectively, and collectively accounting for nearly 42% of the national total (Table 2). The YR and NE regions followed, with emissions of 29.8 Gg and 29.1 Gg, respectively, ranking these regions as third and fourth in terms of contributions. In contrast, the QT region had the lowest reported N2O emissions, contributing a mere 1.35% to the national total (Figure 4).

3.3. Impacts of Future Climate Change on N2O Emissions from Upland Fields in China

Under each of the RCP scenarios, projections indicated a rise in cumulative N2O emissions from China’s upland fields attributable to climate change, as detailed in Table 3. Notably, RCP8.5 was anticipated to have the most pronounced increment, increasing by 5.9% to reach 10.83 Gg over emissions recorded in 2020, whereas RCP6.0 projected the slightest augmentation at a rise of 2.8%. Moreover, the impact of future climate scenarios on N2O emissions varied significantly across different agricultural regions (Figure 5 and Figure S4). The S region emerged as the area most affected, witnessing the largest increases across all scenarios, with the growth rate spanning 6.2% to 10.4%. It was closely followed by the HHH region, where the increases ranged from 5.7% to 9.8%.
N2O emissions across all crop types witnessed the most substantial increase under future climate change (Table S1). Under RCP8.5, grain crops exhibited the most significant surge in emissions, amounting to 1.48 Gg. In contrast, the increase in N2O emissions from cash crop cultivation, triggered by rising temperatures and increasing precipitation, was the least, standing at only 0.29 Gg.

3.4. Mitigation Potential Under Improved Nitrogen Management

Under current climate conditions, the adoption of an improved N fertilization strategy resulted in a significant reduction of 12.96 Gg in N2O emissions nationwide, as shown in Table 2 and Table 4. Grain crops witnessed the most substantial reduction, amounting to 4.64 Gg, which accounted for 35.8% of the total emission reduction. In contrast, the emission reduction effect for cash crops was the weakest, with only 0.39 Gg of reduction (Table 2 and Table S2). At the regional scale, the NE region showed the highest mitigation potential, achieving a reduction rate of 21.8%. The SW region closely followed, with a reduction of 21.3% (Table 4; Figure S5). However, the improved N strategy had the least mitigation effect in the QT region, contributing only a 0.36% reduction (Table 4; Figure S5).
Under different climate change scenarios, the reduction in emissions with optimized management measures compared to conventional management measures varied between 13.44 Gg and 13.59 Gg, which was higher than that under current climate conditions. This prediction demonstrated that it is possible to offset the negative impacts of future climate change while still achieving some degree of emission reduction through reasonable N fertilizer management measures. Even so, N2O emissions from upland fields under optimized management measures under future climate change scenarios (174.54–180.25 Gg) still exceeded those under current climate conditions with the same optimized management (169.93 Gg). This indicates that climate change may continue to undermine the mitigation efforts of optimized agricultural measures.

4. Discussion

4.1. Drivers of N2O Emission from Upland Fields

The variable importance analysis revealed that the mineral N fertilizer application rate emerged as the predominant determinant of N2O emissions, with organic N inputs demonstrating comparatively low explanatory significance [12,45]. Both N sources exhibited nonlinear positive correlations with N2O emission fluxes, consistent with established findings in the field [16]. Moreover, our findings revealed that the integrated use of crop straw with synthetic nitrogen fertilizers effectively reduced N2O emissions in dryland agriculture systems, which agreed with the meta-analysis results of Shan and Yan [46]. This phenomenon is likely derived from the microbial N immobilization triggered by the incorporation of cereal straws with high C:N ratios. According to Yao et al. [47], the combined application of a high C:N ratio of straw and synthetic nitrogen fertilizer can significantly suppress N2O emissions. They hypothesized that this mitigation effect is primarily mediated through the decreased availability of NH4⁺ and NO3⁻, thereby limiting substrates for nitrification and denitrification processes responsible for N2O production.
Not only management practices but also climate variables significantly affect the emission of N2O. This study found that air temperature had a higher impact than precipitation, and this was due to denitrification being the primary process for N2O production, which is highly sensitive to rising temperatures [48]. In addition, N2O emissions were found to be positively correlated with the rising temperature. On the one hand, an increase in temperature serves to enhance the metabolic activities of soil denitrifiers. On the other hand, higher temperatures accelerate the decomposition of organic matter in the soil. As organic matter breaks down at a faster rate, it releases more substrates that are essential for the denitrification process [49]. Precipitation also exhibited a positive relationship with soil N2O emission. When daily precipitation was around 7.5 mm, the stimulation effect was the greatest. Increasing precipitation enhanced soil moisture, creating an anoxic soil environment that favored the denitrification process, resulting in continuous N2O emissions [50,51].
Soil properties were the third most important variable in determining N2O emissions. Initial SOC was the most important variable, followed by clay content and bulk density. SOC had a positive correlation with N2O emission. A meta-analysis by Mei et al. [52] obtained similar results to ours, and they found that higher SOC promoted microbial activities related to the denitrification process, thereby causing more N2O emissions. When the clay content in the soil was less than 20%, there was a negative correlation between N2O emissions and clay content (Figure S3). This is because clay particles have a strong ability to retain N, which can fix more N in the soil. As a result, the amount of N available for N2O production is reduced, thereby suppressing N2O emissions. However, when the clay content exceeded 20%, the relationship turned positive. This might be due to the fact that higher clay content leads to lower soil porosity, creating a relatively anaerobic environment. In such an environment, the activity of denitrifying bacteria is favored, which in turn promotes the production of N2O. Soil pH showed a positive correlation with N2O emissions (Figure S3). Both autotrophic nitrifiers and heterotrophic denitrifiers functioned more effectively at near-neutral pH compared to acidic pH conditions [53].

4.2. Characteristics of N2O Emissions and Mitigation Potential

In recent years, several studies have estimated N2O emissions from cropland in China, allowing for a comparison with the estimates of N2O emissions from upland crops in this study after deducting emissions from rice. Previous studies have reported a wide range of total N2O emissions from Chinese upland fields, with estimates varying from 253 to 464.2 Gg [12,13,54]. Notably, these estimates exceed the 2020 emission estimate of 183 Gg obtained in this study (Table S3). Regarding the reasons, inter-annual variations in fertilizer application have certainly led to differences in N2O emissions. After 2015, China implemented a “zero growth” policy for chemical fertilizers, and the use of N fertilizers has decreased year by year, which has inevitably reduced N2O emissions. Li et al. [55], using the emission factor method, estimated that N2O emissions from Chinese cropland peaked in 2015 and decreased by 17% in 2022, although their estimate is still higher than this study’s. On the other hand, differences in methods also inevitably lead to differences in estimation results. Most of the existing studies have used the emission factor method, which only considers the impact of N input. However, soil properties and climate conditions also significantly affect N2O emissions, as this study’s variable importance analysis shows that temperature, rainfall, and SOC content, among others, all have a significant impact. Not considering these factors will inevitably lead to differences in estimation results. Moreover, the impact of N input and other driving factors on N2O emissions was nonlinear, which is why the estimation results of this study’s Random Forest model differ from other linear methods (Figure 3). In any case, N2O emissions from upland crop fields in China are higher than in other countries (e.g., 59.08 Gg for Australia and 78.9 Gg for Canada), making reducing N2O emissions a huge challenge.
The emission intensity of upland crop production exhibited marked heterogeneity across crop types, with soybean cultivation demonstrating the lowest carbon footprint (0.76 kg CO2-eq/kg) attributable to the biological N fixation capacity inherent in leguminous crops. In contrast, fruit production manifested the highest emission intensity (3.41 kg CO2-eq/kg), a phenomenon primarily attributable to excessive N application rates in Chinese orchards (403 kg N/ha on average) that surpass the global average (117 kg N/ha), compounded by the geographical concentration of ~40% of orchards in subtropical zones along the Yangtze River and southwestern China [56]. These regions’ characteristic humid subtropical climate amplifies nitrification–denitrification processes through microclimate interactions, elevating baseline N2O emissions compared to temperate regions. This spatial–temporal synergy has been formally recognized by the IPCC (2019) through the introduction of climate-zone-specific emission factors [57].
Variable importance analysis revealed climatic factors exerted a significant impact on N2O emissions, corresponding to previous predictions that climate change will substantially intensify soil-derived N2O fluxes [58]. Model simulations projected a 2.80–5.92% elevation in N2O emissions from Chinese upland fields across all RCP scenarios by 2050 relative to 2020 baseline levels, markedly exceeding the 0.6–1.2% increment predicted for paddy rice fields [33]. The emission amplification exhibited pronounced scenario dependence, with RCP8.5 demonstrating the most drastic enhancement. This divergence principally stems from the exceptionally intensified warming (a 1.11 °C increase) and precipitation regime shifts (a 0.13 mm d−1 decrease) under RCP8.5 relative to other scenarios [59]. Conversely, the rate of increase in N2O emissions under RCP6.0 was the lowest. This is because the future climate change projected under RCP6.0 is the mildest among all the RCP scenarios, with a 0.51 °C increase and a 0.12 mm d−1 reduction (Tables S4 and S5).
The impacts of climate change vary across different regions and crops. Taking RCP8.5 as an example, the agricultural regions of HHH, YR, and SW were hotspots for climate change impacts. In the HHH region, the emissions from grain crops and vegetable cultivation witnessed the most significant increase, whereas, in the S region, sugar crops and fruit cultivation showed the highest emission growth. The meteorological variables in the HHH region changed relatively dramatically (Tables S4 and S5), and the crop-growing areas were extensive. The combined effect of these two factors stimulated a substantial increase in emissions. Likewise, in the S region, precipitation underwent a remarkable change. When combined with the larger cultivation areas of fruit and sugar crops compared to other agricultural regions, this ultimately led to the most prominent increase in emissions. This study emphasizes the necessity of formulating tailored mitigation strategies. Given the diverse responses of N2O emissions from different crops to climate change, the specific characteristics of both crops and regions must be taken into account.
In China’s agricultural sector, studies have demonstrated that over 50% of applied N fertilizer remains unutilized by crops, creating substantial environmental burdens through subsequent N2O emissions [13]. In response to this challenge, the Chinese government has implemented policy initiatives since 2015 promoting N-use optimization. This study developed crop-specific N reduction strategies under different climate change scenarios. The results revealed that optimized N management achieved a 7.09% reduction in N2O emissions compared to 2020 baseline levels. However, under the high-emission RCP8.5 scenario, this mitigation efficiency decreased to 6.1%. Despite these reduction efforts, the cultivation of grain crops, fruits, and vegetables still emerged as the primary source of N2O emissions. These findings suggest that climate change may weaken N2O emission reduction efforts through improved management in China’s upland fields.

4.3. Uncertainty and Limitations

The N2O machine learning model developed in this study had a high R2 of 0.66 and a low RMSE of 0.008 kg ha−1, outperforming previous emission factors and linear regression models [12,60]. However, this study is not without limitations in the following aspects, which may offer valuable insights for future research.
Model uncertainty was primarily associated with the data quality within our database. When dealing with studies that failed to report specific soil properties or climate data, we resorted to matching them via spatial databases. Nevertheless, these matched data may not accurately represent the actual conditions of the experimental sites. As previously analyzed, both soil properties and climate exert a substantial influence on N2O emissions, which ultimately gives rise to model uncertainty. In addition, we also observed an uneven distribution of our data. For example, the majority of our experimental sites were concentrated in the HHH, YR, and LP agricultural regions, while data from other regions were either limited or completely absent (Table S6). A significant data gap also existed for non-food crops, including cash crops and vegetables, where observational data were extremely limited or nonexistent. This imbalance led to model bias during the model-building process. Enhancing the observational data through targeted experiments in these regions and crop types will likely lead to significant improvements in the model’s simulation performance.
Undoubtedly, the choice of a model significantly impacts the predictive results. Despite the RF model demonstrating improved performance, it struggled to account for specific fluctuations. Machine learning algorithms are often regarded as “black boxes.” They primarily build models through data-driven methods without directly incorporating ecological principles into the modeling process [61]. Therefore, they cannot accurately capture the response of soil N2O emissions to all variables. To bridge this gap, future research may combine mechanistic biogeochemical principles with machine learning frameworks. This hybrid model would leverage the predictive advantages of data-driven methods while retaining the explanatory power of process-based theories, thus achieving accurate predictions and actionable insights into the drivers of emissions.
The consideration of variables could also affect the simulation performance of the model. Due to the lack of data, atmospheric CO2 concentration was excluded from this model. Although the responses of N2O emissions to elevated CO2 concentrations varied across different terrestrial ecosystems, N2O emissions generally increased with rising atmospheric CO2 levels in N-non-limited agricultural systems [62]. Elevated CO2 stimulated soil N2O emissions by enhancing soil microbial activities and soil respiration, leading to soil anoxia [63]. However, more field experiments on increased CO2 concentration are required before incorporating it as a model variable. Research by Mei et al. [52] and Van Kessel et al. [64] indicated that soil N2O emissions are influenced by factors such as fertilization practices, tillage systems, and crop residue management, as evidenced by data analysis. However, the scarcity of observational data on these management practices prevented us from incorporating these variables into the model. Enriching observational data under various scenarios would help build models with broader predictive capabilities, thereby expanding the applicability of the model.
Furthermore, predicting future climate scenarios and their precise impact on N2O emissions is hindered by significant uncertainties. A previous study revealed that the variability in GHG emissions from paddy fields among different GCMs was comparable to, or even exceeded, the variability resulting from the four RCPs [33]. This disparity was attributed to the differing radiative forcing agents considered by the GCMs. A comparison of various machine learning models and GCMs underscored the importance of model selection, whether GCMs or GHG models, in projecting the impacts of future climate change. To address this challenge, accurately quantifying the overall uncertainty associated with input data and model performance will be crucial in identifying strategies to reduce uncertainty and improve the reliability of climate change impact assessments in the future.

5. Conclusions

The Random Forest model performed best in predicting N2O emissions from Chinese upland fields. The N application rate was the most important driving factor affecting N2O emissions, followed by climate and soil properties. In 2020, the total N2O emissions from Chinese upland fields were estimated to be 183 Gg, with a national average emission intensity of 1.41 kg/ha. Across all climate change scenarios, there was an observed increase in N2O emissions, ranging from 2.8% under the RCP6.0 scenario to 5.9% under RCP8.5. Scenario analysis suggested that curtailing excessive mineral N fertilizer application could lead to a 7% reduction in N2O emissions under current climate conditions. However, climate change may offset N2O emission reductions achieved through enhanced N management compared to reductions achieved under present climatic conditions.

Supplementary Materials

The following supporting information can be downloaded at: https://www.mdpi.com/article/10.3390/agronomy15061447/s1, Figure S1: Distribution of experiment sites in different climate zones and soil types; Figure S2: Spatial distribution of climatic stations used in this study; Figure S3: Marginal effects of other variables; Figure S4: Spatial distribution of the impact of RCP2.6 (a), RCP4.5 (b) and RCP6.0 (c) scenarios on N2O emissions; Figure S5: Spatial distribution of N2O mitigation effects under optimized nitrogen management; Table S1: N2O emissions (Gg N2O) from different upland crop groups under RCP8.5; Table S2: N2O emissions (Gg N2O) from different upland crop groups under optimized nitrogen management in 2020; Table S3: Previous estimate of N2O emissions in China’s upland fields; Table S4: Annual average temperature (°C) of different agricultural regions under current climate conditions in 2020 and future climate scenarios in 2050; Table S5: Average daily precipitation (mm d−1) of different agricultural regions under current climate conditions in 2020 and future climate scenarios in 2050; Table S6: Observation counts by crop type and agricultural region.

Author Contributions

Conceptualization, K.C.; Methodology, T.L., Y.L. and K.C.; Validation, Y.L. and W.C.; Formal analysis, T.L.; Data curation, Y.L.; Writing—original draft, T.L.; Writing—review & editing, J.Z., L.L. and K.C.; Supervision, K.C. All authors have read and agreed to the published version of the manuscript.

Funding

This work was financially supported by the Natural Science Foundation of China under grant no. 42277020. This study was also supported by the Technology Innovation Special Fund of Jiangsu Province for Carbon Dioxide Emission Peaking and Carbon Neutrality (BE2022423).

Data Availability Statement

Data are contained within the article and Supplementary Materials.

Acknowledgments

Global climate model data were extracted and converted by Jie Pan from the Institute of Environment and Sustainable Development in Agriculture, Chinese Academy of Agricultural Sciences.

Conflicts of Interest

The authors have no conflicts of interest to declare.

References

  1. IPCC. Summary for policymakers. In Climate Change 2021: The Physical Science Basis. Contribution of Working Group I to the Sixth Assessment Report of the Intergovernmental Panel on Climate Change; Masson-Delmotte, V., Zhai, P., Pirani, A., Connors, S.L., Péan, C., Berger, S., Caud, N., Chen, Y., Goldfarb, L., Gomis, M.I., et al., Eds.; Cambridge University Press: Cambridge, UK, 2021; pp. 923–1054. [Google Scholar]
  2. Ravishankara, A.R.; Daniel, J.S.; Portmann, R.W. Nitrous oxide (N2O): The dominant ozone-depleting substance emitted in the 21st century. Science 2009, 326, 123–125. [Google Scholar] [CrossRef] [PubMed]
  3. Paustian, K.; Lehmann, J.; Ogle, S.; Reay, D.; Robertson, G.P.; Smith, P. Climate-smart soils. Nature 2016, 532, 49–57. [Google Scholar] [CrossRef] [PubMed]
  4. Alexandratos, N.; Bruinsma, J. World Agriculture Towards 2030/2050: The 2012 Revision. 2012. Available online: https://www.fao.org/4/ap106e/ap106e.pdf (accessed on 6 June 2025).
  5. Liang, M.; Zhou, Z.; Ren, P.; Xiao, H.; Hu, Z.; Piao, S.; Tian, H.; Tong, Q.; Zhou, F.; Wei, J.; et al. Four decades of full-scale nitrous oxide emission inventory in China. Natl. Sci. Rev. 2024, 11, nwad285. [Google Scholar] [CrossRef]
  6. Shang, Z.; Zhou, F.; Smith, P.; Saikawa, E.; Ciais, P.; Chang, J.; Tian, H.; Del Grosso, S.J.; Ito, A.; Chen, M.; et al. Weakened growth of cropland-N2O emissions in China associated with nationwide policy interventions. Glob. Chang. Biol. 2019, 25, 3706–3719. [Google Scholar] [CrossRef]
  7. Wrage-Mönnig, N.; Horn, M.A.; Well, R.; Müller, C.; Velthof, G.; Oenema, O. The role of nitrifier denitrification in the production of nitrous oxide revisited. Soil Biol. Biochem. 2018, 123, A3–A16. [Google Scholar] [CrossRef]
  8. Tian, H.; Yang, J.; Xu, R.; Lu, C.; Canadell, J.G.; Davidson, E.A.; Jackson, R.B.; Arneth, A.; Chang, J.; Ciais, P.; et al. Global soil nitrous oxide emissions since the preindustrial era estimated by an ensemble of terrestrial biosphere models: Magnitude, attribution, and uncertainty. Glob. Chang. Biol. 2019, 25, 640–659. [Google Scholar] [CrossRef]
  9. IPCC. 2006 IPCC Guidelines for National Greenhouse Gas Inventories; Prepared by the National Greenhouse Gas Inventories Programme; Eggleston, H.S., Buendia, L., Miwa, K., Ngara, T., Tanabe, K., Eds.; IGES: Kanagawa, Japan, 2006. [Google Scholar]
  10. Smith, K.A.; Mosier, A.R.; Crutzen, P.J.; Winiwarter, W. The role of N2O derived from crop-based biofuels, and from agriculture in general, in Earth’s climate. Philos. Trans. R. Soc. B Biol. Sci. 2012, 367, 1169–1174. [Google Scholar] [CrossRef]
  11. Xu, R.; Tian, H.; Pan, S.; Prior, S.A.; Feng, Y.; Dangal, S.R. Global N2O emissions from cropland driven by nitrogen addition and environmental factors: Comparison and uncertainty analysis. Glob. Biogeochem. Cycles 2020, 34, e2020GB006698. [Google Scholar] [CrossRef]
  12. Yue, Q.; Wu, H.; Sun, J.; Cheng, K.; Smith, P.; Hillier, J.; Xu, X.; Pan, G. Deriving emission factors and estimating direct nitrous oxide emissions for crop cultivation in China. Environ. Sci. Technol. 2019, 53, 10246–10257. [Google Scholar] [CrossRef] [PubMed]
  13. Ma, R.; Yu, K.; Xiao, S.; Liu, S.; Ciais, P.; Zou, J. Data-driven estimates of fertilizer-induced soil NH3, NO and N2O emissions from croplands in China and their climate change impacts. Glob. Chang. Biol. 2022, 28, 1008–1022. [Google Scholar] [CrossRef]
  14. Bouwman, A.F.; Boumans, L.J.M.; Batjes, N.H. Modeling global annual N2O and NO emissions from fertilized fields. Glob. Biogeochem. Cycles 2002, 16, 28-1–28-9. [Google Scholar] [CrossRef]
  15. Shcherbak, I.; Millar, N.; Robertson, G.P. Global metaanalysis of the nonlinear response of soil nitrous oxide (N2O) emissions to fertilizer nitrogen. Proc. Natl. Acad. Sci. USA 2014, 111, 9199–9204. [Google Scholar] [CrossRef] [PubMed]
  16. Zhou, F.; Shang, Z.; Zeng, Z.; Piao, S.; Ciais, P.; Raymond, P.A.; Wang, X.; Wang, R.; Chen, M.; Yang, C.; et al. New model for capturing the variations of fertilizer-induced emission factors of N2O. Glob. Biogeochem. Cycles 2015, 29, 885–897. [Google Scholar] [CrossRef]
  17. Wang, Q.; Zhou, F.; Shang, Z.; Ciais, P.; Winiwarter, W.; Jackson, R.B.; Tubiello, F.N.; Janssens-Maenhout, G.; Tian, H.; Cui, X.; et al. Data-driven estimates of global nitrous oxide emissions from croplands. Natl. Sci. Rev. 2020, 7, 441–452. [Google Scholar] [CrossRef]
  18. Yin, Y.; Wang, Z.; Tian, X.; Wang, Y.; Cong, J.; Cui, Z. Evaluation of variation in background nitrous oxide emissions: A new global synthesis integrating the impacts of climate, soil, and management conditions. Glob. Chang. Biol. 2022, 28, 480–492. [Google Scholar] [CrossRef]
  19. Li, C.; Narayanan, V.; Harriss, R.C. Model estimates of nitrous oxide emissions from agricultural lands in the United States. Glob. Biogeochem. Cycles 1996, 10, 297–306. [Google Scholar] [CrossRef]
  20. Brown, L.; Syed, B.; Jarvis, S.C.; Sneath, R.W.; Phillips, V.R.; Goulding, K.W.T.; Li, C. Development and application of a mechanistic model to estimate emission of nitrous oxide from UK agriculture. Atmos. Environ. 2002, 36, 917–928. [Google Scholar] [CrossRef]
  21. Wang, J.; Kuhnert, M.; Abdalla, M.; Smith, P.; Ding, W.; Yan, X.; Zou, J.; Guo, S.; Fan, J.; Jiang, Y.; et al. A Comparison of DNDC and DayCent to Evaluate Greenhouse Gas Emissions from China’s Main Cropping Systems. 2023. Available online: https://ssrn.com/abstract=4354801 (accessed on 6 June 2025).
  22. Jiang, R.; Yang, J.Y.; Drury, C.F.; He, W.; Smith, W.N.; Grant, B.B.; He, P.; Zhou, W. Assessing the impacts of diversified crop rotation systems on yields and nitrous oxide emissions in Canada using the DNDC model. Sci. Total Environ. 2021, 759, 143433. [Google Scholar] [CrossRef]
  23. Shaukat, M.; Muhammad, S.; Maas, E.D.; Khaliq, T.; Ahmad, A. Predicting methane emissions from paddy rice soils under biochar and nitrogen addition using DNDC model. Ecol. Model. 2022, 466, 109896. [Google Scholar] [CrossRef]
  24. dos Reis Martins, M.; Necpalova, M.; Ammann, C.; Buchmann, N.; Calanca, P.; Flechard, C.R.; Hartman, M.D.; Krauss, M.; Le Roy, P.; Mäder, P.; et al. Modeling N2O emissions of complex cropland management in Western Europe using DayCent: Performance and scope for improvement. Eur. J. Agron. 2022, 141, 126613. [Google Scholar] [CrossRef]
  25. Eckl, M.; Roiger, A.; Kostinek, J.; Fiehn, A.; Huntrieser, H.; Knote, C.; Barkley, Z.R.; Ogle, S.M.; Baier, B.C.; Sweeney, C.; et al. Quantifying nitrous oxide emissions in the US Midwest: A top-down study using high resolution airborne in-situ observations. Geophys. Res. Lett. 2021, 48, e2020GL091266. [Google Scholar] [CrossRef]
  26. Abdalla, M.; Wattenbach, M.; Smith, P.; Ambus, P.; Jones, M.; Williams, M. Application of the DNDC model to predict emissions of N2O from Irish agriculture. Geoderma 2009, 151, 327–337. [Google Scholar] [CrossRef]
  27. Uzoma, K.C.; Smith, W.; Grant, B.; Desjardins, R.L.; Gao, X.; Hanis, K.; Tenuta, M.; Goglio, P.; Li, C. Assessing the effects of agricultural management on nitrous oxide emissions using flux measurements and the DNDC model. Agric. Ecosyst. Environ. 2015, 206, 71–83. [Google Scholar] [CrossRef]
  28. Cheng, K.; Ogle, S.M.; Parton, W.J.; Pan, G. Simulating greenhouse gas mitigation potentials for Chinese Croplands using the DAYCENT ecosystem model. Glob. Chang. Biol. 2014, 20, 948–962. [Google Scholar] [CrossRef]
  29. Yue, Q.; Ledo, A.; Cheng, K.; Albanito, F.; Lebender, U.; Sapkota, T.B.; Brentrup, F.; Stirling, C.M.; Smith, P.; Sun, J.; et al. Re-assessing nitrous oxide emissions from croplands across Mainland China. Agric. Ecosyst. Environ. 2018, 268, 70–78. [Google Scholar] [CrossRef]
  30. Kamir, E.; Waldner, F.; Hochman, Z. Estimating wheat yields in Australia using climate records, satellite image time series and machine learning methods. ISPRS J. Photogramm. Remote Sens. 2020, 160, 124–135. [Google Scholar] [CrossRef]
  31. Jiang, Z.; Yang, S.; Smith, P.; Pang, Q. Ensemble machine learning for modeling greenhouse gas emissions at different time scales from irrigated paddy fields. Field Crops Res. 2023, 292, 108821. [Google Scholar] [CrossRef]
  32. Glenn, A.J.; Moulin, A.P.; Roy, A.K.; Wilson, H.F. Soil nitrous oxide emissions from no-till canola production under variable rate nitrogen fertilizer management. Geoderma 2021, 385, 114857. [Google Scholar] [CrossRef]
  33. Sun, J.; Chen, L.; Ogle, S.; Cheng, K.; Xu, X.; Li, Y.; Pan, G. Future climate change may pose pressures on greenhouse gas emission reduction in China’s rice production. Geoderma 2023, 440, 116732. [Google Scholar] [CrossRef]
  34. Mueller, N.D.; Gerber, J.S.; Johnston, M.; Ray, D.K.; Ramankutty, N.; Foley, J.A. Closing yield gaps through nutrient and water management. Nature 2012, 490, 254–257. [Google Scholar] [CrossRef]
  35. Department of Price in National Development and Reform Commission of China (DP-NDRC). Compilation of the National Agricultural Costs and Returns; China Statistics Press: Beijing, China, 2021. [Google Scholar]
  36. Collins, M.; Knutti, R.; Arblaster, J.; Dufresne, J.-L.; Fichefet, T.; Friedlingstein, P.; Gao, X.; Gutowski, W.J.; Johns, T.; Krinner, G.; et al. Chapter 12—Long-term climate change: Projections, commitments and irreversibility. In Climate Change 2013. The Physical Science Basis. IPCC Working Group I Contribution to AR5; IPCC, Ed.; Cambridge University Press: Cambridge, UK, 2013. [Google Scholar]
  37. Wilkinson, L.; Dallal, G.E. Tests of significance in forward selection regression with an F-to-enter stopping rule. Technometrics 1981, 23, 377–380. [Google Scholar] [CrossRef]
  38. Suthaharan, S. Support vector machine. In Machine Learning Models and Algorithms for Big Data Classification: Thinking with Examples for Effective Learning; Springer: Boston, MA, USA, 2016; pp. 207–235. [Google Scholar]
  39. Pekel, E. Estimation of soil moisture using decision tree regression. Theor. Appl. Clim. 2020, 139, 1111–1119. [Google Scholar] [CrossRef]
  40. Breiman, L. Random forests. Mach. Learn. 2001, 45, 5–32. [Google Scholar] [CrossRef]
  41. Cutler, D.R.; Edwards, T.C., Jr.; Beard, K.H.; Cutler, A.; Hess, K.T.; Gibson, J.; Lawler, J.J. Random forests for classification in ecology. Ecology 2007, 88, 2783–2792. [Google Scholar] [CrossRef]
  42. Prasad, A.M.; Iverson, L.R.; Liaw, A. Newer classification and regression tree techniques: Bagging and random forests for ecological prediction. Ecosystems 2006, 9, 181–199. [Google Scholar] [CrossRef]
  43. Philibert, A.; Loyce, C.; Makowski, D. Prediction of N2O emission from local information with Random Forest. Environ. Pollut. 2013, 177, 156–163. [Google Scholar] [CrossRef]
  44. Cook-Patton, S.C.; Leavitt, S.M.; Gibbs, D.; Harris, N.L.; Lister, K.; Anderson-Teixeira, K.J.; Briggs, R.D.; Chazdon, R.L.; Crowther, T.W.; Ellis, P.W.; et al. Mapping carbon accumulation potential from global natural forest regrowth. Nature 2020, 585, 545–550. [Google Scholar] [CrossRef]
  45. Wang, J.; Xiong, Z.; Yan, X. Fertilizer-induced emission factors and background emissions of N2O from vegetable fields in China. Atmos. Environ. 2011, 45, 6923–6929. [Google Scholar] [CrossRef]
  46. Shan, J.; Yan, X. Effects of crop residue returning on nitrous oxide emissions in agricultural soils. Atmos. Environ. 2013, 71, 170–175. [Google Scholar] [CrossRef]
  47. Yao, Z.; Yan, G.; Zheng, X.; Wang, R.; Liu, C.; Butterbach-Bahl, K. Straw return reduces yield-scaled N2O plus NO emissions from annual winter wheat-based cropping systems in the North China Plain. Sci. Total Environ. 2017, 590, 174–185. [Google Scholar] [CrossRef]
  48. Butterbach-Bahl, K.; Baggs, E.M.; Dannenmann, M.; Kiese, R.; Zechmeister-Boltenstern, S. Nitrous oxide emissions from soils: How well do we understand the processes and their controls? Philos. Trans. R. Soc. B Biol. Sci. 2013, 368, 20130122. [Google Scholar] [CrossRef] [PubMed]
  49. Cui, P.; Fan, F.; Yin, C.; Song, A.; Huang, P.; Tang, Y.; Zhu, P.; Peng, C.; Li, T.; Wakelin, S.A.; et al. Long-term organic and inorganic fertilization alters temperature sensitivity of potential N2O emissions and associated microbes. Soil Biol. Biochem. 2016, 93, 131–141. [Google Scholar] [CrossRef]
  50. Bollmann, A.; Conrad, R. Influence of O2 availability on NO and N2O release by nitrification and denitrification in soils. Glob. Chang. Biol. 1998, 4, 387–396. [Google Scholar] [CrossRef]
  51. Abalos, D.; Jeffery, S.; Drury, C.F.; Wagner-Riddle, C. Improving fertilizer management in the US and Canada for N2O mitigation: Understanding potential positive and negative side-effects on corn yields. Agric. Ecosyst. Environ. 2016, 221, 214–221. [Google Scholar] [CrossRef]
  52. Mei, K.; Wang, Z.; Huang, H.; Zhang, C.; Shang, X.; Dahlgren, R.A.; Zhang, M.; Xia, F. Stimulation of N2O emission by conservation tillage management in agricultural lands: A meta-analysis. Soil Tillage Res. 2018, 182, 86–93. [Google Scholar] [CrossRef]
  53. Chen, H.; Li, X.; Hu, F.; Shi, W. Soil nitrous oxide emissions following crop residue addition: A meta-analysis. Glob. Chang. Biol. 2013, 19, 2956–2964. [Google Scholar] [CrossRef]
  54. Cui, X.; Shang, Z.; Xia, L.; Xu, R.; Adalibieke, W.; Zhan, X.; Smith, P.; Zhou, F. Deceleration of cropland-N2O emissions in China and future mitigation potentials. Environ. Sci. Technol. 2022, 56, 4665–4675. [Google Scholar] [CrossRef]
  55. Li, Z.; Hong, S.; Sun, Z.; Cong, N.; Yan, Y.; Li, F.; Gao, Y.; Sun, Y.; Chen, Y.; Chen, Y.; et al. Turning point of direct N2O emissions in China’s croplands dominated by reduced fertilizer usage since 2015. Agric. Ecosyst. Environ. 2025, 388, 109655. [Google Scholar] [CrossRef]
  56. MARA. Data on Key Agricultural Product Futures Prices and More. 2023. Available online: http://zdscxx.moa.gov.cn:8080/nyb/pc/frequency.jsp (accessed on 6 June 2025).
  57. IPCC. Technical summary. In IPCC Special Report on the Ocean and Cryosphere in a Changing Climate; Pörtner, H.-O., Roberts, D.C., Masson-Delmotte, V., Zhai, P., Poloczanska, E., Mintenbeck, K., Tignor, M., Alegría, A., Nicolai, M., Okem, A., et al., Eds.; Cambridge University Press: Cambridge, UK, 2019; In Press. [Google Scholar]
  58. Reay, D.S.; Davidson, E.A.; Smith, K.A.; Smith, P.; Melillo, J.M.; Dentener, F.; Crutzen, P.J. Global agriculture and nitrous oxide emissions. Nat. Clim. Chang. 2012, 2, 410–416. [Google Scholar] [CrossRef]
  59. Xu, X.; Ouyang, X.; Gu, Y.; Cheng, K.; Smith, P.; Sun, J.; Li, Y.; Pan, G. Climate change may interact with nitrogen fertilizer management leading to different ammonia loss in China’s croplands. Glob. Chang. Biol. 2021, 27, 6525–6535. [Google Scholar] [CrossRef]
  60. Yue, Q.; Cheng, K.; Ogle, S.; Hillier, J.; Smith, P.; Abdalla, M.; Ledo, A.; Sun, J.; Pan, G. Evaluation of four modelling approaches to estimate nitrous oxide emissions in China’s cropland. Sci. Total Environ. 2019, 652, 1279–1289. [Google Scholar] [CrossRef] [PubMed]
  61. Hassija, V.; Chamola, V.; Mahapatra, A.; Singal, A.; Goel, D.; Huang, K.Z.; Scardapane, S.; Spinelli, I.; Mahmud, M.; Hussain, A. Interpreting black-box models: A review on explainable artificial intelligence. Cogn. Comput. 2024, 16, 45–74. [Google Scholar] [CrossRef]
  62. Wang, X.; Li, Y.E.; Waqas, M.A.; Wang, B.; Hassan, W.; Qin, X. Divergent terrestrial responses of soil N2O emissions to different levels of elevated CO2 and temperature. Oikos 2021, 130, 1440–1449. [Google Scholar] [CrossRef]
  63. Van Groenigen, K.J.; Osenberg, C.W.; Hungate, B.A. Increased soil emissions of potent greenhouse gases under increased atmospheric CO2. Nature 2011, 475, 214–216. [Google Scholar] [CrossRef]
  64. Van Kessel, C.; Venterea, R.; Six, J.; Adviento-Borbe, M.A.; Linquist, B.; van Groenigen, K.J. Climate, duration, and N placement determine N2O emissions in reduced tillage systems: A meta-analysis. Glob. Chang. Biol. 2013, 19, 33–44. [Google Scholar] [CrossRef]
Figure 1. Spatial distribution of experimental sites in this study. Note: NE: northeast; IM: Inner Mongolia and along the Great Wall; HHH: Huang–Huai–Hai; LP: Loess Plateau; YR: Yangtze River; SW: southwest; S: South; GX: Gansu–Xinjiang; QT: Qinghai–Tibet.
Agronomy 15 01447 g001
Figure 2. Comparison of observed and simulated daily N2O fluxes ((a), Random Forest; (b), Decision Tree Regression; (c), Stepwise Regression Model; (d), Support Vector Machine).
Agronomy 15 01447 g002
Figure 3. Importance of variables (a) and marginal effects of key variables (b). Note: Mineral N: mineral fertilizer nitrogen input; Organic N: organic fertilizer nitrogen input; Straw N: crop straw nitrogen input.
Agronomy 15 01447 g003
Figure 4. Spatial distribution of N2O emissions from Chinese upland fields. (a) Per-hectare intensity; (b) total emissions per grid (5′ × 5′ resolution). Note: NE: northeast; IM: Inner Mongolia and along the Great Wall; HHH: Huang–Huai–Hai; LP: Loess Plateau; YR: Yangtze River; SW: southwest; S: south; GX: Gansu–Xinjiang; QT: Qinghai–Tibet.
Agronomy 15 01447 g004
Figure 5. Spatial distribution of the impact of RCP8.5 scenario on N2O emissions. Note: NE: northeast; IM: Inner Mongolia and along the Great Wall; HHH: Huang–Huai–Hai; LP: Loess Plateau; YR: Yangtze River; SW: southwest; S: south; GX: Gansu–Xinjiang; QT: Qinghai–Tibet.
Agronomy 15 01447 g005
Table 1. The emission intensities (kg N2O/ha) of different upland crops in 2020.
RegionWheatMaizeSoybeanGroundnutRapeseedCottonSugarcaneSugar BeetPotatoTobaccoFruitsVegetablesAll Crops
NE1.111.240.781.090.791.153.161.661.280.742.561.031.16
IM1.081.070.540.860.631.370.501.201.090.462.150.961.10
HHH1.211.060.701.601.061.522.600.740.861.203.561.411.28
LP1.401.410.811.311.211.713.021.721.510.892.851.231.54
YR1.441.040.731.271.332.392.460.970.750.903.460.851.48
SW1.231.420.871.371.411.573.001.251.571.284.540.991.71
S1.011.020.870.711.382.052.580.880.900.903.060.741.57
GX1.471.210.550.590.901.500.001.621.080.602.510.931.53
QT1.481.450.891.151.240.701.991.701.521.163.281.092.37
National1.271.210.761.311.311.582.591.421.351.133.411.001.41
Note: NE: northeast; IM: Inner Mongolia and along the Great Wall; HHH: Huang–Huai–Hai; LP: Loess Plateau; YR: Yangtze River; SW: southwest; S: south; GX: Gansu–Xinjiang; QT: Qinghai–Tibet. “All crops” refers to the average emission intensity of all the crops mentioned before.
Table 2. N2O emissions (Gg N2O) from different agricultural regions in 2020.
RegionGrain CropsOil-Bearing CropsCash CropsSugar CropsFruitsVegetablesAll Crops
NE21.31 4.27 0.15 0.04 1.56 1.75 29.07
IM4.74 0.68 0.01 0.09 1.46 0.88 7.84
HHH23.84 3.88 0.70 0.01 3.78 5.99 38.19
LP8.14 0.79 0.08 0.00 3.26 2.31 14.58
YR6.84 5.87 0.85 0.73 9.90 5.59 29.78
SW9.56 5.50 0.78 0.35 13.30 8.93 38.43
S1.11 0.61 0.04 2.43 5.39 2.25 11.83
GX3.75 0.14 3.55 0.13 2.64 0.49 10.70
QT0.31 0.19 0.00 0.00 1.84 0.14 2.47
National79.60 21.92 6.16 3.78 43.11 28.32 182.89
Note: NE: northeast; IM: Inner Mongolia and along the Great Wall; HHH: Huang–Huai–Hai; LP: Loess Plateau; YR: Yangtze River; SW: southwest; S: south; GX: Gansu–Xinjiang; QT: Qinghai–Tibet. “All crops” refers to the sum of the emissions of all the crops mentioned before.
Table 3. N2O emissions (Gg N2O) under different climate change scenarios in 2050.
RegionRCP2.6RCP4.5RCP6.0RCP8.5
NE30.15 29.80 29.59 30.67
IM7.94 7.98 7.74 7.95
HHH40.86 40.49 40.38 41.91
LP14.74 14.42 14.74 15.31
YR31.12 30.65 30.46 31.38
SW40.74 40.14 40.08 40.68
S12.84 12.90 12.56 13.07
GX10.25 10.33 10.22 10.47
QT2.26 2.31 2.26 2.29
National190.89 189.01 188.03 193.72
Note: NE: northeast; IM: Inner Mongolia and along the Great Wall; HHH: Huang–Huai–Hai; LP: Loess Plateau; YR: Yangtze River; SW: southwest; S: south; GX: Gansu–Xinjiang; QT: Qinghai–Tibet. The RCP (Representative Concentration Pathway) value indicates the radiative forcing level (in W/m2) resulting from the corresponding emission scenario.
Table 4. N2O emissions (Gg N2O) from upland fields with optimized nitrogen management under current and future climate change scenarios in 2050.
Regions2020RCP2.6RCP4.5RCP6.0RCP8.5
NE26.25 27.06 26.71 26.50 27.70
IM6.88 6.95 7.00 6.81 7.02
HHH35.67 38.22 37.80 37.69 39.24
LP13.56 13.72 13.46 13.72 14.29
YR28.02 29.28 28.87 28.63 29.46
SW35.67 37.83 37.29 37.26 37.82
S11.36 12.32 12.39 12.06 12.56
GX10.10 9.69 9.78 9.66 9.93
QT2.42 2.22 2.27 2.22 2.25
National169.93 177.30 175.57 174.54 180.25
Note: NE: northeast; IM: Inner Mongolia and along the Great Wall; HHH: Huang–Huai–Hai; LP: Loess Plateau; YR: Yangtze River; SW: southwest; S: south; GX: Gansu–Xinjiang; QT: Qinghai–Tibet. The RCP (Representative Concentration Pathway) value indicates the radiative forcing level (in W/m2) resulting from the corresponding emission scenario.
Disclaimer/Publisher’s Note: The statements, opinions and data contained in all publications are solely those of the individual author(s) and contributor(s) and not of MDPI and/or the editor(s). MDPI and/or the editor(s) disclaim responsibility for any injury to people or property resulting from any ideas, methods, instructions or products referred to in the content.

