Article

Optimizing Cropping Systems Using Biochar for Wheat Production Across Contrasting Seasons in Ethiopian Highland Agroecology

by
Desalew Fentie
1,2,
Fekremariam Asargew Mihretie
3,
Yudai Kohira
2,
Solomon Addisu Legesse
4,
Mekuanint Lewoyehu
2,5,
Tassapak Wutisirirattanachai
1 and
Shinjiro Sato
2,*
1
College of Agriculture, Food and Climate Sciences, Injibara University, Injibara P.O. Box 40, Ethiopia
2
Graduate School of Science and Engineering, Soka University, Tokyo 192-8577, Japan
3
CSIRO, 2-40 Clunies Ross Street, Acton, ACT 2601, Australia
4
College of Agriculture and Environmental Science, Bahir Dar University, Bahir Dar P.O. Box 79, Ethiopia
5
College of Sciences, Bahir Dar University, Bahir Dar P.O. Box 79, Ethiopia
*
Author to whom correspondence should be addressed.
Agronomy 2025, 15(5), 1227; https://doi.org/10.3390/agronomy15051227
Submission received: 14 April 2025 / Revised: 8 May 2025 / Accepted: 16 May 2025 / Published: 18 May 2025
(This article belongs to the Special Issue Energy Crops in Sustainable Agriculture)

Abstract

:
Biochar has recently emerged as a promising resource for enhancing crop productivity by improving the soil quality. However, there is limited understanding of how varying application rates of biochar combined with inorganic fertilizers impact crop productivity across diverse biophysical contexts. This study investigated the effects of different rates of water hyacinth-derived biochar and fertilizer application on wheat production during the rainy and dry seasons. Four biochar rates (0, 5, 10, and 20 t ha−1), three NPS fertilizer rates (0, 100, and 200 kg ha−1), and two irrigation levels (50% and 100%; for the dry season only) were evaluated for wheat yield and profitability with a randomized complete block design. Soil amendment with both biochar and fertilizer improved wheat grain yield by 6.4% in the dry season and by 173% in the rainy season. Optimal grain yields were achieved with 10 t ha−1 of biochar and 200 kg ha−1 of fertilizer in the rainy season, whereas in the dry season, the highest yield was observed with 20 t ha−1 of biochar and 200 kg ha−1 of fertilizer under the full water requirement. Specifically, for the dry season, plant height, leaf area, soil plant analysis development (SPAD) of leaf value, dry biomass, spike length, spikelet number, and grain number significantly improved due to biochar and fertilizer application. Furthermore, reducing irrigation to 50% did not significantly affect growth and yield components when the soil was amended with biochar. The highest net return (5351 and 3084 USD ha−1) was achieved with 10 t ha−1 of biochar and 200 kg ha−1 of fertilizer during the rainy and dry seasons, respectively. This study suggests that maximum yield improvement and economic benefits can be obtained through the combination of biochar application, appropriate fertilizer rates, and water management strategies in rainfed and irrigated cropping systems.

Graphical Abstract

1. Introduction

Wheat (Triticum aestivum L.), a prominent crop and staple food, originated in the Central Asian region, covers 225 million hectares, and has a global production of 750 million tons [1]. Wheat holds a vital role in ensuring food security in Ethiopia, where it is cultivated across a total area of 1.87 million hectares, with average yields of 3.19 t ha−1 in Ethiopia, more specifically 0.690 million hectares with yields of 2.78 t ha−1 in the Amhara Region and 0.019 million hectares with yields of 2.88 t ha−1 in the Awi Zone during the 2021/2022 cropping season [2].
Wheat is currently produced through rain-fed and irrigation systems in Ethiopia. Ethiopia has significant potential for wheat production under irrigation, with approximately 5.3 million hectares of land suitable for irrigated agriculture utilizing surface, ground, and rainwater sources. However, less than 2% of this potential is utilized [3]. Although the productivity of wheat under irrigation is promising, its yields are currently hampered by water scarcity, particularly during the irrigation season, along with soil acidity and nutrient deficiency [4]. Wheat grain yield decreased by 7.27% to 43.6% under different levels of moisture stress compared to well-watered conditions [5]. Soil acidity also has multiple implications for plant growth and soil fertility, including reduced or lack of response to ammonium phosphate and urea fertilizers. It can lead to stunted root and plant growth due to nutrient deficiencies, resulting in yield reductions ranging from 0% to 50% [6]. According to Eshete et al. [7], a critical review revealed an increasing demand for irrigation water among users, making efficient water use and management a major concern in Ethiopia. Among the various strategies for efficient irrigation water use, management, and soil quality improvement, the application of biochar on the soil combined with inorganic fertilizer has gained attention.
Amending soil with biochar improves its quality not by directly supplying nutrients, but by modifying soil properties such as increasing porosity, specific surface area, and cation exchange capacity, which can enhance soil structure, water retention, and nutrient holding capacity over time. Moreover, this amendment reduces nutrient leaching and ultimately enhances soil fertility [8]. Additionally, in biochar-amended soils, the concentrations of vital nutrients for plant growth and development, such as nitrogen and cations, are elevated. This increase is attributed to biochar’s ability to attract and retain these ions through its functional groups [9]. When biochar is applied to soil alongside inorganic fertilizers like urea and NPK, crop yield can be improved significantly due to enhanced leaf area and increased photosynthetic capacity. This leads to greater dry matter production and assimilates, effectively translocated to the seeds, ultimately resulting in higher yields [8]. Moreover, applying biochar improves soil pH [10], electrical conductivity [11], and cation exchange capacity [12], enhancing nutrient availability and uptake [13], resulting in improved plant growth and yield components. [14]. Considering the above general benefits of biochar, this study was conducted with the hypothesis that the combined application of biochar derived from water hyacinth and inorganic fertilizers will significantly improve wheat crop growth and yield components compared to the application of inorganic fertilizers alone in both rainy and dry seasons. Moreover, the performance of wheat crops grown in biochar-amended soils will not be significantly affected under deficit irrigation conditions compared to non-amended soils, due to biochar’s ability to increase soil moisture retention. Although biochar positively affects soil’s properties, its impact depends on the biochar feedstock, application rate, and production method [15]. Water hyacinth (Eichhornia crassipes), a highly invasive aquatic weed affecting many regions worldwide, including Ethiopia, significantly disrupts socioeconomic activities and watershed ecosystems. Since 2011, its spread in Lake Tana, Ethiopia, has caused considerable damage to the lake’s biodiversity and local livelihoods [16]. The Ethiopian government uses various control methods, such as mechanical and manual removal and biological interventions, to combat this weed. However, the labor-intensive and costly transportation and management of the removed biomass present major challenges. Despite these issues, water hyacinth biomass holds potential as a valuable feedstock for biochar production, offering a sustainable solution for soil enhancement.
According to Baiamonte et al. [17], biochar-amended soils, particularly for wheat crops, maintained crop productivity under deficit irrigation due to biochar’s ability to enhance irrigation water use efficiency (IWUE) and crop water use efficiency (CWUE). Similarly, Hou et al. [18] demonstrated that biochar application improves soil water-holding capacity and water use efficiency, especially under deficit irrigation conditions. Biochar reduces the water infiltration rate of soil by enhancing its physical and hydrological properties [19], and it decreases soil bulk density while increasing soil porosity, aggregation, and structural stability index compared to soil without biochar [20]. This helps retain more water from irrigation, reducing the need for frequent irrigation and optimizing the limited water resources available for crop production. Despite these benefits, several studies on the combined amendment of soil with biochar and fertilizer have yielded inconsistent results.
The response to biochar and chemical fertilizers can vary significantly based on soil conditions, including factors such as soil types, pH, nutrient content, and organic matter [21]. Soil chemical properties, including soil pH, electrical conductivity, cation exchange capacity, soil organic carbon, total soil carbon, and the carbon-to-nitrogen ratio, determine the effects of biochar on soil properties and crop yield [22]. Different research locations and soil types can lead to different outcomes, contributing to the observed inconsistencies in the results. Different locations have soils with unique characteristics such as texture, structure, and nutrient levels. These variations in soil properties influence how biochar interacts with the soil, significantly affecting its impact on soil quality and crop yield [23]. Moreover, the effects of biochar on soil quality and crop yield depend on the type of feedstock, pyrolysis temperature, and application rate. Biochar produced from wood, manure, crop residues, and urban and industrial waste materials has different properties and thus affects soil quality and crop yield differently [24]. Biochar and chemical fertilizers interact with various soil and environmental factors in complex ways. These interactions can be influenced by the timing and method of application, type and rate of fertilizer, and specific characteristics of the biochar used [25], making it challenging to establish a one-size-fits-all solution. Crop type, as well as the specific needs and growth patterns of different crops, can also influence the response to biochar and chemical fertilizers. Variability in crop genetics and characteristics can lead to differences in observed effects [21,26]. According to Ye et al. [21], maize exhibited the highest response to biochar addition, with or without fertilizer, showing an increase in yield ranging from 48.7% to 152%. Wheat, barley, or oats also responded positively, with yield increases ranging from 16.8% to 46.6%. In contrast, there was no significant increase in yield observed for rice, rapeseed, or sunflower. Moreover, environmental factors, including weather patterns, water availability, and temperature, can affect the effectiveness of biochar and chemical fertilizers. Variations in research methodologies, such as experimental design and measurement techniques, can also lead to differences in reported results. The effects of biochar and chemical fertilizers may be further influenced by specific conditions of deficit irrigation. Water availability and management practices can vary widely and can interact with nutrient availability and soil improvement from biochar in unpredictable ways. Moreover, farmers living in Ethiopia are generally unfamiliar with biochar production and its use as a soil amendment. Due to this lack of awareness and access, they face challenges such as poor soil fertility and low water retention, which lead to moisture stress during dry periods and ultimately limit crop productivity.
Given the complex and context-specific nature of agricultural systems, it is reasonable to highlight the need for further research to better understand the effects of combined biochar and chemical fertilizer applications on wheat crops under different cropping seasons. Developing and optimizing clear guidelines and recommendations for these practices in various environments can help improve crop productivity and sustainability in agriculture. Furthermore, the significance of this study is heightened by its role in combating the infestation of water hyacinth weeds in Lake Tana, Ethiopia, through the conversion of biomass into biochar for soil amendment. Therefore, this study aimed to optimize the cropping system by examining the combined biochar and inorganic fertilizer application on wheat growth and yield components, specifically focusing on the rainy and dry cropping seasons.

2. Materials and Methods

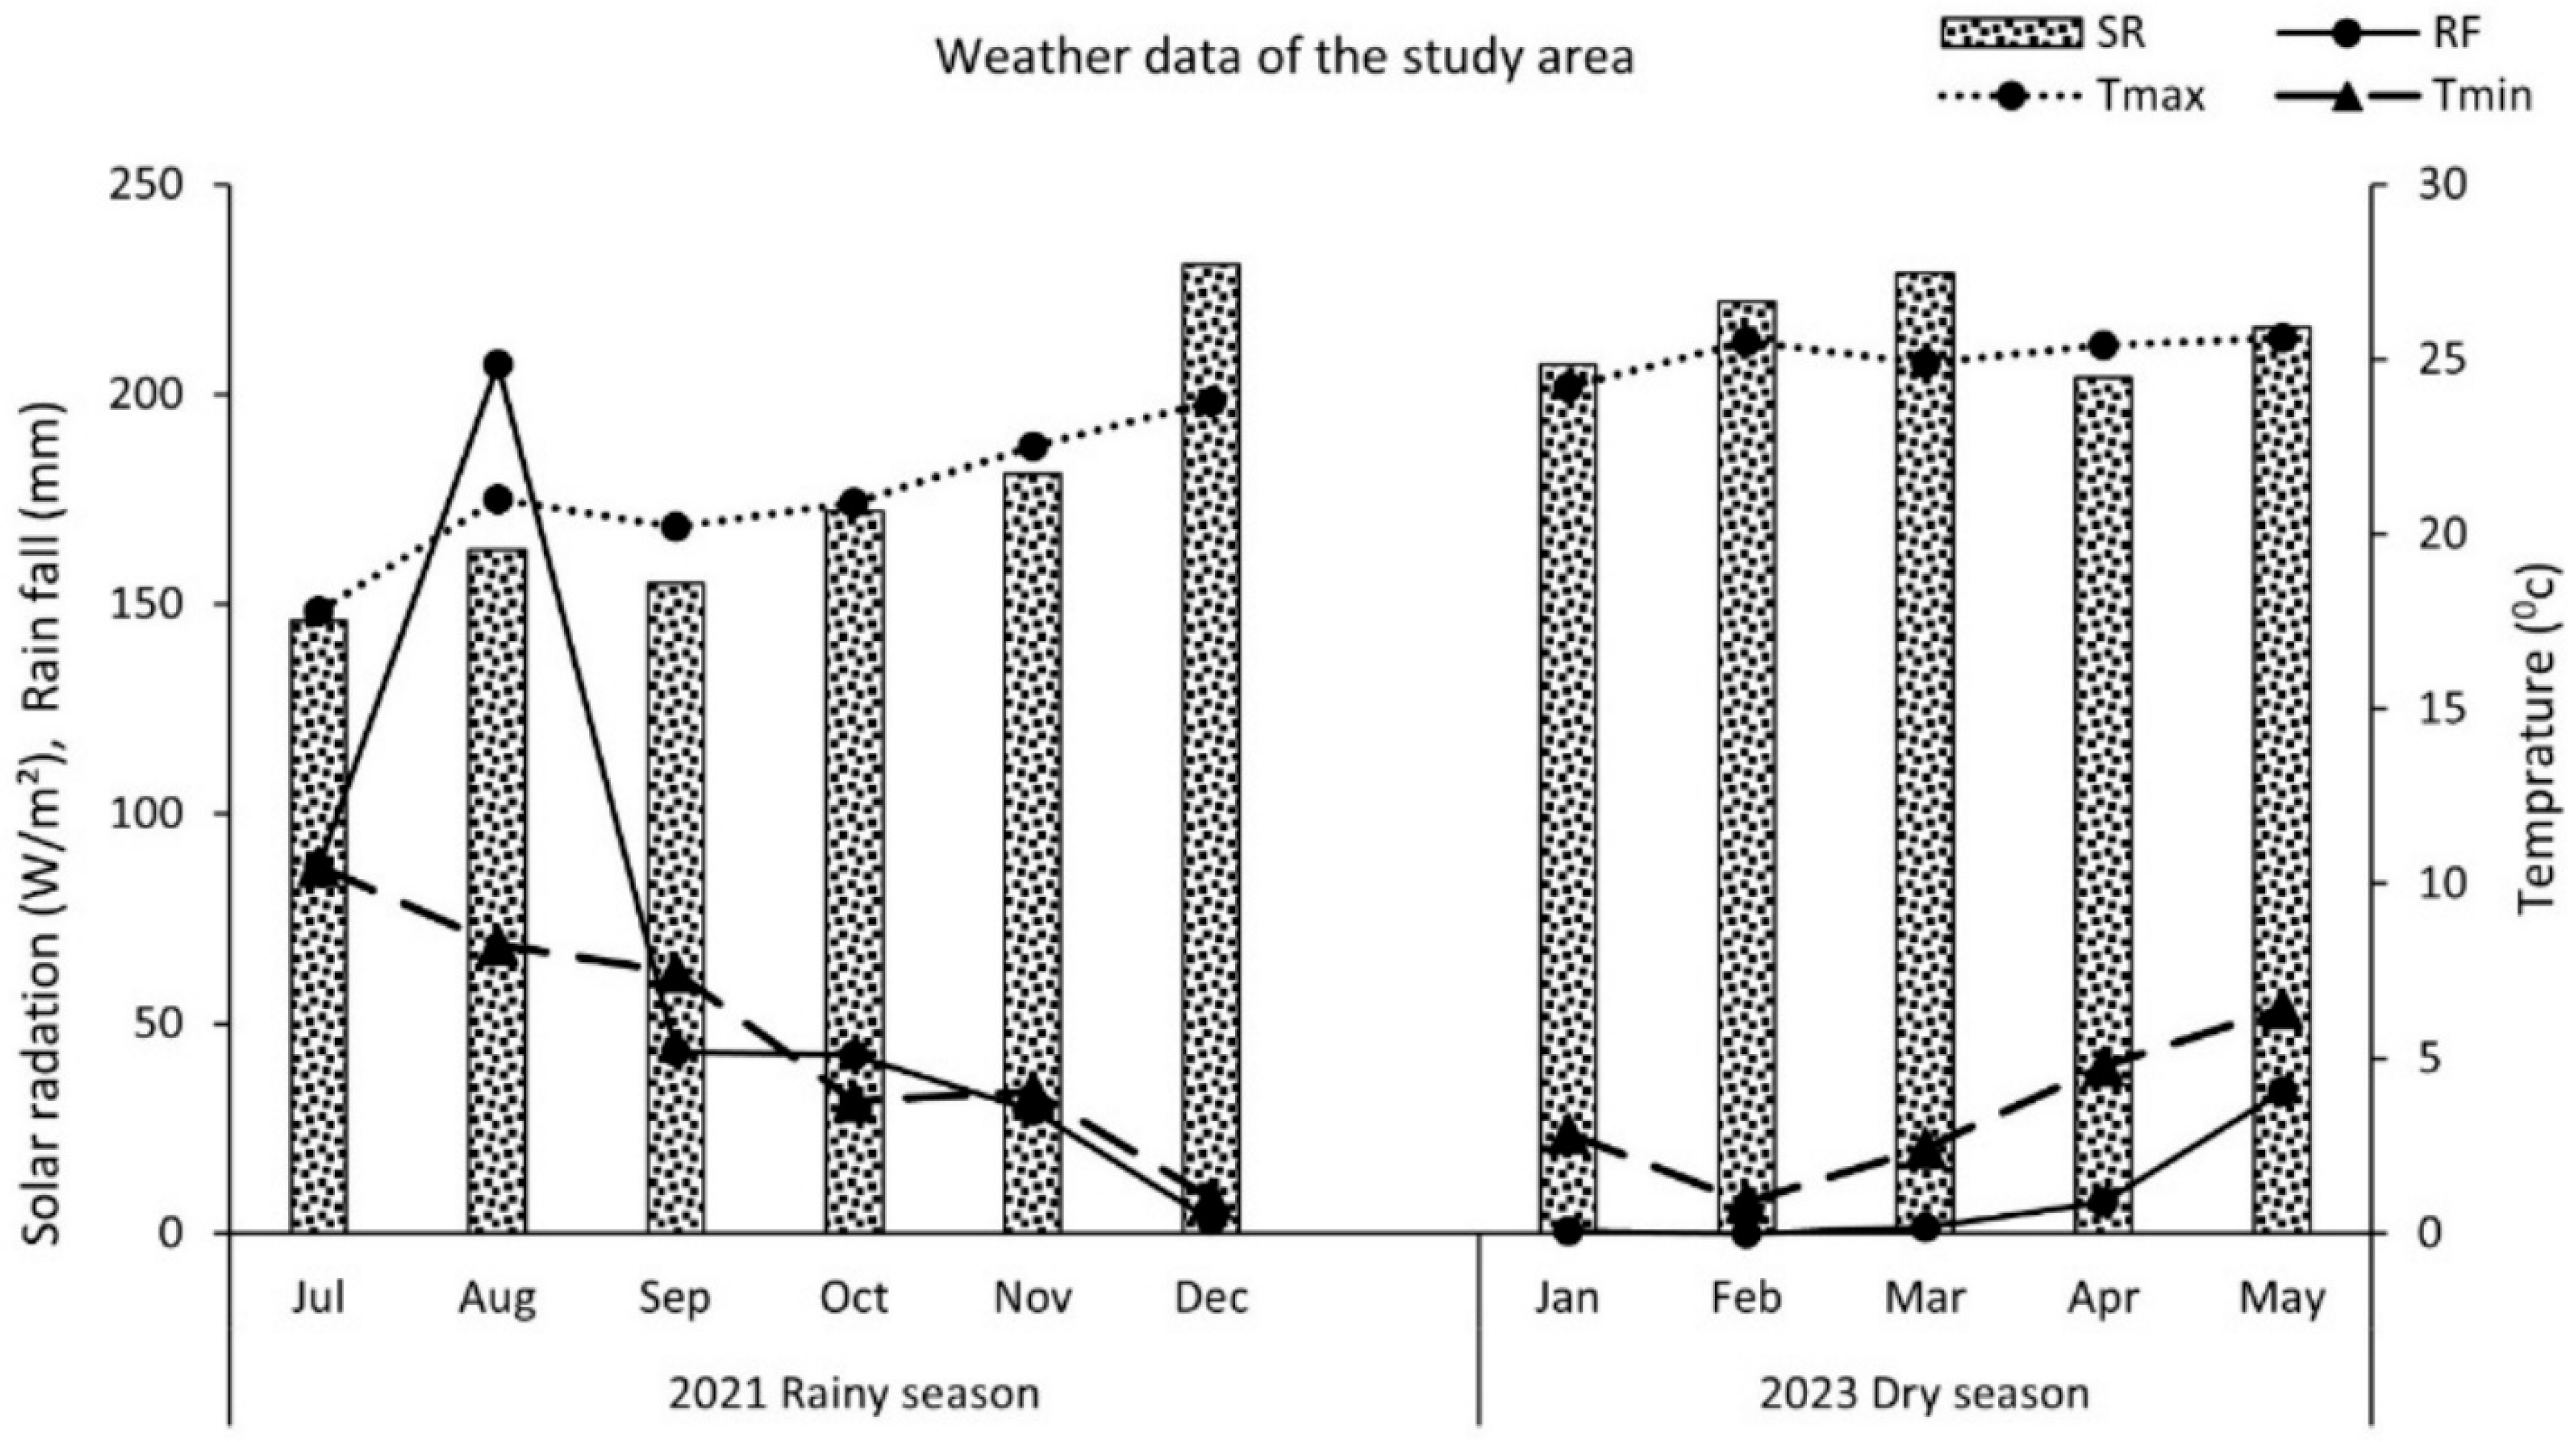
2.1. Descriptions of Experimental Site

The field experiments were carried out at the Injibara University campus, located in the Awi Zone of Ethiopia, during two distinct cropping seasons: the rainy season from July to December 2021 and the dry season from January to May 2023. The experiment was discontinued during the 2022 dry season due to the delayed collection of water hyacinth biomass, which made biochar production impossible. Habtie et al. [27] reported that over the past 33 years, the area has experienced average minimum and maximum temperatures of 10.3 °C and 22.5 °C, respectively. The mean annual rainfall is 1344 mm, with the primary rainy season occurring from June to September. Precipitation, minimum and maximum temperatures, and average solar radiation at the experimental site during each season of this study are depicted in Figure 1.

2.2. Land Preparation

Following land clearing, the experimental site was plowed five times using oxen. Plot dimensions were 1.6 m wide by 2.4 m long for the rainy season trials and 1.6 m wide by 2.0 m long for the dry season experiments.

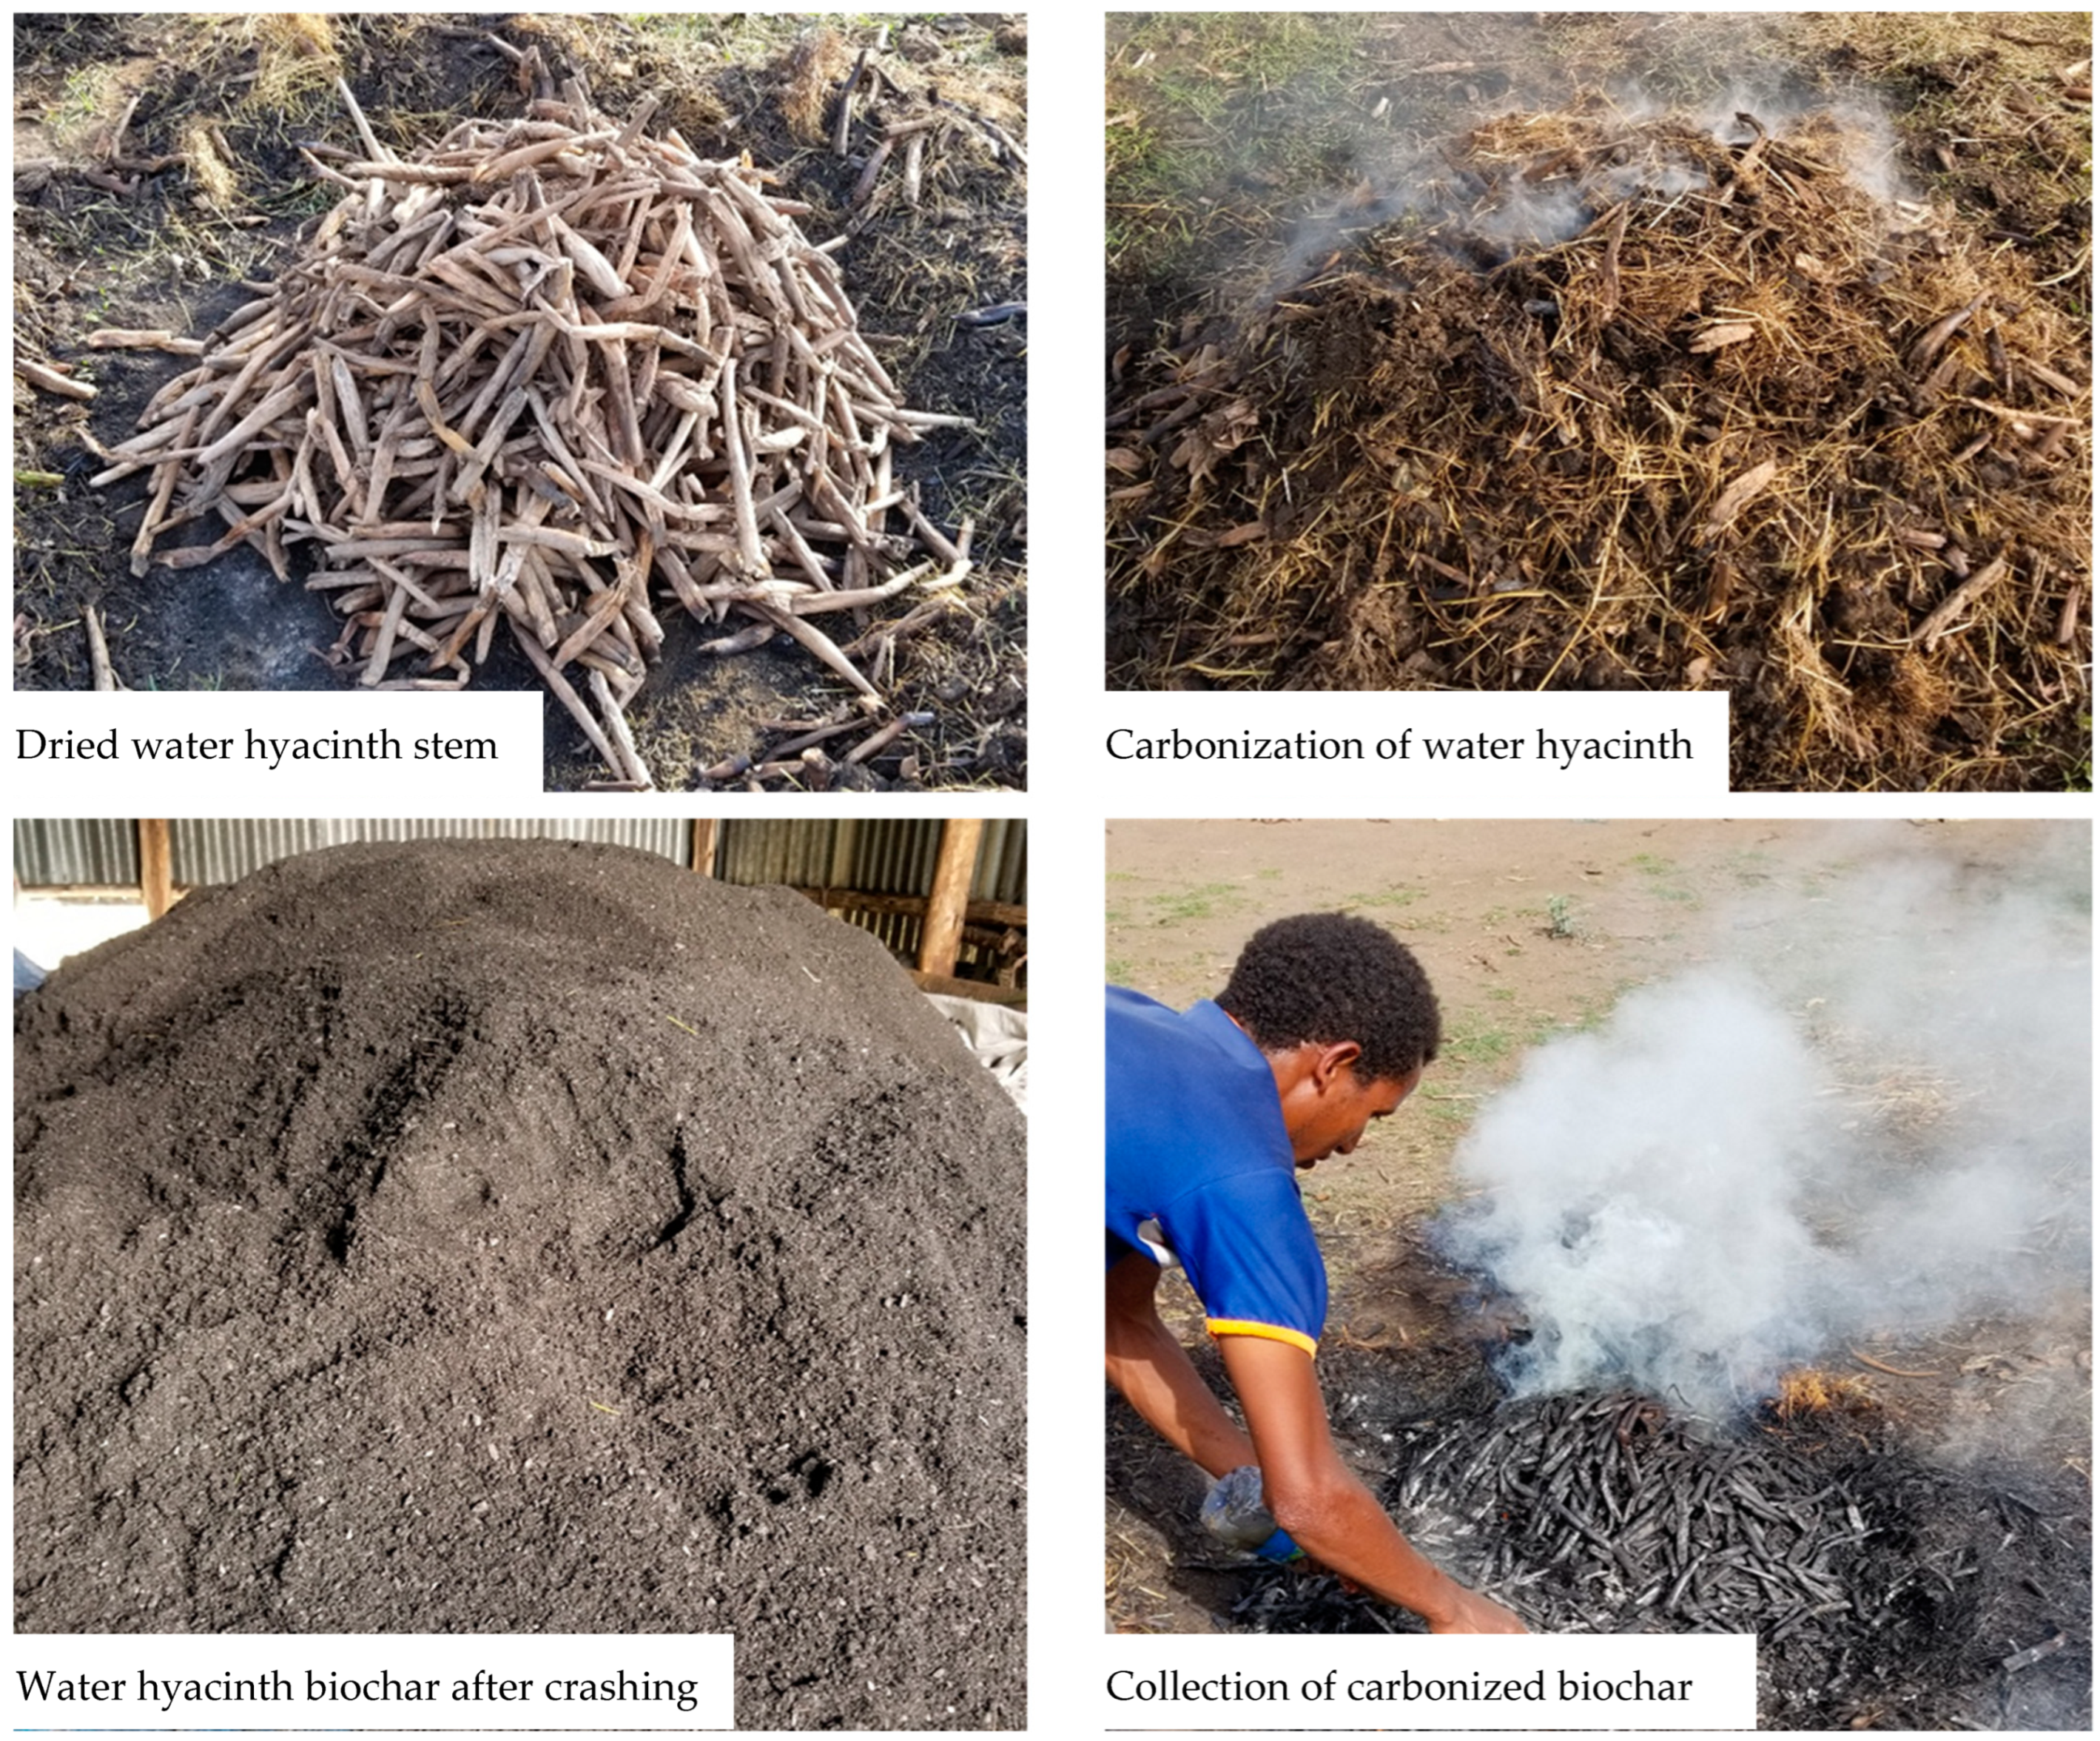
2.3. Biochar Production

Water hyacinth biomass collected from Lake Tana, Ethiopia (12°72′78″ N, 37°52′02″ E), was used as the feedstock for biochar production. The stem part of the water hyacinth was collected and sun-dried. Recognizing the challenges posed by furnace pyrolysis methods, particularly for resource-limited farmers, a simple grounding system was developed that can be easily implemented at water hyacinth collection sites, such as Lake Tana in Ethiopia. This cost-effective solution enables farmers to convert water hyacinth biomass into biochar without the need for expensive furnaces, thus making it accessible and practical for small-scale agricultural operations.
To produce water hyacinth biochar (WHB), approximately 0.4–0.5 kg of water hyacinth biomass was heaped and covered with teff (Eragrostis tef) straw and a layer of soil to restrict oxygen flow during combustion. The pile was ignited using locally available matches. The pyrolysis conditions of temperature and residence time were inferred from the physico-chemical properties of the resulting biochar, including pH, cation exchange capacity (CEC), and total carbon content. These characteristics closely matched those reported by Gezahegn et al. [11], who produced WHB from the same Lake Tana biomass using a laboratory pyrolysis furnace at temperatures of 350 °C, 550 °C, and 750 °C. Based on this comparison, the pyrolysis temperature for WHB in this study was estimated to range between 500 °C and 600 °C, with a residence time of approximately 50 to 60 min. After pyrolysis, the biochar was cooled with water, then sun-dried, manually crushed, and sieved to particle sizes of less than 2 mm for laboratory analysis and less than 5 mm for use in the field. Biochar was produced annually for every season of the experiment, utilizing water hyacinth biomass collected from the same location and employing identical procedures (Figure 2).

2.4. Field Experimentation

A randomized complete block design (RCBD) with 4 replications was employed, yielding 24 experimental plots for the rainy season and 36 plots for the dry season (Table 1 and Table 2). This study incorporated four rates of water hyacinth biochar (WHB) (0, 5, 10, and 20 t ha−1) and three rates of NPS inorganic fertilizer (0, 100, and 200 kg ha−1) across both seasons. Additionally, two irrigation water regimes (50% and 100% of crop requirements) were applied only in the dry season experiment. We utilized the new NPS blended fertilizer, which contains nitrogen, phosphorus, and sulfur (19% N, 38% P2O5, and 7% S). This fertilizer has recently gained popularity in Ethiopia and has been introduced by the Ministry of Agriculture as a replacement for diammonium triphosphate (DAP) as the main phosphorus source in national crop production. [28]. The irrigation regimes (50 and 100%) were determined based on a previous study review, which considered a range of 50 to 100% [29,30,31]. We also considered the study by Cakmakcı and Sahın [32], which observed that under 50% water deficit conditions, biochar amendments increased irrigation water productivity compared to the control (non-biochar), resulting in water savings of 8.3–18.4% at different rates of biochar. Additionally, Ullah et al. [33] reported that under 50% field capacity, using algal biochar significantly improved weights of shoots and roots, as well as root length, in maize compared to the control. Kakaba bread wheat variety was used as a test crop, sown at a seeding rate of 150kg ha−1.
The “Kakaba” variety of bread wheat was used as the test crop, sown at a seeding rate of 150 kg ha−1. Application of biochar was carried out two days before planting: on 22 July 2021, for the rainy season, and on 28 December 2023, for the dry season, to a depth of 20 cm in the plots designated to receive biochar. In plots receiving inorganic fertilizer, the full rate of NPS and half of the urea were applied at the time of planting (24 July 2021, for the rainy season; 30 December 2023, for the dry season). The remaining half of the urea was top-dressed during the tillering stage, on 7 September 2021, for the rainy season and 9 March 2023, for the dry season [34].
For the dry season experiment, all plots were pre-irrigated two days before sowing and received continuous irrigation for one week following sowing to ensure uniform crop germination. After this establishment phase, irrigation was applied according to the treatment regimes, either 50% or 100% of the wheat crop’s estimated water requirement, until the crop reached physiological maturity. Daily irrigation amounts were five liters for plots receiving 50% irrigation and ten liters for those receiving 100% irrigation, up until the booting stage. Following the booting stage, the irrigation amounts increased to ten liters and fifteen liters per day, respectively, until physiological maturity, using a watering can. This adjustment accounts for the increased water needs of the wheat crop during its later growth stages [35]. The irrigation volumes and scheduling were determined based on established crop water requirement estimates for wheat [36,37].

2.5. Plant Data Collection

The growth and yield components of a wheat crop refer to various measurable attributes and characteristics that determine its overall development and productivity. Growth components included plant height, leaf area, dry biomass, and soil plant analysis development (SPAD) value, and yield components included spike length, spikelet number per spike, grain number per spike, and grain yield. Parts of the growth components (plant height and dry biomass) and all yield components were measured during the rainy season and all of the growth and yield components for the dry season. Leaf area and leaf SPAD values were not measured during the rainy season because of the unavailability of measurement instruments (leaf area and chlorophyll meters).
For the dry season experiment, each plot was divided into two halves: the first half was used for frequent biomass measurements to quantify the effects of the amendments on wheat crop biomass throughout the growth stages, while the second half was used for the measurement of other growth and yield components of wheat. For the rainy season experiment, the crop dry biomass data were recorded from the central rows of the whole plot only at harvest.
Dry biomass, which includes the dry weight of plant components, is a measure of its overall growth and productivity. Biomass samples were collected at harvesting time in the rainy season and at four different times during the crop growth stages in the dry season. The first sample was collected at 70 DAS during the full-tillering growth stage of the crop. Subsequent sampling was conducted at 90 (flowering stage), 110 (physiological maturity stage), and 130 DAS (harvesting stage). Samples were collected using 25 cm × 25 cm quadrants from each plot during the dry season. Dry biomass was measured after drying in the sun during both seasons.
The chlorophyll content and the concentration of chlorophyll in the leaves are indicative of the plant’s photosynthetic activity and overall health. A chlorophyll meter (CY-YD, Jinan Cyeeyo Instruments Co., Ltd., Jinan, China) was used to measure chlorophyll concentrations in the leaves. A leaf area meter (LAM-A, Biobase Biodustry Co., Ltd., Jinan, China) was used to measure leaf area. Measurements were taken from the central, fully mature leaves of five randomly selected plants in the central rows of each plot [38]. Leaf area and chlorophyll concentration were measured three times at 70, 90, and 110 DAS, corresponding to the full tillering, flowering, and physiological maturity stages of the crop growth period, respectively. The same leaves were used for measurements during the sampling dates by marking them from five selected leaves in the central part of the plant.
Spike length measures the length of the wheat spike or head, which contains grains. A longer spike often indicates a higher potential for grain production, and spikelet number is the number of spikelets on each spike, which is a crucial determinant of the potential grain yield. The number of grains is the total number of seeds or grains produced by each wheat plant spike that directly influences the final grain yield, whereas grain yield is the ultimate component representing the actual amount of wheat grains harvested per unit area, which is the most important yield component and is influenced by the other growth and yield components mentioned above. At crop maturity, key growth and yield attributes, including plant height, spike length, number of spikelets per spike, and number of grains per spike, were recorded from five randomly selected plants within the central rows of each plot during both the rainy and dry seasons. To determine grain yield, all plants in the central rows were harvested. The harvested grain was sun-dried, then threshed and separated from the straw before being weighed to assess final yield.
A linear regression model and Pearson correlation coefficient procedure were employed to determine the relationship and correlation between crop growth, yield components, and grain yield of the wheat crop.
The production cost–benefit of wheat was determined by comparing the gross return and total cost of wheat crop production. The total cost was calculated from the input costs (fertilizer and biochar production) and labor costs (sowing, fertilizer application, and irrigation). Gross return was derived from the sales of wheat grain and straw at market prices in the respective years. The cost of the biochar stock material (water hyacinth) was not considered because it is naturally available in Lake Tana. Only the collection and production cost of biochar was included. The total biochar production cost was divided over five years, considering that the biochar applied in the first year of crop production served for five consecutive years without much crop yield reduction [39]. All costs and returns were converted to USD (1 USD ≈ 56 Ethiopian Birr as of December 2023). The rental cost of land and plowed oxen or horses was not included because most Ethiopian farmers own their land and plow animals. Net return was computed as the difference between the gross return and total cost. The cost–benefit ratio was also computed from the ratio of the gross return to the total cost of production.

2.6. Soil and Biochar Sampling and Characterization

Five subsoil samples were collected from the experimental land before the experimental treatments were applied. The sub-samples were combined to create a composite sample for the measurement of basic soil and biochar properties. These properties include pH, total C, N, ammonium-N (NH4+-N), nitrate-N–N (NO3-N), available P, bulk density, and water-holding capacity.
The pH was measured using a water-to-soil ratio of 1:2.5 (w/v) using a digital pH meter (LAQUA F-71, Kyoto, Japan). Total carbon (C) and nitrogen (N) concentrations were analyzed with a CHN analyzer (Perkin Elmer, Waltham, USA). For NH4+-N and NO3-N (extracted using 2 mol L−1 KCl) and available P (extracted using the Mehlich-3 method), measurements were performed using an auto-analyzer 2000 (FIAlyzer-1000, Seattle, WA, USA). Cation exchange capacity (CEC) of both soil and biochar was assessed using 1 mol L−1 ammonium acetate buffered to pH 7. The biochar-specific surface area was determined using N2 adsorption–desorption performed at 77K with the Micromeritics ASAP 2020, Shimadzu, Tokyo, Japan. Fixed carbon and ash content of the biochar were determined by thermal gravimetric analysis (TGA) using simultaneous differential thermogravimetry (SDT Q600, TA Instruments Lukens Drive, New Castle, DE, USA).
The pH was measured using a pH meter (LAQUA F-71, Horiba Scientific, Kyoto, Japan) with a 1:2.5 (w/v) water-to-soil ratio. Total carbon (C) and nitrogen (N) concentrations were determined using a CHN analyzer (Perkin Elmer, 2400 Series II, Waltham, MA, USA). Ammonium nitrogen (NH4+-N) and nitrate nitrogen (NO3-N) were extracted with 2 mol L−1 KCl, and available phosphorus (P) was extracted using the Mehlich-3 method, with all analyzed using an auto-analyzer 2000 (FIAlyzer–1000, FIAlab Instruments Inc., Seattle, WA, USA). The cation exchange capacity (CEC) of the soil and biochar was measured using 1 mol L−1 ammonium acetate adjusted to pH 7. The specific surface area of the biochar was determined via nitrogen (N2) adsorption–desorption at 77K using the Micromeritics ASAP 2020 (Shimadzu, Tokyo, Japan). Thermogravimetric analysis was employed to determine the fixed carbon and ash content of the biochar using a simultaneous differential thermogravimetric analyzer (SDT Q600, New Castle, DE, USA).

2.7. Statistical Analysis

A one-way analysis of variance (ANOVA) was used to compare the means across different treatment combinations for wheat growth and yield components. To assess interaction effects, two-way ANOVA was performed for combinations of biochar and fertilizer, biochar and irrigation, and fertilizer and irrigation. Additionally, a three-way ANOVA was employed to analyze the individual and combined effects of biochar, fertilizer, and irrigation on plant growth and yield components. Correlation analysis was conducted to identify linear relationships between variables. Both linear models (LM) and generalized linear models (GLM) were utilized in these analyses. All analyses were conducted using R software version 4.3.0 [40]. The Shapiro–Wilk [41] was employed to check data normality, and Tukey’s Honestly Significant Difference (HSD) test was used to determine differences between treatment means at a significance level of 5% (p < 0.05).

3. Results

3.1. Fundamental Characteristics of Soil and Biochar

The soil on which the field experiments were conducted was classified as Nitisol, belonging to the silt loam texture class for both the rainy and dry season experiments. The soil at the experimental site was strongly acidic in both the rainy (pH 5.23) and dry (pH 4.42) seasons, whereas the biochar used was alkaline in both the rainy (pH 9.33) and dry (pH 10.7) seasons. The NH4+-N, NO3-N, and available P concentrations for the rainy season soil were 1.67, 11.6, and 4.19 mg kg−1, respectively, and the dry season soil had concentrations of 1.52, 15.7, and 0.392 mg kg−1 for NH4+-N, NO3-N, and available P, respectively. The total carbon and nitrogen content were 9.30% and 0.68%, respectively, for the rainy season and 3.71% and 0.48% for the dry season. Based on these measurements, the experimental soil from the rainy season is more fertile than that from the dry season. The NH4+-N, NO3-N, and available P concentrations in the biochar used during the rainy season were 2.13, 3.21, and 613 mg kg−1, respectively. During the dry season, the corresponding concentrations were 0.748, 0.676, and 837 mg kg−1. The cation exchange capacity, ash content, fixed carbon, and surface area of the biochar for the 2021 rainy season were 32.2 cmolc kg−1, 42%, 17.7%, and 12.4 m2 g−1, respectively. Meanwhile, for the 2023 dry season, these values were 33.4 cmolc kg−1, 20.5%, 20.3%, and 53.2 m2 g−1, respectively (Table 3).

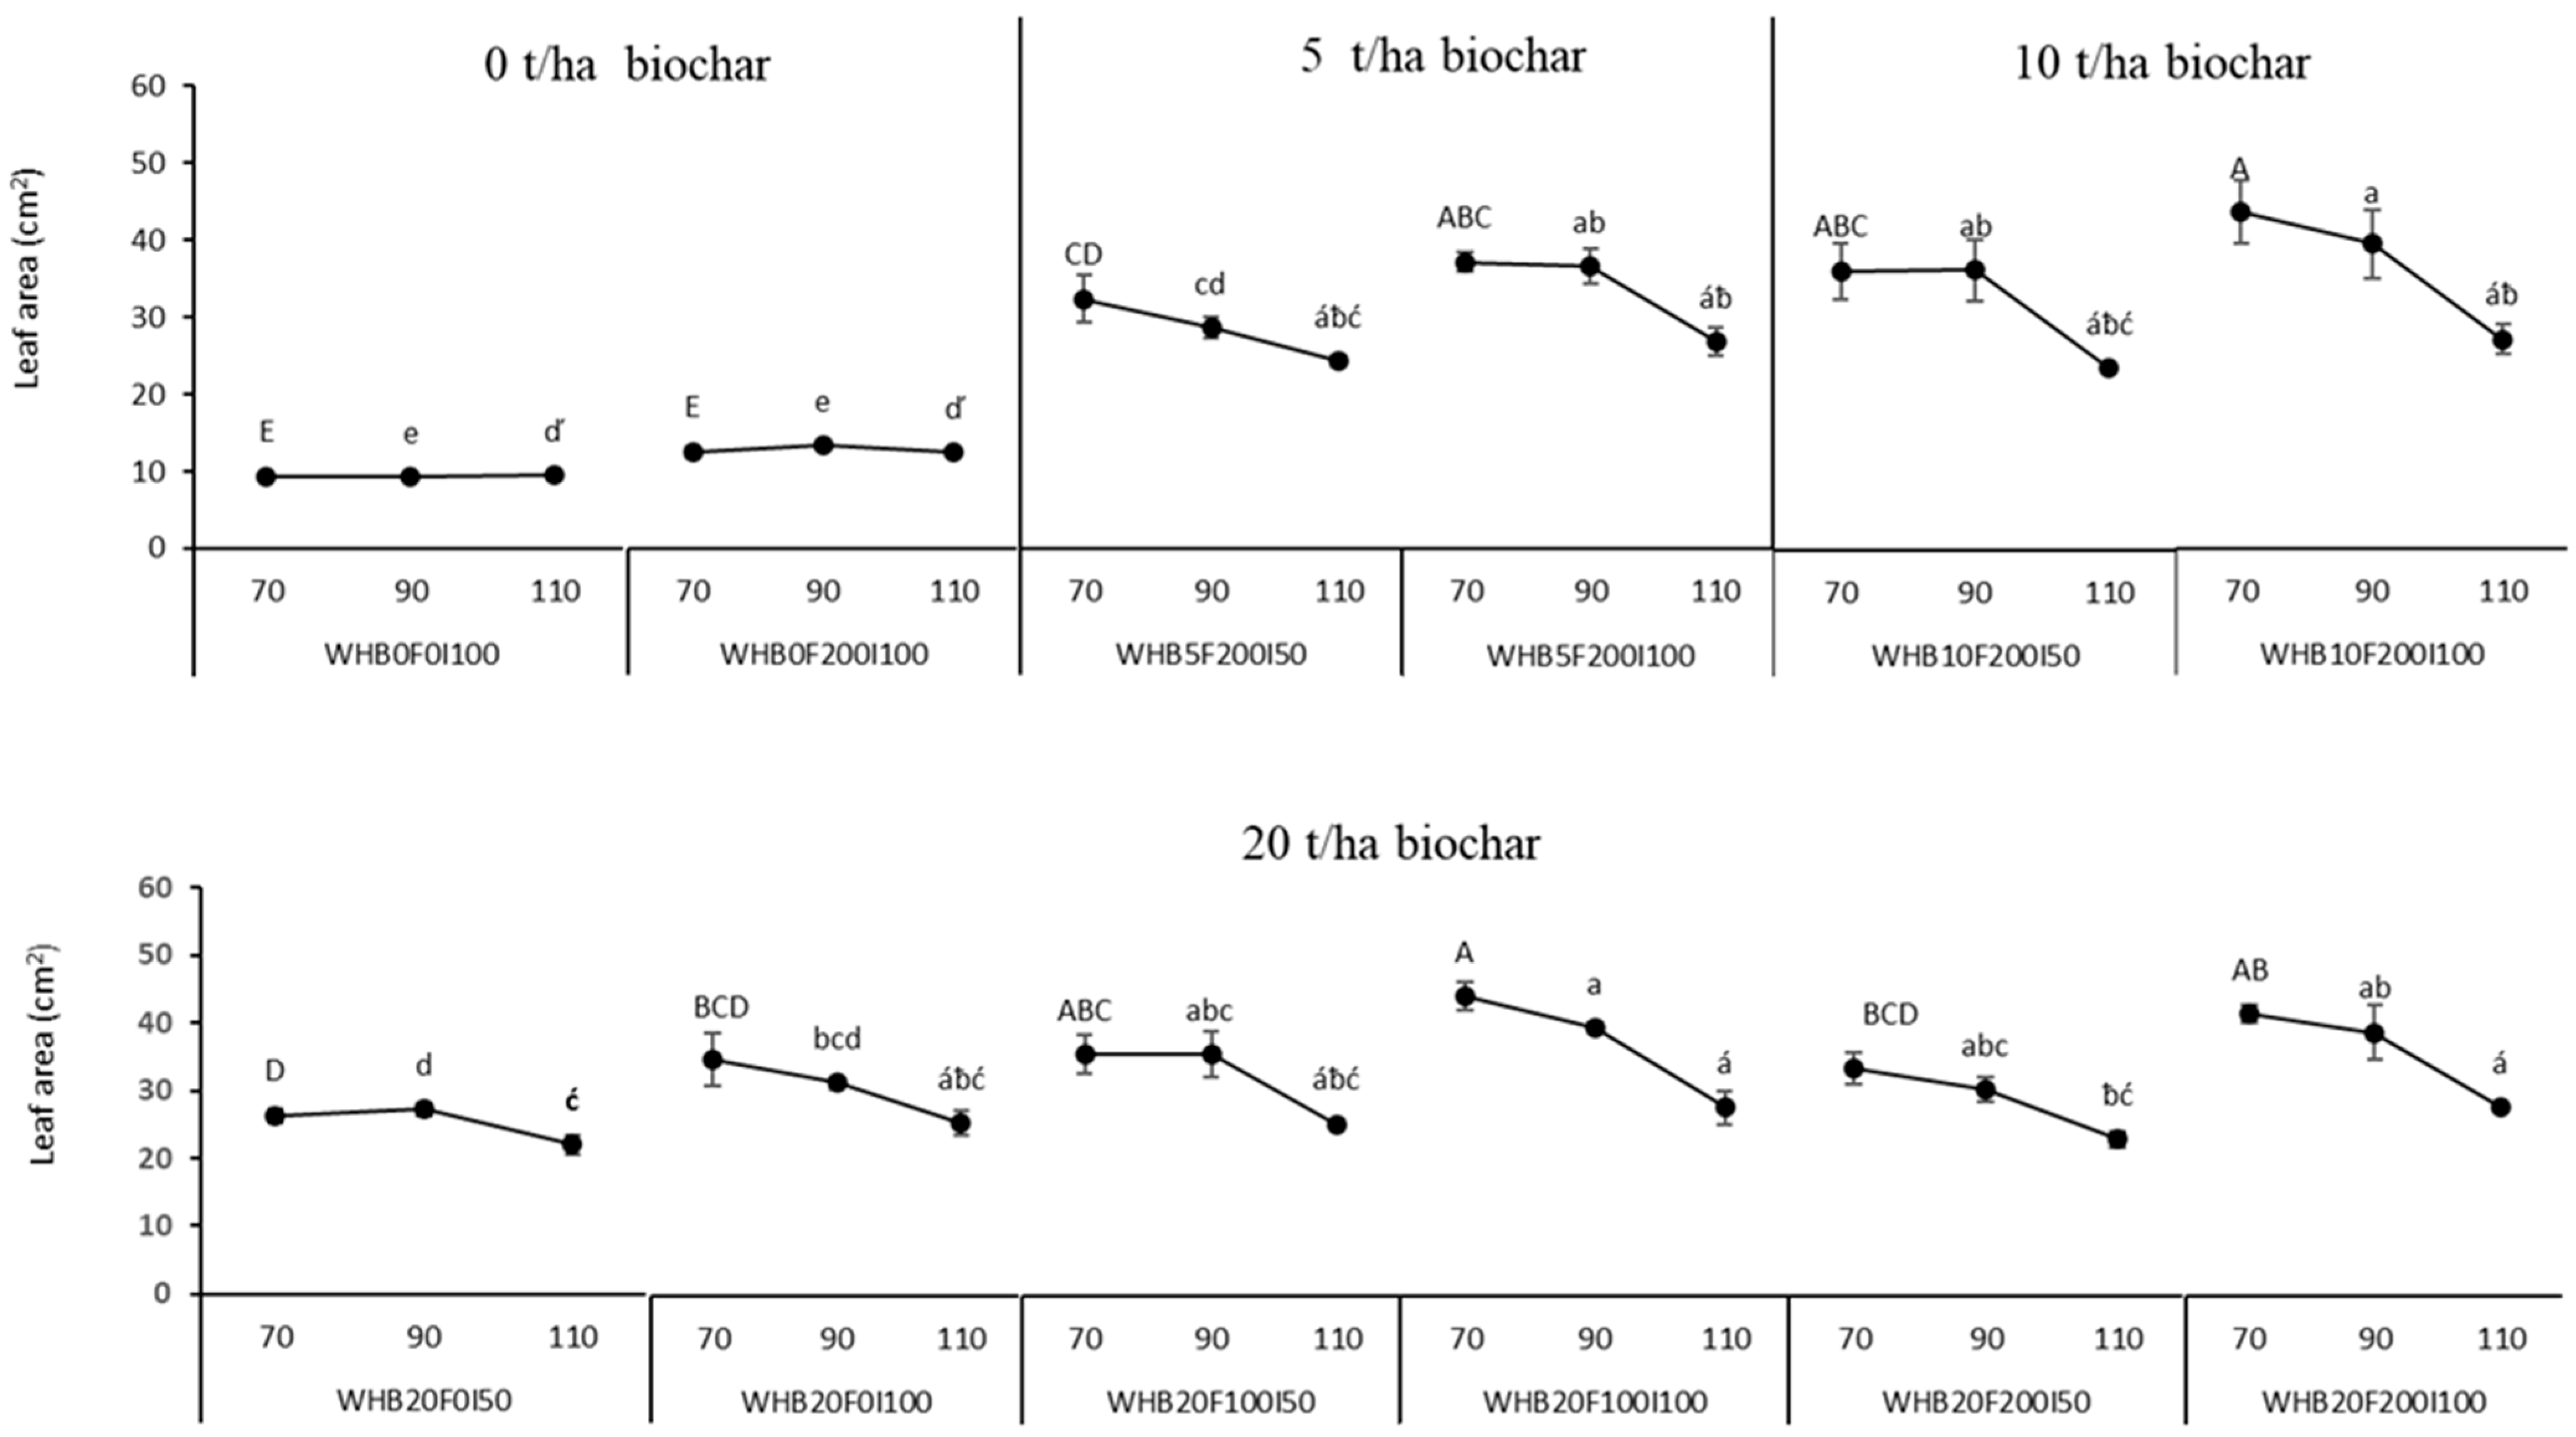
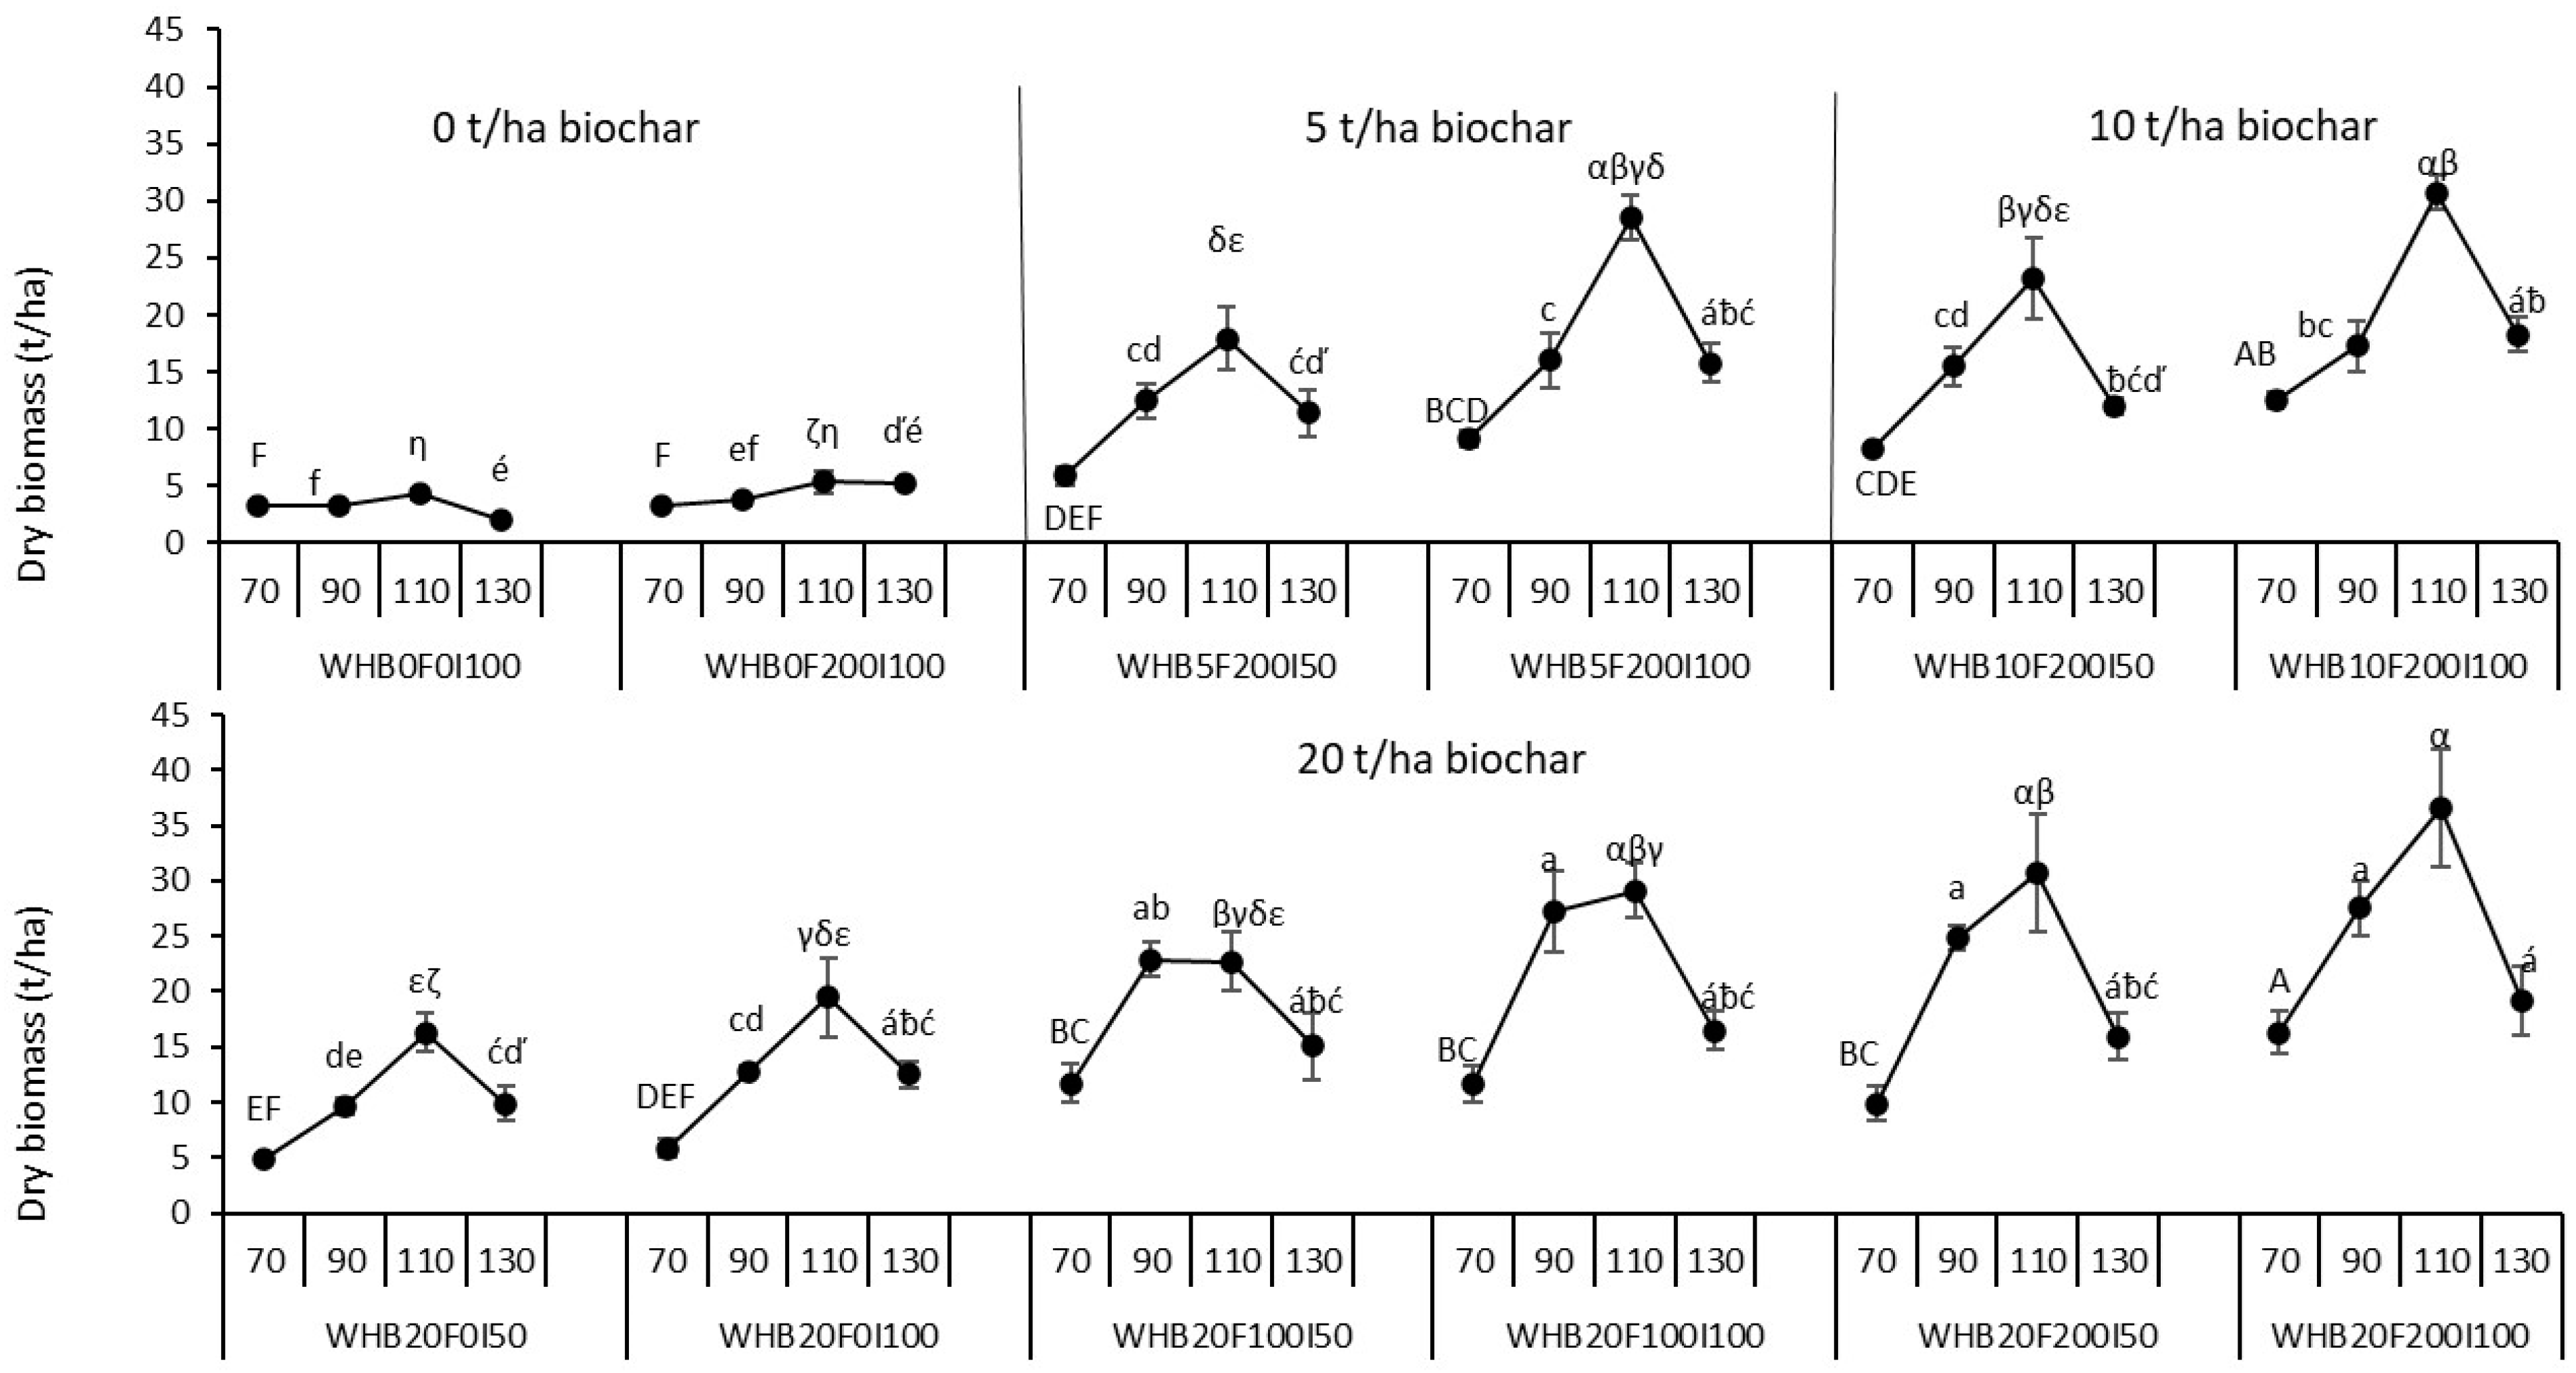
3.2. Effects of Biochar, Fertilizer, and Irrigation on Wheat Growth Components

Amendment of the soil with biochar and fertilizer during both growing seasons resulted in positive responses in terms of wheat growth components. In the rainy season experiment, plant height was not significantly (p > 0.05) affected by the combined application of biochar and fertilizer (Table 4). Nevertheless, greater plant height was observed in biochar-amended plots than in plots without biochar. Plant height was greater in WHB20F200 (89.2 cm) than in the control (85.9 cm). However, in the dry season, plant height was significantly more influenced by the combined application of biochar and fertilizer (Table 4). Plant height was significantly (p < 0.001) greater in the treatment with WHB20F200I100 (71.5 cm) than in the treatments without biochar, such as WHB0F0I100 (42.2 cm) and WHB0F200I100 (43.7 cm).
Leaf area generally increased at 70 DAS and decreased afterward, irrespective of treatment (Figure 3). Significant main effects of biochar, fertilizer, and irrigation were observed, along with a highly significant two-way interaction between biochar and irrigation (p < 0.001; Table A1). Although the three-way interaction was not significant (p > 0.05), a higher leaf area was recorded with the combination of a higher rate of WHB and fertilizer under full irrigation. Leaf area significantly (p < 0.001) increased with increasing WHB when combined with fertilizer and irrigation. The highest leaf area (44.4 cm2) was observed in treatments amended with WHB20F100I100 at 70 DAS, compared to plots without WHB and those with lower WHB rates under 50% irrigation (Figure 3). Leaf area significantly (p < 0.001) increased from 9.39 cm2 (WHB0F0I100) and 12.5 cm2 (WHB0F200I100) to 44.4 cm2 (WHB20F100I100) on 70 DAS, maintaining higher leaf area on 90 and 110 DAS compared to plots without biochar and those with lower WHB rates. Leaf area was greater in plots amended with 200 kg ha−1 fertilizer than in plots without fertilizer, even when combined with the same amount of biochar and irrigation water.
Although there was no significant difference (p > 0.05) in dry biomass during the rainy season, biomass increased with higher rates of biochar and fertilizer application (Figure 6a). The highest dry biomass (14.7 t ha−1) was recorded in the WHB20F200 treatment during the rainy season. Dry biomass tended to rise until 110 DAS in the dry season, followed by a decline, regardless of treatment. The main effects of biochar, fertilizer, and irrigation on dry biomass were significant (p < 0.001) at all sampling dates (except at 110 DAS and 130 DAS of irrigation) (Table A1). The two-way interaction of biochar and fertilizer (70 DAS to 110 DAS) and biochar and irrigation, as well as fertilizer and irrigation (70 DAS), significantly affected the dry biomass (p < 0.001). Dry biomass increased significantly (p < 0.001) with increasing amounts of WHB, even when combined with the same levels of fertilizer and irrigation water. Dry biomass was also significantly (p < 0.001) affected by the fertilizer rate when applied in combination with the same amount of biochar and irrigation water. Dry biomass was significantly (p < 0.001) higher in WHB20F200I100 (16.3 t ha−1) than in controls, WHB0F0I100 and WHB0F200I100 (3.20 t ha−1), at 70 DAS and continued to be higher at 90, 110, and 130 DAS. The highest dry biomass (36.5 t ha−1) was recorded for the interaction of 20WHB with 200F, under full irrigation (WHB20F200I100) at 110 DAS (Figure 4). Although dry biomass was influenced by the amount of irrigation water, no significant differences were observed among treatments during the dry season.
The leaf SPAD value generally decreased from 70 to 110 DAS, regardless of treatment (Figure 5) in the dry season. There was a significant (p < 0.001) increase in SPAD values from 28.1 (WHB0F0I100) to 50.4 (WHB20F100I50) with continued significant differences on 90 and 110 DAS. The SPAD values were significantly influenced by the main (p < 0.001) and interaction (p < 0.01) effects of biochar and fertilizer (Table A1). There were no significant differences among the treatments that received different rates of biochar application. However, a significant difference was observed between the biochar-amended and unamended treatments (Figure 5).

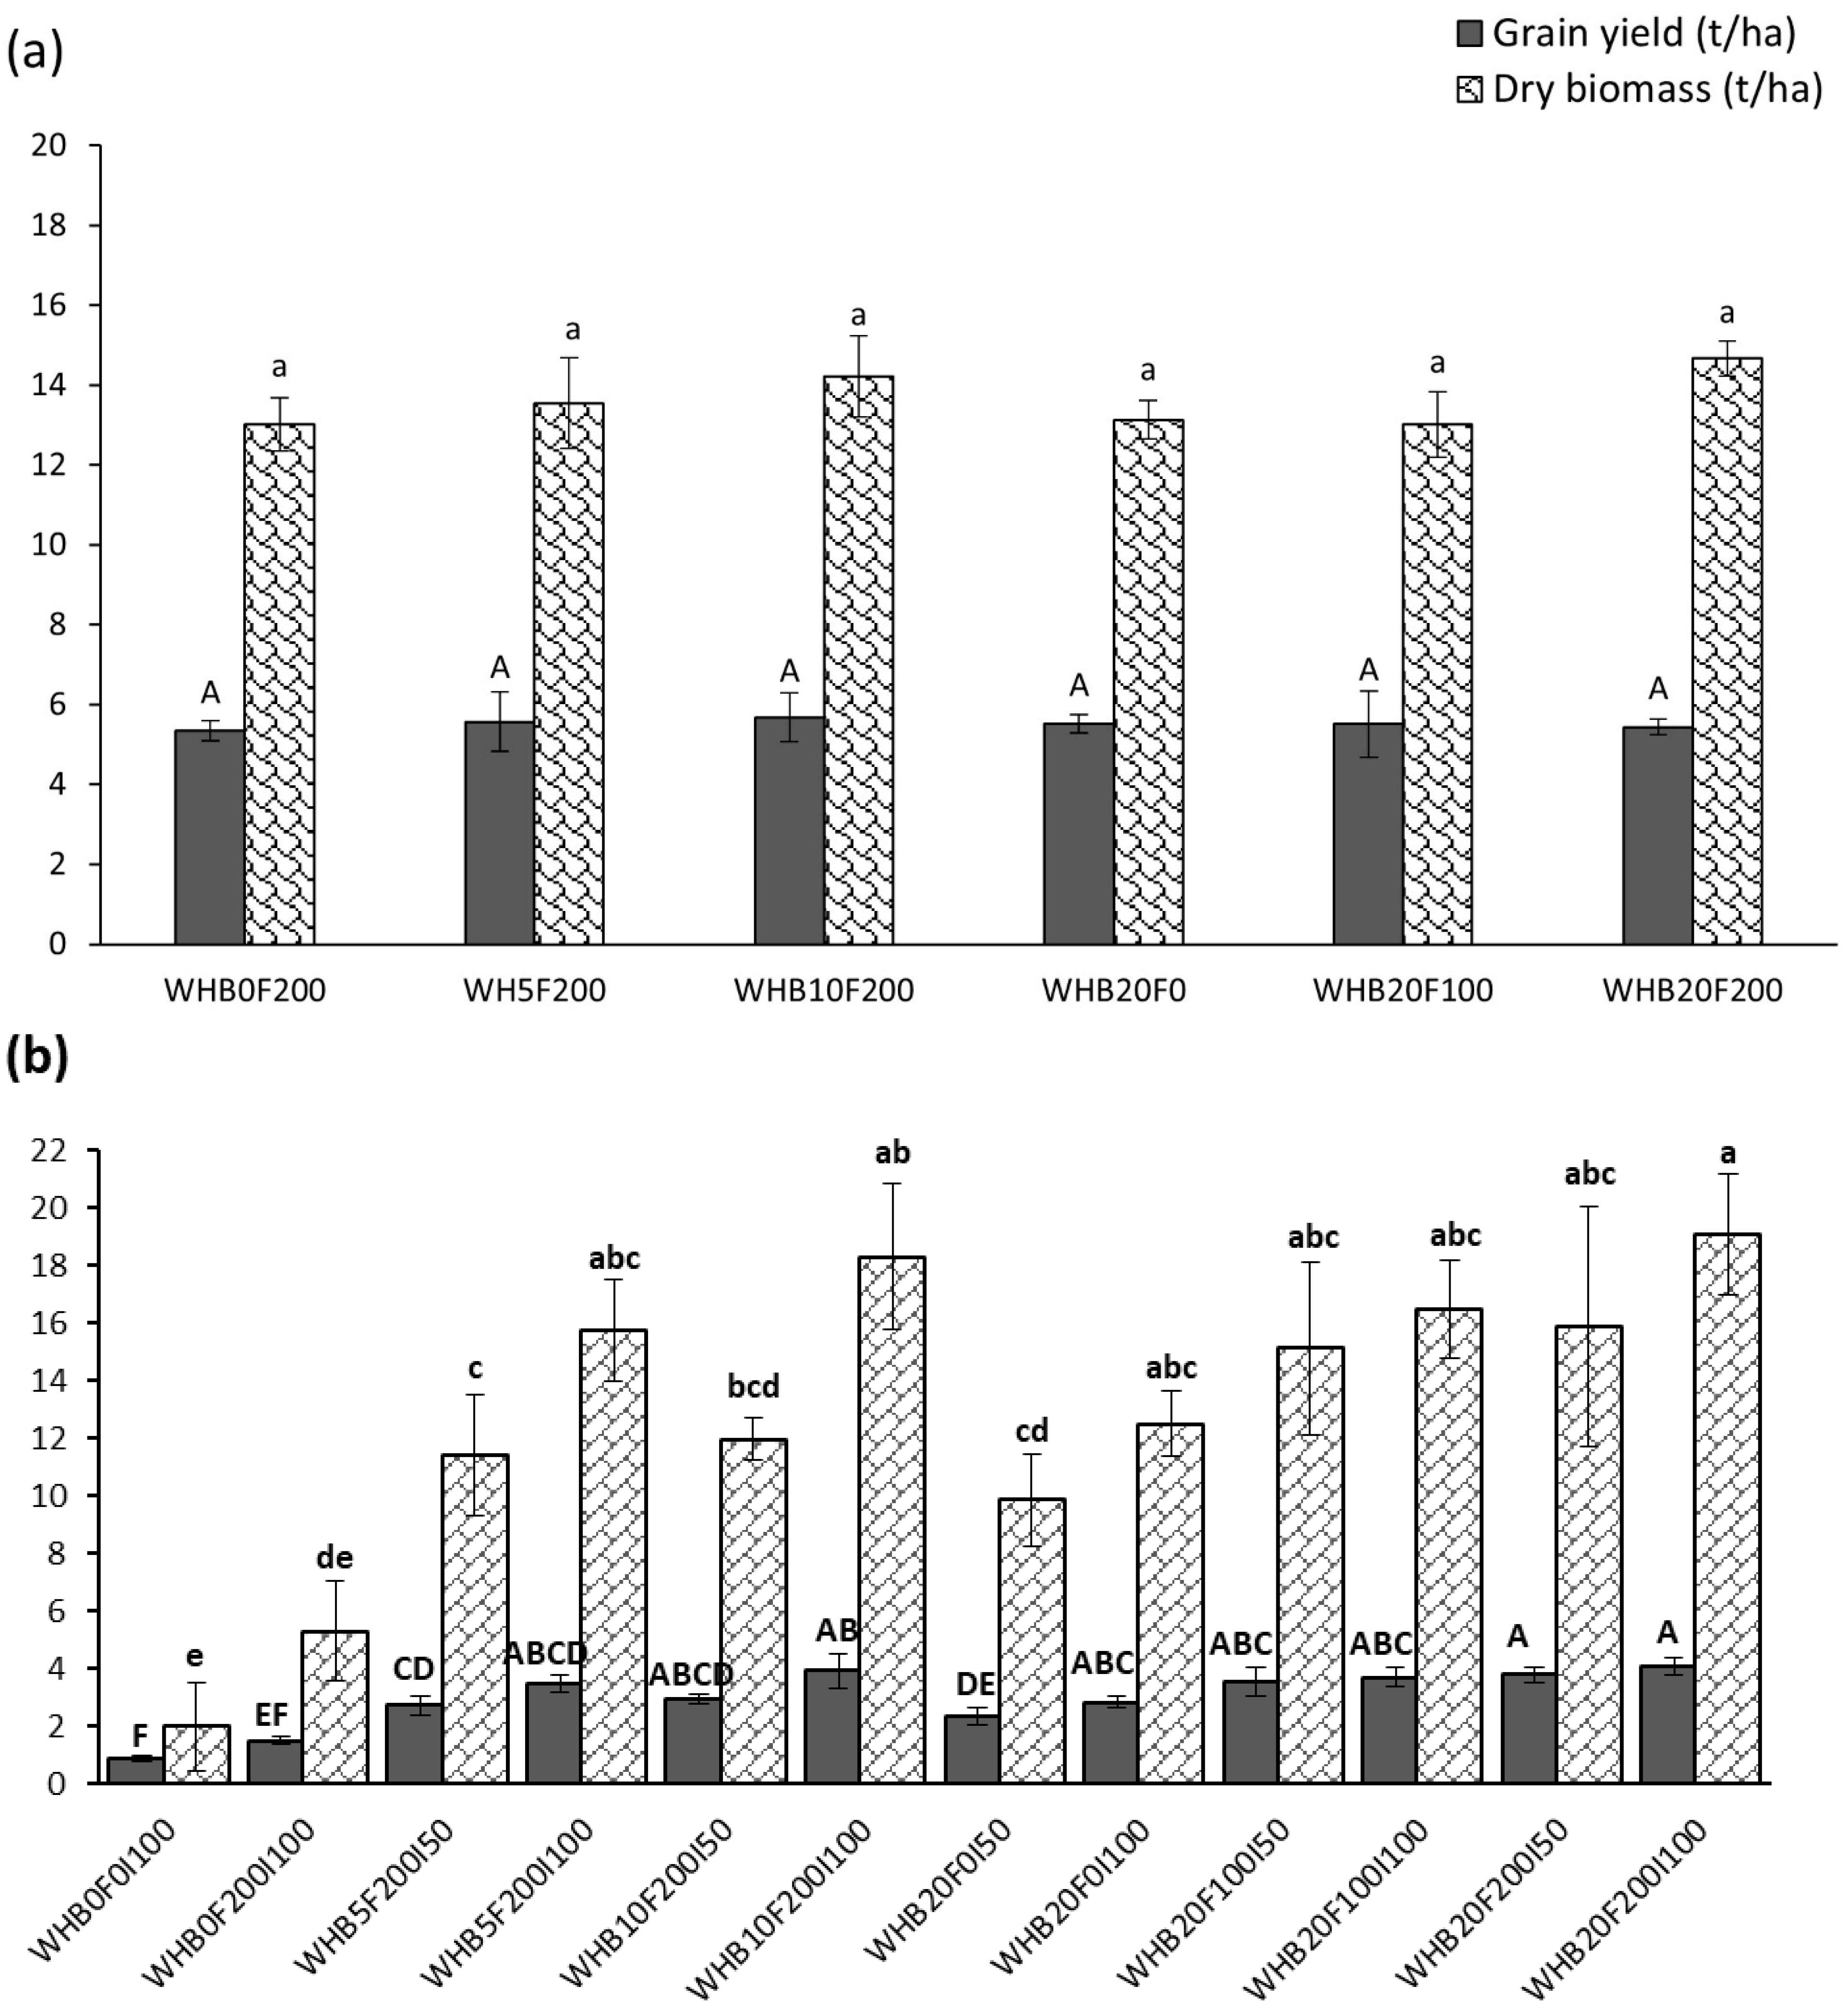
3.3. Effects of Biochar, Fertilizer, and Irrigation on Wheat Yield Components

The application of WHB and fertilizer during both the rainy and dry seasons had positive impacts on spike length, spikelet number, grain number, and grain yield (Table 4 and Figure 6).
In the rainy season experiment, spike length was not significantly affected (p > 0.05) by the application of both biochar and fertilizer (Table 4). However, the spike length was greater in WHB10F200 (6.75 cm) than in the control, WHB0F200 (6.63 cm). In the dry season, the main effects of biochar and fertilizer significantly (p < 0.001) affected the spike length of the crop (Table A1). Spike length was significantly affected by biochar compared with that without biochar. However, there was no significant difference in spike length between treatments that received different rates of biochar and fertilizer. Spike length increased significantly (p < 0.001), increasing from 6.60 cm (WHB0F0I100) to 10.1 cm (WHB20F200I100; Table 4) in the dry season. Although there were no significant differences between treatments, spike length was higher in plots that received full irrigation (I100) than in plots that received 50% irrigation.
Although there was no significant difference in spikelet number during the rainy season, it was higher in plots amended with biochar than in those without biochar (Table 4). However, in the dry season, spikelet number was significantly affected (p < 0.001), with the main effect of biochar and fertilizer (Table A1). The highest spikelet number was observed in WHB20F200I100 and WHB10F200I100 (16.3), whereas the lowest was observed in WHB0F0I100 (8; Table 4).
During the rainy season, the grain number of the wheat crop was not significantly affected (p > 0.05; Table 4). However, the highest grain number (36.7) was observed in the plots amended with biochar (WHB20F200) compared to that in the unamended plot (34.9; WHB0F200). However, in the dry season, the grain number was significantly (p < 0.001) affected by the main effects of biochar and fertilizer (Table A1). The grain number increased significantly from 19.4 (WHB0F0I100) to 40.7 (WHB20F200I100) during the dry season (Table 4).
In the rainy season experiment, although there was no significant difference among treatments, a higher grain yield was recorded in WHB10F200 (5.68 t ha−1) than in WHB0F200 (5.34 t ha−1; Figure 6a). The grain yield of the wheat crop generally increased with an increase in biochar rate and fertilizer in the dry season (Figure 6b). During the dry season, both the main effects of biochar and fertilizer (p < 0.001), as well as their interaction (p < 0.01), had a significant impact on wheat grain yield (Table A1). It was also influenced by irrigation water, with plots receiving full irrigation water showing higher grain yields than those receiving deficit irrigation, but the difference was not significant. The grain yield increased significantly (p < 0.001) from 0.881 t ha−1 (WHB0F0I100) to 4.10 t ha−1 (WHB20F200I100) in the dry season (Figure 6b).

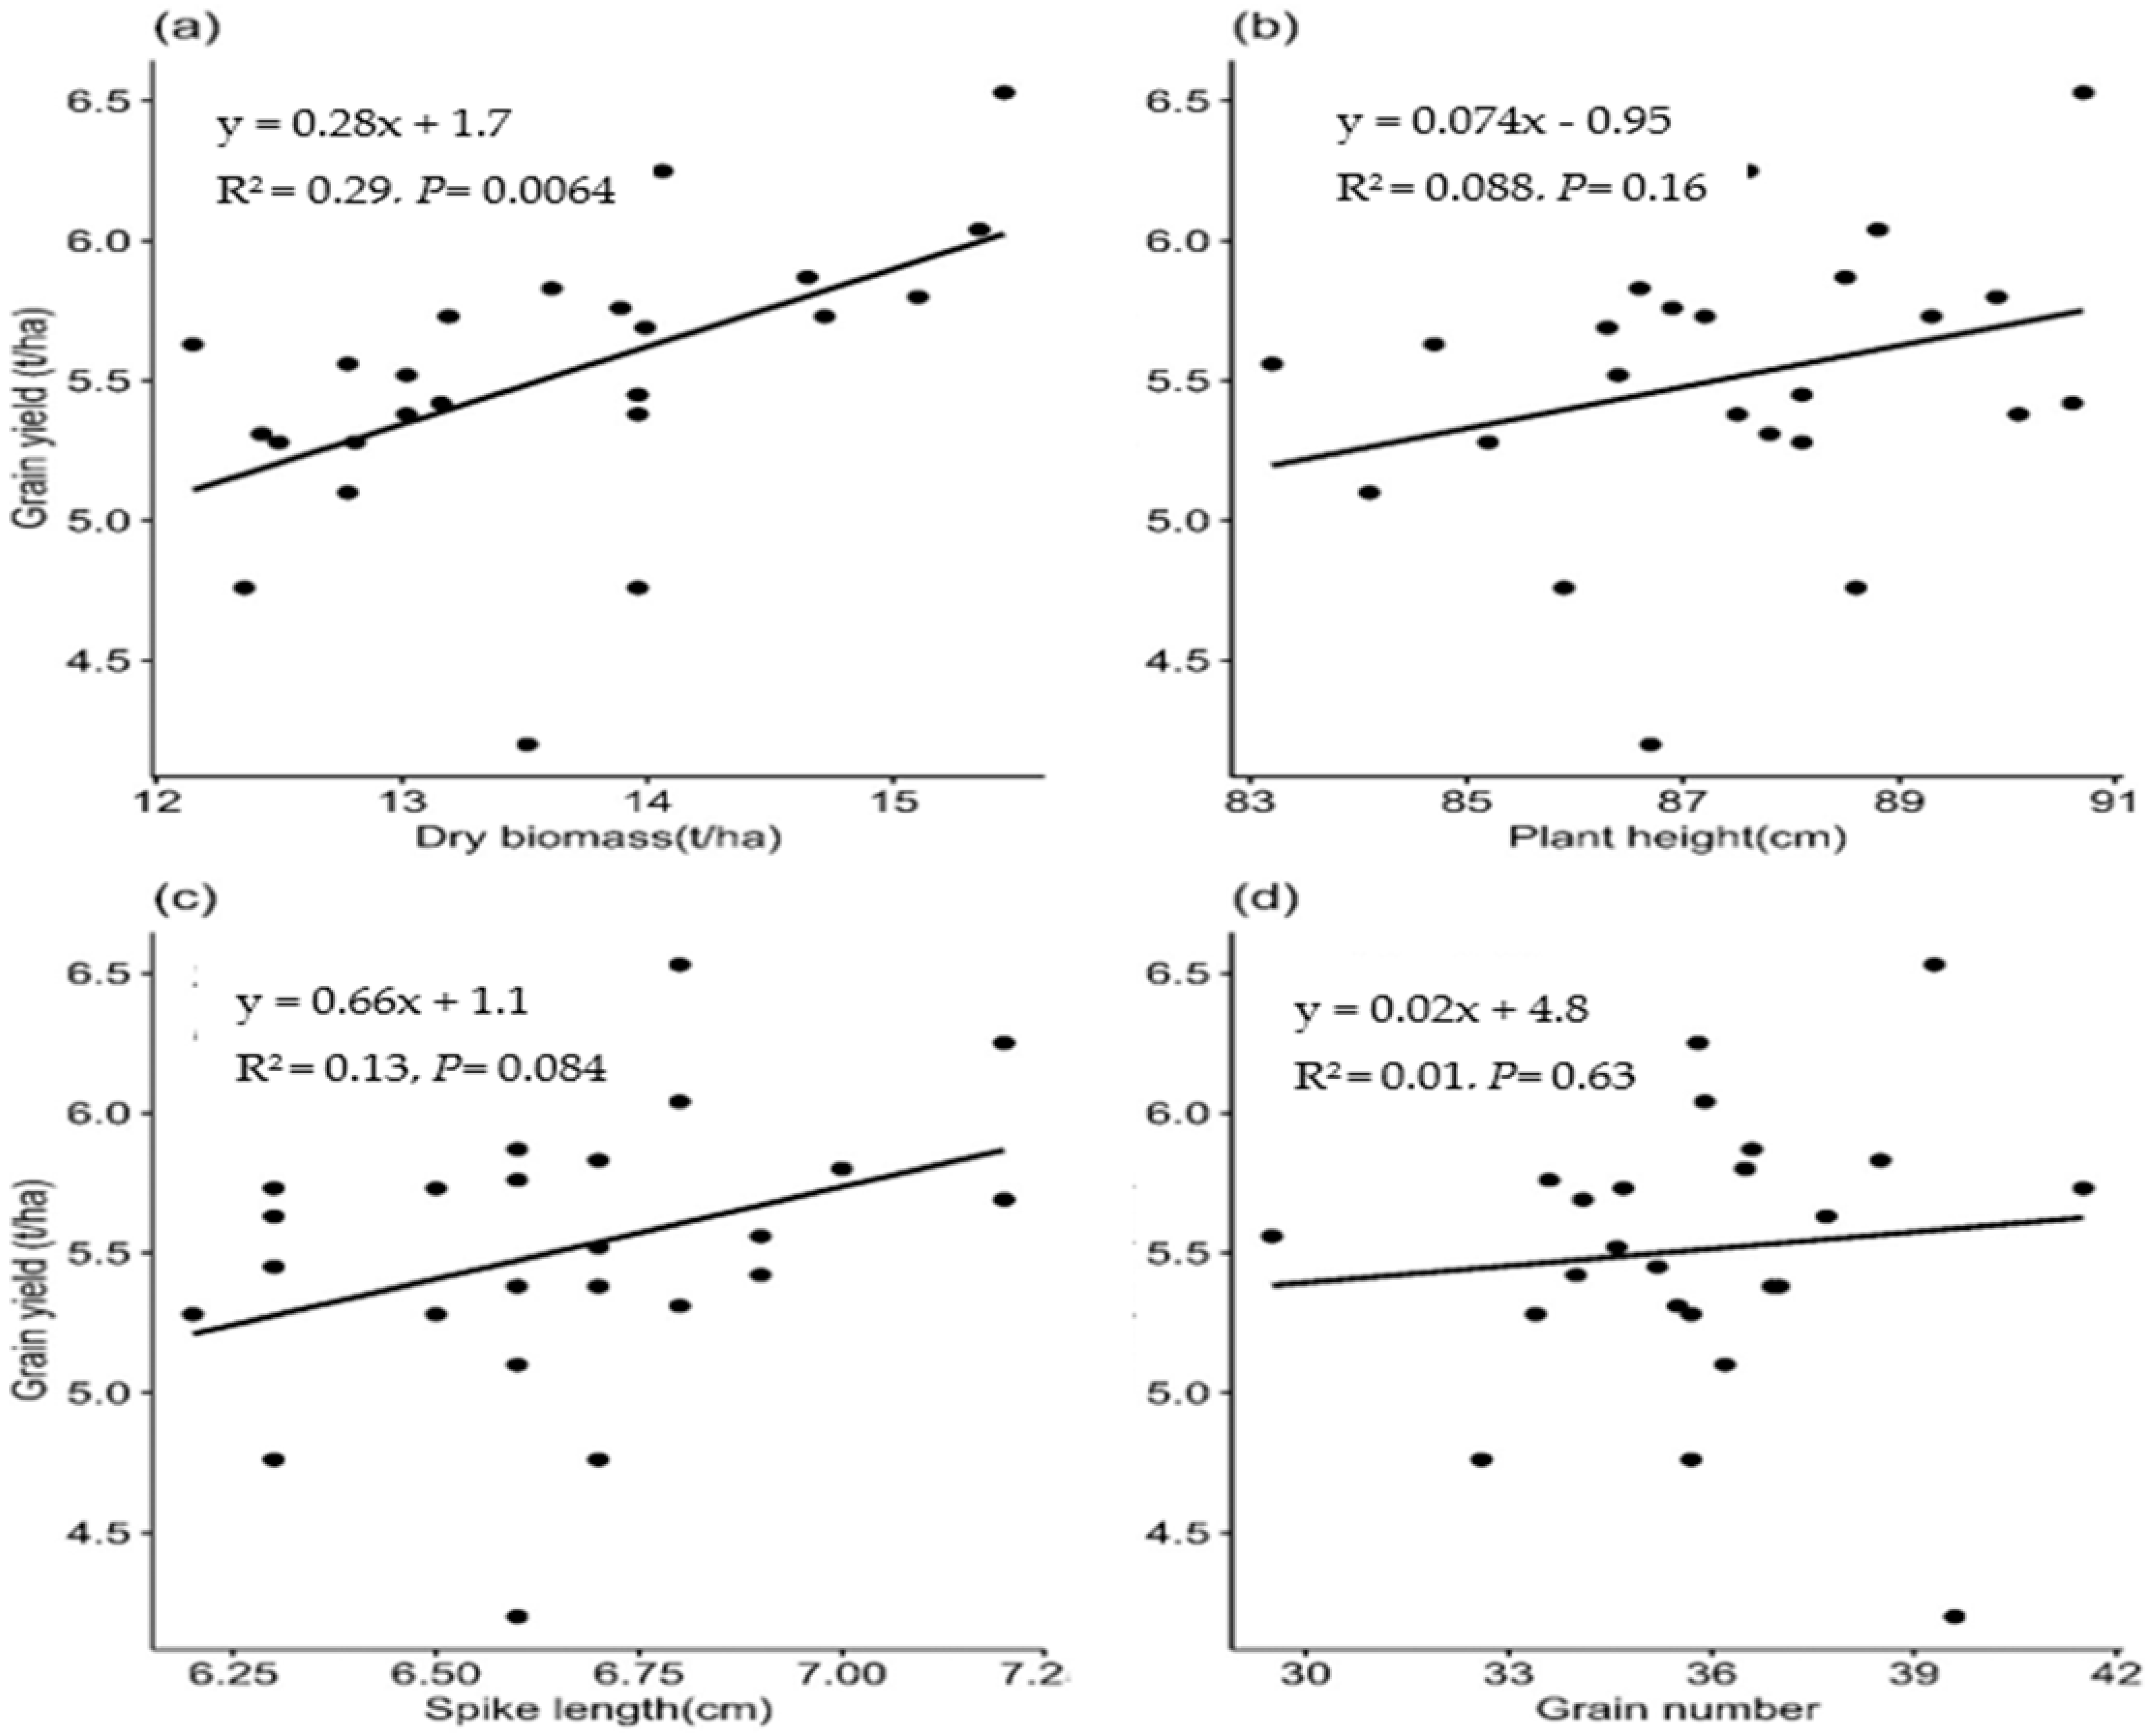
3.4. Correlation Analysis Between Growth and Yield Components

In the rainy season (Figure 7), plant height, dry biomass, spike length, and grain number exhibited a positive correlation with grain yield; however, the correlation was not statistically significant, except for dry biomass. Despite its low value, the best r2 value was observed for the dry biomass during the rainy season. Spike length showed the highest correlation (0.66), although it was not significantly correlated with grain yield during the rainy season.
During the dry season (Figure 8), all growth and yield components, including dry biomass, plant height, spike length, leaf SPAD value, leaf area, and grain number, were significantly positively correlated with grain yield (p < 0.001). Spike length exhibited the highest contribution (0.70), followed by dry biomass (0.19), for wheat grain yield during the dry season (Figure 8).

3.5. Production Cost–Benefit Analysis

The total wheat crop production cost was generally higher in the dry season (USD 931–1521) than in the rainy season (USD 636–993) (Table 5). The highest cost was attributed to biochar production (USD 178–356 and USD 179–357) in the rainy and dry seasons, respectively. Gross returns ranged from USD 5794–5924 and USD 960–4598 in the rainy and dry seasons, respectively. The highest net return (USD 5351 and USD 3084) was observed in the plots that received 10 t ha−1 biochar with 200 kg ha−1 fertilizer in both the rainy and dry seasons, respectively.

4. Discussion

4.1. Effects of Biochar, Fertilizer, and Irrigation on Wheat Growth Components

The combined application of biochar and inorganic fertilizer improves crop growth components by enhancing soil nutrient retention and availability [42], buffering soil pH, improving soil structure and aeration [43], increasing soil water retention [19], and boosting soil microbial activity [44]. Moreover, the presence of organic matter in the soil also can amplify the positive effects of biochar on soil properties and plant growth. The interaction between biochar and organic matter can lead to improved nutrient availability, soil structure, microbial activity, water retention, pH buffering, carbon sequestration, and contaminant stabilization, ultimately enhancing soil health and crop productivity [45]. In the current study, the growth components of the wheat crop were positively affected by biochar and fertilizer application in both the rainy and dry seasons. However, in the rainy season, although the growth components of the wheat crop were influenced by the application of biochar, the impact was not statistically significant.
Measuring plant height is an essential component of crop management and yield prediction, providing valuable information for optimizing agronomic practices and assessing crop health to maximize productivity and profitability [46]. In the rainy season of our study, although no significant difference was observed, plant height was improved by 3.84% (WHB20F200) compared to the control (WHB0F200). However, in the dry season, plant height was significantly affected by the combined application of biochar and fertilizer. Plant height was improved by 63.6% (WHB20F200I100) compared to the control (WHB0F200I100). Similarly, in the study by Sial et al. [47], wheat crop plant height was improved by 40.3% due to amendment of the soil with biochar and chemical fertilizer compared to that without biochar and fertilizer. This is likely due to biochar’s pH buffering, which optimizes nutrient availability, especially in acidic soils. This allows wheat plants to absorb nutrients more effectively, supporting taller growth [48]. Plant height was much more affected by biochar application than by fertilizer and irrigation water in the dry season in the current study. Plant height decreased by only 3.65% when the NPS fertilizer amount was reduced by 50% (100 kg ha−1), indicating that the combined application of biochar and fertilizer is a promising strategy to minimize fertilizer usage. Moreover, reducing the irrigation water to 50% did not significantly affect plant height. In the 50% crop water requirement (WHB20F200I50) treatment, the plant height was improved by 51.3% compared to the control (WHB0F200I100), which was not statistically significant with the 100% crop water requirement (WHB20F200I100), demonstrating biochar’s ability to conserve irrigation water. This is likely due to biochar’s capacity to increase available water for plants by improving soil physical properties, such as bulk density and soil porosity [49]. Our results were consistent with those of Kangoma et al. [50], who showed that the combined application of biochar and fertilizer enhanced crop plant height by 6.40% under moderate deficit irrigation compared to flood irrigation.
Measuring plant leaf area is a fundamental aspect for estimating crop photosynthetic potential, assessing plant growth and development, understanding plant responses to the environment, and enhancing crop productivity and quality [51]. In our study, the leaf area was improved significantly by 124–255% (WHB20F100I100) compared to that of the control (WHB0F200I100) during the growth period of the crop in the dry season. As explained by Minhas et al. [52], biochar soil amendments, particularly when combined with fertilizer, improve chlorophyll content, which in turn enhances leaf area development. Lowering the irrigation amount to 50% with the same amount of biochar and fertilizer did not significantly affect leaf area compared with the 100% crop water requirement (I100) treatments. It was significantly improved by 106–187% when the irrigation amount was reduced to 50% (WHB20F100I50) compared to the control (WHB0F200I100), which was not significantly different from the full water requirement (WHB20F100I100). This improvement is likely due to the amendment of the soil with biochar, which enhances water retention by storing moisture within its porous structure [53]. The leaf area was not significantly affected by the WHB rate. This indicates the possibility of using the minimum amount (e.g., 5 t ha−1) of WHB while minimizing the irrigation water to 50% with a minimum effect on the leaf area of the wheat crop. These findings align with previous research, where applying 15 t ha−1 of biochar in combination with nitrogen fertilizer improved the wheat crop leaf area by 45.0% and 67.0% compared to fertilizer alone and without both biochar and fertilizer, respectively [54]. Similarly, the combined use of biochar and fertilizer improved the leaf area of wheat by 57.3% compared to that without biochar and fertilizer [55].
Measuring dry biomass is crucial for assessing crop yield, optimizing resources, and enhancing agricultural productivity and profitability. In the rainy season, wheat dry biomass improved by 13.1% (WHB20F200) compared to that of the control (WHB0F200). In the dry season, dry biomass was more affected by the main and interactive effects of biochar and fertilizer application than by the irrigation amount. Lowering the irrigation amount to 50% of the crop water requirement did not significantly affect dry biomass. The highest biomass was in the treatment of WHB20F200I100 (36.5 t ha−1), which was not significantly different from the treatment that received 50% of crop water requirement (WHB20F200I50; 30.1 t/ha) at 110 DAS. This is probably due to the ability of biochar to reduce the amount of water depletion under deficit irrigation, resulting in increased irrigation and crop water-use efficiencies [56]. Moreover, biomass was not significantly affected by reducing NPS fertilizer from 200 to 100 kg ha−1. This is likely attributable to the ability of biochar to enhance fertilizer utilization, especially when combined with moderately reduced inorganic fertilizers [57]. Additionally, reducing the biochar rate did not significantly affect the dry biomass. The dry biomass in WHB10F200I100 (12.5–30.7 t ha−1) did not significantly differ from WHB20F200I100 (16.3–36.5 t ha−1), indicating the potential for using a reduced amount of biochar with minimal impact on biomass yield. Olmo et al. [58] demonstrated that the above-ground biomass of wheat significantly improved due to the application of biochar (13.5–15 t ha−1) after 124 DAS compared to unamended soil (10.7–11.2 t ha−1). Similarly, research conducted by Cong et al. [59] on biochar application under deficit irrigation showed the highest above-ground biomass (25.7 t ha−1) was in the treatment of 20 t ha−1 biochar with 0.8 ETc compared to control with no biochar (17.7 t ha−1). Moreover, the high straw-to-grain ratio observed in this study may be attributed to specific growth conditions during the dry season, including enhanced vegetative growth due to the biochar and fertilizer combination, as well as varietal characteristics of the wheat.
The SPAD observations obtained from leaves are highly and positively correlated with leaf chlorophyll, which estimates the nitrogen nutritional status of crops and provides guidance for more accurate nitrogen fertilizer management [60,61]. The chlorophyll concentration of wheat leaf SPAD values ranged from 28 to 35, 35 to 45, and 45 to 50 in the no, lower, and higher rates of fertilizer plots, respectively [62]. Similar consistency with SPAD values of 28.1 (WHB0F0I100) and 39.1 (WHB0F200I100) in unfertilized and fertilized plants at 70 DAS, respectively, in our study. The SPAD value at the heading stage can provide a more accurate estimation of the final yield of wheat crops [63]. In our study, the application of biochar and fertilizer improved the SPAD value at the heading stage (90 DAS) of the crop by 28.5% (WHB20F200I100) compared with the control (WHB0F200I100). The interaction between biochar and fertilizer significantly (except at 90 DAS) affected the SPAD value. The SPAD value improved by 65.1-143% (WHB20F200I100) compared to without both biochar and fertilizer (WHB0F0I100) and 25.1-36.2% (WHB20F200I100) compared to with only fertilizer (WHB0F200I100) at different growth stages of wheat crops. This result was consistent with the experiment conducted by Zulfiqar et al. [64] on the effect of biochar on mitigating drought on wheat crops, which showed enhancement of chlorophyll a (19.3%) and chlorophyll b (22.2%) compared to the control (without biochar). Ghorbani et al. [65] also showed that the SPAD value was significantly affected by the combined application of biochar and chemical fertilizers at the jointing and grain-filling stages of wheat crops. This is probably due to increased soil N availability, followed by a subsequent increase in foliar N concentrations due to biochar soil amendment [66].

4.2. Effects of Biochar, Fertilizer, and Irrigation on Wheat Yield Components

The combined application of WHB and NPS fertilizers positively affected wheat crop yield components in both the rainy and dry seasons. However, yield components were not significantly affected by the combined application during the rainy season.
The combined application of biochar and NPS fertilizers has been shown to improve crop yields. This improvement is attributed to several mechanisms, including the enhancement of soil water holding capacity [53], irrigation water use, crop water use efficiency, and nutrient availability [31]. Biochar application has been reported to reduce soil bulk density and increase soil porosity [67], while also decreasing irrigation water loss [19]. These combined effects contribute to increased crop yield. Sadaf et al. [55] showed that the combined application of biochar and NPK inorganic fertilizer improved wheat grain yield components of spike length, number of spikelets, and number of grains by 27%, 31%, and 29%, respectively, compared with the control plot. During the rainy season in our study, although there were no significant differences among treatments, the combined application of biochar and fertilizer improved spike length, spikelet number, grain number, and grain yield by 1.81%, 2.16%, 5.16%, and 6.40%, respectively. This non-significant improvement was likely due to the absence of water scarcity during the rainy season, which is a critical factor that affects crop production [31]. In the dry season, the spike length improved by 53.0%, 27.4%, and 4.45% because of the combined application of biochar and fertilizer (WHB20F200I100) compared with WHB0F0I100, WHB0F200I100, and WHB20F0I100, respectively. The spikelet number, grain number, and grain yield of wheat also improved by 33.6%, 28.0%, and 173%, respectively, in the WHB20F200I100 treatment compared to the control (WHB0F200I100). A similar finding by Hu et al. [68] also showed that wheat grain yield was improved by 81.7% by the application of wheat straw-derived biochar and inorganic NP fertilizer compared to that without both biochar and fertilizer. Additionally, the application of 20 t ha−1 biochar prepared from acacia wood improved wheat grain yield by 13.2% [8]. These results demonstrate that biochar derived from water hyacinth can achieve comparable yield improvements to biochar produced from other feedstocks. This improvement was likely due to the high surface area of the biochar [69], which enabled it to retain nutrients and increase its availability for crops. Additionally, the liming effect of biochar reduces the acidity of the soil and enhances soil nutrient availability and microbial activity, thereby contributing to crop improvement [70]. Moreover, biochar has a high degree of thermal stability, is highly porous, and has stronger adsorbability of nutrients that decrease from leaching and decrease availability for plants. In plots treated with the combined application of biochar and fertilizer, wheat yield components were not significantly affected by reducing the irrigation water to 50% of the crop water requirement. In treatments receiving 50% of the crop water requirement (WHB20F200I50), wheat yield components, such as plant spike length (19.4%), spikelet number (28.7%), grain number (22.0%), and grain yield (153%), were improved compared to the control (WHB0F200I100). This implies the possibility of growing wheat crops under deficit irrigation with biochar amendment without significant yield loss. This result was consistent with the study by Zulfiqar et al. [64], who showed that biochar application substantially improved spike length (16.6%), number of grains (13.9%), and biological yield (13.1%) when compared with the control treatment by reducing the detrimental effects of drought. Moreover, grain yield did not show a significant reduction when the amount of NPS fertilizer was decreased by 50% (100 kg−1). The grain yield improved by 173% in the treatments that received 200 kg ha−1 (WHB20F200I100), whereas it was improved by 147% in the treatments that received 50% fertilizer (100 kg ha−1; WHB20F100I100) of NPS fertilizer. This implies the possibility of reducing the amount of fertilizer used when combined with biochar. In the study by Zhang et al. [57], the maximum crop yield was recorded in treatments that received 70% chemical fertilizer combined with biochar. Moradi et al. [71] also observed an increased yield of rapeseed cultivars when treated simultaneously with combined biochar and 50% N application. Similarly, Singh et al. [72] reported that the application of biochar under deficit irrigation improved the yield components of sweet corn crops. Soil amendment with biochar under deficit irrigation, particularly during the critical growth periods of tillering, flowering, and grain filling, can improve wheat crop yield components with minimal impact [73]. The two-year study by Singh et al. [72] demonstrated that reducing water use to 70% of ETc, while maintaining plant physiology, growth, and yield comparable to 100% ETc, was achievable with the amendment of biochar. This effect is likely attributable to biochar’s ability to enhance irrigation water productivity by improving soil properties under water-deficit conditions. According to Cakmakcı and Sahın [32], under 50% water deficit conditions, biochar amendment increased the irrigation water productivity as well as water savings from 8.30% to 18.4% at different rates of biochar.

4.3. Correlation Analysis Between Yield and Growth Components

Understanding the contribution of yield components to grain yield in different production environments is essential for increasing grain production [74]. The interaction between growth and yield components was not significant for grain yield during the rainy season. (Figure 7). However, in the dry season, all growth and yield components contributed better to grain yield (Figure 8). Spike length, which is related to the reproductive structure of wheat plants, exhibited the highest contribution to wheat grain yield during both the rainy and dry seasons. One unit of spike length increment could increase 0.66 and 0.70 units of grain yield in rainy and dry seasons, respectively. Longer spikes may have more florets and, therefore, more potential for grain development.

4.4. Production Cost–Benefit Analysis

Economic analysis of crop production is essential for optimizing resource use, managing risks, making informed decisions, and contributing to the overall sustainability and profitability of agricultural enterprises [75]. Biochar as a soil amendment has proven to be profitable and may be competitive with other soil amendments, such as lime or conventional fertilizers, particularly in the medium term (3–4 years) [75].
In our study, the production cost was higher by 28.1–56.1% in the rainy season and by 15.4–30.7% in the dry season in biochar-amended soil than in unamended plots. The gross return was higher in biochar-amended plots than in unamended plots by 2.24–6.42% and 150–177% in the rainy and dry seasons, respectively. This result is consistent with that of Wang et al. [76], where the gross production value of wheat in biochar-amended soil was 18.3-35.5% higher than in the unamended soil, with the gross return ratio of wheat production to total cost ranging from 1.96 to 2.25. In our study, net income was higher by 3.74% (WHB10F200) and 519% (WHB10F200I100) in the rainy and dry seasons, respectively, compared to the control (WHB0F200), with gross return ratios of 7.57 and 3.30, respectively. Moreover, the application of biochar alongside fertilizer consistently resulted in higher net returns compared to fertilizer-only treatments. These results demonstrate that biochar application enhances profitability, particularly under less favorable growing conditions, likely due to improved soil moisture retention and nutrient-use efficiency. The output income was higher in the rainy season, possibly due to the better fertility status of the experimental site during the rainy season than during the dry season, as indicated in Table 4. Higher net income was observed in the plots amended with a lower rate of biochar (10 t ha−1) because a higher rate of biochar increased the production cost. This finding is consistent with the study by Apori et al. [77], which reported a higher net income (176%) with the combined application of biochar and NPK fertilizer.

5. Conclusions

The combined application of biochar and NPS fertilizer improved wheat growth and yield components in both rainy and dry seasons. Specifically, the combined application enhanced plant height, dry biomass, spike length, spikelets, grain number, and grain weight. Additionally, in the dry season, this combination also improved leaf area and leaf SPAD value. The increase in grain yield was more pronounced in the dry season compared to the rainy season. Economic analysis showed the highest net return in both rainy and dry seasons with a lower biochar application rate. This increase in net returns is attributed to the reduced production costs associated with the lower biochar rate.
In conclusion, the findings highlight that wheat production under deficit irrigation does not compromise yield when the soil is amended with biochar and NPS fertilizer. Moreover, the combined application of biochar and fertilizer can reduce fertilizer costs by lowering the amount of fertilizer needed. These results have significant implications for sustainable and efficient wheat cultivation, especially in regions facing water scarcity, and for optimizing the use of agricultural resources. However, further experiments across various agroecologies and soil types over an extended period are necessary to fully understand the combined effects on crop yield.

Author Contributions

D.F. contributed to the conception and design of the work; data acquisition, collection, analysis, and interpretation; as well as drafting, revising, and final approval of the manuscript. F.A.M., Y.K., M.L. and T.W. contributed through supervision, drafting, revising, and final approval of the manuscript. S.A.L. was responsible for reviewing, editing, project administration, and final approval. S.S. contributed to conceptualization, investigation methodology, validation, supervision, reviewing, and editing; served as project leader; and gave final approval of the version. All authors have read and agreed to the published version of the manuscript.

Funding

This study was supported by the Science and Technology Research Partnership for Sustainable Development (SATREPS) program (Grant No. JPMJSA2005), with funding provided by the Japan Science and Technology Agency (JST) and the Japan International Cooperation Agency (JICA).

Data Availability Statement

The datasets generated and/or analyzed during the current study are available from the corresponding author upon reasonable request.

Acknowledgments

I would like to express my sincere gratitude to the Japan International Cooperation Agency (JICA) for generously funding this research. I also extend my heartfelt appreciation to the staff of Soka University and Injibara University for their unwavering support and for providing essential facilities that enabled the successful execution of experimental work.

Conflicts of Interest

The authors hereby declare that they have no financial, professional, or personal conflicts of interest that could have influenced the research, interpretation of results, or the integrity of this publication.

Appendix A

Table A1. Main and interaction effects of locally produced water hyacinth biochar, NPS inorganic fertilizer, and irrigation regimes on treatment outcomes during the dry season.
Plant
Height
Spike
Length
Spikelet
Number
Grain
Number
Leaf AreaLeaf SPAD ValueDry Biomass
709011070901107090110130
Days After Sowing (DAS)
B⁎⁎⁎⁎⁎⁎⁎⁎⁎⁎⁎⁎⁎⁎⁎⁎⁎⁎⁎⁎⁎⁎⁎⁎⁎⁎⁎⁎⁎⁎⁎⁎⁎⁎⁎⁎⁎⁎⁎⁎⁎⁎
Fns⁎⁎⁎⁎⁎⁎⁎⁎⁎⁎⁎⁎⁎⁎⁎⁎⁎⁎⁎⁎⁎⁎⁎⁎⁎⁎⁎⁎⁎⁎⁎⁎⁎⁎⁎⁎⁎
Insnsnsns⁎⁎⁎⁎⁎⁎⁎⁎⁎nsnsns⁎⁎⁎⁎⁎⁎nsns
B ⁎ Fnsnsns⁎⁎nsnsns⁎⁎ns⁎⁎⁎⁎⁎⁎⁎⁎⁎⁎⁎ns
B ⁎ Insnsnsns⁎⁎⁎ns⁎⁎⁎nsnsns⁎⁎⁎⁎⁎nsns
F ⁎ Insnsnsnsnsnsnsnsnsns⁎⁎nsnsns
B ⁎ F ⁎ Insnsnsnsnsnsnsnsnsns⁎⁎nsnsns
Where ⁎⁎⁎, ⁎⁎ and ns indicate highly significant (p < 0.001), significant (p < 0.05), and non-significant differences, respectively.

References

  1. Singh, S.K.; Kumar, S.; Kashyap, P.L.; Sendhil, R.; Gupta, O.P. Wheat BT—Trajectory of 75 Years of Indian Agriculture After Independence; Ghosh, P.K., Das, A., Saxena, R., Banerjee, K., Kar, G., Vijay, D., Eds.; Springer Nature: Singapore, 2023; pp. 137–162. ISBN 978-981-19-7997-2. [Google Scholar]
  2. Tadesse, W.; Zegeye, H.; Debele, T.; Kassa, D.; Shiferaw, W.; Solomon, T.; Negash, T.; Geleta, N.; Bishaw, Z.; Assefa, S. Wheat Production and Breeding in Ethiopia: Retrospect and Prospects. Crop Breed. Genet. Genom. 2022, 4, e220003. [Google Scholar] [CrossRef]
  3. Haile, G.G. Irrigation in Ethiopia, a Review. J. Environ. Earth Sci. 2015, 5, 141–147. [Google Scholar]
  4. Asmamaw, D.K.; Janssens, P.; Dessie, M.; Tilahun, S.A.; Adgo, E.; Nyssen, J.; Walraevens, K.; Assaye, H.; Yenehun, A.; Nigate, F.; et al. Effect of Deficit Irrigation and Soil Fertility Management on Wheat Production and Water Productivity in the Upper Blue Nile Basin, Ethiopia. Agric. Water Manag. 2023, 277, 108077. [Google Scholar] [CrossRef]
  5. Zhao, W.; Liu, L.; Shen, Q.; Yang, J.; Han, X.; Tian, F.; Wu, J. Effects of Water Stress on Photosynthesis, Yield, and Water Use Efficiency in Winter Wheat. Water 2020, 12, 2127. [Google Scholar] [CrossRef]
  6. Takala, B. Soil Acidity and Its Management Options in Western Ethiopia: Review. J. Environ. Earth Sci. 2019, 9, 2224–3216. [Google Scholar] [CrossRef]
  7. Eshete, D.G.; Sinshaw, B.G.; Legese, K.G. Critical Review on Improving Irrigation Water Use Efficiency: Advances, Challenges, and Opportunities in the Ethiopia Context. Water-Energy Nexus 2020, 3, 143–154. [Google Scholar] [CrossRef]
  8. Khan, M.A.; Basir, A.; Fahad, S.; Adnan, M.; Saleem, M.H.; Iqbal, A.; Amanullah; Al-Huqail, A.A.; Alosaimi, A.A.; Saud, S.; et al. Biochar Optimizes Wheat Quality, Yield, and Nitrogen Acquisition in Low Fertile Calcareous Soil Treated with Organic and Mineral Nitrogen Fertilizers. Front. Plant Sci. 2022, 13, 879788. [Google Scholar] [CrossRef]
  9. Ginebra, M.; Muñoz, C.; Calvelo-Pereira, R.; Doussoulin, M.; Zagal, E. Biochar Impacts on Soil Chemical Properties, Greenhouse Gas Emissions and Forage Productivity: A Field Experiment. Sci. Total Environ. 2022, 806, 150465. [Google Scholar] [CrossRef]
  10. Fentie, D.; Mihretie, F.A.; Kohira, Y.; Legesse, S.A.; Lewoyehu, M.; Sato, S. Enhancing Soil Environments and Wheat Production through Water Hyacinth Biochar under Deficit Irrigation in Ethiopian Acidic Silty Loam Soil. Soil Syst. 2024, 8, 72. [Google Scholar] [CrossRef]
  11. Gezahegn, A.; Selassie, G.Y.; Agegnehu, G.; Addisu, S.; Asargew Mihretie, F.; Kohira, Y.; Sato, S. Pyrolysis Temperature Changes the Physicochemical Characteristics of Water Hyacinth-Based Biochar as a Potential Soil Amendment. Biomass Convers. Biorefinery 2025, 15, 3737–3752. [Google Scholar] [CrossRef]
  12. Domingues, R.R.; Sánchez-Monedero, M.A.; Spokas, K.A.; Melo, L.C.A.; Trugilho, P.F.; Valenciano, M.N.; Silva, C.A. Enhancing Cation Exchange Capacity of Weathered Soils Using Biochar: Feedstock, Pyrolysis Conditions and Addition Rate. Agronomy 2020, 10, 824. [Google Scholar] [CrossRef]
  13. Ghorbani, M.; Amirahmadi, E. Biochar and Soil Contributions to Crop Lodging and Yield Performance—A Meta-Analysis. Plant Physiol. Biochem. 2024, 215, 109053. [Google Scholar] [CrossRef]
  14. Rehman, M.; Saleem, M.H.; Fahad, S.; Bashir, S.; Peng, D.; Deng, G.; Alamri, S.; Siddiqui, M.H.; Khan, S.M.; Shah, R.A.; et al. Effects of Rice Straw Biochar and Nitrogen Fertilizer on Ramie (Boehmeria nivea L.) Morpho-Physiological Traits, Copper Uptake and Post-Harvest Soil Characteristics, Grown in an Aged-Copper Contaminated Soil. J. Plant Nutr. 2021, 45, 11–24. [Google Scholar] [CrossRef]
  15. Jalal, F.; Khan, Z.H.; Imtiz, M.; Khan, M.A.; Said, F.; Hussain, S.; Shah, F.; Adnan, M. Biochar for Improving Crop Productivity and Soil Fertility. In Sustainable Agriculture Reviews 61: Biochar to Improve Crop Production and Decrease Plant Stress Under a Changing Climate; Fahad, S., Danish, S., Datta, R., Saud, S., Lichtfouse, E., Eds.; Springer International Publishing: Cham, Switzerland, 2023; pp. 75–98. ISBN 978-3-031-26983-7. [Google Scholar]
  16. Wondie, A.; Seid, A.; Molla, E.; Goshu, G.; Gkidan, W.; Shibabaw, A.; Genanew, M. Preliminary Assessment of Water Hyacinth (Eichornia crassipes) in Lake Tana. In Proceedings of the National Workshop (Biological Society of Ethiopia), Addis Ababa, Ethiopia; 2012. [Google Scholar]
  17. Baiamonte, G.; Minacapilli, M.; Crescimanno, G. Effects of Biochar on Irrigation Management and Water Use Efficiency for Three Different Crops in a Desert Sandy Soil. Sustainability 2020, 12, 7678. [Google Scholar] [CrossRef]
  18. Hou, J.; Zhang, J.; Liu, X.; Ma, Y.; Wei, Z.; Wan, H.; Liu, F. Effect of Biochar Addition and Reduced Irrigation Regimes on Growth, Physiology and Water Use Efficiency of Cotton Plants under Salt Stress. Ind. Crops Prod. 2023, 198, 116702. [Google Scholar] [CrossRef]
  19. Wang, H.; Shao, D.; Ji, B.; Gu, W.; Yao, M. Biochar Effects on Soil Properties, Water Movement and Irrigation Water Use Efficiency of Cultivated Land in Qinghai-Tibet Plateau. Sci. Total Environ. 2022, 829, 154520. [Google Scholar] [CrossRef] [PubMed]
  20. Li, Y.; Feng, G.; Tewolde, H. Biochar Derived from Papermill Factories Improves Soil Physical and Hydraulic Properties in No-till Cotton Fields. Biochar 2023, 5, 35. [Google Scholar] [CrossRef]
  21. Ye, L.; Camps-Arbestain, M.; Shen, Q.; Lehmann, J.; Singh, B.; Sabir, M. Biochar Effects on Crop Yields with and without Fertilizer: A Meta-Analysis of Field Studies Using Separate Controls. Soil Use Manag. 2020, 36, 2–18. [Google Scholar] [CrossRef]
  22. Sun, Z.; Hu, Y.; Shi, L.; Li, G.; Pang, Z.; Liu, S.; Chen, Y.; Jia, B. Effects of Biochar on Soil Chemical Properties: A Global Meta-Analysis of Agricultural Soil. Plant Soil Environ. 2022, 68, 272–289. [Google Scholar] [CrossRef]
  23. Bornø, M.L.; Müller-Stöver, D.S.; Liu, F. Contrasting Effects of Biochar on Phosphorus Dynamics and Bioavailability in Different Soil Types. Sci. Total Environ. 2018, 627, 963–974. [Google Scholar] [CrossRef]
  24. Alkharabsheh, H.M.; Seleiman, M.F.; Battaglia, M.L.; Shami, A.; Jalal, R.S.; Alhammad, B.A.; Almutairi, K.F.; Al-Saif, A.M. Biochar and Its Broad Impacts in Soil Quality and Fertility, Nutrient Leaching and Crop Productivity: A Review. Agronomy 2021, 11, 993. [Google Scholar] [CrossRef]
  25. Weber, K.; Quicker, P. Properties of Biochar. Fuel 2018, 217, 240–261. [Google Scholar] [CrossRef]
  26. Bai, S.H.; Omidvar, N.; Gallart, M.; Kämper, W.; Tahmasbian, I.; Farrar, M.B.; Singh, K.; Zhou, G.; Muqadass, B.; Xu, C.Y.; et al. Combined Effects of Biochar and Fertilizer Applications on Yield: A Review and Meta-Analysis. Sci. Total Environ. 2022, 808, 152073. [Google Scholar] [CrossRef] [PubMed]
  27. Habtie, A.; Mezgebu, G.; Esubalew, S.; Bainesagn, W. Screening of Napier Grass (Pennisetum purpureum) Accessions Tolerant to Acid Soils in Some Areas of Ethiopia. Int. J. Sci. 2020, 4, 1–6. [Google Scholar]
  28. Alemayehu, M.; Jemberie, M. Optimum Rates of NPS Fertilizer Application for Economically Profitable Production of Potato Varieties at Koga Irrigation Scheme, Northwestern Ethiopia. Cogent Food Agric. 2018, 4, 1439663. [Google Scholar] [CrossRef]
  29. Alfadil, A.A.; Xia, J.; Shaghaleh, H.; Alhaj Hamoud, Y.; Ibrahim, J.N.; Hamad, A.A.A.; Fahad Rahim, S.; Sheteiwy, M.S.; Wu, T. Wheat Straw Biochar Application Improves the Morphological, Physiological, and Yield Attributes of Maize and the Physicochemical Properties of Soil under Deficit Irrigation and Salinity Stress. J. Plant Nutr. 2021, 44, 2399–2420. [Google Scholar] [CrossRef]
  30. Singh, M.; Saini, R.K.; Singh, S.; Sharma, S.P. Potential of Integrating Biochar and Deficit Irrigation Strategies for Sustaining Vegetable Production in Water-Limited Regions: A Review. HortScience 2019, 54, 1872–1878. [Google Scholar] [CrossRef]
  31. Faloye, O.T.; Alatise, M.O.; Ajayi, A.E.; Ewulo, B.S. Effects of Biochar and Inorganic Fertiliser Applications on Growth, Yield and Water Use Efficiency of Maize under Deficit Irrigation. Agric. Water Manag. 2019, 217, 165–178. [Google Scholar] [CrossRef]
  32. Cakmakcı, T.; Sahın, U. Yield, Physiological Responses and Irrigation Water Productivity of Capia Pepper (Capsicum annuum L.) at Deficit Irrigation and Different Biochar Levels. Gesunde Pflanz. 2023, 75, 317–327. [Google Scholar] [CrossRef]
  33. Ullah, N.; Ditta, A.; Khalid, A.; Mehmood, S.; Rizwan, M.S.; Ashraf, M.; Mubeen, F.; Imtiaz, M.; Iqbal, M.M. Integrated Effect of Algal Biochar and Plant Growth Promoting Rhizobacteria on Physiology and Growth of Maize Under Deficit Irrigations. J. Soil Sci. Plant Nutr. 2020, 20, 346–356. [Google Scholar] [CrossRef]
  34. Derebe, B.; Bitew, Y.; Asargew, F.; Chakelie, G. Optimizing Time and Split Application of Nitrogen Fertilizer to Harness Grain Yield and Quality of Bread Wheat (Triticum aestivum L.) in Northwestern Ethiopia. PLoS ONE 2022, 17, e0279193. [Google Scholar] [CrossRef]
  35. Deo, K.; Singh, A.; Mishra, S.R.; Singh, A.K.; Mishra, A.N. Water Requirement of Wheat Crop for Optimum Production Using CROPWAT Model. J. Med. Plants 2017, 5, 338–342. [Google Scholar]
  36. Tewabe, D. Determination of Crop Water Requirements and Irrigation Scheduling of Wheat Using Cropwat at Koga and Rib Irrigation Scheme, Ethiopia. Indian J. Ecol. 2022, 49, 363–371. [Google Scholar] [CrossRef]
  37. Desalegn, T.; Abera, D.; Indris, S.; Tolcha, W.; Hordofa, T. Results of Natural Resources Management Research In Proceedings of the Natural Resources Management Research Completed Research Activities Workshop, Addis Ababa, Ethiopia, 25–26 November 2019; ISBN 9789994466580.
  38. Islam, M.R.; Haque, K.M.S.; Akter, N.; Karim, M.A. Leaf Chlorophyll Dynamics in Wheat Based on SPAD Meter Reading and Its Relationship with Grain Yield. Sci. Agric. 2014, 4, 4–9. [Google Scholar] [CrossRef]
  39. Vijay, V.; Shreedhar, S.; Adlak, K.; Payyanad, S.; Sreedharan, V.; Gopi, G.; Sophia van der Voort, T.; Malarvizhi, P.; Yi, S.; Gebert, J.; et al. Review of Large-Scale Biochar Field-Trials for Soil Amendment and the Observed Influences on Crop Yield Variations. Front. Energy Res. 2021, 9, 710766. [Google Scholar] [CrossRef]
  40. The R Core Team R: A Language and Environment for Statistical Computing; R Foundation for Statistical Computing: Vienna, Austria, 2010.
  41. Shapiro, S.S.; Wilk, M.B. An Analysis of Variance Test for Normality (Complete Samples). Biometrika 1965, 52, 591–611. [Google Scholar] [CrossRef]
  42. Gupta, R.K.; Vashisht, M.; Naresh, R.K.; Dhingra, N.; Sidhu, M.S.; Singh, P.K.; Rani, N.; Al-Ansari, N.; Alataway, A.; Dewidar, A.Z.; et al. Biochar Influences Nitrogen and Phosphorus Dynamics in Two Texturally Different Soils. Sci. Rep. 2024, 14, 6533. [Google Scholar] [CrossRef]
  43. Park, J.H.; Yun, J.J.; Kim, S.H.; Park, J.H.; Acharya, B.S.; Cho, J.S.; Kang, S.W. Biochar Improves Soil Properties and Corn Productivity under Drought Conditions in South Korea. Biochar 2023, 5, 66. [Google Scholar] [CrossRef]
  44. Huang, K.; Zhang, J.; Tang, G.; Bao, D.; Wang, T.; Kong, D. Impacts and Mechanisms of Biochar on Soil Microorganisms. Plant Soil Environ. 2023, 69, 45–54. [Google Scholar] [CrossRef]
  45. Kong, L.; Song, B.; Zhang, T.; Gao, K.; Liu, J. Effects of Soil Organic Matter on Biochar Application in Developing the Biodegradation Potentials of Polycyclic Aromatic Hydrocarbons (PAHs). Appl. Soil Ecol. 2021, 167, 104046. [Google Scholar] [CrossRef]
  46. Wang, X.; Singh, D.; Marla, S.; Morris, G.; Poland, J. Field-Based High-Throughput Phenotyping of Plant Height in Sorghum Using Different Sensing Technologies. Plant Methods 2018, 14, 53. [Google Scholar] [CrossRef]
  47. Sial, T.A.; Lan, Z.; Wang, L.; Zhao, Y.; Zhang, J.; Kumbhar, F.; Memon, M.; Lashari, M.S.; Shah, A.N. Effects of Different Biochars on Wheat Growth Parameters, Yield and Soil Fertility Status in a Silty Clay Loam Soil. Molecules 2019, 24, 1798. [Google Scholar] [CrossRef] [PubMed]
  48. Huang, K.; Li, M.; Li, R.; Rasul, F.; Shahzad, S.; Wu, C.; Shao, J.; Huang, G.; Li, R.; Almari, S.; et al. Soil Acidification and Salinity: The Importance of Biochar Application to Agricultural Soils. Front. Plant Sci. 2023, 14, 1206820. [Google Scholar] [CrossRef]
  49. Razzaghi, F.; Obour, P.B.; Arthur, E. Does Biochar Improve Soil Water Retention? A Systematic Review and Meta-Analysis. Geoderma 2020, 361, 114055. [Google Scholar] [CrossRef]
  50. Kangoma, E.; Blango, M.M.; Rashid-Noah, A.B.; Sherman-Kamara, J.; Moiwo, J.P.; Kamara, A. Potential of Biochar-Amended Soil to Enhance Crop Productivity under Deficit Irrigation. Irrig. Drain. 2017, 66, 600–614. [Google Scholar] [CrossRef]
  51. Richards, R.A. Selectable Traits to Increase Crop Photosynthesis and Yield of Grain Crops. J. Exp. Bot. 2000, 51, 447–458. [Google Scholar] [CrossRef] [PubMed]
  52. Minhas, W.A.; Hussain, M.; Mehboob, N.; Nawaz, A.; UL-Allah, S.; Rizwan, M.S.; Hassan, Z. Synergetic Use of Biochar and Synthetic Nitrogen and Phosphorus Fertilizers to Improves Maize Productivity and Nutrient Retention in Loamy Soil. J. Plant Nutr. 2020, 43, 1356–1368. [Google Scholar] [CrossRef]
  53. de Jesus Duarte, S.; Cerri, C.E.P.; Rittl, T.F.; Abbruzzin, T.F.; Pano, B.L.P. Biochar Physical and Hydrological Characterization to Improve Soil Attributes for Plant Production. J. Soil. Sci. Plant Nutr. 2023, 23, 3051–3057. [Google Scholar] [CrossRef]
  54. Yeboah, S.; Zhang, R.; Cai, L.; Li, L.; Xie, J.; Luo, Z.; Wu, J.; Antille, D.L. Soil Water Content and Photosynthetic Capacity of Spring Wheat as Affected by Soil Application of Nitrogen-Enriched Biochar in a Semiarid Environment. Photosynthetica 2017, 55, 532–542. [Google Scholar] [CrossRef]
  55. Sadaf, J.; Shah, G.A.; Shahzad, K.; Ali, N.; Shahid, M.; Ali, S.; Hussain, R.A.; Ahmed, Z.I.; Traore, B.; Ismail, I.M.I.; et al. Improvements in Wheat Productivity and Soil Quality Can Accomplish by Co-Application of Biochars and Chemical Fertilizers. Sci. Total Environ. 2017, 607–608, 715–724. [Google Scholar] [CrossRef]
  56. Babalola, T.E.; Adabembe, B.A.; Faloye, O.T. Water Use—Yield Relationship of Maize as Influenced by Biochar and Inorganic Fertilizer Applications in a Tropical Sandy Clay Loam Soil. Agric. Water Manag. 2022, 271, 107801. [Google Scholar] [CrossRef]
  57. Zhang, M.; Liu, Y.; Wei, Q.; Liu, L.; Gu, X.; Gou, J.; Wang, M. Chemical Fertilizer Reduction Combined with Biochar Application Ameliorates the Biological Property and Fertilizer Utilization of Pod Pepper. Agronomy 2023, 13, 1616. [Google Scholar] [CrossRef]
  58. Olmo, M.; Alburquerque, J.A.; Barrón, V.; del Campillo, M.C.; Gallardo, A.; Fuentes, M.; Villar, R. Wheat Growth and Yield Responses to Biochar Addition under Mediterranean Climate Conditions. Biol. Fertil. Soils 2014, 50, 1177–1187. [Google Scholar] [CrossRef]
  59. Cong, X.; Zhou, S.; Wang, T.; Pang, G.; Xu, Z. Effects of Biochar Application and Irrigation on Soil Preferential Flow and Winter Wheat Productivity. Pol. J. Environ. Stud. 2022, 31, 625–635. [Google Scholar] [CrossRef]
  60. Murdock, L.; Jones, S.; Bowley, C.; Needham, P.; James, J.; Howe, P. Using a Chlorophyll Meter to Make Nitrogen Recommendations on Wheat; University of Kentucky: Lexington, KY, USA, 1997. [Google Scholar]
  61. Schlichting, A.F.; Bonfim-silva, E.M.; Silva, M.D.C.; Pietro-souza, W.; Silva, T.J.A.; Farias, L.N. Revista Brasileira de Engenharia Agrícola e Ambiental Efficiency of Portable Chlorophyll Meters in Assessing the Nutritional Status of Wheat Plants. Rev. Bras. Eng. Agrícola Ambient. 2015, 19, 1148–1151. [Google Scholar] [CrossRef]
  62. Mehrabi, F.; Sepaskhah, A.R. Leaf Nitrogen, Based on SPAD Chlorophyll Reading Can Determine Agronomic Parameters of Winter Wheat. Int. J. Plant Prod. 2022, 16, 77–91. [Google Scholar] [CrossRef]
  63. Monostori, I.; Árendás, T.; Hoffman, B.; Galiba, G.; Gierczik, K.; Szira, F.; Vágújfalvi, A. Relationship between SPAD Value and Grain Yield Can Be Affected by Cultivar, Environment and Soil Nitrogen Content in Wheat. Euphytica 2016, 211, 103–112. [Google Scholar] [CrossRef]
  64. Zulfiqar, B.; Raza, M.A.S.; Saleem, M.F.; Aslam, M.U.; Iqbal, R.; Muhammad, F.; Amin, J.; Ibrahim, M.A.; Khan, I.H. Biochar Enhances Wheat Crop Productivity by Mitigating the Effects of Drought: Insights into Physiological and Antioxidant Defense Mechanisms. PLoS ONE 2022, 17, e0267819. [Google Scholar] [CrossRef]
  65. Ghorbani, M.; Konvalina, P.; Neugschwandtner, R.W.; Kopecký, M.; Amirahmadi, E.; Bucur, D.; Walkiewicz, A. Interaction of Biochar with Chemical, Green and Biological Nitrogen Fertilizers on Nitrogen Use Efficiency Indices. Agronomy 2022, 12, 2106. [Google Scholar] [CrossRef]
  66. He, Y.; Yao, Y.; Ji, Y.; Deng, J.; Zhou, G.; Liu, R.; Shao, J.; Zhou, L.; Li, N.; Zhou, X.; et al. Biochar Amendment Boosts Photosynthesis and Biomass in C3 but Not C4 Plants: A Global Synthesis. GCB Bioenergy 2020, 12, 605–617. [Google Scholar] [CrossRef]
  67. Seyedsadr, S.; Šípek, V.; Jačka, L.; Sněhota, M.; Beesley, L.; Pohořelý, M.; Kovář, M.; Trakal, L. Biochar Considerably Increases the Easily Available Water and Nutrient Content in Low-Organic Soils Amended with Compost and Manure. Chemosphere 2022, 293, 133586. [Google Scholar] [CrossRef] [PubMed]
  68. Hu, Y.; Sun, B.; Wu, S.; Feng, H.; Gao, M.; Zhang, B.; Liu, Y. After-Effects of Straw and Straw-Derived Biochar Application on Crop Growth, Yield, and Soil Properties in Wheat (Triticum aestivum L.)-Maize (Zea mays L.) Rotations: A Four-Year Field Experiment. Sci. Total Environ. 2021, 780, 146560. [Google Scholar] [CrossRef]
  69. Jena, T.; Dayal, P.; Pradhan, S.; Sow, S.; Ranjan, S. Role of Biochar in Soil Carbon Dynamics. In Innovations in Nutrient Management: Improving Efficiency and Crop Production; Elite Publishing House: New Delhi, India, 2023. [Google Scholar]
  70. Bo, X.; Zhang, Z.; Wang, J.; Guo, S.; Li, Z.; Lin, H.; Huang, Y.; Han, Z.; Kuzyakov, Y.; Zou, J. Benefits and Limitations of Biochar for Climate-Smart Agriculture: A Review and Case Study from China. Biochar 2023, 5, 77. [Google Scholar] [CrossRef]
  71. Moradi, S.; Sajedi, N.A.; Madani, H.; Gomarian, M.; Chavoshi, S. Integrated Effects of Nitrogen Fertilizer, Biochar, and Salicylic Acid on Yield and Fatty Acid Profile of Six Rapeseed Cultivars. J. Soil Sci. Plant Nutr. 2023, 23, 380–397. [Google Scholar] [CrossRef]
  72. Singh, M.; Singh, S.; Parkash, V.; Ritchie, G.; Wallace, R.W.; Deb, S.K. Biochar Implications Under Limited Irrigation for Sweet Corn Production in a Semi-Arid Environment. Front. Plant Sci. 2022, 13, 853746. [Google Scholar] [CrossRef]
  73. Haider, I.; Raza, M.A.S.; Iqbal, R.; Aslam, M.U.; Habib-ur-Rahman, M.; Raja, S.; Khan, M.T.; Aslam, M.M.; Waqas, M.; Ahmad, S. Potential Effects of Biochar Application on Mitigating the Drought Stress Implications on Wheat (Triticum aestivum L.) under Various Growth Stages. J. Saudi Chem. Soc. 2020, 24, 974–981. [Google Scholar] [CrossRef]
  74. Yang, X.; McMaster, G.S.; Yu, Q. Spatial Patterns of Relationship Between Wheat Yield and Yield Components in China. Int. J. Plant Prod. 2018, 12, 61–71. [Google Scholar] [CrossRef]
  75. Latawiec, A.E.; Koryś, A.; Koryś, K.A.; Kuboń, M.; Sadowska, U.; Gliniak, M.; Sikora, J.; Drosik, A.; Niemiec, M.; Klimek-Kopyra, A.; et al. Economic Analysis of Biochar Use in Soybean Production in Poland. Agronomy 2021, 11, 2108. [Google Scholar] [CrossRef]
  76. Wang, L.; Li, L.; Cheng, K.; Ji, C.; Yue, Q.; Bian, R.; Pan, G. An Assessment of Emergy, Energy, and Cost-Benefits of Grain Production over 6 Years Following a Biochar Amendment in a Rice Paddy from China. Environ. Sci. Pollut. Res. 2018, 25, 9683–9696. [Google Scholar] [CrossRef]
  77. Apori, S.O.; Byalebeka, J.; Murongo, M.; Ssekandi, J.; Noel, G.L. Effect of Co-Applied Corncob Biochar with Farmyard Manure and NPK Fertilizer on Tropical Soil. Resour. Environ. Sustain. 2021, 5, 100034. [Google Scholar] [CrossRef]
Figure 1. Monthly averages of solar radiation (SR), total rainfall (RF), and maximum (Tmax) and minimum (Tmin) temperatures were recorded during the 2021 rainy season and the 2023 dry season in the study area.
Agronomy 15 01227 g001
Figure 2. Local biochar production using water hyacinth.
Agronomy 15 01227 g002
Figure 3. Different rates of locally produced water hyacinth biochar (WHB), inorganic fertilizer(F), and different irrigation regimes (I) affect the leaf area of wheat during the 2023 dry season cropping season. Mean separation was carried out independently for each day after sowing (DAS) across treatments. Different English and Latin letters with accent marks indicate significant differences between treatments at a 5% significance level. The bars represent the standard deviation of the means.
Agronomy 15 01227 g003
Figure 4. Different rates of locally produced water hyacinth biochar (WHB), inorganic fertilizer(F), and different irrigation regimes (I) affect the dry biomass of wheat during the 2023 dry season cropping season. Mean separation was performed independently for each day after sowing (DAS) across the different treatments. Different English, Greek and Latin letters with accent marks indicate significant differences between treatments at a 5% significance level. The bars represent the standard deviation of the means.
Agronomy 15 01227 g004
Figure 5. Different rates of locally produced water hyacinth biochar (WHB), inorganic fertilizer(F), and different irrigation regimes (I) affect the leaf SPAD value of wheat during the 2023 dry season cropping season. Mean separation was carried out independently for each day after sowing (DAS) across treatments. Different English and Latin letters with accent marks indicate significant differences between treatments at a 5% significance level. The bars represent the standard deviation of the means.
Agronomy 15 01227 g005
Figure 6. Effects of biochar, fertilizer, and irrigation (for the dry season) application on wheat crop dry biomass and grain yield in the 2021 rainy (a) and 2023 dry (b) seasons. Mean separation was performed independently for each day after sowing (DAS) across the different treatments. Different letters indicate significant differences between treatments at a 5% significance level. The bars represent the standard deviation of the means.
Agronomy 15 01227 g006
Figure 7. Correlation between dry biomass (a), plant height (b), spike length (c), and grain number (d) and grain yield during the 2021 rainy season.
Agronomy 15 01227 g007
Figure 8. Correlation between dry biomass (a), plant height (b), spike length (c), leaf SPAD value (d), leaf area (e), and grain number (f) and wheat crop grain yield during the 2023 dry season.
Agronomy 15 01227 g008
Table 1. Treatments of field experiment for the 2021 rainy season.
Biochar
(t ha−1)
Fertilizer
(kg ha−1)
TreatmentsExplanation
0200WHB0F200No biochar, only 200 kg ha−1 NPS fertilizer
5200WHB5F2005 t ha−1 water hyacinth biochar with 200 kg ha−1 NPS fertilizer
10200WHB10F20010 t ha−1 water hyacinth biochar with 200 kg ha−1 NPS fertilizer
200WHB20F020 t ha−1 water hyacinth biochar only
20100WHB20F10020 t ha−1 water hyacinth biochar with 100 kg ha−1 NPS fertilizer
20200WHB20F20020 t ha−1 water hyacinth biochar with 200 kg ha−1 NPS fertilizer
WHB: Biochar derived from water hyacinth; F: NPS inorganic fertilizer.
Table 2. Treatments of field experiment for the 2023 dry season.
Biochar
(t ha−1)
Fertilizer
(kg ha 1)
Irrigation Water
(%)
TreatmentsExplanation
00100WHB0F0I100No biochar + No fertilizer + 100% Full irrigation
0200100WHB0F200I100No biochar + 200 kg ha−1 fertilizer + 100% Full irrigation
520050WHB5F200I505 t ha−1 biochar + 200 kg ha−1 fertilizer + 50% Full irrigation
5200100WHB5F200I1005 t ha−1 biochar + 200 kg ha−1 fertilizer + 100% Full irrigation
1020050WHB10F200I5010 t ha−1 biochar + 200 kg ha−1 fertilizer + 50% Full irrigation
10200100WHB10F200I10010 t ha−1 biochar + 200 kg ha−1 fertilizer + 100% Full irrigation
20050WHB20F0I5020 t ha−1 biochar + No fertilizer + 50% Full irrigation
200100WHB20F0F10020 t ha−1 biochar + No fertilizer + 100% Full irrigation
2010050WHB20F100I5020 t ha−1 biochar + 100 kg ha−1 fertilizer + 50% Full irrigation
20100100WHB20F100I10020 t ha−1 biochar + 100 kg ha−1 fertilizer + 100% Full irrigation
2020050WHB20F200I5020 t ha−1 biochar + 200 kg ha−1 fertilizer + 50% Full irrigation
20200100WHB20F200I10020 t ha−1 biochar + 200 kg ha−1 fertilizer + 100% Full irrigation
WHB: locally produced water hyacinth biochar; F: NPS blended fertilizer; I: irrigation regime.
Table 3. Basic characterization of soil and biochar samples.
SandSiltClayBulk
Density
pHT-C T-N NH4+-NNO3-NAvailable
P §
CEC #Ash
Content
Fixed CarbonSurface Area
%g cm−3 %mg kg−1cmolc kg−1%m2 g−1
Rainy season 2021
Soil 30.051.918.11.145.239.30.6771.6711.64.1919.2---
Biochar ----9.3333.90.7832.133.2161332.242.017.712.4
Dry season 2023
Soil 20.465.913.71.214.423.710.4831.5215.70.39218.2---
Biochar ----10.735.20.9300.7480.67683733.420.520.353.2
Silty loam Nitisol collected at Injibara University, Ethiopia. Locally produced from water hyacinth. § Mehlich 3-extraction # Cation exchange capacity Total carbon Total nitrogen.
Table 4. The effects of locally produced water hyacinth biochar, inorganic fertilizer, and different irrigation regimes on average wheat plant height (PH), spike length (SL), spikelet number per spike (SN), and grain number per spike (GN) in the 2021 rainy and 2023 dry seasons.
TreatmentsPH (cm)SL (cm)SNGN
2021 Rainy season
WHB0F20085.9 ± 1.7 a6.63 ± 0.63 a13.9 ± 0.63 a34.9 ± 1.2 a
WHB5F20087.8 ± 0.16 a6.68 ± 0.15 a14.2 ± 0.23 a36.5 ± 3.2 a
WHB10F20086.6 ± 3.2 a6.75 ± 0.11 a14.2 ± 0.51 a35.3 ± 3.6 a
WHB20F087.1 ± 1.6 a6.53 ± 0.39 a14.0 ± 0.19 a35.3 ± 1.8 a
WHB20F10088.2 ± 0.68 a6.70 ± 0.07 a14.0 ± 0.16 a36.4 ± 1.5 a
WHB20F20089.2 ± 1.4 a6.68 ± 0.26 a14.2 ± 0.73 a36.7 ± 1.5 a
2023 Dry season
WHB0F0I10042.2 ± 5.8 d6.60 ± 0.91 d8.80 ± 1.0 c19.4 ± 3.7 b
WHB0F200I10043.7 ± 4.2 d7.93 ± 0.99 bcd12.2 ± 1.2 b31.8 ± 3.5 a
WHB5F200I5060.9 ± 3.1 bc9.27 ± 0.41 ab13.8 ± 0.98 ab38.4 ± 4.0 a
WHB5F200I10066.6 ± 2.0 abc9.67 ± 0.25 a15.1 ± 0.09 ab39.1 ± 0.84 a
WHB10F200I5063.3 ± 1.1 abc9.47 ± 0.34 a15.1 ± 0.96 ab39.2 ± 1.8 a
WHB10F200I10070.9 ± 4.5 ab9.87 ± 0.34 a16.3 ± 0.41 a39.2 ± 4.5 a
WHB20F0I5057.9 ± 4.2 c7.87 ± 0.77 cd12.5 ± 1.4 b30.3 ± 2.8 ab
WHB20F0I10065.1 ± 2.5 abc9.67 ± 0.25 a14.2 ± 0.33 ab33.9 ± 3.3 a
WHB20F100I5066.5 ± 0.929 abc8.87 ± 0.19 abc13.4 ± 1.1 ab34.8 ± 6.1 a
WHB20F100I10069.9 ± 2.5 ab9.47 ± 0.50 a15.7 ± 0.61 a40.3 ± 1.8 a
WHB20F200I5066.1 ± 2.7 abc9.47 ± 0.19 a15.7 ± 0.84 a38.8 ± 1.3 a
WHB20F200I10071.5 ± 3.4 a10.1 ± 0.47 a16.3 ± 0.57 a40.7 ± 5.3 a
Where WHB (water hyacinth biochar), F (NPS fertilizer), and I (irrigation regime). Means that do not share the same letter in each treatment are significantly different at the 5% level of significance.
Table 5. Partial budget analysis for wheat production in both rainy and dry seasons.
Farm Activities2021 Rainy Season2023 Dry Season
WHB0F200WHB10F200WHB20F100WHB20F200WHB0F0I100WHB0F200I100WHB10F200I100WHB20F100I100WHB20F200I100
Input and labor costs (USD ha−1)
NPS fertilizer14014070140014314372143
Urea fertilizer141141141141145145145145145
Biochar production017835635600179357357
Sowing177178178178179179179179179
Fertilizer application17817816017889.3179179161179
Irrigation518518518518518
Total cost6368159059939311164134314321521
Output (t ha−1) and return (USD ha−1)
Output of wheat grain5.345.685.515.440.8811.53.943.714.1
Output of wheat straw7.688.537.519.231.133.8114.412.815
Gross return57946166597759249601662442741474598
Net return 515853515072493129.0498308427153077
Cost–benefit ratio 9.117.576.605.971.031.433.302.903.02
Calculated as (gross return)-(total cost). Calculated as (gross return)/(total cost).
Disclaimer/Publisher’s Note: The statements, opinions and data contained in all publications are solely those of the individual author(s) and contributor(s) and not of MDPI and/or the editor(s). MDPI and/or the editor(s) disclaim responsibility for any injury to people or property resulting from any ideas, methods, instructions or products referred to in the content.

