Article

Effects of Biochar on Soil Quality in a Maize Soybean Rotation on Mollisols

1
College of Resources and Environment, Northeast Agricultural University, Harbin 150030, China
2
Key Laboratory of Soybean Biology in Chinese Ministry of Education, College of Agriculture, Northeast Agricultural University, Harbin 150030, China
*
Author to whom correspondence should be addressed.
These authors contributed equally to this work.
Agronomy 2025, 15(5), 1226; https://doi.org/10.3390/agronomy15051226
Submission received: 15 April 2025 / Revised: 14 May 2025 / Accepted: 15 May 2025 / Published: 18 May 2025
(This article belongs to the Section Innovative Cropping Systems)

Abstract

:
Rotation and organic material addition (e.g., biochar) are major measures to improve soil quality, but the improvement effects and mechanisms of their combination on soil quality remain unclear; the relationship between the physical, chemical, and biological parameters was has not been adequately detected in terms of the change in quality after biochar addition. This study selected corn straw biochar as the material and established two biochar application methods: biochar mixed in 0–20 cm soil depth (B1) and biochar mixed in 0–40 cm soil depth (B2). After 3 years of maize–bean rotation, soil samples from 0–20 cm and 20–40 cm were collected to determine the soil’s physical, chemical, and biological properties, as well as crop yields. Principal component analysis was used to establish a minimum data set for the systematic analysis of soil quality and its factors. The results showed that compared with the control (CK), biochar reduced soil bulk density by 3.1% and electrical conductivity by 19.5–28.25% while increasing soil organic matter content by 7.2%, ammonium nitrogen content by 6.7–12.0%, available nitrogen content by 6.7–18.5%, available phosphorus content by 15.6–23.8%, available potassium content by 11.6–17.3%, soil urease activity by 12.25–21.6%, soil sucrase activity by 6.8–30.8%, soil neutral phosphatase activity by 5.6–9.7%, and soil catalase activity by 13.6%. Four indicators, namely bulk density, water content, pH, and nitrate nitrogen, were selected from 16 soil-quality-related indicators to form the minimum data set (MDS), and the soil quality index was calculated. Biochar application significantly increased the soil quality index (SQI) of rotation soil by 14.6–63.3% and crop yields by 5.6–7.2%. A random forest analysis of soil indicators and crop yields, combined with partial least squares structural equation modeling, revealed that biological indicators—particularly catalase activity—showed significant positive correlations with crop yields. Based on these multi-dimensional analyses, the interaction between rotation systems and biochar application improves the quality of mollisol soil plow layers by reducing bulk density and increasing catalase activity.

1. Introduction

As the years of land use increase, there is an increasing likelihood of soil resource shortages and soil quality degradation. Mollisol, one of the most valuable soil types globally, covers approximately one-sixth of the world’s arable land [1] and is renowned for its high fertility and suitability for cultivation [2]. In China, the mollisol region of the Northeast China Plain accounts for about 12% of the total global mollisol area [3]. This region serves as a critical granary for China’s grain reserves [4], often referred to as the “ballast stone” of national food production, playing a vital role in ensuring food security [5,6]. However, intensive anthropogenic activities and long-term tillage have exacerbated soil degradation [7,8,9], resulting in a significant thinning of the mollisol topsoil [10,11]. The thickness of mollisol has decreased by 30–40 cm from the 1950s to the present, losing approximately 1.25 mm per year [12]. In the typical Songnen mollisol region, the number of permanent gullies on cropland has increased by 24.6% over the past 50 years [13], with an average soil loss rate of 3–10 mm/year from 1985 to 2020 and a 30–40 cm reduction in mollisol thickness since the 1950s [12]. Notably, nearly 64% of farmland exhibited a decline in soil organic carbon (SOC), with an average reduction of 3.07 g·kg−1 [14], and soil organic matter (SOM) decreased rapidly at a rate of 0.6–1.4 g·kg−1 per decade [15]. As a more detailed example, compared to the second national soil survey in 1980, SOC content in Shuangcheng District, Gongzhuling, and Helen decreased by 5.0 × 10⁸, 1.8 × 10⁹, and 2.3 × 10⁹ g·kg−1, respectively, by 2011 [16]. Stabilizing and enhancing the quality of the plow layer is essential for maintaining sustainable agricultural productivity in this region.
Soil quality, defined as the capacity of soil to sustain ecosystem functions, production, and environmental transformation, has shown a clear declining trend in the northeast mollisol region, Chain, due to soil degradation [1,17,18], primarily influenced by agricultural activities and natural climate factors [19,20]. Research indicates that compared to uncultivated primary forest and grassland soils (SQI = 61.0), soils with less than 20 years of cultivation have experienced a 19.6% decline in quality (SQI = 49.0), while soils with more than 80 years of cultivation have seen a 14.6% decline (SQI = 52.0) [21]. After converting forest land to tea plantation models for 50 years, the quality of surface soil (0–30 cm) at six different sampling points in tea gardens was found to be lower than that of natural forest soils [22]. Due to the limited carbon input and prolonged cultivation duration, after 40 years of reclamation in the northeastern region, soil bulk density (BD) increased by 34.2% and total porosity decreased by 13.3% [23]. The SOM in the 0-20 cm surface soil declined from 5 to 7% at the start of reclamation to the current 3–5% [12], with an average reduction rate of 0.5% [24]. The reduction in SOM content and the destruction of soil environmental and structural characteristics have led to a decline in the fundamental productivity of soils in the northeastern mollisol region [25].
Crop rotation, particularly when integrated with tillage practices, has been demonstrated as an effective method for enhancing soil quality through soil fertility preservation and yield sustainability [26,27,28,29]. For instance, a two-year wheat–maize rotation increased the baseline SQI in the 0–20 cm and 20–40 cm soil layers by 4.1–8.7% and 9.8–18.9%, respectively [30]. Rapeseed–rice rotation positively affected rice yield (14.5%) and enhanced nitrogen (54–98%), phosphorus (57–99%), and potassium (59–99%) accumulation in aboveground biomass [31], while flax–wheat rotation reduced soil pH (from 8.22 to 8.02) and improved soil urease (15.4%), catalase (11.6%) [30]. However, some contrasting findings have also been reported. Soybean–corn rotations in the U.S. Midwest had no effects on soil quality [32], and cassava–maize rotations were even associated with soil quality degradation after 12 years [33]. Soybean–maize rotation is the main planting pattern in mollisol soil areas in China, and studies have shown that SQI under crop rotation (soybean–maize rotation and soybean–maize–maize rotation) was 5.4–23.5% higher than those under continuous cropping [34]. It means that the cultivating crop species within rotation have different effects on the soil quality for the soil’s specificity, and more data are needed to find the nature of the relationship between rotation and soil quality [35].
Additionally, organic amendments, such as biochar, have emerged as sustainable strategies for improving soil quality and nutrient cycling [36,37,38,39,40]. Biochar, with a high surface area and porosity, enhances water and nutrient retention [41], reduces soil BD, and improves soil structure [42,43]. For example, in silty soil, the application of biochar at a rate of 25 g·kg¹ can reduce the soil BD from 1.52 g·cm³ to 1.33 g·cm³ [44]. When 25% and 5% of biochar are added to sandy soil, the water holding capacities are 260% and 370% higher, respectively, than those in the control experiment [45]. Adding straw biochar to clay soil increases the number of macropores and mesopores. Soil particles can combine with biochar to form stable, large aggregates [46], which have a positive impact on crop growth [47]. Its microporous structure also facilitates nutrient adsorption and SOC accumulation [8,48]. Existing studies have demonstrated that biochar significantly enhances bacterial diversity (Chao1 and Shannon indexes rise by 27.58% and 16.04%, respectively) and soil fertility (SOM increased by 25.06–23.25%) in tobacco–rice rotation soils [49], while also improving total carbon, total nitrogen, total carbon/total nitrogen ratio (C/N), and soil quality in corn–soybean–switchgrass cropping systems [50]. It is needed to determine how biochar change the soil quality under maize-soybean rotation. The soil fertility level, especially the improvement in the soil fertility level in northeast black soil, is crucial for the stable food supply. So, understanding biochar is of great significance for improving soil quality.
So, we hypothesize that (1) biochar improves the soil quality under maize–soybean rotation by enhancing nutrient exchange and enzyme activity [49,51], thereby activating soil nutrient retention; (2) biochar’s key role in improving the soil quality lies in its ability to improve the physical characters such as soil BD because biochar has a high surface area and porosity [52]; and (3) another explanation for how biochar improves the quality may be the enzyme activity, because biochar activated the bacteria and fungi and thus increased the activity of the enzyme [53].

2. Materials and Methods
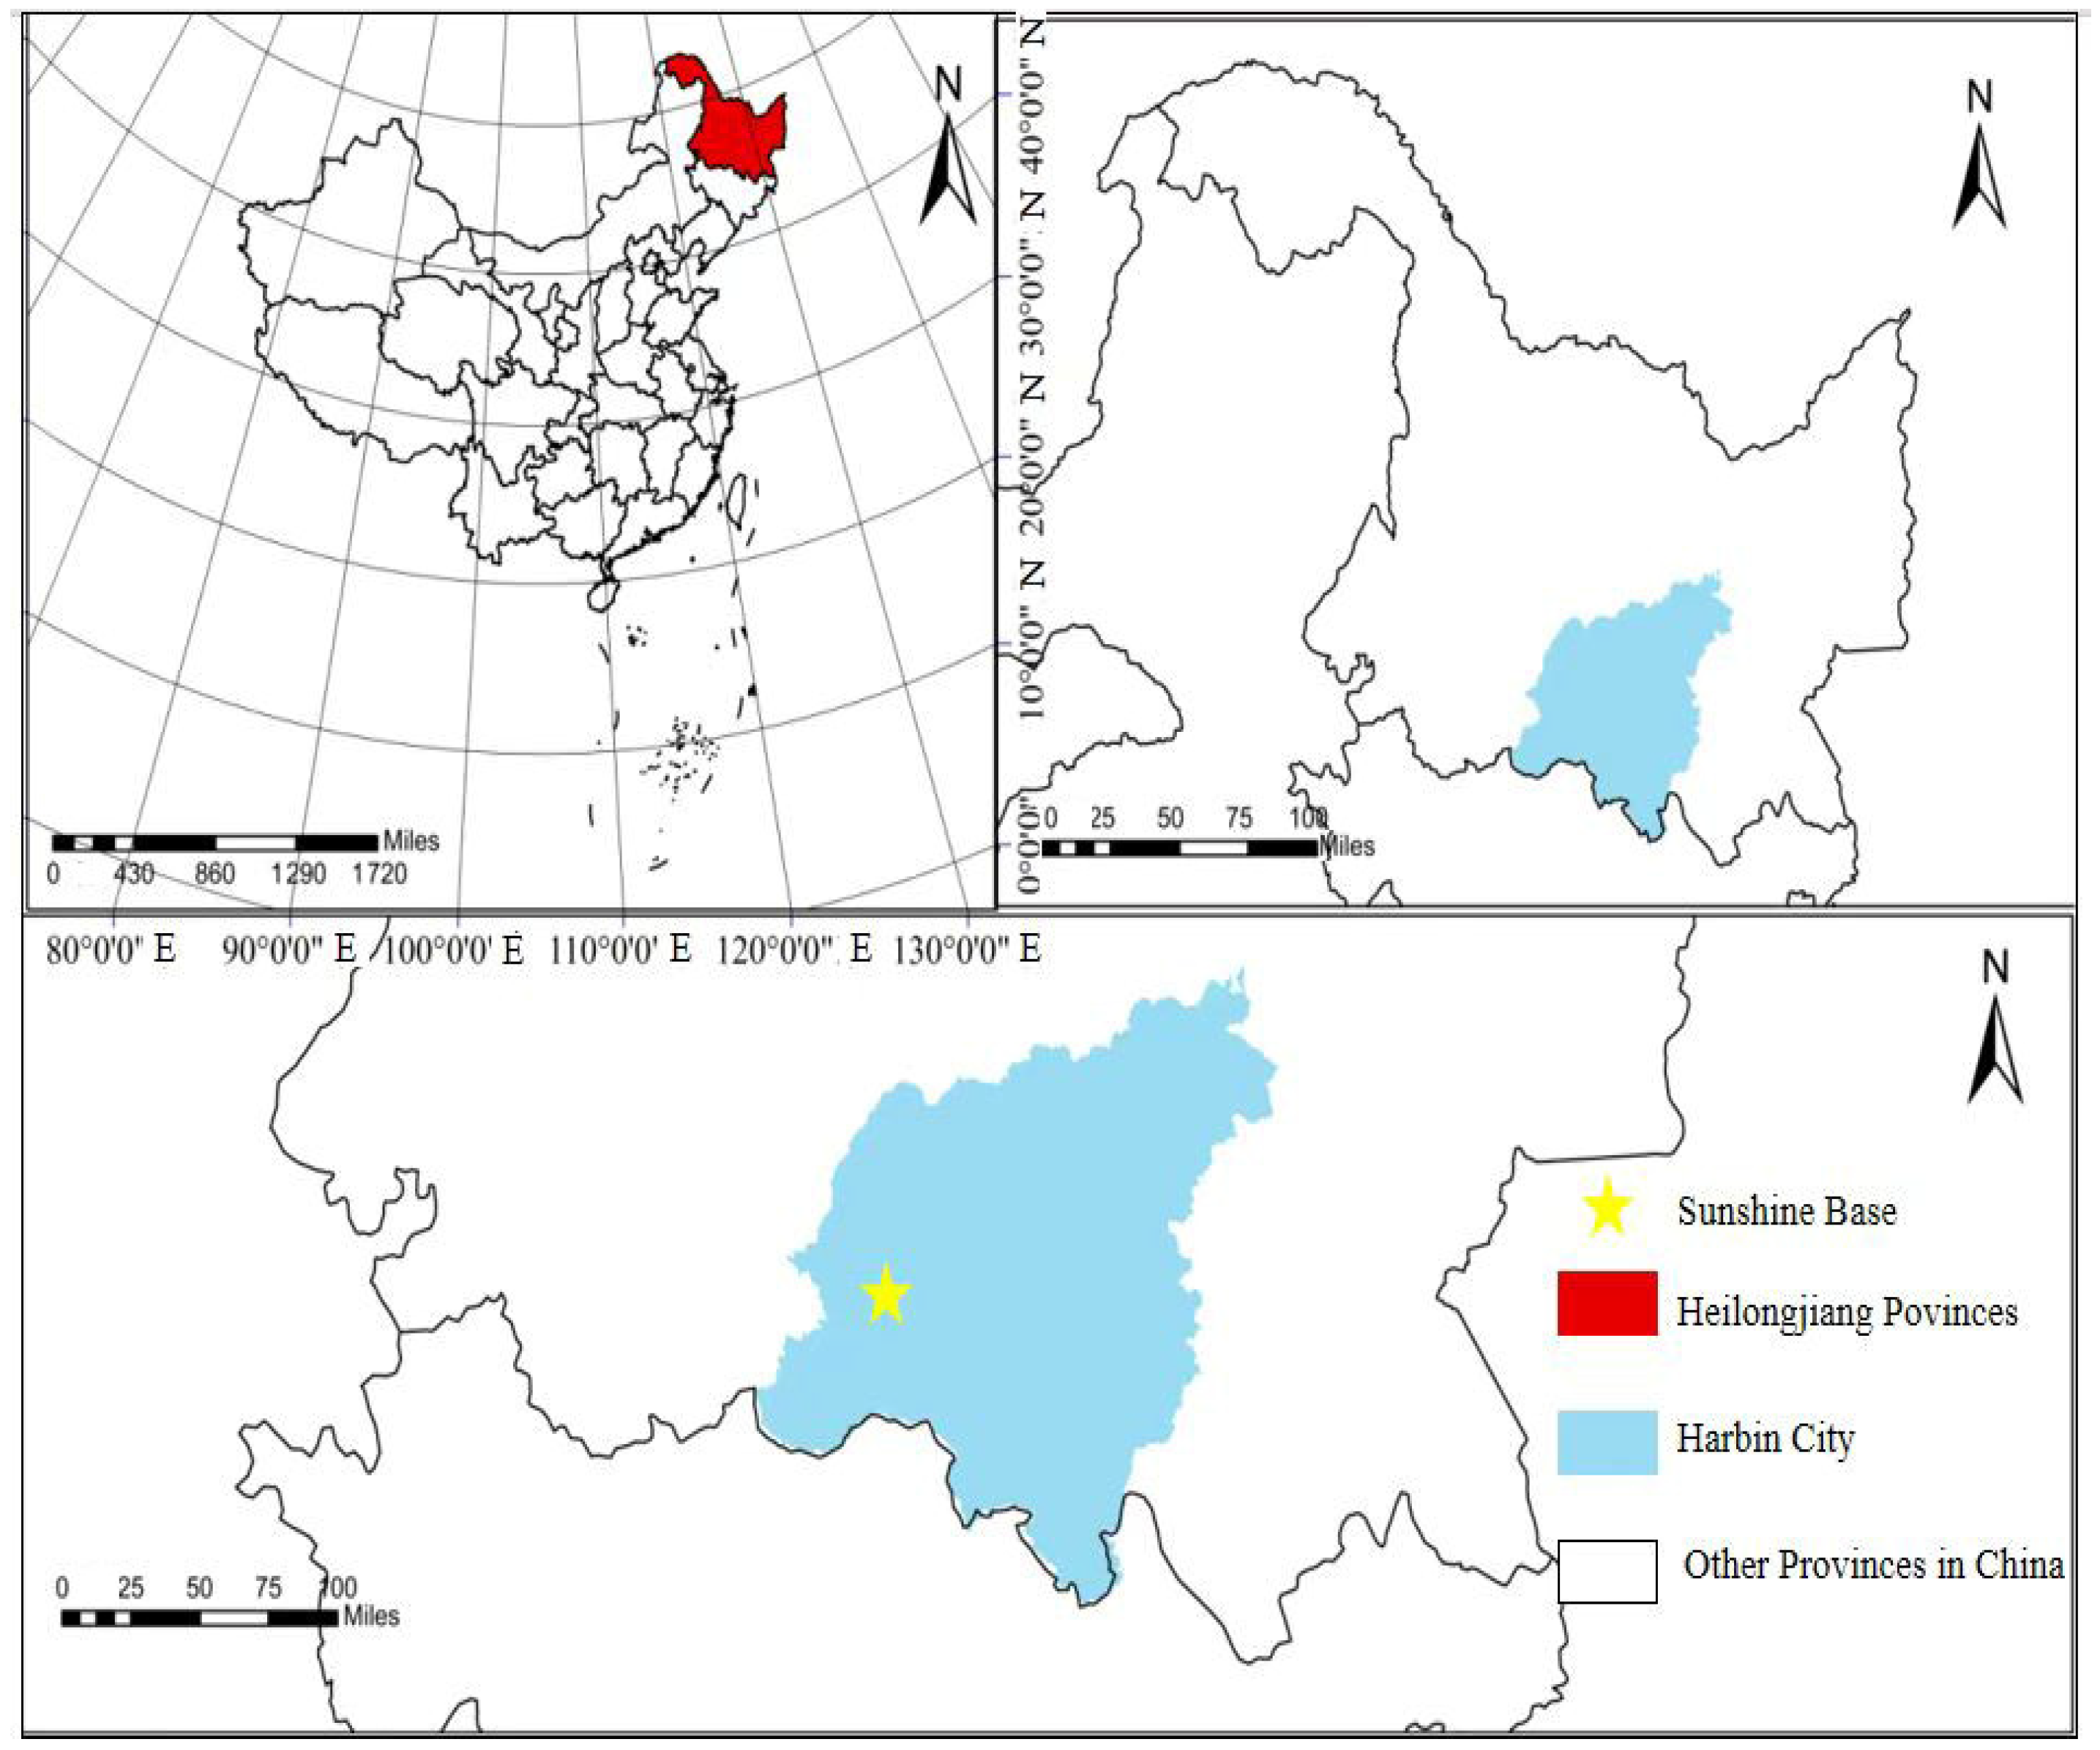
2.1. Study Site

The study was conducted at the Xiangyang Experimental Station of Northeast Agricultural University (45°45′ N, 126°54′ E), which is in China, Heilongjiang, Harbin, located in a cold temperate continental climate zone (Figure 1). Precipitation is concentrated in summer, while spring and autumn are dry, and low temperatures characterize winters [54]. Sampling was conducted from April to September in 2021 and 2022. During the planting periods, the mean temperatures were 18.04 °C and 17.87 °C, with an average precipitation of 30.37 mm and 26.28 mm, respectively. The average duration of sunlight was 67.83 h and 76.68 h in 2021 and 2022, respectively.

2.2. Experimental Design

The study employed a field experiment under a soybean–maize–maize rotation system with integrated biochar amendments. Biochar was added at two soil incorporation depths: B1 involved a biochar application in the 0–20 cm soil layer, while B2 involved a biochar application in the 0–40 cm plough layer, alongside a non-amended control (CK). Biochar (4500 kg·ha−1, based on corn stover input of 15,000 kg·ha−1 with a carbonization rate of 30%) was uniformly applied once during autumn tillage in 2019 before the initial soybean planting in 2020, followed by maize cultivation in 2021 and 2022. The experimental design adopts a completely randomized design. The basic physical and chemical properties of soil were showed in Table 1. The biochar, produced by Liaoning Jinhefu Agricultural Development Company via pyrolysis at 400 °C under oxygen-limited conditions (Table 2). Field management followed conventional practices without additional chemical fertilization, replicated three times. The maize cultivar Xianyu 335 (Zea mays L.) was used throughout the study.

2.3. Soil Sampling and Analysis

Samples were taken from the 0–20 cm and 20–40 cm soil layers using a 5 cm diameter soil auger. Sampling was conducted at four growth stages: seedling (T1, 23 June), jointing (T2, 16 July), filling (T3, 16 August), and maturity (T4, 1 October). Then, samples were partly air-dried for physicochemical indicators, and another part of the fresh samples was analyzed for biological indicators. We calculated the average values of the test data from the soil samples collected in four periods for subsequent analysis.
The indicators of soil samples were classified into physical, chemical, and biological categories. The soil physical chemistry indicators are measured according to the method of Bao [55], and the method of Guan Songyin [56] was used to determine the biological index of soil. Soil physical properties, including soil BD, soil water content (SWC), total soil porosity (TSP), and capillary porosity (CP), were measured using the ring knife method. Soil pH was measured with a glass electrode (soil: water ratio = 1:2.5 (w/v)), while soil electrical conductivity (EC) was measured with a conductivity meter. SOM content was detected using the potassium dichromate method. The available phosphorus (AP) content in the soil was measured using the molybdenum-antimony colorimetric method, and the available potassium (AK) content was determined by flame photometry. The available nitrogen (AN) content in the soil was measured using the alkaline diffusion method, while ammonium nitrogen (HN) was assessed using the phenol blue colorimetric method. Nitrate nitrogen (NN) content was measured using a dual-wavelength UV spectrophotometric method at 220 nm and 275 nm. Soil urease activity (S-URE) was determined using the sodium hypochlorite colorimetric method, and soil sucrase activity (S-SC) was assessed using the 3,5-dinitro salicylic acid colorimetric method. Soil catalase activity (S-CAT) was measured using the UV absorbance method, and soil phosphatase activity (S-NP) was determined using the disodium phenyl phosphate colorimetric method.

2.4. Soil Health Assessment System

2.4.1. Determination of the Minimum Data Set

Sixteen soil physical and chemical indicators were initially chosen as the total data set (TDS). The minimum data set (MDS) was derived through Pearson Correlation Analysis and principal component analysis (PCA), combined with Norm value screening. The Norm value represents the length of the vector modulus of a variable in a multi-dimensional space, reflecting the comprehensive loading magnitude of the variable on all principal components. According to [57], the larger the Norm value, the more soil quality information the indicator contains. Therefore, it can be used to assist in indicator screening. To minimize data redundancy while retaining essential soil information, the Norm value was calculated using the following formula [58]:
N j k = 1 k ( u j k 2 λ k )
where Njk is the cumulative factor loading value of the j-th index across k principal components, k is the number of principal components with eigenvalues ≥ 1, ujk is the factor loading value of the j-th index, and λk is the eigenvalue of the k-th principal component.
TDS indicators were classified according to principal components with eigenvalues ≥ 1 [59]. Indicators with factor loadings > 0.5 were assigned to groups. If a certain soil parameter has a loading greater than 0.5 in both groups, then this parameter should be merged into the group that has a lower correlation with other parameters [60,61]. Within each group, the indicator with a Norm value in the top 90% (the highest Norm value within that range) was chosen for the MDS. If significant correlations (r > 0.5) existed among indicators within a group, only the indicator with the maximum Norm value was kept for use in the MDS; if the loading factors of a soil indicator in all principal components are all < 0.5, then the soil parameter with the largest loading among those that have not been screened in this group is selected [62,63].

2.4.2. Calculation of the Soil Quality Index

The measured values of all indicators were transformed into dimensionless scores (ranging from 0 to 1) using membership functions (Table 3). The upper and lower limits for the soil physicochemical indicators were based on the standards from the second national soil survey [58,59].

2.4.3. Calculation of Index Weight and Soil Quality Index

The weight coefficient (Wi) for each index was determined by calculating the ratio of the common factor variance of the index to the total variance of all indices through PCA. The communalities refer to the sum of the variance contributions of each original variable on all common factors, and they measure the extent to which each variable can be explained by the common factors. The closer the communality is to 1, the higher the degree to which the variable can be explained by the common factors, and the less information of the variable is lost. Conversely, the closer the communality is to 0, the more difficult it is for it to be explained by the common factors. In this case, it may be necessary to consider whether the variable is suitable for inclusion in the factor analysis model or whether there are other special factors affecting the variable. This weight reflects the relative importance of each evaluation index [64]. The SQI was calculated using a weighted sum model:
S Q I = i = 1 n W i N i
where Wi is the weight of the i-th soil index and Ni is the membership function value (0–1) of the i-th soil index, representing the ratio of its common factor variance to the total variance in PCA.

2.5. Statistical Analysis

Data were preliminarily organized using Microsoft Excel 2024. Before conducting the statistical analysis, we conducted the Kolmogorov–Smirnov test on all the data. This was conducted to guarantee that the data met the statistical assumptions necessary for accurate analysis. One-way ANOVA was performed at the 0.05 significance level using SPSS 26.0 to compare differences among treatments for each index. Graphical representations were generated using Origin 2024 (10.1.0.178) SR1, while dendrogram construction and structural equation modeling (SEM) were performed using the R language for correlation analysis.

3. Results

3.1. Effects of Biochar on Maize Yield

The application of biochar significantly changed the yield and its components of maize in a soybean–maize rotation system, with the effects varying across years and agronomic traits (Table 4).
In 2021, compared to the CK, biochar had a positive effect on the number of kernel rows per ear, and B1 and B2 increased it by 5.1% and 8.0% and increased yield by 7.2% and 6.7%, respectively (p < 0.05). Biochar application had no effect on single-ear weight or 100-kernel weight.
Differently from 2021, in 2022, biochar application demonstrated more pronounced effects. Compared to CK, B1 and B2 increased the 100-kernel weight by 7.8% and 5.6%, respectively, and improved yield by 5.6% and 5.7% (p < 0.05). Biochar application had no effect on single ear weight or kernel rows per ear.
These results indicate that the effects of biochar on maize yield and its components were changed by annual growing conditions, with more consistent and significant effects observed in 2022 compared to 2021.

3.2. Effects of Biochar on Soil Quality Index

3.2.1. Descriptive Analysis of Soil Indicators

Soil quality in the plow layer was evaluated using physical and chemical indicators, which exhibited varying degrees of sensitivity (Table 5). The coefficient of variation (CV) was used to assess the variability of these indicators. For example, under the B2 rotation cropping pattern in 2021, 16 indicators were selected as evaluation factors. We have calculated the coefficients of variation for all treatments over the two years according to this procedure, and this information has been submitted as Supplementary Materials (Tables S1–S6).
The results (Table 5) showed that low-variability indicators (CV < 10%) included BD, TSP, pH, HN, and S-NP, with CV values of 6.72%, 6.56%, 1.70%, 7.69%, and 7.92%, respectively. Medium-variability indicators (10% ≤ CV < 50%) included CP, SWC, EC, AP, AK, SOM, AN, S-URE, S-SC, and S-CAT, with CV values ranging from 12.6% to 23.4%. High-variability indicators (50% ≤ CV < 100%) included NN, with a CV of 60.2%.

3.2.2. Evaluation Process of Influencing Factors on Topsoil Quality

Minimum Data Set Construction

A total of 16 physical, chemical, and biological indicators were selected to evaluate soil quality, including physical indicators (SWC, BD, TSP, and CP), chemical indicators (pH, EC, SOM, AP, AK, AN, NN, and HN), and biological indicators (S-URE, S-SC, S-NP, and S-CAT) (Table 6).
PCA was performed on the TDS to identify key factors influencing soil quality. A partial correlation, KMO (Kaiser–Meyer–Olkin), and Bartlett (2019) sphericity test were conducted on TDS. The results showed that the KMO value was 0.772, which is greater than 0.5, indicating a relatively strong partial correlation among the indicators. Sig. = 0.000, <0.01, leading to the rejection of the null hypothesis of Bartlett’s sphericity test. Therefore, it is suitable for factor analysis. Four principal components (PCs) with eigenvalues >1 were extracted, explaining 95.2% of the cumulative variance (Table 6). Among these, the first principal component (PC1) accounted for 42.5% of the variance, indicating its dominant role in soil quality. Urease activity and soil porosity showed the highest loadings on PC1, suggesting their critical importance in soil quality.
Based on the Norm values and correlation analysis, MDS was established by selecting the indicators with the highest loadings in each principal component. The MDS included BD, SWC, pH, and NN.

Calculation of Soil Quality Composite Index

The SQI was calculated based on the MDS. First, the weights of the MDS indicators were determined using their common factor variances. The SQI was computed using the following formula:
S Q I = 0.262 × N 1 + 0.138 × N 2 + 0.339 × N 3 + 0.261 × N 4
where N1 represents BD, N2 represents SWC, N3 represents pH, and N4 represents NN.
The common factor variances and weights of the MDS indicators are presented in Table 7. The SQI values were calculated according to Equation (2), reflecting the integrated soil quality based on the selected indicators.

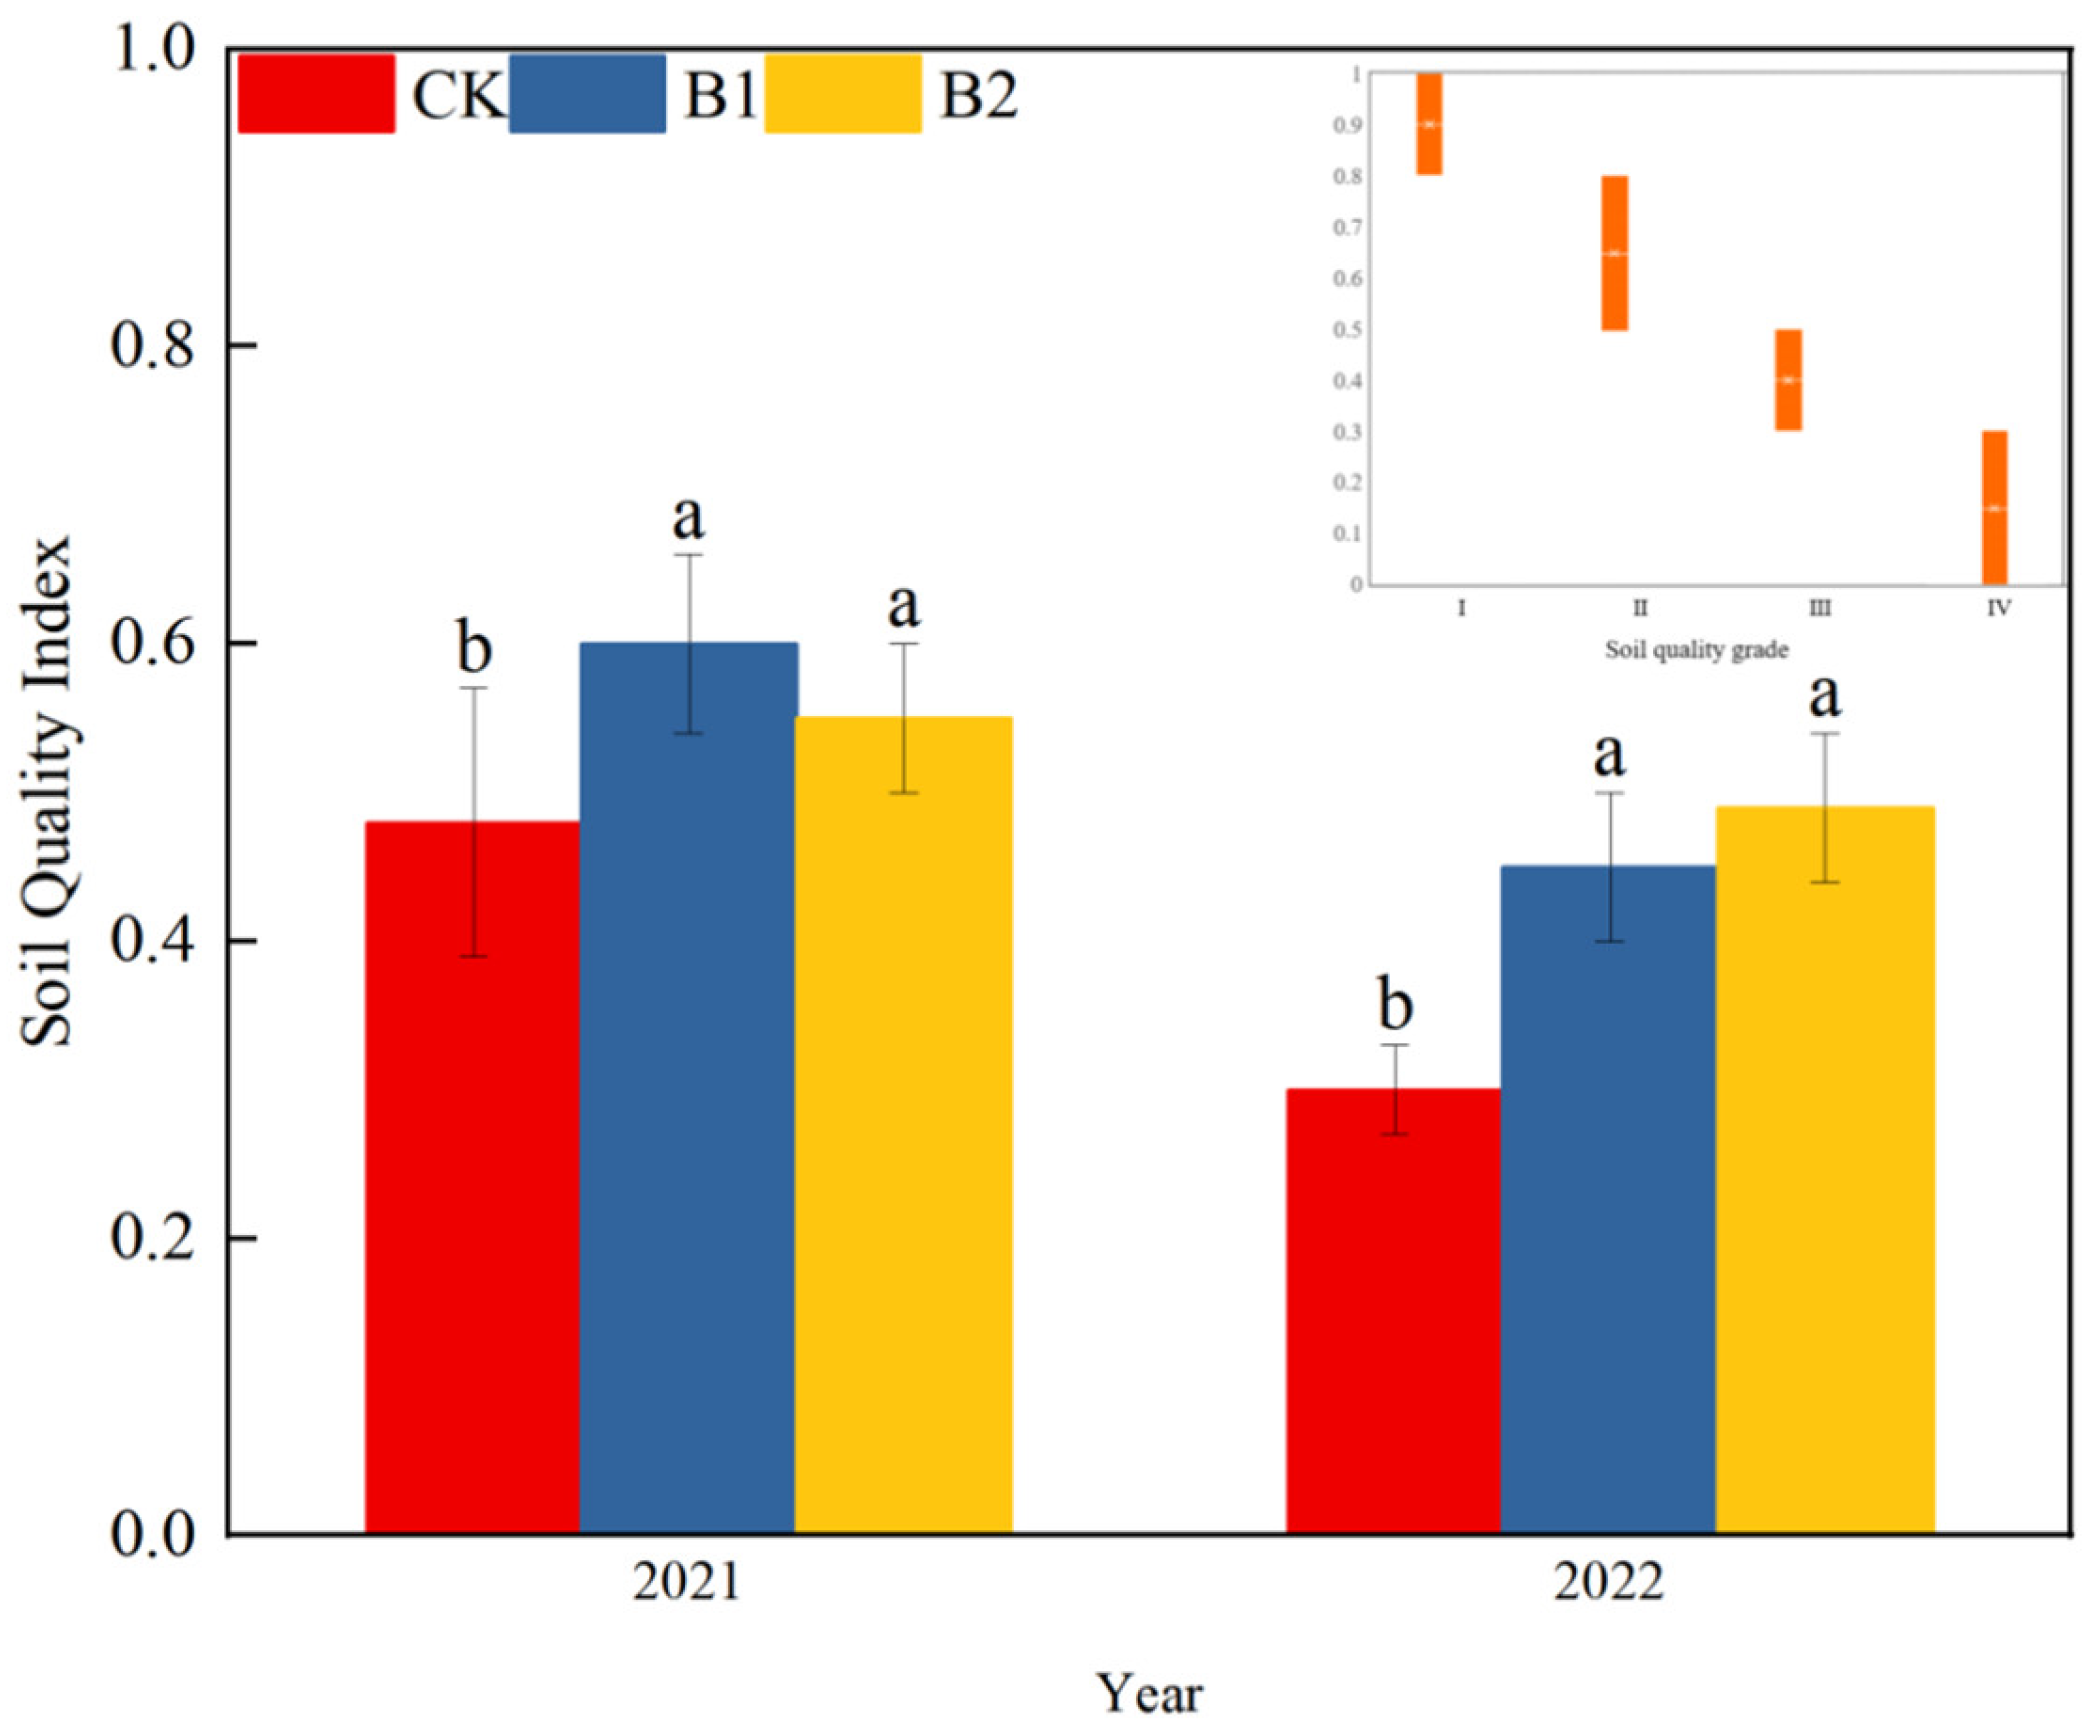
3.2.3. Soil Quality Index Values and Soil Quality Classification

The SQI is a comprehensive metric used to evaluate soil cultivability. The calculated SQI values and corresponding soil quality grades for each treatment are presented in Figure 2.
Biochar elevated the SQI and improved the soil quality (Figure 3). In 2021, compared to the CK, B1 and B2 significantly increased the SQI values by 25.0% and 14.6%, respectively, resulting in a one-level elevation in soil quality grade compared to CK. In 2022, the positive effects of biochar application were even more pronounced. Compared to CK, B1 and B2 increased the SQI values of the soybean–maize rotation soil by 50.0% and 63.3%, respectively.
Overall, the application of biochar significantly improved the SQI values, though the magnitude of the effect varied with soil depth. Additionally, a strong positive correlation was observed between the SQI and crop yield, indicating that improved soil quality directly contributed to higher productivity.

3.3. Effects of Biochar on the Relationship Between Soil Quality and Related Soil Properties

3.3.1. Effects of Biochar Addition on Soil Physical, Chemical, and Biological Indicators

As shown in Table 8, biochar addition significantly enhanced soil enzyme activities across different soil layers. In 2021, in the 0–20 cm soil depth, compared to CK, B1 increased S-URE, S-SC, and S-NP activities by 12.2%, 22.8%, and 9.7%, respectively; B2 increased the activities of S-URE, S-SC, S-NP, and S-CAT by 14.6%, 30.8%, 6.9%, and 13.6%, respectively (p < 0.05). In the 20–40 cm soil depth, compared to CK, B1 increased S-URE, S-SC, and S-NP activities by 21.6%, 16.1%, and 5.6%, respectively; B2 increased S-URE, S-SC, and S-NP activities by 13.5%, 21.3%, and 6.9%, respectively (p < 0.05). In 2022, in the 0–20 cm soil depth, in comparison with CK, B1 increased S-URE, S-SC, S-NP, and S-CAT activities by 15.8%, 6.8%, 9.7%, and 13.5%, respectively; B2 increased these activities by 13.2%, 10.3%, 6.9%, and 13.5%, respectively, (p < 0.05). In the 20–40 cm soil depth, compared to CK, B1 increased S-URE and S-NP activities by 13.2% and 6.9%, respectively; B2 increased S-NP activity by 5.6% (p < 0.05).
Biochar addition also improved SOM and nutrient availability, with the degree of improvement varying by soil depth and biochar application depth (Table 8). In 2021, in the 0–20 cm soil layer, B1 increased HN, AN, SOM and AP content by 11.5%, 8.3%, 7.2% and 23.8%, respectively, in comparison with CK; B2 increased HN and AN content by 11.9% and 6.7% and reduced EC content by 19.5%, respectively, compared to CK (p < 0.05). At the 20–40 cm soil depth, there was no significant difference in the chemical index content of B1 and CK; B2 increased HN content by 26.3%, and reduced EC content by 28.2%, respectively, compared to CK (p < 0.05). In 2022, in the 0–20 cm soil layer, B1 increased AP content by 15.7%, in comparison with CK; B2 increased AN, AP, and AK content by 18.5%, 15.3%, and 11.6%, respectively, compared to CK (p < 0.05). At the 20–40 cm soil depth, there was no significant difference in the chemical index content of B1 and CK; B2 increased AK content by 17.3%, compared to CK (p < 0.05).
As shown in Table 9, the addition of biochar showed no significant effects on soil SWC, TSP, or CP, and reduced BD by 3%, compared to CK.

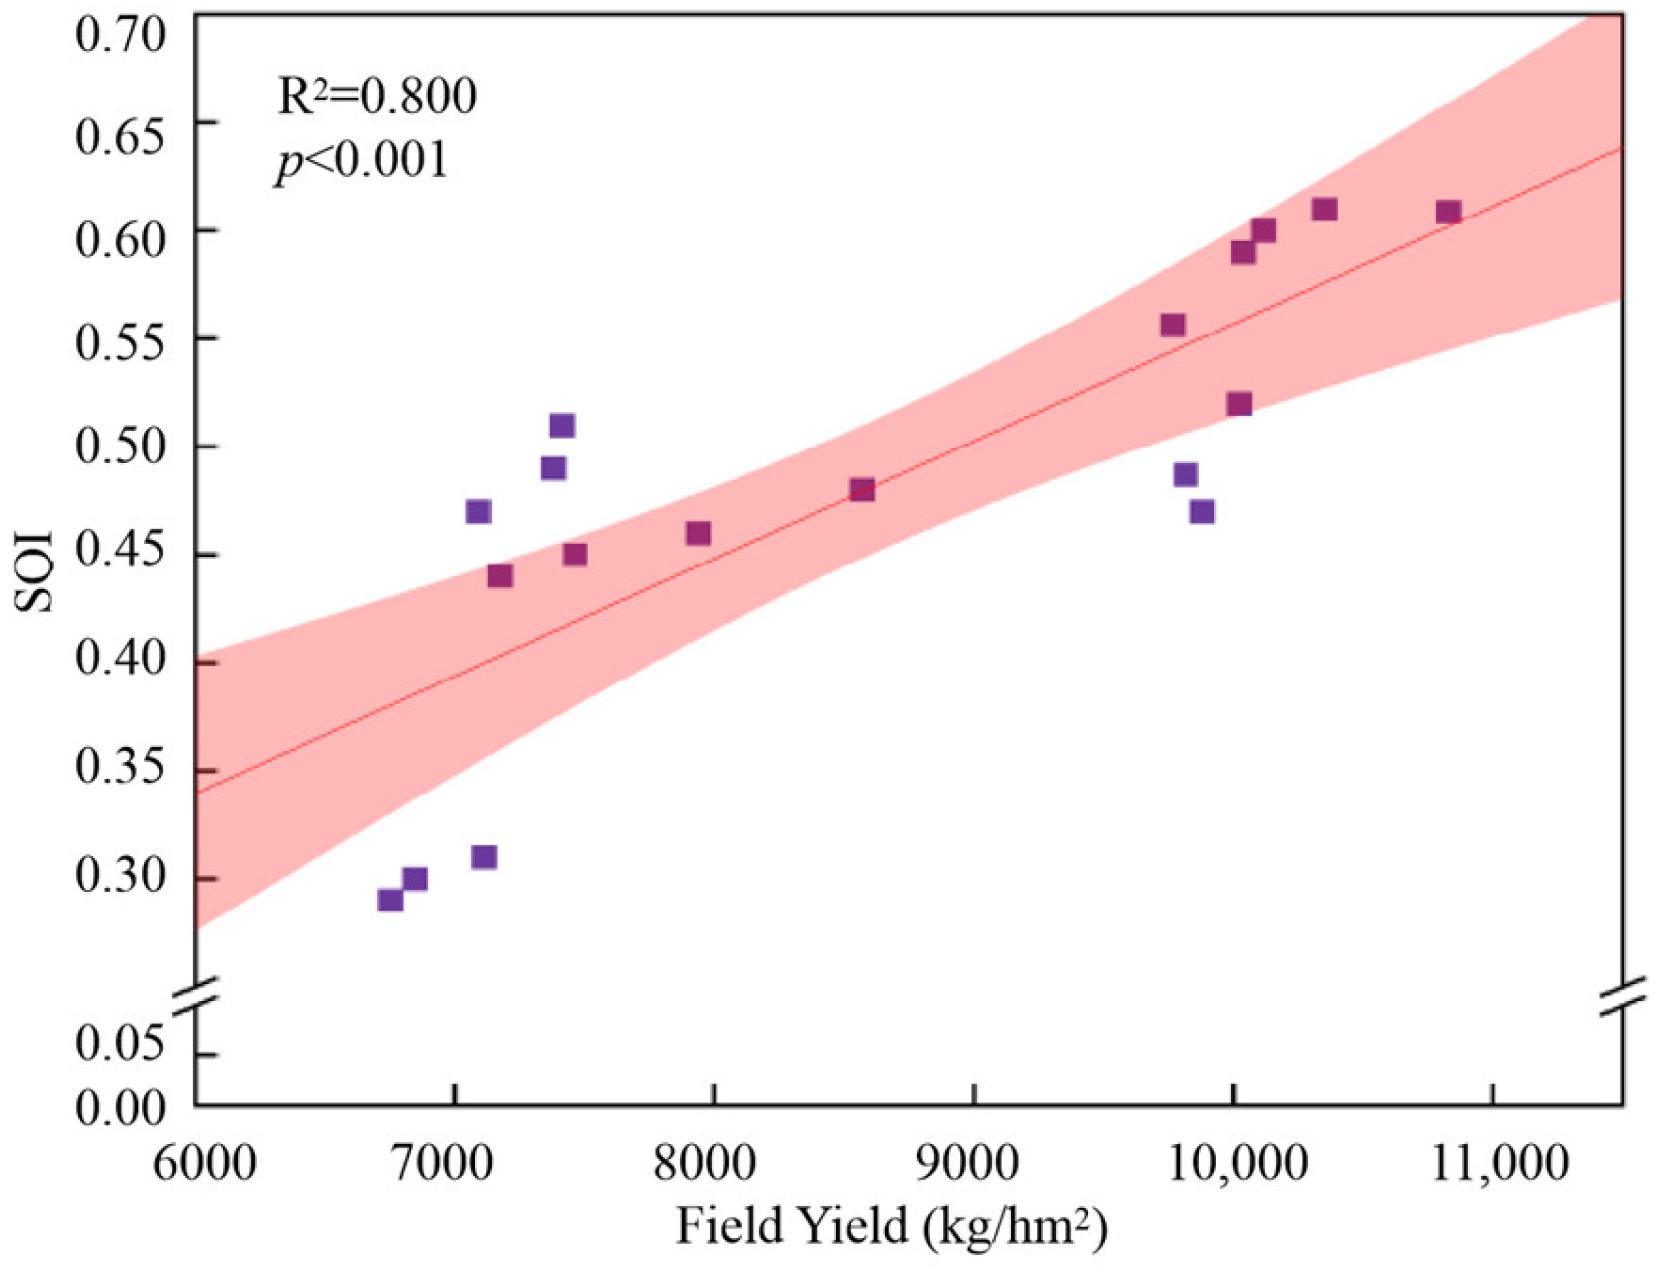
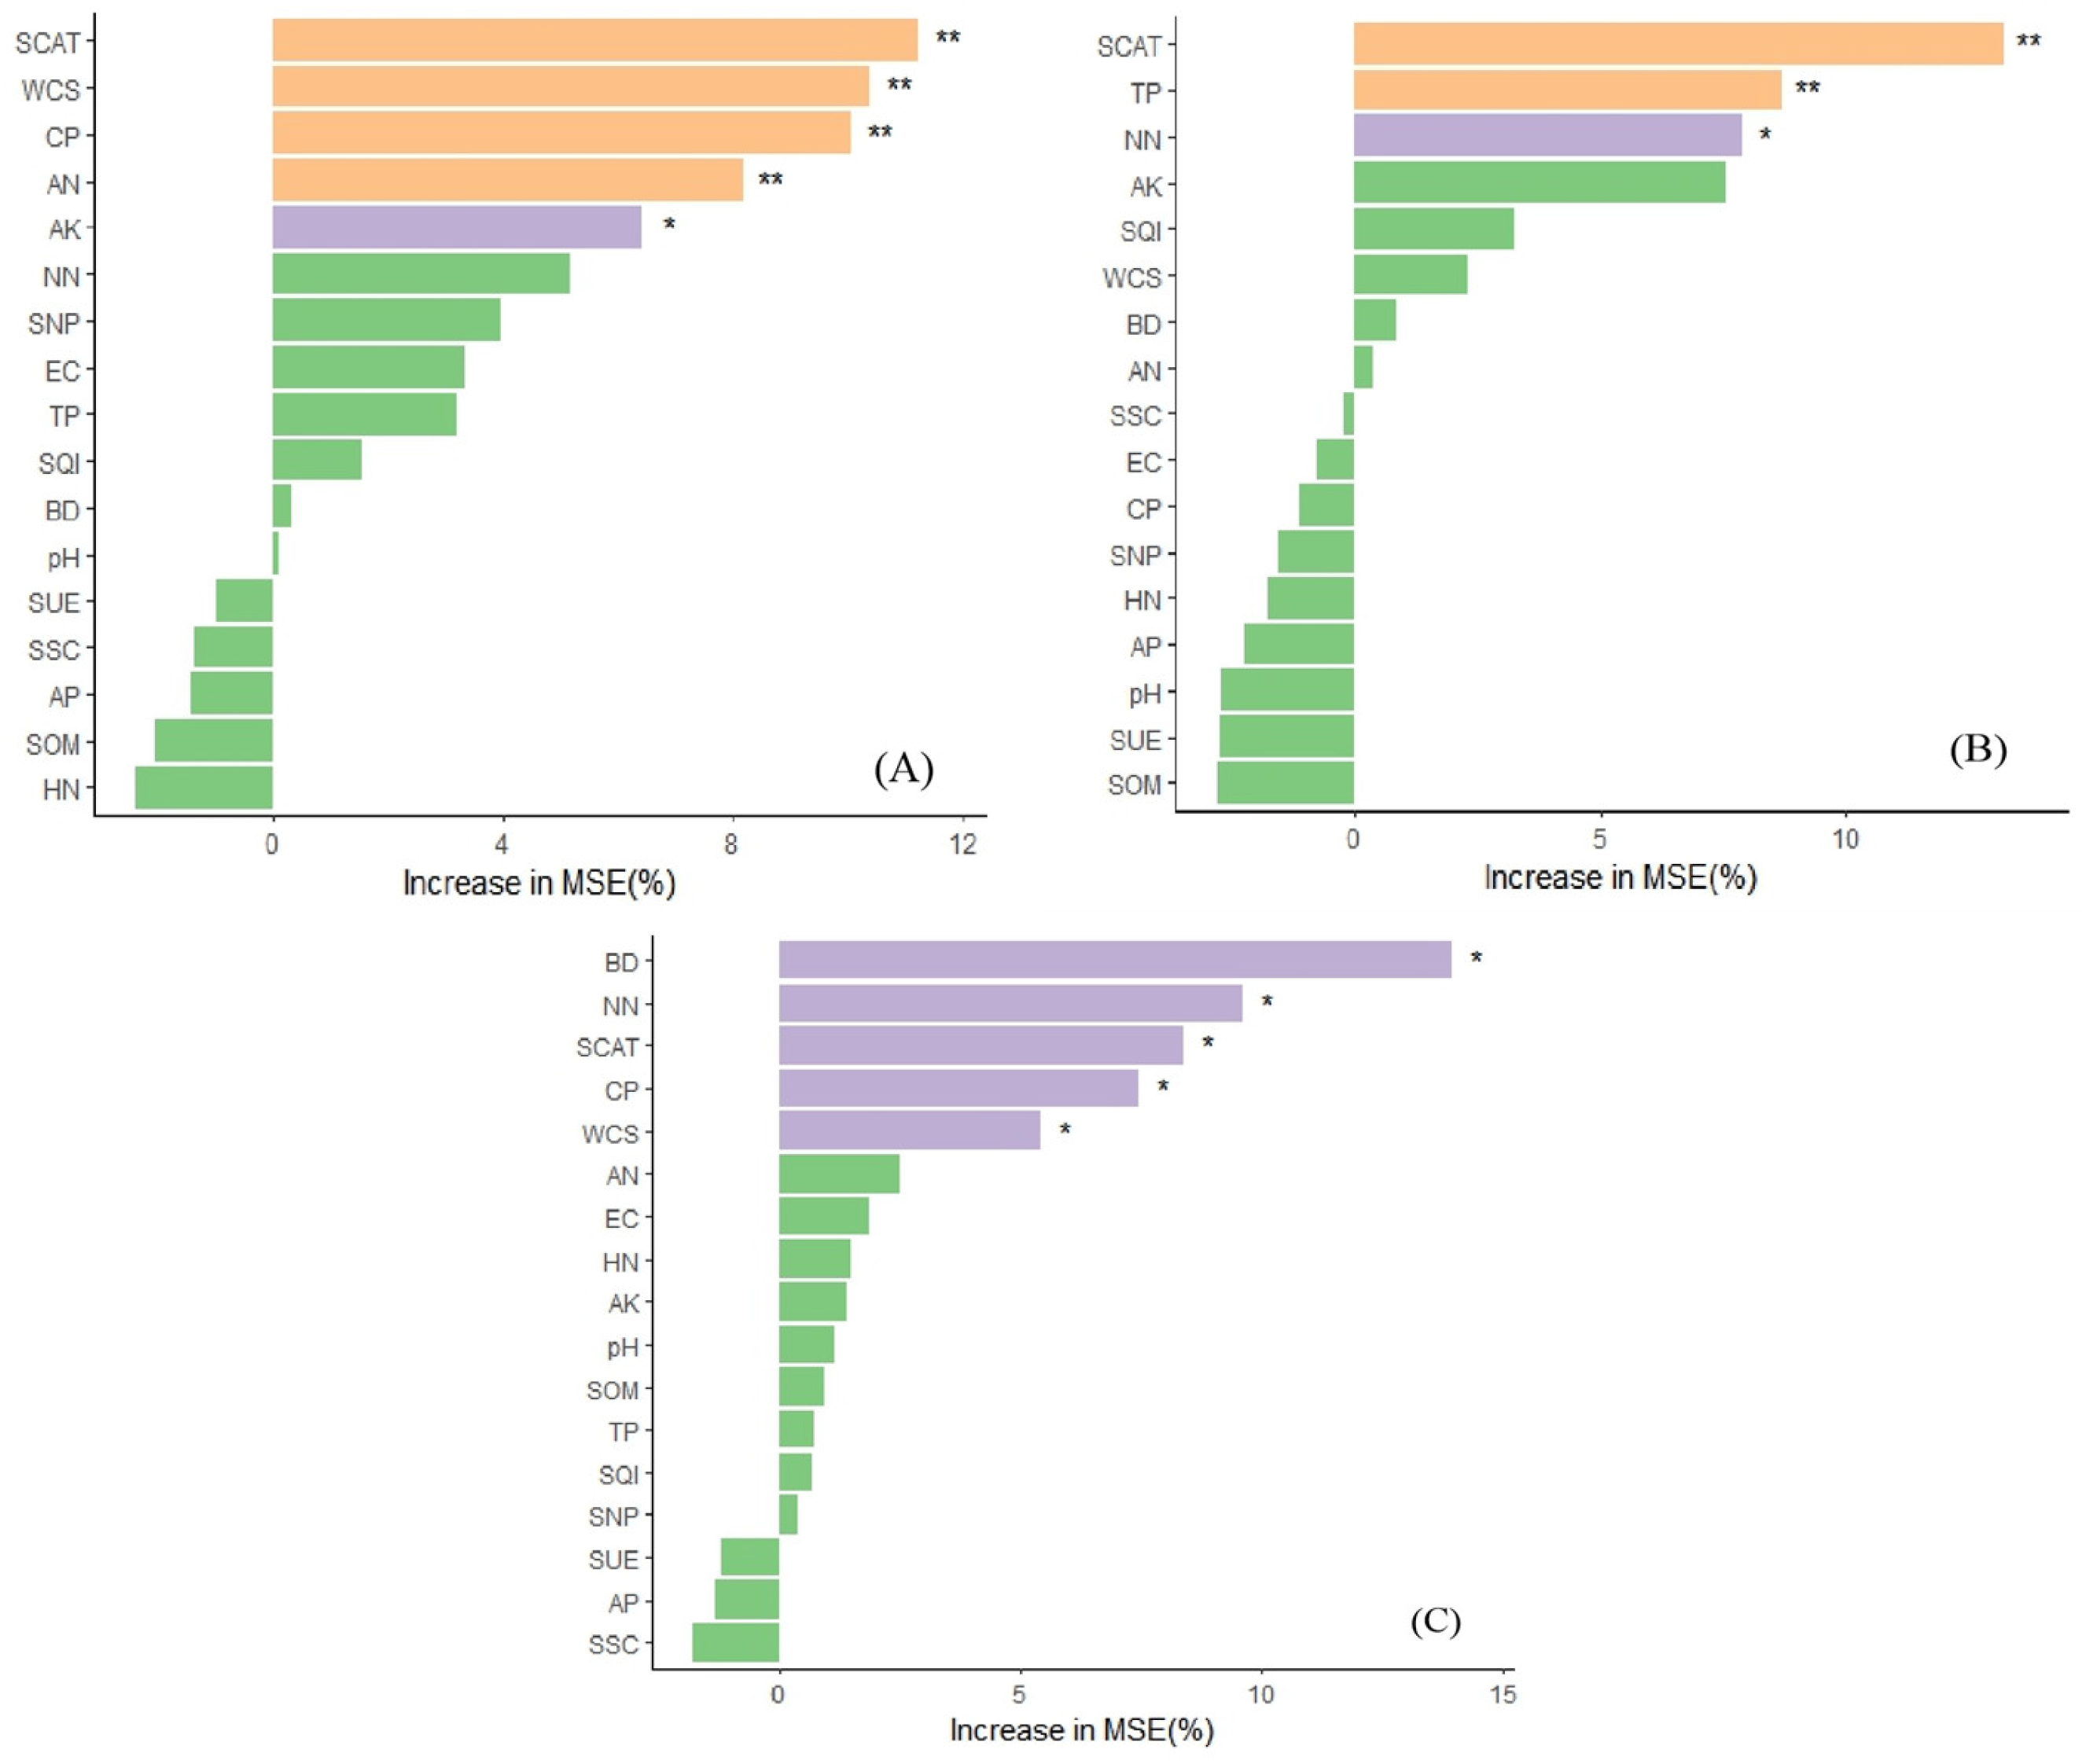
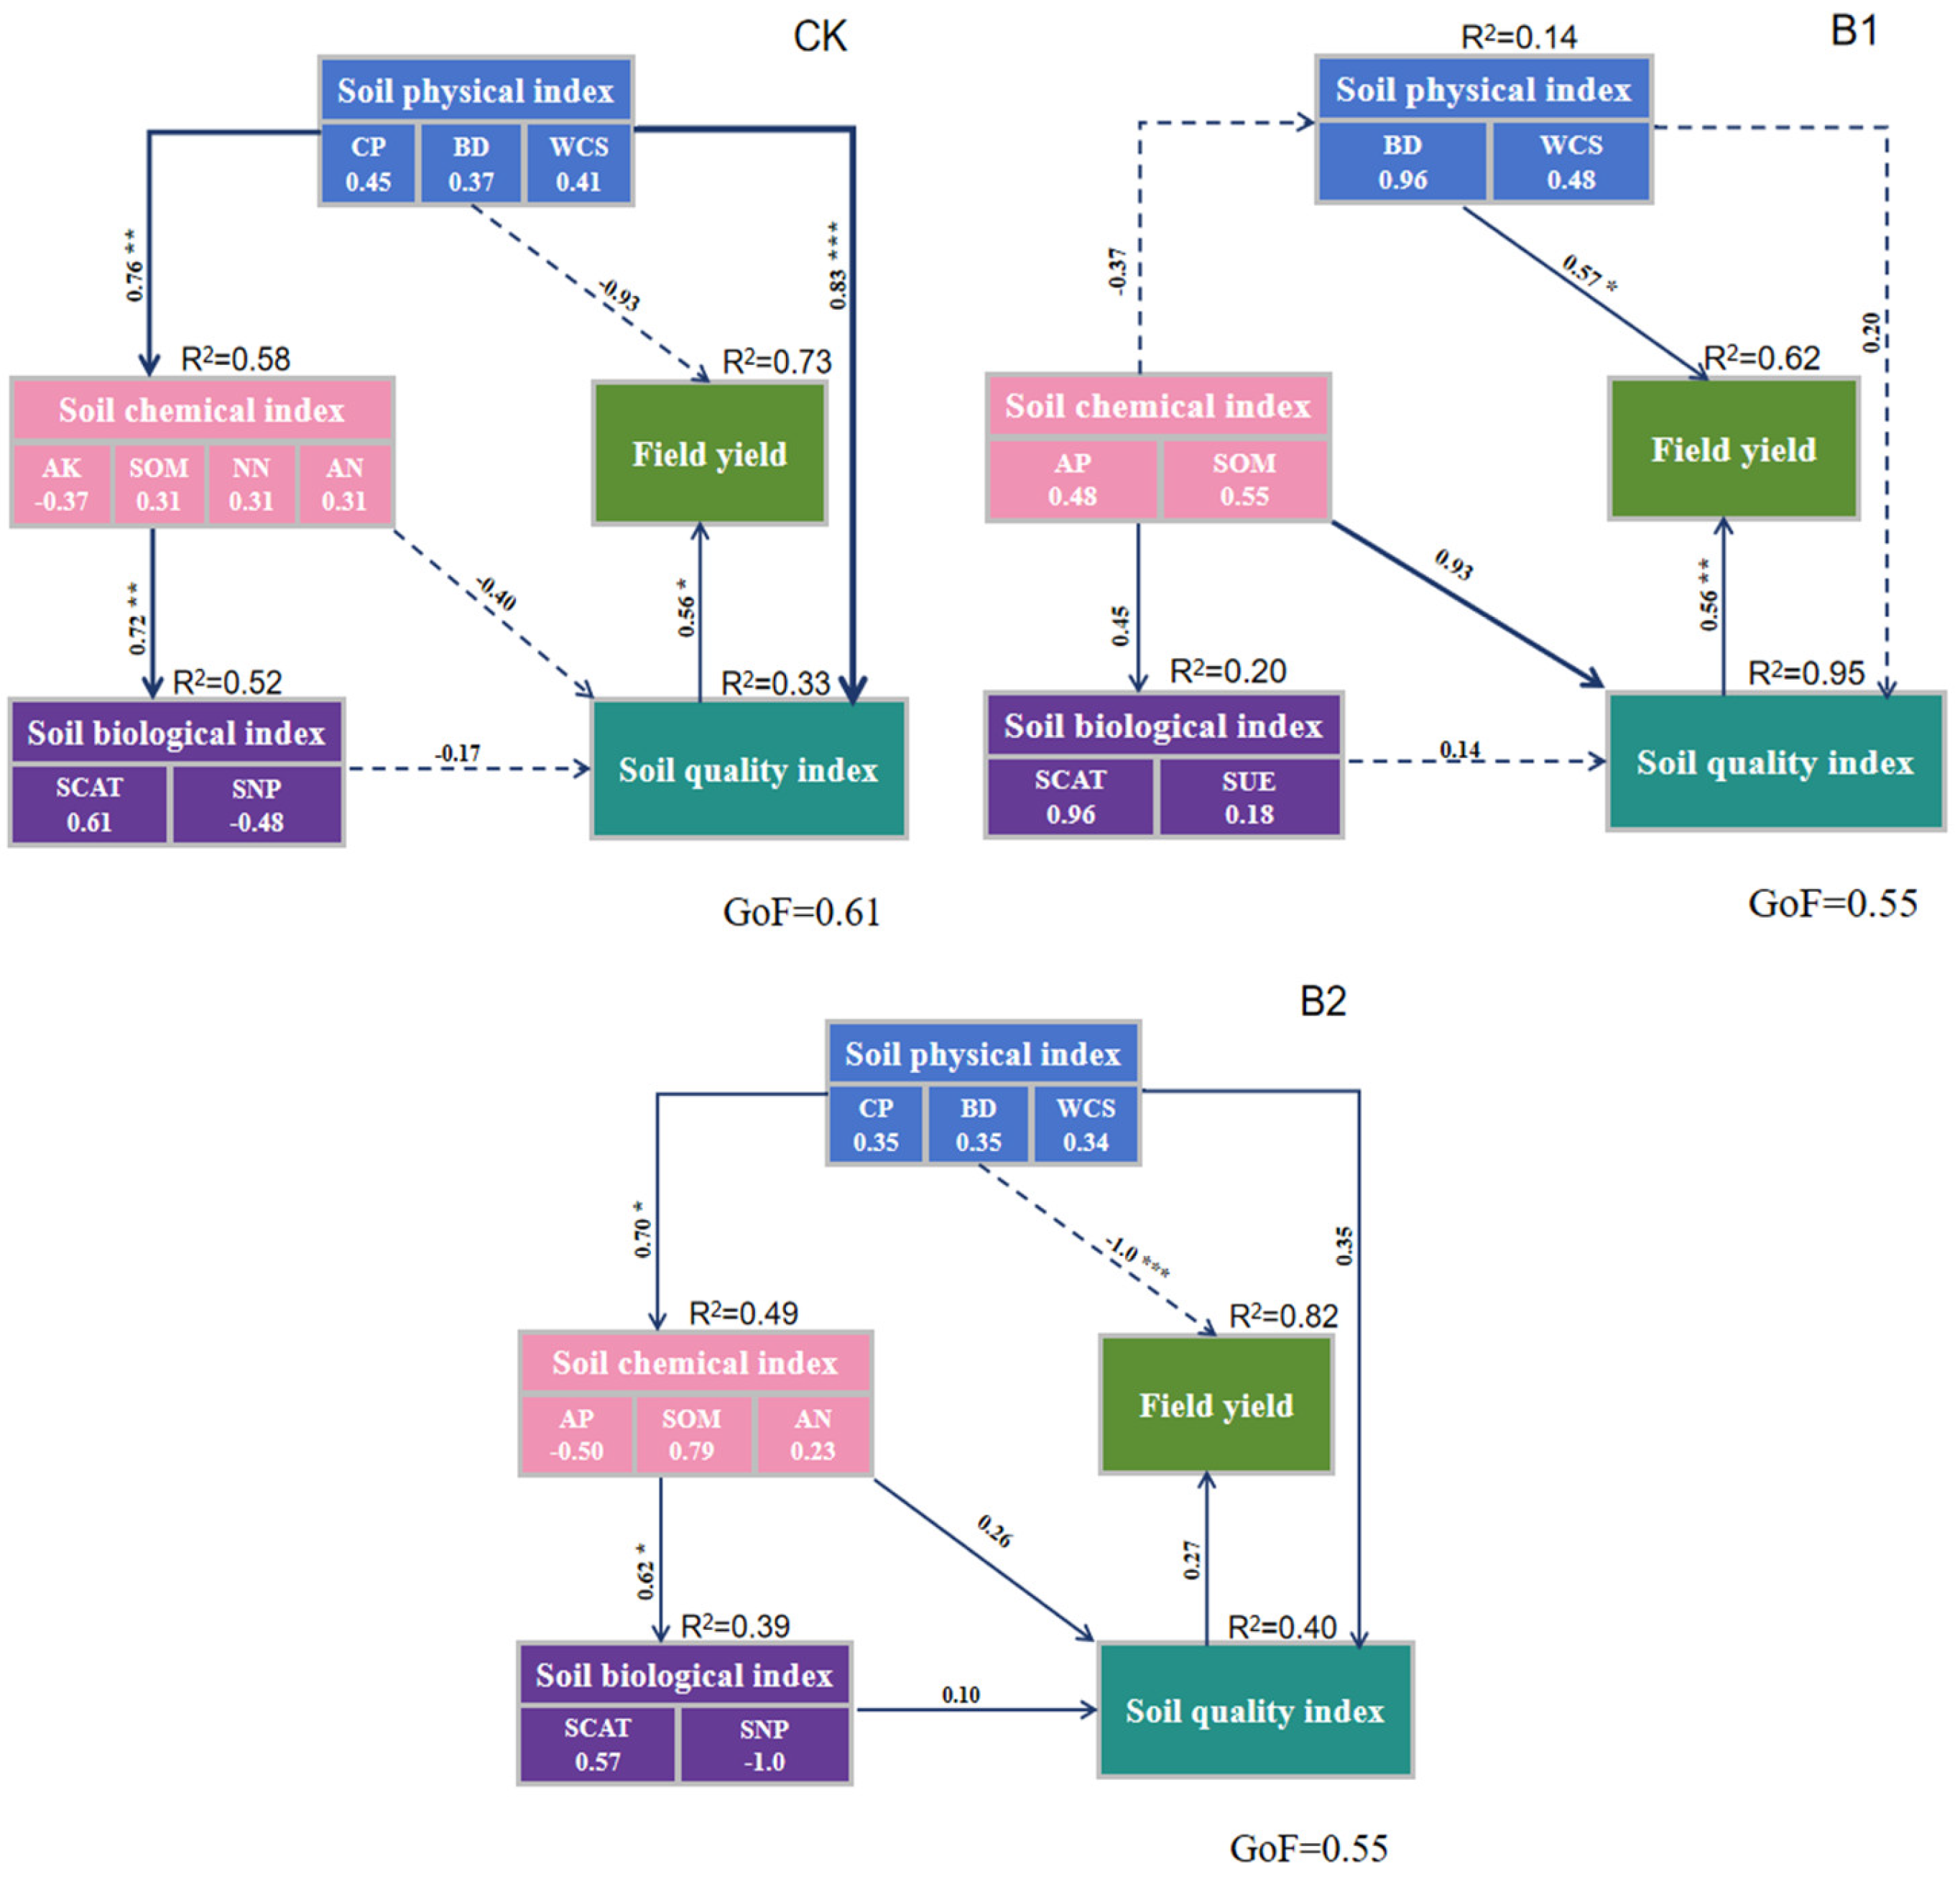
3.3.2. The Effects of SQI, Soil Physical and Chemical Properties, and Biological Indicators on Corn Yield

The results of the dendrogram analysis (Figure 4) show that the intensity of the correlation among the five factors varies depending on the biochar treatment.
The random forest analysis presented in Figure 4 demonstrates hierarchical clustering relationships between maize yield and soil physical, chemical, and biological indicators, as well as SQI values. This multivariate analysis revealed that maize yield exhibited significant associations with soil parameters across multiple quality dimensions, though the strength and pattern of correlations varied substantially among biochar application treatments.
Under the CK, maize yield showed a highly significant positive correlation with S-CAT, SWC, CP, AN (p < 0.01), and AK (p < 0.05). Under the B1 treatment, yield maintained a highly significant correlation (p < 0.01) with S-CAT and TSP while showing a significant association (p < 0.05) with NN. Under the B1 treatment, yield revealed significant correlations with BD, NN, S-CAT, CP, and SWC (p < 0.05). Notably, S-CAT emerged as a consistent biological indicator showing significant correlations with maize yield across all three treatments (p < 0.01 for CK and B1; p < 0.05 for B2).
As depicted in Figure 5, by integrating the random forest analysis of how soil indicators affect yield, a partial least squares structural path model was constructed. Physical indicators, chemical indicators, biological indicators, soil SQI values, and yield exert mutual influences. The data showed that mutual effects exist between the soil’s physical, chemical, and biological indicators, SQI, and yield. And biochar input had different effects on it for the input method with varied weight ratios. Without biochar addition, physical indexes had a significant positive impact on chemical indexes and SQI (SPC = 0.76, p < 0.01; standardized path coefficient = 0.83, p < 0.001); chemical indexes had a significant positive effect on biological indexes (SPC = 0.72, p < 0.01). SQI had a significant positive effect on field yield (SPC = 0.56, p < 0.05). Among the four indices, the soil’s physical index, the soil’s chemical index, the soil’s biological index, the SQI, and the field yield, the yield weight is the largest (R2 = 0.73). Under the B1 treatment, physical indexes had a significant positive effect on yield (SPC = 0.57, p < 0.05); SQI had a significant positive effect on yield (SPC = 0.56, p < 0.01). Both SQI and yield have high weight (R2 = 0.95, R2 = 0.62). Under the B2 treatment, physical indexes had a significant positive influence on chemical indexes (SPC = 0.70, p < 0.01). Chemical indexes have a significant positive effect on biological indexes (SPC = 0.62, p < 0.05). The yield weight is the largest (R2 = 0.82).

4. Discussion

4.1. The Effects of Biochar on Soil Quality Index Under Soybean–Corn Rotational Cropping Conditions

The soil quality index (SQI) serves as a highly informative metric capable of mirroring the comprehensive state of the soil. It encapsulates an extensive array of physical attributes, chemical properties, and microbial features, providing a holistic view of soil quality [65]. It was found that biochar improved the soil quality under maize–soybean rotation; for example, B1 increased SQI from 0.45 to 0.6 in 2021 and from 0.3 to 0.45 in 2022 (p < 0.05). And B2 elevated the SQI from 0.45 to 0.55 in 2021 and from 0.3 to 0.49 in 2022 (p < 0.05) (Figure 2). This indicates that the incorporation of biochar in the 0–20 cm soil depth (B1) has a greater impact on soil quality than the incorporation of biochar in the 0–40 cm soil depth (B2), but there is no significant difference in the results. This indicates that Treatment B1 has a short-term impact on soil quality, while Treatment B2 has a more profound influence on soil quality. The reason may be that under Treatment B1, the applied biochar can quickly mix with the soil in the 0–20 cm layer. Due to the relatively large number of soil microorganisms and diverse species in the surface soil, the biochar can improve the bulk density and pore structure of the soil in the short term. At the same time, it can change the structure and activity of the microbial community, providing a favorable physical environment for the growth of crop roots, thus significantly increasing the soil quality index. After the biochar is applied to the 0–40 cm plough layer, the biochar decomposes slowly in the deep soil and can continuously release nutrients over a long period. Also, it takes a certain amount of time to gradually improve the structure of the deep soil. By 2022, the biochar reduced the bulk density of the deep soil and optimized the soil structure. This is beneficial for the roots of crops to develop deeper, expand the absorption range of the roots, and enhance the ability of crops to absorb water and nutrients, thus having a positive impact on the soil quality index. All data showed the positive support for the first hypothesis, which is that biochar improves soil quality in crop rotation by enhancing nutrient exchange and enzyme activity, thus activating soil nutrient retention. This is consistent with the results of Yan et al. [65]. The increase in the SQI of the field rotation soil in the 0–20 cm layer with the uniform incorporation of biochar can be largely attributed to (1) the decrease in soil BD (Table 9), which may have led to the improvement of soil aggregates [66]—a good physical structure helps to promote the respiration of roots and microorganisms [67], thereby enhancing water retention, nutrient storage, and improving soil quality [68]; (2) the increase in catalase activity (Table 8). Biochar has an adsorptive effect on enzymes, enhancing their retention [69], and the increase in catalase activity will promote the release and absorption of nutrients [70], thus improving soil quality and crop yield.

4.2. The Effects of Biochar on Soil Physical, Chemical, and Biological Indicators Under Soybean–Corn Rotational Cropping Conditions

Soil BD stands as a crucial parameter for representing the physical traits of soil. It plays a significant role in influencing the diffusion process of nutrients within the soil matrix. Moreover, it has a direct bearing on the uptake of these nutrients by crops, thus being essential for understanding soil–plant interactions and overall agricultural productivity [71]. Similar to previous reports [72,73,74], in our study, the mixed application of biochar was more significantly inclined to reduce the BD (Table 9), proving the second hypothesis, which is that biochar improves soil quality mainly by enhancing physical properties like soil BD, thanks to its high surface area and porosity. This phenomenon can be explained by the characteristics of biochar. In contrast to soil, biochar contains a relatively high proportion of cellulose, pure carbon, and carbon compounds. As a result, it has a lower density and a more porous, loose structure [75,76]. The biophysical requirements for root and microbial respiration are affected by the soil BD. As the soil BD decreases, this changes the composition and diversity of bacteria and fungi in the soil [67], promotes nutrient supply, and ultimately increases the SQI. However, some studies have shown that the high porosity and hydrophobic functional groups of biochar may increase the soil BD. This is mainly because biochar particles can block soil pores, and excessive application may hinder the diffusion of soil moisture. In addition, its dark surface may increase the soil temperature and promote water evaporation, jointly leading to a decrease in SWC, which may harm the soil BD [77]. These effects may vary depending on the soil type and structural category. The above evidence can prove that hypothesis (2) holds. This research additionally discovered that Treatment B1 had a more pronounced impact on BD compared to Treatment B2 (Table 9), possibly due to the positive synergistic effect between biochar and crop rotation. Therefore, compared with B2, the mixed application of biochar in the 0-20 cm soil depth (B1) is more effective in reversing soil compaction.
In this study, the combined application of biochar significantly increased the contents of SOM, HN, AN, AP, and AK (Table 8). This can be explained as follows: (1) Biochar serves as an additional source of soil nutrients such as SOM, which can directly increase the soil nutrient levels [78]; (2) The porous structure of biochar endows it with a high cation exchange capacity and high specific surface area, enabling it to adsorb more substances. In particular, it can adsorb nitrogen in the soil in the “gaseous cycle” mode and adsorb phosphorus and potassium in the “sedimentary cycle” mode, thus improving soil nutrient retention [79,80]. This study found that the combined application of biochar significantly increased the activities of soil enzymes such as S-URE, S-SC, S-NP, and S-CAT (Table 8). Previous studies have shown that soil enzyme activities are greatly affected by the application rate of biochar, its source, and the properties of the applied soil [81,82,83]. There are two important mechanisms for biochar to regulate soil enzyme activities: Firstly, the adsorption of enzymes or substrates by biochar directly affects the activities and properties of enzymes [84]. Secondly, the application of biochar can increase the SOM and nutrient contents in the soil, stimulate the interaction between microorganisms and plant roots, create necessary conditions for the growth of soil microorganisms, and thus increase soil enzyme activities [85]. These enzymes play a crucial role in the cycles of C, N, and P [86]. A positive feedback loop is formed between enzyme activities and soil nutrients [87], achieving the effect of improving soil quality. Compared with the soil depth of 0–40 cm, the soil depth of 0–20 cm is a hot spot area where soil microorganisms are active [88]. Therefore, the combined application of biochar (B1) in the 0–20 cm soil depth has a more obvious effect on increasing SOM, available nutrients, and enzyme activities by influencing properties such as soil moisture and temperature.

4.3. The Effects of Biochar on Maize Yield Under Soybean–Corn Rotational Cropping Conditions

The increase in maize grain yield obtained in this study is consistent with the reports of other researchers [89,90,91,92,93], who also reported increased crop yields after adding biochar to the soil. From our research, we found that the application of biochar mixed in the 0–20 cm soil depth (B1) increased the yield of rotation maize by 7.2% and 5.6% over two years (Table 2), while B2 only notably increased the maize yield in 2021 (Table 2). The activities of roots and microorganisms (which promote the movement and assimilation of nutrients) are significantly enhanced in the top 20 cm of the soil. However, when biochar is applied at a depth of 0–40 cm, over time, due to the lower biological activity in this layer, the nutrients released by biochar may not be effectively retained. They may migrate to deeper layers, beyond the root zone, in which the ability of biochar to improve soil quality weakened. This differential response pattern suggests that biochar application depth substantially modifies the relative importance of specific soil parameters in determining crop productivity, though soil enzymatic activity (as represented by S-CAT) persists as a critical biological indicator irrespective of amendment strategy. Compared with Treatment B1, under Treatment B2, on the one hand, biochar exerts its effect in the deep soil, improving the structure of the deep soil. Under the action of gravity and other factors, the arrangement of soil particles in the surface soil becomes more reasonable, thus reducing the bulk density. On the other hand, the deep mixed application of biochar provides more habitats and breeding places for soil microorganisms, enhancing the activity of microorganisms and accelerating the decomposition of organic matter, which further improves the soil structure. Similar to the reasons for the decrease in bulk density, the biochar in Treatment B2 decomposes relatively slowly and can continuously exert its effect over a long period. Therefore, it can continuously provide a stable habitat and nutrients for soil microorganisms, keeping the microbial community stable and thus maintaining a high level of catalase activity. Moreover, the good physical structure and biochemical structure promote each other, forming a positive and stable interaction in the soil. A least squares SEM was developed to quantify the interactions among soil properties and maize yield, informed by random-forest-derived variable-importance metrics (Figure 5). The analysis revealed distinct treatment-dependent patterns in the magnitude and direction of relationships between physical, chemical, and biological soil indicators, SQI, and crop yield. This can be attributed to the following. (1) Biochar improved the physical and chemical properties of the soil. Specifically, due to its high adsorption capacity, biochar mitigated nutrient losses. Simultaneously, it augmented the content of available nutrients in the soil, thereby facilitating crop growth [94]. (2) Or this may be because the application of biochar improved the SQI of the soil through the positive additive effects on the physical, chemical, and biological properties of the soil (Figure 2), and there was a significant positive correlation between SQI and yield (p < 0.001) (Figure 3), thus increasing crop yield. (3) Or, even though biochar exhibits relative stability within the soil environment, its capacity to enhance soil quality and the soil’s micro-ecosystem has the potential to decline as time progresses [95,96]. Overall, the influence of biochar on soil quality and crop yield in soft soils is undeniable. Biochar can effectively facilitate crop growth and, to a certain degree, contribute to the accumulation of maize yield. Even though its effectiveness is contingent upon diverse environmental conditions, in future research, continuous investigations should be carried out regarding the impacts of biochar application rates and methods on maize yield.

5. Conclusions

The study establishes a minimum data set to evaluate soil quality indices under biochar application in maize–soybean rotation systems and conducts random forest analysis on soil indicators that affect maize yield. A partial least squares structural equation model was created, which includes soil bulk density, soil water content, pH, and nitrate nitrogen values. Under the conditions of rotation systems, compared with CK, the application of biochar reduced the soil bulk density index by 3%, increased soil organic matter, ammonium nitrogen, available nitrogen, available phosphorus, and available potassium contents by 7.25%, 11.55–26.3%, 6.7–18.5%, 15.3–23.8%, and 11.6–17.3%, respectively, and reduced electrical conductivity content by 19.5-28.2%; it also increased increased soil urease, sucrase, phosphatase, and catalase activities by 12.2–21.6%, 6.8–30.8%, 5.6–9.7%, and 9.7–13.6%, respectively, the yield was increased by 5.6–7.2%, and the soil quality index was increased by 14.6–63.3% (p < 0.05). The random forest model indicates that soil catalase activity has a significant correlation with yield. These results suggest that biochar primarily improves soil quality and maize yield by influencing soil bulk density and the activity of soil catalase. Considering soil properties, soil quality index and crop yield comprehensively, with the extension of the rotation time, the advantages of mixing biochar in the 0–40 cm soil layer gradually become promising. Therefore, we recommend the method of mixing biochar in the 0–40 cm soil layer for the sustainable utilization of farmland soil. The data were obtained from a fixed experiment for the three years in typical mollisol, so the results can act as an example for the other sites with mollisol. Recent studies have shown that biochar has a greater impact on soil microorganisms than on soil physical and chemical indices. Therefore, subsequent studies can supplement the proportion of soil microbial indices to better understand the effects of biochar.

Supplementary Materials

The following supporting information can be downloaded at: https://www.mdpi.com/article/10.3390/agronomy15051226/s1, Table S1: The descriptive statistical analysis of soil physical and chemical indexes under CK in 2021; Table S2: The descriptive statistical analysis of soil physical and chemical indexes under B1 in 2021; Table S3: The descriptive statistical analysis of soil physical and chemical indexes under B2 in 2021; Table S4: The descriptive statistical analysis of soil physical and chemical indexes under CK in 2022; Table S5: The descriptive statistical analysis of soil physical and chemical indexes under B1 in 2022; Table S6: The descriptive statistical analysis of soil physical and chemical indexes under B2 in 2022.

Author Contributions

Conceptualization, Z.J. and Z.L.; Data curation, L.H.; Formal analysis, Y.W., L.H. and S.Y.; Funding acquisition, Z.L. and Z.J.; Investigation, Z.W. and X.L.; Methodology, X.L., S.Y. and Z.W.; Project administration, X.Z. and R.G.; Resources, L.H.; Software, L.H. and Y.W.; Supervision, R.G. and X.Z.; Validation, Y.W.; Visualization, Y.W. and L.H.; Writing—original draft, Y.W.; Writing—review and editing, Z.L. All authors have read and agreed to the published version of the manuscript.

Funding

This research was funded by the National Key Research and Development Program (grant number 2024YFD1501003-03).

Data Availability Statement

The datasets used or analyzed during the current study are available from the corresponding author upon reasonable request.

Conflicts of Interest

The authors confirm that the research was carried out without any commercial or financial ties that might be perceived as a possible conflict of interest.

Abbreviations

The following abbreviations are used in this manuscript:
BDBulk density
TSPTotal soil porosity
CPCapillary porosity
SWCSoil water content
ECElectrical conductivity
APAvailable phosphorus
AKAvailable potassium
SOMSoil organic matter
ANAvailable nitrogen
NNNitrate nitrogen
HNAmmonium nitrogen
S-URESoil urease activity
S-SCSoil sucrase activity
S-NPSoil phosphatase activity
S-CATSoil catalase activity
CVThe coefficient of variation
TDSThe total data set
MDSThe minimum data set
PCAPrincipal component analysis
SQISoil quality index

References

  1. Li, R.; Hu, W.Y.; Jia, Z.J.; Liu, H.Q.; Zhang, C.; Huang, B.; Yang, S.H.; Zhao, Y.G.; Zhao, Y.C.; Shukla, M.K.; et al. Soil degradation: A global threat to sustainable use of black soils. Pedosphere 2025, 35, 264–279. [Google Scholar] [CrossRef]
  2. Abhilash, P.C.; Singh, N. Pesticide use and application: An Indian scenario. J. Hazard. Mater. 2009, 165, 1–12. [Google Scholar] [CrossRef] [PubMed]
  3. Wang, H.; Zhang, C.; Yao, X.C.; Yun, W.J.; Ma, J.N.; Gao, L.L.; Li, P.S. Scenario simulation of the tradeoff between ecological land and farmland in black soil region of Northeast China. Land Use Policy 2022, 114, 105991. [Google Scholar] [CrossRef]
  4. He, Y.X.; Zhang, F.B.; Yang, M.Y.; Li, X.T.; Wang, Z.A. Insights from size fractions to interpret the erosion-driven variations in soil organic carbon on black soil sloping farmland, Northeast China. Agric. Ecosyst. Environ. 2023, 343, 108283. [Google Scholar] [CrossRef]
  5. Sui, P.; Luo, Y.; Zheng, H.; Li, R.; Wang, H.; Yuan, Y.; Zheng, J.; Liu, W. Effects of long-term tillage practices on the stability of soil aggregates and organic carbon in black soil farmland. Chin. J. Appl. Ecol. 2023, 34, 1853–1861. (In Chinese) [Google Scholar] [CrossRef]
  6. Liu, X.B.; Burras, C.L.; Kravchenko, Y.S.; Duran, A.; Huffman, T.; Morras, H.; Studdert, G.; Zhang, X.Y.; Cruse, R.M.; Yuan, X.H. Overview of Mollisols in the world: Distribution, land use and management. Can. J. Soil Sci. 2012, 92, 383–402. [Google Scholar] [CrossRef]
  7. Zhang, S.L.; Huang, J.; Wang, Y.; Shen, Q.S.; Mu, L.L.; Liu, Z.H. Spatiotemporal heterogeneity of soil available nitrogen during crop growth stages on mollisol slopes of northeast China. Land Degrad. Dev. 2017, 28, 856–869. [Google Scholar] [CrossRef]
  8. Zhang, S.L.; Zhang, X.Y.; Liu, Z.H.; Sun, Y.K.; Liu, W.; Dai, L.; Fu, S.C. Spatial heterogeneity of soil organic matter and soil total nitrogen in a Mollisol watershd of Northeast China. Environ. Earth Sci. 2014, 72, 275–288. [Google Scholar] [CrossRef]
  9. Zhang, S.L.; Zhang, X.Y.; Liu, X.B.; Liu, W.; Liu, Z.H. Spatial distribution of soil nutrient at depth in black soil of Northeast China: A case study of soil available potassium. Nutr. Cycl. Agroecosyst. 2013, 95, 319–331. [Google Scholar] [CrossRef]
  10. Raiesi, F. A minimum data set and soil quality index to quantify the effect of land use conversion on soil quality and degradation in native rangelands of upland arid and semiarid regions. Ecol. Indic. 2017, 75, 307–320. [Google Scholar] [CrossRef]
  11. Jiang, M.; Wen, Y.; Sun, M.; Wang, H.; Zeng, Y.; Han, Y.; Li, X.; Wu, H.; Li, L.; Xu, S. Thinking and implementation approach of science and technology strategy of well raising black soil—overall idea and implementation planning of strategy priority research program of chinese academy of sciences on black soil conservation and utilization. Bull. Chin. Acad. Sci. 2021, 36, 1146–1154. (In Chinese) [Google Scholar] [CrossRef]
  12. Zhang, X.Y.; Sui, Y.Y.; Zhang, X.D.; Meng, K.; Herbert, S.J. Spatial variability of nutrient properties in black soil of northeast China. Pedosphere 2007, 17, 19–29. [Google Scholar] [CrossRef]
  13. Li, K.H.; Zhang, Y.; Zhang, J.B.; Chen, C.; Yang, R.Z. Long-term gully dynamics over cropland in the black soil area of China based on systematic sampling. Soil Tillage Res. 2024, 244, 106273. [Google Scholar] [CrossRef]
  14. Zhang, G.; Yang, Y.; Liu, Y.; Wang, Z. Advances and prospects of soil erosion research in the black soil region of northeast China. J. Soil Water Conserv. 2022, 36, 1–12. (In Chinese) [Google Scholar] [CrossRef]
  15. Wei, D.; Kuang, E.; Chi, F.; Zhang, J.; Guo, W. Status and protection strategy of black soil resources in northeast of China. Heilongjiang Agric. Sci. 2016, 1, 158–161. (In Chinese) [Google Scholar]
  16. Gao, G.; Wang, J.; Li, S.; Pei, J. Changes of organic carbon density and storage in northeastern black soil areas in past 30 years. Chin. J. Soil Sci. 2015, 46, 774–780. (In Chinese) [Google Scholar] [CrossRef]
  17. Guo, S.J.; Han, X.H.; Li, H.; Wang, T.; Tong, X.G.; Ren, G.X.; Feng, Y.Z.; Yang, G.H. Evaluation of soil quality along two revegetation chronosequences on the Loess Hilly Region of China. Sci. Total Environ. 2018, 633, 808–815. [Google Scholar] [CrossRef]
  18. Zhang, Y.H.; Xu, X.L.; Li, Z.W.; Liu, M.X.; Xu, C.H.; Zhang, R.F.; Luo, W. Effects of vegetation restoration on soil quality in degraded karst landscapes of southwest China. Sci. Total Environ. 2019, 650, 2657–2665. [Google Scholar] [CrossRef]
  19. Han, X.; Zou, W.; Wang, F.; Wang, F. Construction effect of fertile cultivated layer in black soil. Chin. J. Appl. Ecol. 2009, 20, 2996–3002. (In Chinese) [Google Scholar] [CrossRef]
  20. Peng, J.; Yang, Q.S.; Zhang, C.Y.; Ni, S.M.; Wang, J.G.; Cai, C.F. Aggregate pore structure, stability characteristics, and biochemical properties induced by different cultivation durations in the Mollisol region of Northeast China. Soil Tillage Res. 2023, 233, 105797. [Google Scholar] [CrossRef]
  21. Ma, R.; Tian, Z.Y.; Zhao, Y.; Wu, Y.H.; Liang, Y. Response of soil quality degradation to cultivation and soil erosion: A case study in a Mollisol region of Northeast China. Soil Tillage Res. 2024, 242, 106159. (In Chinese) [Google Scholar] [CrossRef]
  22. Gholoubi, A.; Emami, H.; Alizadeh, A. Soil quality change 50 years after forestland conversion to tea farming. Soil Res. 2018, 56, 509–517. [Google Scholar] [CrossRef]
  23. Ma, C.; Wang, H. Research on the status quo and direction of black land protection and utilization at home and abroad. Agric. Compr. Dev. China 2022, 7–11. (In Chinese) [Google Scholar]
  24. Fang, H.Y.; Sun, L.Y.; Qi, D.L.; Cai, Q.G. Using Cs technique to quantify soil erosion and deposition rates in an agricultural catchment in the black soil region, Northeast China. Geomorphology 2012, 169, 142–150. [Google Scholar] [CrossRef]
  25. Obalum, S.E.; Chibuike, G.U.; Peth, S.; Ouyang, Y. Soil organic matter as sole indicator of soil degradation. Environ. Monit. Assess. 2017, 189, 176. [Google Scholar] [CrossRef]
  26. Cai, Y.; Hao, M. Effects of rotation model and period on wheat yield, nutrient uptake and soil fertility in the Loess Plateau. J. Plant Nutr. Fertil. 2015, 21, 864–872. (In Chinese) [Google Scholar] [CrossRef]
  27. Yang, L.; Wang, L.H.; Chu, J.C.; Zhao, H.L.; Zhao, J.; Zang, H.D.; Yang, Y.D.; Zeng, Z.H. Improving soil quality and wheat yield through diversified crop rotations in the North China Plain. Soil Tillage Res. 2024, 244, 106231. [Google Scholar] [CrossRef]
  28. Zhao, W.Y.; Wen, M.X.; Zhao, C.T.; Zhang, S.R.; Dou, R.A.; Liang, X.F.; Zhang, X.F.; Liu, Z.H.; Jiang, Z.F. Warm temperature increments strengthen the crosstalk between roots and soil in the rhizosphere of soybean seedlings. Plants 2023, 12, 4135. [Google Scholar] [CrossRef]
  29. Xin, J.; Mu, J.L.; Qiu, W.W.; Xu, L.Y.; Guo, J.L.; Jiang, Z.F.; Liu, Z.H. Responses of soil macro-porosity, nutrient concentrations and stoichiometry following conversion of rice-wheat rotation to organic greenhouse vegetable system. Agronomy 2024, 14, 2207. [Google Scholar] [CrossRef]
  30. Wang, L.; Ye, C.; Chen, J.; Li, J.; Luo, J. Effects of intercropping and rotation between oil flax and wheat on soil physicochemical properties and growth of oil flax. J. Agric. Sci. Technol. 2021, 23, 161–171. (In Chinese) [Google Scholar] [CrossRef]
  31. Fang, Y.T.; Ren, T.; Zhang, S.T.; Liu, Y.; Liao, S.P.; Li, X.K.; Cong, R.H.; Lu, J.W. Rotation with oilseed rape as the winter crop enhances rice yield and improves soil indigenous nutrient supply. Soil Tillage Res. 2021, 212, 105065. [Google Scholar] [CrossRef]
  32. Hoss, M.; Behnke, G.D.; Davis, A.S.; Nafziger, E.D.; Villamil, M.B. Short corn rotations do not improve soil quality, compared with corn monocultures. Agron. J. 2018, 110, 1274–1288. [Google Scholar] [CrossRef]
  33. Adjei, E.O.; Ayamba, B.E.; Buri, M.M.; Biney, N.; Appiah, K. Soil quality and fertility dynamics under a continuous cassava-maize rotation in the semi-deciduous forest agro-ecological zone of Ghana. Front. Sustain. Food Syst. 2023, 7, 1095207. [Google Scholar] [CrossRef]
  34. Luo, B.L.; Zhou, J.; Yao, W.; Wang, Y.X.; Guillaume, T.; Yuan, M.; Han, D.W.; Bilyera, N.; Wang, L.X.; Zhao, L.; et al. Maize and soybean rotation benefits soil quality and organic carbon stock. J. Environ. Manag. 2024, 372, 123352. [Google Scholar] [CrossRef]
  35. Kumar, N.; Sow, S.; Rana, L.; Ranjan, S.; Singh, A.K. Trash amended with trichoderma effects on cane yield, soil carbon dynamics, and enzymatic activities under plant-ratoon system of sugarcane in calcareous soil. Sugar Tech 2025, 27, 134–147. [Google Scholar] [CrossRef]
  36. Shao, G.D.; Zhou, J.; Liu, B.C.; Alharbi, S.A.; Liu, E.K.; Kuzyakov, Y. Carbon footprint of maize-wheat cropping system after 40-year fertilization. Sci. Total Environ. 2024, 926, 172082. [Google Scholar] [CrossRef]
  37. Zhu, X.M.; Chen, B.L.; Zhu, L.Z.; Xing, B.S. Effects and mechanisms of biochar-microbe interactions in soil improvement and pollution remediation: A review. Environ. Pollut. 2017, 227, 98–115. [Google Scholar] [CrossRef]
  38. Liu, Z.H.; Gao, J.C.; Xu, L.Y.; Yang, R.Z.; Li, J.B.; Shi, Y.L.; Jiang, Z.F.; Shen, Y.Z. Effects of humic materials on soil n transformation and nh loss when co-applied with 3, 4-dimethylpyrazole phosphate and urea. J. Soil Sci. Plant Nut. 2022, 22, 3490–3499. [Google Scholar] [CrossRef]
  39. Dai, Y.J.; Liu, M.; Sun, Y.; Li, J.J.; Jiang, Y.; Li, S.S.; Yue, W.; Liu, Z.H. Adsorption characteristics of tetracycline on biochar from agricultural wastes. Desalin. Water Treat. 2019, 151, 384–391. [Google Scholar] [CrossRef]
  40. Meng, L.B.; Cheng, Z.Y.; Wang, Y.N.; Li, S.M.; Clarke, N. Arbuscular mycorrhizal fungal interacted with biochar and enhanced phosphate-solubilizing microorganism abundance and phosphorus uptake in maize. Agronomy 2024, 14, 1678. [Google Scholar] [CrossRef]
  41. Verheijen, F.G.A.; Zhuravel, A.; Silva, F.C.; Amaro, A.; Ben-Hur, M.; Keizer, J.J. The influence of biochar particle size and concentration on bulk density and maximum water holding capacity of sandy vs sandy loam soil in a column experiment. Geoderma 2019, 347, 194–202. [Google Scholar] [CrossRef]
  42. Kuzyakov, Y.; Bogomolova, I.; Glaser, B. Biochar stability in soil: Decomposition during eight years and transformation as assessed by compound-specific C analysis. Soil Biol. Biochem. 2014, 70, 229–236. [Google Scholar] [CrossRef]
  43. Wei, Z.; Zhang, S.; Yan, S.; Yan, P.; Feng, L.; Xiao, Z.; Liu, Z. Effects of biochar application on the dynamic of soil moisture-temperature-salt in degraded mollisols during freezing period. J. Soil Water Conserv. 2024, 38, 322–334. (In Chinese) [Google Scholar] [CrossRef]
  44. Chen, Y.; Shinogi, Y.; Taira, M. Influence of biochar use on sugarcane growth, soil parameters, and groundwater quality. Aust. J. Soil Res. 2010, 48, 526–530. [Google Scholar] [CrossRef]
  45. Brockhoff, S.R.; Christians, N.E.; Killorn, R.J.; Horton, R.; Davis, D.D. Physical and mineral-nutrition properties of sand-based turfgrass root zones amended with biochar. Agron. J. 2010, 102, 1627–1631. [Google Scholar] [CrossRef]
  46. Sun, F.F.; Lu, S.G. Biochars improve aggregate stability, water retention, and pore- space properties of clayey soil. J. Plant Nutr. Soil Sc. 2014, 177, 26–33. [Google Scholar] [CrossRef]
  47. Dokoohaki, H.; Miguez, F.E.; Laird, D.; Horton, R.; Basso, A.S. Assessing the biochar effects on selected physical properties of a sandy soil: An analytical approach. Commun. Soil Sci. Plant Anal. 2017, 48, 1387–1398. [Google Scholar] [CrossRef]
  48. Guo, C.Q.; Yang, C.; Fu, J.S.; Song, Y.; Chen, S.X.; Li, H.Y.; Ma, C.Q. Effects of crop rotation on sugar beet growth through improving soil physicochemical properties and microbiome. Ind. Crops Prod. 2024, 212, 118331. [Google Scholar] [CrossRef]
  49. He, F.; Hu, W.; He, F.; Wang, P.Z.; Pi, B.Y.; Zhao, M.Q. An appraisal of the utility of biochar in a rotation involving tobacco-rice in southern China. GCB Bioenergy 2023, 15, 979–993. [Google Scholar] [CrossRef]
  50. Aller, D.; Mazur, R.; Moore, K.; Hintz, R.; Laird, D.; Horton, R. Biochar age and crop rotation impacts on soil quality. Soil Sci. Soc. Am. J. 2017, 81, 1157–1167. [Google Scholar] [CrossRef]
  51. Zhang, Z.G.; An, J.; Xiong, S.W.; Li, X.F.; Xin, M.H.; Wang, J.; Han, Y.C.; Wang, G.P.; Feng, L.; Lei, Y.P.; et al. Orychophragmus violaceus-maize rotation increases maize productivity by improving soil chemical properties and plant nutrient uptake. Field Crops Res. 2022, 279, 108470. [Google Scholar] [CrossRef]
  52. Toková, L.; Igaz, D.; Horák, J.; Aydin, E. Effect of biochar application and re-application on soil bulk density, porosity, saturated hydraulic conductivity, water content and soil water availability in a silty loam Haplic Luvisol. Agronomy 2020, 10, 1005. [Google Scholar] [CrossRef]
  53. Wang, Y.Z.; Zhang, H.F.; Zhang, Y.P.; Fei, J.C.; Rong, X.M.; Peng, J.W.; Luo, G.W. Crop rotation-driven changes in rhizosphere metabolite profiles regulate soil microbial diversity and functional capacity. Agr. Ecosyst. Environ. 2023, 358, 108716. [Google Scholar] [CrossRef]
  54. Guo, E.L.; Wang, Y.F.; Jirigala, B.; Jin, E. Spatiotemporal variations of precipitation concentration and their potential links to drought in mainland China. J. Clean. Prod. 2020, 267, 122004. [Google Scholar] [CrossRef]
  55. Bao, S. Soil Agrochemical Analysis; China Agriculture Press: Beijing, China, 2000. [Google Scholar]
  56. Guan, S.Y. Soil Enzymes and Their Research Methods; Agricultural Press: Beijing, China, 1986. [Google Scholar]
  57. Li, B.; Li, H.; Guo, X.; Sun, J.; Liang, J.; Long, H.; Tao, Z. Evaluation of soil quality of cultivated land in Ningxia area based on minimum data set. Jiangsu Agric. Sci. 2021, 49, 195–201. (In Chinese) [Google Scholar] [CrossRef]
  58. Chen, Z. Study on Environmental Quality and Degradationcauses of Greenhouse Agricultural Soil in Shaanxi Province. Master’s Thesis, Northwest Agriculture and Forestry University, Xianyang, China, 2021. (In Chinese). [Google Scholar]
  59. Rezaei, S.A.; Gilkes, R.J.; Andrews, S.S. A minimum data set for assessing soil quality in rangelands. Geoderma 2006, 136, 229–234. [Google Scholar] [CrossRef]
  60. Qiao, Y.; Zhong, X.; Miao, S.; Li, Q.; Lu, X. Evaluation indicators of soil quality in plough layer of aeolian sandy land in northeast China based on minimum data set. Res. Soil Water Conserv. 2019, 26, 132–138. (In Chinese) [Google Scholar] [CrossRef]
  61. Lou, Y.; Shi, D.; Jiang, G.; Jin, H.; Chen, Z.; Lin, Z. Evaluation of soil quality in the cultivated-layer of sloping farmland in purple hilly area based on minimum data set. Sci. Soil Water Conserv. 2019, 17, 75–85. (In Chinese) [Google Scholar] [CrossRef]
  62. Hu, W.; Liu, W.; Liu, K.; Wu, Y. Evaluation of soil quality and establishment of bio-indicators based on minimal data set. Acta Agrestia Sin. 2024, 32, 3855–3867. (In Chinese) [Google Scholar]
  63. Mei, N.; Gu, Y.; Li, D.; Liang, Y.; Yuan, J.; Liu, J.; Ren, J.; Cai, H. Soil quality evaluation in topsoil layer of black soil in Jilin Province based on minimum data set. Trans. Chin. Soc. Agric. Eng. 2021, 37, 91–98. (In Chinese) [Google Scholar] [CrossRef]
  64. Andrews, S.S.; Karlen, D.L.; Mitchell, J.P. A comparison of soil quality indexing methods for vegetable production systems in Northern California. Agric. Ecosyst. Environ. 2002, 90, 25–45. [Google Scholar] [CrossRef]
  65. Yan, S.H.; Zhang, S.L.; Yan, P.K.; Aurangzeib, M. Effect of biochar application method and amount on the soil quality and maize yield in Mollisols of Northeast China. Biochar 2022, 4, 56. [Google Scholar] [CrossRef]
  66. Ghorbani, M.; Amirahmadi, E. Insights into soil and biochar variations and their contribution to soil aggregate status—A meta-analysis. Soil Tillage Res. 2024, 244, 106282. [Google Scholar] [CrossRef]
  67. Fouladidorhani, M.; Shayannejad, M.; Shariatmadari, H.; Mosaddeghi, M.R.; Arthur, E. Pyrolysis of different organic feedstock combinations as soil amendments enhances the reclamation of saline-sodic soil. Soil Tillage Res. 2024, 238, 105993. [Google Scholar] [CrossRef]
  68. Laghari, M.; Mirjat, M.S.; Hu, Z.Q.; Fazal, S.; Xiao, B.; Hu, M.A.; Chen, Z.H.; Guo, D.B. Effects of biochar application rate on sandy desert soil properties and sorghum growth. Catena 2015, 135, 313–320. [Google Scholar] [CrossRef]
  69. Foster, E.J.; Fogle, E.J.; Cotrufo, M.F. Sorption to biochar impacts -glucosidase and phosphatase enzyme activities. Agriculture 2018, 8, 158. [Google Scholar] [CrossRef]
  70. Kuscu, I.S.K.; Cetin, M.; Yigit, N.; Savaci, G.; Sevik, H. Relationship between enzyme activity (urease-catalase) and nutrient element in soil use. Pol. J. Environ. Stud. 2018, 27, 2107–2112. [Google Scholar] [CrossRef]
  71. Costa, J.C.; Borges, J.A.R.; Pires, L.F. Soil bulk density evaluated by gamma-ray attenuation: Analysis of system geometry. Soil Tillage Res. 2013, 129, 23–31. [Google Scholar] [CrossRef]
  72. Blanco-Canqui, H. Biochar and soil physical properties. Soil Sci. Soc. Am. J. 2017, 81, 687–711. [Google Scholar] [CrossRef]
  73. Pranagal, J.; Kraska, P. 10-years studies of the soil physical condition after one-time biochar application. Agronomy 2020, 10, 1589. [Google Scholar] [CrossRef]
  74. Singh, H.; Northup, B.K.; Rice, C.W.; Prasad, P.V.V. Biochar applications influence soil physical and chemical properties, microbial diversity, and crop productivity: A meta-analysis. Biochar 2022, 4, 8. [Google Scholar] [CrossRef]
  75. Bird, M.I.; Ascough, P.L.; Young, I.M.; Wood, C.V.; Scott, A.C. X-ray microtomographic imaging of charcoal. J. Archaeol. Sci. 2008, 35, 2698–2706. [Google Scholar] [CrossRef]
  76. Spokas, K.A.; Koskinen, W.C.; Baker, J.M.; Reicosky, D.C. Impacts of woodchip biochar additions on greenhouse gas production and sorption/degradation of two herbicides in a Minnesota soil. Chemosphere 2009, 77, 574–581. [Google Scholar] [CrossRef] [PubMed]
  77. Zhu, Z.T.; Zhang, Y.; Tao, W.M.; Zhang, X.L.; Xu, Z.D.; Xu, C.C. The biological effects of biochar on soil’s physical and chemical characteristics: A review. Sustainability 2025, 17, 2214. [Google Scholar] [CrossRef]
  78. Antal, M.J.; Gronli, M. The art, science, and technology of charcoal production. Ind. Eng. Chem. Res. 2003, 42, 1619–1640. [Google Scholar] [CrossRef]
  79. Saifullah; Dahlawi, S.; Naeem, A.; Rengel, Z.; Naidu, R. Biochar application for the remediation of salt-affected soils: Challenges and opportunities. Sci. Total Environ. 2018, 625, 320–335. [Google Scholar] [CrossRef]
  80. Zhang, X.; Qu, J.S.; Li, H.; La, S.K.; Tian, Y.Q.; Gao, L.H. Biochar addition combined with daily fertigation improves overall soil quality and enhances water-fertilizer productivity of cucumber in alkaline soils of a semi-arid region. Geoderma 2020, 363, 114170. [Google Scholar] [CrossRef]
  81. Xu, Y.X.; He, L.L.; Liu, Y.X.; Lyu, H.H.; Wang, Y.Y.; Chen, J.Y.; Yang, S.M. Effects of biochar addition on enzyme activity and fertility in paddy soil after six years. Ying Yong Sheng Tai Xue Bao 2019, 30, 1110–1118. [Google Scholar] [CrossRef]
  82. Zaid, F.; Al-Awwal, N.; Yang, J.; Anderson, S.H.; Alsunuse, B.T.B. Effects of biochar-amended composts on selected enzyme activities in soils. Processes 2024, 12, 1678. [Google Scholar] [CrossRef]
  83. Galazka, A.; Jonczyk, K.; Gawryjolek, K.; Ciepiel, J. The impact of biochar doses on soil quality and microbial functional diversity. Bioresources 2019, 14, 7852–7868. [Google Scholar] [CrossRef]
  84. Oleszczuk, P.; Josko, I.; Futa, B.; Pasieczna-Patkowska, S.; Palys, E.; Kraska, P. Effect of pesticides on microorganisms, enzymatic activity and plant in biochar-amended soil. Geoderma 2014, 214, 10–18. [Google Scholar] [CrossRef]
  85. Wu, S.W.; Zhang, Y.; Tan, Q.L.; Sun, X.C.; Wei, W.H.; Hu, C.X. Biochar is superior to lime in improving acidic soil properties and fruit quality of Satsuma mandarin. Sci. Total Environ. 2020, 714, 136722. [Google Scholar] [CrossRef] [PubMed]
  86. Frankenberger, W.T.; Bingham, F.T. Influence of salinity on soil enzyme-activities. Soil Sci. Soc. Am. J. 1982, 46, 1173–1177. [Google Scholar] [CrossRef]
  87. Wang, N.; Li, L.; Gou, M.M.; Jian, Z.J.; Hu, J.W.; Chen, H.L.; Xiao, W.F.; Liu, C.F. Living grass mulching improves soil enzyme activities through enhanced available nutrients in citrus orchards in subtropical China. Front. Plant Sci. 2022, 13, 1053009. [Google Scholar] [CrossRef]
  88. Kot, A.; Frac, M.; Lipiec, J.; Usowicz, B. Biological activity and microbial genetic diversity of bare-fallow and grassland soils. Acta Agric. Scand. Sect. B—Soil Plant Sci. 2015, 65, 648–657. [Google Scholar] [CrossRef]
  89. Major, J.; Rondon, M.; Molina, D.; Riha, S.J.; Lehmann, J. Maize yield and nutrition during 4 years after biochar application to a Colombian savanna oxisol. Plant Soil 2010, 333, 117–128. [Google Scholar] [CrossRef]
  90. Uzoma, K.C.; Inoue, M.; Andry, H.; Fujimaki, H.; Zahoor, A.; Nishihara, E. Effect of cow manure biochar on maize productivity under sandy soil condition. Soil Use Manag. 2011, 27, 205–212. [Google Scholar] [CrossRef]
  91. Chen, Z.K.; Kamchoom, V.; Apriyono, A.; Chen, R.; Chen, C.W. Laboratory study of water infiltration and evaporation in biochar-amended landfill covers under extreme climate. Waste Manag. 2022, 153, 323–334. [Google Scholar] [CrossRef]
  92. Karer, J.; Wimmer, B.; Zehetner, F.; Kloss, S.; Soja, G. Biochar application to temperate soils: Effects on nutrient uptake and crop yield under field conditions. Agric. Food Sci. 2013, 22, 390–403. [Google Scholar] [CrossRef]
  93. Luan, J.; Fu, Y.; Tang, W.Z.; Yang, F.; Li, X.Z.; Yu, Z.M. Impact of interaction between biochar and soil microorganisms on growth of chinese cabbage by increasing soil fertility. Appl. Sci. 2023, 13, 12545. [Google Scholar] [CrossRef]
  94. Wang, H.L.; Lin, K.D.; Hou, Z.N.; Richardson, B.; Gan, J. Sorption of the herbicide terbuthylazine in two New Zealand forest soils amended with biosolids and biochars. J. Soils Sediments 2010, 10, 283–289. [Google Scholar] [CrossRef]
  95. Spokas, K.A.; Novak, J.M.; Masiello, C.A.; Johnson, M.G.; Colosky, E.C.; Ippolito, J.A.; Trigo, C. Physical disintegration of biochar: An overlooked process. Environ. Sci. Technol. Lett. 2014, 1, 326–332. [Google Scholar] [CrossRef]
  96. Ippolito, J.A.; Laird, D.A.; Busscher, W.J. Environmental benefits of biochar. J. Environ. Qual. 2012, 41, 967–972. [Google Scholar] [CrossRef]
Figure 1. Location of the Xiangyang Experimental Station of Northeast Agricultural University.
Agronomy 15 01226 g001
Figure 2. Effects of biochar on SQI value with soil quality grade classification. Note: Different lowercase letters indicate significant differences between biochar treatments (p < 0.05). The Abscissa is the grade of soil quality, and the ordinate is the range of each grade of soil quality. CK, no biochar application; B1, 0–20 cm mixed biochar; B2, 0–40 cm mixed biochar.
Agronomy 15 01226 g002
Figure 3. Relationship between soil SQI values and yield.
Agronomy 15 01226 g003
Figure 4. Random forest analysis of important factors affecting soil yield. Note: (A) represents CK, (B) represents B1, 0–20 cm mixed biochar and (C) represents B2, 0–40 cm mixed biochar SQI, Soil Quality Index; p < 0.05 is indicated by “*”; p < 0.01 is indicated by “**”. The ordinate abbreviations are indicated at the end of the text.
Agronomy 15 01226 g004
Figure 5. Relationship between soil properties, SQI, and crop yield under different biochar treatments. Note: CK, no biochar application; B1, 0–20 cm mixed biochar; B2, 0–40 cm mixed biochar; Solid and dashed arrows indicate positive and negative correlations, respectively; p < 0.05 is represented by “*”, p < 0.01 by “**”, p < 0.001 by “***”, two numbers on each path represent standardized path coefficients (SPC), and R2 represents the proportion of variance explained by each variable. Goodness of fit is the degree of model fit.
Agronomy 15 01226 g005
Table 1. Basic physical and chemical properties of soil.
YearspH ValueOrganic
Matter
(g·kg−1)
Available
Phosphorus
(mg·kg−1)
Available
Potassium
(mg·kg−1)
Electrical
Conductivity
(uS·m−1)
Alkaline
Hydrolyzable
Nitrogen (mg·kg−1)
20216.5027.616.3181.065.0121.5
20226.4227.015.9162.078.0110.1
Table 2. Basic properties of the biochar in the experiment.
pHOrganic Matter
(g·kg−1)
Available Nitrogen (mg·kg−1)Available Phosphorus (mg·kg−1)Available Potassium (mg·kg−1)
9.5767068.11.0134.3
Table 3. Soil quality parameter membership function types.
IndicatorsMembership Function TypesMembershipFunctionsMembership Function Parameters
a1b1a2b2
BD (g·cm−3)Parabola F = 1                           b 2 x b 1 x a 1 b 1 a 1     a 1 < x < b 1 x a 2 b 2 a 2     a 2 > x > b 2 0               x a 1   o r   a 2
a1, b1, a2, b2 are the upper and lower limits of the index threshold, and x is the measured value of the index
1.151.261.321.38
pH 6.406.456.556.60
SWC (%)S F = 1                                         x b 1 x a 1 b 1 a 1     a 1 < x < b 1 0                                       x < a 1
a1, b1 are the upper and lower limits of the indicator thresholds, and x is the measured value of the indicator
16.022.0
TSP (%)S43.053.0
CP (%)S22.030.0
EC (μS·cm−1)S47.085.0
AN (mg·kg−1)S103.2121.7
HN (mg·kg−1)S32.043.7
NN (mg·kg−1)S8.816.0
SOM (g·kg−1)S20.724.9
AP (mg·kg−1)S16.624.4
AK (mg·kg−1)S160.7189.2
S-URE (mg·kg−1 24 h)S0.330.47
S-SC (mg·kg−1 24 h)S11.814.8
S-NP (mg·kg−1 24 h)S0.710.79
S-CAT (mL·g−1 20 min)S0.370.46
Note: BD, soil bulk density; SWC, soil water content; TSP, total soil porosity; CP, capillary porosity; EC, electrical conductivity; AN, available nitrogen; HN, ammonium nitrogen; NN, nitrate nitrogen; SOM, soil organic matter; AP, available phosphorus; AK, available potassium; S-URE, soil urease activity; S-SC, soil sucrase activity; S-NP, soil phosphatase activity; S-CAT, soil catalase activity.
Table 4. The effects of biochar addition on maize yield and some yield components.
Years Codes Single Ear Weight (g) Kernel Rows Per Ear 100-Kernel Weight (g) Yield (kg·hm−2)
2021CK277.5 ± 1.2 a17.5 ± 0.1 b36.5 ± 2.0 a9499.0 ± 598.6 b
B1284.5 ± 7.5 a18.4 ± 0.5 ab37.3 ± 1.2 a10185.1 ± 583.5 a
B2282.0 ± 1.2 a18.9 ± 0.4 a36.0 ± 0.9 a10137.3 ± 450.7 a
2022CK246.8 ± 1.1 a17.2 ± 0.1 a27.0 ± 0.5 b6904.0 ± 170.8 b
B1251.2 ± 1.5 a17.4 ± 0.1 a29.1 ± 0.6 a7526.8 ± 249.4 a
B2249.6 ± 2.1 a17.2 ± 0.1 a28.5 ± 0.3 a7294.8 ± 118.0 ab
Note: Different lowercase letters indicate differences between different biochar treatments (p < 0.05). CK: No biochar application, B1: 0–20 cm mixed biochar, B2: 0–40 cm mixed biochar.
Table 5. The descriptive statistical analysis of soil physical and chemical indexes.
Indexes Minimum Maximum Mean Standard Deviation CV (%)
BD1.071.341.240.086.72
TSP44.6055.6051.003.346.56
CP18.829.224.53.9116.0
SWC0.140.240.200.0314.8
pH6.406.816.540.111.70
EC21.011561.426.042.4
AP11.528.720.04.6823.4
AK15522918323.012.6
SOM16.426.823.23.4414.9
AN24.051.637.07.7921.1
NN4.2434.412.37.4360.2
HN1091421239.327.69
S-URE0.300.580.440.0920.3
S-SC11.322.015.53.5322.7
S-NP0.670.860.770.067.92
S-CAT0.360.670.470.0714.7
Note: BD, soil bulk density; TSP, total soil porosity; CP, capillary porosity; SWC, soil water content; EC, electrical conductivity; AP, available phosphorus; AK, available potassium; SOM, soil organic matter; AN, available nitrogen; NN, nitrate nitrogen; HN, ammonium nitrogen; S-URE, soil urease activity; S-SC, soil sucrase activity; S-NP, soil phosphatase activity; S-CAT, soil catalase activity; CV, the coefficient of variation.
Table 6. Principal component analysis of soil quality indicators and Norm values.
Index Load Factor Norm Values
PC1 PC2 PC3 PC4
BD−0.600.77−0.11−0.102.30
TSP0.90−0.24−0.160.092.42
CP0.360.790.430.082.09
SWC0.610.510.510.152.12
pH−0.930.260.120.182.51
EC−0.10−0.910.35−0.012.07
AP−0.620.470.54−0.162.11
AK−0.760.370.470.012.29
SOM0.82−0.340.12−0.292.28
AN0.840.460.00−0.202.43
NN0.640.05−0.130.751.85
HN−0.68−0.56−0.290.322.22
S-URE0.91−0.010.40−0.052.46
S-SC0.09−0.740.64−0.111.94
S-NP0.100.15−0.90−0.321.56
S-CAT0.410.85−0.230.092.18
Eigenvalues6.804.732.681.01
Contribution rate
of variance (%)
42.529.616.86.32
Cumulative rate
of contribution (%)
42.572.188.895.2
Note: BD, soil bulk density; TSP, total soil porosity; CP, capillary porosity; SWC, soil water content; EC, electrical conductivity; AP, available phosphorus; AK, available potassium; SOM, soil organic matter; AN, available nitrogen; NN, nitrate nitrogen; HN, ammonium nitrogen; S-URE, soil urease activity; S-SC, soil sucrase activity; S-NP, soil phosphatase activity; S-CAT, soil catalase activity.
Table 7. Variance and weights of soil quality factors in the minimum data set.
Common Factor VarianceWeights
BD0.5930.262
SWC0.3130.138
pH0.7660.339
NN0.5890.261
Note: BD, soil bulk density; SWC, soil water content; NN, nitrate nitrogen.
Table 8. Effects of biochar application on soil chemical and biological indices.
YearsDepthTreatmentspHHN (mg·kg−1)AN (mg·kg−1)EC (μS·cm−1)NN (mg·kg−1)SOM (g·kg−1)AP (mg·kg−1)AK (mg·kg−1)S-URE (mg·g−1·24 h)S-SC (mg·g−1·24 h)S-NP (mg·g−1·24 h)S-CAT (ml·g−1·20 min)
20210–20 cmCK6.46 ± 0.01 a114.22 ± 0.40 b36.10 ± 0.07 b87.42 ± 1.54 a9.21 ± 0.17 a22.38 ± 0.06 b19.46 ± 0.11 b183.56 ± 0.65 a0.41 ± 0.00 b12.26 ± 0.02 b0.72 ± 0.01 b0.44 ± 0.00 b
B16.46 ± 0.02 a127.40 ± 2.06 a39.44 ± 0.45 a84.58 ± 1.06 a9.55 ± 0.96 a24.00 ± 0.10 a24.09 ± 0.87 a184.47 ± 2.34 a0.46 ± 0.00 a15.05 ± 0.22 a0.79 ± 0.00 a0.46 ± 0.01 b
B26.48 ± 0.00 a127.87 ± 0.72 a38.28 ± 0.13 a70.38 ± 2.88 b12.29 ± 1.25 a23.60 ± 0.40 ab20.45 ± 0.05 b194.01 ± 2.06 a0.47 ± 0.00 a16.03 ± 0.17 a0.77 ± 0.01 a0.50 ± 0.00 a
20–40 cmCK6.56 ± 0.00 a110.48 ± 0.76 b33.63 ± 0.69 a73.04 ± 2.11 a11.92 ± 0.53 a21.73 ± 0.35 a18.05 ± 0.56 a181.24 ± 0.13 a0.37 ± 0.00 b12.95 ± 0.14 c0.72 ± 0.00 b0.44 ± 0.00 a
B16.60 ± 0.02 a113.93 ± 0.98 ab34.98 ± 0.66 a60.75 ± 2.90 ab12.81 ± 0.57 a22.43 ± 0.19 a18.34 ± 0.93 a180.34 ± 4.65 a0.45 ± 0.01 a15.71 ± 0.10 a0.77 ± 0.01 a0.45 ± 0.00 a
B26.57 ± 0.00 a117.83 ± 0.50 a35.64 ± 0.54 a52.46 ± 0.83 b12.39 ± 0.94 a22.71 ± 0.07 a19.50 ± 1.16 a172.72 ± 1.16 a0.42 ± 0.01 a15.04 ± 0.02 b0.76 ± 0.00 a0.44 ± 0.00 a
20220–20 cmCK6.49 ± 0.01 a108.62 ± 1.01 a36.43 ± 0.25 b71.55 ± 4.39 a11.56 ± 1.40 a22.60 ± 0.43 a18.04 ± 0.32 b161.73 ± 2.58 b0.38 ± 0.01 b12.14 ± 0.07 b0.72 ± 0.01 b0.37 ± 0.01 b
B16.52 ± 0.01 a112.35 ± 1.01 a38.88 ± 0.89 b71.08 ± 4.92 a15.60 ± 0.75 a23.50 ± 0.08 a20.88 ± 0.52 a163.32 ± 0.90 b0.44 ± 0.00 a12.96 ± 0.19 a0.79 ± 0.00 a0.42 ± 0.01 a
B26.52 ± 0.01 a109.91 ± 0.76 a43.17 ± 0.63 a68.53 ± 2.09 a16.74 ± 0.87 a23.78 ± 0.37 a20.85 ± 0.44 a180.45 ± 1.12 a0.43 ± 0.00 a13.39 ± 0.03 a0.77 ± 0.01 a0.42 ± 0.01 a
20–40 cmCK6.53 ± 0.02 a104.13 ± 1.09 a38.36 ± 1.27 a61.93 ± 0.71 a11.81 ± 0.35 a21.05 ± 0.52 a17.66 ± 0.33 a151.32 ± 3.13 b0.38 ± 0.00 b11.54 ± 0.17 a0.72 ± 0.00 b0.37 ± 0.01 a
B16.52 ± 0.01 a107.16 ± 0.62 a38.12 ± 0.87 a63.50 ± 1.49 a13.48 ± 1.06 a22.43 ± 0.20 a18.95 ± 0.04 a155.00 ± 2.37 b0.43 ± 0.01 a11.79 ± 0.17 a0.77 ± 0.01 a0.38 ± 0.01 a
B26.52 ± 0.04 a107.51 ± 0.78 a41.23 ± 0.34 a62.89 ± 0.20 a13.69 ± 0.45 a21.02 ± 0.39 a19.01 ± 1.08 a177.47 ± 4.16 a0.39 ± 0.00 b12.21 ± 0.16 a0.76 ± 0.00 a0.40 ± 0.01 a
Note: Different lowercase letters indicate differences in different biochar treatments (p < 0.05). CK, no biochar application; B1, 0–20 cm mixed biochar; B2, 0–40 cm mixed biochar; HN, ammonium nitrogen; AN, available nitrogen; EC, electrical conductivity; NN, nitrate nitrogen; SOM, soil organic matter; AP, available phosphorus; AK, available potassium; S-URE, soil urease activity; S-SC, soil sucrase activity; S-NP, soil phosphatase activity; S-CAT, soil catalase activity. All abbreviations are listed separately at the end of this article.
Table 9. The effects of biochar application on soil physical properties.
YearsTreatmentsBD (g·cm−3)SWC (%)TSP (%)CP (%)
2021CK1.28 ± 0.01 a19.50 ± 0.41 a49.59 ± 0.09 a24.89 ± 0.60 a
B11.26 ± 0.01 a20.58 ± 0.25 a50.89 ± 0.18 a25.80 ± 0.41 a
B21.24 ± 0.01 b19.80 ± 0.06 a50.97 ± 0.35 a24.48 ± 0.12 a
2022CK1.31 ± 0.02 a18.58 ± 0.51 a49.03 ± 0.79 a24.23 ± 0.31 a
B11.28 ± 0.02 a17.42 ± 1.30 a45.62 ± 0.91 a22.27 ± 1.48 a
B21.27 ± 0.00 b19.65 ± 0.55 a45.75 ± 0.54 a24.71 ± 0.64 a
Note: Different lowercase letters indicate differences between different biochar treatments (p < 0.05). CK, no biochar application; B1, 0–20 cm mixed biochar; B2, 0–40 cm mixed biochar; BD, soil bulk density; SWC, soil water content; TSP, total soil porosity; CP, capillary porosity.
Disclaimer/Publisher’s Note: The statements, opinions and data contained in all publications are solely those of the individual author(s) and contributor(s) and not of MDPI and/or the editor(s). MDPI and/or the editor(s) disclaim responsibility for any injury to people or property resulting from any ideas, methods, instructions or products referred to in the content.

