Effects of Irrigation Interval and Irrigation Level on Growth, Photosynthesis, Fruit Yield, Quality, and Water-Nitrogen Use Efficiency of Drip-Fertigated Greenhouse Tomatoes (Solanum lycopersicum L.)

 , and
, and 
Abstract
1. Introduction
2. Materials and Methods
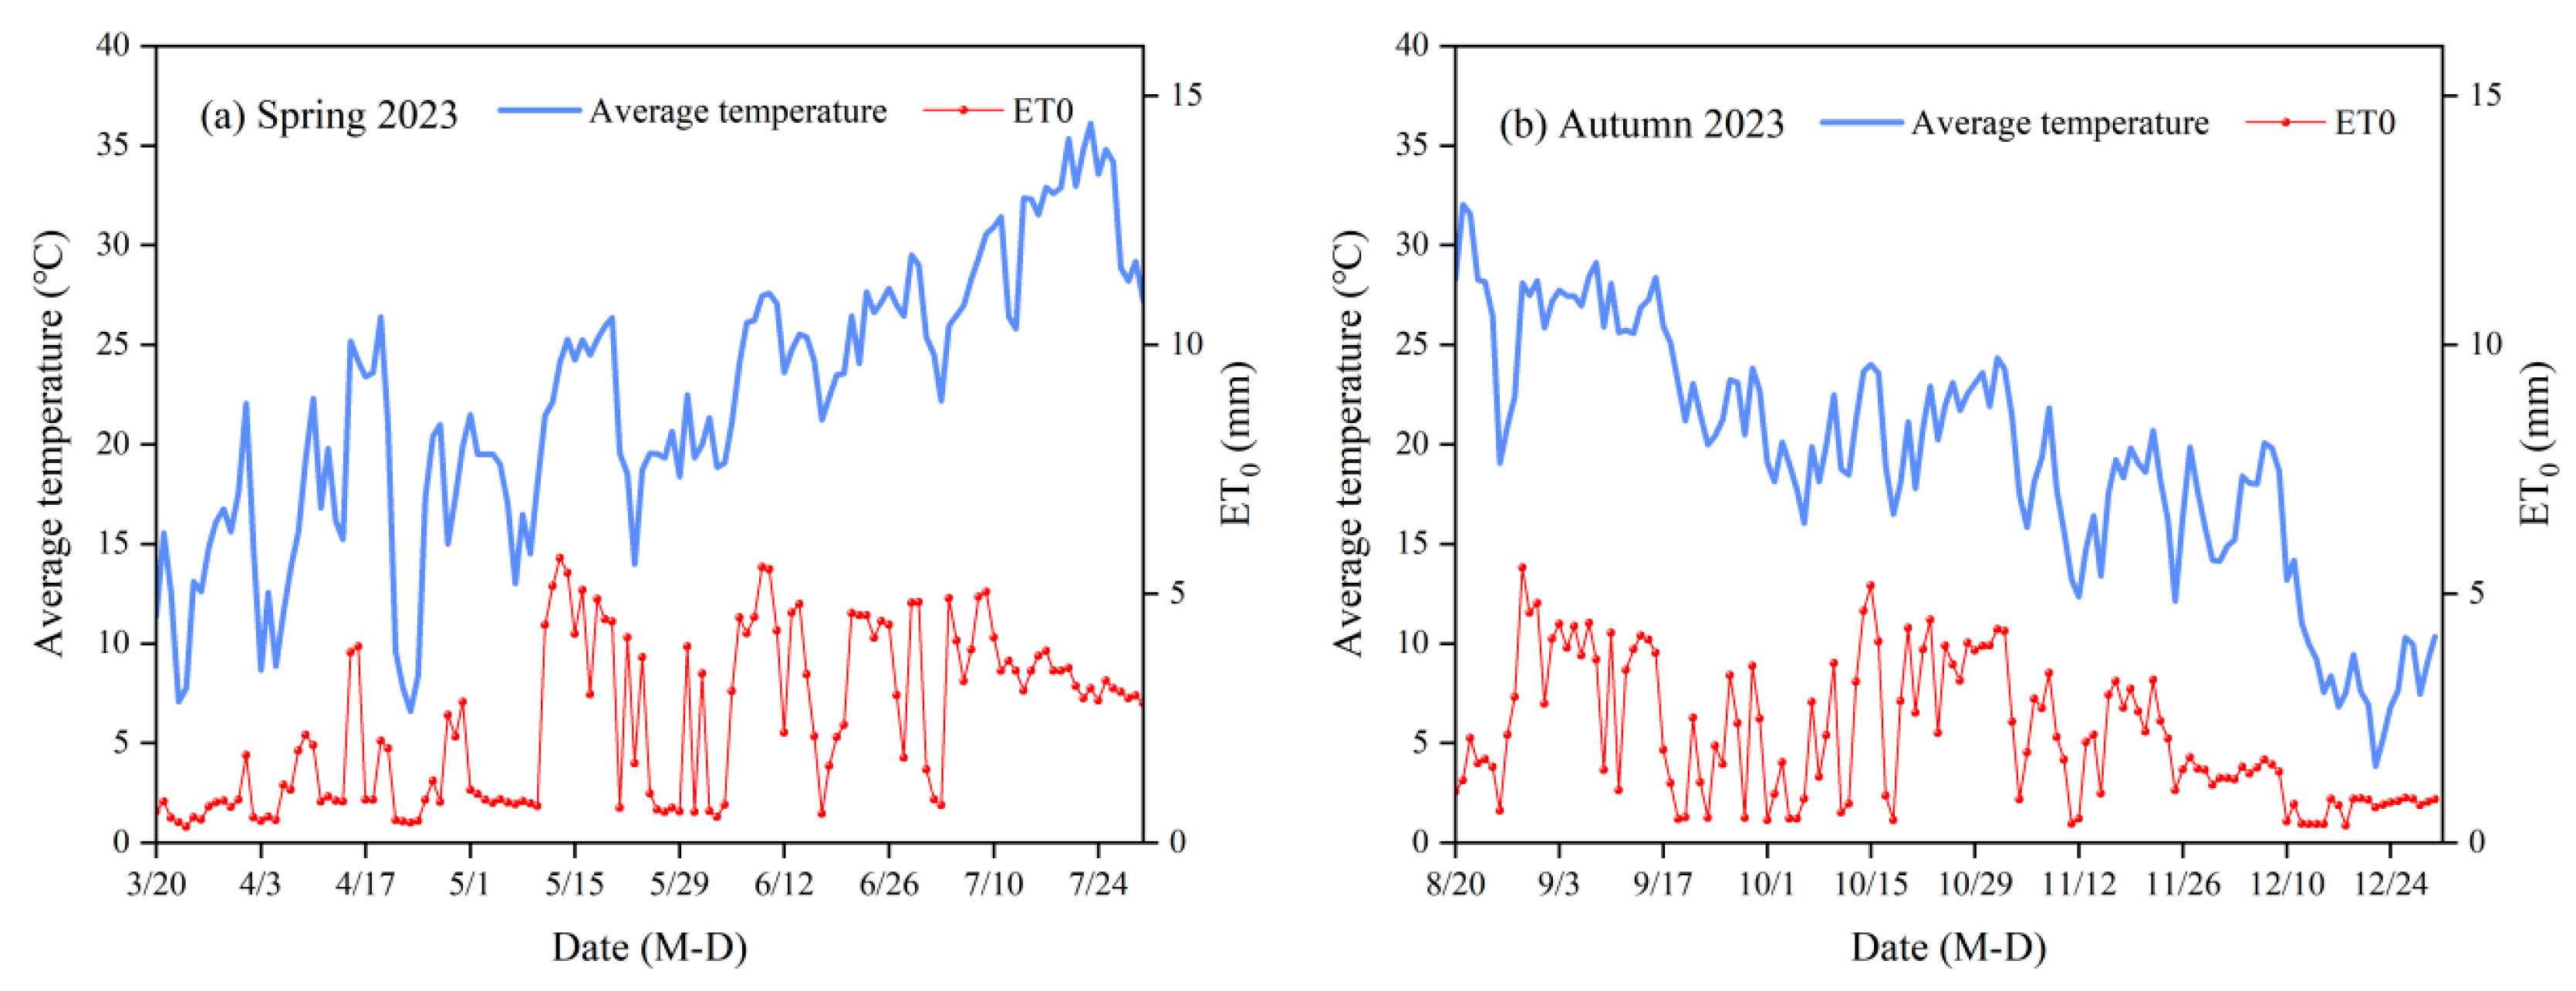
2.1. Experimental Site Description
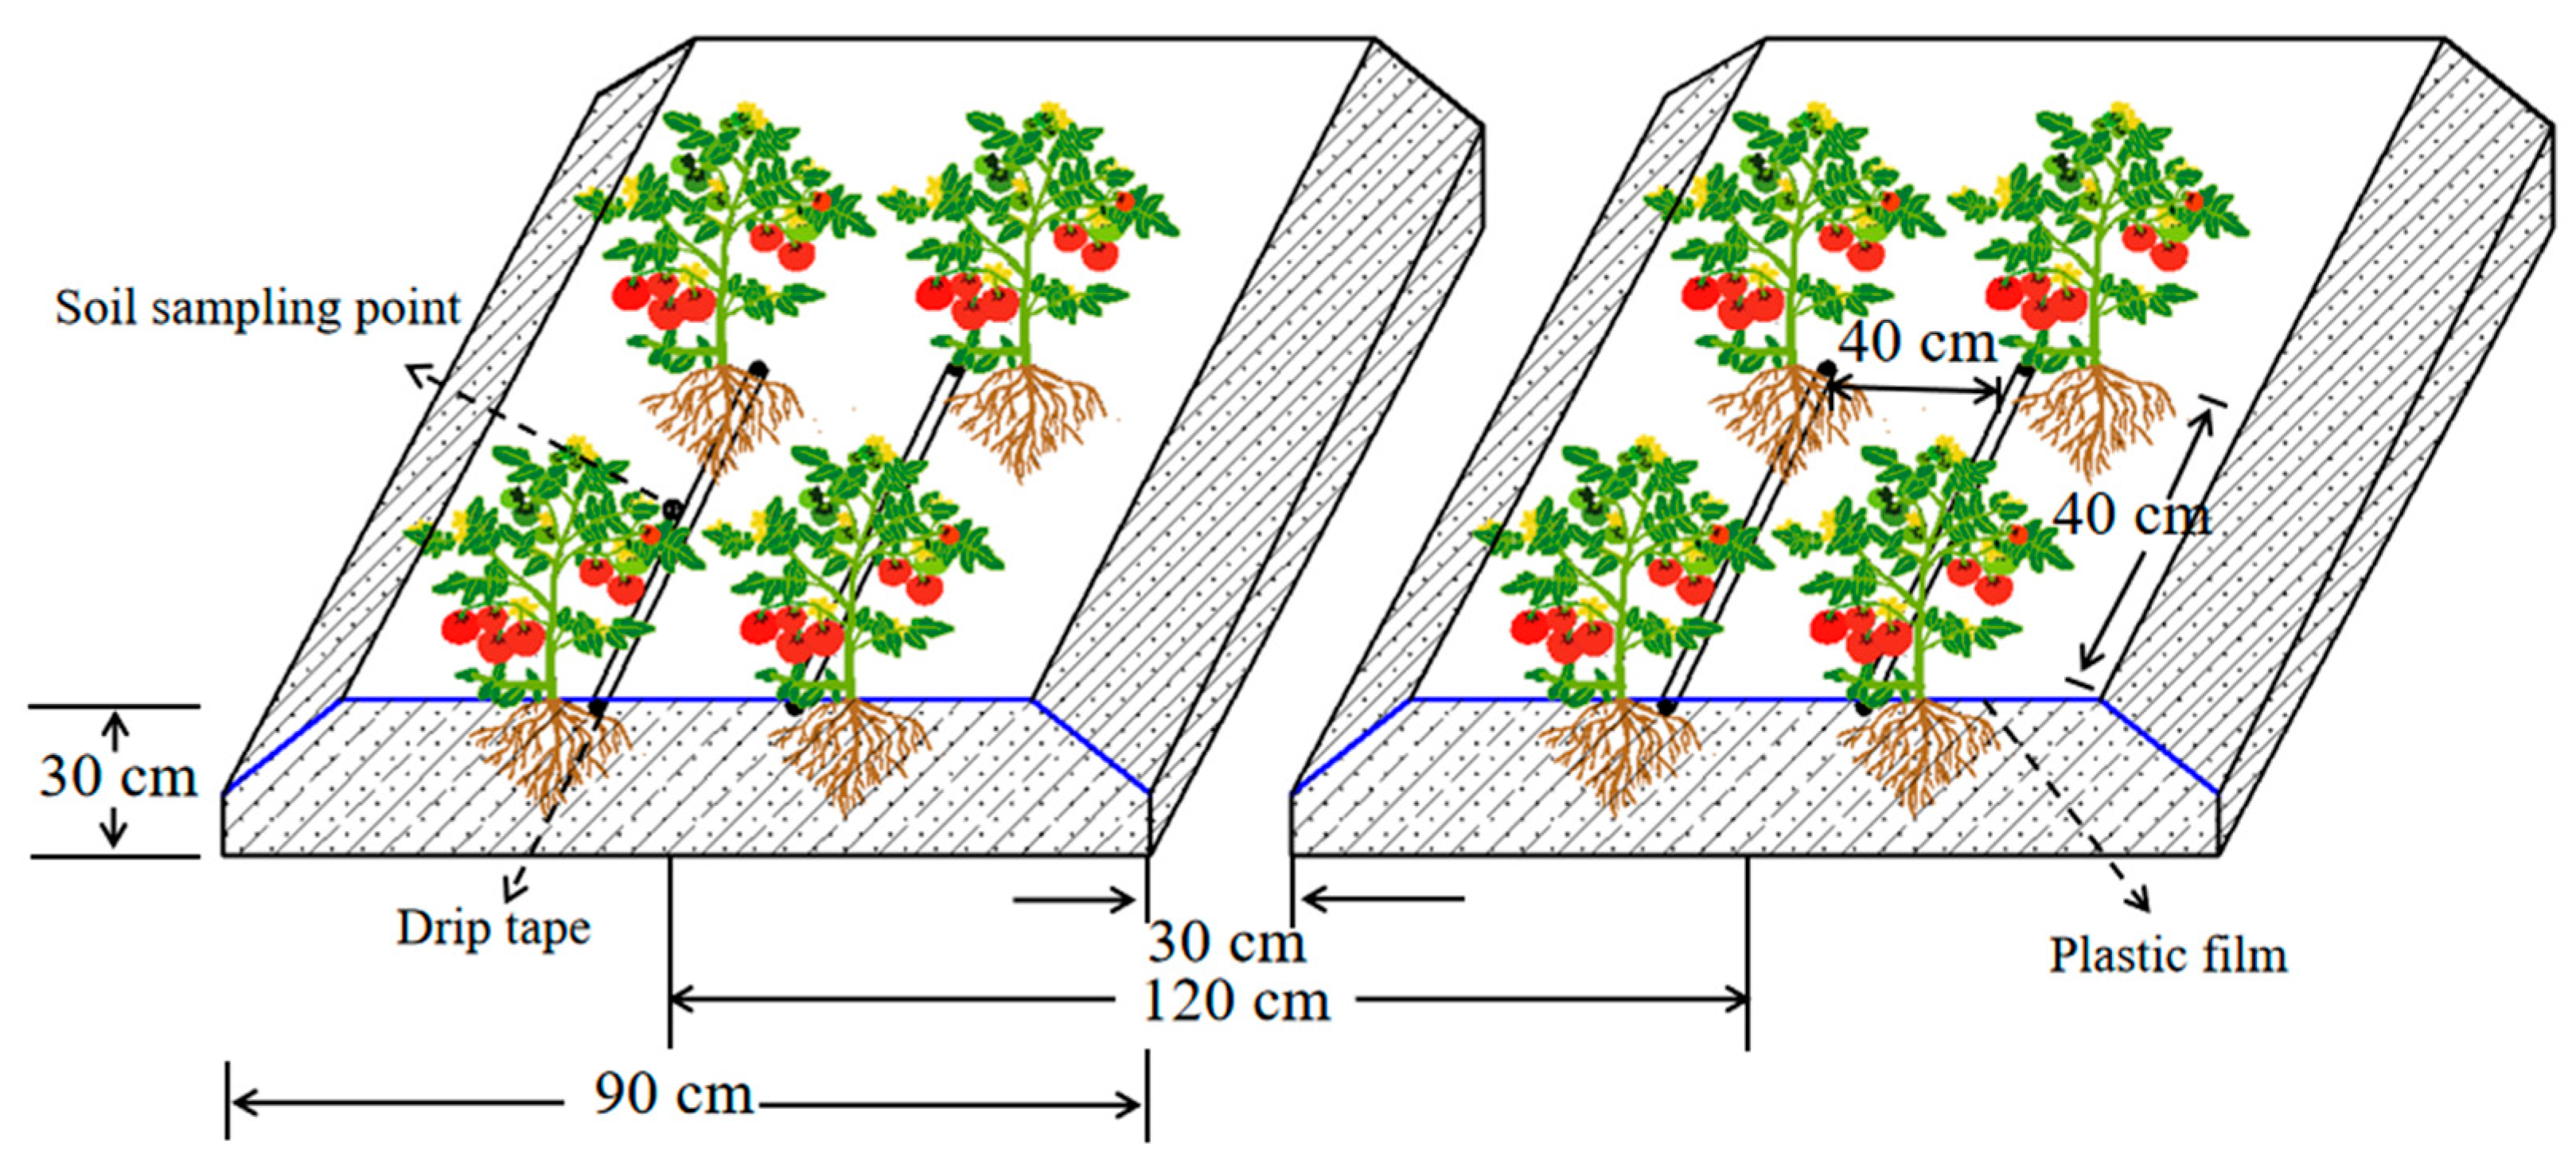
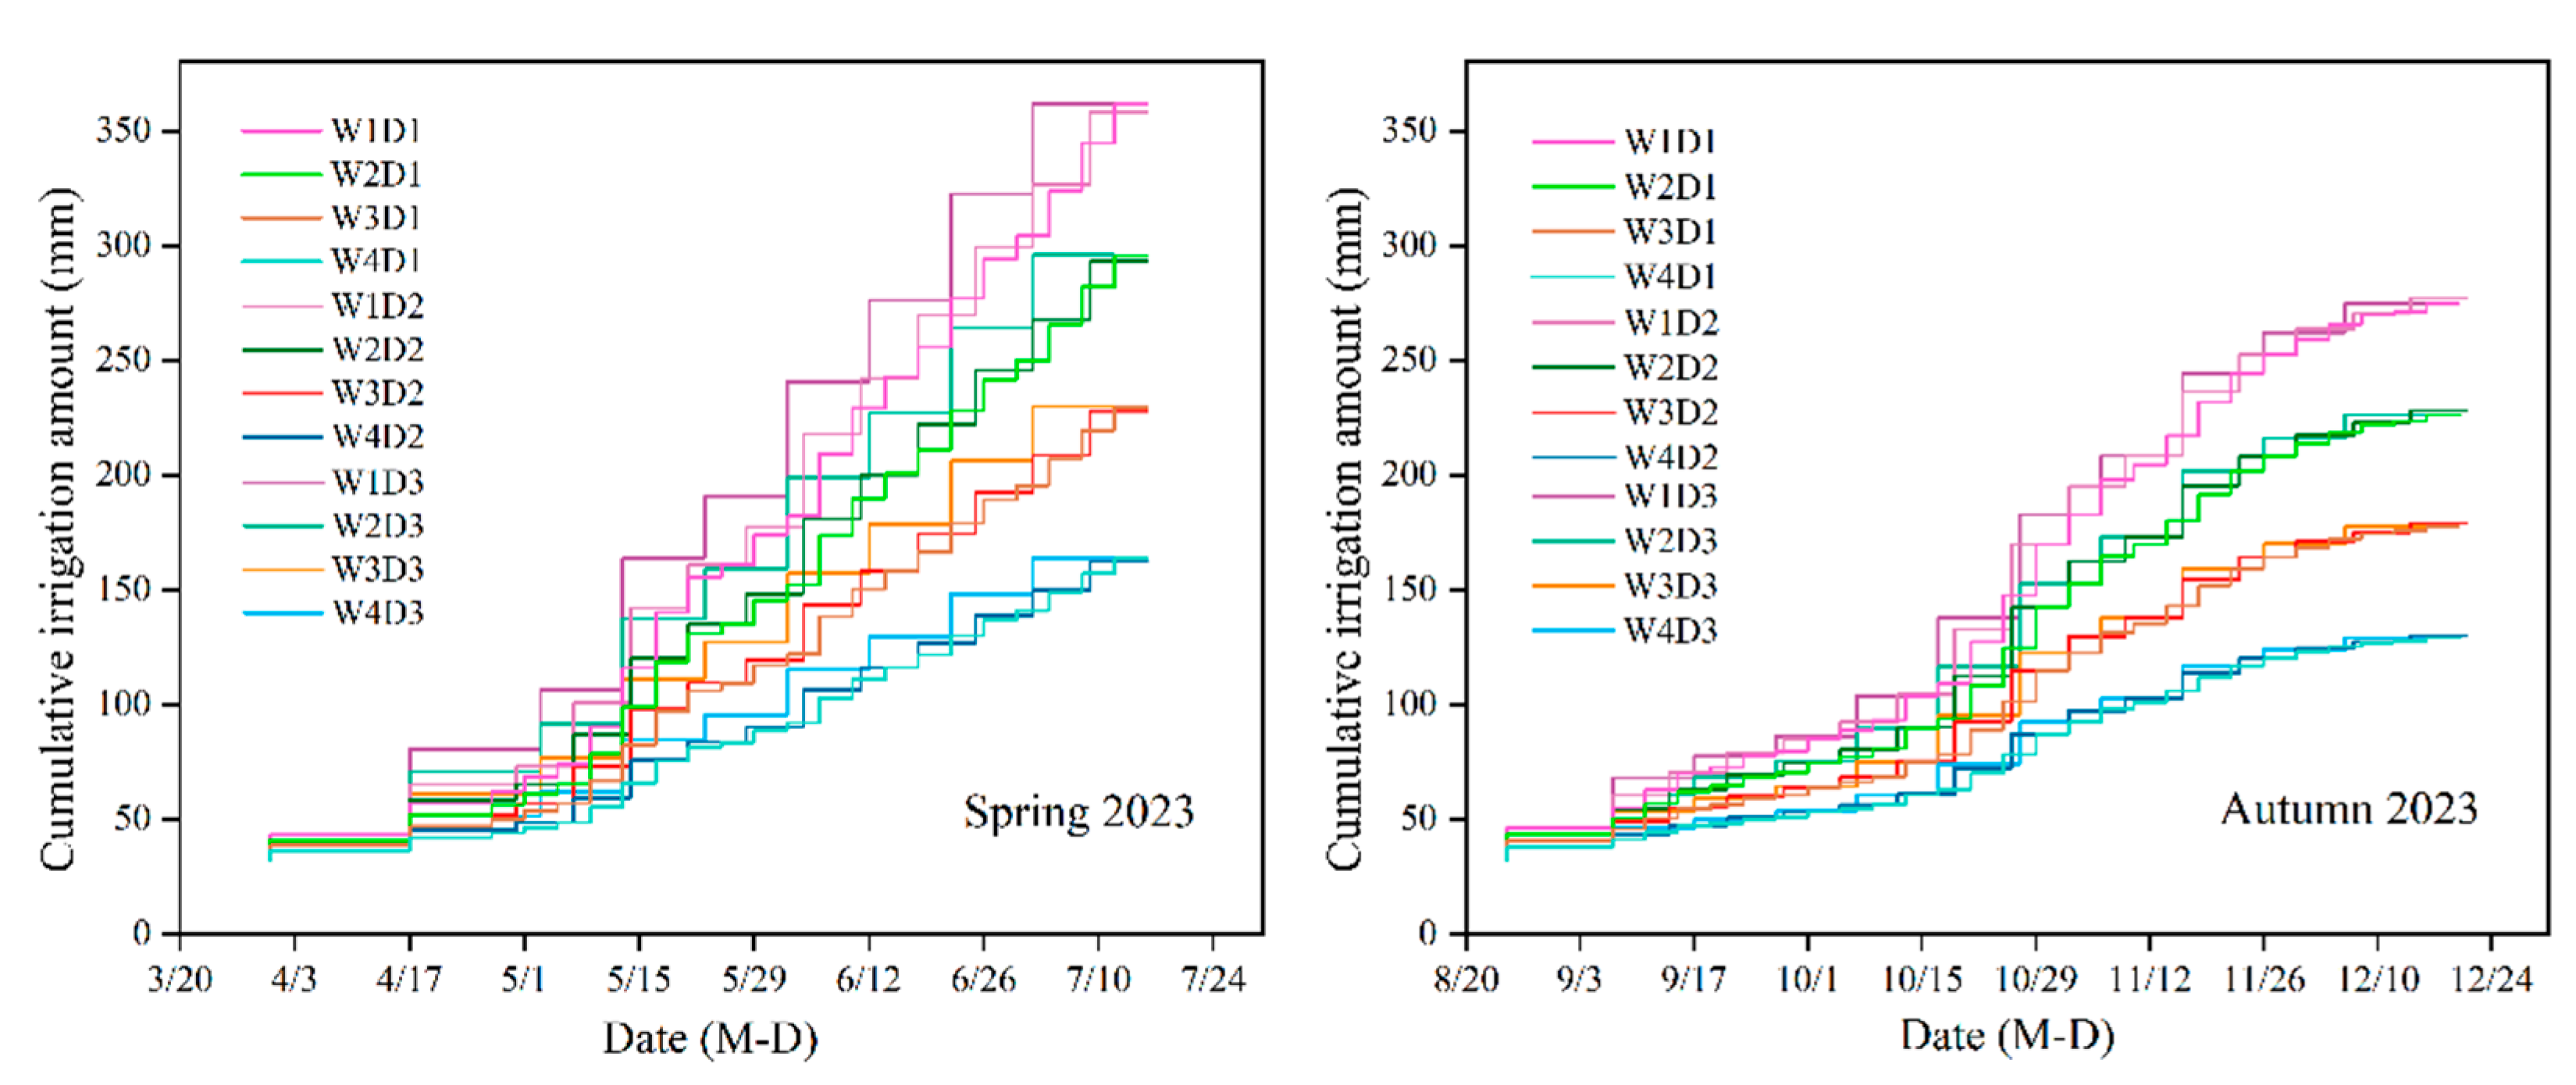
2.2. Experimental Design
2.3. Sampling and Measurements
2.3.1. Growth Indexes
2.3.2. Plant Nitrogen Uptake and Distribution
2.3.3. Photosynthetic Indicators
2.3.4. Fruit Yield and Its Components
2.3.5. Crop Evapotranspiration, Water Productivity, and Nitrogen Use Efficiency
2.3.6. Tomato Quality
2.4. Statistical Analysis
3. Results
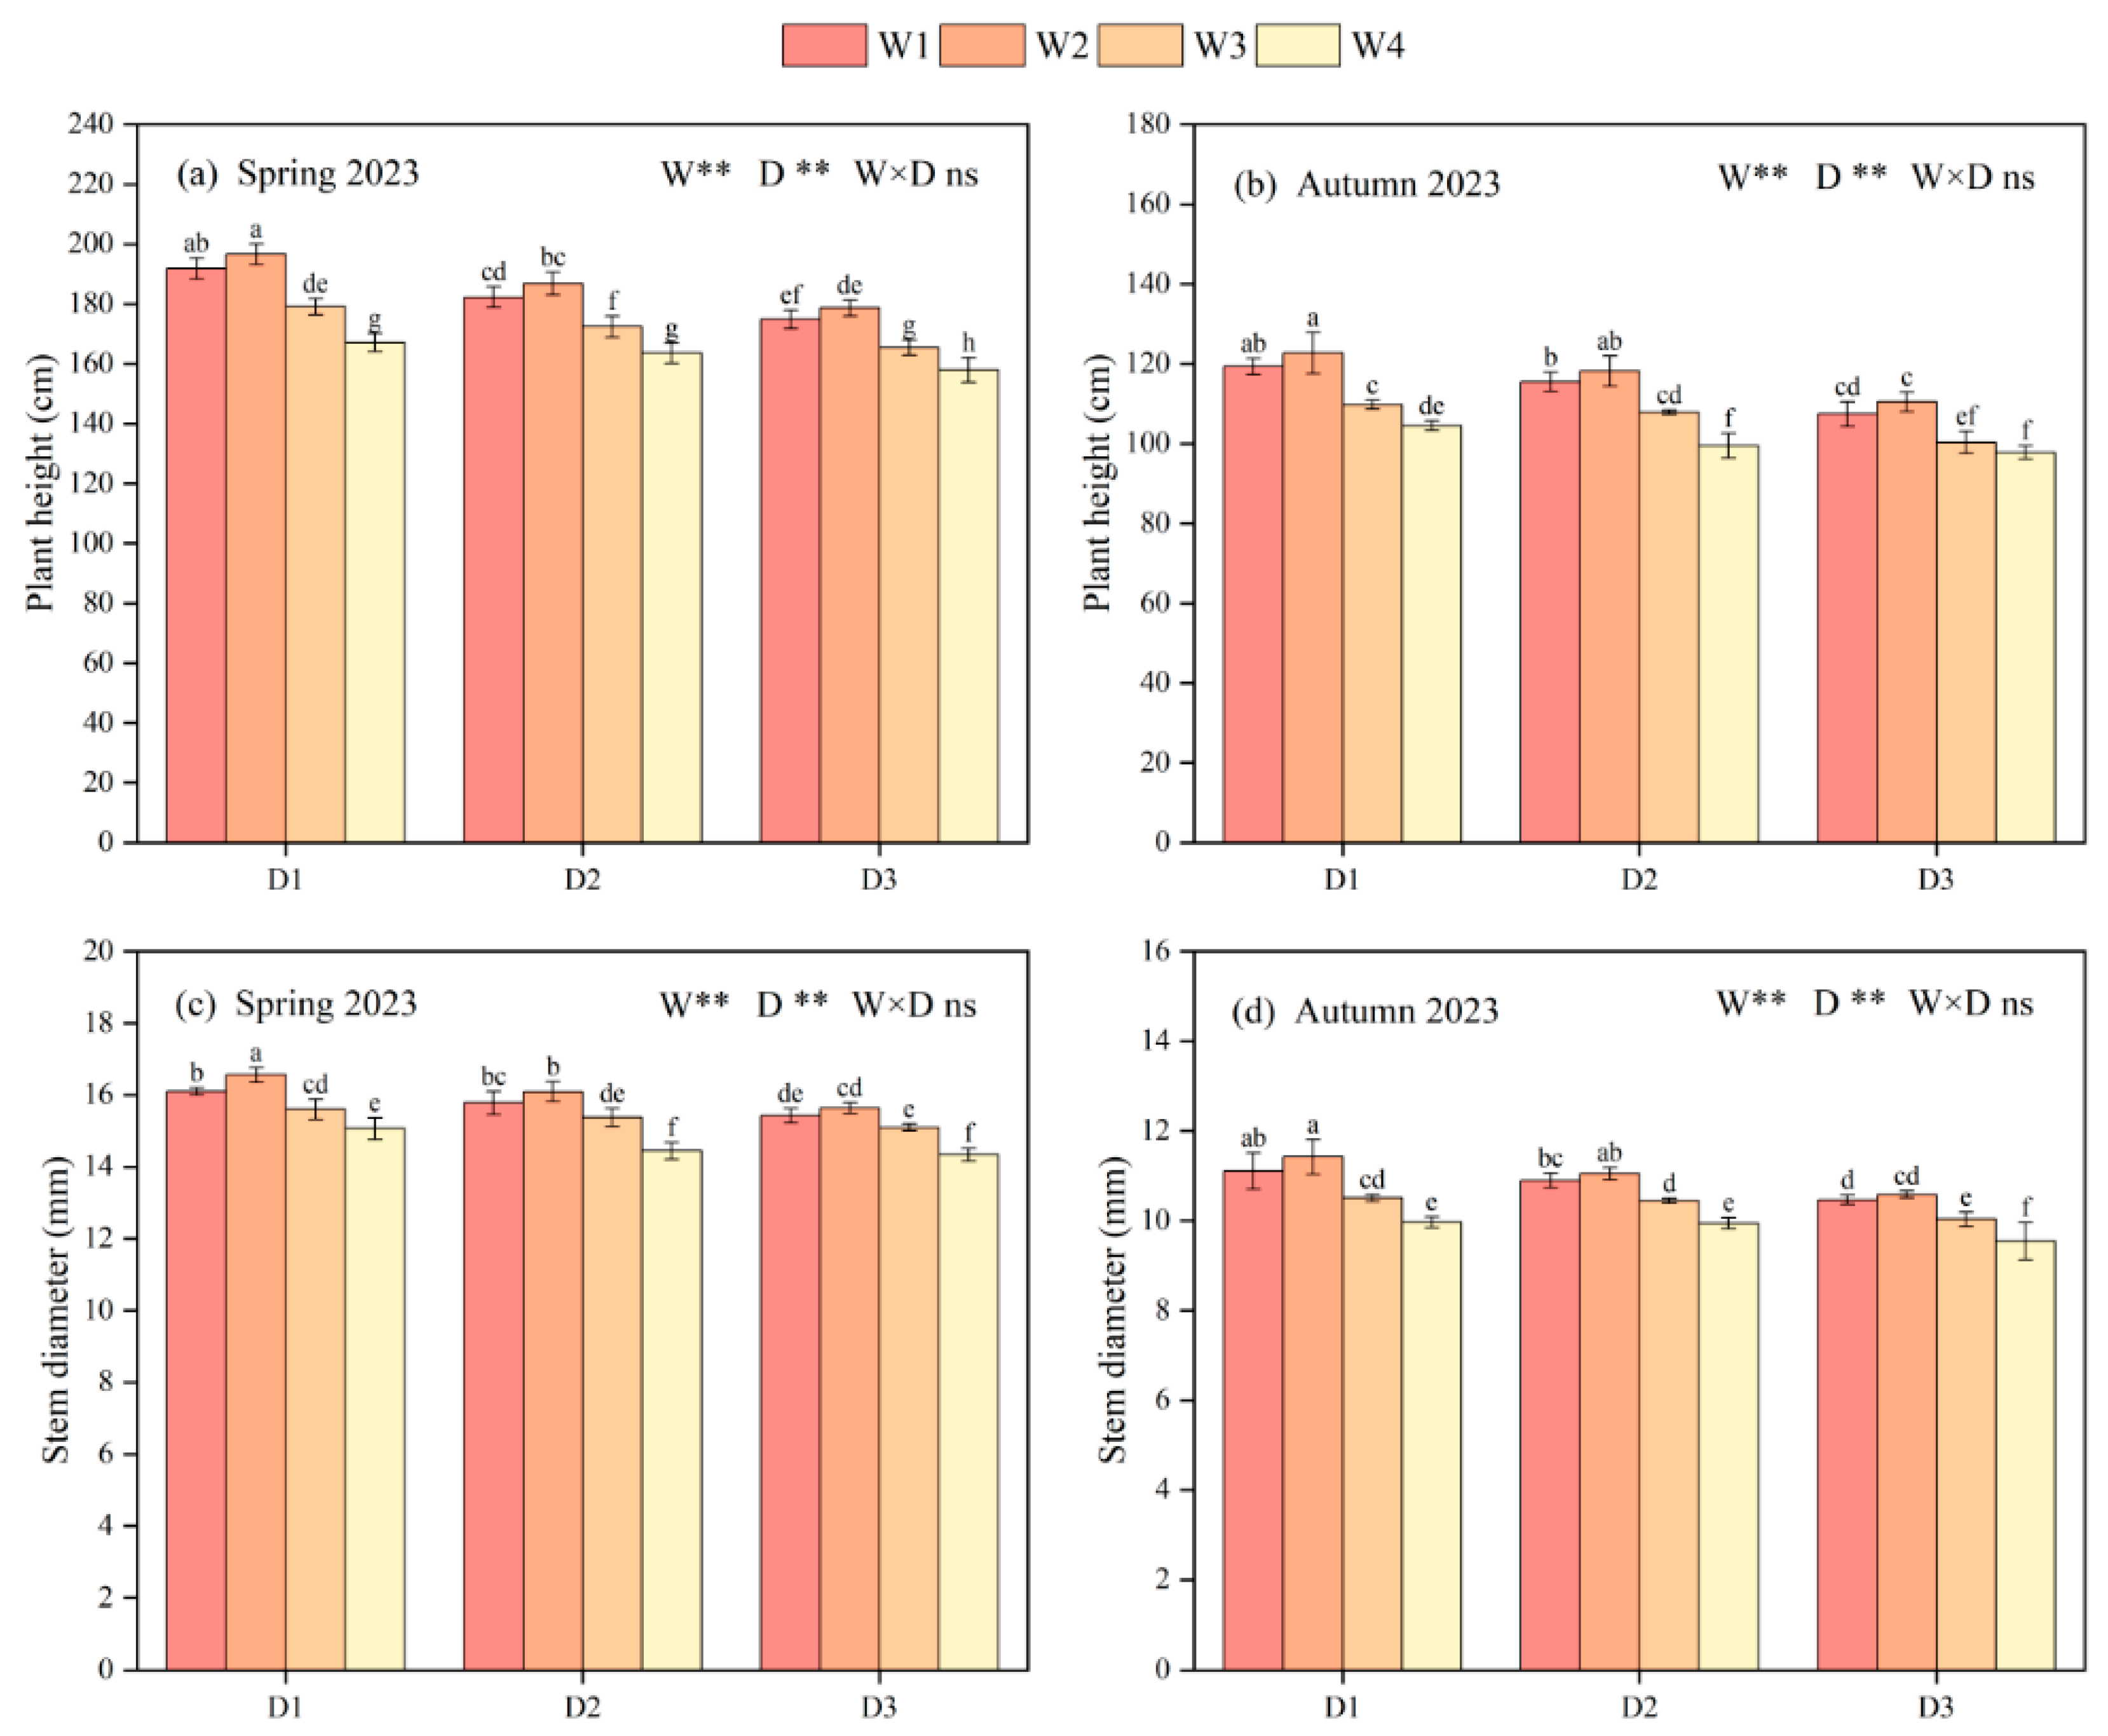
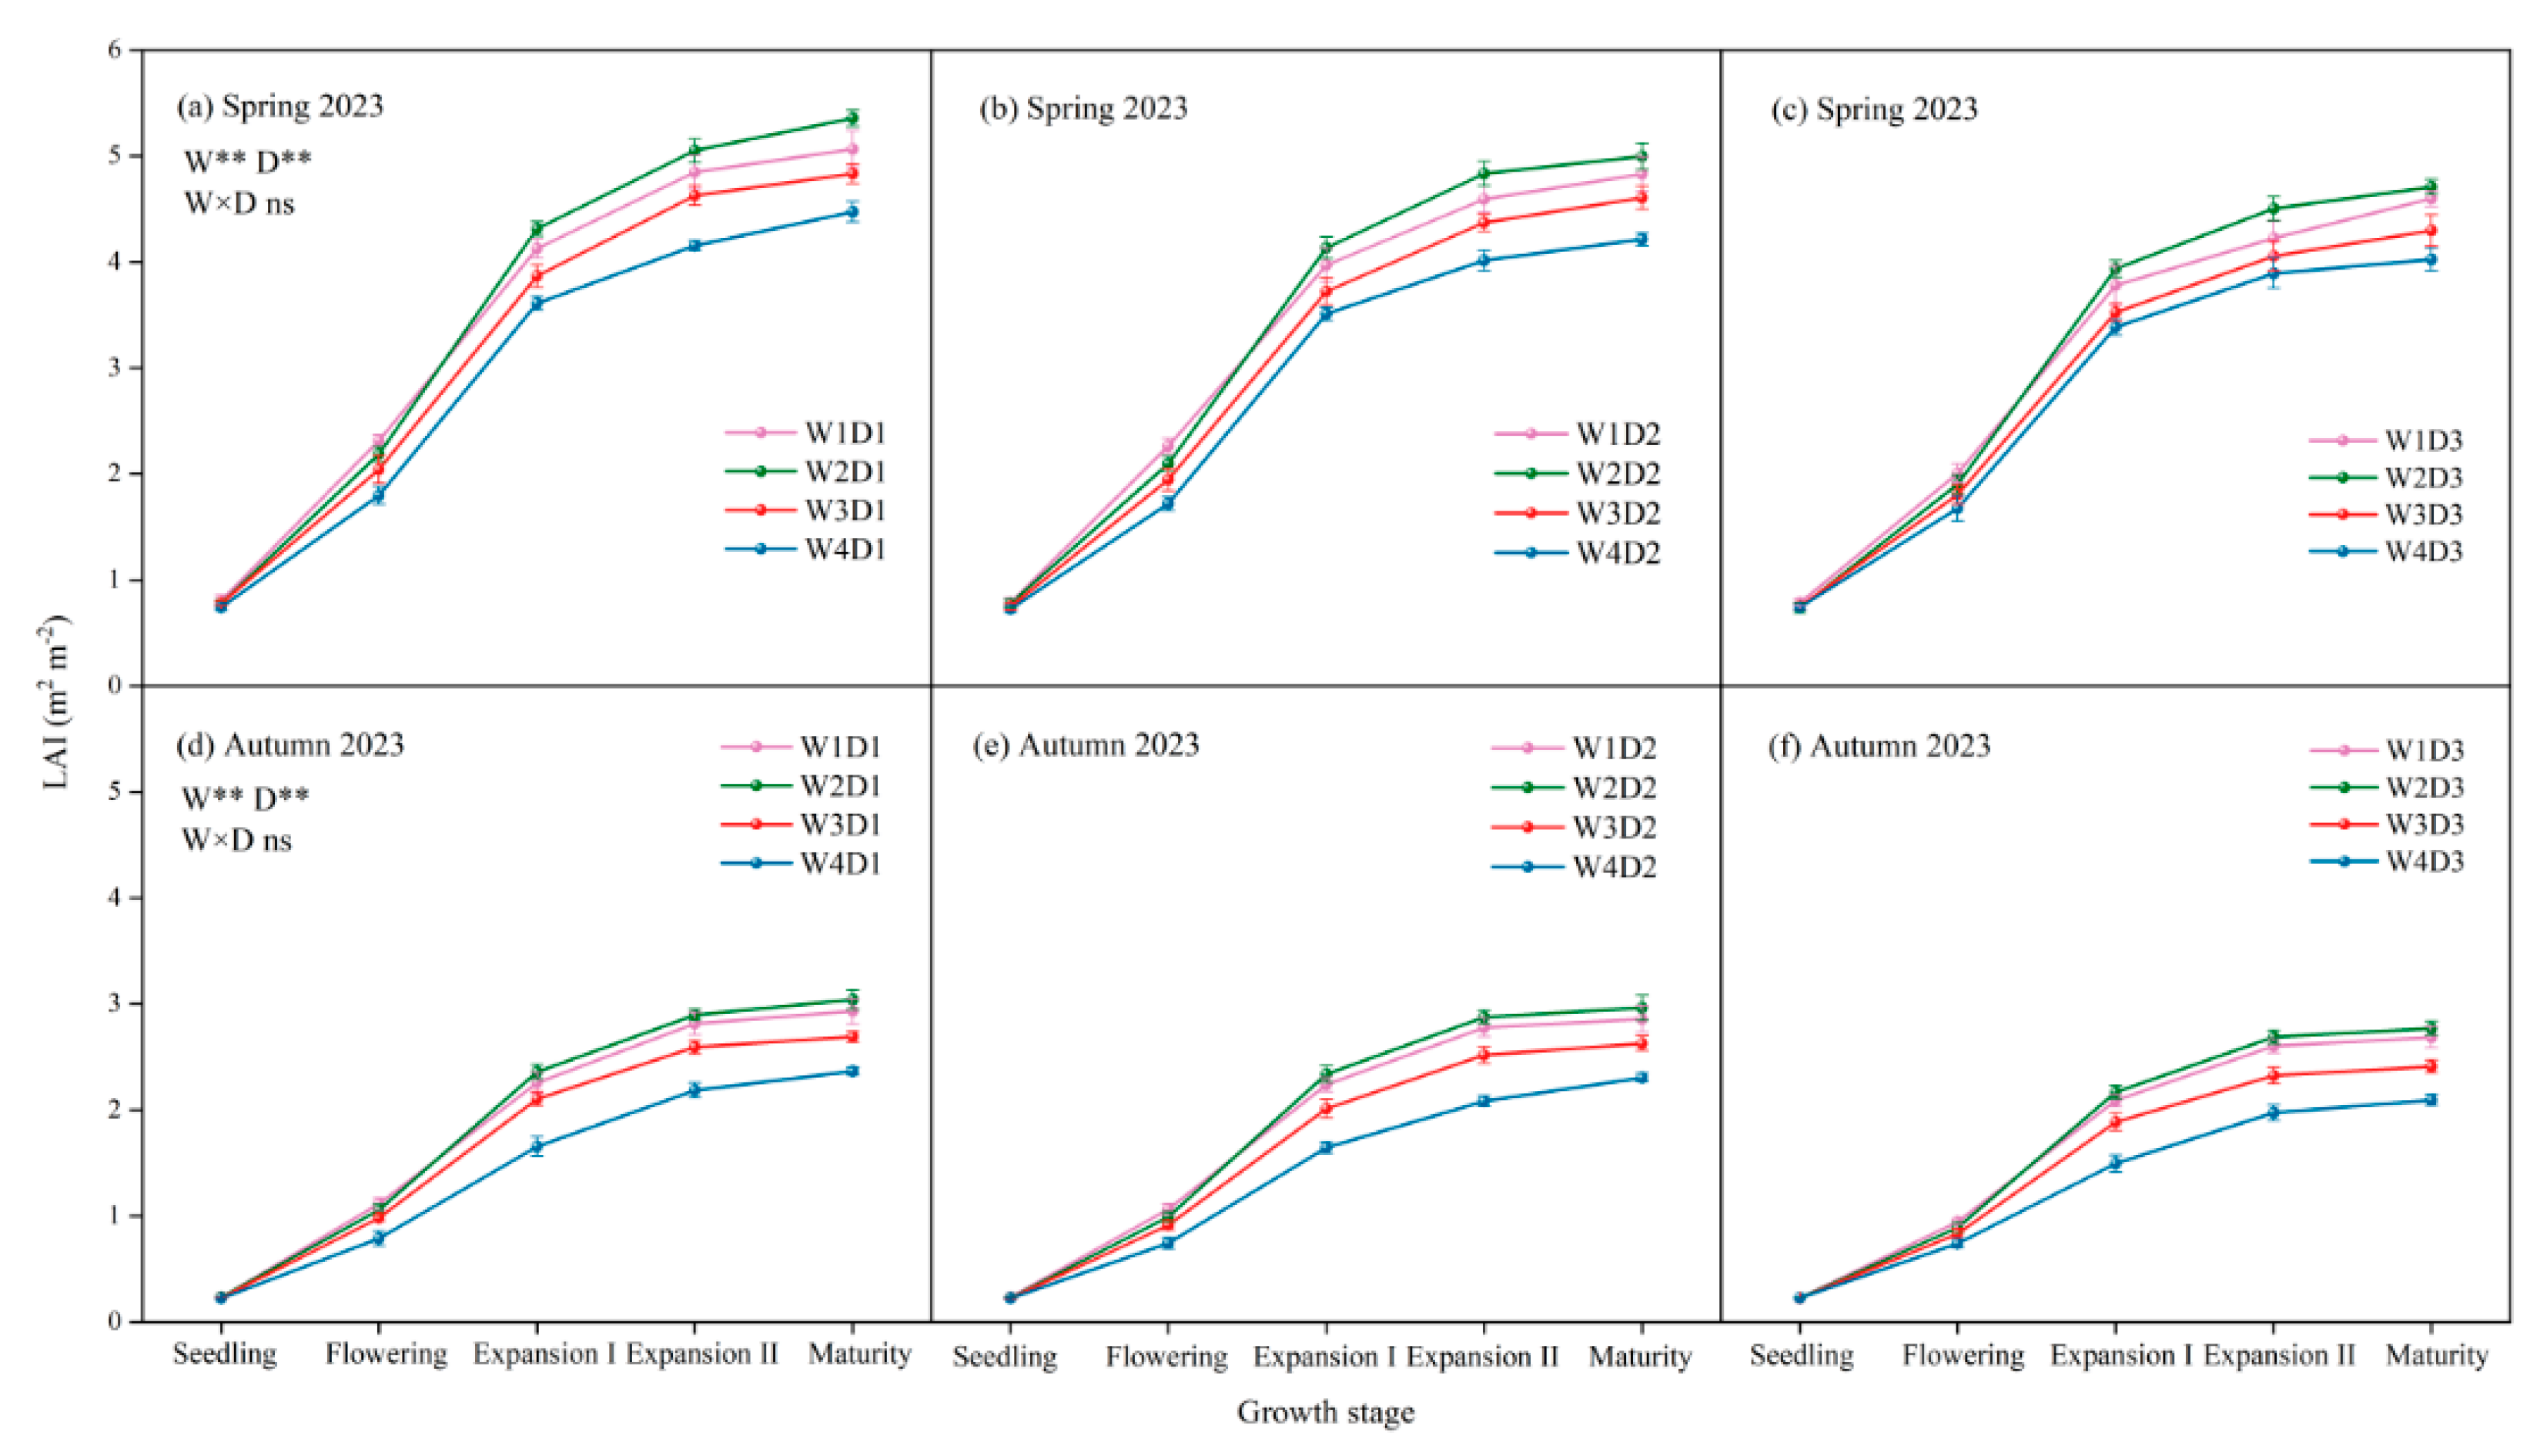
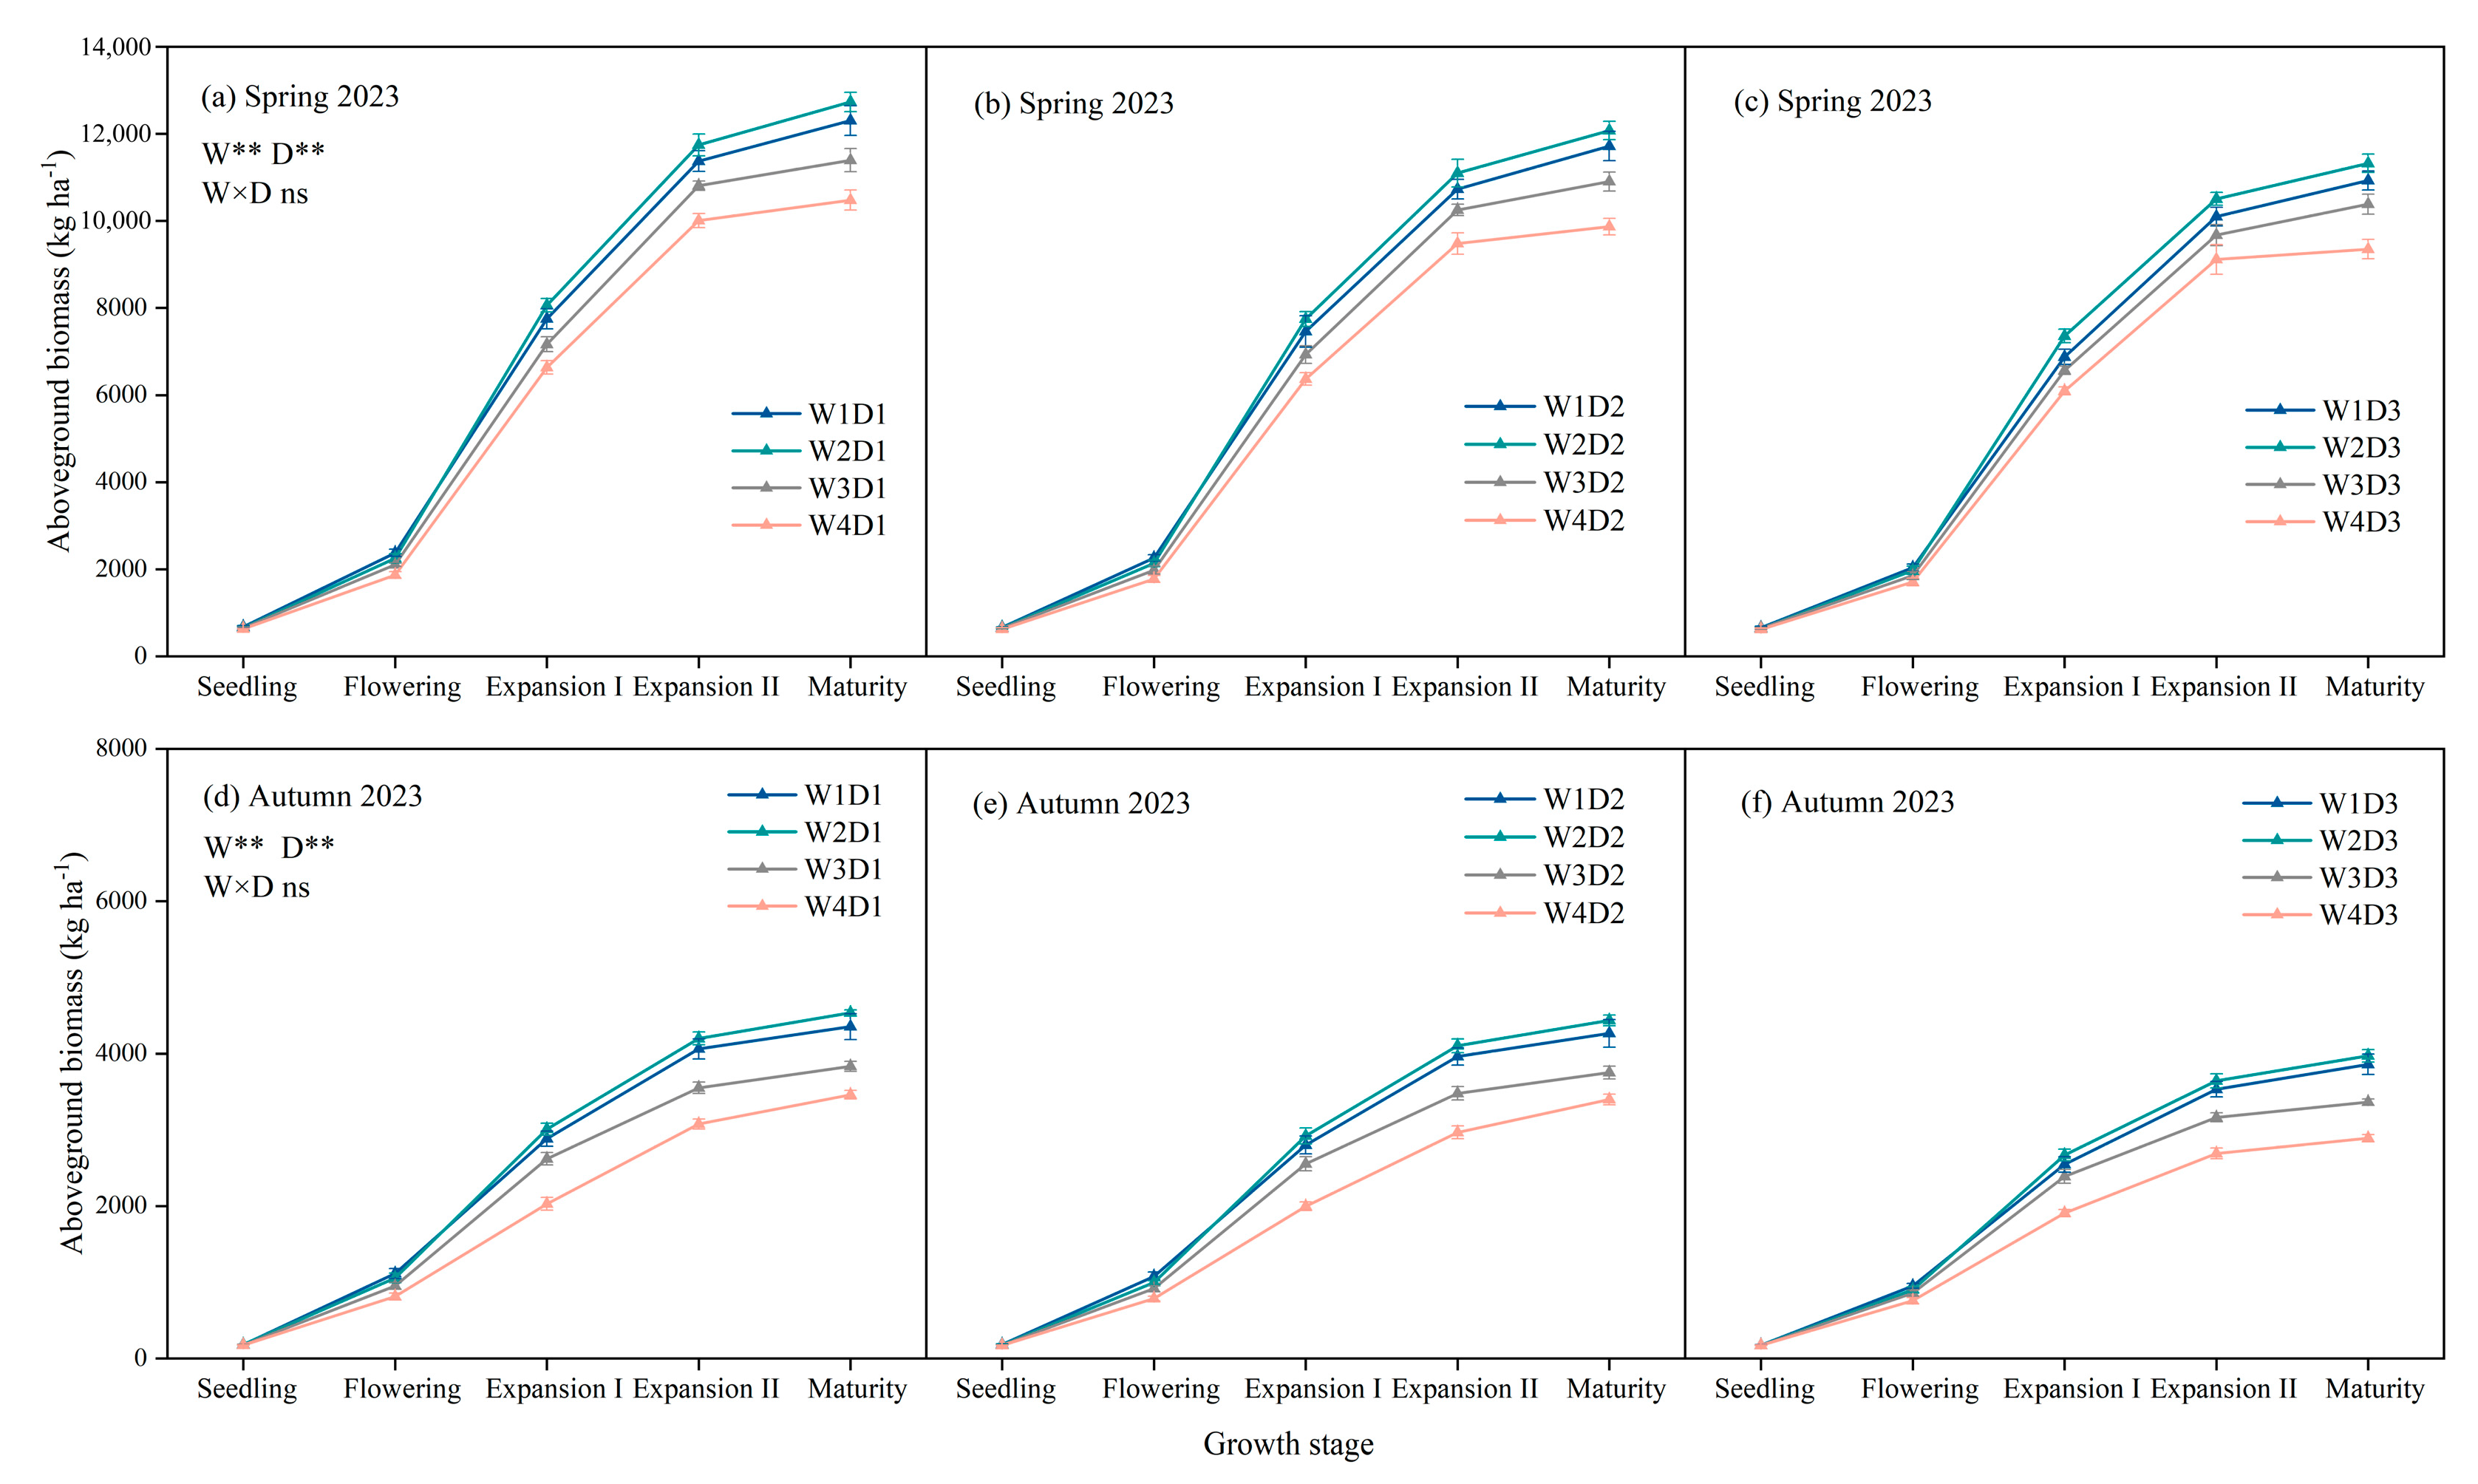
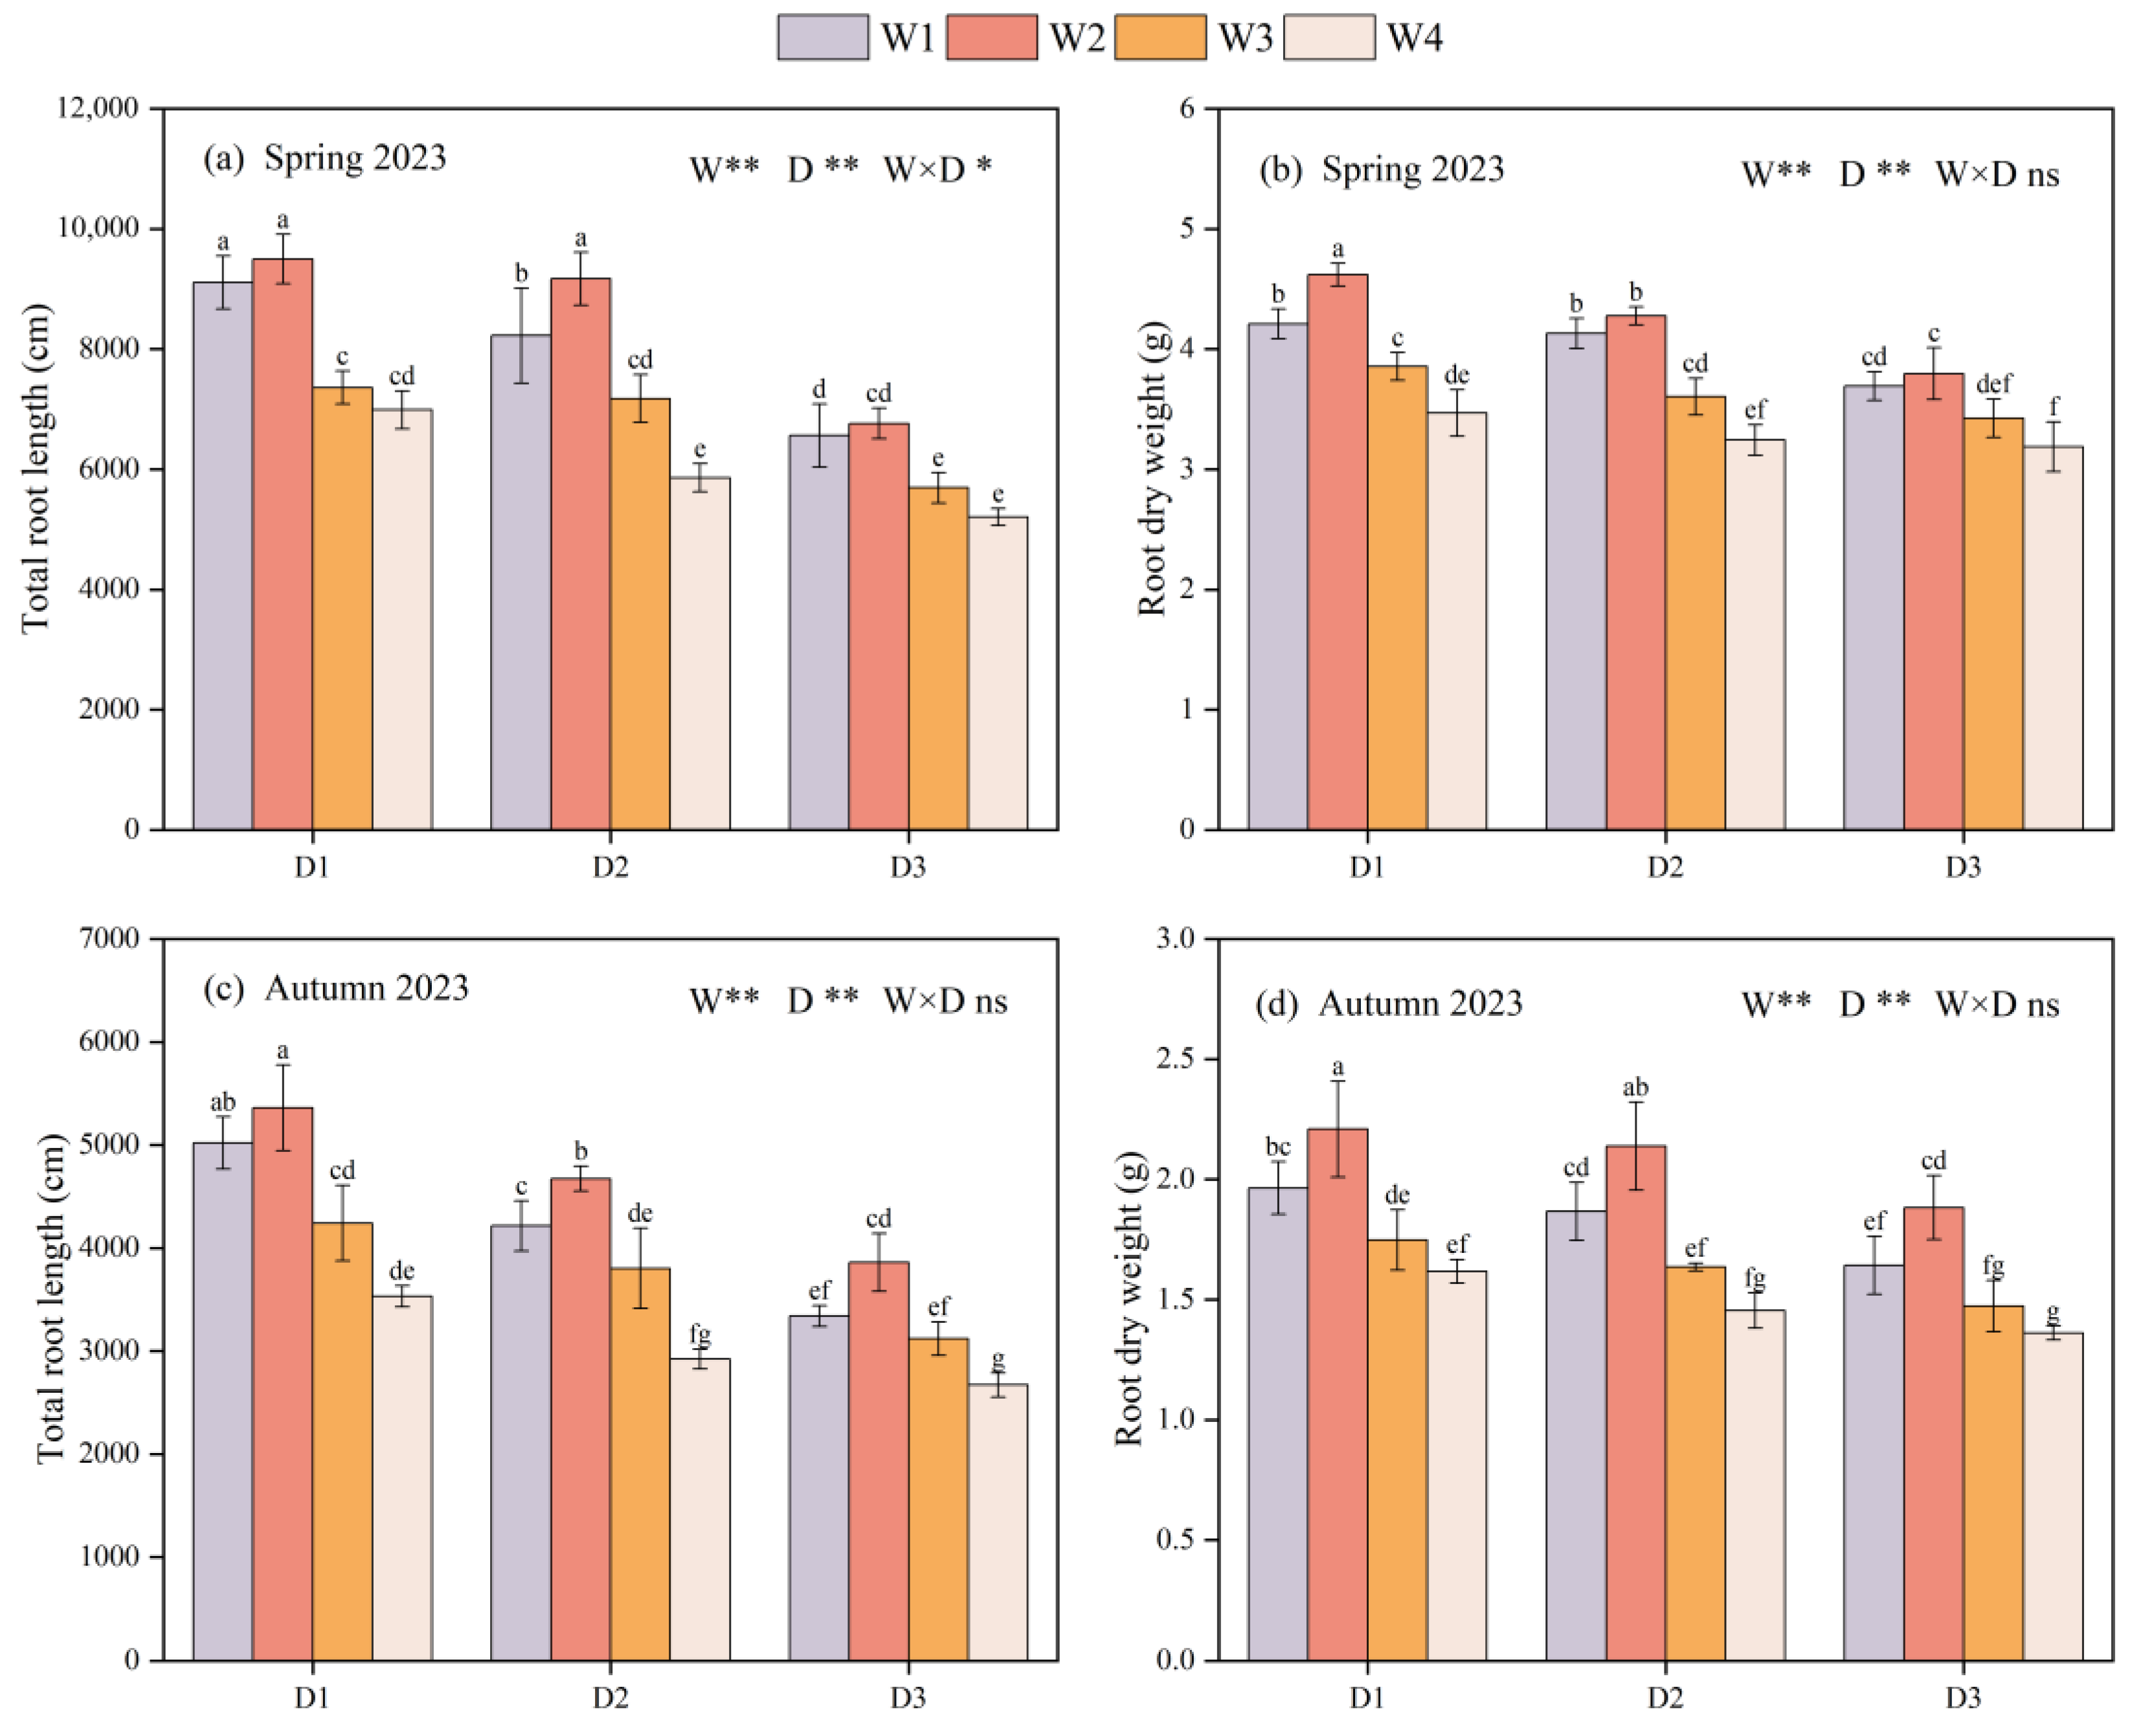
3.1. Growth Indexes
3.2. Plant Nitrogen Uptake and Distribution
3.3. Photosynthetic Indicators
3.4. Yield and Its Components
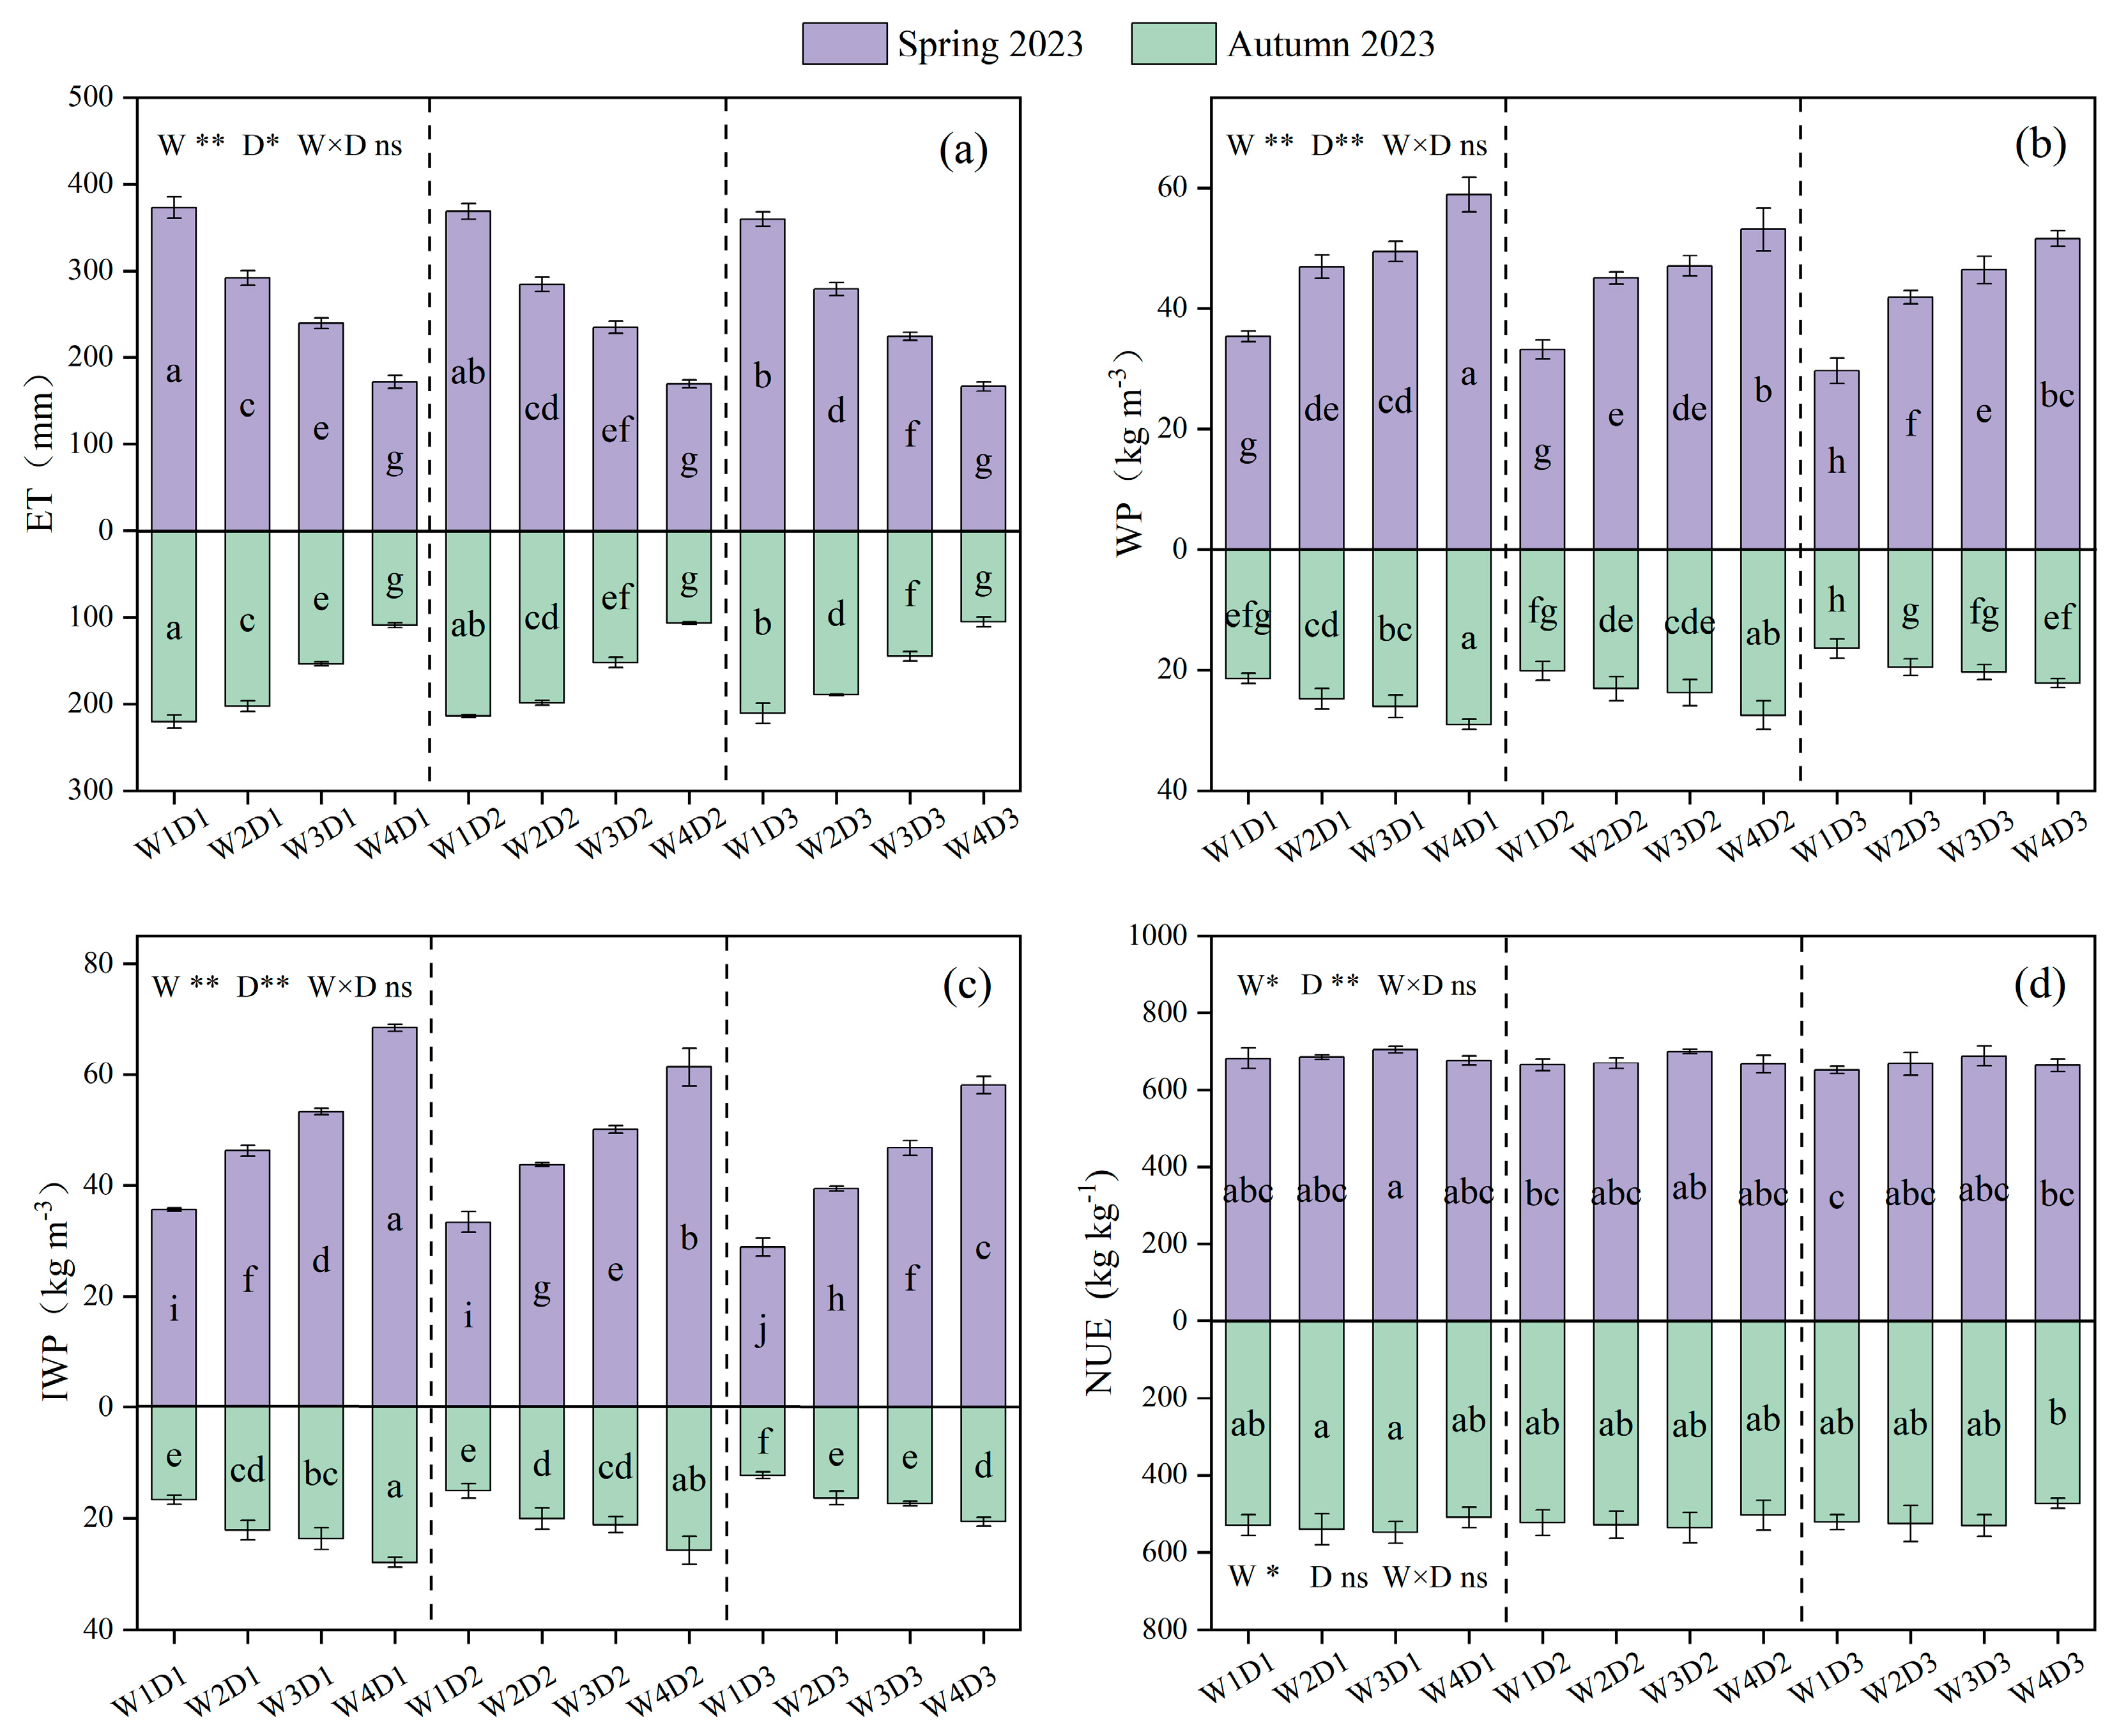
3.5. Crop Evapotranspiration, Water Productivity, and Nitrogen Use Efficiency
3.6. Fruit Quality
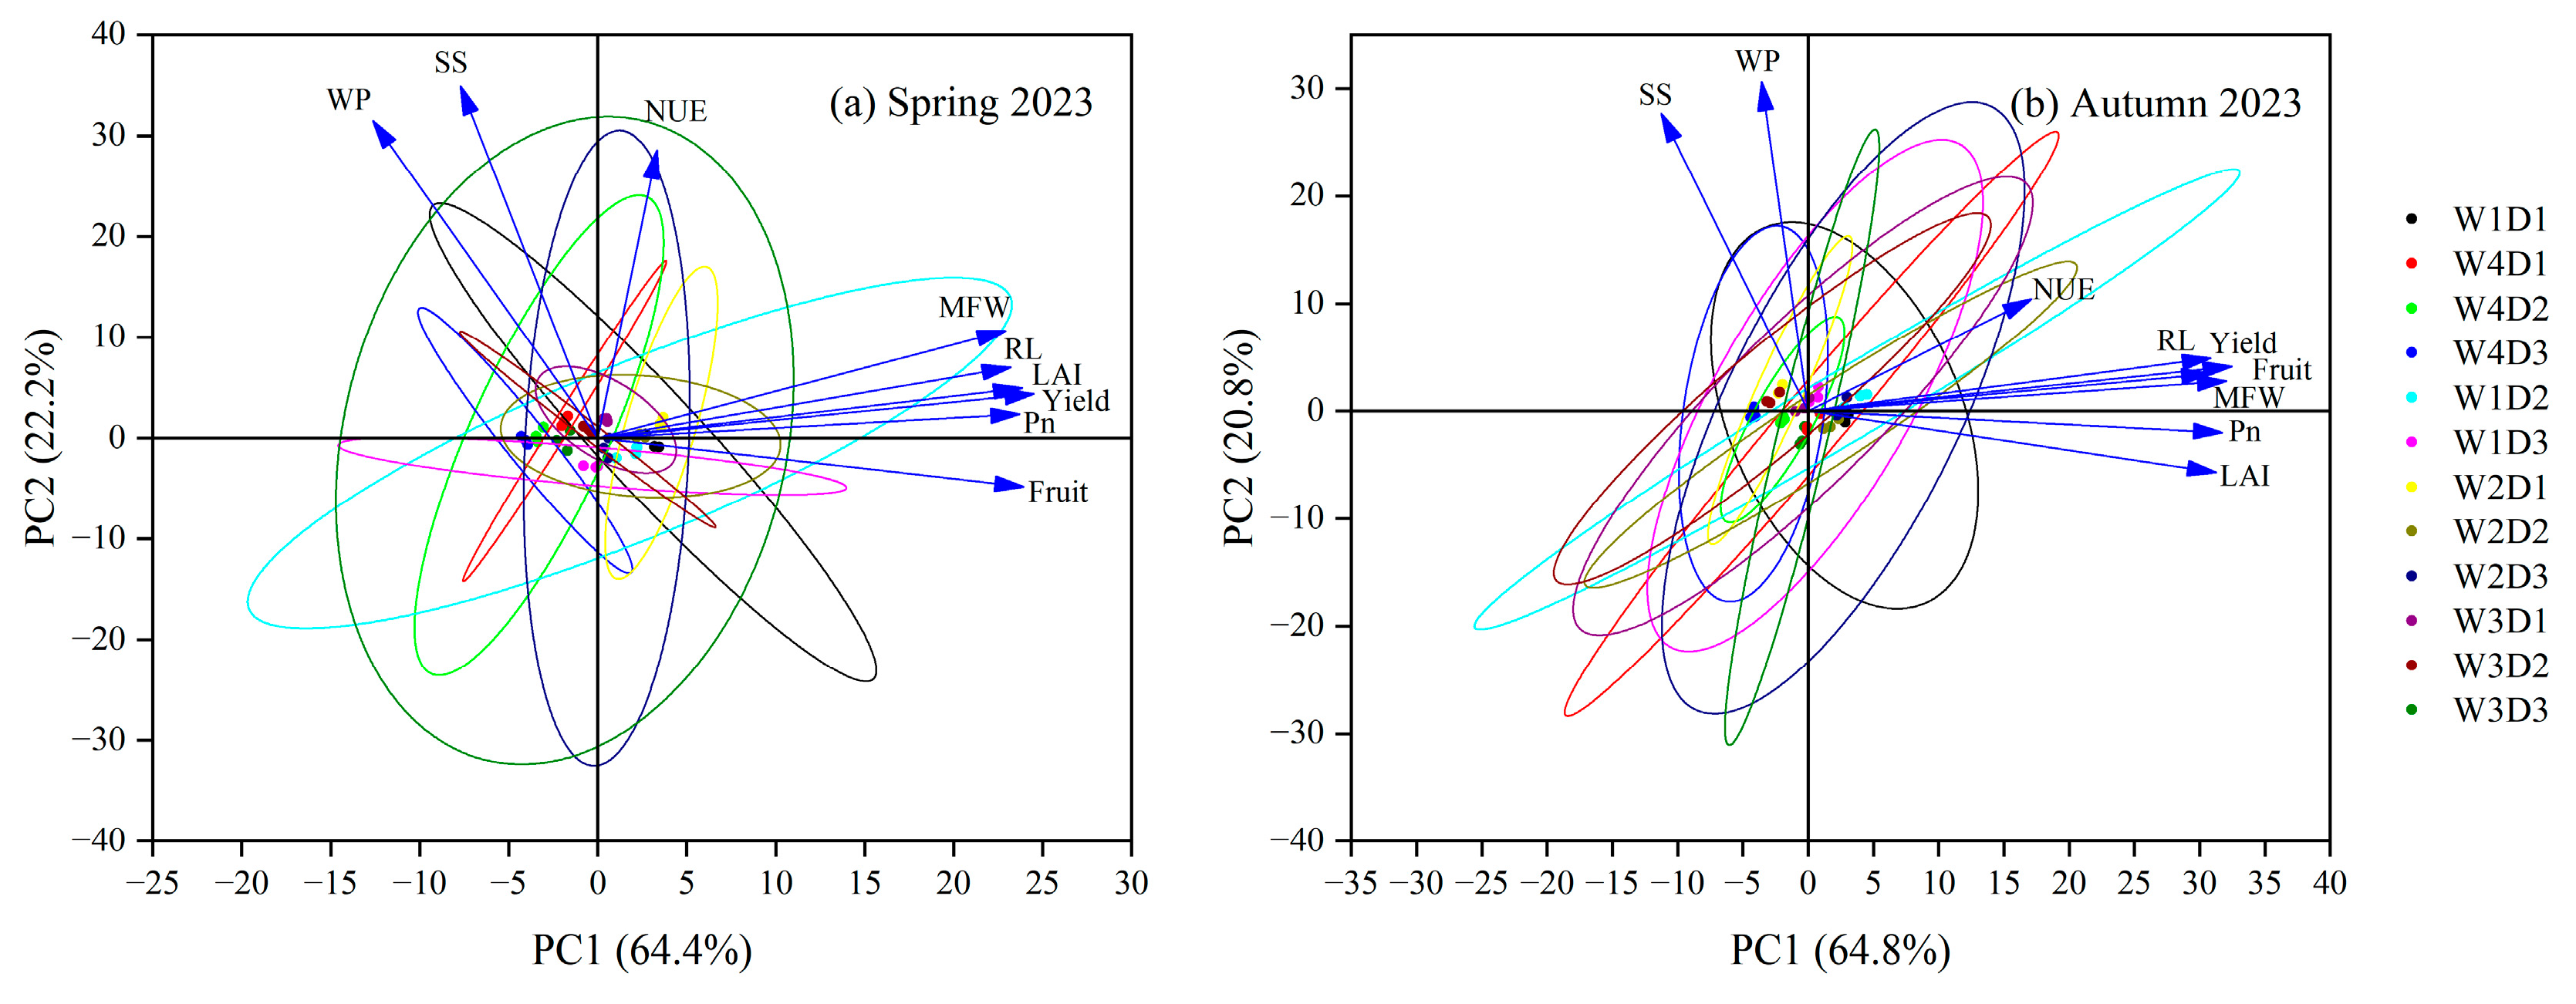
3.7. Principal Component Analysis and Correlation Matrix
4. Discussion
4.1. Effects of Different Irrigation Levels and Intervals on Crop Growth, Nitrogen Uptake, and Distribution
4.2. Effects of Irrigation Level and Interval on Leaf Photosynthesis
4.3. Effects of Irrigation Level and Interval on Tomato Yield, Crop Evapotranspiration, and Water-Nitrogen Use Efficiency
4.4. Effects of Irrigation Level and Interval on Tomato Quality
5. Conclusions
Author Contributions
Funding
Data Availability Statement
Conflicts of Interest
References
- Blando, F.; Berland, H.; Maiorano, G.; Durante, M.; Mazzucato, A.; Picarella, M.E.; Nicoletti, I.; Gerardi, C.; Mita, G.; Andersen, Ø.M. Nutraceutical Characterization of Anthocyanin-Rich Fruits Produced by “Sun Black” Tomato Line. Front. Nutr. 2019, 6, 133. [Google Scholar] [CrossRef]
- Roșca, M.; Mihalache, G.; Stoleru, V. Tomato responses to salinity stress: From morphological traits to genetic changes. Front. Plant Sci. 2023, 14, 1118383. [Google Scholar] [CrossRef] [PubMed]
- Maureira, F.; Rajagopalan, K.; Stöckle, C.O. Evaluating tomato production in open-field and high-tech greenhouse systems. J. Clean. Prod. 2022, 337, 130459. [Google Scholar] [CrossRef]
- Yao, Z.; Yan, G.; Wang, R.; Zheng, X.; Liu, C.; Butterbach-Bahl, K. Drip irrigation or reduced N-fertilizer rate can mitigate the high annual N2O+NO fluxes from Chinese intensive greenhouse vegetable systems. Atmos. Environ. 2019, 212, 183–193. [Google Scholar] [CrossRef]
- Ullah, I.; Mao, H.; Rasool, G.; Gao, H.; Javed, Q.; Sarwar, A.; Khan, M.I. Effect of Deficit Irrigation and Reduced N Fertilization on Plant Growth, Root Morphology and Water Use Efficiency of Tomato Grown in Soilless Culture. Agronomy 2021, 11, 228. [Google Scholar] [CrossRef]
- Irmak, S. Maize response to different subsurface drip irrigation management strategies: Yield, production functions, basal and crop evapotranspiration. Agric. Water Manag. 2024, 300, 108927. [Google Scholar] [CrossRef]
- Xing, Y.; Chen, M.; Wang, X. Enhancing water use efficiency and fruit quality in jujube cultivation: A review of advanced irrigation techniques and precision management strategies. Agric. Water Manag. 2025, 307, 109243. [Google Scholar] [CrossRef]
- Li, B.; Wim, V.; Shukla, M.K.; Du, T. Drip irrigation provides a trade-off between yield and nutritional quality of tomato in the solar greenhouse. Agric. Water Manag. 2021, 249, 106777. [Google Scholar] [CrossRef]
- Shu, L.; Liu, R.; Min, W.; Wang, Y.; Yu, H.; Zhu, P.; Zhu, J. Regulation of soil water threshold on tomato plant growth and fruit quality under alternate partial root-zone drip irrigation. Agric. Water Manag. 2020, 238, 106200. [Google Scholar] [CrossRef]
- Jiang, Z.; Wang, Q.; Wang, L.; Li, M. Study on the optimal water−biochar management mode based on pan evaporation for solar greenhouse tomato (Solanum lycopersicum L.) in Northeast China. Agric. Water Manag. 2024, 302, 109014. [Google Scholar] [CrossRef]
- Li, Y.; Sun, Y.; Liao, S.; Zou, G.; Zhao, T.; Chen, Y.; Yang, J.; Zhang, L. Effects of two slow-release nitrogen fertilizers and irrigation on yield, quality, and water-fertilizer productivity of greenhouse tomato. Agric. Water Manag. 2017, 186, 139–146. [Google Scholar] [CrossRef]
- An, J.; Zheng, L.; Ma, L.; Ma, X.; Ma, J. Effects of Different Mulched Drip Irrigation Levels on the Soil Microorganisms and Yield of Greenhouse Tomatoes (Solanum lycopersicum L.). Horticulturae 2025, 11, 204. [Google Scholar] [CrossRef]
- Lu, J.; Shao, G.; Cui, J.; Wang, X.; Keabetswe, L. Yield, fruit quality and water use efficiency of tomato for processing under regulated deficit irrigation: A meta-analysis. Agric. Water Manag. 2019, 222, 301–312. [Google Scholar] [CrossRef]
- Gong, X.; Qiu, R.; Sun, J.; Ge, J.; Li, Y.; Wang, S. Evapotranspiration and crop coefficient of tomato grown in a solar greenhouse under full and deficit irrigation. Agric. Water Manag. 2020, 235, 106154. [Google Scholar] [CrossRef]
- Liu, M.; Yang, J.; Li, X.; Liu, G.; Yu, M.; Wang, J. Distribution and dynamics of soil water and salt under different drip irrigation regimes in northwest China. Irrig. Sci. 2013, 31, 675–688. [Google Scholar] [CrossRef]
- Sugita, N.H.; Herrera, M.D.G.; Marano, R.P.; Luaces, P.A. Evaluation of irrigation frequency on pineapple plants grown in greenhouse conditions. Sci. Hortic. 2022, 302, 111186. [Google Scholar] [CrossRef]
- Yin, J.; Yang, Y.; Eeswaran, R.; Yang, Z.; Ma, Z.; Sun, F. Irrigation scheduling for potatoes (Solanum tuberosum L.) under drip irrigation in an arid region using AquaCrop model. Front. Plant Sci. 2023, 14, 1242074. [Google Scholar] [CrossRef]
- Valiente-Banuet, J.I.; Gutiérrez-Ochoa, A. Effect of Irrigation Frequency and Shade Levels on Vegetative Growth, Yield, and Fruit Quality of Piquin Pepper (Capsicum annuum L. var. glabriusculum). Hortscience. 2016, 51, 573–579. [Google Scholar] [CrossRef]
- Esteban-Sanchez, G.; Campillo, C.; Uriarte, D.; Moral, F.J. Assessing Effect of Irrigation Frequency on Evaporation and Transpiration in Vineyards Using SIMDualKc Simulation Model with Measured Wet Fraction. Agronomy 2024, 14, 1468. [Google Scholar] [CrossRef]
- Li, Q.; Dong, B.; Qiao, Y.; Liu, M.; Zhang, J. Root growth, available soil water, and water-use efficiency of winter wheat under different irrigation regimes applied at different growth stages in North China. Agric. Water Manag. 2010, 97, 1676–1682. [Google Scholar] [CrossRef]
- Ertek, A.; Şensoy, S.; Gedik, İ.; Küçükyumuk, C. Irrigation scheduling based on pan evaporation values for cucumber (Cucumis sativus L.) grown under field conditions. Agric. Water Manag. 2006, 81, 159–172. [Google Scholar] [CrossRef]
- Zinkernagel, J.; Maestre-Valero, J.F.; Seresti, S.Y.; Intrigliolo, D.S. New technologies and practical approaches to improve irrigation management of open field vegetable crops. Agric. Water Manag. 2020, 242, 106404. [Google Scholar] [CrossRef]
- Jia, Y.; Yang, B.; Han, Y.; Wang, G.; Su, T.; Li, X.; Lei, Y.; Zhi, X.; Xiong, S.; Xin, M.; et al. Enhanced Cotton Yield and Fiber Quality by Optimizing Irrigation Amount and Frequency in Arid Areas of Northwest China. Agronomy 2024, 14, 266. [Google Scholar] [CrossRef]
- Irmak, S.; Djaman, K.; Rudnick, D.R. Effect of full and limited irrigation amount and frequency on subsurface drip-irrigated maize evapotranspiration, yield, water use efficiency and yield response factors. Irrig. Sci. 2016, 34, 271–286. [Google Scholar] [CrossRef]
- Wang, Q.; Jia, Y.; Pang, Z.; Zhou, J.; Scriber, K.E.; Liang, B.; Chen, Z. Intelligent fertigation improves tomato yield and quality and water and nutrient use efficiency in solar greenhouse production. Agric. Water Manag. 2024, 298, 108873. [Google Scholar] [CrossRef]
- Allen, R.G.; Pereira, L.S.; Raes, D.; Smith, M. Crop evapotranspiration-Guidelines for computing crop water requirements. Irrig. Drain. 1998, 56, 147–151. [Google Scholar]
- Wu, Y.; Si, W.; Yan, S.; Wu, L.; Zhao, W.; Zhang, J.; Zhang, F.; Fan, J. Water consumption, soil nitrate-nitrogen residue and fruit yield of drip-irrigated greenhouse tomato under various irrigation levels and fertilization practices. Agric. Water Manag. 2023, 277, 108092. [Google Scholar] [CrossRef]
- Bai, Z.; Bai, W.; Xie, C.; Yu, J.; Dai, Y.; Pei, S.; Zhang, F.; Li, Y.; Fan, J.; Yin, F. Irrigation depth and nitrogen rate effects on seed cotton yield, fiber quality and water-nitrogen utilization efficiency in southern Xinjiang, China. Agric. Water Manag. 2023, 290, 108583. [Google Scholar] [CrossRef]
- Wang, C.; Wu, G.; Wang, H.; Wang, J.; Yuan, M.; Guo, X.; Liu, C.; Xing, S.; Sun, Y.; Talpur, M.M.A. Optimizing Tomato Cultivation: Impact of Ammonium–Nitrate Ratios on Growth, Nutrient Uptake, and Fertilizer Utilization. Sustainability. 2024, 16, 5373. [Google Scholar] [CrossRef]
- Chen, F.; Cui, N.; Jiang, S.; Zhang, W.; Li, H.; Li, X.; Lv, M.; Liu, C.; Qiu, R.; Wang, Z. Effects of deficit drip irrigation at different growth stages on citrus leaf physiology, fruit growth, yield, and water productivity in South China. Agric. Water Manag. 2025, 307, 109206. [Google Scholar] [CrossRef]
- Sun, Y.; Duan, L.; Zhong, H.; Cai, H.; Xu, J.; Li, Z. Effects of irrigation-fertilization-aeration coupling on yield and quality of greenhouse tomatoes. Agric. Water Manag. 2024, 299, 108893. [Google Scholar] [CrossRef]
- Chen, J.; Kang, S.; Du, T.; Qiu, R.; Guo, P.; Chen, R. Quantitative response of greenhouse tomato yield and quality to water deficit at different growth stages. Agric. Water Manag. 2013, 129, 152–162. [Google Scholar] [CrossRef]
- Burato, A.; Fusco, G.M.; Pentangelo, A.; Nicastro, R.; Modugno, A.F.; Scotto Di Covella, F.; Ronga, D.; Carillo, P.; Campi, P.; Parisi, M. Regulated Deficit Irrigation to Boost Processing Tomato Sustainability and Fruit Quality. Sustainability. 2024, 16, 3798. [Google Scholar] [CrossRef]
- Zhang, C.; Li, X.; Yan, H.; Ullah, I.; Zuo, Z.; Li, L.; Yu, J. Effects of irrigation quantity and biochar on soil physical properties, growth characteristics, yield and quality of greenhouse tomato. Agric. Water Manag. 2020, 241, 106263. [Google Scholar] [CrossRef]
- Wang, N.; Fu, F.; Wang, H.; Wang, P.; He, S.; Shao, H.; Ni, Z.; Zhang, X. Effects of irrigation and nitrogen on chlorophyll content, dry matter and nitrogen accumulation in sugar beet (Beta vulgaris L.). Sci. Rep. 2021, 11, 16651. [Google Scholar] [CrossRef] [PubMed]
- Guida, G.; Sellami, M.H.; Mistretta, C.; Oliva, M.; Buonomo, R.; De Mascellis, R.; Patanè, C.; Rouphael, Y.; Albrizio, R.; Giorio, P. Agronomical, physiological and fruit quality responses of two Italian long-storage tomato landraces under rain-fed and full irrigation conditions. Agric. Water Manag. 2017, 180, 126–135. [Google Scholar] [CrossRef]
- Zhang, H.; Xiong, Y.; Huang, G.; Xu, X.; Huang, Q. Effects of water stress on processing tomatoes yield, quality and water use efficiency with plastic mulched drip irrigation in sandy soil of the Hetao Irrigation District. Agric. Water Manag. 2017, 179, 205–214. [Google Scholar] [CrossRef]
- Zhang, J.; Xiang, L.; Liu, Y.; Jing, D.; Zhang, L.; Liu, Y.; Li, W.; Wang, X.; Li, T.; Li, J. Optimizing irrigation schedules of greenhouse tomato based on a comprehensive evaluation model. Agric. Water Manag. 2024, 295, 108741. [Google Scholar] [CrossRef]
- Li, H.; Hou, X.; Bertin, N.; Ding, R.; Du, T. Quantitative responses of tomato yield, fruit quality and water use efficiency to soil salinity under different water regimes in Northwest China. Agric. Water Manag. 2023, 277, 108134. [Google Scholar] [CrossRef]
- Xiao, F.; Yang, Z.; Han, W.; Li, Y.; Qiu, Y.; Sun, Q.; Zhang, F. Effects of day and night temperature on photosynthesis, antioxidant enzyme activities, and endogenous hormones in tomato leaves during the flowering stage. J. Horticult. Sci. Biotechnol. 2018, 93, 306–315. [Google Scholar] [CrossRef]
- Mendonça, S.R.; Ávila, M.C.R.; Vital, R.G.; Evangelista, Z.R.; Pontes, N.D.C.; Nascimento, A.D.R. The effect of different mulching on tomato development and yield. Sci. Hortic. 2021, 275, 109657. [Google Scholar] [CrossRef]
- Ge, J.; Zhu, Y.; Gong, X.; Yao, C.; Wu, X.; Zhang, J.; Li, Y. The Effect of Mulching on the Root Growth of Greenhouse Tomatoes Under Different Drip Irrigation Volumes and Its Distribution Model. Horticulturae. 2025, 11, 99. [Google Scholar] [CrossRef]
- Zhao, B.; Lou, H.; Wang, Y.; Wang, B.; Wang, J.; Xu, Z.; Zhao, J.; Zhou, G.; Kuai, J. Efficient root nitrogen transport is a key factor in improving nitrogen utilization and yield of semi-dwarf rapeseed. Field Crops Res. 2025, 322, 109758. [Google Scholar] [CrossRef]
- Odone, A.; Popovic, O.; Thorup-Kristensen, K. Deep roots: Implications for nitrogen uptake and drought tolerance among winter wheat cultivars. Plant Soil 2024, 500, 13–32. [Google Scholar] [CrossRef]
- Wang, H.; Yang, Z.; Yu, Y.; Chen, S.; He, Z.; Wang, Y.; Jiang, L.; Wang, G.; Yang, C.; Liu, B.; et al. Drought Enhances Nitrogen Uptake and Assimilation in Maize Roots. Agron. J. 2017, 109, 39–46. [Google Scholar] [CrossRef]
- Wang, X.; Yun, J.; Shi, P.; Li, Z.; Li, P.; Xing, Y. Root Growth, Fruit Yield and Water Use Efficiency of Greenhouse Grown Tomato Under Different Irrigation Regimes and Nitrogen Levels. J. Plant Growth Regul. 2019, 38, 400–415. [Google Scholar] [CrossRef]
- Zhang, G.; Shen, D.; Ming, B.; Xie, R.; Jin, X.; Liu, C.; Hou, P.; Xue, J.; Chen, J.; Zhang, W.; et al. Using irrigation intervals to optimize water-use efficiency and maize yield in Xinjiang, northwest China. Crop J. 2019, 7, 322–334. [Google Scholar] [CrossRef]
- Habibi, N.; Tayobong, R.R.P.; Saharan, P.; Terada, N.; Sanada, A.; Koshio, K. Novel insights into seed priming for tomato plants: Restoring root vitality in the face of salt stress. Hortic. Environ. Biotechnol. 2025, 66, 361–380. [Google Scholar] [CrossRef]
- Liu, J.; Li, H.; Yuan, Z.; Feng, J.; Chen, S.; Sun, G.; Wei, Z.; Hu, T. Effects of microbial fertilizer and irrigation amount on growth, physiology and water use efficiency of tomato in greenhouse. Sci. Hortic. 2024, 323, 112553. [Google Scholar] [CrossRef]
- Mattar, M.A.; Zin El-Abedin, T.K.; Alazba, A.A.; Al-Ghobari, H.M. Soil water status and growth of tomato with partial root-zone drying and deficit drip irrigation techniques. Irrig. Sci. 2020, 38, 163–176. [Google Scholar] [CrossRef]
- Zhang, Z.; Yang, R.; Zhang, Z.; Geng, Y.; Zhu, J.; Sun, J. Effects of Oxygenated Irrigation on Root Morphology, Fruit Yield, and Water–Nitrogen Use Efficiency of Tomato (Solanum lycopersicum L.). J. Plant Nutr. Soil Sci. 2023, 23, 5582–5593. [Google Scholar] [CrossRef]
- Zuo, Z.; Lü, T.; Sun, J.; Peng, H.; Yang, D.; Song, J.; Ma, G.; Mao, H. Dynamic Water and Fertilizer Management Strategy for Greenhouse Tomato Based on Morphological Characteristics. Agriculture 2025, 15, 304. [Google Scholar] [CrossRef]
- Ahammed, G.J.; Li, X.; Yang, Y.; Liu, C.; Zhou, G.; Wan, H.; Cheng, Y. Tomato WRKY81 acts as a negative regulator for drought tolerance by modulating guard cell H2O2–mediated stomatal closure. Environ. Exp. Bot. 2020, 171, 103960. [Google Scholar] [CrossRef]
- Bradford, K.J. Effects of soil flooding on leaf gas exchange of tomato plants. Plant Physiol. 1983, 73, 475–479. [Google Scholar] [CrossRef]
- Xu, B.; Long, Y.; Feng, X.; Zhu, X.; Sai, N.; Chirkova, L.; Betts, A.; Herrmann, J.; Edwards, E.J.; Okamoto, M.; et al. GABA signalling modulates stomatal opening to enhance plant water use efficiency and drought resilience. Nat. Commun. 2021, 12, 1952. [Google Scholar] [CrossRef] [PubMed]
- Liu, G.; Du, Q.; Jiao, X.; Li, J. Irrigation at the level of evapotranspiration aids growth recovery and photosynthesis rate in tomato grown under chilling stress. Acta Physiol. Plant 2018, 40, 2. [Google Scholar] [CrossRef]
- Wen, S.; Cui, N.; Wang, Y.; Gong, D.; Xing, L.; Wu, Z.; Zhang, Y.; Wang, Z. Deficit irrigation enhances yield and water productivity of apples by inhibiting excessive vegetative growth and improving photosynthetic performance. Agric. Water Manag. 2025, 307, 109220. [Google Scholar] [CrossRef]
- Missen, M.L.; De Kauwe, M.G.; Hovenden, M.J. Increasing photosynthetic benefit with decreasing irrigation frequency in an Australian temperate pasture exposed to elevated carbon dioxide. J. Exp. Bot. 2025, erae511. [Google Scholar] [CrossRef]
- Puértolas, J.; Albacete, A.; Dodd, I.C. Irrigation frequency transiently alters whole plant gas exchange, water and hormone status, but irrigation volume determines cumulative growth in two herbaceous crops. Environ. Exp. Bot. 2020, 176, 104101. [Google Scholar] [CrossRef]
- Fara, S.J.; Teixeira Delazari, F.; Silva Gomes, R.; Araújo, W.L.; Da Silva, D.J.H. Stomata opening and productiveness response of fresh market tomato under different irrigation intervals. Sci. Hortic. 2019, 255, 86–95. [Google Scholar] [CrossRef]
- Xu, J.; Wan, W.; Zhu, X.; Zhao, Y.; Chai, Y.; Guan, S.; Diao, M. Effect of Regulated Deficit Irrigation on the Growth, Yield, and Irrigation Water Productivity of Processing Tomatoes under Drip Irrigation and Mulching. Agronomy 2023, 13, 2862. [Google Scholar] [CrossRef]
- Li, C.; Wang, J.; Zhang, Y.; Feng, H.; Zhang, W.; Siddique, K.H.M. Response of plastic film mulched maize to soil and atmospheric water stresses in an arid irrigation area. Eur. J. Agron. 2024, 154, 127080. [Google Scholar] [CrossRef]
- El-Hendawy, S.E.; Schmidhalter, U. Optimal coupling combinations between irrigation frequency and rate for drip-irrigated maize grown on sandy soil. Agric. Water Manag. 2010, 97, 439–448. [Google Scholar] [CrossRef]
- Ors, S.; Ekinci, M.; Yildirim, E.; Sahin, U.; Turan, M.; Dursun, A. Interactive effects of salinity and drought stress on photosynthetic characteristics and physiology of tomato (Lycopersicon esculentum L.) seedlings. S. Afr. J. Bot. 2021, 137, 335–339. [Google Scholar] [CrossRef]
- Liu, H.; Duan, A.; Li, F.; Sun, J.; Wang, Y.; Sun, C. Drip Irrigation Scheduling for Tomato Grown in Solar Greenhouse Based on Pan Evaporation in North China Plain. J. Integr. Agric. 2013, 12, 520–531. [Google Scholar] [CrossRef]
- Jia, D.; Dai, X.; Xie, Y.; He, M. Alternate furrow irrigation improves grain yield and nitrogen use efficiency in winter wheat. Agric. Water Manag. 2021, 244, 106606. [Google Scholar] [CrossRef]
- Zotarelli, L.; Scholberg, J.M.; Dukes, M.D.; Muñoz-Carpena, R.; Icerman, J. Tomato yield, biomass accumulation, root distribution and irrigation water use efficiency on a sandy soil, as affected by nitrogen rate and irrigation scheduling. Agric. Water Manag. 2009, 96, 23–34. [Google Scholar] [CrossRef]
- Ebstu, E.T.; Muluneh, M. Evaluate the integrative effects of irrigation water level, furrow irrigation methods, and nitrogen fertilizer rate on tomato yield in semi-arid southern Ethiopia. Heliyon 2025, 11, e41551. [Google Scholar] [CrossRef]
- Zhao, W.; Wu, K.; Wu, Y.; Yu, H.; Cao, W.; Ma, H. Effects of biochar amendment on greenhouse tomato quality, nutrient uptake and use efficiency under various irrigation and fertilization regimes. Sci. Hortic. 2024, 337, 113441. [Google Scholar] [CrossRef]
- Li, H.; Hou, X.; Du, T. Responses of tomato fruit water balance and xylem hydraulic property of pedicel and calyx to water deficit and salinity stress. Environ. Exp. Bot. 2023, 206, 105195. [Google Scholar] [CrossRef]
- Jahan Leghari, S.; Hu, K.; Wei, Y.; Wang, T.; Laghari, Y. Modelling the effects of cropping systems and irrigation methods on water consumption, N fates and crop yields in the North China Plain. Comput. Electron. Agric. 2024, 218, 108677. [Google Scholar] [CrossRef]
- Liu, H.; Li, H.; Ning, H.; Zhang, X.; Li, S.; Pang, J.; Wang, G.; Sun, J. Optimizing irrigation frequency and amount to balance yield, fruit quality and water use efficiency of greenhouse tomato. Agric. Water Manag. 2019, 226, 105787. [Google Scholar] [CrossRef]
- Rodriguez-Ortega, W.M.; Martinez, V.; Rivero, R.M.; Camara-Zapata, J.M.; Mestre, T.; Garcia-Sanchez, F. Use of a smart irrigation system to study the effects of irrigation management on the agronomic and physiological responses of tomato plants grown under different temperatures regimes. Agric. Water Manag. 2017, 183, 158–168. [Google Scholar] [CrossRef]
- Dohat, M.; Patel, R.A.; Patel, V.Y.; Patel, H.K. Effect of Irrigation and Nitrogen on Growth and Yield of linseed (Linum usitatissimum L.). J. Pure Appl. Microbiol. 2017, 11, 949–951. [Google Scholar] [CrossRef]
- Xue, R.; Zhang, C.; Yan, H.; Disasa, K.N.; Lakhiar, I.A.; Akhlaq, M.; Hameed, M.U.; Li, J.; Ren, J.; Deng, S.; et al. Determination of the optimal frequency and duration of micro-spray patterns for high-temperature environment tomatoes based on the Fuzzy Borda model. Agric. Water Manag. 2025, 307, 109240. [Google Scholar] [CrossRef]
- Pires, R.C.D.M.; Furlani, P.R.; Ribeiro, R.V.; Bodine Junior, D.; Sakai, E.; Lourenção, A.L.; Torre Neto, A. Irrigation frequency and substrate volume effects in the growth and yield of tomato plants under greenhouse conditions. Sci. Agric. 2011, 68, 400–405. [Google Scholar] [CrossRef]
- Si, J.; Wang, L.; Zhang, K.; Li, L.; Fudjoe, S.K.; Luo, Z. Irrigation as an Effective Way to Increase Potato Yields in Northern China: A Meta-Analysis. Agronomy 2024, 14, 448. [Google Scholar] [CrossRef]
- Shabbir, A.; Mao, H.; Ullah, I.; Buttar, N.A.; Ajmal, M.; Lakhiar, I.A. Effects of Drip Irrigation Emitter Density with Various Irrigation Levels on Physiological Parameters, Root, Yield, and Quality of Cherry Tomato. Agronomy 2020, 10, 1685. [Google Scholar] [CrossRef]
- Suazo-López, F.; Zepeda-Bautista, R.; Castillo, F.; Martínez-Hernández, J.; Virgen-Vargas, J.; Tijerina-Chávez, L. Growth and Yield of Tomato (Solanum lycopersicum L.) as Affected by Hydroponics, Greenhouse and Irrigation Regimes. Annu. Res. Rev. Biology. 2014, 4, 4246–4258. [Google Scholar] [CrossRef]
- Yang, S.; Cai, W.; Shen, L.; Wu, R.; Cao, J.; Tang, W.; Lu, Q.; Huang, Y.; Guan, D.; He, S. Solanaceous plants switch to cytokinin--mediated immunity against Ralstonia solanacearum under high temperature and high humidity. Plant Cell Environ. 2022, 45, 459–478. [Google Scholar] [CrossRef]
- Agbna, G.H.D.; Dongli, S.; Zhipeng, L.; Elshaikh, N.A.; Guangcheng, S.; Timm, L.C. Effects of deficit irrigation and biochar addition on the growth, yield, and quality of tomato. Sci. Hortic. 2017, 222, 90–101. [Google Scholar] [CrossRef]
- Zhou, X.; Zheng, Y.; Chen, J.; Wang, Y.; Zuo, J.; Ma, L.; Liang, H.; Liu, M.; Ji, Y. Multivariate analysis of the effect of deficit irrigation on postharvest storability of tomato. Postharvest Biol. Technol. 2025, 219, 113245. [Google Scholar] [CrossRef]
- Zhu, Y.; Cai, H.; Song, L.; Wang, X.; Shang, Z.; Sun, Y. Aerated Irrigation of Different Irrigation Levels and Subsurface Dripper Depths Affects Fruit Yield, Quality and Water Use Efficiency of Greenhouse Tomato. Sustainability 2020, 12, 2703. [Google Scholar] [CrossRef]
- Yu, X.; Zhang, J.; Zhang, Y.; Ma, L.; Jiao, X.; Zhao, M.; Li, J. Identification of optimal irrigation and fertilizer rates to balance yield, water and fertilizer productivity, and fruit quality in greenhouse tomatoes using TOPSIS. Sci. Hortic. 2023, 311, 111829. [Google Scholar] [CrossRef]
- Zhang, X.; Yang, H.; Du, T. Study of regulated deficit irrigation regime based on individual fruit weight and quality response to water deficit duration: A case study in tomato. Agric. Water Manag. 2025, 307, 109232. [Google Scholar] [CrossRef]
- Nangare, D.D.; Singh, Y.; Kumar, P.S.; Minhas, P.S. Growth, fruit yield and quality of tomato (Lycopersicon esculentum Mill.) as affected by deficit irrigation regulated on phenological basis. Agric. Water Manag. 2016, 171, 73–79. [Google Scholar] [CrossRef]
- Zhang, X.; Li, H.; Liu, H.; Wang, J.; Qiang, X. Response of Tomato Quality Parameters to Water Deficit Under Soil Salinity and Simulation Based on Stem Water Potential. Horticulturae 2025, 11, 114. [Google Scholar] [CrossRef]
- Bai, C.; Zuo, J.; Watkins, C.B.; Wang, Q.; Liang, H.; Zheng, Y.; Liu, M.; Ji, Y. Sugar accumulation and fruit quality of tomatoes under water deficit irrigation. Postharvest Biol. Technol. 2023, 195, 112112. [Google Scholar] [CrossRef]
- Tao, X.; Wu, Q.; Li, J.; Cai, L.; Mao, L.; Luo, Z.; Li, L.; Ying, T. Exogenous methyl jasmonate regulates sucrose metabolism in tomato during postharvest ripening. Postharvest Biol. Technol. 2021, 181, 111639. [Google Scholar] [CrossRef]
- Colimba-Limaico, J.E.; Zubelzu-Minguez, S.; Rodríguez-Sinobas, L. Optimal Irrigation Scheduling for Greenhouse Tomato Crop (Solanum lycopersicum L.) in Ecuador. Agronomy 2022, 12, 1020. [Google Scholar] [CrossRef]
- Favati, F.; Lovelli, S.; Galgano, F.; Miccolis, V.; Di Tommaso, T.; Candido, V. Processing tomato quality as affected by irrigation scheduling. Sci. Hortic. 2009, 122, 562–571. [Google Scholar] [CrossRef]
- Zheng, J.; Huang, G.; Jia, D.; Wang, J.; Mota, M.; Pereira, L.S.; Huang, Q.; Xu, X.; Liu, H. Responses of drip irrigated tomato (Solanum lycopersicum L.) yield, quality and water productivity to various soil matric potential thresholds in an arid region of Northwest China. Agric. Water Manag. 2013, 129, 181–193. [Google Scholar] [CrossRef]
- Dumas, Y.; Dadomo, M.; Di Lucca, G.; Grolier, P. Effects of environmental factors and agricultural techniques on antioxidantcontent of tomatoes. J. Sci. Food. Agric. 2003, 83, 369–382. [Google Scholar] [CrossRef]
- Li, B.; Shukla, M.K.; Du, T. Combined environmental stresses induced by drip irrigation positively affect most solar greenhouse grown tomato fruit quality. Sci. Hortic. 2021, 288, 110334. [Google Scholar] [CrossRef]


| Treatment | Pn (μmol m−2 s−1) | Tr (mmol m−2 s−1) | Gs (mol m−2 s−1) | ||||||
|---|---|---|---|---|---|---|---|---|---|
| Flowering | Expansion | Maturity | Flowering | Expansion | Maturity | Flowering | Expansion | Maturity | |
| W1D1 | 20.14 ± 1.12 a | 23.32 ± 1.27 b | 12.33 ± 0.36 b | 10.29 ± 0.84 a | 11.29 ± 0.30 b | 6.92 ± 0.40 bc | 0.49 ± 0.02 a | 0.52 ± 0.01 bc | 0.30 ± 0.01 b |
| W2D1 | 19.09 ± 0.54 ab | 25.58 ± 0.64 a | 13.30 ± 0.28 a | 9.57 ± 0.67 abc | 12.24 ± 0.24 a | 7.69 ± 0.18 a | 0.47 ± 0.02 a | 0.55 ± 0.01 a | 0.34 ± 0.01 a |
| W3D1 | 18.42 ± 0.67 bc | 20.68 ± 0.44 cd | 10.89 ± 0.35 de | 8.84 ± 0.28 cd | 10.30 ± 0.12 cd | 6.24 ± 0.28 de | 0.43 ± 0.02 b | 0.46 ± 0.01 d | 0.27 ± 0.01 cd |
| W4D1 | 16.28 ± 0.75 de | 17.29 ± 0.75 e | 9.63 ± 0.58 g | 7.83 ± 0.32 ef | 9.67 ± 0.22 ef | 5.68 ± 0.12 fg | 0.38 ± 0.03 de | 0.41 ± 0.01 f | 0.24 ± 0.01 ef |
| W1D2 | 19.73 ± 1.06 ab | 21.76 ± 0.86 c | 11.52 ± 0.56 cd | 9.70 ± 0.66 ab | 10.73 ± 0.39 c | 6.46 ± 0.19 d | 0.47 ± 0.01 a | 0.50 ± 0.03 c | 0.28 ± 0.01 bc |
| W2D2 | 18.50 ± 0.86 bc | 23.26 ± 0.84 b | 12.59 ± 0.2 b | 9.25 ± 0.30 bc | 11.63 ± 0.50 b | 7.18 ± 0.21 b | 0.43 ± 0.03 b | 0.53 ± 0.02 ab | 0.32 ± 0.03 a |
| W3D2 | 17.55 ± 0.98 cd | 19.27 ± 0.92 d | 10.45 ± 0.48 e | 8.28 ± 0.18 de | 10.07 ± 0.10 de | 5.82 ± 0.21 f | 0.40 ± 0.02 bcd | 0.44 ± 0.02 de | 0.26 ± 0.01 de |
| W4D2 | 15.55 ± 0.67 e | 15.67 ± 0.89 f | 8.78 ± 0.26 h | 7.49 ± 0.35 fg | 9.22 ± 0.42 f | 5.35 ± 0.11 gh | 0.35 ± 0.04 ef | 0.38 ± 0.01 gh | 0.23 ± 0.01 fg |
| W1D3 | 16.68 ± 0.69 de | 19.26 ± 1.06 d | 10.37 ± 0.58 ef | 8.90 ± 0.17 cd | 10.05 ± 0.44 de | 6.06 ± 0.12 ef | 0.41 ± 0.02 bc | 0.42 ± 0.02 ef | 0.25 ± 0.01 de |
| W2D3 | 15.70 ± 1.09 e | 20.20 ± 1.63 d | 11.60 ± 0.27 c | 8.40 ± 0.15 de | 10.62 ± 0.28 c | 6.58 ± 0.16 cd | 0.39 ± 0.01 cd | 0.47 ± 0.01 d | 0.29 ± 0.02 bc |
| W3D3 | 14.19 ± 0.29 f | 17.77 ± 0.79 e | 9.70 ± 0.33 fg | 8.08 ± 0.19 ef | 9.47 ± 0.44 f | 5.71 ± 0.31 fg | 0.37 ± 0.01 de | 0.40 ± 0.03 fg | 0.22 ± 0.01 f |
| W4D3 | 13.65 ± 1.04 f | 15.02 ± 0.75 f | 8.37 ± 0.84 h | 6.77 ± 0.73 g | 8.67 ± 0.38 g | 5.17 ± 0.05 h | 0.33 ± 0.02 f | 0.37 ± 0.02 h | 0.20 ± 0.01 g |
| Source of variation | |||||||||
| W | ** | ** | ** | ** | ** | ** | ** | ** | ** |
| D | ** | ** | ** | ** | ** | ** | ** | ** | ** |
| W × D | ns | ns | ns | ns | ns | * | ns | * | ns |
| Treatment | Pn (μmol m−2 s−1) | Tr (mmol m−2 s−1) | Gs (mol m−2 s−1) | ||||||
|---|---|---|---|---|---|---|---|---|---|
| Flowering | Expansion | Maturity | Flowering | Expansion | Maturity | Flowering | Expansion | Maturity | |
| W1D1 | 15.98 ± 0.50 a | 18.36 ± 0.47 b | 9.96 ± 0.39 b | 8.99 ± 0.69 a | 10.41 ± 0.35 ab | 5.85 ± 0.10 bc | 0.44 ± 0.02 a | 0.48 ± 0.03 ab | 0.27 ± 0.01 bc |
| W2D1 | 15.16 ± 1.18 ab | 19.99 ± 0.55 a | 11.01 ± 0.36 a | 8.27 ± 0.23 bc | 10.92 ± 0.24 a | 6.49 ± 0.18 a | 0.42 ± 0.01 a | 0.52 ± 0.02 a | 0.30 ± 0.01 a |
| W3D1 | 14.35 ± 0.59 bc | 16.03 ± 0.55 c | 9.06 ± 0.11 de | 8.03 ± 0.24 bcd | 9.34 ± 0.34 c | 5.31 ± 0.17 d | 0.41 ± 0.01 ab | 0.40 ± 0.01 cd | 0.24 ± 0.01 de |
| W4D1 | 11.99 ± 0.80 ef | 12.71 ± 1.12 ef | 7.94 ± 0.40 fg | 6.31 ± 0.54 f | 8.04 ± 0.31 ef | 4.78 ± 0.20 ef | 0.37 ± 0.01 cd | 0.36 ± 0.02 ef | 0.22 ± 0.01 fg |
| W1D2 | 15.31 ± 0.36 ab | 17.76 ± 0.68 b | 9.69 ± 0.32 bc | 8.65 ± 0.56 ab | 10.00 ± 0.29 b | 5.73 ± 0.28 c | 0.43 ± 0.01 a | 0.47 ± 0.02 b | 0.26 ± 0.02 cd |
| W2D2 | 14.44 ± 0.62 bc | 19.32 ± 1.04 ab | 10.70 ± 0.33 a | 8.02 ± 0.6 bcd | 10.44 ± 0.45 ab | 6.21 ± 0.14 ab | 0.41 ± 0.01 ab | 0.5 ± 0.03 ab | 0.30 ± 0.02 ab |
| W3D2 | 13.80 ± 1.12 cd | 14.92 ± 0.84 cd | 8.66 ± 0.07 e | 7.4 ± 0.52 de | 8.79 ± 0.68 cd | 5.09 ± 0.11 de | 0.39 ± 0.01 bc | 0.37 ± 0.01 de | 0.23 ± 0.01 ef |
| W4D2 | 11.34 ± 0.23 ef | 12.06 ± 0.74 f | 7.69 ± 0.10 g | 5.93 ± 0.35 f | 7.52 ± 0.37 fg | 4.55 ± 0.36 fg | 0.34 ± 0.02 de | 0.32 ± 0.01 fg | 0.21 ± 0.01 fg |
| W1D3 | 13.50 ± 0.44 cd | 14.46 ± 1.33 cd | 8.86 ± 0.09 de | 7.65 ± 0.52 cde | 8.42 ± 0.17 de | 5.09 ± 0.29 de | 0.38 ± 0.02 bc | 0.4 ± 0.04 cd | 0.23 ± 0.02 ef |
| W2D3 | 13.24 ± 0.19 cd | 15.15 ± 1.31 cd | 9.31 ± 0.09 cd | 7.34 ± 0.10 de | 8.74 ± 0.53 cd | 5.32 ± 0.04 d | 0.37 ± 0.01 cd | 0.42 ± 0.03 c | 0.24 ± 0.02 de |
| W3D3 | 12.55 ± 0.39 de | 13.74 ± 1.04 de | 8.16 ± 0.15 f | 7.05 ± 0.27 e | 8.14 ± 0.12 def | 4.62 ± 0.23 f | 0.37 ± 0.02 cd | 0.36 ± 0.01 de | 0.19 ± 0.02 gh |
| W4D3 | 10.83 ± 0.91 f | 11.50 ± 0.40 f | 7.24 ± 0.31 h | 5.75 ± 0.18 f | 7.09 ± 0.25 g | 4.23 ± 0.30 g | 0.33 ± 0.03 e | 0.31 ± 0.01 g | 0.18 ± 0.01 h |
| Source of variation | |||||||||
| W | ** | ** | ** | ** | ** | ** | ** | ** | ** |
| D | ** | ** | ** | ** | ** | ** | ** | ** | ** |
| W × D | ns | * | ns | ns | ns | ns | ns | * | ns |
| Treatment | Spring 2023 | Autumn 2023 | ||||
|---|---|---|---|---|---|---|
| Mean Fruit Weight (g) | Fruit Number (n) | Total Yield (t ha−1) | Mean Fruit Weight (g) | Fruit Number (n) | Total Yield (t ha−1) | |
| W1D1 | 167.41 ± 0.82 a | 17.98 ± 0.22 ab | 131.85 ± 1.06 ab | 96.32 ± 4.88 ab | 11.10 ± 0.60 a | 47.20 ± 2.26 ab |
| W2D1 | 169.72 ± 2.25 a | 18.36 ± 0.12 a | 136.78 ± 3.06 a | 103.06 ± 8.48 a | 11.15 ± 0.51 a | 50.10 ± 3.92 a |
| W3D1 | 163.40 ± 1.10 b | 16.57 ± 0.28 cd | 118.22 ± 1.22 d | 88.58 ± 4.21 cd | 10.01 ± 0.12 bc | 40.12 ± 3.28 cd |
| W4D1 | 155.23 ± 1.11 de | 14.90 ± 0.17 f | 101.22 ± 0.93 f | 76.28 ± 1.43 ef | 9.33 ± 0.15 def | 31.61 ± 1.07 fg |
| W1D2 | 160.93 ± 1.53 bc | 17.30 ± 1.13 bc | 122.42 ± 6.96 cd | 90.81 ± 5.76 bc | 10.60 ± 0.33 ab | 43.12 ± 3.61 bc |
| W2D2 | 163.43 ± 1.89 b | 17.91 ± 0.29 ab | 128.14 ± 1.01 bc | 96.51 ± 3.16 ab | 10.81 ± 0.73 a | 45.85 ± 4.37 ab |
| W3D2 | 156.86 ± 3.08 d | 16.08 ± 0.15 de | 110.25 ± 1.47 e | 83.30 ± 1.84 d | 9.81 ± 0.51 cd | 36.19 ± 2.47 def |
| W4D2 | 146.68 ± 2.14 f | 14.06 ± 0.53 g | 89.92 ± 4.98 g | 74.12 ± 1.63 fg | 8.91 ± 0.52 ef | 29.35 ± 2.85 g |
| W1D3 | 152.23 ± 1.70 e | 16.15 ± 0.98 de | 106.76 ± 5.95 ef | 82.95 ± 3.48 de | 9.46 ± 0.22 cde | 34.51 ± 1.71 ef |
| W2D3 | 157.27 ± 5.63 cd | 17.04 ± 0.41 c | 116.82 ± 1.29 d | 86.52 ± 7.03 cd | 9.67 ± 0.44 cd | 37.06 ± 2.69 de |
| W3D3 | 151.69 ± 2.12 e | 15.68 ± 0.28 ef | 103.83 ± 3.04 f | 76.39 ± 1.16 ef | 8.67 ± 0.19 f | 29.53 ± 0.66 g |
| W4D3 | 141.34 ± 3.29 g | 13.95 ± 0.69 g | 85.93 ± 2.31 g | 69.28 ± 2.51 g | 7.74 ± 0.15 g | 23.34 ± 0.89 h |
| Source of variation | ||||||
| W | ** | ** | ** | ** | ** | ** |
| D | ** | ** | ** | ** | ** | ** |
| W × D | ns | ns | ns | ns | ns | ns |
| Treatment | Total Soluble Solids Content (%) | Vitamin C (mg/kg) | Soluble Sugar (%) | Organic Acid (%) | Sugar-Acid Ratio |
|---|---|---|---|---|---|
| W1D1 | 5.56 ± 0.10 fg | 188.2 ± 5.62 d | 2.76 ± 0.11 fg | 0.27 ± 0.01 ef | 10.30 ± 0.22 abc |
| W2D1 | 5.95 ± 0.09 bcd | 206.93 ± 6.49 bc | 3.19 ± 0.07 bc | 0.30 ± 0.01 bc | 10.67 ± 0.21 a |
| W3D1 | 6.14 ± 0.16 b | 214.42 ± 6.49 ab | 3.27 ± 0.08 ab | 0.31 ± 0.01 ab | 10.71 ± 0.26 a |
| W4D1 | 6.36 ± 0.10 a | 223.78 ± 8.58 a | 3.39 ± 0.17 a | 0.32 ± 0.02 a | 10.75 ± 0.37 a |
| W1D2 | 5.36 ± 0.09 gh | 175.09 ± 6.49 ef | 2.67 ± 0.08 g | 0.26 ± 0.01 fg | 10.14 ± 0.24 bc |
| W2D2 | 5.67 ± 0.23 ef | 197.57 ± 6.49 cd | 2.92 ± 0.07 de | 0.28 ± 0.01 de | 10.38 ± 0.18 abc |
| W3D2 | 5.89 ± 0.08 cd | 205.06 ± 5.62 bc | 3.04 ± 0.11 cd | 0.29 ± 0.01 cd | 10.51 ± 0.32 ab |
| W4D2 | 6.06 ± 0.11 bc | 214.42 ± 3.24 ab | 3.19 ± 0.13 bc | 0.30 ± 0.01 bc | 10.69 ± 0.32 a |
| W1D3 | 5.20 ± 0.15 h | 165.73 ± 11.24 f | 2.49 ± 0.11 h | 0.25 ± 0.01 g | 9.95 ± 0.19 c |
| W2D3 | 5.44 ± 0.06 g | 184.46 ± 8.58 de | 2.69 ± 0.05 fg | 0.26 ± 0.01 fg | 10.19 ± 0.17 bc |
| W3D3 | 5.79 ± 0.08 de | 190.07 ± 8.58 d | 2.84 ± 0.08 ef | 0.27 ± 0.01 ef | 10.41 ± 0.16 ab |
| W4D3 | 5.96 ± 0.09 bcd | 206.93 ± 6.49 bc | 3.14 ± 0.1 bc | 0.29 ± 0.01 bcd | 10.67 ± 0.19 a |
| Source of variation | |||||
| W | ** | ** | ** | ** | ** |
| D | ** | ** | ** | ** | * |
| W × D | ns | ns | ns | ns | ns |
| Treatment | Total Soluble Solids Content (%) | Vitamin C (mg/kg) | Soluble Sugar (%) | Organic Acid (%) | Sugar-Acid Ratio |
|---|---|---|---|---|---|
| W1D1 | 4.97 ± 0.15 de | 150.75 ± 3.24 cd | 2.54 ± 0.17 ef | 0.31 ± 0.02 de | 8.29 ± 0.32 cd |
| W2D1 | 5.30 ± 0.26 bc | 165.73 ± 5.62 b | 2.95 ± 0.06 bc | 0.34 ± 0.01 b | 8.70 ± 0.11 ab |
| W3D1 | 5.53 ± 0.06 ab | 169.48 ± 6.49 ab | 3.10 ± 0.17 ab | 0.35 ± 0.02 ab | 8.81 ± 0.29 ab |
| W4D1 | 5.73 ± 0.06 a | 178.84 ± 12.97 a | 3.29 ± 0.10 a | 0.37 ± 0.02 a | 9.00 ± 0.29 a |
| W1D2 | 4.80 ± 0.17 ef | 139.51 ± 6.49 de | 2.32 ± 0.08 fg | 0.29 ± 0.01 ef | 8.04 ± 0.15 d |
| W2D2 | 5.10 ± 0.17 cd | 152.62 ± 3.24 c | 2.81 ± 0.10 cd | 0.33 ± 0.01 bc | 8.49 ± 0.13 bc |
| W3D2 | 5.30 ± 0.10 bc | 160.11 ± 5.62 bc | 2.92 ± 0.10 bc | 0.33 ± 0.01 bc | 8.71 ± 0.11 ab |
| W4D2 | 5.60 ± 0.10 a | 169.48 ± 3.24 ab | 3.07 ± 0.15 ab | 0.35 ± 0.03 ab | 8.78 ± 0.23 ab |
| W1D3 | 4.37 ± 0.06 g | 132.02 ± 9.73 e | 2.23 ± 0.18 g | 0.28 ± 0.02 f | 8.07 ± 0.26 d |
| W2D3 | 4.70 ± 0.10 f | 139.51 ± 3.24 de | 2.53 ± 0.11 ef | 0.30 ± 0.01 de | 8.30 ± 0.27 cd |
| W3D3 | 5.00 ± 0.17 de | 150.75 ± 3.24 cd | 2.68 ± 0.07 de | 0.31 ± 0.01 cd | 8.53 ± 0.10 bc |
| W4D3 | 5.23 ± 0.21 cd | 167.60 ± 8.58 ab | 3.03 ± 0.19 bc | 0.34 ± 0.01 ab | 8.77 ± 0.34 ab |
| Source of variation | |||||
| W | ** | ** | ** | ** | ** |
| D | ** | ** | ** | ** | * |
| W×D | ns | ns | ns | ns | ns |
| Spring 2023 | Autumn 2023 | ||||
|---|---|---|---|---|---|
| Treatment | Score | Rank | Treatment | Score | Rank |
| W1D1 | 0.74 | 2 | W1D1 | 0.68 | 3 |
| W2D1 | 1.42 | 1 | W2D1 | 1.37 | 1 |
| W3D1 | 0.64 | 4 | W3D1 | 0.56 | 4 |
| W4D1 | −0.04 | 7 | W4D1 | −0.07 | 7 |
| W1D2 | 0.08 | 6 | W1D2 | 0.14 | 5 |
| W2D2 | 0.71 | 3 | W2D2 | 0.85 | 2 |
| W3D2 | 0.08 | 5 | W3D2 | 0.02 | 6 |
| W4D2 | −0.83 | 10 | W4D2 | −0.47 | 9 |
| W1D3 | −0.88 | 11 | W1D3 | −0.81 | 11 |
| W2D3 | −0.14 | 8 | W2D3 | −0.25 | 8 |
| W3D3 | −0.58 | 9 | W3D3 | −0.78 | 10 |
| W4D3 | −1.20 | 12 | W4D3 | −1.26 | 12 |
Disclaimer/Publisher’s Note: The statements, opinions and data contained in all publications are solely those of the individual author(s) and contributor(s) and not of MDPI and/or the editor(s). MDPI and/or the editor(s) disclaim responsibility for any injury to people or property resulting from any ideas, methods, instructions or products referred to in the content. |
© 2025 by the authors. Licensee MDPI, Basel, Switzerland. This article is an open access article distributed under the terms and conditions of the Creative Commons Attribution (CC BY) license (https://creativecommons.org/licenses/by/4.0/).
Share and Cite
Zhang, H.; Cao, H.; Zhao, Z.; Dou, Z.; Liao, Z.; Bai, Z.; Li, S.; Zhang, F.; Fan, J. Effects of Irrigation Interval and Irrigation Level on Growth, Photosynthesis, Fruit Yield, Quality, and Water-Nitrogen Use Efficiency of Drip-Fertigated Greenhouse Tomatoes (Solanum lycopersicum L.). Agronomy 2025, 15, 1068. https://doi.org/10.3390/agronomy15051068
Zhang H, Cao H, Zhao Z, Dou Z, Liao Z, Bai Z, Li S, Zhang F, Fan J. Effects of Irrigation Interval and Irrigation Level on Growth, Photosynthesis, Fruit Yield, Quality, and Water-Nitrogen Use Efficiency of Drip-Fertigated Greenhouse Tomatoes (Solanum lycopersicum L.). Agronomy. 2025; 15(5):1068. https://doi.org/10.3390/agronomy15051068
Chicago/Turabian StyleZhang, Hongxin, Hongxia Cao, Zhiming Zhao, Zhiyao Dou, Zhenqi Liao, Zhentao Bai, Sien Li, Fucang Zhang, and Junliang Fan. 2025. "Effects of Irrigation Interval and Irrigation Level on Growth, Photosynthesis, Fruit Yield, Quality, and Water-Nitrogen Use Efficiency of Drip-Fertigated Greenhouse Tomatoes (Solanum lycopersicum L.)" Agronomy 15, no. 5: 1068. https://doi.org/10.3390/agronomy15051068
APA StyleZhang, H., Cao, H., Zhao, Z., Dou, Z., Liao, Z., Bai, Z., Li, S., Zhang, F., & Fan, J. (2025). Effects of Irrigation Interval and Irrigation Level on Growth, Photosynthesis, Fruit Yield, Quality, and Water-Nitrogen Use Efficiency of Drip-Fertigated Greenhouse Tomatoes (Solanum lycopersicum L.). Agronomy, 15(5), 1068. https://doi.org/10.3390/agronomy15051068