Article

Cold-Tolerance Candidate Gene Identification in Maize Germination Using BSA, Transcriptome and Metabolome Profiling

1
State Key Laboratory of Maize Bio-Breeding, Liaoning Academy of Agricultural Sciences, Shenyang 110161, China
2
College of Agronomy, Shenyang Agricultural University, Shenyang 110866, China
*
Authors to whom correspondence should be addressed.
Agronomy 2025, 15(5), 1067; https://doi.org/10.3390/agronomy15051067
Submission received: 1 April 2025 / Revised: 23 April 2025 / Accepted: 25 April 2025 / Published: 27 April 2025
(This article belongs to the Section Crop Breeding and Genetics)

Abstract

:
Exploring the characteristics of maize’s tolerance to low-temperature stress is of great significance for enhancing maize’s adaptability to such stress and for developing valuable germplasm resources. In this study, a combined analysis of genomics, transcriptomics, and metabolomics was conducted on maize 245 F7 recombinant inbred lines (RILs) to screen for candidate genes and differential metabolites controlling the cold tolerance of maize during the germination stage. Bulked segregant analysis-sequencing (BSA-seq) located four candidate regions on chromosome 1 (qSGRL1-2, qSGRL1-3, and qSGRL1-4) and chromosome 10 (qSGRL10), which altogether contained 109 candidate genes. Combined with the transcriptome sequencing results, among the genes screened by quantitative trait locus sequencing (QTL-seq), seven genes (Zm00001eb043000, Zm00001eb043620, Zm00001eb043650, Zm00001eb043680, Zm00001eb043720, Zm00001eb043400, and Zm00001eb043490) were identified as common candidate genes related to the cold tolerance of maize during the germination stage. Combined with the metabolomic analysis results, low-temperature stress induced the differential expression of relevant genes, leading to the differential accumulation of metabolites such as L-glutamic acid, 4-aminobutyric acid, and Lysophosphatidylcholine (LPC). These results enrich the information for molecular marker-assisted selection of maize tolerance to low-temperature stress and provide genetic resources for the maize varieties breeding.

1. Introduction

Maize (Zea mays L.) is an important food, feed, and industrial raw material globally. It is mainly distributed in tropical and temperate regions, and its germination and growth rely on suitable temperatures. Research has indicated that maize experiences low-temperature stress when the temperature drops below 15 °C [1]. Notably, during the early growth stage, maize is extremely sensitive to low temperatures. This sensitivity can severely impact seed germination, and seedling growth and development, diminishing seedling vitality and potentially resulting in death. Even if the temperature rises in the subsequent stages, the seedlings’ further growth may still be affected, perhaps because maize cannot rapidly adapt to favorable environmental changes [2,3,4]. In recent years, climate anomalies have led to an increasing frequency of extreme cold weather. In the higher-latitude regions of the world, cold damage caused by low temperatures occurs more often under the influence of climate change. Thus, elucidating the molecular mechanism of maize tolerance to low-temperature stress during germination has become an urgent task. This research not only provides a theoretical basis for enhancing maize’s adaptability to low-temperature stress but also contributes to the creation of crop germplasm and an increase in yield.
Low-temperature stress can cause physiological damage to plants, which is mainly manifested as internal metabolic disorders resulting from membrane damage. A key factor for plants to adapt to temperature stress is the regulation of membrane fluidity, which is determined by the unsaturated fatty acids of glycerol molecules and the relative proportions of various lipids in the lipid bilayer [5,6]. When plants are exposed to low-temperature stress, the cell membrane’s fluidity diminishes while its permeability increases. This leads to the extravasation of intracellular solutes, a reduction in mitochondrial oxidation activity, a decline in the photosynthesis rate, damage to the enzyme system, disruption in metabolic balance, accumulation of harmful substances, and the emergence of cold-injury phenotypes [7]. The molecular mechanisms underlying plants’ responses to low-temperature stress encompass the cold signaling pathway, post-transcriptional regulation, and post-translational modification. In the cold-signal regulatory pathway, CBF/DREB1 (C-repeat binding factor/Dehydration-responsive element binding factor) serves as a key regulatory factor [8,9]. Post-transcriptional mechanisms, which involve alternative splicing, mRNA precursor processing, RNA stability, RNA silencing, and nuclear export, also play pivotal roles in cold acclimation and cold tolerance [10,11,12,13,14]. The ubiquitin-proteasome pathway is crucial for many biological functions, including responses to abiotic stress [15,16].
Due to the complexity and polygenic nature of the molecular mechanism underlying maize tolerance to low-temperature stress, extensive research has been conducted on the detection and mapping of quantitative trait loci (QTL) as well as gene regulation mechanisms. For example, numerous double-haploid lines (DHs), backcross inbred lines, and recombinant inbred lines (RILs) have been developed using cold-tolerant and cold-sensitive materials, and some valuable QTLs and genes have been screened. Using the maize B73 × Mo17 (IBM) Syn10 DH population, 13 low-temperature germination ability (LTGA)-related QTLs were detected and 39 candidate genes extracted; integrated RNA-Seq and QTL-localization gene analysis identified three B73 and five Mo17 genes associated with low-temperature seed germination [17]. Transcriptome analysis of maize inbred lines Ye478 and Q1 at multiple low-temperature germination stages revealed that genes related to ribosome synthesis and the cell cycle regulated LTGA, and a QTL was mapped on chromosome 1 in their derived double-haploid population [18]. The genetic bridge MTP between maize, short-leaf maize, and perennial maize was constructed, and the introgression line IB030 with high LTGA was obtained through backcross breeding. Through QTL-seq and integrated transcriptomic analysis, two candidate genes, ZmbZIP113 and ZmTSAH1, which control LTGA, were identified [19,20]. Two cold-tolerant inbred lines, 220 and P9–10, and two susceptible lines, Y1518 and PH4CV, were used to construct three connected F2V3 populations. Forty-three QTLs were associated with LTGA [21]. The high-homozygosity RIL population, known for its high mapping efficiency and accuracy, is suitable for gene mapping and QTL analysis. Using 243 intercropped B73 × Mo17 (IBM) Syn4 RILs for LTGA QTL analysis, six QTLs controlling the low-temperature germination rate with single-QTL contribution rates from 3.39% to 11.29% were detected, and five genes were selected as potential candidates [22]. The application of genome-wide association analysis (GWAS) has also facilitated QTL mapping and has been used to identify numerous QTLs associated with low-temperature stress. GWAS of 125 inbred lines was used to investigate the genetic structure of cold tolerance at maize germination and seedling stages, detecting 43 single-nucleotide polymorphisms with none associated with both stages, suggesting different genetic bases for cold tolerance at these two stages [23]. GWAS of 222 diverse maize inbred lines, using 14 seed germination-related phenotypic traits, detected 30 SNPs (single-nucleotide polymorphisms) associated with low-temperature tolerance and identified 68 genes. Among them, Zm00001d039219 and Zm00001d034319 might participate in low-temperature signal transduction and cell-membrane fluidity via the mitogen-activated protein kinase (MAPK) signaling and fatty-acid metabolic pathways [24].
Transcriptome analysis represents a powerful and well-established methodology for comprehensively deciphering the molecular mechanisms underpinning abiotic stress responses across a wide spectrum of species. For instance, a microarray-based investigation into the transcriptome profiles of maize seedlings unveiled that the most conspicuous divergence in their responses to low temperatures manifested as the upregulation of genes encoding membrane- and cell-wall-associated proteins. Concurrently, other differentially regulated gene pathways were predominantly characterized by the suppression of multiple genes integral to photosynthesis and the activation of genes involved in fundamental biological processes, such as transcription, gene expression regulation, protein phosphorylation, and cell-wall organization [25]. The principal QTL, qp1ER1-1, identified as a key determinant of maize’s LTGA, was successfully introgressed into the cold-sensitive line PH4CV. Notably, two genes, Zm00001d031209 and Zm00001d031292, were pinpointed within the confidence interval of qp1ER1-1, highlighting their potential significance in mediating LTGA using transcriptome analysis [26]. Analyses of gene expression alterations in the radicles of DMY1 and Zhengdan958 seeds under low-temperature stress have provided evidence suggesting that the phenylpropanoid biosynthesis pathway plays a pivotal role in the plant’s response to this stress [27]. To date, various factors related to maize’s response to low-temperature stress, covering glucose metabolism, photosynthesis, secondary metabolism, circadian rhythm regulation, and cell membrane and wall components, have been identified via gene expression profiling and other molecular methods [25,28]. Additionally, low-temperature signal transduction genes such as ZmCDPK1, ZmMAPKKK, and ZmRR1 have been demonstrated to be intricately linked to maize’s cold tolerance, underscoring their importance in the complex molecular network governing the plant’s adaptation to cold stress [29,30].
Metabolites represent the terminal products of gene transcription and protein modification processes. In the face of abiotic stress, plant metabolites undergo alterations as a consequence of the interplay between genes and the environment [31]. High-throughput transcriptome sequencing and extensively targeted metabolome sequencing were employed to explore the molecular mechanisms by which maize inbred lines B144 (cold-tolerant) and Q319 (cold-sensitive) regulate seed germination under low-temperature stress. Low-temperature stress instigated the accumulation of stress-related metabolites, including amino acids and their derivatives, lipids, phenolic acids, organic acids, flavonoids, lignin, coumarins, and alkaloids. This finding implies that these metabolites play a crucial role in the low-temperature response [32]. Using maize varieties Xinxin 2 and Damin 3307 as experimental materials and incorporating proline-soaking treatments, metabolomic analysis revealed that proline enhanced low-temperature stress resistance by promoting starch and sucrose metabolism, arginine and proline metabolism, secondary metabolite biosynthesis, flavonoid biosynthesis, and the pentose phosphate pathway [33]. Waxy maize has a relatively short growth cycle and is particularly vulnerable to low temperatures during the early growth stage. Transcriptome and metabolome analyses indicated that, under low-temperature stress, the expression of certain genes associated with plant hormones and MAPK pathway was significantly upregulated, and flavonoid metabolites were also markedly enriched. These genes and their corresponding metabolites may contribute to enhancing the cold resistance of waxy maize [34].
Genetic investigations have revealed that maize cold tolerance is a quantitative trait governed by polygenes with minor effects and is highly susceptible to environmental conditions. The maize genes associated with low-temperature stress have rarely been confirmed, and their regulatory mechanisms remain poorly understood. Traditional genetic research approaches have certain limitations in uncovering the genetic basis of this trait and the molecular regulatory mechanisms of the relevant genes. Identifying the key regulatory genes for maize seed germination under low-temperature stress and elucidating their molecular mechanisms can offer theoretical and technical support for the development of maize germplasm resources with enhanced low-temperature tolerance. In this study, we explored the inheritance pattern of the maize seed germination rate under low-temperature-condition (SGRL) genes within the RIL population derived from the cross between Liao 2386 (a cold-tolerant line) and Liao 6082 (a cold-sensitive line). By integrating genomics, transcriptomics, and metabolomics, we aimed to screen for candidate genes and differential metabolites in maize in response to low-temperature stress. This research is expected to provide novel insights into the molecular regulatory mechanisms underlying maize’s low-temperature tolerance during the germination stage. Moreover, it will lay a solid theoretical and material foundation for the creation of new maize varieties with improved low-temperature tolerance.

2. Materials and Methods

2.1. Plant Materials

In this study, the cold-tolerant female parent Liao 2386 (P1) and the cold-sensitive male parent Liao 6082 (P2) were utilized as the parental lines. Through seven consecutive generations of self-crossing, a population of 245 RILs was developed. All the materials described above were sourced from the Liaoning Academy of Agricultural Sciences in Liaoning Province, China. In April 2022, the RILs were planted in three distinct plots (E1, E2, and E3) at the Shenyang test station. In each test, the parent lines and F1 generation were also planted. During the flowering stage, plants were manually self-pollinated. The seeds were harvested in September of the same year.
For the genetic analysis, phenotypic data of the SGRL were collected under controlled-environment conditions. First, 100 healthy and plump seeds were selected and disinfected with a 0.5% sodium hypochlorite solution for 5 min. Subsequently, they were rinsed three times with distilled water. After being soaked in warm water for 24 h, the seeds were transferred to petri dishes lined with wet filter paper for the germination test. The experiment employed an artificial climate incubator (Sanyo MLR-351H, Osaka, Japan) to simulate low-temperature stress. The culture environment was set at a constant temperature of 10 °C (with a control at a constant temperature of 25 °C), and a 12 h light cycle was maintained daily. The number of seeds with a radicle that protruded more than 2 mm through the seed coat was counted, and the germination rate was calculated. Four biological replicates were carried out. The germination rate (%) was calculated as follows: (the number of normally germinated seeds/the number of tested seeds) × 100%.

2.2. Construction of Segregating Pools

Leaves were collected at the three-leaf stage of maize for the extraction of total genomic DNA. The quality of the extracted DNA was assessed using the Qubit (Thermo Fisher Scientific, Waltham, MA, USA) and Nanodrop (Thermo Fisher Scientific, Waltham, MA, USA) instruments. Four DNA pools were assembled, consisting of two parent bulks and two RIL segregation bulks, for the purpose of conducting bulked segregant analysis (BSA-seq). The parent bulk T1 was formed using the DNA of the female parent (Liao 2386), while the parent bulk T2 was constructed with the DNA of the male parent (Liao 6082). The H bulk was constructed by evenly mixing the DNA of 20 individual plants with the highest SGRL phenotypic values among the RILs, while the L bulk was constructed in the same way but with the DNA of 20 individual plants that had the lowest SGRL phenotypic values among the RILs.

2.3. BSA-Seq and QTL-Seq Analysis

Total genomic DNA was extracted from the bulks. For each bulk, at least 3 μg of genomic DNA was utilized to construct paired-end libraries with an insert size of 500 bp, employing the Paired-End DNA Sample Prep kit (Illumina Inc., San Diego, CA, USA). These libraries were then sequenced on the Illumina NovaSeq 6000 (Illumina Inc., San Diego, CA, USA) platform at Genedenovo company (Guangzhou, China). The raw reads underwent processing to obtain high-quality clean reads, following three strict filtering criteria: (1) reads containing ≥ 10% unidentified nucleotides were removed; (2) reads with >50% of bases having phred quality scores of ≤20 were discarded; and (3) reads that aligned with the barcode adapter were eliminated.
To identify SNPs and insertions and deletions (indels), the filtered reads were aligned to the public reference genome (https://www.maizegdb.org/ (accessed on 20 July 2023)) using the Burrows-Wheeler Aligner (BWA, v0.7.16a-r1181) [35]. Variant calling was performed with GATK Unified Genotyper (v3.5). SNPs and indels were then filtered using the GATK Variant Filtration function. All mutations were annotated for genes, functions, and genomic regions by means of ANNOVAR 20230720 [36]. Several additional criteria were applied for further marker filtering: (1) Markers with a segregation type inconsistent with the population type were excluded. (2) Markers with any missing genotype information were removed. (3) Markers with a read depth < 10× or >500× in each bulk were excluded. This was done to eliminate those with low confidence due to low coverage (the ratio of the total amount of bases obtained from sequencing to the size of the genome), as well as those potentially located in repetitive regions, which could result in inflated read depths. (4) Markers with an SNP-index in both bulks either <0.3 or >0.7 were excluded. Four calculation models were employed for QTL-seq analysis based on the SNPs. These models included Δ(SNP-index) [37], G′ value [38,39], Euclidean distance [40], and Fisher’s exact test [41].

2.4. Bulked Segregant RNA-Seq Analysis

To analyze the impact of low-temperature stress on the transcription levels of the parental lines (P1 and P2) and their RILs, seeds of P1, P2, and two lines with the lowest and highest phenotypic values respectively in the RILs were collected after 24 h of exposure to low temperature. These served as materials for transcriptome analysis. The low-temperature treatment procedure was identical to that described in “Section 2.1”. Total RNA was extracted using the RNA plant Plus Reagent Kit (TIANGEN, Beijing, China) following the manufacturer’s instructions. Three biological replicates were prepared for each sample.
The extracted mRNA was enriched with mRNA Capture Beads. Following purification with the beads, the mRNA was fragmented by high-temperature treatment. The fragmented mRNA then served as a template for synthesizing the first strand of cDNA within a reverse transcription enzyme mixture system. During the synthesis of the second strand of cDNA, end-repair and A-tailing were simultaneously completed. Subsequently, adapters were ligated. PCR library amplification was then conducted, and finally, detection was performed using the Illumina HiSeq 2500 platform. The reads were further filtered by fastp (version 0.18.0) [42] to obtain high-quality clean reads. The filtering parameters were as follows: (1) reads containing adapters were removed; (2) reads with more than 10% unknown nucleotides were discarded; and (3) low-quality reads with more than 50% low-quality (q-value ≤ 20) bases were eliminated. An index of the reference genome was constructed, and the paired-end clean reads were mapped to the reference genome using HISAT2 2.1.0 [43]. Differentially expressed genes (DEGs) were identified using p < 0.05 and a fold-change > 2 or a fold-change < 0.5 as the thresholds [44].

2.5. Metabolomics Analysis

Maize seeds from P1, P2, and two lines with the lowest and highest phenotypic values in the RIL were gathered after 24 h of exposure to low temperature. These seeds served as materials for metabolomics analysis, which was carried out by Genedenovo Biotechnology Co., Ltd. (Guangzhou, China). The analysis utilized an LC-ESI-MS/MS system (HPLC: Shim-pack UFLC SHIMADZU CBM30A system; MS: Applied Biosystems 6500 Q TRAP, Waltham, MA, USA), with a waters ACQUITY UPLC HSS T3 C18 column. The ion spray voltage (IS) was set at 5500 V and the curtain gas (CUR) pressure was set at 25 psi.
To preliminarily visualize the differences among different groups of samples, the unsupervised dimensionality reduction method, principal component analysis (PCA), was applied to all samples using the R package (http://www.r-project.org/ (accessed on 20 July 2023)). In the OPLS-DA model, a variable importance in projection (VIP) score was utilized to rank the metabolites that most effectively differentiated between two groups. The VIP threshold was set at 1. Furthermore, a t-test was employed as a univariate analysis for screening differential metabolites. Metabolites with a t-test p-value < 0.05 and VIP ≥ 1 were regarded as differential metabolites between the two groups. The abundance of differential metabolites within the same group was normalized using the z-score. Subsequently, the VIP score of OPLS-DA was used to generate a graph. The top 15 metabolites, presented in descending order, are shown in the variable importance in projection (VIP) score plot [45].

3. Results

3.1. Statistical Analysis of Phenotypes of Maize’s SGRL

Two maize inbred lines, Liao 2386 with an average SGRL of 85.22% and Liao 6082 with an average SGRL of 14.44%, were selected as parents. A RIL population consisting of 245 individuals was generated through continuous self-crossing of the parents. The SGRL of this RIL population was investigated across three different environments. A frequency distribution histogram was constructed, and the results are presented in Table 1. The SGRL values of the majority of individuals within the RIL population fell between those of the tested parents, demonstrating a continuous distribution pattern. Overall, the character distribution exhibited relatively large variations, suggesting the possible existence of major genes governing the SGRL.

3.2. Sequencing Data Analysis of Four DNA Bulks

BSA-seq analysis was conducted using the DNAs of four bulks (P1, P2, H, and L) on the Illumina NovaSeq 6000 platform at GENE DENOVO (Guangzhou, China). In total, 2008.54 million clean reads were generated, with approximately 495.83 million reads for P1, 496.09 million reads for P2, 544.04 million reads for H, and 472.59 million reads for L. After filtering, the effective data of the four bulks ranged from 70.89 to 81.61 Gb. The Q20 value exceeded 96%, the Q30 value exceeded 90%, and the GC base content ranged from 46.29% to 48.08%. The clean reads were mapped to the reference maize genome Ensembl release56 (https://www.maizegdb.org/ (accessed on 20 July 2023)). The mapping results indicated that the coverage depths for the P1, P2, H, and L bulks were 34×, 34×, 37×, and 33×, respectively. The alignment efficiency of this sequencing was at least 98.76%, and the reads were perfectly matched to the genomes with an efficiency of at least 83.51% (Table 2).
A total of 9,067,031 SNPs and 987,960 indels were identified across all 10 chromosomes. The number of SNPs identified in the P1, P2, H, and L bulks were 5,951,422, 4,351,073, 7,324,014, and 7,265,497, respectively. Among these, 178,817, 117,296, 207,575, and 207,144 SNPs were located in the exon regions; 178,190, 121,119, 213,170, and 213,755 SNPs were located within 1 Kb upstream of the transcription start site; and 85,258, 56,507, 99,176, and 98,824 SNPs led to non-synonymous mutations. The numbers of indels identified in the P1, P2, H, and L bulks were 689,385, 484,007, 837,490, respectively. Among these indels, 16,145, 10,774, 18,738, and 18,607 were located in the exon regions; 45,261, 30,557, 53,886, and 53,752 were located within 1 Kb upstream of the transcription start site; and 4987, 3532, 5962, and 5899 indels caused frameshift deletion and frameshift insertion mutations (Table S1). Through detection, the study obtained a large number of SNPs and indels, indicating that there is rich genetic variation among different materials in this study. This variation may be related to the specific biological functions of genes. The distribution of SNPs and indels in different regions provides clues to gene functions and regulation. SNPs and indels located in the exon regions may directly affect the coding sequences of proteins. SNPs and indels located in the region 1 Kb upstream of the transcription start site may be involved in the regulation of gene expression.

3.3. QTL-Seq Analysis

The values of Δ(SNP-index), G′ value (G-statistic), Euclidean distance, and Fisher’s exact test were employed to delimit the association intervals for the SGRL. In total, 44, 43, 40, and 14 QTL regions were identified using an association threshold of 95% by the four calculation models, respectively. Meanwhile, when the association threshold was set at 99%, 13, 8, 5, and 4 QTL regions were detected by these four models. The QTL regions identified at the 95% association threshold were mapped to chromosomes 1, 2, 3, 7, 9, and 10, while those at the 99% association threshold were mapped to chromosomes 1 and 10 (Table 3). Regarding chromosome 1, four genomic regions, denoted qSGRL1-1, qSGRL1-5, qSGRL1-6, and qSGRL1-7, were obtained at the 95% significance level, and three genomic regions, namely qSGRL1-2, qSGRL1-3, and qSGRL1-4, were identified at the 99% significance level. For chromosome 2, three genomic regions, designated qSGRL2-1, qSGRL2-2, and qSGRL2-3, were obtained at the 95% significance level. At the 95% significance level, three additional genomic regions were revealed: qSGRL3 (231.1–232.1 Mb) on chromosome 3, qSGRL7 (173.0–176.2 Mb) on chromosome 7, and qSGRL9 (155.1–157.1 Mb) on chromosome 9, all associated with SGRL. Another genomic region associated with SGRL at the 99% significance level was qSGRL10 (2.9–3.9 Mb) on chromosome 10. Since the peak values obtained at the 99% significance level were greater than those at the 95% significance level, we concentrated on the QTL intervals detected by all calculation models when a 99% confidence interval (CI) critical value was applied. However, when the 99% CI critical value was used, only two high-peak values were observed on chromosomes 1 and 10. These encompassed four QTL intervals, namely qSGRL1-2, qSGRL1-3, qSGRL1-4, and qSGRL10. Therefore, these four QTL intervals were regarded as the most significantly associated with the target trait (Table S2).

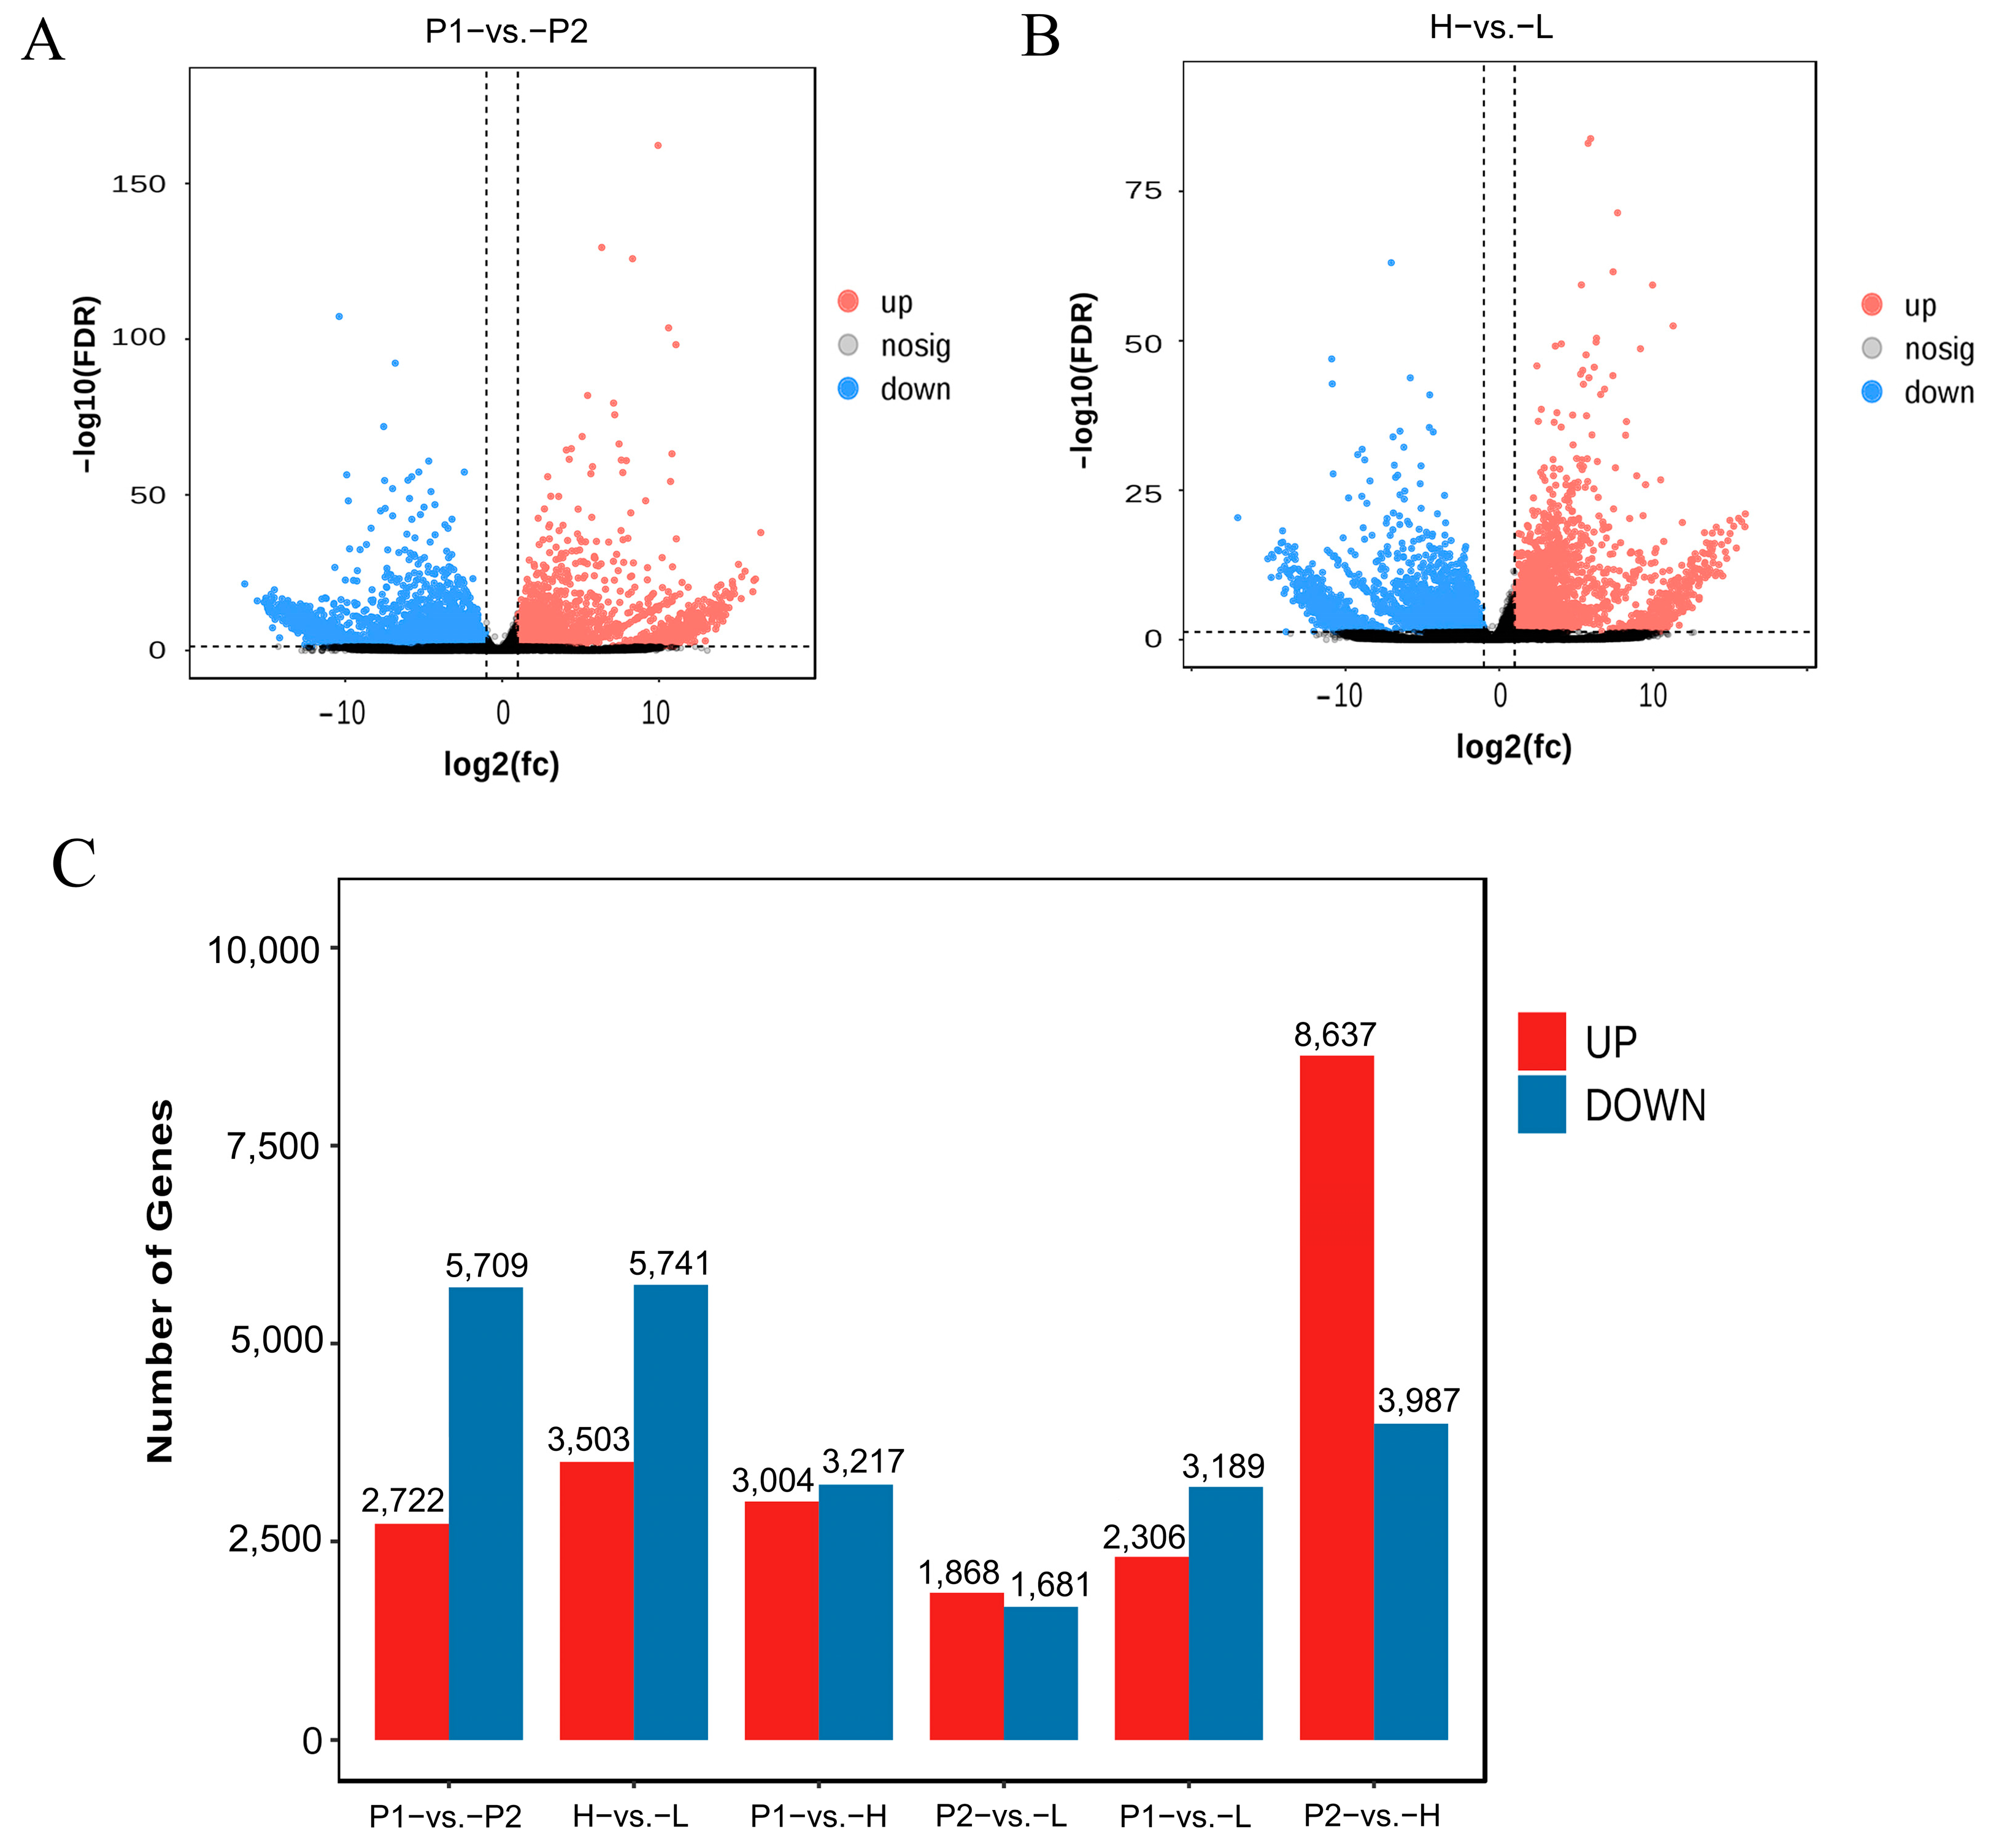
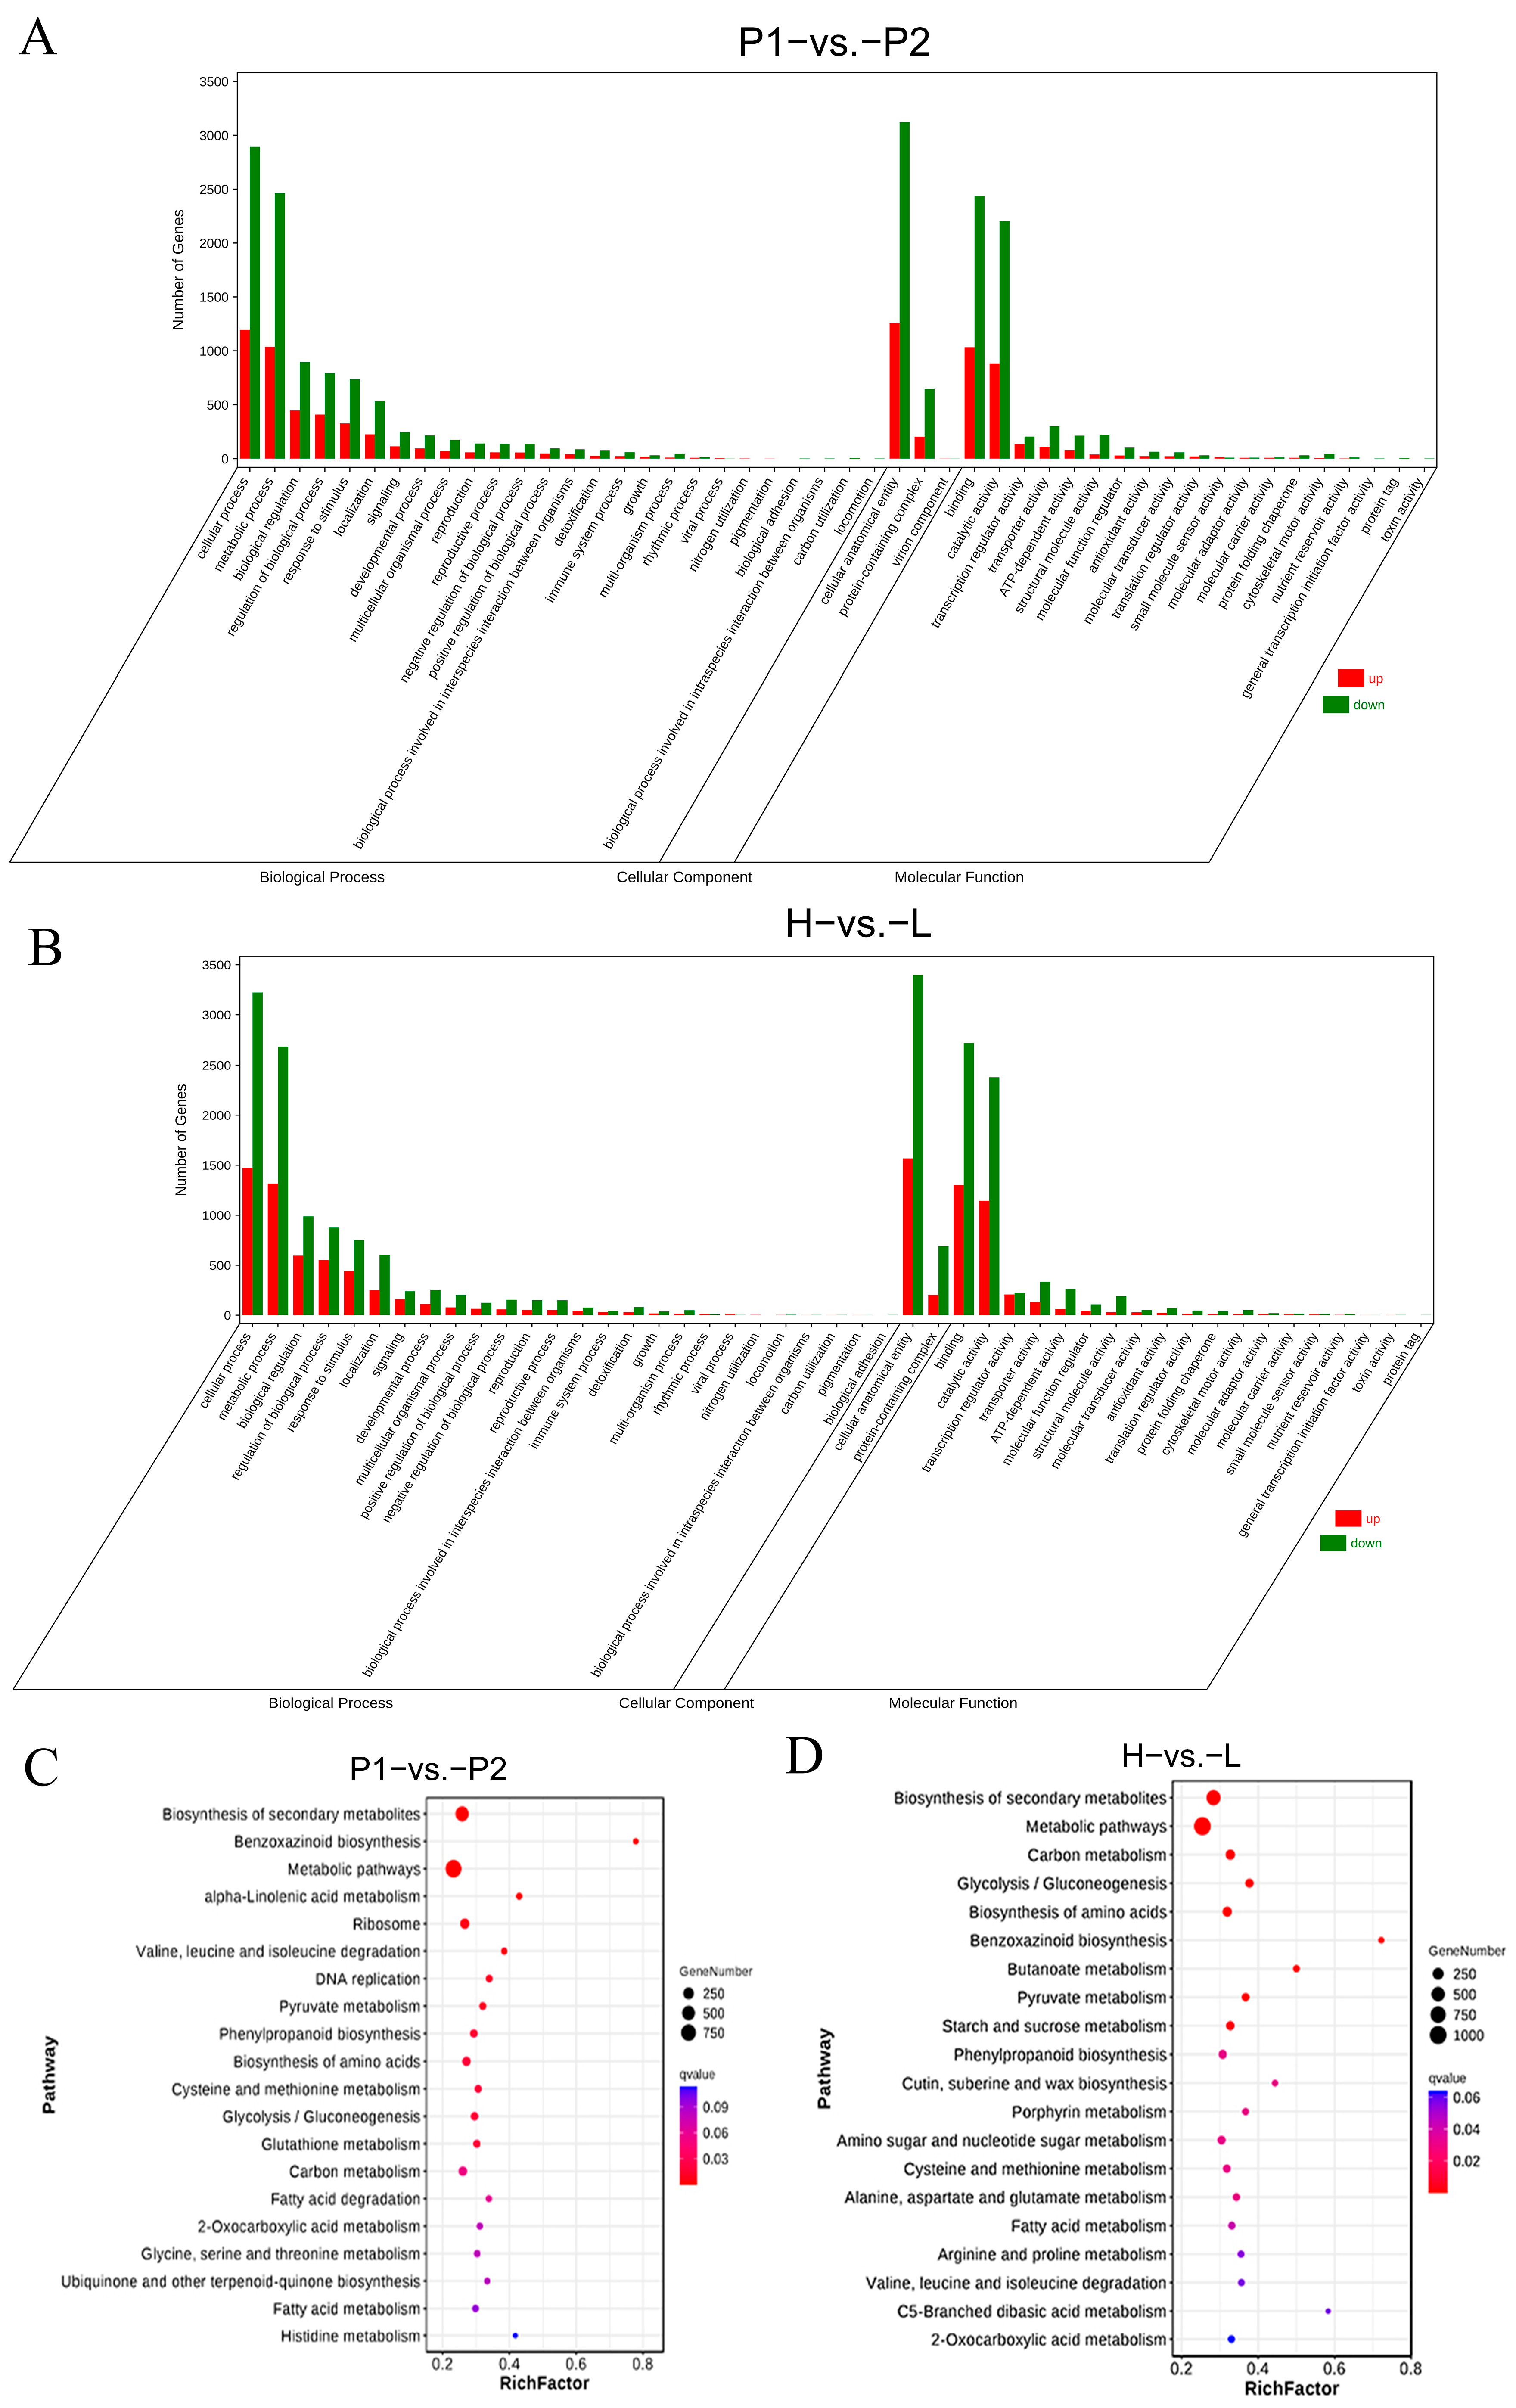
3.4. Transcriptome Analysis

To gain insights into the differentially expressed genes in response to low temperature, transcriptomic sequencing was carried out on four cDNA sequencing bulks (P1, P2, H, and L) using the Illumina NovaSeq 6000 platform. After quality control and filtering of the raw reads, the parent bulks yielded over 39.10 million and 40.66 million clean reads, respectively. Each of the two RIL segregation bulks generated over 40.90 million and 42.69 million clean reads per sample. The clean reads could be precisely mapped to the maize B73 v4 reference genome (https://www.maizegdb.org/ (accessed on 20 July 2023)) with a mapping efficiency of over 90.71% for each sample (Table S3).
Genes with a log2 fold change of ≥1 and an adjusted p-value of ≤0.05 were analyzed. Among these, a total of 35,741 genes were expressed across the 12 analyzed samples. On average, 28,690, 26,710, 29,390, and 27,126 genes were detected in the P1, P2, H, and L bulks, respectively. Using the DESeq2 software, a total of 8431 genes were identified as differentially expressed between the P1 and P2 bulks. Specifically, 2722 genes were significantly upregulated, while 5709 were significantly downregulated. Additionally, between the H and L bulks, 9244 genes exhibited differential expression patterns, with 3503 genes being upregulated and 5741 genes being downregulated (Figure 1).
To delve deeper into the key genes involved in the regulation of the SGRL, Gene Ontology (GO) terms and Kyoto Encyclopedia of Genes and Genomes (KEGG) pathways were utilized to functionally annotate the differentially expressed genes (DEGs) among the sequencing bulks. The DEGs were classified into three major GO categories: biological process, molecular function, and cellular component. A substantial proportion of the DEGs fell within the biological process category and were enriched in 26 sub-clusters. The GO terms under biological processes predominantly encompassed the regulation of cellular processes, metabolic processes, biological processes, response to stimuli, localization, signaling, developmental processes, and multicellular organismal processes. Between P1 and P2, only three cellular component terms were enriched: cellular anatomical entity, protein-containing complex, and virion component. Between H and L, two cellular component terms were enriched: cellular anatomical entity and protein-containing complex. The enriched molecular function terms mainly included binding, catalytic activity, transcription regulator activity, ATP-dependent activity, and structural molecule activity (Figure 2A,B). The enrichment analysis of KEGG pathways among the DEGs uncovered several biological processes relevant to SGRL. For the P1 and P2 bulks, the DEGs were assigned to 132 KEGG pathways, with the number of genes associated with each pathway ranging from 1 to 911. When the p-value ≤ 0.05, 29 pathways were significantly enriched; when the q-value ≤ 0.05, 13 pathways were significantly enriched. These included the biosynthesis of secondary metabolites, benzoxazinoid biosynthesis, metabolic pathways, alpha-Linolenic acid metabolism, ribosome, and valine, leucine, and isoleucine degradation. For the H and L bulks, the DEGs were assigned to 134 KEGG pathways, with the number of genes per pathway ranging from 1 to 1000. When the p-value ≤ 0.05, 30 pathways were significantly enriched; when the q-value ≤ 0.05, 16 pathways were significantly enriched. These included the biosynthesis of secondary metabolites, carbon metabolism, glycolysis/gluconeogenesis, biosynthesis of amino acids, benzoxazinoid biosynthesis, and butanoate metabolism (Figure 2C,D).

3.5. Association Analysis of QTL-Seq and Transcriptome Data

Based on the QTL-seq results, the three candidate intervals on chromosome 1, namely qSGRL1-2, qSGRL1-3, and qSGRL1-4, were narrowed down to regions of 1 Mb, 1 Mb, and 1.8 Mb, respectively. These intervals collectively contain 79 genes. Taking into account the overlapping intervals identified by the four calculation models, qSGRL10 was refined to a 1 Mb region, which harbors 30 predicted genes. When integrating the results of transcriptome analysis with those of QTL-seq, a total of seven genes were found to be differentially expressed in the comparative analysis between the two groups (P1 and P2, H and L) among the genes predicted by QTL-seq. Notably, all of these genes were located within the QTL intervals on chromosome 1. Specifically, the genes Zm00001eb043000, Zm00001eb043620, Zm00001eb043650, Zm00001eb043680, and Zm00001eb043720 encode Phosphofructose kinase 2, Cytochrome P450, Tasselless1, Kinesin-like protein, and Zinc finger CCCH domain-containing protein, respectively. The other two genes, Zm00001eb043400 and Zm00001eb043490, encode proteins involved in ATP hydrolysis and UDP synthesis, respectively (Table 4).

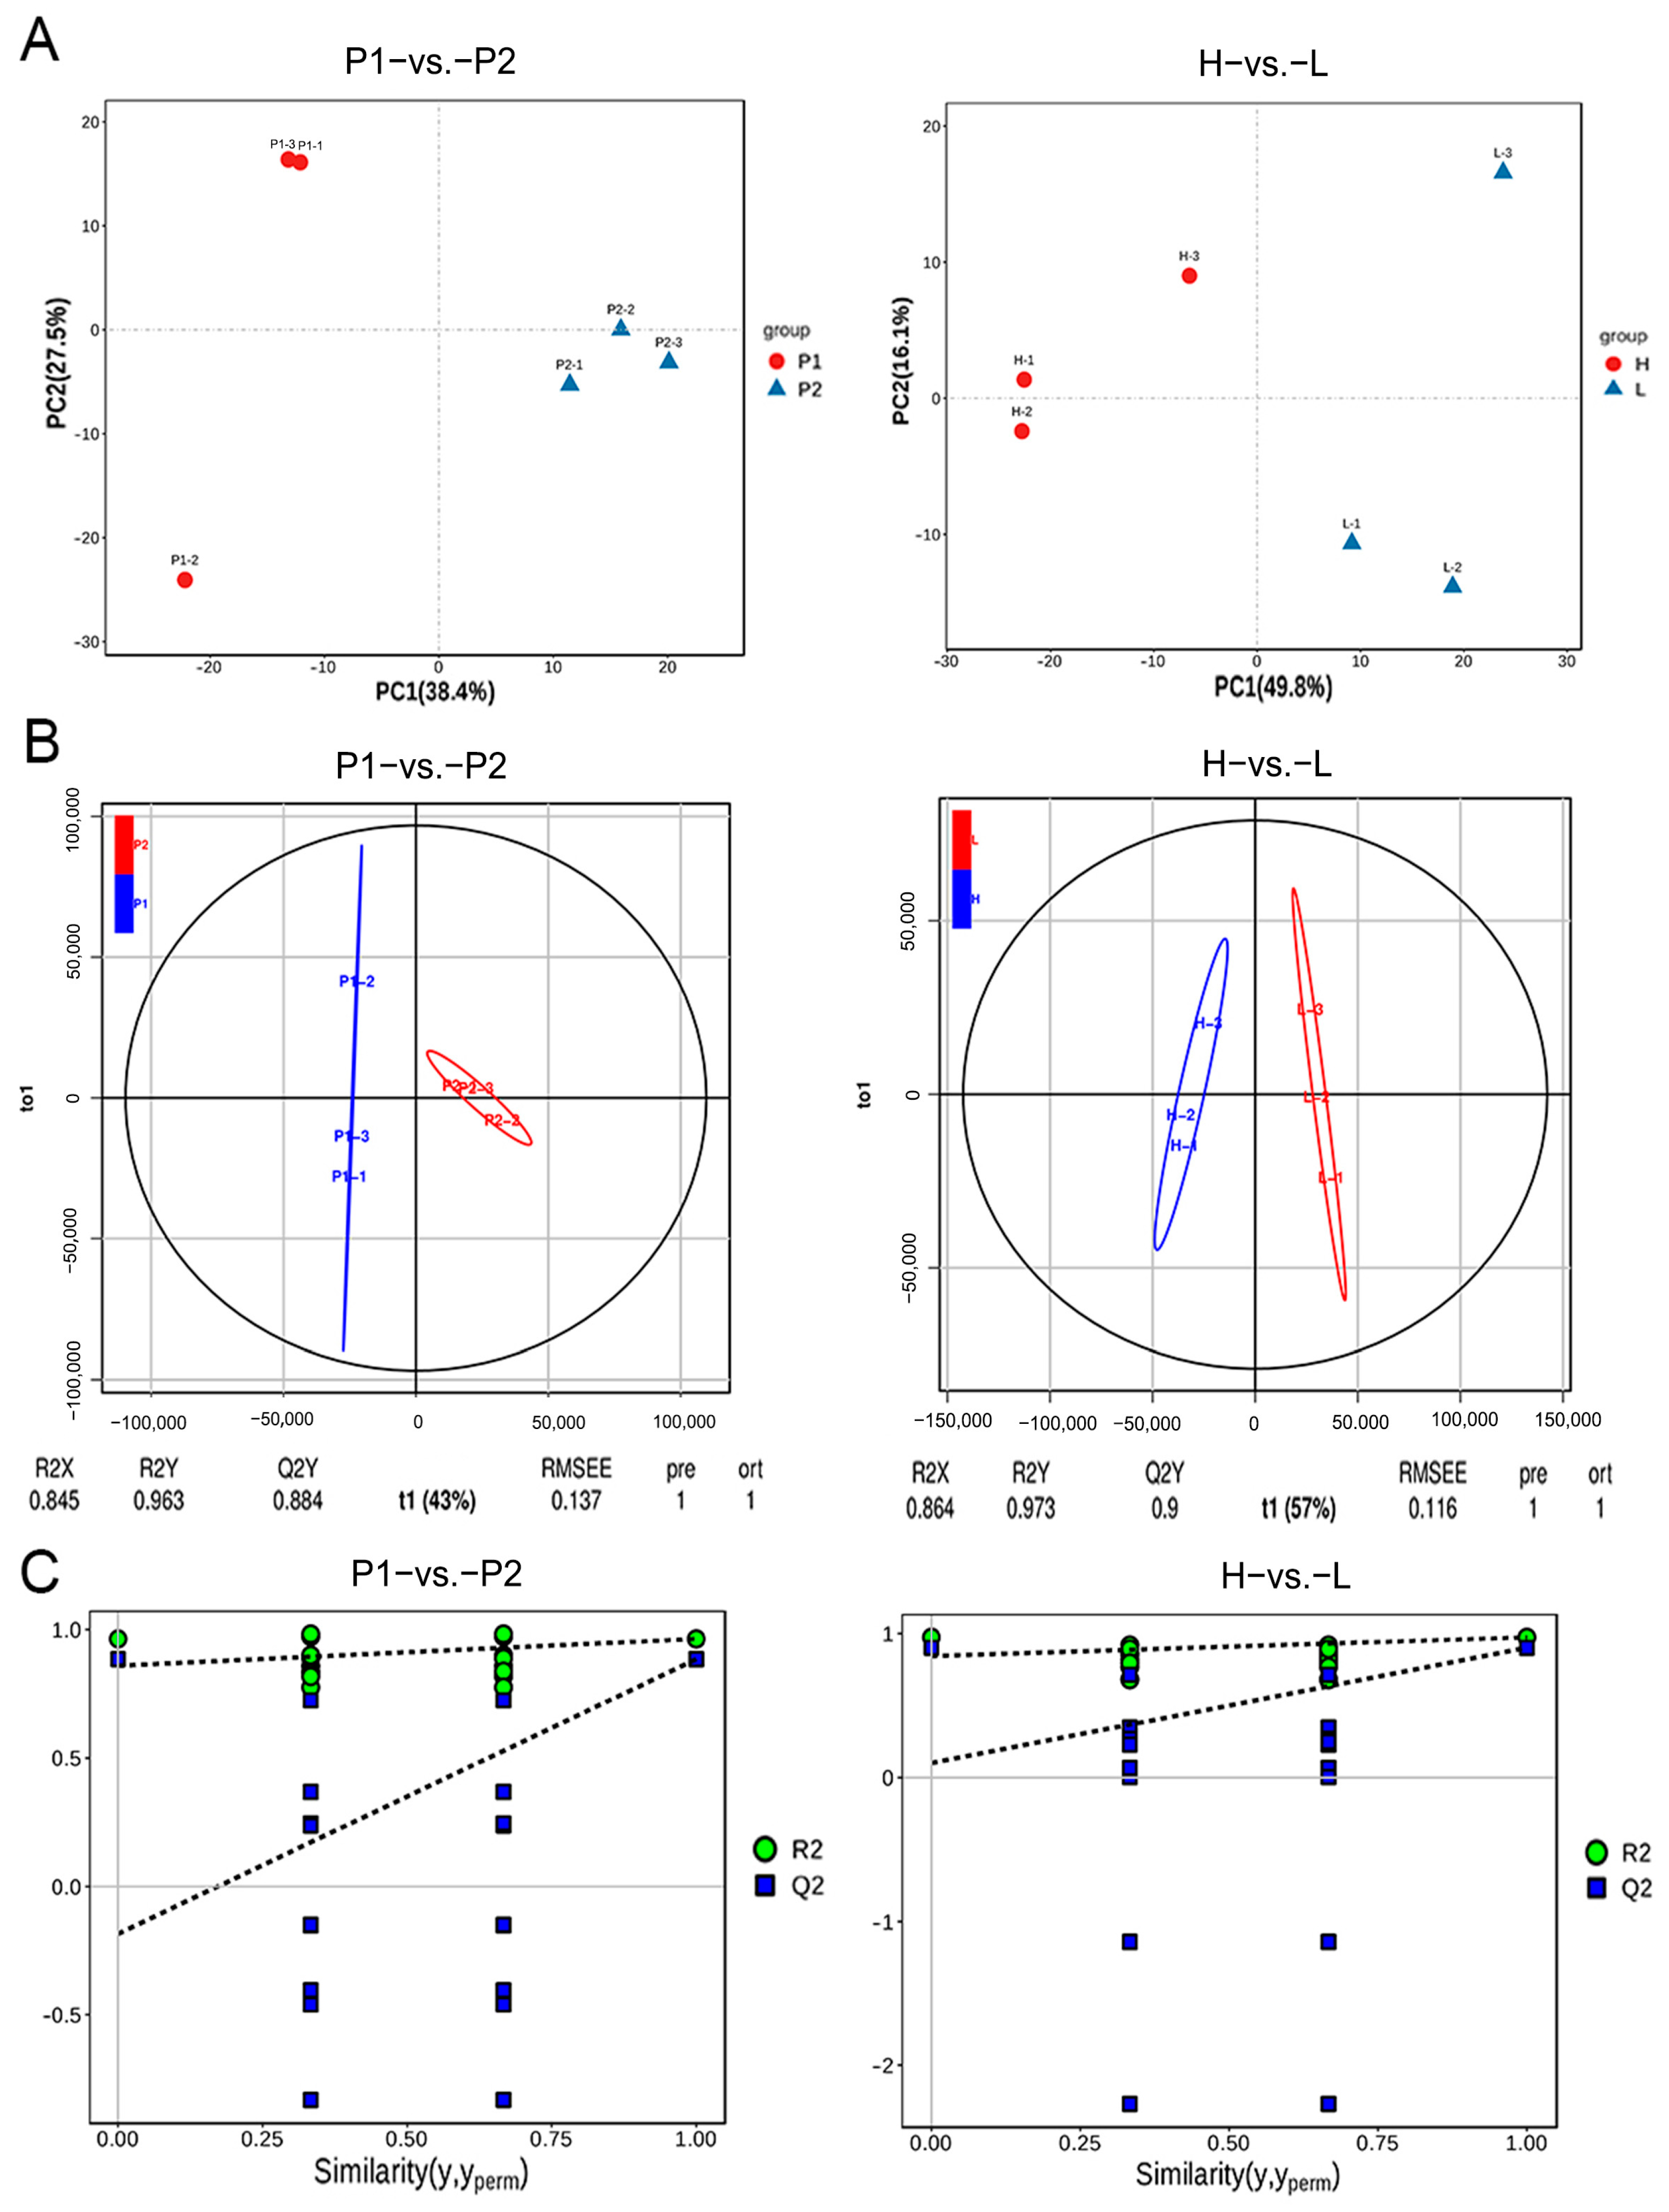
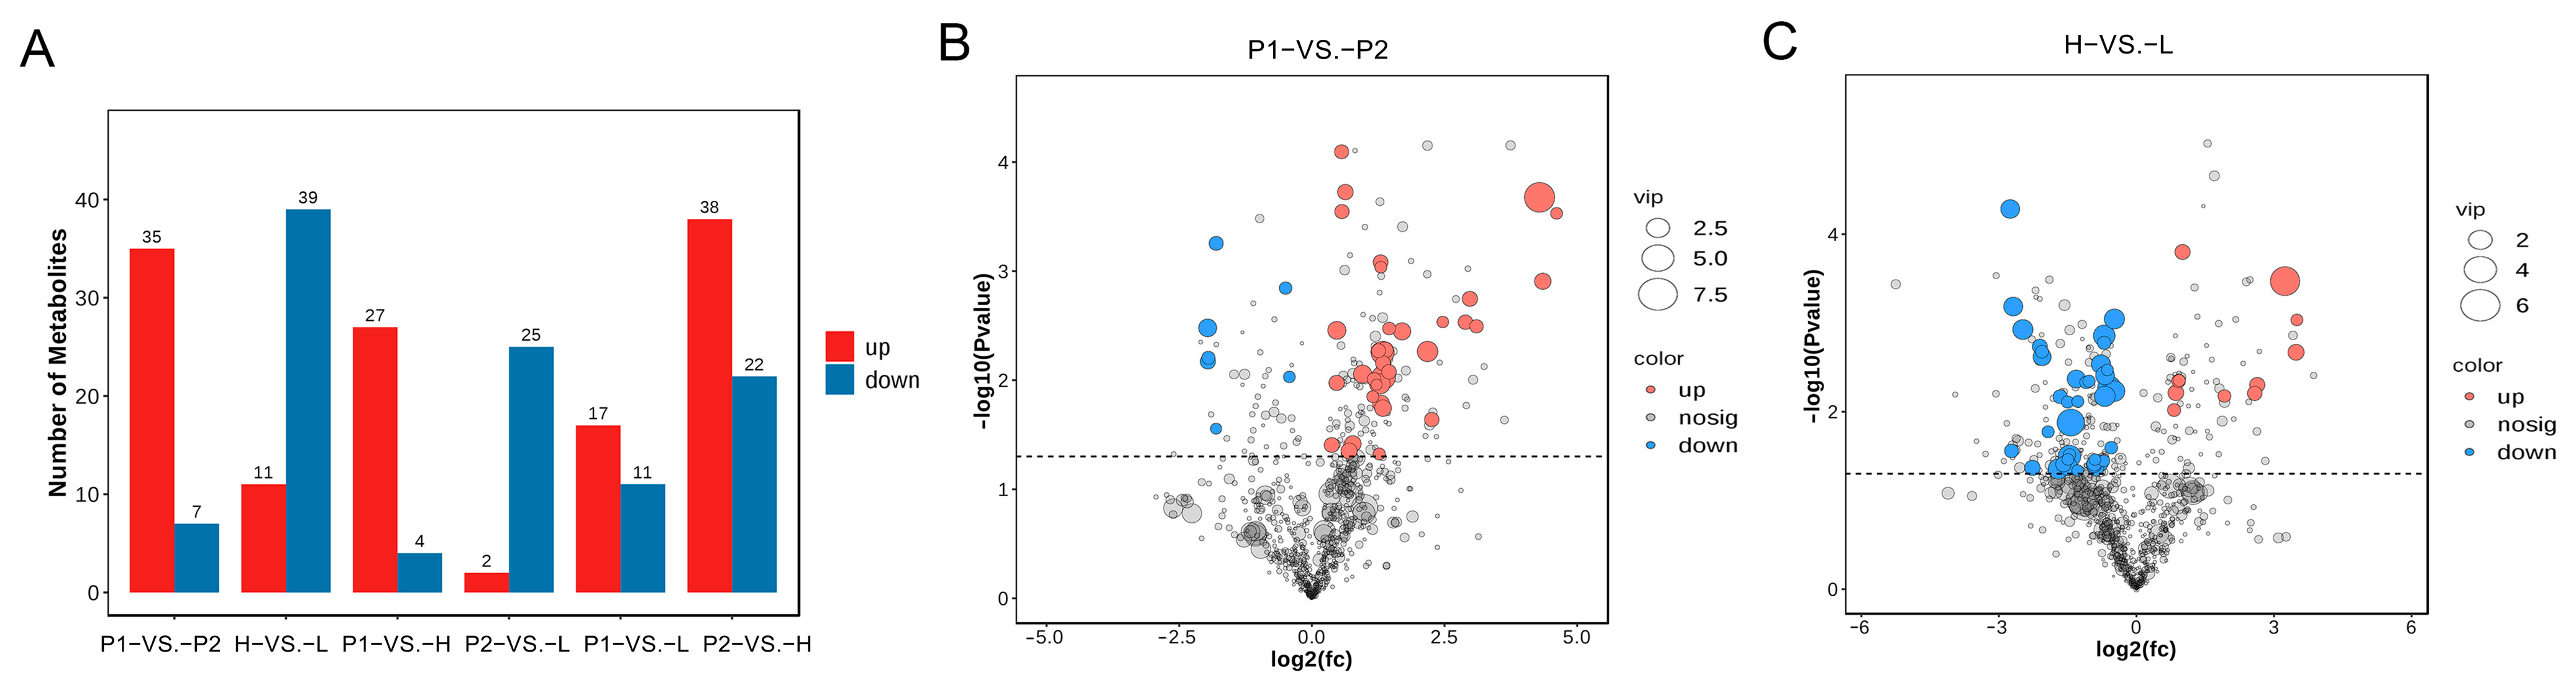
3.6. Metabolomic Analyses

To uncover the metabolic disparities among the P1, P2, H, and L bulks during the seed germination stage under low-temperature conditions, metabolomic analyses were conducted on 12 samples (with three replicates per material). Principal component analysis (PCA) was used to clarify the overall intra-group and inter-group metabolic differences within and among the P1, P2, H, and L groups. In the comparative analysis between P1 and P2, the first principal component (PC1) accounted for 38.4% of the variance, and the second principal component (PC2) accounted for 27.5% of the variance. When comparing H and L, PC1 accounted for 49.8% and PC2 accounted for 16.1%. The significant differences between the groups indicate that low-temperature stress significantly induced changes in metabolites (Figure 3A). Metabolites associated with maize seed germination under low-temperature stress were identified using orthogonal partial least-squares discriminant analysis (OPLS-DA). For the P1 and P2 pair, the OPLS-DA scores, including R2X, R2Y, and Q2Y, were 0.845, 0.963, and 0.884, respectively. For the H and L pair, the R2X, R2Y, and Q2Y scores were 0.864, 0.973, and 0.9, respectively (Figure 3B). To assess the reliability of the OPLS-DA model, cross-validation and permutation tests were performed. The cross-validation results indicated that R2X, R2Y, and Q2 were all close to 1, verifying the stability and significance of the model. This also confirmed that metabolite levels were influenced by low-temperature stress (Figure 3C and Table 5).
Differentially expressed metabolites (DEMs) between different comparison groups were identified through a combination of multivariate statistical analysis based on the variable importance in projection (VIP) value (VIP ≥ 1) from OPLS-DA and univariate statistical analysis using the t-test (p < 0.05). Under low-temperature stress, a total of 42 DEMs were detected between the parental materials P1 and P2. Among these, 35 DEMs were upregulated, and 7 were downregulated. Additionally, between the RIL population materials H and L, 50 DEMs were identified, with 11 being upregulated and 39 being downregulated (Figure 4A). To gain a deeper understanding of the variation in the abundance of differential metabolites, fold-change values were calculated. Subsequently, a volcano plot of differential metabolites was generated based on the VIP value and p-value. The results clearly demonstrated that low-temperature stress led to alterations in metabolite accumulation (Figure 4B,C).
The differential metabolites between P1 and P2 were primarily classified into 10 categories. Among these, the most variable categories were predominantly amino acids and their derivatives, lipids, and organic acids and their derivatives, with the majority of the differential metabolites in these categories being upregulated. The differential metabolites between H and L were also mainly classified into 10 categories. The most variable categories were mainly amino acids and their derivatives, carbohydrates and their derivatives, and lipids. In this case, most of the differential metabolites were downregulated. Notably, carbohydrate metabolites did not exhibit significant differences between P1 and P2 (Table 6).
The enrichment of KEGG pathways was carried out to annotate and characterize the differential substances that were enriched in various pathways related to SGRL. For the parental materials P1 and P2, the differentially expressed metabolites (DEMs) were assigned to 56 KEGG pathways, with the number of metabolites associated with each pathway ranging from 1 to 18. In the comparison of P1 and P2 DEMs, a total of twenty pathways were identified. These included alanine, aspartate and glutamate metabolism, butanoate metabolism, glyoxylate and dicarboxylate metabolism, taurine and hypotaurine metabolism, and nicotinate and nicotinamide metabolism. Regarding the RIL population materials H and L, the DEMs were assigned to 162 KEGG pathways, with the number of metabolites per pathway ranging from 1 to 23. Compared to the differential metabolites between P1 and P2, the identified pathways not only encompassed butanoate metabolism, alanine, aspartate, and glutamate metabolism, and glyoxylate and dicarboxylate metabolism, but also included galactose metabolism, ABC transporters, and nitrogen metabolism (Figure 5A).
Based on the OPLS-DA model, a variable-importance projection (VIP) plot was constructed to illustrate the significance of differential metabolites and their respective contributions. In the P1, P2, H, and L materials, the variations in the top 15 DEMs could account for the resistance of maize seeds to low-temperature stress during germination. Among the differential metabolites between P1 and P2, 14 DEMs were highly accumulated in P2, while 1 DEM was highly accumulated in P1. Among the differential metabolites between H and L, 14 DEMs were highly accumulated in H, and 1 DEM was highly accumulated in L. Specifically, after low-temperature stress, L-glutamic acid and LPC were highly accumulated in P2, and 4-aminobutyric acid was highly accumulated in P1. Additionally, when compared with L, except for the low accumulation of L-glutamic acid in the H material, all other DEMs were highly accumulated (Figure 5B).

4. Discussion

In recent years, although the planting area and yield of corn in China have generally shown an upward trend, global climate change has spurred the northward shift of crop climate zones, as statistics indicate that over the past 30 years, the northern boundary of spring-corn planting in China has shifted northward by 158.3–285.8 km [46], and the expanding crop-planting area has heightened the uncertainty and instability of agricultural production. As a crop native to tropical and subtropical regions, corn growth is significantly influenced by temperature variations. Abnormally low temperatures during the sowing period pose a serious threat to corn seed germination and seedling growth, emerging as the primary climatic limiting factor in spring-sown corn production [1]. The response of crops to stress is an intricate process, regarded as a quantitative trait regulated by minor-polygenes and highly susceptible to environmental factors. With the advancement of molecular marker technology, certain headway has been made in the genetic research on crop stress resistance. Notable progress has been achieved in the QTL mapping research of key resistance traits such as drought resistance and salt tolerance in crops. Although numerous studies exist on the genetic mechanisms and QTL mapping of crops under low-temperature stress, they are predominantly concentrated on crops like rice, wheat, and soybean [47,48,49]. In contrast, there are relatively few reports on the QTL mapping of cold-tolerance quantitative traits in maize. To expeditiously study the genetic control of agronomic traits, BSA and BSR (bulked segregant RNA-Seq) techniques have been developed and applied. The integration of these two methods, when compared to traditional gene-mapping approaches, substantially shortens the research cycle and enhances research efficiency [50,51], furnishing a potent tool for the rapid exploration of cold-tolerant genes in maize.
In this study, to accurately map QTLs related to maize cold tolerance during germination, we used multiple methods. We first phenotyped an RIL population under low- temperature conditions, then conducted QTL-seq analysis with two DNA pools of different cold-tolerance phenotypes and applied four bioinformatics methods to map QTL regions at a 99% significance level. Finally, significant peaks were detected on chromosomes 1 and 10, named qSGRL1-2, qSGRL1-3, qSGRL1-4, and qSGRL10, respectively. Combining transcriptome sequencing results, seven genes were screened. Among them, the gene Zm00001eb043000 encodes PFK-2, a protein with a crucial role in plant growth and development. During cellular glycolysis, PFK-2 catalyzes the phosphorylation of fructose-6-phosphate (F6P), yielding fructose-2,6-bisphosphate (F-2,6-BP). F-2,6-BP serves as a potent allosteric activator of phosphofructokinase 1 (PFK-1), enhancing its activity and accelerating the glycolysis process. Glycolysis is an essential metabolic pathway in plant cells, facilitating the breakdown of glucose into pyruvate, which generates energy (ATP) and intermediate metabolites. These products provide the energy and material basis for plant growth, development, and various physiological activities. In the context of seed germination, PFK-2 is vital for mobilizing stored carbohydrates, such as starch, in seeds. By initiating and regulating the glycolysis pathway, it breaks down starch into monosaccharides like glucose. This process supplies energy and carbon sources for seed germination, promoting embryo growth and development, and enabling the seed to rupture the seed coat and enter a new growth phase [52]. Research indicates that the activity of PFK-2 in plant cells may be altered in a low-temperature environment. Through the regulation of metabolic pathways like glycolysis, it can further modulate the sugar metabolism level within the plant [53,54]. In this study, low temperature induced differential expression of the PFK-2 gene in materials with varying cold-tolerance levels. Thus, it is hypothesized that low temperature affects the activity of PFK-2 during seed germination, disrupting the glycolysis process and altering the accumulation of certain carbohydrates, such as sucrose and glucose. These carbohydrates can influence plant cold tolerance by regulating the freezing point of the intracellular solution. During glycolysis, ATP is hydrolyzed to ADP, providing a phosphate group that activates glucose for entry into the glycolytic pathway. The conversion of fructose-6-phosphate to fructose-1,6-bisphosphate, catalyzed by phosphofructokinase-1, also requires ATP hydrolysis for phosphate group and energy supply. In this study, the screened gene Zm00001eb043400 exhibits ATP hydrolysis activity. Therefore, it is likely that this gene is also involved in the glycolysis metabolic pathway during seed germination under low-temperature stress.
Kinesin-like proteins belong to a class of proteins possessing motor activity, and they are actively involved in plant growth, development, and various cellular physiological processes. These proteins are capable of transporting diverse organelles along microtubule tracks, thereby guaranteeing their proper positioning and distribution within the cell. Additionally, Kinesin-like proteins play a crucial role in the transport of vesicles from the donor membrane to the receptor membrane. This function has a significant impact on substance secretion, signal transduction, and membrane renewal in plant cells. When plants are subjected to stress conditions such as drought, low temperature, and salt stress, the expression and activity of Kinesin-like proteins often undergo changes to assist plants in adapting to these adverse circumstances. They can enhance a plant’s stress resistance by regulating intracellular substance transport and signal transduction [55]. In this study, we identified a gene encoding a Kinesin-like protein (Zm00001eb043680). Drawing on the functions of Kinesin-like proteins in plants as elucidated in previous research, we postulated that during the germination of maize seeds under low-temperature stress, these Kinesin-like proteins might be engaged in transporting certain proteins associated with osmotic regulation and antioxidant defense to specific organelles or regions within the cell. Consequently, this could enhance the low-temperature tolerance of maize during the germination stage.
Zinc finger CCCH domain-containing proteins play a pivotal role in plants, being implicated in diverse processes such as the establishment of plant growth morphology, regulation of flowering, and seed germination. Under abiotic stress, particularly low-temperature conditions, the expression of certain proteins with the CCCH-type Zinc finger domain is induced. These proteins can bind to specific RNA or DNA sequences, thereby regulating the expression of stress-related genes, engaging in the plant’s low-temperature tolerance mechanism, and enhancing the plant’s resilience to low-temperature environments. A prior investigation analyzed the physiological, biochemical, transcriptomic, and metabolomic profiles of apples during endodormancy and ecodormancy. It unveiled the key pathways through which apples respond to low-temperature stress and identified genes encoding Zinc finger CCCH domain-containing proteins that are part of the network regulation pathways governing apples’ response to low-temperature stress [56]. Research on tomatoes has also shown that the expression of the gene SlC3H39, which encodes a tandem CCCH-type Zinc finger protein responsive to low temperatures, is significantly upregulated upon low-temperature induction. The accumulation of its corresponding protein increases in a low-temperature milieu. SlC3H39 binds to the motif in the 3′ untranslated region (3′UTR) of the mRNAs of low-temperature-responsive genes, mediating the degradation of these mRNAs and thus orchestrating the balance between the plant’s stress defense and growth [57]. In the present study, among the genes identified via QTL mapping and transcriptome analysis, the gene Zm00001eb043720 encodes a Zinc finger CCCH domain-containing protein. Consequently, it is hypothesized that the gene Zm00001eb043720 might impact the low-temperature tolerance of maize seeds during the germination process by participating in gene expression regulation or signal transduction.
In addition to the aforementioned four genes, we also identified Zm00001eb043620 (encoding Cytochrome P450), Zm00001eb043650 (encoding Tasselless1), and Zm00001eb043490 (involved in UDP synthesis). Cytochrome P450 constitutes an important enzyme family in plants, participating in plant hormone metabolism, the synthesis of secondary metabolites, and the regulation of plant growth and development [58]. Sequencing-based studies indicate that P450 plays a vital role in diverse plant functions, including the plant stress response, and holds great promise in screening crop varieties resistant to biotic and abiotic stresses [59]. Tasselless1 represents a key gene influencing the development of maize tassels. It preserves the normal morphology of tassels by regulating the cell division and differentiation processes within tassel meristems. It mainly participates in the auxin signaling pathway and exerts a synergistic effect with other plant hormones such as gibberellins and cytokinins [60,61]. In plants, UDP functions as a glycosyl carrier, partaking in the synthesis of polysaccharides and glycoproteins. It is also involved in the synthesis of secondary metabolites like flavonoids and terpenoids [62,63]. Notably, in previous research, there have been no reports regarding the genes Zm00001eb043650 and Zm00001eb043490 in relation to the response to and regulation of low-temperature stress in plants. As a result, the functions of these genes during the seed germination process under low-temperature stress remain unconfirmed, and their molecular mechanisms are yet to be elucidated.
Metabolomics allows for the qualitative and quantitative analysis of all metabolites in an organism, helping to understand the overall metabolic state and its change patterns. When plants face stress, their metabolism adapts. Metabolomics research can reveal plant metabolic pathways and the metabolic response mechanisms under stress. In this study, we analyzed metabolites in seeds (P1 vs. P2 and H vs. L) under low-temperature stress. L-glutamic acid, 4-aminobutyric acid, and LPC showed differential accumulation. L-glutamic acid and 4-aminobutyric acid are common plant amino acids. Under low-temperature stress, they maintain cell osmotic balance, stabilize the cell membrane, protect biological macromolecules, boost antioxidant synthesis, and regulate antioxidant enzyme activity [64]. LPC is involved in cell membrane repair and reconstruction. The fluidity of the plant cell membrane is crucial for cell function. LPC inserts into the cell membrane’s phospholipid bilayer to regulate phospholipid interactions, ensuring proper membrane fluidity for normal material transport and signal transduction [65]. When the cell membrane is damaged by stress, LPC helps repair it by interacting with other phospholipids and membrane proteins, restoring membrane integrity and cell function. So, under low-temperature stress, LPC accumulates differently, maintaining cell function at low temperatures by regulating membrane fluidity and stability [66]. Based on the differential accumulation of these metabolites and prior knowledge of their functions, we speculate that during maize germination under low-temperature stress, the cell membrane may be damaged. The differential metabolite accumulation stabilizes the cell membrane, regulates antioxidant enzymes, and maintains normal cell transport and signaling. Combined with the candidate genes identified by genome and transcriptome analysis, we hypothesize that low temperatures may trigger differential gene expression, altering metabolites through certain regulatory pathways. However, the underlying regulatory mechanisms of these genes need further study.

5. Conclusions

In this study, we employed a RIL population and BSA-seq method. Through QTL analysis, we successfully mapped four candidate intervals on chromosome 1 and chromosome 10, designated as qSGRL1-2, qSGRL1-3, qSGRL1-4, and qSGRL10. Collectively, these intervals harbored a total of 109 candidate genes. By integrating the results of transcriptome sequencing, among the genes screened via QTL-seq, seven genes were identified as common candidate genes associated with the cold tolerance of maize during the germination stage. Specifically, the genes Zm00001eb043000, Zm00001eb043620, Zm00001eb043650, Zm00001eb043680, and Zm00001eb043720 were found to encode Phosphofructose kinase 2, Cytochrome P450, Tasselless1, Kinesin-like protein, and Zinc finger CCCH domain-containing protein, respectively. Meanwhile, the genes Zm00001eb043400 and Zm00001eb043490 were responsible for encoding proteins involved in ATP hydrolysis and UDP synthesis, respectively. Combined with the results of metabolomic analysis, low-temperature stress induced the differential expression of relevant genes, and also led to the differential accumulation of metabolites such as L-glutamic acid, 4-aminobutyric acid, and LPC. In order to further analyze the regulatory mechanism of the candidate genes under low-temperature stress during the germination stage and their roles in maize genetic improvement, it is necessary to study their biological functions and evaluate their utilization in breeding in future research.

Supplementary Materials

The following supporting information can be downloaded at: https://www.mdpi.com/article/10.3390/agronomy15051067/s1, Table S1: SNP/Indel number and function analysis of P1, P2, H and L bulks by BSA-seq sequencing; Table S2: QTLs conferring SGRL identified by four calculation models.

Author Contributions

Conceptualization, L.W. and Y.Y.; Investigation, C.W., Y.L., N.H. and N.S.; Data Curation, C.W.; Writing—Original Draft Preparation, C.W.; Writing—Review and Editing, L.W. and Y.Y.; Visualisation, C.W., L.W. and Y.Y. All authors have read and agreed to the published version of the manuscript.

Funding

This work was supported by the Special Project for Seed Industry Innovation of the Shenyang Science and Technology Plan (23-410-2-14), the Sub-project of the Major Special Project of “Germplasm Innovation and Storing Grain through Technology” in Liaoning Province (2023JH1/10200009-01-2), and the National Natural Science Foundation of China (31701441).

Data Availability Statement

All BSA-seq and RNA-seq data reported in this study are publicly available through the National Center for Biotechnology Information Sequence Read Archive (NCBI SRA, https://www.ncbi.nlm.nih.gov/ (accessed on 31 March 2025)). The data can be accessed under the accession number PRJNA1242990.

Conflicts of Interest

The authors declare no conflicts of interest.

References

  1. Peter, R.; Eschholz, T.W.; Stamp, P. Swiss flint maize landraces-A rich pool of variability for early vigour in cool environments. Field Crop. Res. 2009, 110, 157–166. [Google Scholar] [CrossRef]
  2. Verheul, M.J.; Picatto, C.; Stamp, P. Growth and development of maize (Zea mays L.) seedlings under chilling conditions in the field. Eur. J. Agron. 1996, 5, 31–43. [Google Scholar] [CrossRef]
  3. Hund, A.; Richner, W.; Soldati, A.; Fracheboud, Y.; Stamp, P. Root morphology and photosynthetic performance of maize inbred lines at low temperature. Eur. J. Agron. 2007, 27, 52–61. [Google Scholar] [CrossRef]
  4. Muhammad, F.A.E.; Tariq, A.A.; Abdul, W.B.; Dong-Jin, L.C.; Kadambot, H.M. Chilling tolerance in maize: Agronomic and physiological approaches. Crop Pasture Sci. 2009, 60, 501–516. [Google Scholar]
  5. Guy, C.L. Cold acclimation and freezing stress tolerance: Role of protein metabolism. Annu. Rev. Plant Physiol. Plant Mol. Biol. 1990, 41, 187–223. [Google Scholar] [CrossRef]
  6. Xiong, L.; Schumaker, K.S.; Zhu, J.K. Cell signaling during cold, drought, and salt stress. Plant Cell 2002, 14, S165–S183. [Google Scholar] [CrossRef]
  7. Wang, X.; Guo, Y.; Wang, X. Physiological and molecular mechanisms of plant responses to cold stress. Front. Plant Sci. 2017, 8, 1844. [Google Scholar]
  8. Chinnusamy, V.; Zhu, J.; Zhu, J.K. Cold stress regulation of gene expression in plants. Trends Plant Sci. 2007, 12, 444–451. [Google Scholar] [CrossRef]
  9. Chengqun, L.; Baoling, H. Effects of low temperature stress on membrane lipid peroxidation and cell defense enzyme activity in leaves of E. grandis × E. urophylla seedlings. Guihaia 2004, 24, 64–68. [Google Scholar]
  10. Kim, J.S.; Jung, H.J.; Lee, H.J.; Kim, K.A.; Kang, H. Glycine-rich RNA-binding protein7 affects abiotic stress responses by regulating stomata opening and closing in Arabidopsis thaliana. Plant J. 2008, 55, 455–466. [Google Scholar] [CrossRef]
  11. Mastrangelo, A.M.; Marone, D.; Laidò, G.; Leonardis, A.M.D.; Vita, P.D. Alternative splicing: Enhancing ability to cope with stress via transcriptome plasticity. Plant Sci. 2012, 185, 40–49. [Google Scholar] [CrossRef] [PubMed]
  12. Zhou, X.; Wang, G.; Sutoh, K.; Zhu, J.K.; Zhang, W. Identification of cold-inducible microRNAs in plants by transcriptome analysis. BBA-Gene Regul. Mech. 2008, 1779, 780–788. [Google Scholar] [CrossRef] [PubMed]
  13. Zhang, Y.; Fu, J.; Gu, R.; Wang, J.; Chen, X.; Jia, J.; Zhang, J.; Wang, G. Isolation and analysis of cold stress inducible genes in Zea mays by suppression subtractive hybridization and cDNA macroarray. Plant Mol. Biol. Rep. 2009, 27, 38–49. [Google Scholar] [CrossRef]
  14. Lv, D.K.; Bai, X.; Li, Y.; Ding, X.D.; Ge, Y.; Cai, H.; Ji, W.; Wu, N.; Zhu, Y.M. Profiling of cold-stress-responsive miRNAs in rice by microarrays. Gene 2010, 459, 39–47. [Google Scholar] [CrossRef]
  15. Sadanandom, A.; Bailey, M.; Ewan, R.; Lee, J.; Nelis, S. The ubiquitin–proteasome system: Central modifier of plant signalling. New Phytol. 2012, 196, 13–28. [Google Scholar] [CrossRef]
  16. Jung, J.H.; Seo, P.J.; Park, C.M. The E3 ubiquitin ligase HOS1 regulates Arabidopsis flowering by mediating CONSTANS degradation under cold stress. J. Biol. Chem. 2012, 287, 43277–43287. [Google Scholar] [CrossRef]
  17. Han, Q.; Zhu, Q.; Shen, Y.; Lee, M.; Lübberstedt, T.; Zhao, G. QTL Mapping Low-Temperature Germination Ability in the Maize IBM Syn10 DH Population. Plants 2022, 11, 214. [Google Scholar] [CrossRef]
  18. Du, L.; Peng, X.; Zhang, H.; Xin, W.; Ma, K.; Liu, Y.; Hu, G. Transcriptome Analysis and QTL Mapping Identify Candidate Genes and Regulatory Mechanisms Related to Low-Temperature Germination Ability in Maize. Genes 2023, 14, 1917. [Google Scholar] [CrossRef]
  19. Jatimliansky, J.R.; García, M.D.; Molina, M.C. Response to chilling of Zea mays, Tripsacum dactyloides and their hybrid. Biol. Plant. 2004, 48, 561–567. [Google Scholar] [CrossRef]
  20. He, R.Y.; Zheng, J.J.; Chen, Y.; Pan, Z.Y.; Yang, T.; Zhou, Y.; Tang, Q.L. QTL-seq and transcriptomic integrative analyses reveal two positively regulated genes that control the low-temperature germination ability of MTP–maize introgression lines. Theor. Appl. Genet. 2023, 136, 116. [Google Scholar] [CrossRef]
  21. Li, X.; Wang, G.; Fu, J.; Li, L.; Jia, G.; Ren, L.; Lubberstedt, T.; Wang, G.; Wang, J.; Gu, R. QTL mapping in three connected populations reveals a set of consensus genomic regions for low temperature germination ability in Zea mays L. Front. Plant Sci. 2018, 9, 65. [Google Scholar] [CrossRef] [PubMed]
  22. Hu, S.; Lübberstedt, T.; Zhao, G.; Lee, M. QTL mapping of low-temperature germination ability in the maize IBM Syn4 RIL population. PLoS ONE 2016, 11, e0152795. [Google Scholar] [CrossRef] [PubMed]
  23. Huang, J.; Zhang, J.; Li, W.; Lee, M. Genome-wide Association Analysis of Ten Chilling Tolerance Indices at the Germination and Seedling Stages in Maize. J. Integr. Plant Biol. 2013, 55, 735–744. [Google Scholar] [CrossRef] [PubMed]
  24. Zhang, H.; Zhang, J.; Xu, Q.; Wang, D.; Di, H.; Huang, J.; Yang, X.; Wang, Z.; Zhang, L.; Dong, L.; et al. Identification of candidate tolerance genes to low-temperature during maize germination by GWAS and RNA-seq approaches. BMC Plant Biol. 2020, 20, 333. [Google Scholar] [CrossRef]
  25. Sobkowiak, A.; Jończyk, M.; Jarochowska, E.; Biecek, P.; Trzcinska-Danielewicz, J.; Leipner, J.; Fronk, J.; Sowiński, P. Genome-wide transcriptomic analysis of response to low temperature reveals candidate genes determining divergent cold-sensitivity of maize inbred lines. Plant Mol. Biol. 2014, 85, 317–331. [Google Scholar] [CrossRef]
  26. Li, X.; Hu, H.; Hu, X.; Wang, G.; Du, X.; Li, L.; Wang, F.; Fu, J.; Wang, G.; Wang, J.; et al. Transcriptome analysis of near-isogenic lines provides novel insights into genes associated with seed low-temperature germination ability in Maize (Zea mays L.). Plants 2022, 11, 887. [Google Scholar] [CrossRef]
  27. Zhang, Y.; Li, J.; Li, W.; Gao, X.; Xu, X.; Zhang, C.; Yu, S.; Dou, Y.; Luo, W.; Yu, L. Transcriptome Analysis Reveals POD as an Important Indicator for Assessing Low-Temperature Tolerance in Maize Radicles during Germination. Plants 2024, 13, 1362. [Google Scholar] [CrossRef]
  28. Yu, T.; Zhang, J.; Cao, J.; Cai, Q.; Li, X.; Sun, Y.; Li, S.; Li, Y.; Hu, G.; Cao, S.; et al. Leaf transcriptomic response mediated by cold stress in two maize inbred lines with contrasting tolerance levels. Genomics 2021, 113, 782–794. [Google Scholar] [CrossRef]
  29. Yang, G.; Zou, H.; Wu, Y.; Liu, H.; Yuan, Y. Identification and characterisation of candidate genes involved in chilling responses in maize (Zea Mays L.). Plant Cell 2011, 106, 127–141. [Google Scholar] [CrossRef]
  30. Zeng, R.; Li, Z.; Shi, Y.; Fu, D.; Yin, P.; Cheng, J.; Jiang, C.; Yang, S. Natural variation in a type-A response regulator confers maize chilling tolerance. Nat. Commun. 2021, 12, 4713. [Google Scholar] [CrossRef]
  31. Nicholson, J.K.; Lindon, J.C.; Holmes, E. ‘Metabonomics’: Understanding the metabolic responses of living systems to pathophysiological stimuli via multivariate statistical analysis of biological NMR spectroscopic data. Xenobiotica 1999, 29, 1181–1189. [Google Scholar] [CrossRef] [PubMed]
  32. Yu, T.; Zhang, J.; Ma, X.; Cao, S.; Li, W.; Yang, G. A Multi-Omics View of Maize’s (Zea mays L.) Response to Low Temperatures During the Seedling Stage. Int. J. Mol. Sci. 2024, 25, 12273. [Google Scholar] [CrossRef] [PubMed]
  33. Zuo, S.; Zuo, Y.; Gu, W.; Wei, S.; Li, J. Exogenous Proline Optimizes Osmotic Adjustment Substances and Active Oxygen Metabolism of Maize Embryo under Low-Temperature Stress and Metabolomic Analysis. Processes 2022, 10, 1388. [Google Scholar] [CrossRef]
  34. Jiang, F.; Lv, S.; Zhang, Z.; Chen, Q.; Mai, J.; Wan, X.; Liu, P. Integrated metabolomics and transcriptomics analysis during seed germination of waxy corn under low temperature stress. BMC Plant Biol. 2023, 23, 190. [Google Scholar] [CrossRef]
  35. Li, H.; Richard, D. Fast and accurate short read alignment with Burrows–Wheeler transform. Bioinformatics 2009, 25, 754–1760. [Google Scholar] [CrossRef]
  36. Wang, K.; Mingyao, L.; Hakon, H. ANNOVAR: Functional annotation of genetic variants from high-throughput sequencing data. Nucleic Acids Res. 2010, 38, e164. [Google Scholar] [CrossRef]
  37. Takagi, H.; Abe, A.; Yoshida, K.; Kosugi, S.; Natsume, S.; Mitsuoka, C.; Uemura, A.; Utsushi, H.; Tamiru, M.; Takuno, S.; et al. QTL-seq: Rapid mapping of quantitative trait loci in rice by whole genome resequencing of DNA from two bulked populations. Plant J. 2013, 74, 174–183. [Google Scholar] [CrossRef]
  38. Magwene, P.M.; Willis, J.H.; Kelly, J.K. The statistics of bulk segregant analysis using next generation sequencing. PLoS Comput. Biol. 2011, 7, e1002255. [Google Scholar] [CrossRef]
  39. Mansfeld, B.N.; Grumet, R. QTLseqr: An R package for bulk segregant analysis with next-generation sequencing. Plant Genome 2018, 11, 180006. [Google Scholar] [CrossRef]
  40. Hill, J.T.; Demarest, B.L.; Bisgrove, B.W.; Gorsi, B.; Su, Y.C.; Yost, H.J. MMAPPR: Mutation mapping analysis pipeline for pooled RNA-seq. Genome Res. 2013, 23, 687–697. [Google Scholar] [CrossRef]
  41. Fisher, R.A. On the interpretation of $2 from contingency tables, and the calculation of P. J. R. Stat. Soc. 1922, 85, 87–94. [Google Scholar] [CrossRef]
  42. Chen, S.; Zhou, Y.; Chen, Y.; Gu, J. fastp: An ultra-fast all-in-one FASTQ preprocessor. bioRxiv 2018, 34, i884–i890. [Google Scholar] [CrossRef] [PubMed]
  43. Kim, D.; Langmead, B.; Salzberg, S.L. HISAT: A fast spliced aligner with low memory requirements. Nat. Methods 2015, 12, 357. [Google Scholar] [CrossRef] [PubMed]
  44. Love, M.I.; Huber, W.; Anders, S. Moderated estimation of fold change and dispersion for RNAseq data with DESeq2. Genome Biol. 2014, 15, 550. [Google Scholar] [CrossRef]
  45. Yoon, D.; Kim, Y.J.; Lee, W.K.; Choi, B.R.; Oh, S.M.; Lee, Y.S.; Kim, J.K.; Lee, D.Y. Metabolic Changes in Serum Metabolome of Beagle Dogs Fed Black Ginseng. Metabolites 2020, 10, 517. [Google Scholar] [CrossRef]
  46. Chen, Q.; Geng, T.; Hou, W.J.; Chen, C.Q. Impacts of Climate Warming on Growth and Yield of Spring Maize in Recent 20 Years in Northeast China. Sci. Agric. Sin. 2014, 47, 1904–1916. [Google Scholar]
  47. Shin, K.C.; Kim, S.; Le, A.Q.; Lee, H.S.; Adeva, C.; Jeon, Y.A.; Luong, N.H.; Kim, W.J.; Akhtamov, M.; Ahn, S.N. Fine mapping of a low-temperature germinability QTL qLTG1 using introgression lines derived from Oryza rufipogon. Plant Breed. Biotechnol. 2019, 7, 141–150. [Google Scholar] [CrossRef]
  48. Yamaguchi, N.; Hagihara, S.; Hirai, D. Field assessment of a major QTL associated with tolerance to cold-induced seed coat discoloration in soybean. Breed. Sci. 2019, 69, 521–528. [Google Scholar] [CrossRef]
  49. Yang, L.M.; Liu, H.L.; Lei, L.; Zhao, H.W.; Wang, J.G.; Li, N.; Sun, J.; Zheng, H.L.; Zou, D.T. Identification of QTLs controlling low-temperature germinability and cold tolerance at the seedling stage in rice (Oryza Sativa L.). Euphytica 2018, 214, 1–4. [Google Scholar] [CrossRef]
  50. Livaja, M.; Wang, Y.; Wieckhorst, S.; Haseneyer, G.; Seidel, M.; Hahn, V.; Knapp, S.J.; Taudien, S.; Schön, C.-C.; Bauer, E. BSTA: A targeted approach combines bulked segregant analysis with next-generation sequencing and de novo transcriptome assembly for SNP discovery in sunflower. BMC Genom. 2013, 14, 628. [Google Scholar] [CrossRef]
  51. Liu, S.; Yeh, C.-T.; Tang, H.M.; Nettleton, D.; Schnable, P.S. Gene mapping via bulked segregant RNA-Seq (BSR-Seq). PLoS ONE 2012, 7, e36406. [Google Scholar] [CrossRef] [PubMed]
  52. Lara-Núñez, A.; Guerrero-Molina, E.D.; Vargas-Cortez, T.; Vázquez-Ramos, J.M. Interplay of CDKs and cyclins with glycolytic regulatory enzymes PFK and PK. J. Plant Physiol. 2024, 303, 154378. [Google Scholar] [CrossRef] [PubMed]
  53. Deng, X.; Wei, Y.; Chen, Y.; Ding, P.; Xu, F.; Shao, X. Gene co-expression network analysis of the transcriptome identifies cold-resistant hub genes related to carbohydrate metabolism in peach fruit. Postharvest Biol. Technol. 2025, 220, 113300. [Google Scholar] [CrossRef]
  54. Liu, S.; Zhou, X.; Wang, Y.; Wang, Q.; Ma, L.; Wu, C.E.; Wang, R.; Shi, Y.; Watkins, C.B.; Zuo, J.; et al. Storage temperature affects metabolism of sweet corn. Postharvest Biol. Technol. 2025, 219, 113232. [Google Scholar] [CrossRef]
  55. Sproule, K.A. Microtubule Involvement in the Plant Low Temperature Response. Ph.D. Thesis, University of Saskatchewan, Saskatoon, SK, Canada, 2008. [Google Scholar]
  56. Xu, G.; Li, L.; Zhou, J.; He, M.; Lyu, D.; Zhao, D.; Qin, S. Integrated transcriptomics and metabolomics analyses reveal key genes and essential metabolic pathways for the acquisition of cold tolerance during dormancy in apple. Environ. Exp. Bot. 2023, 213, 105413. [Google Scholar] [CrossRef]
  57. Xu, J.; Huang, Z.; Du, H.; Tang, M.; Fan, P.; Yu, J.; Zhou, Y. SEC1-C3H39 module fine-tunes cold tolerance by mediating its target mRNA degradation in tomato. New Phytol. 2023, 237, 870–884. [Google Scholar] [CrossRef]
  58. Schuler, M.A. Plant cytochrome P450 monooxygenases. Crit. Rev. Plant Sci. 1996, 15, 235–284. [Google Scholar] [CrossRef]
  59. Pandian, B.A.; Sathishraj, R.; Djanaguiraman, M.; Prasad, P.V.V.; Jugulam, M. Role of cytochrome P450 enzymes in plant stress response. Antioxidants 2020, 9, 454. [Google Scholar] [CrossRef]
  60. Leonard, A.; Holloway, B.; Guo, M.; Rupe, M.; Yu, G.; Beatty, M.; Zastrow-Hayes, G.; Meeley, R.; Llaca, V.; Butler, K.; et al. tassel-less1 encodes a boron channel protein required for inflorescence development in maize. Plant Cell Physiol. 2014, 55, 1044–1054. [Google Scholar] [CrossRef]
  61. Matthes, M.S.; Darnell, Z.; Best, N.B.; Guthrie, K.; Robil, J.M.; Amstutz, J.; Durbak, A.; McSteen, P. Defects in meristem maintenance, cell division, and cytokinin signaling are early responses in the boron deficient maize mutant tassel-less1. Physiol. Plant. 2022, 174, e13670. [Google Scholar] [CrossRef]
  62. Ostrowski, M.; Jakubowska, A. UDP-glycosyltransferases of plant hormones. Adv. Cell Biol. 2014, 4, 43–60. [Google Scholar] [CrossRef]
  63. Gharabli, H.; Della Gala, V.; Welner, D.H. The function of UDP-glycosyltransferases in plants and their possible use in crop protection. Biotechnol. Adv. 2023, 67, 108182. [Google Scholar] [CrossRef]
  64. Jia, Y.; Zou, D.; Wang, J.; Sha, H.; Liu, H.; Inayat, M.A.; Sun, J.; Zheng, H.; Xia, N.; Zhao, H. Effects of γ-aminobutyric acid, glutamic acid, and calcium chloride on rice (Oryza sativa L.) under cold stress during the early vegetative stage. J. Plant Growth Regul. 2017, 36, 240–253. [Google Scholar] [CrossRef]
  65. Lager, I.; Yilmaz, J.L.; Zhou, X.R.; Jasieniecka, K.; Kazachkov, M.; Wang, P.; Zou, J.; Weselake, R.; Smith, M.A.; Bayon, S. Plant acyl-CoA: Lysophosphatidylcholine acyltransferases (LPCATs) have different specificities in their forward and reverse reactions. J. Biol. Chem. 2013, 288, 36902–36914. [Google Scholar] [CrossRef]
  66. Nair, P.; Kandasamy, S.; Zhang, J.; Ji, X.; Kirby, C.; Benkel, B.; Hodges, M.D.; Critchley, A.T.; Hiltz, D.; Prithiviraj, B. Transcriptional and metabolomic analysis of Ascophyllum nodosum mediated freezing tolerance in Arabidopsis thaliana. BMC Genom. 2012, 13, 643. [Google Scholar] [CrossRef]
Figure 1. DEGs between two sets of cDNA sequencing pools in the transcriptome analysis, based on the log2 fold change (log2FC) and false discovery rate (FDR) values. In the volcano plots, red scatter points represent upregulated genes and blue scatter points represent downregulated genes. (A) Expression classification of DEGs between P1 and P2. (B) Expression classification of DEGs between H and L. (C) Statistics of differentially expressed genes. P1-vs.-P2, in comparison between P1 and P2; H-vs.-L, in comparison between H and L; P1-vs.-H, in comparison between P1 and H; P2-vs.-L, in comparison between P2 and L; P1-vs.-L, in comparison between P1 and L; P2-vs.-H, in comparison between P2 and H.
Agronomy 15 01067 g001
Figure 2. Functional analysis of the DEGs. (A,B) The GO terms in molecular function, cellular component, and biological process categories. (C,D) KEGG pathway enrichment of the DEGs. P1-vs.-P2, in comparison between P1 and P2; H-vs.-L, in comparison between H and L.
Agronomy 15 01067 g002
Figure 3. Metabolic analysis during the seed germination stage under low-temperature conditions. (A) Principal component analysis. (B) Score plots of OPLS-DA. (C) Permutation test analysis. P1-vs.-P2, in comparison between P1 and P2; H-vs.-L, in comparison between H and L.
Agronomy 15 01067 g003
Figure 4. Analysis of DEMs during the seed germination stage under low-temperature conditions. (A) DEM statistics. (B,C) Volcano plot of DEMs. P1-vs.-P2, in comparison between P1 and P2; H-vs.-L, in comparison between H and L; P1-vs.-H, in comparison between P1 and H; P2-vs.-L, in comparison between P2 and L; P1-vs.-L, in comparison between P1 and L; P2-vs.-H, in comparison between P2 and H; VIP, variable importance in projection.
Agronomy 15 01067 g004
Figure 5. KEGG enrichment diagrams of DEMs and graph of log2FC values of the top 15 DEMs. (A) KEGG enrichment diagrams. (B) Graph of log2FC values of the top 15 DEMs. Red indicates upregulation, green indicates downregulation. Abscissa shows log2FC and ordinate displays differential metabolites. P1-vs.-P2, in comparison between P1 and P2; H-vs.-L, in comparison between H and L.
Agronomy 15 01067 g005
Table 1. Phenotypic means and range of SGRL of Liao2386, Liao6082, and their F1 and RIL populations from three experiments (E1, E2, and E3).
EnvironmentLiao2386Liao6082F1RIL
Mean ± SD
(%)
Mean ± SD
(%)
Mean ± SD
(%)
Mean ± SD
(%)
Range
(%)
E184.67 ± 2.4915.33 ± 1.8950.00 ± 4.3258.41 ± 23.130–98
E285.67 ± 1.7013.67 ± 1.2548.67 ± 10.5356.27 ± 24.902–100
E385.33 ± 1.2514.33 ± 1.7050.33 ± 6.0256.00 ± 23.291–97
average85.22 ± 1.9314.44 ± 1.7749.66 ± 7.4656.89 ± 23.810–100
SGRL, maize seed germination rate under low-temperature conditions; RIL, recombinant inbred line; E, distinct plots; SD, standard deviation.
Table 2. An overview of the sequencing data and the alignment result of BSA-seq.
BulkClean ReadsDate Generated (Gb)Q30 (%)Genome Coverage 10× (%)Average Depth (×)GC (%)Total Mapped Efficiency (%)Perfect Mapped Efficiency (%)
P14.96 × 10874.3793.0591.8034.1146.6899.1888.11
P24.96 × 10874.4189.8083.1334.1348.0899.0486.02
H5.44 × 10881.6192.9788.1337.4446.2998.7683.83
L4.73 × 10870.8992.8286.6932.5246.8698.7683.51
Q30, the indicator of the proportion of bases with a quality value greater than or equal to 30; Genome, maize genome. Genome Coverage10×, the ratio of the total amount of bases obtained from sequencing to the size of the genome was 10.
Table 3. The numbers of QTLs conferring SGRL and genes contained identified by four calculation models.
Calculation ModelsCIQTL NumberGenes NumberChr
Δ(SNP-index)95%4434601, 2, 3, 4, 5, 6, 7, 9, 10
99%137391, 2, 3, 7, 9, 10
G′ value95%4329221, 2, 3, 6, 7, 9, 10
99%85281, 2, 3, 7, 9, 10
Euclidean distance95%4027811, 2, 3, 6, 7, 9, 10
99%54341, 2, 9, 10
Fisher’s exact test95%147891, 2, 3, 7, 9, 10
99%41091, 10
SNP, single-nucleotide polymorphism; G, G-statistic; CI, confidence interval; Chr, chromosome.
Table 4. Transcriptome information and annotation functions of differentially expressed genes located in the QTL interval.
Gene_idP1-vs.-P2H-vs.-LAnnotation
Average Readcount of P1Average Readcount of P2Log2 Fold Changep ValueAverage Readcount of HAverage Readcount of LLog2 Fold Changep Value
Zm00001eb0430008479213771.350.0014567275160871.242.61 × 10−6Phosphofructose kinase2
Zm00001eb043400452192.343.68 × 10−1816501.780.000237ATP hydrolysis activity
Zm00001eb043490170−10.320.000124180−10.366.47 × 10−5UDP-forming activity
Zm00001eb0436201765155−3.434.18 × 10−91957242−3.030.000187Cytochrome P450
Zm00001eb043650293108−1.380.000521060197−2.402.22 × 10−7Tasselless1
Zm00001eb04368028552−2.394.01 × 10−5716129−2.470.00037Kinesin-like protein
Zm00001eb04372075522131.580.00041364418031.603.37 × 10−7Zinc finger CCCH domain-containing protein
P1-vs.-P2, in comparison between P1 and P2; H-vs.-L, in comparison between H and L.
Table 5. Cross-validation of the OPLS-DA model.
ComparisonR2XR2YQ2
P1-vs.-P20.8450.9630.884
H-vs.-L0.8640.9730.9
P1-vs.-P2, in comparison between P1 and P2; H-vs.-L, in comparison between H and L; R2X: The interpretability of the model (for the X variable dataset); R2Y: The interpretability of the model (for the Y variable dataset); Q2: The predictability of the model.
Table 6. Number of DEMs in the seed of maize plants under low temperature stress.
ClassP1-vs.-P2H-vs.-L
UpDownUpDown
Amino acid and derivatives154614
Amines1001
Phenols and its derivatives1000
Phenolic acids2011
Nucleotide and its derivates1000
Flavonoids1001
Alkaloids and derivatives2001
Organic acid and its derivatives4132
Lipids6204
Phytohormones2002
Carbohydrates and its derivatives00113
Total3571139
P1-vs.-P2, in comparison between P1 and P2; H-vs.-L, in comparison between H and L.
Disclaimer/Publisher’s Note: The statements, opinions and data contained in all publications are solely those of the individual author(s) and contributor(s) and not of MDPI and/or the editor(s). MDPI and/or the editor(s) disclaim responsibility for any injury to people or property resulting from any ideas, methods, instructions or products referred to in the content.

