1. Introduction
Soybean (
Glycine max (L.) Merr.) is a cheap source of protein and oil, generally used in human nourishment or animal feed [
1,
2]. Soybean seeds are nutrient-dense, containing approximately 35–40% carbohydrates, 38–40% protein, and 18–20% fat [
3]. Soybean is also an essential source of vitamin E for medicines and cosmetics [
4].
Soybean is planted at high density, often in intercropping systems [
5,
6]. The competition for resources, such as light, water, and nutrients between crops and weeds or between different crop species is crucial in determining overall crop productivity. Understanding these competing mechanisms is a prerequisite to predicting interspecific interactions in intercropping systems and developing effective weed control strategies.
A significant amount of scientific literature has been dedicated to elucidating the mechanisms of nutrient uptake from soil and examining the impact of light on crop yield through field experiments. The nutrient uptake is not uniform during plant development. Soybean plants first utilize the food reserve and the nutrients from the cotyledon, followed by the vegetative stage characterized by intensive nitrogen fixation [
7]. The growth of soybean is determined by six macronutrients, namely nitrogen, phosphorus, potassium, calcium, sulfur, and magnesium [
8,
9,
10], as well as several micronutrients, such as zinc, iron, selenium, manganese, nickel, molybdenum, and copper [
11,
12,
13,
14]. Macronutrient deficiencies negatively affect physio-morphological parameters, such as the shoot height, leaf area, stem diameter, chlorophyll, and dry matter content of soybean [
10]. Micronutrients are essential for crop health, seed quality, abiotic stress tolerance, and enzyme activity [
11].
In addition to nutrient availability, lighting conditions, such as light intensity and spectral distribution of light, play a crucial role in affecting plant growth at all stages of development. LED lighting provides a unique opportunity to control light intensity over different wavelengths. Narrowband LEDs facilitate the selective activation of distinct photoreceptors [
15] and enable the separation of light intensity and spectral composition. While low light intensity can restrict the rate of photosynthesis, there are cases where shading can have a positive impact on soybean growth [
16,
17,
18,
19,
20,
21,
22]. In plant sciences, light intensity is characterized by the photosynthetic photon flux density (PPFD), defined as the photon irradiance in the 400 nm–700 nm waveband. A low level of PPFD triggers shade avoidance response (SAR) in plants, manifested as morphological changes in the shoot system, such as hypocotyl and internode elongation and reduced stem diameter [
23,
24,
25]. The PPFD-related light signal is attributed to cryptochromes primarily absorbing in the blue and UV-A wavebands [
26]; therefore, some studies correlate the SAR with the blue photon flux density, assuming that the shade response is not sensitive to the ratio of red and blue irradiances (R/B ratio) [
25]. The phytochrome photoreceptors also contribute to the activation of SARs. The phytochromes perceive the ratio between the red and far-red radiation (R/FR) which is significantly affected by light reflected and transmitted by neighboring vegetation [
26].
The SARs of the plant organs aim to maximize the light interception of the crop to effectively compete with emerging weeds. Increasing weed pressure may also limit the availability of nutrients in the soil. Nutrient deficiency triggers morphological and physiological changes, particularly in the root system architecture [
27,
28] to enhance the mobilization and uptake of deficient nutrients. The response to nutrient scarcity is activated by hormones and signaling molecules, such as ethylene, auxin, and nitric oxide [
29].
From the early stage of plant growth and development, simultaneous competition for light and nutrients is crucial in determining a seedling’s growth rate and survival [
30,
31]. Although field experiments provide valuable information about resource competition among plants, only a tight control of environmental parameters can lead to determining quantitative relationships between resource availability and plant growth traits.
Research investigating the interactive effects of nutrient availability and lighting conditions on plant growth often relies on a limited number of light treatments [
31]. While a few experimental settings can reveal general trends, they do not provide the exact mathematical functions that link growth traits with lighting parameters and nutrient concentrations. Understanding these response functions is crucial for developing functional structural plant models, which are valuable tools for predicting and optimizing crop growth [
32,
33,
34].
Although soybean is a field crop cultivated in large quantities worldwide, there are special applications where soybean is grown in indoor farms employing soilless techniques. In climate chambers used for speed breeding, the objective is to reduce the time needed to develop new cultivars by growing as many generations as possible during a year [
24,
25]. The optimization of vertical farms for soybean cultivation requires functional relationship between soybean growth traits and key environmental factors, e.g., PPFD, the spectral distribution of light, and nutrient concentrations.
In our study, we employed an experimental method [
35] that allowed for simultaneous measurements across 2 × 12 different lighting conditions in 6 different nutrient solutions. The main objective of this study was to determine the mathematical functions connecting the morphological traits of soybean seedlings with light intensity, red/blue ratio, and nutrient concentration. Specifically, we aimed to examine how these stress factors interact and influence the morphological adaptation of plants as well as the biomass accumulation in the shoot and the root systems.
2. Materials and Methods
The experiments were carried out in two phases in the container farm of the Institute of Agronomy, Hungarian University of Agriculture and Life Sciences, Gödöllő, Hungary. The first experiment (Experiment 1) started in May and the second (Experiment 2) in November 2024. The container farm incorporating three vertically stacked cultivation layers was described in a previous communication in detail [
35]. The vertical farm was equipped with air conditioning to regulate the temperature, and fans ensuring uniform air temperature and relative humidity above the soybean seedlings. The growing chamber had an air temperature of 24 ± 2 °C, and the relative humidity was between 60% and 80% in both experiments.
2.1. Materials and Experimental Conditions
The seeds of the “Pompei” soybean cultivar were obtained from Szójamag Kft, Szentlőrinc, Hungary in January 2024. Pompei is a semi-determinate soybean cultivar characterized by high protein (>42%) and an oil content of 20–23%, providing high crop yield exceeding 5 tons/ha in optimal open field conditions. The seeds were stored in a cool, dry location until the start of the experiments. The soybean seeds were soaked in distilled water for 4 h at 20 °C to initiate germination, as recommended by Sakare et al. [
36], after which the seeds were placed on a sieve of uniform thickness in a plastic tray. The germination occurred in the dark at 20 °C at a saturated humidity level. Soybean seedlings were transplanted to cultivation trays and placed in hydroponic reservoirs when the hypocotyl length was 5 cm. The reservoirs were 60 cm × 40 cm × 7.5 cm plastic boxes incorporating 14 L of nutrient solution.
2.2. Nutrient Solutions
In the irrigation water utilized for preparing the nutrient solution, the average concentrations of ions were as follows: 1.8 mM of Ca2+, 1.4 mM Mg2+, 5.44 mM HCO3−, 0.47 mM Na+, 0.48 mM Cl−, 0.36 mM SO42−, and 0.27 mM of NO3−. Potassium (K) was present only in trace amounts, and phosphorus was not detected. In Experiments 1 and 2, the pH of water was 6.8 and 7.1, respectively; the electrical conductivity (EC) was 0.597 and 0.635 dS/m, respectively. The water was treated with sulfuric acid in Experiment 1 and with nitric acid in Experiment 2 to decompose hidrocarbonate ions and set the pH level at 6.1.
The nutrient solutions were prepared by combining three stock solutions of commercial liquid fertilizers (Advanced Hydroponics of Holland, Best, The Netherlands, Dutch Formula 1, 2, and 3) following the dilution scheme recommended for vegetative growth by the manufacturer. The nutrient content of the stock solutions [
37] is listed in the
Supplementary Material Table S1. Three different dose levels were employed in the hydroponic experiments. The first group, the full-strength (100%) solution, was prepared by mixing the three stock solutions in the following ratios: Formula 1: 2 mL/L, Formula 2: 1 mL/L, Formula 3: 1 mL/L. The second group was given a half concentration (50%), while the third group served as a control, with no nutrient concentrates added to the water (0%). The EC and pH were measured using an ADWA AD31 TDS/EC meter and an ADWA AD12 pH meter. The initial pH value was 6.1 in all treatments, whereas the EC changed according to the experimental design.
Table 1 shows the pH and EC levels at the beginning of experiments.
Table S2 contains the macro and microelement concentrations of the nutrient solutions.
2.3. Lighting Setup
Four-color LED luminaires (Hortiled Multi 4DIM, Hortilux, Den Haag, The Netherlands) containing blue, white, red, and far-red LED chips were the sole source of light in this study.
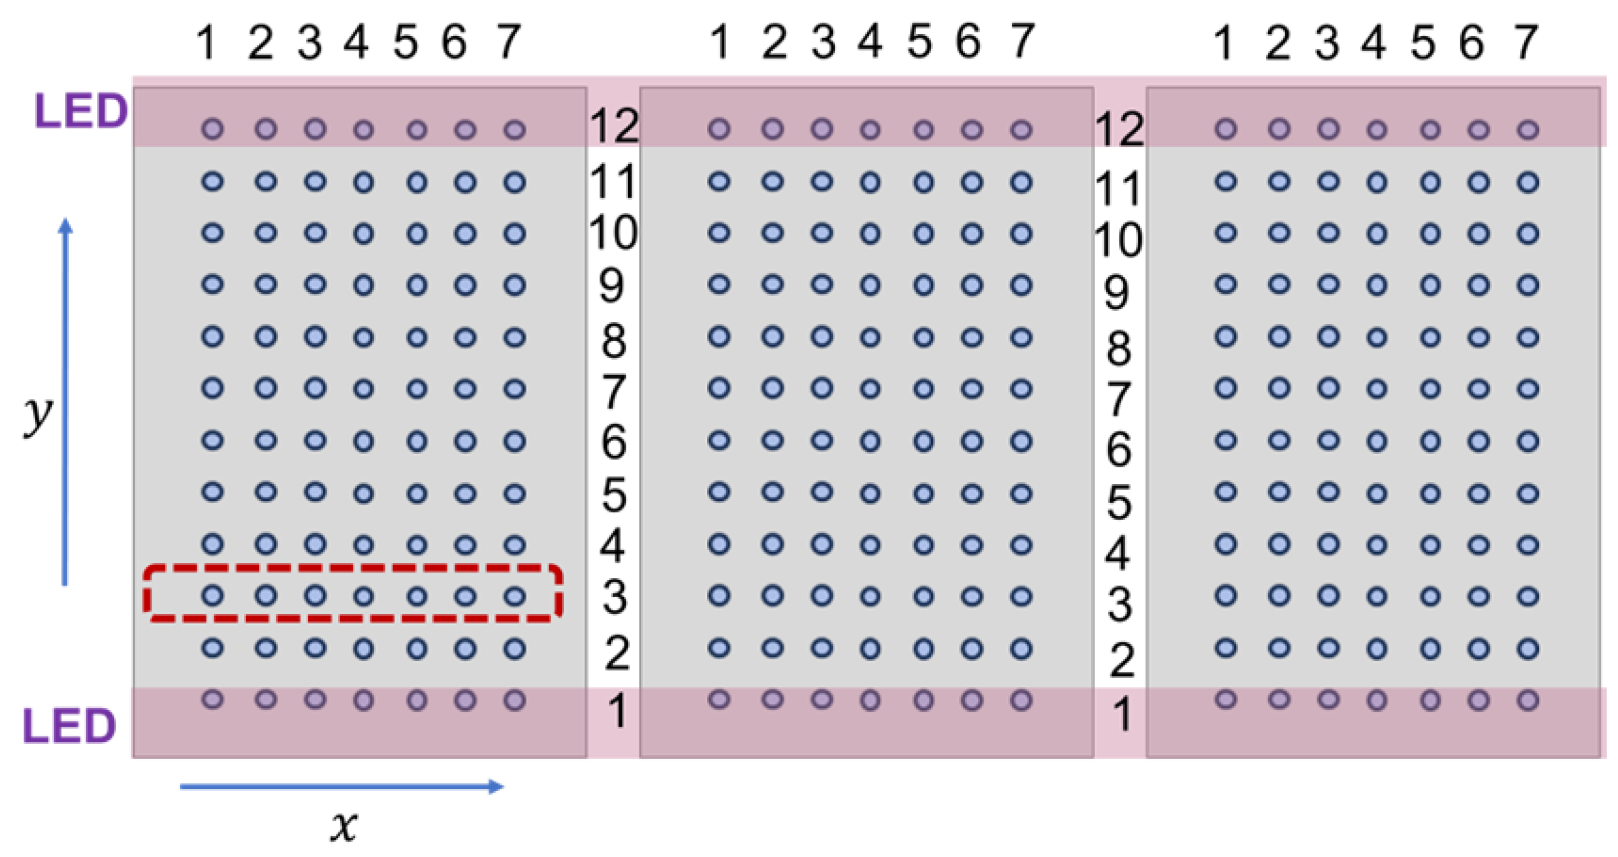
Figure 1 shows the parallel arrangement of the LED light bars positioned above three cultivation trays. The x-axis is parallel to the line of LED luminaires, whereas the y-axis is perpendicular to the LED pairs. Each tray was perforated, containing 4 mm diameter holes arranged in a 7 × 12 matrix. Germinated seeds were transplanted into these holes. The LED luminaires, represented by purple bars in
Figure 1, were always positioned above the first and twelfth rows of the holes.
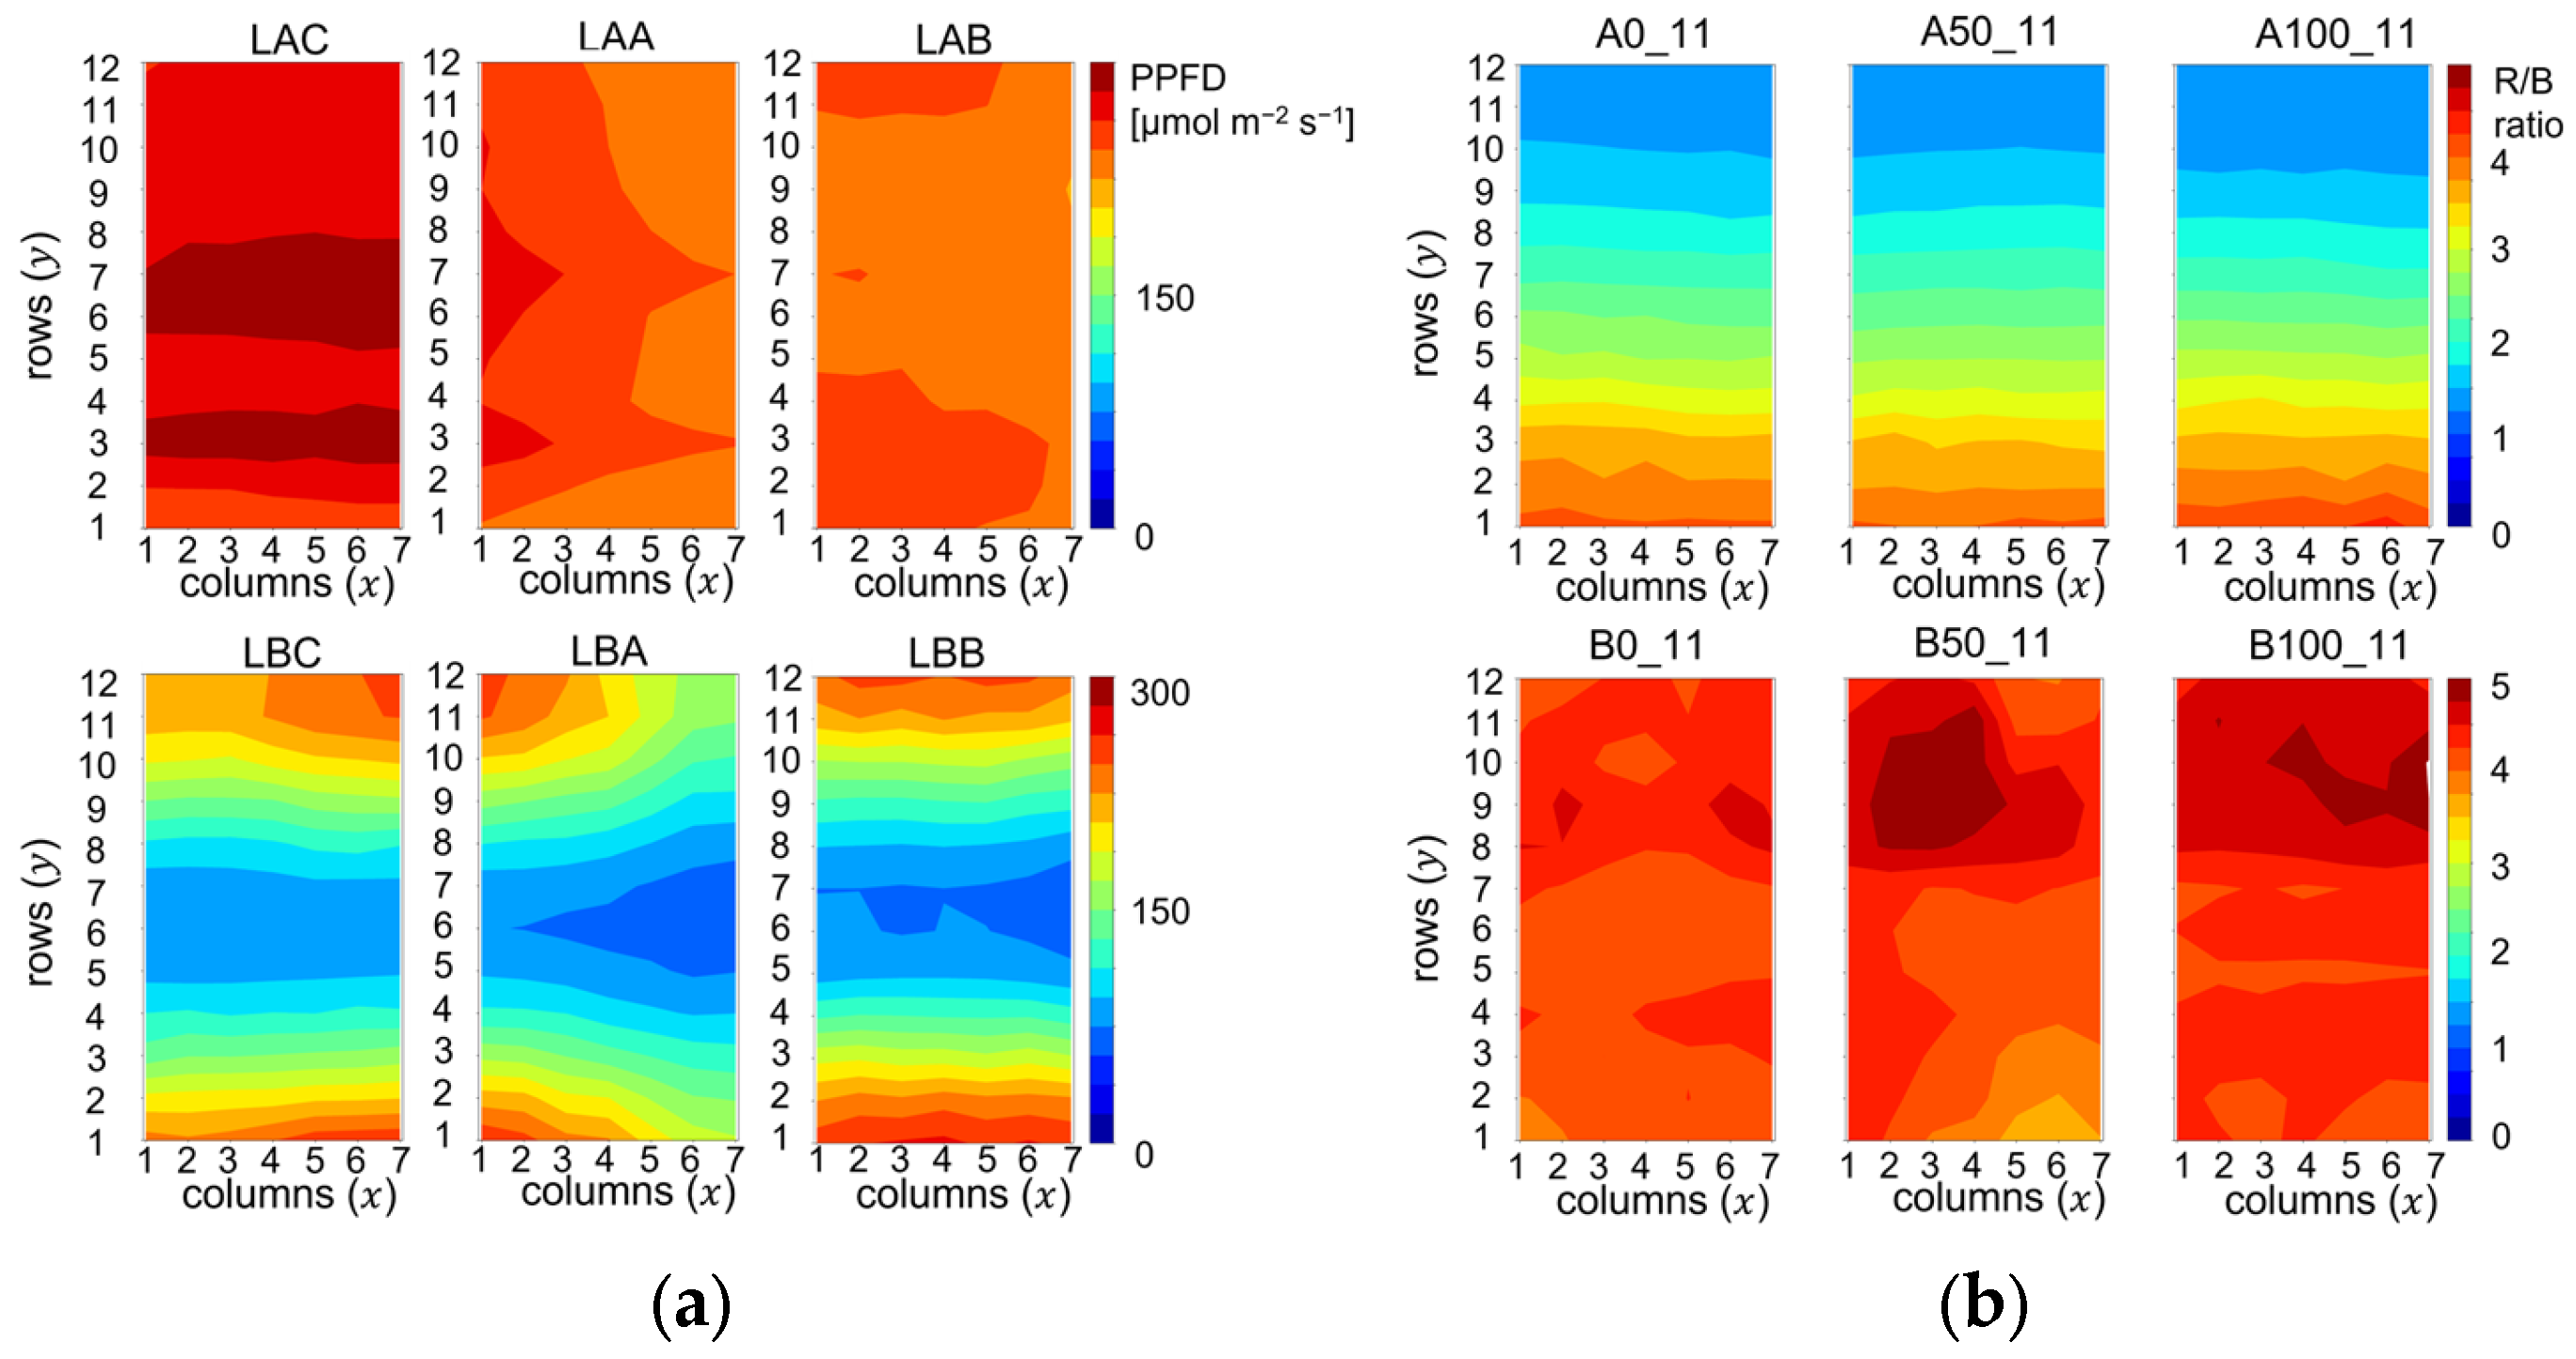
By adjusting the height of the luminaires and the intensity of the blue (450 nm), red (660 nm), and white LEDs, we established two different lighting environments in the experiments: in the first environment, the emission spectrum of the LED stripes on the top was rich in blue, and in the bottom the spectrum was rich in red light. The different spectra emitted by the parallel luminaires created a gradual decrease in the R/B ratio from y = 1 to y = 12, while maintaining a constant PPFD, as shown in the upper row of
Figure 2a,b. In the second environment, the R/B ratio was constant, but the spatial PPFD distribution exhibited maxima at the lower and upper edge of the trays and a minimum halfway between the LED luminaires. Prior to planting soybean seedlings, photon irradiance was measured at each hole using a spectroradiometer (Mavospec Base, GOSSEN Foto—und Lichtmesstechnik GmbH, Nürnberg, Germany).
The heat maps in
Figure 2 display the spatial PPFD and R/B ratio distributions across the cultivation trays in Experiment 1. Codes above the upper panes, starting with letter A denote treatments with high average PPFD values with small spatial variations, as follows: 276 ± 11, 247 ± 7, and 241 ± 5 µmol m
−2 s
−1 from left to right in
Figure 2a. The R/B ratio, however, decreased from the bottom to the top of the trays, as shown in the upper pane of
Figure 2b.
In the second type of lighting environments, denoted by codenames starting with B, the R/B ratio distribution was flat, i.e., 4.3 ± 0.1, 4.3 ± 0.3, and 4.4 ± 0.2 from left to right in
Figure 2b. In the lower panes of
Figure 2a, the cool colors in the middle of the trays and warm colors on the edges indicate that the PPFD varied in a broad range between 70 and 261 µmol m
−2 s
−1.In Experiment 2, similar photon irradiance distributions were established, but the PPFD averages were reduced to the interval of 101–127 µmol m
−2 s
−1, and the effect of R/B variations were tested in the broader R/B range of 0.6–6.0. Another difference compared to Experiment 1 was the lack of green (500–600 nm) light, because in Experiment 2 only the narrow band blue (450 nm) and red (660 nm) LED channels were used, while the white LED was switched off. Representative irradiance spectra for low and high R/B ratios in Experiments 1 and 2 are displayed in
Figure S1.
The lighting characteristics remained constant during one experiment, and the photoperiod was always 16 h. The symmetry of the spatial distribution of irradiance allowed us to average the photon irradiance and plant growth values along the x-axis. In one experimental setting, 7 × 12 individual measurements were taken. Due to the symmetry of light distribution, each row in the matrix incorporated 7 individual seedlings grown under identical conditions. Consequently, we averaged the individual measurement data by row. The red rectangle in
Figure 1 illustrates one group of 7 seedlings growing under the same conditions.
2.4. Experimental Design
Two factors were used in an experiment, namely the lighting environment at two levels and the solution strength at three levels, resulting in six different treatments for each experiment, as listed in
Table 1. The first letter of the tray code defines the lighting variable. Codes starting with “A” represent treatments in which the PPFD level was kept constant and seedlings were exposed to varying ratios of red and blue photon irradiances (R/B). Codes starting with B stand for the cases where the R/B ratio was kept constant and the PPFD changed across the cultivation tray. The first number in the code denotes the strength of the nutrient solution, as follows: 0—no added concentrate, 50—half-strength, 100 full-strength solution. The first digit following the underscore, i.e., 1 or 2, refers to the experiment number, whereas the last digit identifies the full replication of the treatment in another reservoir.
2.5. Data Collection
All soybean seedlings were collected on the fourteenth day after transplanting in Experiments 1 and 2. Parameters were measured immediately on the first trifoliate leaf. The shoot height, the first internode length, the diameter of the first internode, the leaf width, the leaf length were measured by a ruler. The spectral properties of the leaves characterizing the chlorophyll content were measured using a SPAD meter (Soil Plant Analysis Development, Konica-Minolta, Tokyo, Japan). The fresh mass of leaves and the stem were measured and analyzed separately. The shoot fresh mass reported was the sum of the leaf and the stem mass measured by individual plants. Similarly, the leaves, stems, and roots were collected separately by rows then dried in an oven at 70 °C until the dry mass remained constant. The dry mass of shoot reported is the sum of the dry mass of leaves and the dry mass of the stems.
2.6. Determination of Leaf Mass Ratio and Root Mass Ratio
Leaf mass ratio and root mass ratio were determined and calculated using Equations (1) and (2), as follows:
2.7. Statistical Analysis
Regression analysis was carried out using the statistical module of the SciPy (1.13.1) [
38] open-source Python (3.9.7) package. Significance levels were set at
p < 0.05 throughout the data analysis. The growth traits of seedlings were correlated with PPFD and R/B values using a linear model, and the slopes and intercepts were determined by linear least-squares regression. The estimated parameters, the coefficient of determination (R
2) and the
p-values of the regression analysis are summarized in
Table S2. Error bars in the scatter plots represent the mean value ± standard deviation range.
3. Results
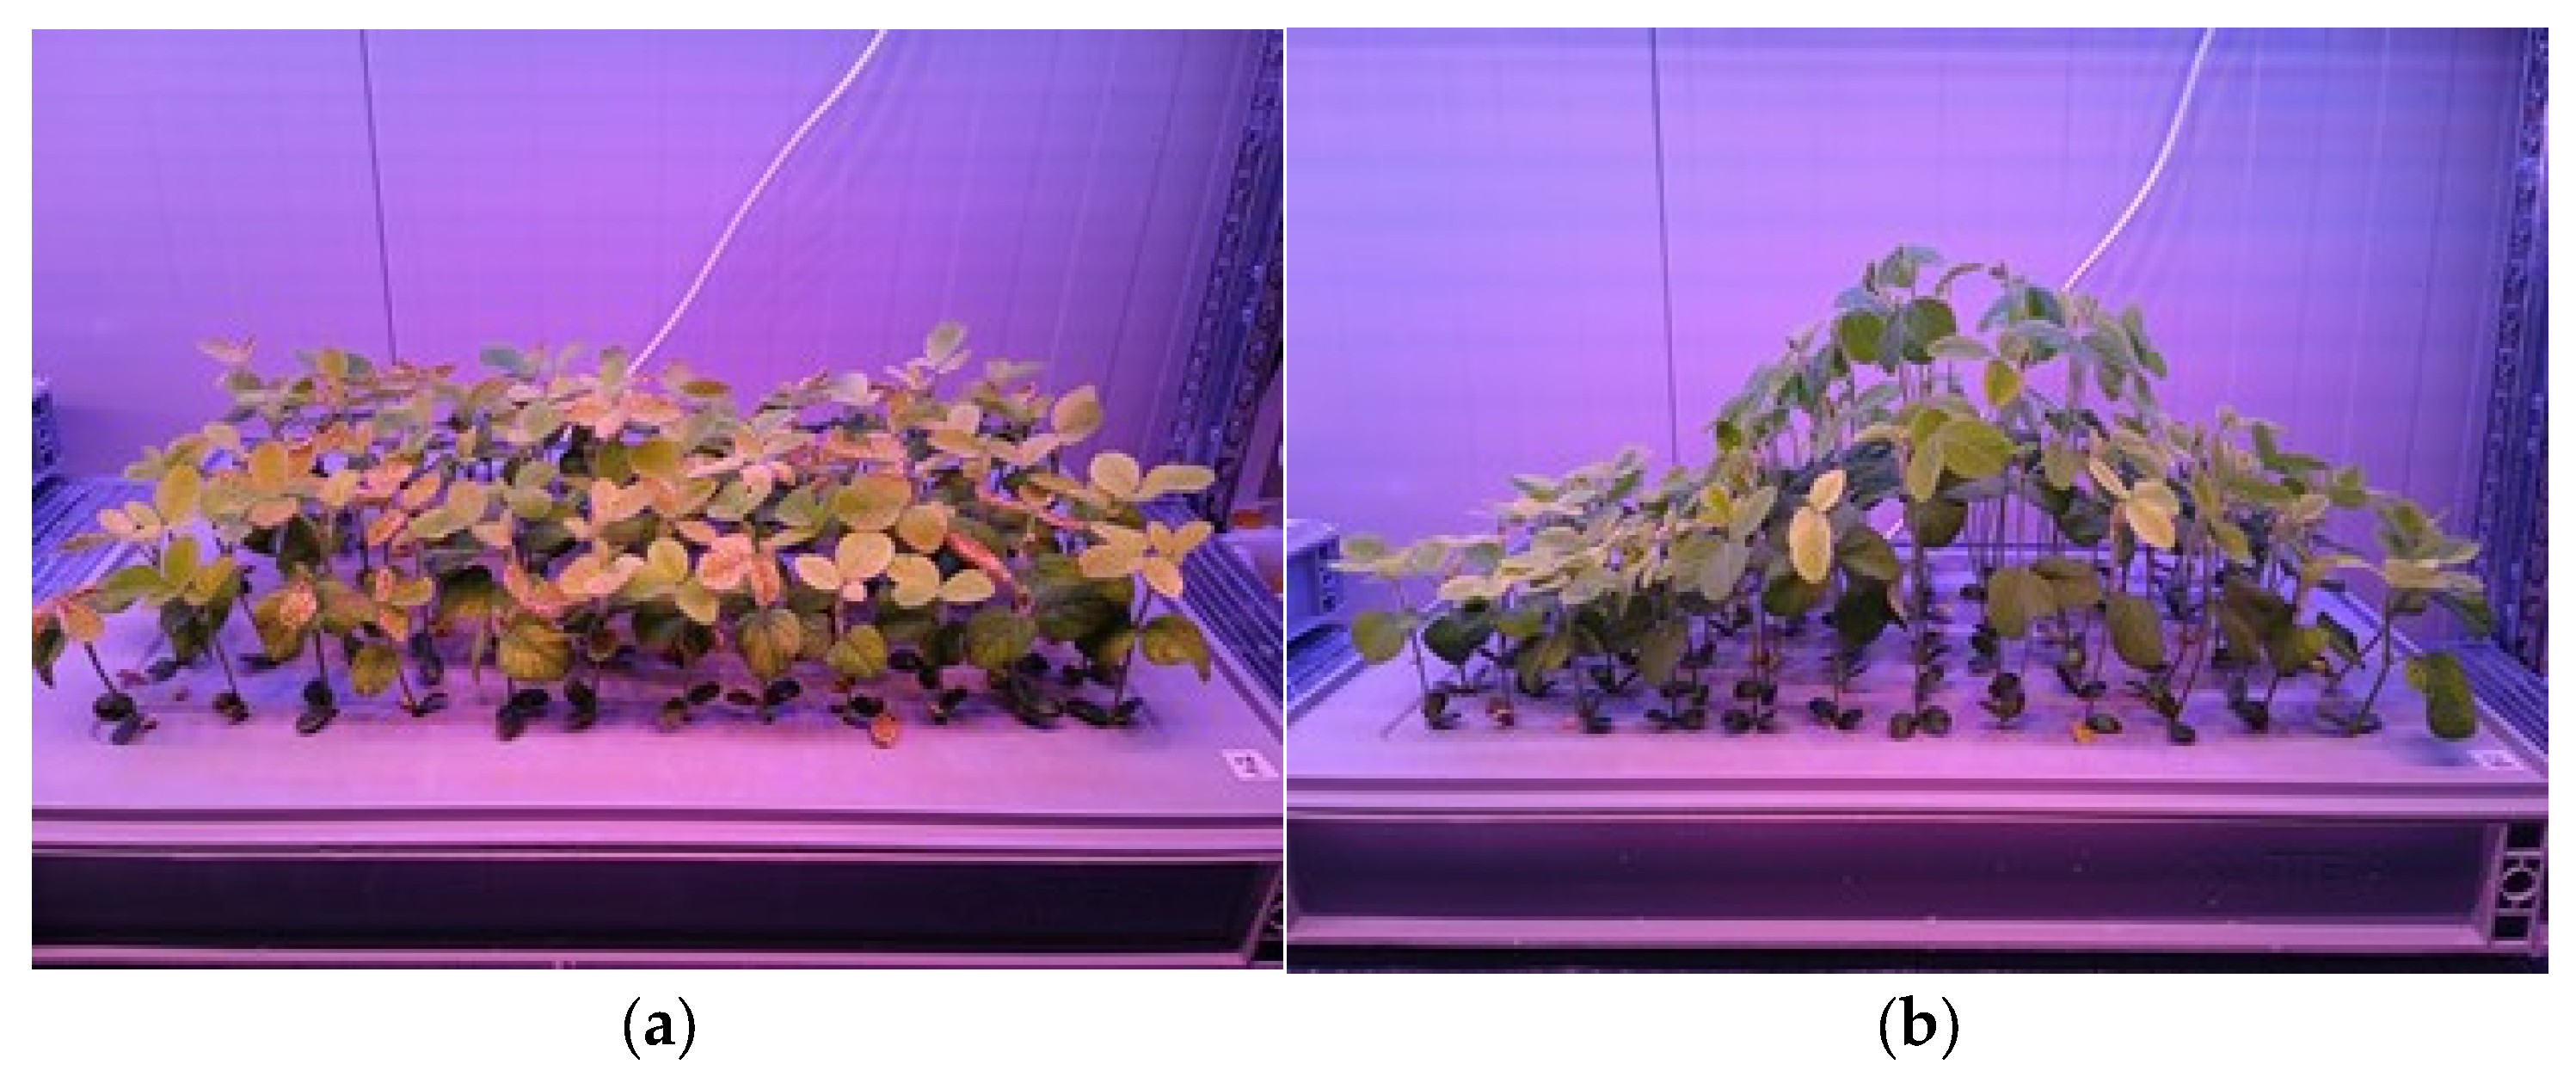
Seedlings were grown under constant environmental conditions until the 14th day after transplanting. Throughout this two-week period both pH and EC were monitored but the volume and compositions of the nutrient solutions were not adjusted. The most significant effect of the two lighting conditions was seen in the morphology, especially in the height of the plants. Under low light intensity, soybean seedlings exhibited tall growth with slender stems, while those exposed to high photosynthetic photon flux density levels displayed a shorter stature and thicker stems. The images presented in
Figure 3 illustrate the differences in height distributions for uniform PPFD (a) and spatially varying PPFD (b). Comparable height variations were noted with both half-strength and full-strength nutrient solutions.
PPFD exhibited a statistically significant correlation with almost all measured growth traits. In contrast, the R/B ratio had a minimal or statistically not significant impact on plant development in A-type treatments where the light intensity was set to PPFD > 100 µmol m
−2 s
−1. Therefore, the charts demonstrating poor or no correlation between the growth traits and R/B ratio are rendered to
Figure S2 of the Supplementary Materials. Because the R/B ratio did not affect significantly the plant parameters, data points were pooled in the treatments with constant PPFD. These data exhibited strong correlation with the solution strength. In the following figures, we present plots in pairs: the left panel (a) displays the growth trait plotted against the blue photon irradiance or PPFD, while panel (b) features a scatter plot of the growth traits as a function of the EC of the nutrient solutions.
Data were evaluated separately for Experiments 1 and 2 and displayed side-by-side in
Figure S3 to make the similarities and differences directly comparable. The same trends were found in the two independent experiments despite the slight differences in the concentrations of the nutrient solutions, light intensities, and spectra. To avoid presenting multivariate data in a two-dimensional plot, we present only Experiment 1’s results in the growth trait vs. PPFD plots, with a reference to the Experiment 2 counterpart presented in
Figure S3.
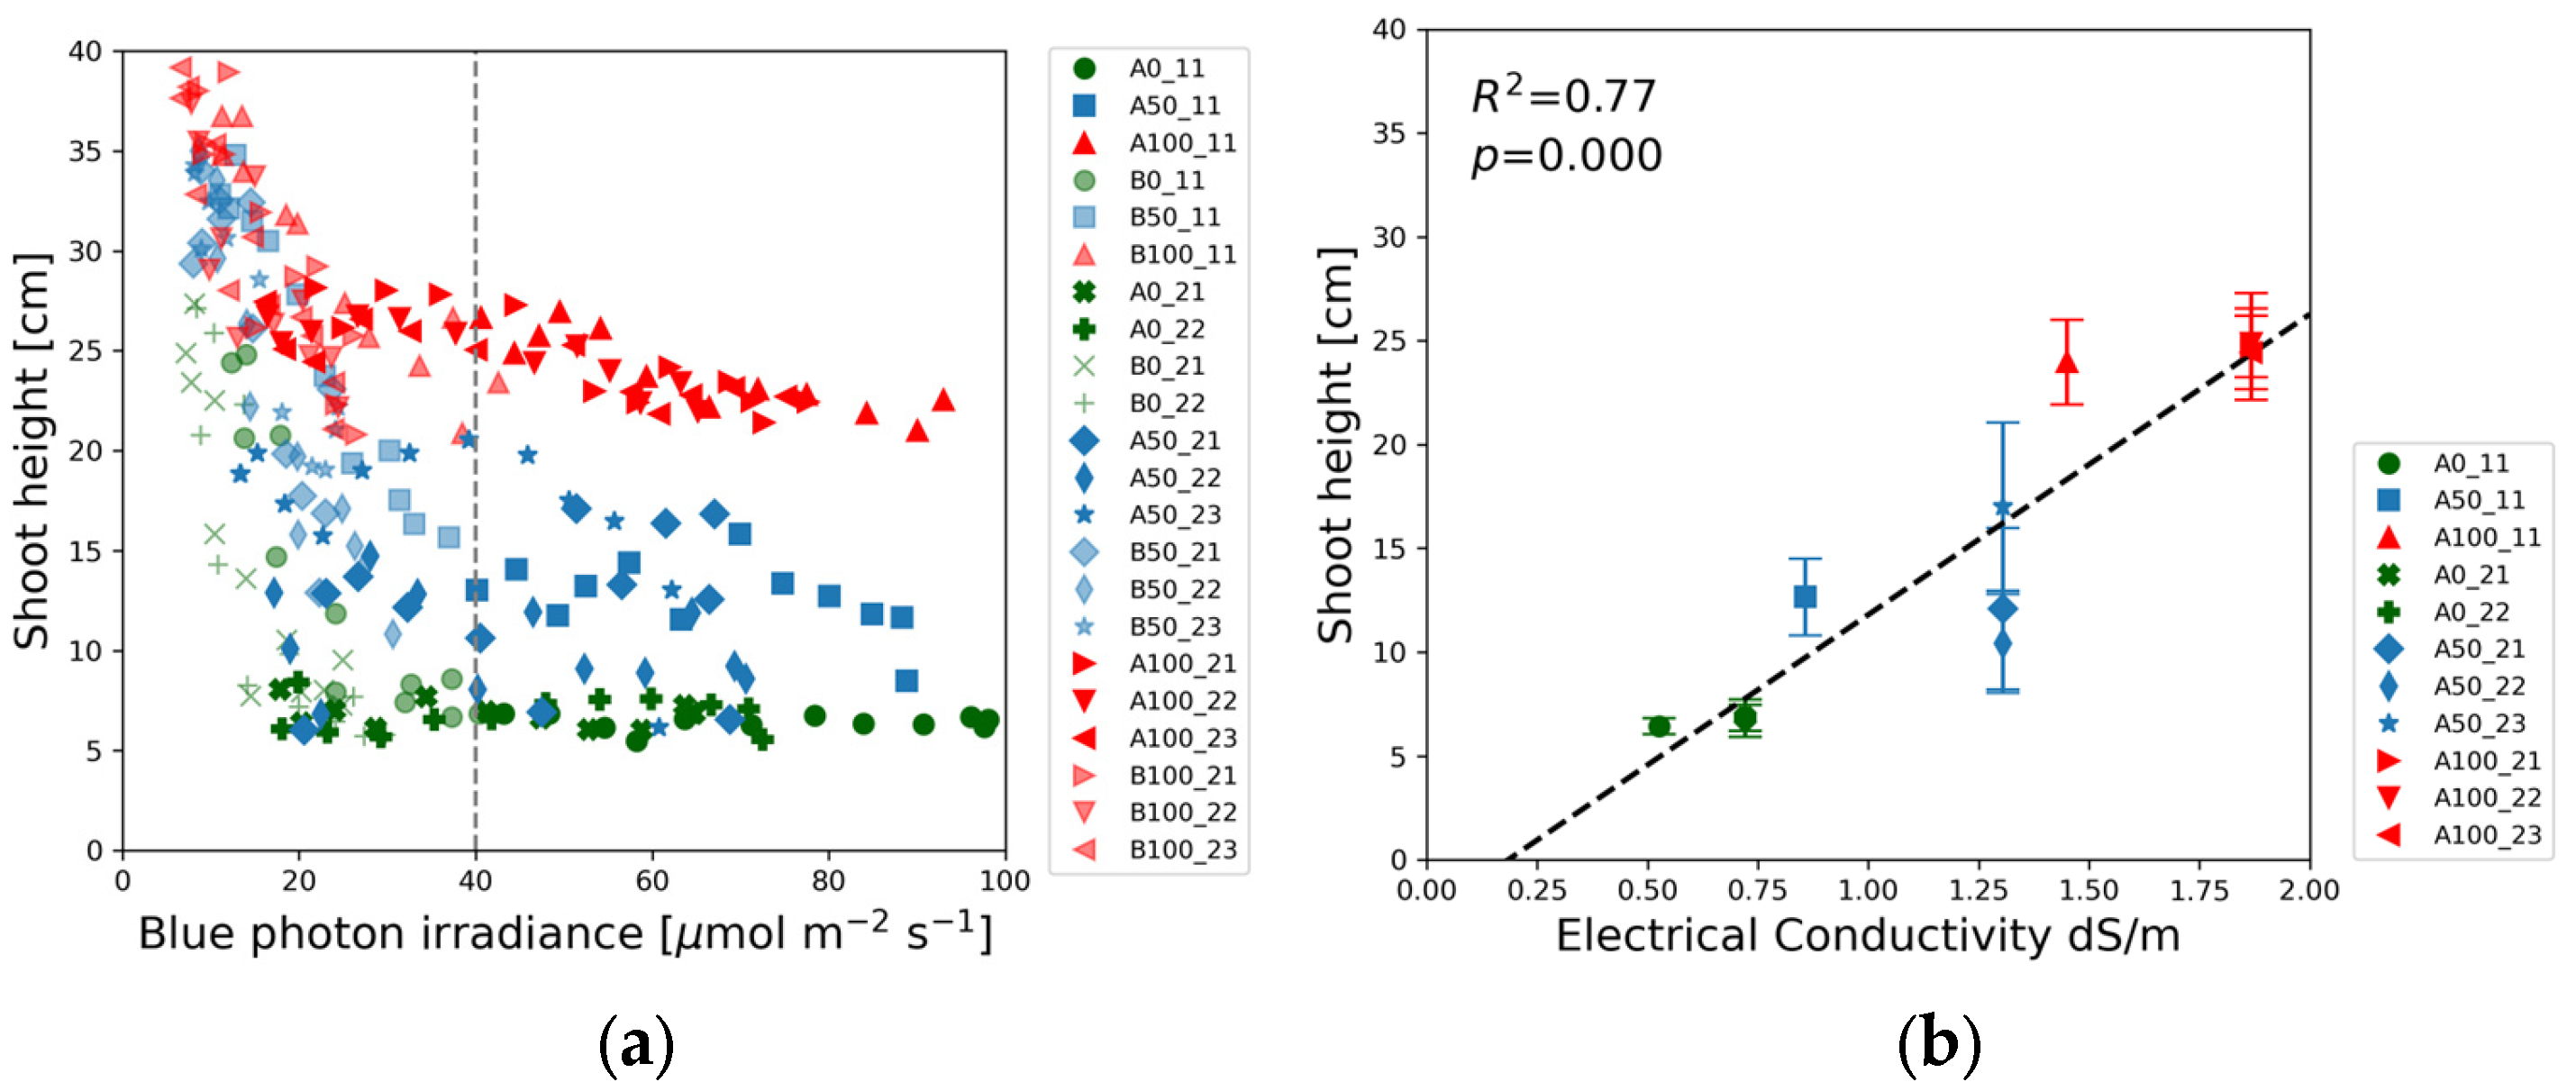
Following the practices of previous SRS studies [
25], the shoot height and the first internode length were plotted against the absolute value of blue (400–500 nm) light intensity in
Figure 4a and
Figure 5a. The red, blue, and green markers representing full-strength (100%), half-strength (50%), and blank (0%) solutions form three distinct groups in
Figure 4a. The maximum shoot heights were measured at the lowest blue light intensity. The shoot height decreased with the increase in blue photon irradiance up to about 40 µmol m
−2 s
−1, as indicated by the vertical dotted line. Beyond this threshold, the shoot height did not change significantly with the blue light intensity, but the average shoot height was determined by the solution strength.
Figure 4b reveals that the shoot height varied linearly with electrical conductivity, highlighting a direct correlation between nutrient concentration and plant growth.
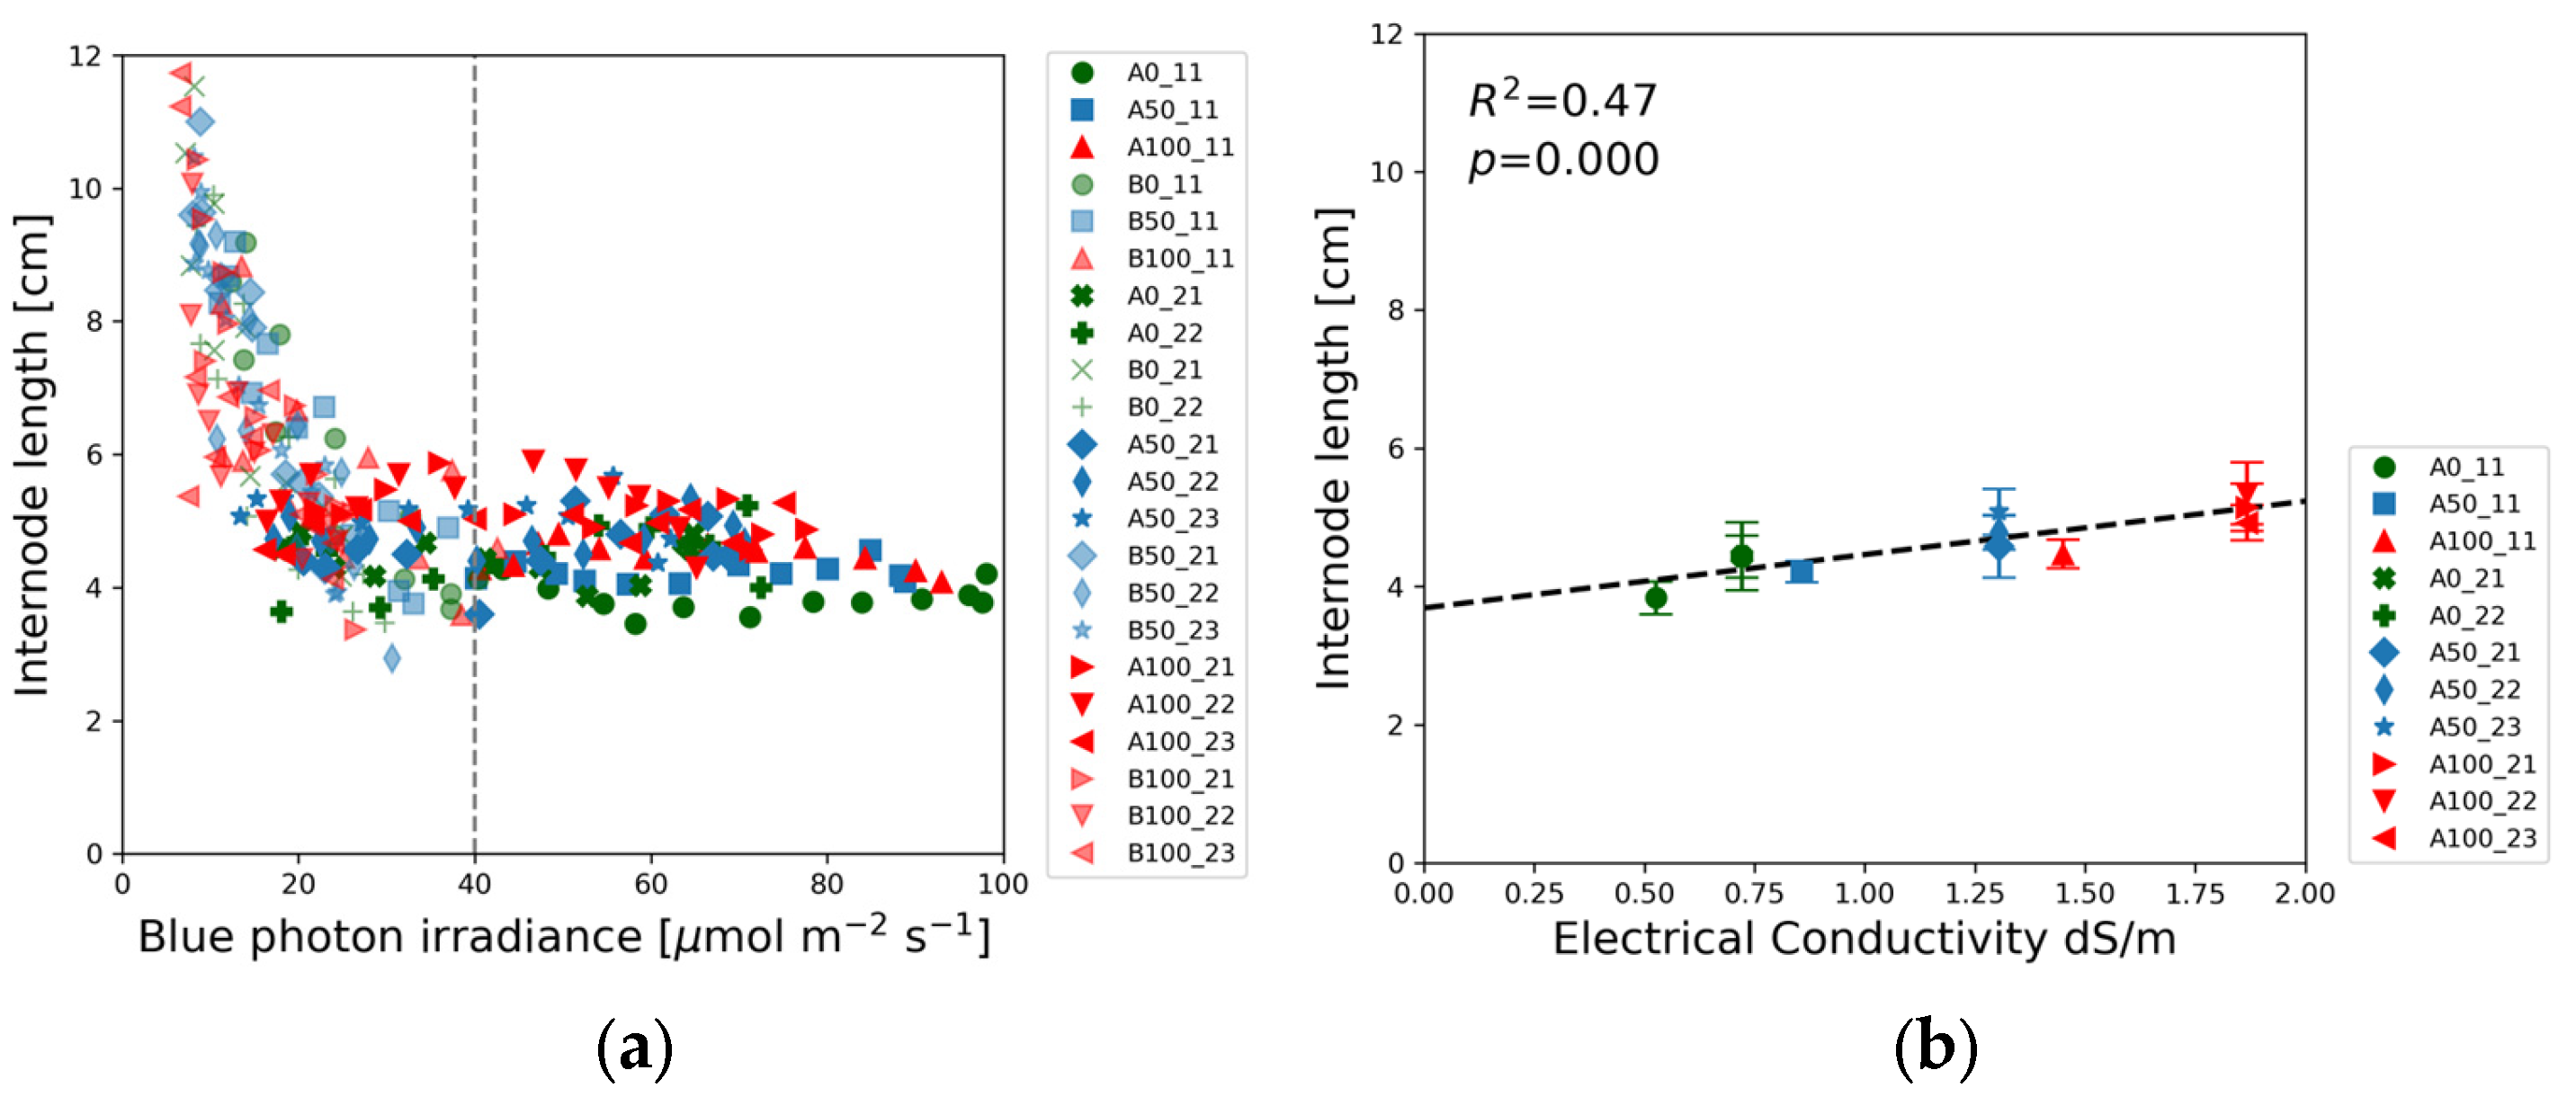
Similar to the shoot height, the first internode length also decreased with increasing blue photon irradiance up to a threshold of about 40 µmol m
−2 s
−1, followed by a flat section independent of the photon irradiance.
Figure 5a illustrates that all of the internode length data points of Experiments 1 and 2 exhibit a consistent trend as a function of blue photon irradiance. Data points align along the same descending curve independently from the nutrient concentrations.
Figure 5b, however, reveals slight linear dependence of the first internode length on EC.
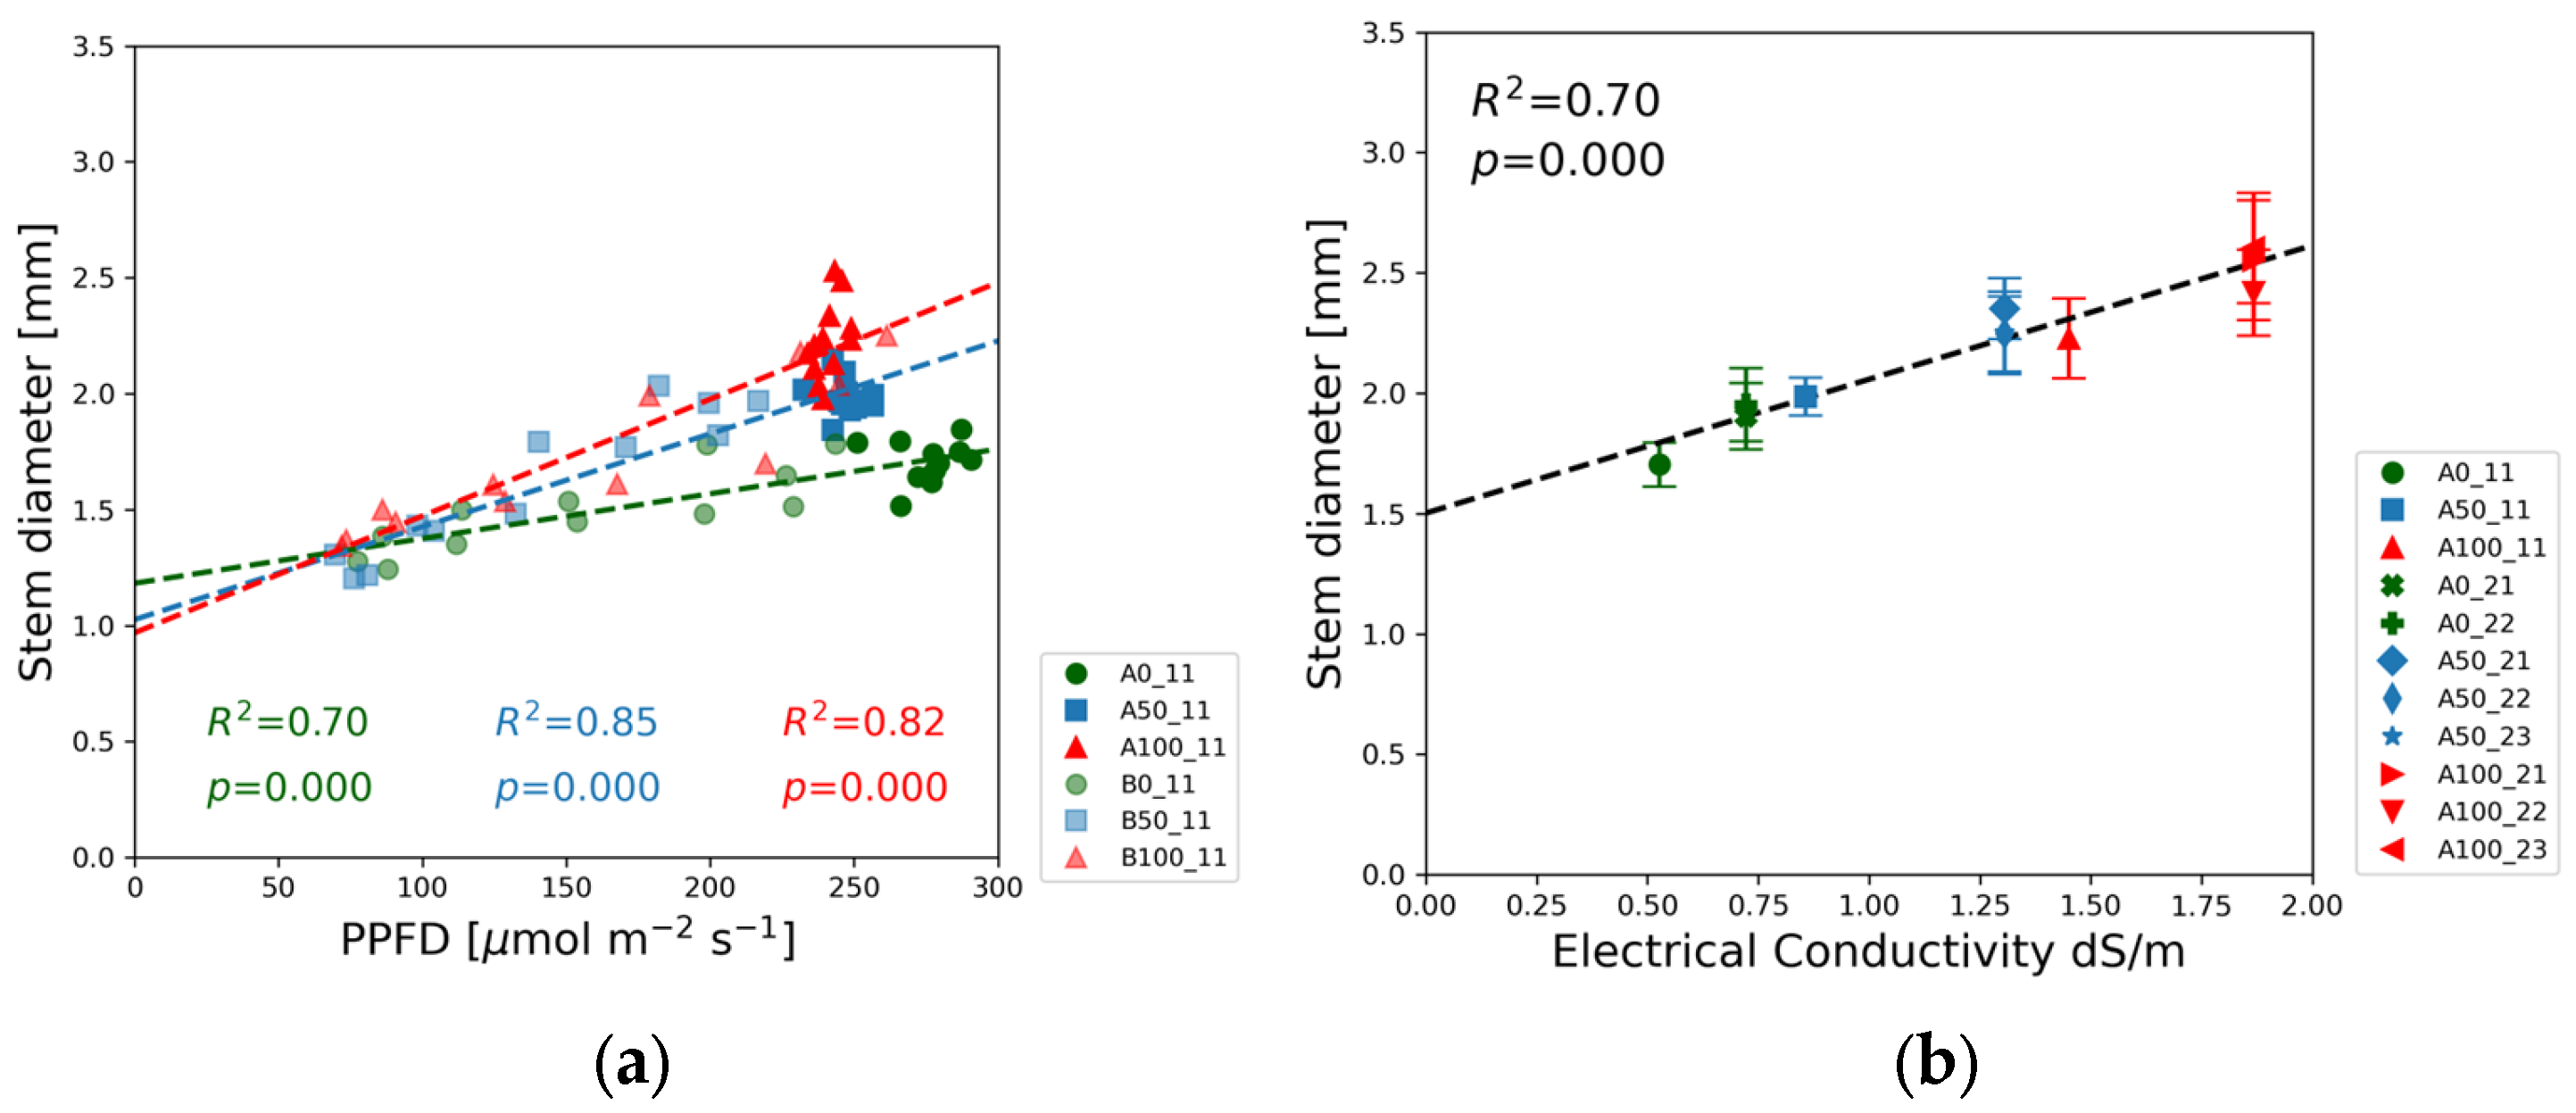
The stem diameter measured at the first internode exhibited the opposite trend compared to the light intensity dependence of shoot height.
Figure 6a demonstrates the positive linear correlation between the PPFD and the stem diameter of soybean seedlings. The red and blue data points representing the full and half-strength solutions exhibit a greater slope than the green markers of the blank solutions. The stem diameter also correlated with the EC as indicated in
Figure 6b and the results of the linear regression in
Table S2.
Leaf size was quantified by the width and length. Since these two parameters are strongly correlated, we present the leaf width data only in
Figure 7. The results of leaf length measurements can be found in
Supplementary Figure S3. The size of the leaves varied in a narrow range for half- and full-strength solutions. Neither the length nor the width changed with the PPFD except for a downward trend in the blank solutions. At high light intensity, leaf dimensions were demonstrated to be a linear function of the EC (
Figure 7b).
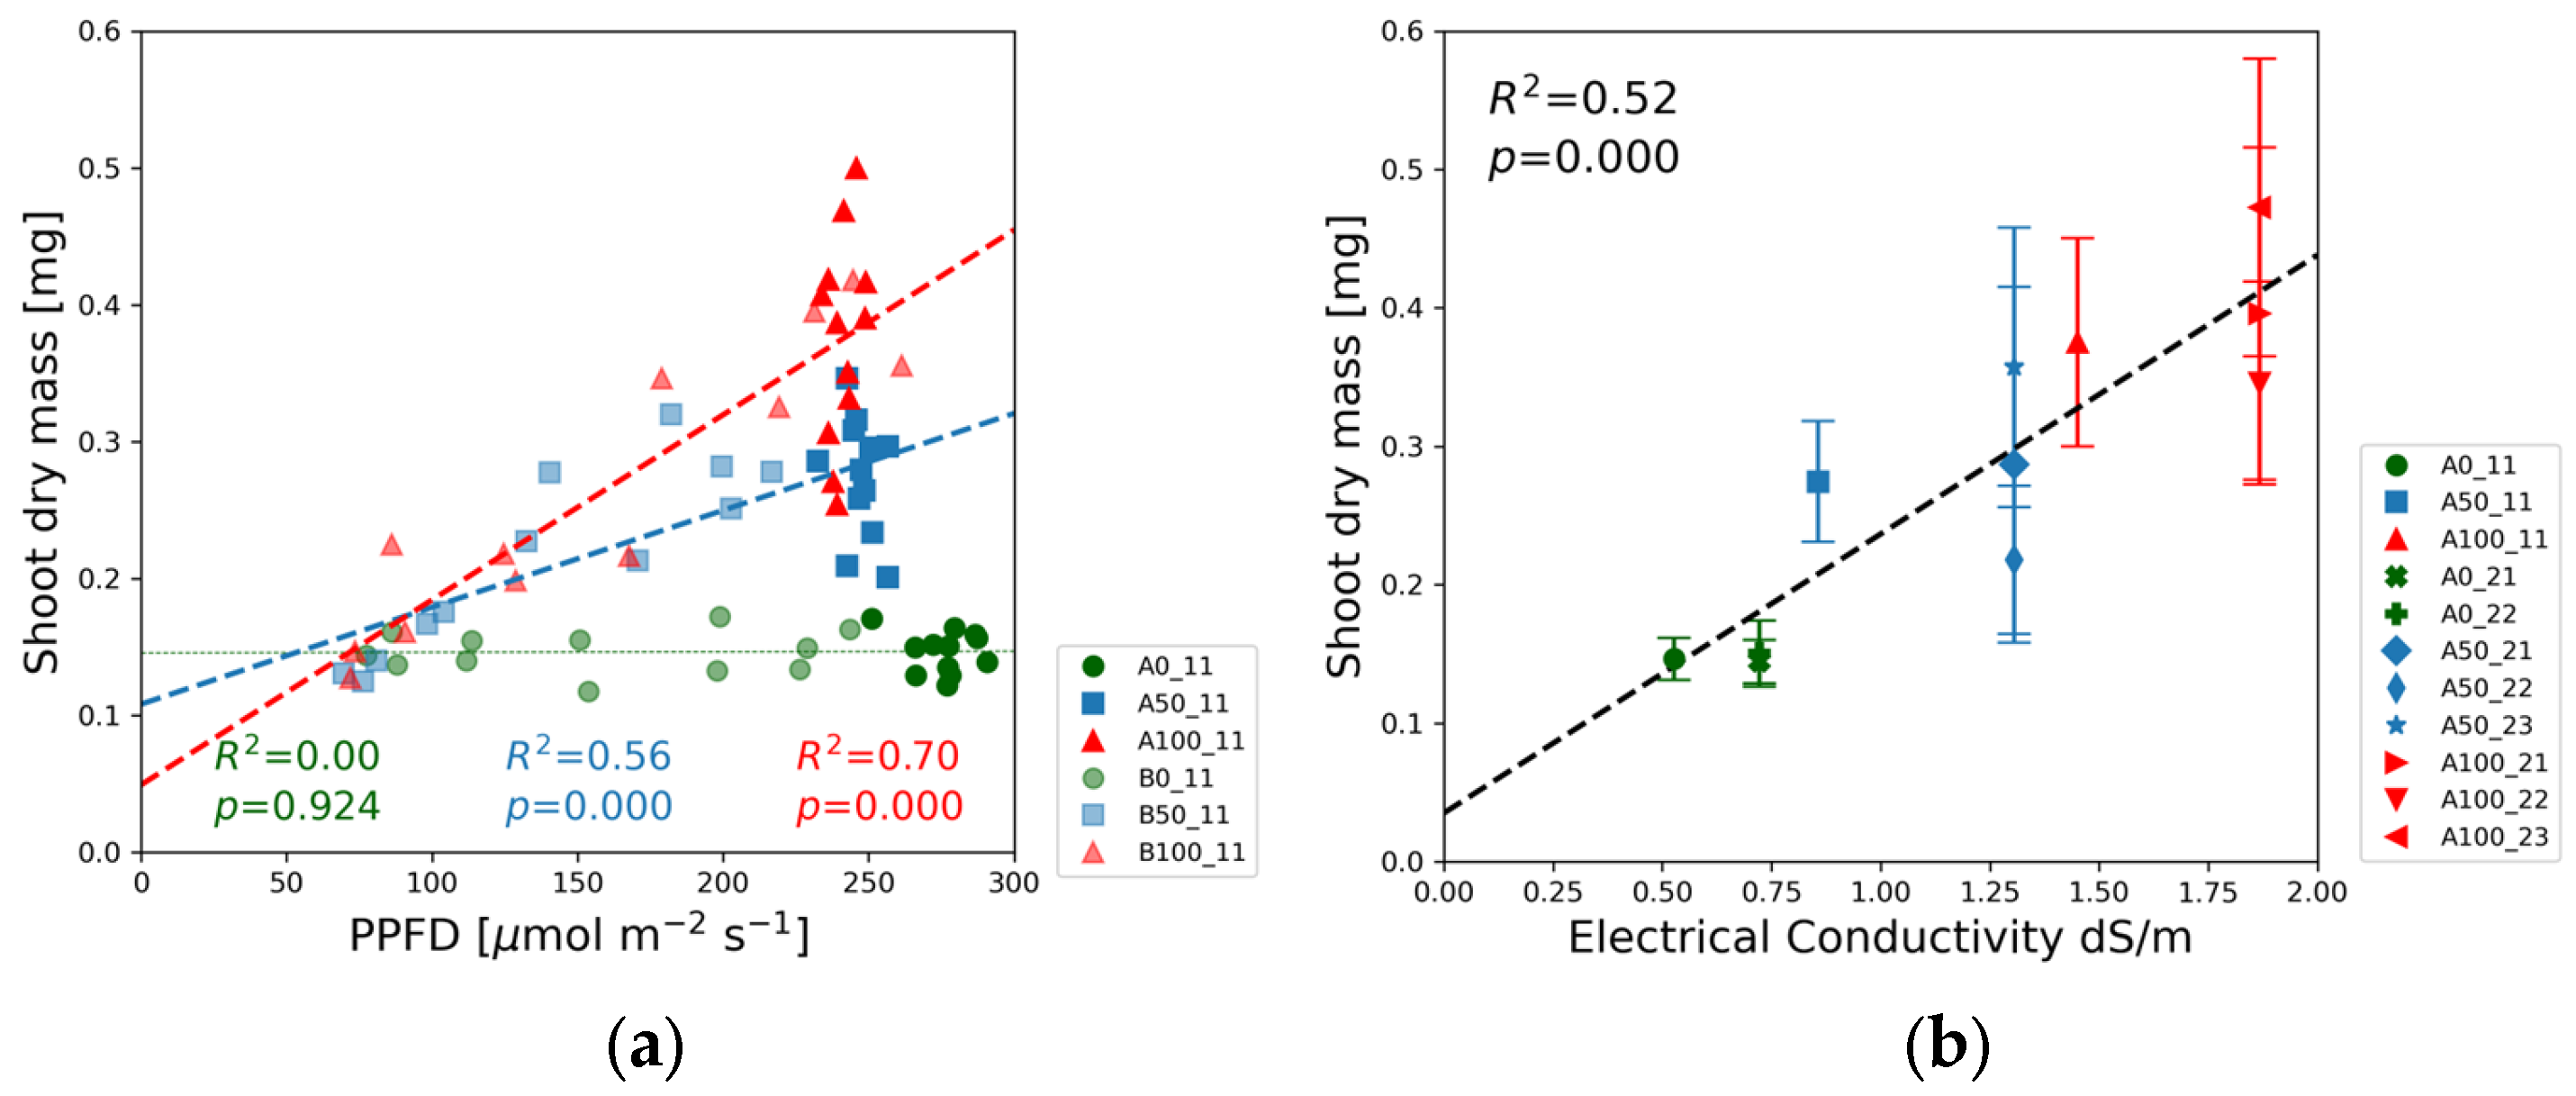
The fresh and dry masses of shoots and roots were measured for each treatment. We focus our analysis on biomass accumulation and present the shoot dry mass data in
Figure 8 and the root dry mass in
Figure 9. The fresh mass trends are similar to those of the dry mass and can be found in
Figure S3 of the Supplementary Materials.
The shoot dry mass did not change with PPFD in the blank solutions, in contrast to the half-strength and full-strength concentration levels exhibiting significant correlations with the light intensity (
Figure 8a and
Figure S3j). The biggest slope was measured for full-strength solutions. Half-strength solution data points are found in between the other two groups.
Figure 8b reveals the linear relationship between the shoot dry mass and the electrical conductivity.
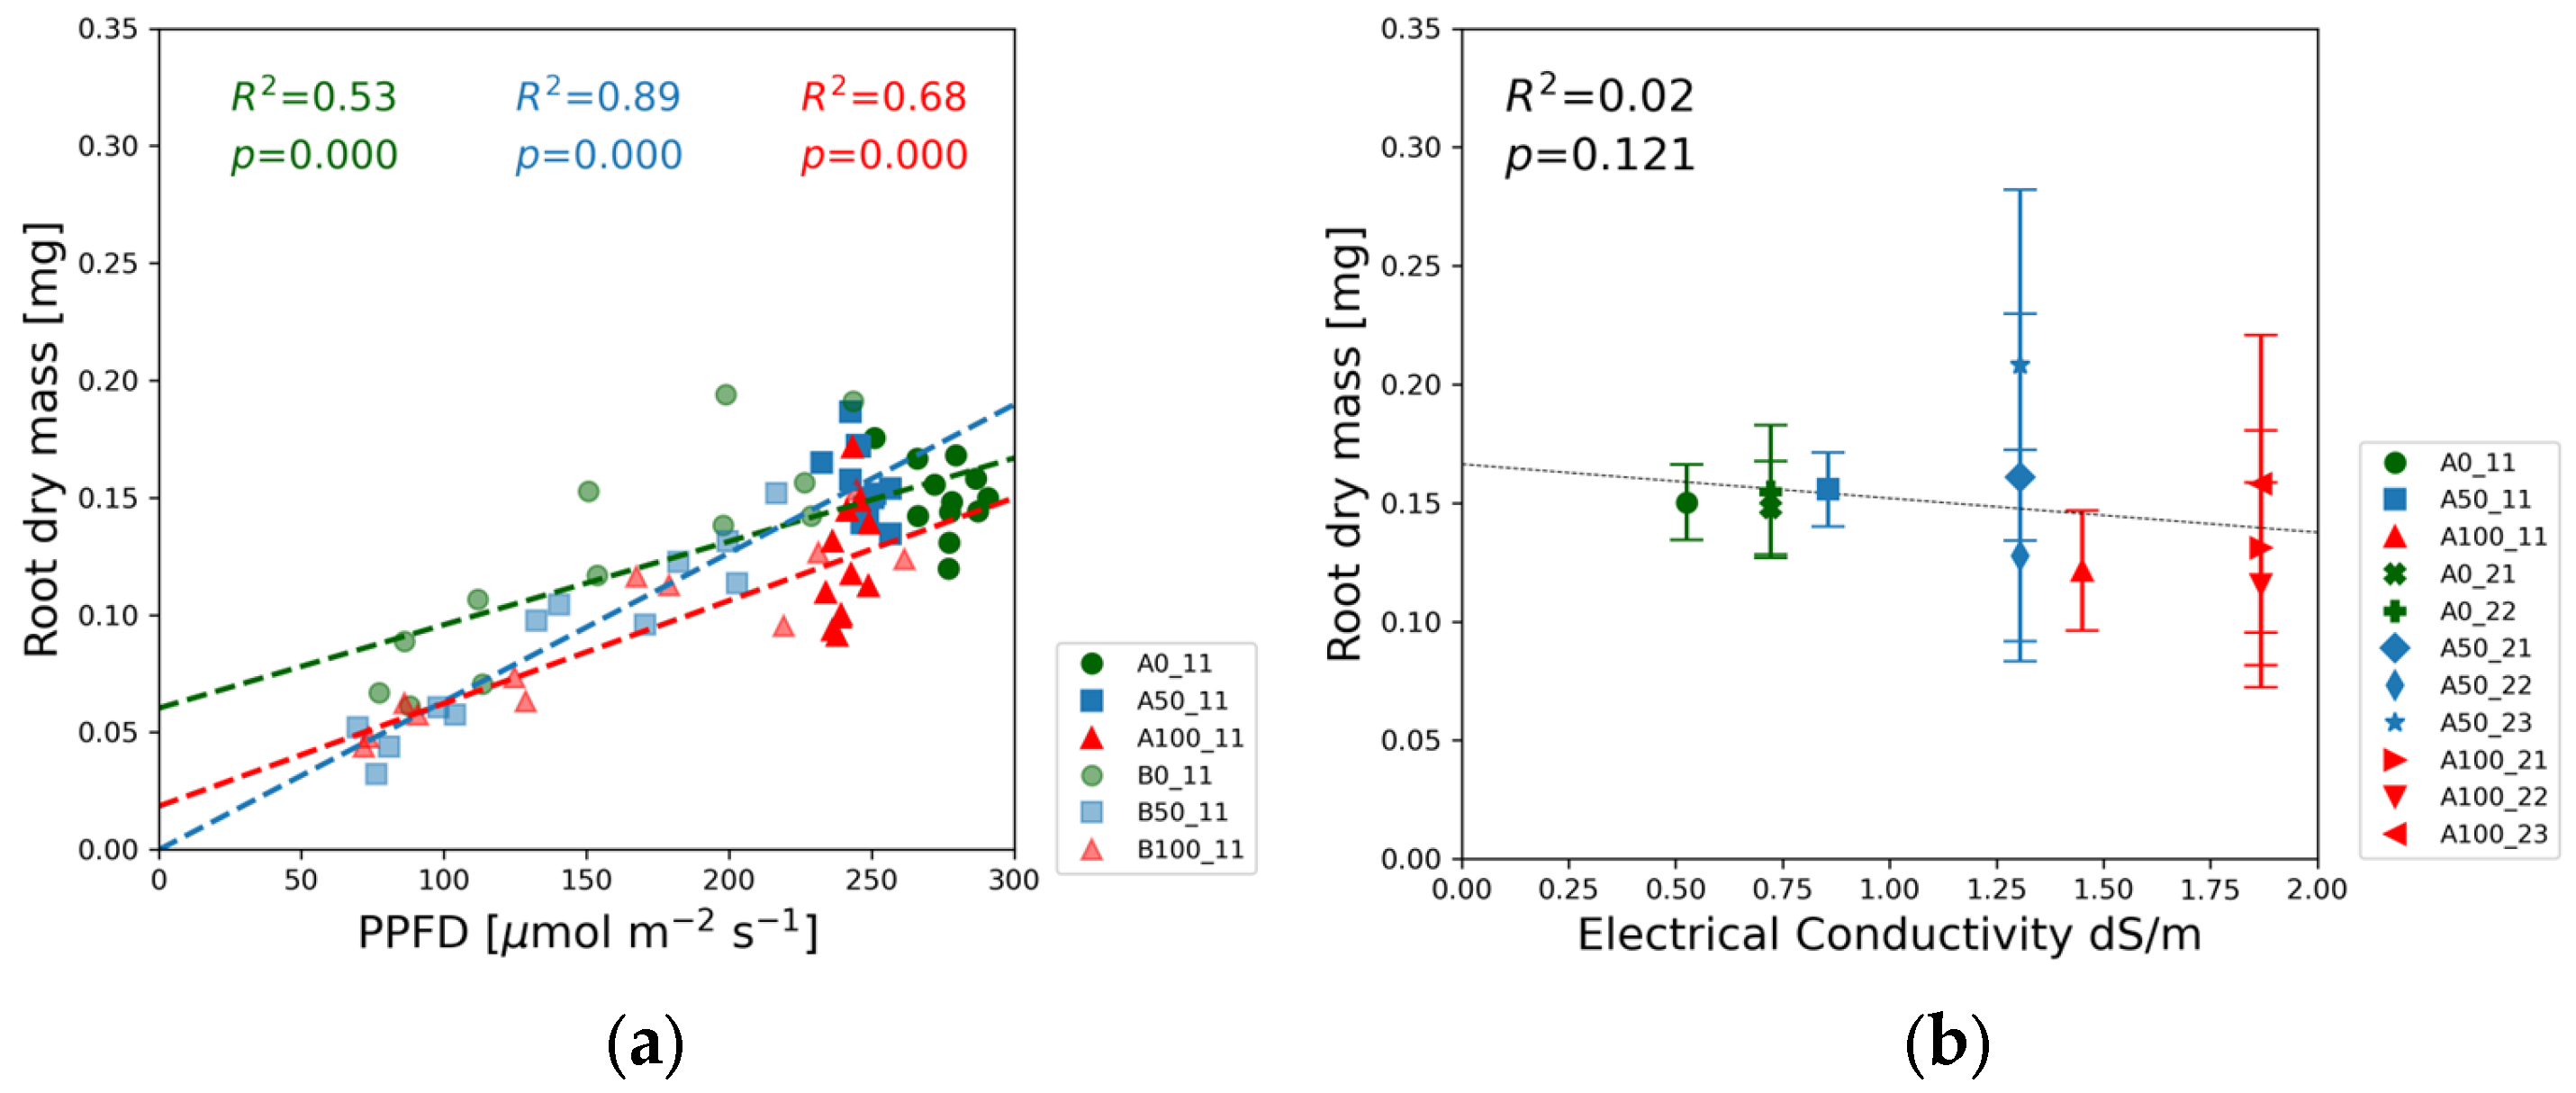
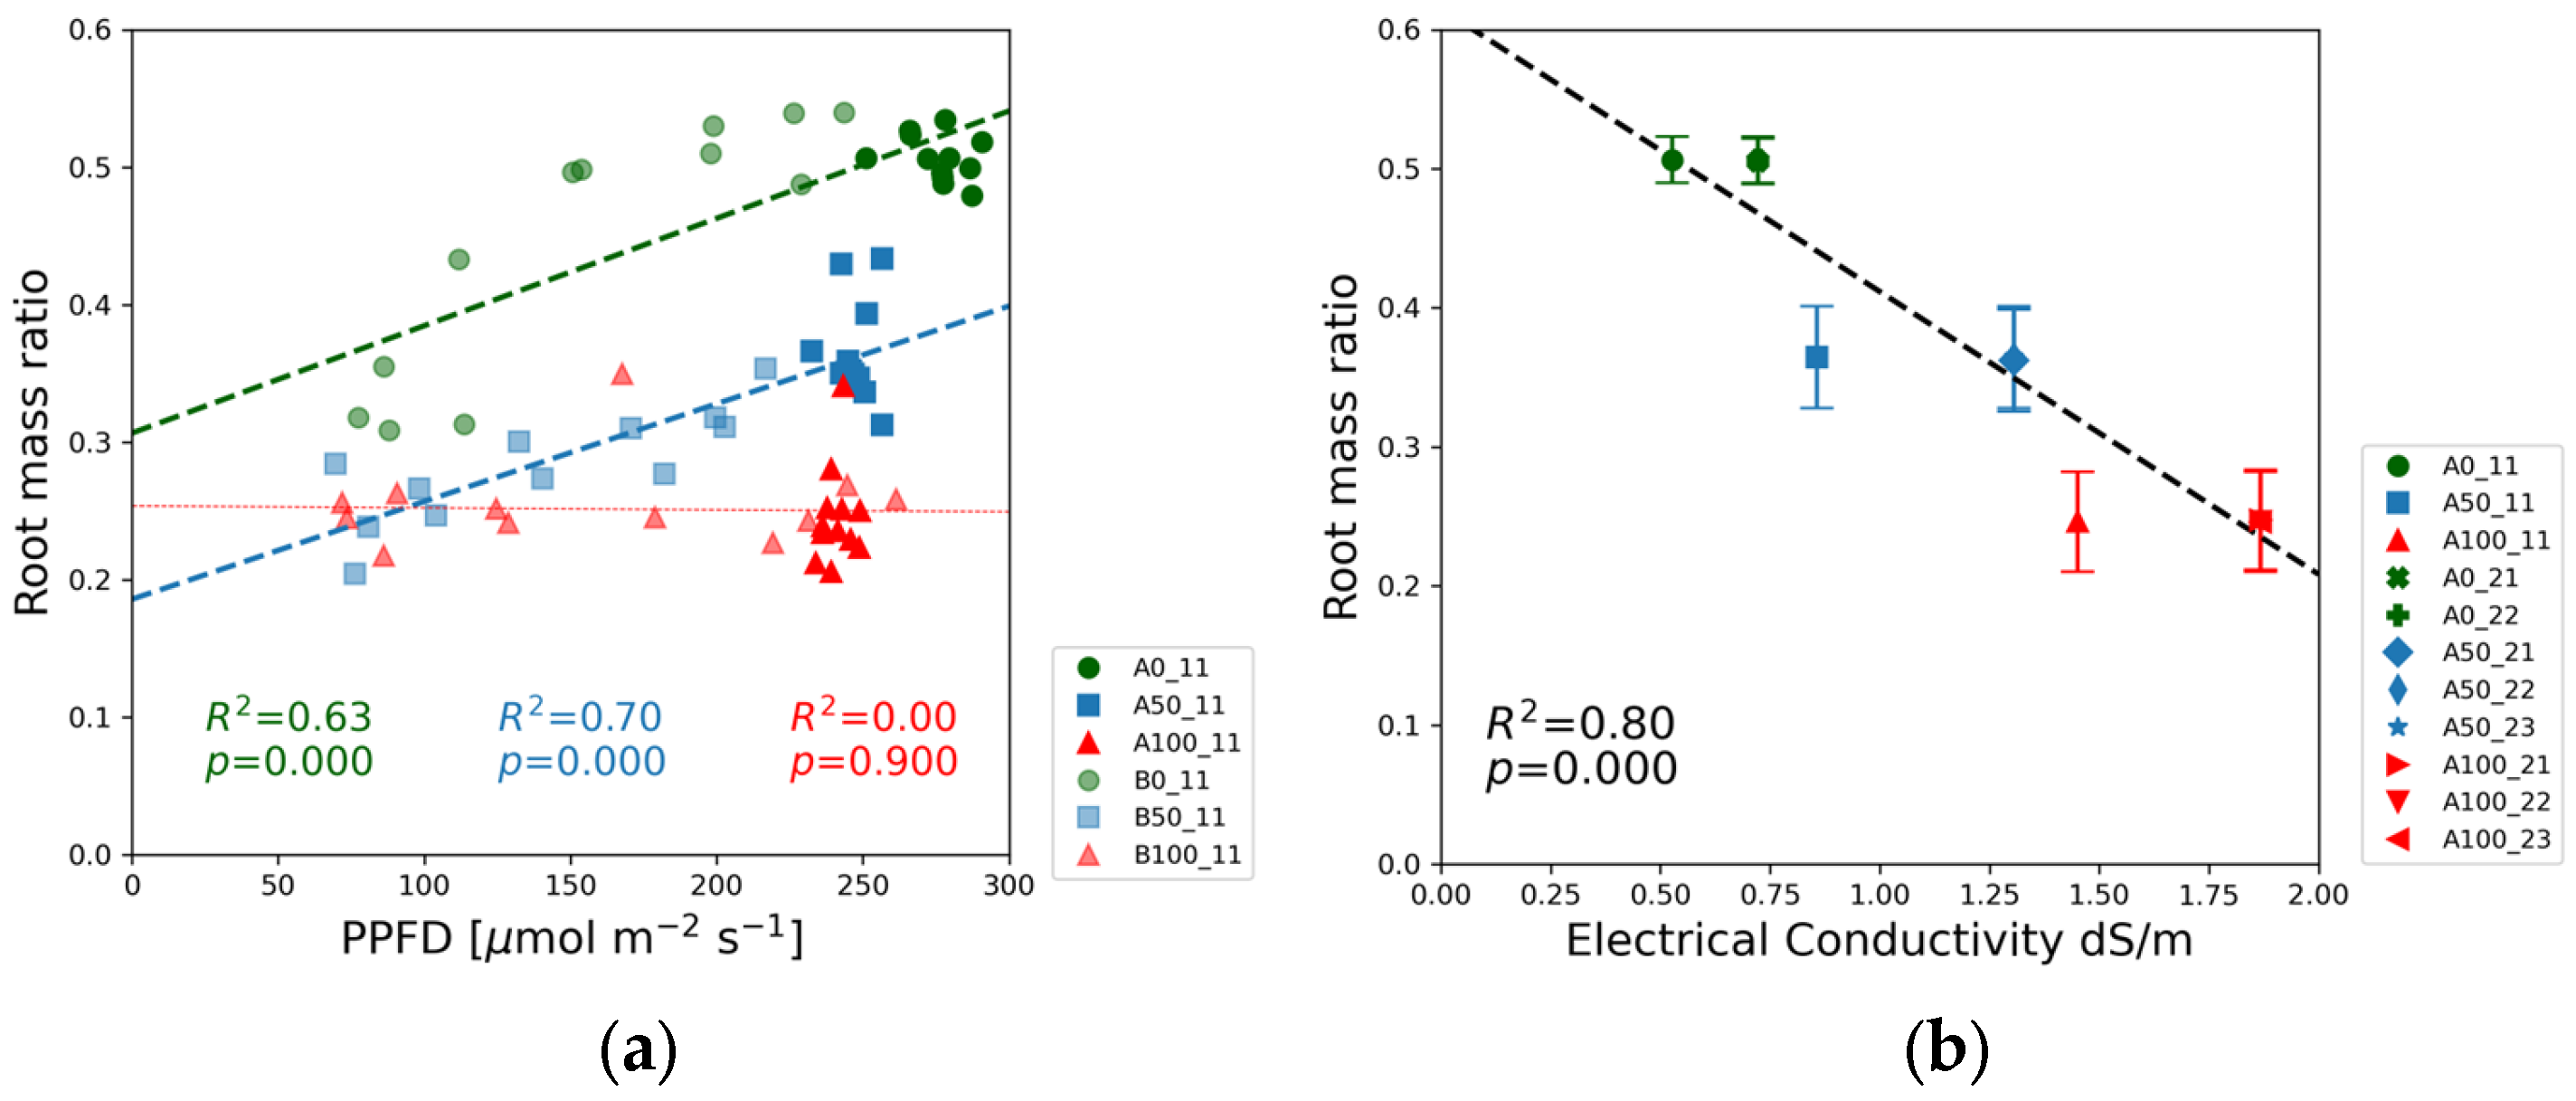
In the case of root dry mass, the solution strength order is reversed: the data points of the blank solutions are associated with the biggest values in
Figure 9a and
Figure S3k, whereas lowest dry mass values were measured in the full-strength solutions. In
Figure 9b, the slight downward trend as a function of EC is in line with this observation that root mass was the highest in the lowest nutrient concentrations.
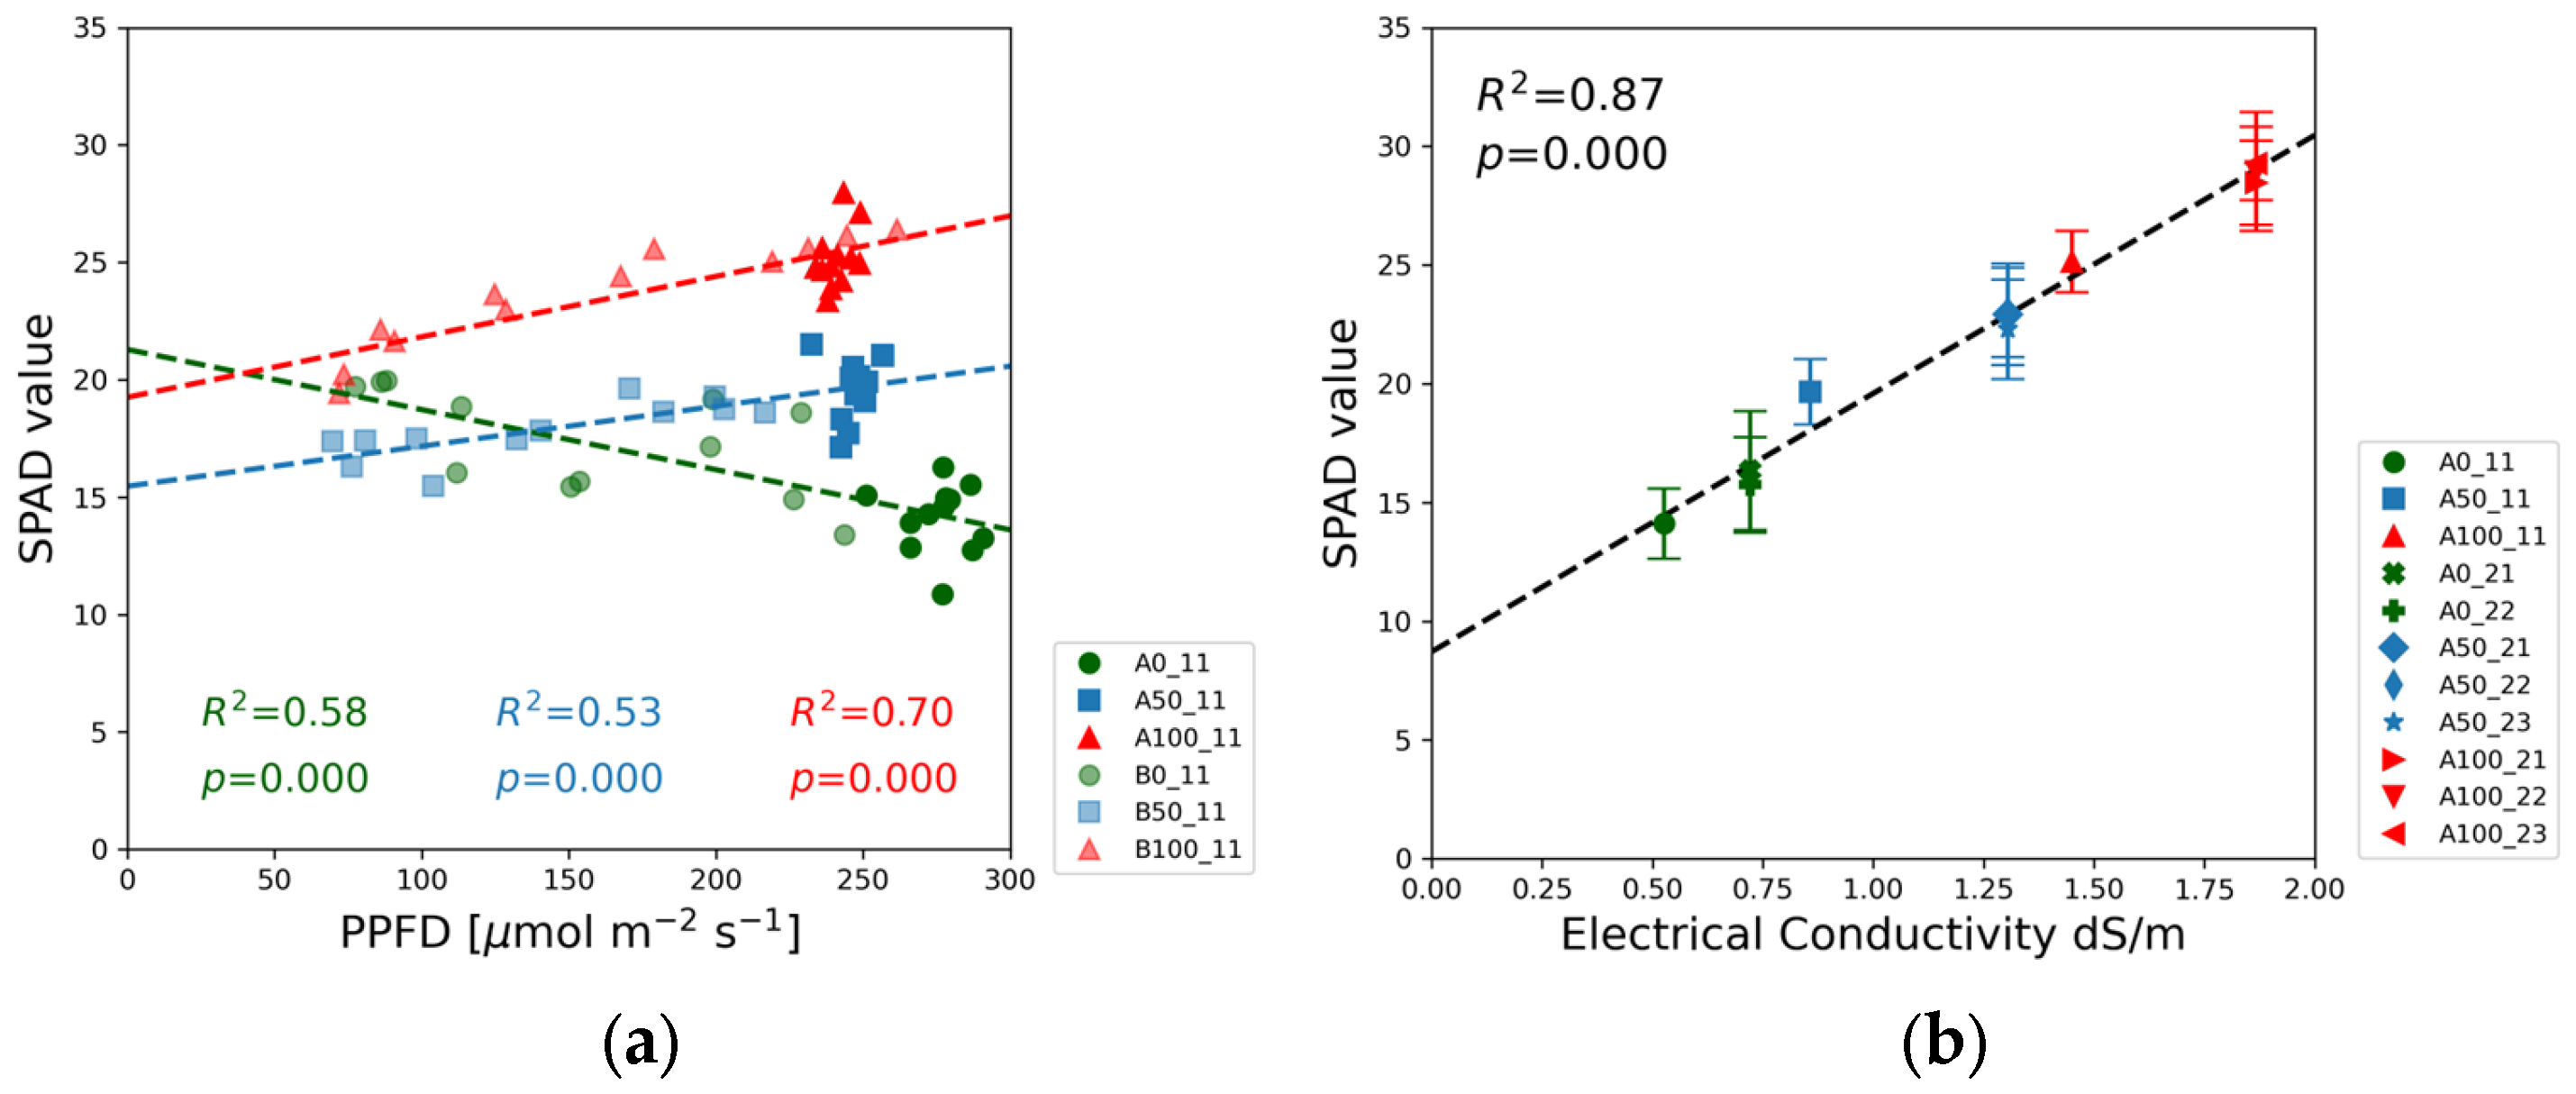
The SPAD measurements assessed the chlorophyll concentration in soybean leaves. As expected, the SPAD readings in
Figure 10b increased with the nitrogen content of the nutrient solution.
Figure 10a illustrates the interaction between nutrient concentration and PPFD in influencing chlorophyll content. The highest SPAD values correspond to the full-strength nutrient solution. In half-strength solutions, chlorophyll content was constrained by nutrient availability, yet the SPAD values showed an upward trend. In the blank solutions, the SPAD values declined with increasing PPFD.
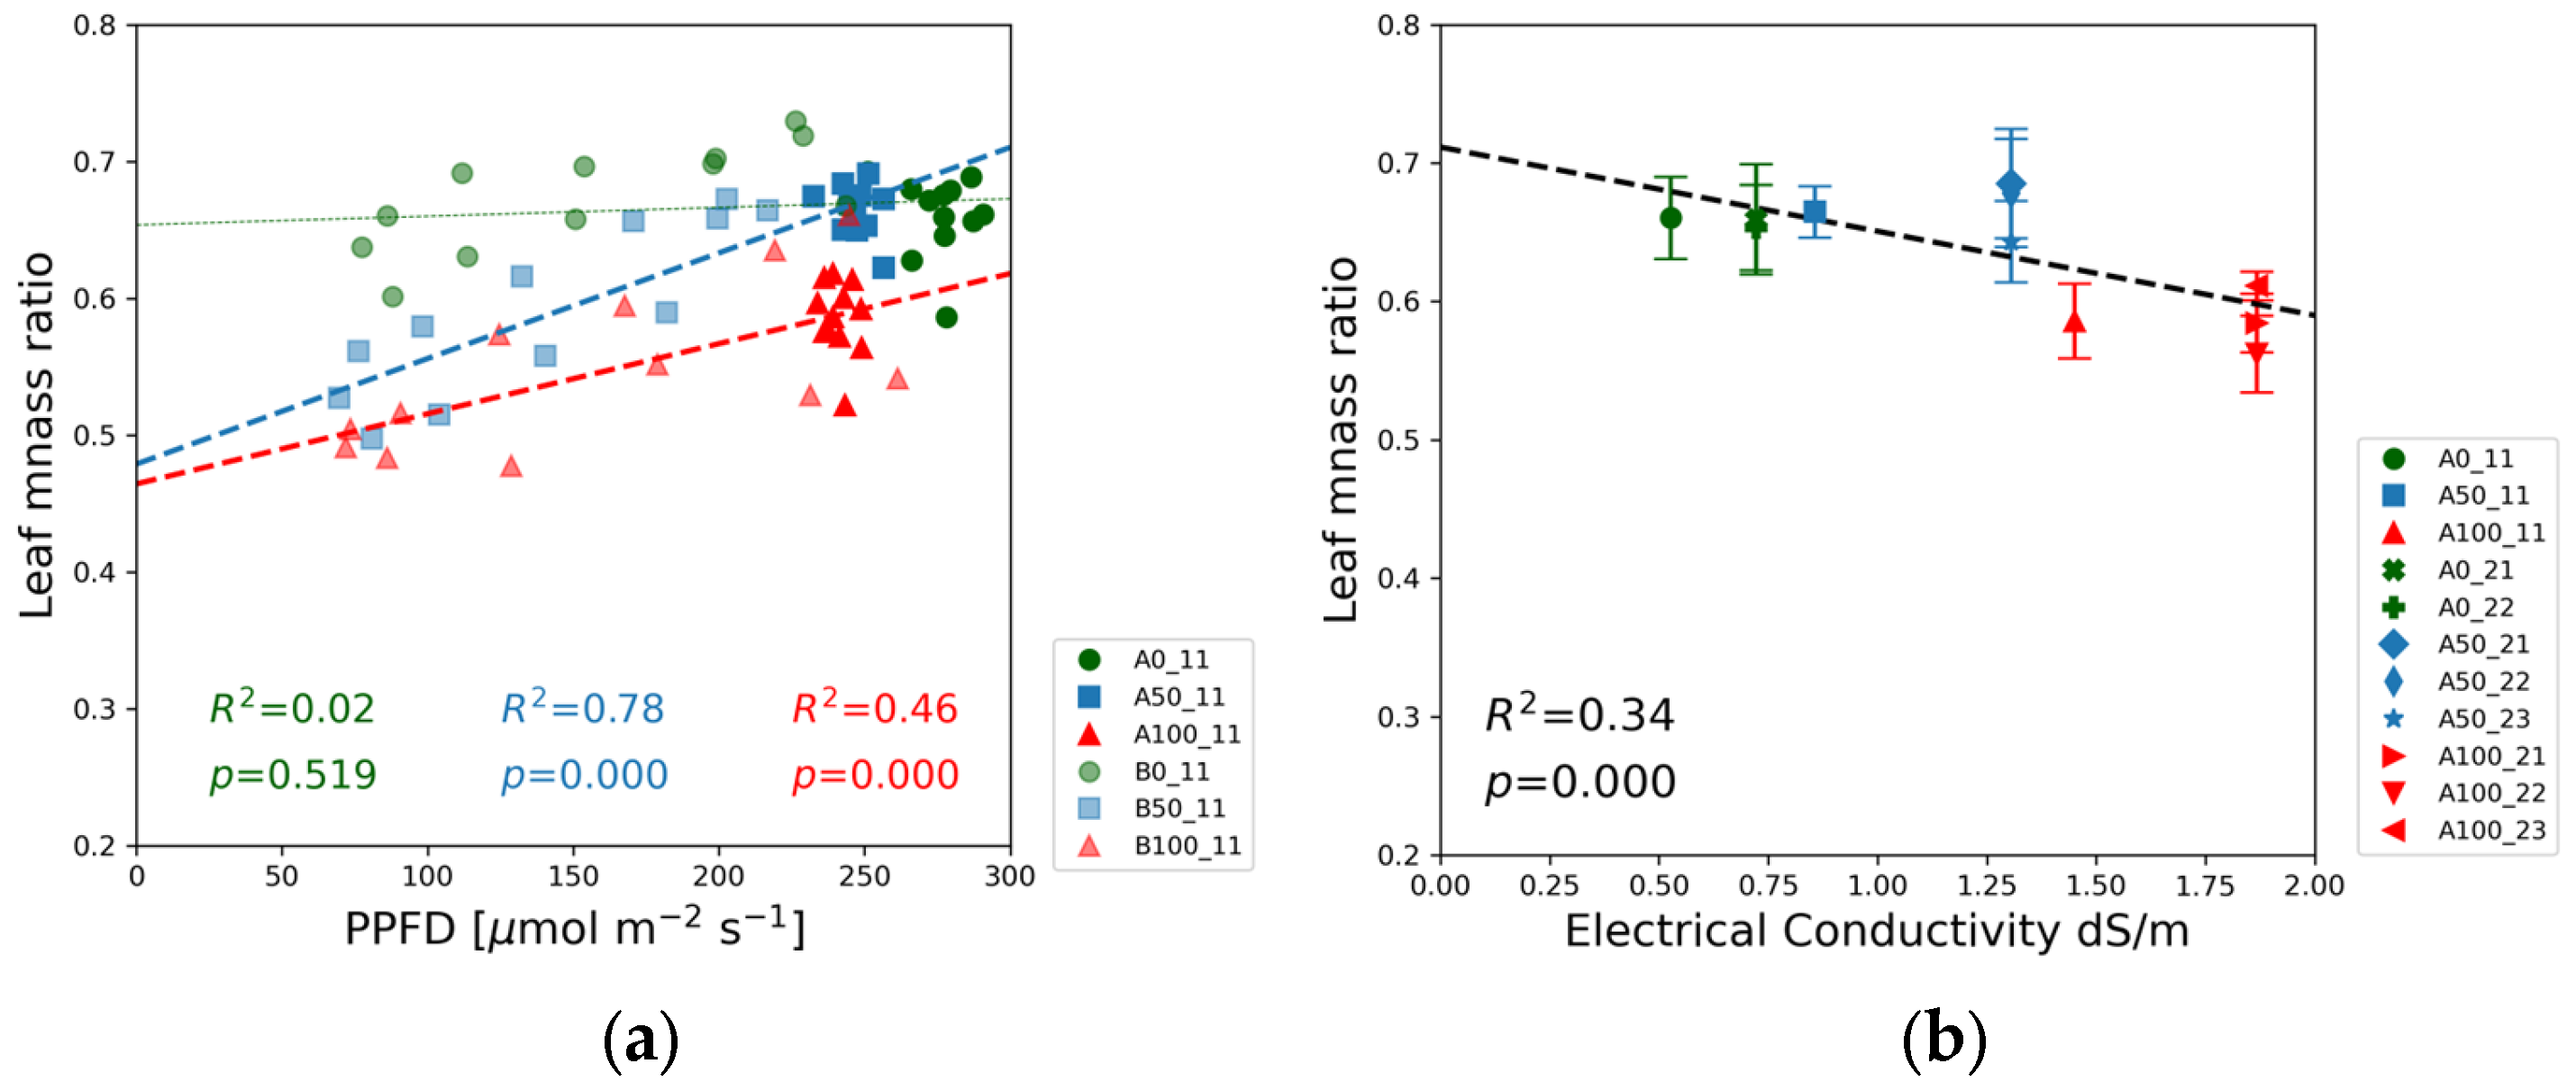
The leaf mass ratio in
Figure 11 and the root mass ratio in
Figure 12 were derived from the dry mass of the leaves, stem, and root by employing Equations (1) and (2), respectively. The leaf mass ratio was the highest for the blank solutions. The blue squares denoting the half-strength solutions are between the data points of the blank (green) and the 100% nutrient dose levels (red) in the bottom of the chart, indicating that leaf and stem development was more balanced at the highest nutrient level.
Figure 11b indicates that the leaf mass ratio gradually decreased with increasing EC.
The root mass ratio was the lowest in the full-strength solutions, and the highest values were observed in the blank solutions, as shown in
Figure 12a. The half-strength solution exhibited a statistically significant upward trend. In the full-strength solution, the root mass ratio exhibited no correlation in Experiment 1 (
Figure 12b) and a weak positive correlation in Experiment 2 (
Figure S3p). The proportion of biomass allocated was negatively correlated with the electrical conductivity.
4. Discussion
The plant parameters measured in the full-strength nutrient solutions are consistent with previous studies that investigated the light response of soybean across a broad PPFD range [
24,
25,
37,
39,
40,
41,
42,
43,
44,
45,
46]. The observed trends between growth traits and PPFD at high nutrient concentration reinforce our confidence in the measured interactive responses between nutrient availability and lighting conditions.
A general observation from the experiments is that variations in PPFD within the range of 30 to 300 µmol m
−2 s
−1, along with EC changes between 0.52 and 1.87 dS/m, induced significant responses in various plant traits. These traits included plant height, internode length, stem diameter, leaf width, leaf length, chlorophyll content, and shoot dry mass, as reflected in
Figure 4,
Figure 5,
Figure 6,
Figure 7,
Figure 8,
Figure 9 and
Figure 10. The trends in developmental response displayed in
Figure 6a,
Figure 7a,
Figure 8a,
Figure 9a and
Figure 10a were reproduced under slightly different conditions in Experiment 2. The side-by-side comparison of the plant traits as a function of PPFD are shown in
Supplementary Figure S3.
4.1. The Effect Blue Photon Irradiance and R/B Ratio on Growth Traits
Photobiological responses to light quality changes [
47,
48] are generally described by the ratio of photon irradiance levels measured in blue (400–500 nm), green (500–600 nm), red (600–700 nm), and far-red (700–800 nm) wavebands. In our experiments, the plant parameters did not exhibit a statistically significant correlation with the R/B ratio except the shoot height and the leaf width shown in
Figure S3a,f.
A possible explanation for the poor or lack of correlation with R/B is that soybeans’ response is determined by the absolute value of the blue light intensity [
49]. Although the 1.3 to 4.2 R/B ratio range was relatively wide, the corresponding blue photon flux density (BPFD) was restricted to the low intensity interval ranging from 13 µmol m
−2 s
−1 to 98 µmol m
−2 s
−1.
Several studies described a saturation effect in the developmental response of plants beyond a relatively low blue photon irradiance threshold [
25,
49,
50,
51]. The shoot elongation as a function blue photon irradiance in
Figure 4a is in agreement with these observations. Cope and Bugbee [
50] reported similar non-linear relationship between plant height and blue photon irradiance, characterized by a sharp decline in shoot length between 20 µmol m
−2 s
−1 and 50 µmol m
−2 s
−1. The plant height remained constant with further increases in blue light intensity up to 120 µmol m
−2 s
−1. Similar trends were observed in our experiments with a somewhat lower saturation threshold. In
Figure 4a, the shoot height decreases rapidly between 6 and 20 µmol m
−2 s
−1 at all nutrient concentrations. The dotted vertical line representing the saturation blue light intensity was positioned at 40 µmol m
−2 s
−1. The shoot height saturation level depended on the solution strength. The shortest plants developed in the blank solution, whereas the shoot height was the highest in the full-strength solution.
The same non-linear trend and threshold was seen in
Figure 5a displaying the blue light intensity dependence of the first internode length. In contrast to the shoot height, the first internode length was independent of the nutrient concentration. All data points of Experiments 1 and 2 in
Figure 5a follow the same declining trendline, indicating that the cotyledon was the primary nutrient supply during the elongation of the first internode. At later stages of plant growth, during the development of second and higher sets of true leaves, the nutrient availability limited the shoot elongation.
In soybean experiments carried out under narrowband red and blue LEDs, Hitz et. al. found greater than 40 µmol m
−2 s
−1 blue photon irradiance thresholds in the range of 210 and 310 μmol m
−2 s
−1 [
25]. The order of magnitude difference in the blue saturation threshold compared to previous reports [
50,
51] was attributed to the presence or absence of green light in the photon irradiance spectra. Our experiments do not support this hypothesis. Experiment 1 containing green light and Experiment 2 employing monochromatic red and blue LEDs without green exhibited similar saturation responses in
Figure 4a and
Figure 5a.
4.2. The Effect of Light Intensity and Nutrient Concentration on Growth Traits
Since the blue waveband is part of the PAR range, the plant height and internode length also correlate with the PPFD. The linear relationships in
Figure S3s–v exhibited by the full strength and half-strength solution data are in agreement with the linear trends reported by other studies [
24,
25].
Figure 6a illustrates that stem elongation is accompanied by a reduction in the stem diameter as a response to shade in agreement with previous studies [
24,
25].
Figure 6a also reveals that the slope of the diameter response function in the blank solution was lower compared to the slopes observed at higher concentrations. This is an indication that nutrient availability limited stem thickness. The EC dependence of the stem diameter is shown in
Figure 6b.
The increasing concentration of nutrients increased the leaf size at a sufficiently high light intensity, as reflected by
Figure 7 and
Figure S3c–f.
Figure 7a and the low R
2 and high
p-values in
Table S3 indicate that leaf dimensions show a weak correlation or are independent of light intensity at the 100% and 50% concentrations. Other publications reported a slight increase in the leaf dimensions with decreasing photon flux density [
25,
50]. The nutrient scarcity in the blank solutions, however, induced a strong negative light response in terms of the leaf size, delivering the largest leaves at the lowest photon irradiance level.
The SARs of the soybean to increase height and leaf size aim at maximizing light interception and promoting photosynthesis. The overall efficiency of photosynthesis is also influenced by the concentration of photosynthetic pigments in the leaves [
45]. Chlorophyll plays an important role in absorbing light in the 400 nm and 700 nm waveband required for photosynthesis. The chlorophyll content of leaves, as indicated by SPAD readings, is influenced by the interaction between light intensity and nutrient availability, as shown in
Figure 10a. In the case of full-strength and half-strength nutrient solutions, the SPAD values exhibit a positive correlation with PPFD, whereas, in the blank solutions, the slope of the regression lines was negative.
Under the strong nutrient limitation, the highest SPAD readings were recorded at the lowest PPFD. The SPAD values decreased as the PPFD increased. A similar shade response was observed in tea (
Camellia sinensis L.). The concentration of chlorophyll and carotenoids increased in tea leaves due to shading against direct sunlight exposure [
52].
Figure 10b reflects the response of soybean seedlings to EC variations in the nutrient solutions at high PPFD. The highest SPAD readings were taken on the leaves grown in the full-strength solutions in the range of 25–35, corresponding to a typical level that can be measured on the leaves of field crops. The SPAD value decreased as the nitrogen concentration was reduced. A decrease in chlorophyll content in the plant significantly reduces the soybean’s ability to capture light and limits the rate of photosynthesis [
44]. These findings agree with previous research on soybeans carried out in a broad PPFD range from 100 to 500 µmol m
−2 s
−1 [
45,
46].
4.3. The Effect of Light Intensity and Nutrient Concentration on Biomass Partitioning
The biomass accumulated during plant growth and development is directly related to the carbon fixation process. The dry mass of the plants was the highest in the case of 100% nutrient concentration and highest PPFD levels, providing the best conditions for photosynthesis. The minimum dry mass was measured in plants grown under restricted lighting conditions without added nutrients. The biomass partitioning among the leaves, shoots, and roots reflects the competition among the regulating mechanisms fostering access to nutrients and light within an individual plant.
Figure 8a shows no correlation between the shoot dry mass and the PPFD for the blank nutrient solution. The low value of the coefficient of determination, R
2 < 0.01, and
p-value > 0.05 in
Table S3 indicate that the mass accumulation was limited by the nutrient availability in Experiments 1 and 2. In both half-strength and full-strength nutrient solutions, a significant positive correlation was observed between the shoot dry mass and PPFD. The increasing slope of the fitted regression lines with augmented solution strength suggests that the allocation of biomass to the shoot is promoted by increasing the nutrient availability.
The biomass partitioning characteristics for different treatments are better reflected by the leaf and root mass ratio derived from the measured leaf, stem, and root dry mass data. In our study, the leaf mass ratio was defined as the quotient of the leaf dry mass and the shoot dry mass, reflecting the proportion of the biomass allocated to the leaves within the shoot system comprising the leaves and the stem.
Figure 11 highlights the importance of leaf development for the seedlings growing under limited nutrient availability. The highest leaf mass ratio was observed in the blank solutions, whereas relative biomass allocation to the leaves was the lowest in the case of full-strength solutions. These data indicate that under conditions of nutrient scarcity, the regulatory mechanisms of soybean growth foster the development of leaves at the expense of stems to maximize leaf area and light interception. A similar conclusion can be drawn from the experiments of Mandal et al. [
27]. The leaf mass ratios calculated for 4-week-old soybean seedlings grown in a water culture at normal NPK concentration and without NPK fertilizer were 0.633 and 0.645, respectively, exhibiting the same trend in
Figure 11b.
In contrast to the shoot response, the root dry mass was the highest in the blank nutrient solutions, although the mass differences between the different concentration levels were less pronounced compared to that of the shoots. The biomass accumulation in the root system strongly correlated with PPFD (
Figure 9a). The green data points referring to the 0% nutrient dose level in Experiment 2 (
Figure S3l) fluctuated around a constant high value, whereas in Experiment 1 the root dry mass decreased with decreasing PPFD. This difference may be attributed to the different water treatments and higher nitrate ion concentrations in Experiment 2 relative to Experiment 1.
The root dry mass followed a steady downward trend with increasing EC in
Figure 9b, although the correlation at
p = 0.121 cannot be regarded as statistically significant.
The plant’s strategy to maximize the chance for finding nutrients is more obvious in
Figure 12, depicting the PPFD (a) and EC (b) dependence of the root mass ratio. The highest proportion of biomass was allocated to the root system in the case of the blank nutrient solution. The green markers in
Figure 12a indicate that the root mass ratio increased as a function of PPFD from 75 to 200 µmol m
−2 s
−1, followed by a flat section between 200 and 300 µmol m
−2 s
−1. In Experiment 2, however, the root mass ratio was independent of PPFD in the entire PPFD range, as displayed in
Figure S3p. This different behavior can be attributed to the higher nitrate concentration in the blank solution in Experiment 2 compared to Experiment 1. The decreasing value of the slope of the regression lines from low to high nutrient concentrations is another sign of the interrelationship between nutrient concentration and light intensity. Independently from the slight differences between Experiments 1 and 2 the root mass ratio as a function of the EC followed the same trendline, with a negative slope in
Figure 12b. This observation agrees with the experiments of Mandel et al. [
27], where the root mass ratios of 4-week-old soybean seedlings were 0.74 and 0.85 for those grown in nutrient solution with and without added NPK fertilizer, respectively. The absolute values of root mass ratios were different from our experiment since the seedlings’ ages and other experimental conditions were different.
Finally, the comparison of Experiments 1 and 2 provided some information about the role of nutrients in soybean growth. The higher EC level in Experiment 2 compared to Experiment 1 was due to the higher nitrate content, while the concentrations of other nutrients were the same in the blank, half-strength, and full-strength solutions. Comparison of the green (0), blue (50), and red (100) markers reveals the effect of nitrate ions on the measured plant parameters. According to our expectations, SPAD values steadily increase with the increasing nitrate content (and EC) in
Figure 10b. In
Figure 4b, however, the green, blue, and red data points form three distinct groups with no significant difference in the shoot heights between Experiments 1 and 2 corresponding to the same solution strength. A similar observation can be made for the root mass ratio in
Figure 12b. The solution strength determined the root mass ratio at high light intensity, but the moderate increase in nitrate concentration from Experiment 1 to Experiment 2 did not result in significant changes in the root mass ratio.
The Ca concentration was probably not a growth-limiting factor in these experiments because of the significant hardness of the water used to prepare the nutrient solutions. The blank solution already contained 1.8 mM Ca, corresponding to 62% of the Ca concentration (2.87 mM) in the full-strength solution. More tests would be required to determine the specific role of individual nutrients and their interactions in limiting plant growth at different solution strengths and lighting conditions.


 ,
, 

