Article

Response of the Stabilization of Organic Carbon to Straw Incorporation and Nitrogen Application: Evidence from Carbon Fractions and Bacterial Survival Strategies

1
State Key Laboratory of Nutrient Use and Management, Key Laboratory of Agro-Environment of Huang-Huai-Hai Plain, Ministry of Agriculture and Rural Affairs, Institute of Agricultural Resources and Environment, Shandong Academy of Agricultural Sciences, Jinan 250100, China
2
National Center of Technology Innovation for Comprehensive Utilization of Saline-Alkali Land, Dongying 257347, China
3
College of Resources and Environment, Qingdao Agricultural University, Qingdao 266109, China
4
School of Ecology and Biology, Dongying Vocational College, Dongying 257091, China
*
Authors to whom correspondence should be addressed.
Agronomy 2025, 15(5), 1034; https://doi.org/10.3390/agronomy15051034
Submission received: 31 March 2025 / Revised: 21 April 2025 / Accepted: 23 April 2025 / Published: 25 April 2025

Abstract

:
Despite the global imperative to enhance carbon sequestration in agricultural landscapes, saline–alkali soils present distinctive soil–microbe constraints that limit our understanding of optimal management strategies. This study addresses critical knowledge gaps regarding the mechanistic relationships between bacterial community structure and carbon stabilization processes in saline–alkali soil. A three-year field experiment was conducted in the Yellow River Delta, China, with two N levels (N1, 270 kg N ha−1; N2, 210 kg N ha−1) and three C treatments (S0, 0 kg C ha−1; S1, 5000 kg C ha−1; S2, 10,000 kg C ha−1). SOC sequestration by straw incorporation increased by 16.34–22.86% and 8.18–11.91%, with no significant difference between the S1 and S2 treatments, because the specific C mineralization rate (SCMR) of the S2 treatment was 13.80–41.61% higher than the S1 treatment. The reduced nitrogen application (N2) enhanced SOC sequestration efficiency by 3.40–12.97% compared with conventional rates, particularly when combined with half straw incorporation. Furthermore, compared with the N1S1 treatment, the N2S1 treatment induced qualitative transformations in carbon chemistry, increasing aromatic carbon compounds (28.79%) while reducing carboxylic fractions (10.06%), resulting in enhanced structural stability of sequestered carbon. Bacterial community analysis revealed distinctive shifts in bacterial composition under different treatments. Half straw incorporation (S1) increased the abundance of oligotrophic strategists (Verrucomicrobiae and Acidimicrobiia) while decreasing copiotrophic bacteria (Bacteroidia), indicating a transition from r-strategy to k-strategy microbial communities that fundamentally altered carbon cycling. Half straw incorporation and reduced N application were beneficial to stabilize SOC composition, reduce mineralization rates, optimize bacterial survival strategy, and thus achieve SOC sequestration.

1. Introduction

Soil organic carbon (SOC) sequestration represents a critical strategy for both mitigating climate change and enhancing agricultural sustainability [1]. Through intensive farming, agricultural soil has lost 20–60% of its primary carbon (C) storage [2]. By improving management practices (such as straw incorporation and nitrogen application), there is huge potential for C recovery [3,4]. However, this sequestration potential faces significant obstacles in degraded landscapes [5], especially in saline–alkali soil [6]. Therefore, in order to enhance the stability and biodiversity of agro-ecosystems, endeavors have been made to explore more effective strategies concerning soil C and N cycles, such as implementing straw incorporation practices and optimizing fertilizer application rates [7]. For example, straw incorporation is believed to enhance soil C stability, while reducing N fertilizer application can mitigate the adverse effects of excessive fertilization, thereby promoting the maintenance of soil characteristics and optimizing microbial structures [8]. Despite concerted efforts, the current comprehension of the synergistic impacts of straw returning and N fertilizer incorporation on SOC retention and N availability in saline–alkali soils at the microscale remains limited.
SOC is classified into different fractions based on distinct physical and chemical properties, which helps gain a deeper comprehension of the C cycle in soil [9]. Among them, particulate organic carbon (POC) and mineral-associated organic carbon (MAOC) are components of SOC [10,11]. The main components of POC are high molecular compounds of plant residues such as straw and litter, which are protected by the inherent structure and biochemical properties of the soil [12], making them relatively stable and resistant to decomposition [13], while MAOC is mainly composed of low molecular weight compounds, whose chemical bonds can prevent decomposition [14]. On the other hand, different functional groups of OC, such as aromatic-C, polysaccharide-C, and carboxyl-C, can also have varying degrees of influence on the stability of SOC, and have different reactions to straw incorporation and N application [15]. It has been found that straw incorporation can increase the accumulation of MAOC and change the chemical composition of SOC [16]. Meanwhile, the addition of N can significantly increase POC and MAOC in the pools, but an excessive N addition can reduce MAOC/SOC and MAOC/POC [17,18]. Previous studies have indicated that the composition of microbial communities influenced by fertilization is primarily affected by the labile organic carbon (OC) pool, including dissolved organic carbon (DOC) and microbial biomass carbon (MBC) [19]. However, the combined effects of straw incorporation and N application on the composition and sequestration of SOC in saline–alkali soil remain unclear.
Microorganisms are an important factor affecting the composition of SOC in saline–alkali soil, and they are also the main regulator of soil C mineralization [20]. Microorganisms not only release OC in the form of CO2 into the atmosphere through various metabolic pathways but also convert exogenous C (straw incorporation) into microbial residues, which are stored in an aggregated form through synthetic metabolism [21,22,23]. The ultimate impact of these processes on C retention and loss is contingent upon the soil micro-environment [24]. For instance, in well-aerated soils, the thriving of aerobic microorganisms facilitates the decomposition of SOM and leads to elevated rates of C mineralization, potentially resulting in increased C loss [25]. In addition, bacteria are key catalysts for soil material cycling and dynamic changes, and bacterial community composition (e.g., the balance between r-strategies and k-strategies) plays a crucial role in improving the efficiency of soil C cycling [26]. Thus, the balance of C input and output in soil is significantly influenced by microbial activity [27]. However, the current knowledge regarding the impacts of soil microbial communities on C mineralization and retention remains limited in saline–alkali soil.
The global extent of saline–alkali soil exceeds 9.5 × 10⁹ ha, with China alone accounting for approximately 9.9 × 10⁸ ha [28]. The global loss of SOC due to salinization is projected to exceed 6.7 Pg by 2100 [29]. The Yellow River Delta is one of the largest saline–alkali wetlands in China, but the understanding of the impact of soil microbial communities on its carbon mineralization and conservation remains limited [30]. The objectives of this study were as follows: (i) examine the impact of straw incorporation and N application on C components and SOC mineralization; (ii) investigate the alterations in microbial activity and bacterial survival strategy after the combined application of straw incorporation and N application; (iii) elucidate the mechanisms by which straw incorporation and N application enhance C sequestration in saline–alkali soil. We assumed that half straw incorporation with reduced N application could increase SOC sequestration by improving C component stability and reducing SOC mineralization, with bacteria associated with k-strategy and r-strategy being a major driving factor in saline–alkali soil.

2. Materials and Methods

2.1. Site Description

The experiment was conducted in Guangrao County of Shandong Province, China (37°18′36″ N, 118°39′20″ E) in October 2021. The area has a typical monsoon climate, and the soil type is saline–alkali. The main farming system is summer maize and winter wheat rotation. Detailed information on the location, climate, and soil characteristics of the study site before the start of the experiment in 2021 is shown in Table 1.

2.2. Experimental Design

During the wheat season, six treatments were designed, which included two N levels (N1, traditional N application, 270 kg N ha−1; N2, reduced N application, 210 kg N ha−1) and three C treatments (S0, no straw incorporation, 0 kg ha−1; S1, half straw incorporation, 5000 kg ha−1; S2, total returning of straw, 10,000 kg ha−1), respectively. Three replicates were conducted for each treatment, resulting in a total of 18 plots, which were completely randomly arranged. The dimensions of each block were 8 m in length and 6 m in width, with a surrounding isolation line set at a distance of 1 m from each block. Furthermore, all treatments utilized an equal amount of phosphorus (105 kg P2O5 ha−1) and potassium (135 kg K2O ha−1) fertilizer, specifically. The maize crop was subjected to equal amounts of phosphorus and potassium fertilizers (105 kg P2O5 ha−1 and 135 kg K2O ha−1), while N fertilizer was applied at two levels (210 kg N ha−1; 180 kg N ha−1), which corresponded to the N1 and N2 levels of the wheat season, respectively, and all wheat straw residues were returned to the field.
The chemical fertilizers applied were urea (N 46%), superphosphate (P2O5 12%), and potassium sulfate (K2O 52%). All phosphorus and potassium fertilizers, 70% N fertilizer, and straw were used as base fertilizers and applied during land plowing. The remaining 30% of N fertilizer was applied during the wheat greening and jointing stage. The wheat variety used was “Jimai 22”, which was mechanically sown with a row spacing of 18.0 cm. According to the local climate and soil conditions, the seeds were sown in mid-October each year, with an average sowing amount of about 300.0 kg ha−1. To ensure the optimal emergence of wheat, compaction equipment was used for post-sowing compaction. Irrigation was carried out using groundwater, without the use of herbicides or insecticides.

2.3. Soil Sampling

After the October 2024 maize harvest, soil samples involving the six treatments were collected using diagonal sampling (three replicates per sample). Specifically, a 2.5 cm diameter soil drill was used to take five soil samples from 0–20 cm depths from each plot. During the process of soil sampling, damage to the soil structure was avoided as much as possible, and then soil from the same depth in the same plot was mixed into composite samples, which were carefully transported back to the laboratory. The retrieved soil samples were divided into two parts: one fresh soil sample was immediately stored at 4 °C, and the other part was air-dried. Some of the air-dried samples were used for the determination of SOC components, while the other samples were screened by 0.25 mm and 2.00 mm to determine soil pH, TN, AP, and other physical and chemical properties as required.

2.4. Soil Physiochemical Analysis

Soil pH and electrical conductivity (EC) were measured using the same soil/water (1:5) by pH meter (Mettler-Toledo-FE-20, Mettler-Toledo, Columbus, OH, USA) and glass electrode (DDS-11A, Shanghai Rex Instrument Factory, Shanghai, China), respectively. Bulk density (BD) was determined from undisturbed soil samples collected by a steel cylinder of 100.0 cm3 volume. Total N (TN) was analyzed using the Kjeldahl digestion procedure. Total P (TP) was determined with H2SO4-HClO4 digestion [31]. Available N (AN) was analyzed using a segmented flow analyzer (AA3-Seal-Germany, Seal Analytical, Hamburg, Germany). Available phosphorus (AP) was determined by spectrophotometry (UV-1601, Shimadzu, Kyoto, Japan) at 700 nm. AK was quantified using flame atomic absorption spectroscopy (FP-6410, JASCO, Tokyo, Japan).

2.5. Scanning Electron Microscopy (SEM) and Fourier-Transform Infrared Spectrometer (FTIR)

The soil morphology was characterized by SEM (Japanese JSM-7500F03040702, JEOL, Tokyo, Japan) at the Instrument Center of Qingdao Agricultural University. Sem samples were carefully prepared by adding soil sample powder to the dispersant and applying it evenly on copper net. Photos were taken after magnification of 500 and 5000 times to obtain images.
OC functional groups were determined by FTIR. The soil sample was mixed with KBr, ground, and dried in agate mortar for scanning. The scanning ranged from 400 to 4000 cm−1, with 4 cm−1 wavelength resolution. The main absorption peak was 1032 cm−1 (polysaccharide-C), 1637 cm−1 (aromatic-C), 1410 cm−1 (carboxylic-C), 3619 cm−1 (OH-C), and 2853 + 2923 cm−1 (aliphatic-C) [1]. OMNIC 9.7 software was used to determine the relative content of functional groups by integrating absorption peaks [32].

2.6. Soil C Fraction Analysis

The content of SOC was measured by K2Cr2O7 oxidation methods [33]. MAOC and POC were determined by the wet sieving method [34]. The soil, which had been dried in the air, was completely dispersed using a 0.5% (w/v) solution of (NaPO3)6 and then filtered through a 53 μm screen. The portion of the sample that remained on the screen was referred to as POC. The fraction of the sample that passed through the sieve was considered MAOC. The determination of MBC was carried out by means of chloroform fumigation [1,35]. Dissolved organic carbon (DOC) was extracted with ultrapure water and measured by a liquid TOC II analyzer made by Elementar from Huanau, Germany [36].
Cultivation experiment. The soil (0–20 cm) collected from the six treatments in the field experiment was incubated for 90 days, with four replicates per treatment [37]. The amount of OC mineralization (OCmin) was determined by the alkaline absorption method. And the remaining NaOH was titrated with standard acid to calculate the CO2 amount.
The calculation formula is:
CO 2 C   ( mmol ) = CNaOH   ×   VNaOH   CHCl   ×   VHCl 2
C   mineralization   rate   ( CMR ) = amount   of   CO 2 time
Specific   C   mineralization   rate   ( SCMR ) = CMR SOC   content  

2.7. Soil Bacterial Community Analysis

Soil bacterial communities were analyzed in triplicate using frozen soil samples (11.5 g) from each treatment. Soil DNA was extracted and amplified in the 341F-806R region using a universal primer (341F: 5′-CCTACGGGNGGCWGCAG-3′, and 806R: 5′-GGACTACHVGGGTWTCTAAT-3′) [38].
We classified the FTI taxa into k-strategy (Verrucomicrobiae, Gemmatimonadetes, Acidimicrobiia, Planctomycetes, Chloroflexia, and Actinobacteria) and r-strategy (Alphaproteobacteria, Gammaproteobacteria, and Bacteroidia) microbes on the basis of the literature [2].

2.8. Calculation and Data Analyses

The homogeneity and normality of variance were checked using the SPSS 18.0 software package for Windows (SPSS Inc., Chicago, IL, USA), and the incompatibility was analyzed by logarithm or square root. Two-way analysis of variance (ANOVA) was used to analyze the significant effects of straw returning amounts and N addition amounts on soil pH, EC, BD, SOC, TN, AP, AK, POC, MAOC, and microbial composition. Significant differences were determined at p < 0.05. Redundancy analysis (RDA) was achieved using Canoco 5 software.

3. Results

3.1. Soil Physical and Chemical Properties

At the same N level, the EC of the S1 and S2 treatments decreased by 5.01–6.91% and 9.27–8.31% compared with the S0 treatment, respectively, and the EC of the N2S1 treatment decreased by 5.65% compared with the N1S1 treatment (p ≤ 0.05, Table 2). pH and BD had the same trend. Meanwhile, under the same N level, the content of soil TN, AP, and AK all showed an increasing trend with the increase in the straw returning amount (p ≤ 0.05). Compared with S0, the SOC content in the S1 and S2 treatments increased by 5.39–8.86% and 9.32–9.30%, respectively, and there was no significant difference between the S1 and S2 treatments (Table 2).

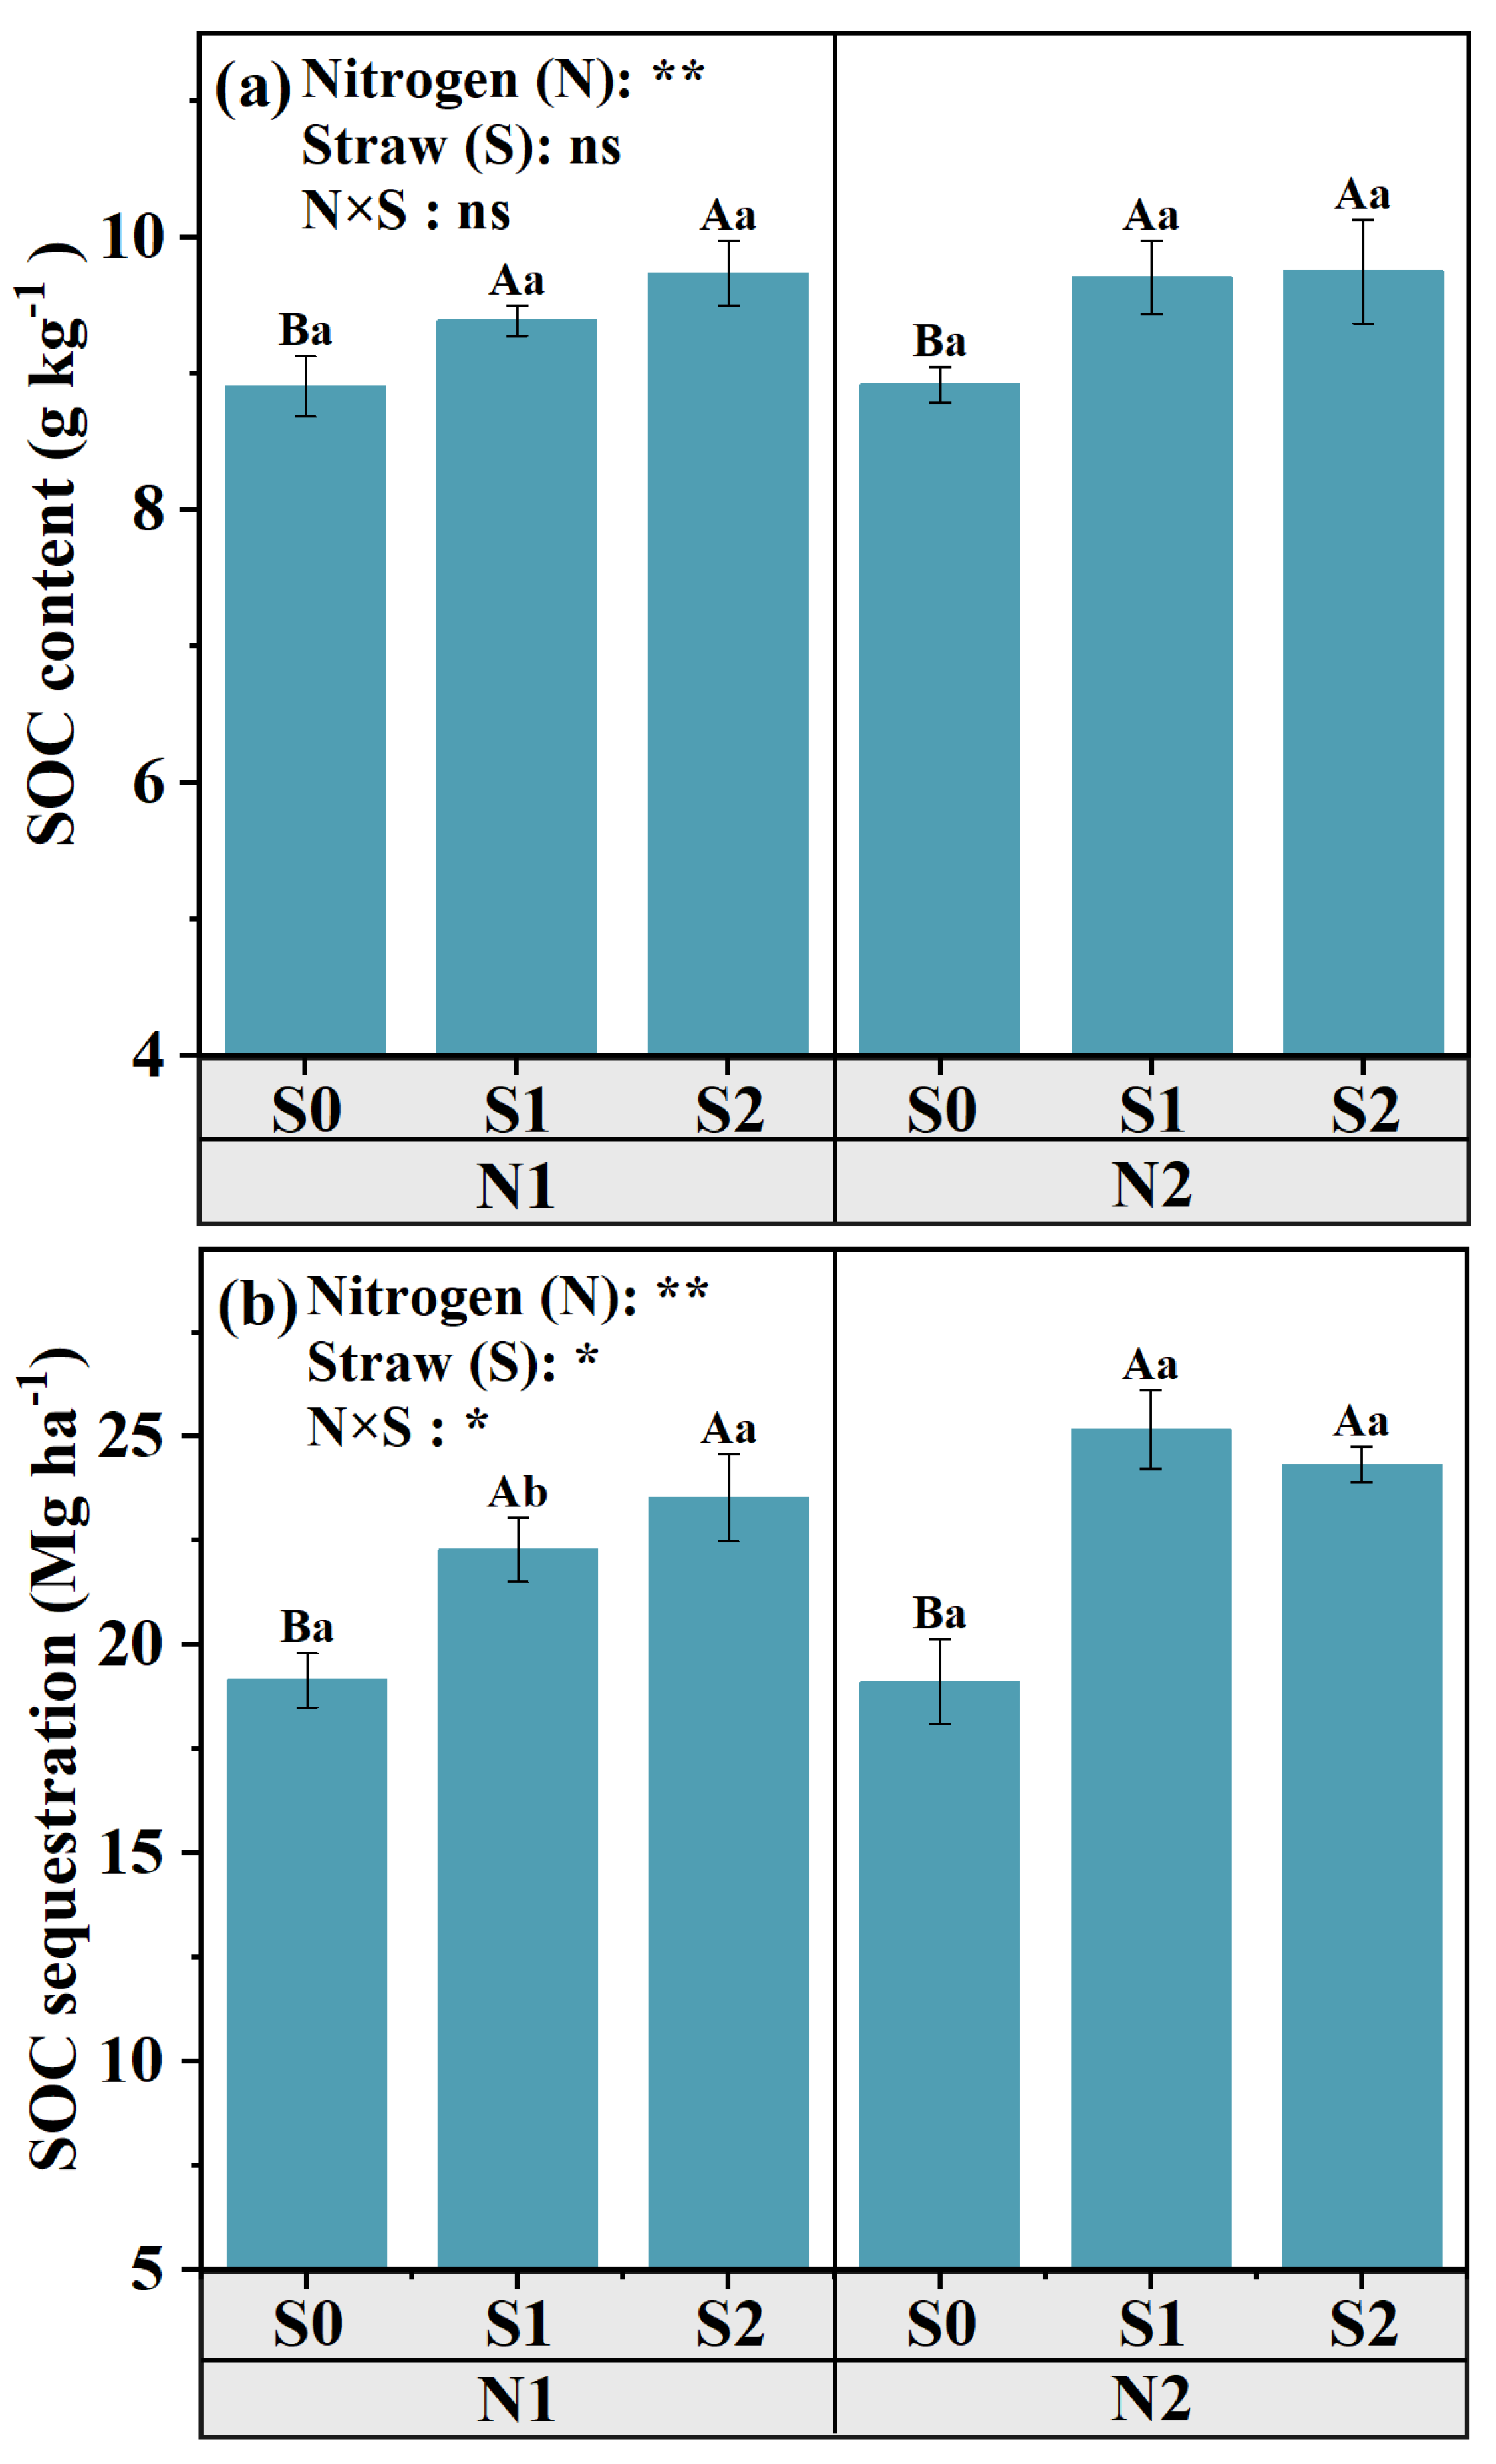
3.2. The Fractions of Soil Labile C and SOC Sequestration
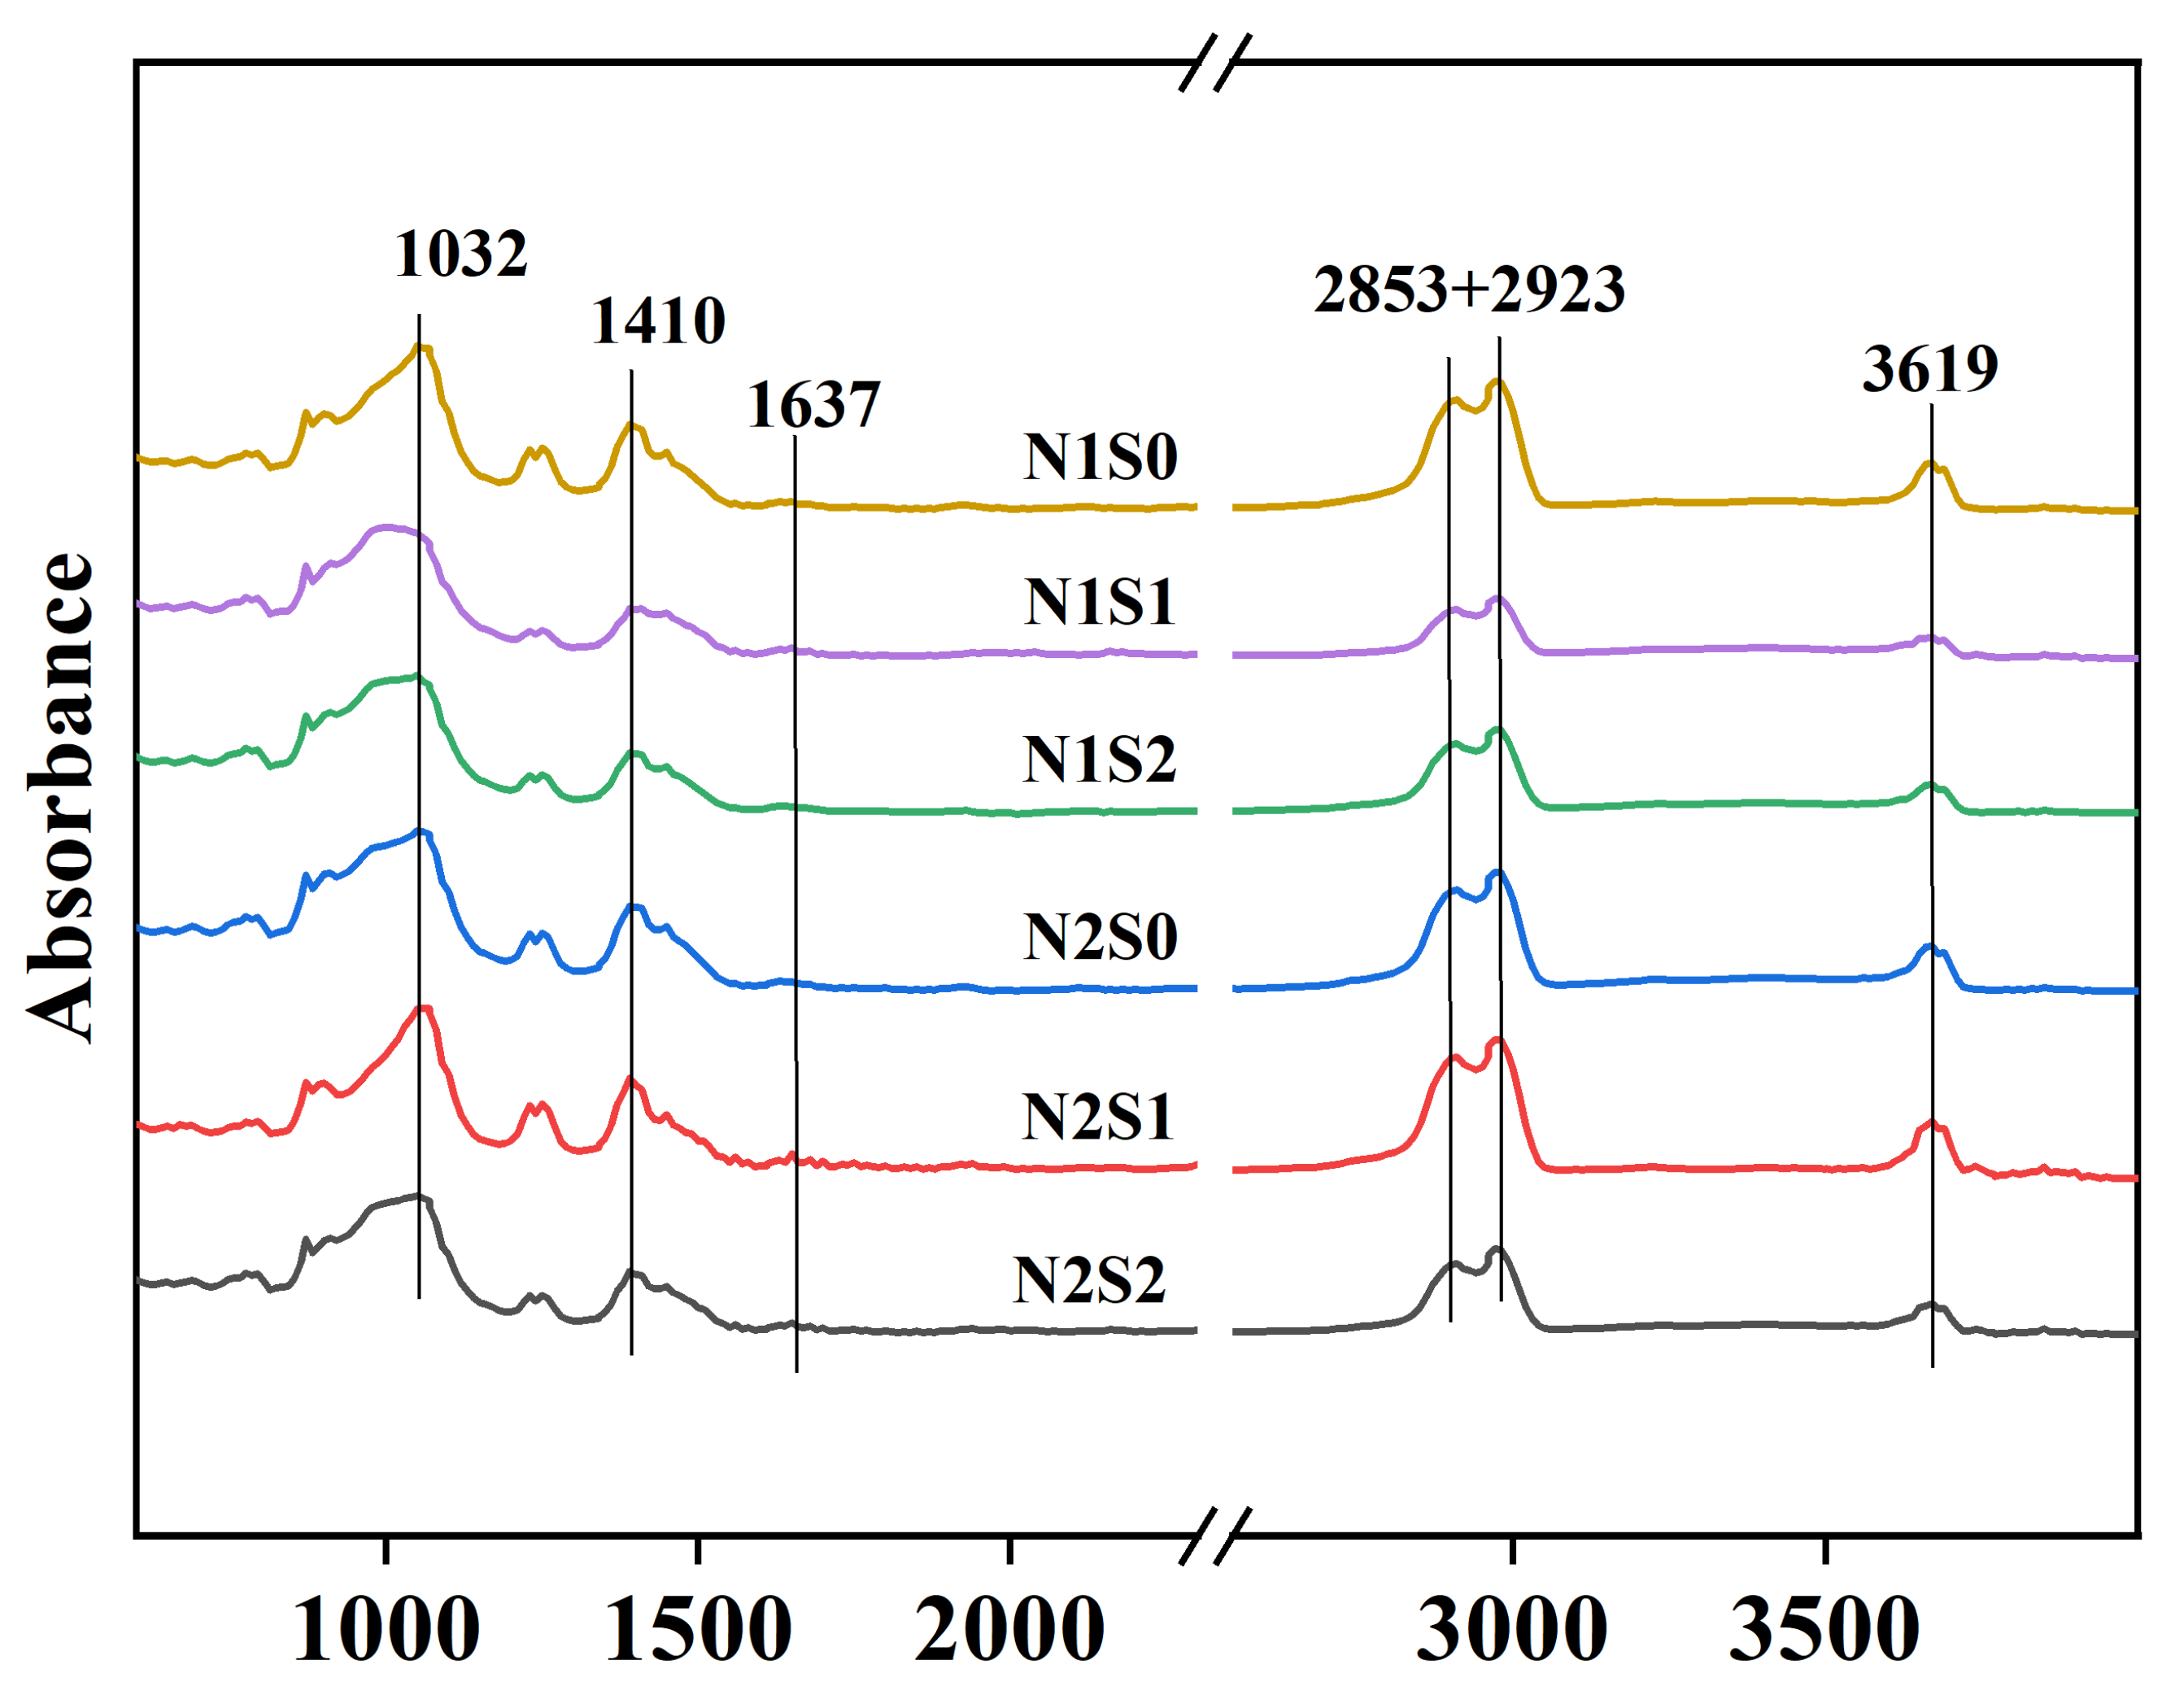
Under both N levels, the content of MAOC significantly increased after straw incorporation (Figure 1a). Under the N2 level, the POC content in the S1 and S2 treatments was significantly increased by 28.10% and 18.95% compared with S0 (p ≤ 0.05) (Figure 1b). And the POC content in the N2S1 treatment was increased by 17.37% compared with the N1S1 treatment (p ≤ 0.05). Under the same N level, straw incorporation significantly increased POC/MAOC and POC/SOC compared with S0 (p ≤ 0.05). Moreover, the two ratios in the N2S1 treatment were significantly higher than that in the N1S1 treatment (p ≤ 0.05) (Figure 1c,d).
Under the same N level, the contents of DOC and MBC increased significantly after straw incorporation (Figure 1e,f). Under the N1 level, compared with the S0 treatment, the DOC content in the S1 and S2 treatments was significantly increased by 16.10% and 20.52% (Figure 1e), and the MBC content was significantly increased by 31.60% and 48.57% (p ≤ 0.05) (Figure 1f). The contents of DOC and MBC in the N2 levels were the same and the difference was significant. It is worth mentioning that, compared with the N1S1 treatment, the DOC and MBC of the N2S1 treatment significantly increased by 10.92% and 15.14%.
Under the N1 level, the SOC sequestration of S1 and S2 was increased by 16.34% and 22.86%, compared with that of S0, respectively (Figure 2b). Under the N2 level, the SOC sequestration of S1 and S2 was also 31.63% and 27.23% higher than that of S0, respectively, in which the SOC sequestration of N2S1 was 12.97% higher than that of N1S1.

3.3. FTIR of Soil

The main functional groups were polysaccharide-C, carboxylic-C, aromatic-C, aliphatic-C, and OH-C in the soil (Figure 3). At the N1 level, compared with the S0 treatment, the proportions of aromatic-C and OH-C in the S2 treatment were significantly (p ≤ 0.05) reduced by 28.29% and 38.43%, respectively (Table 3). At the N2 level, the proportion of carboxylic-C in the S1 treatment was significantly reduced by 13.25% compared with the S0 treatment. At the same time, the proportion of aromatic-C in the N2S1 treatment was significantly (p ≤ 0.05) higher than the N2S0 treatment and the N2S2 treatment, which were 62.42% and 40.11%, respectively. It is worth noting that, in the S1 treatment, the proportion of carboxylic-C was significantly reduced by 10.06% under the N2 treatment compared with the N1 treatment.

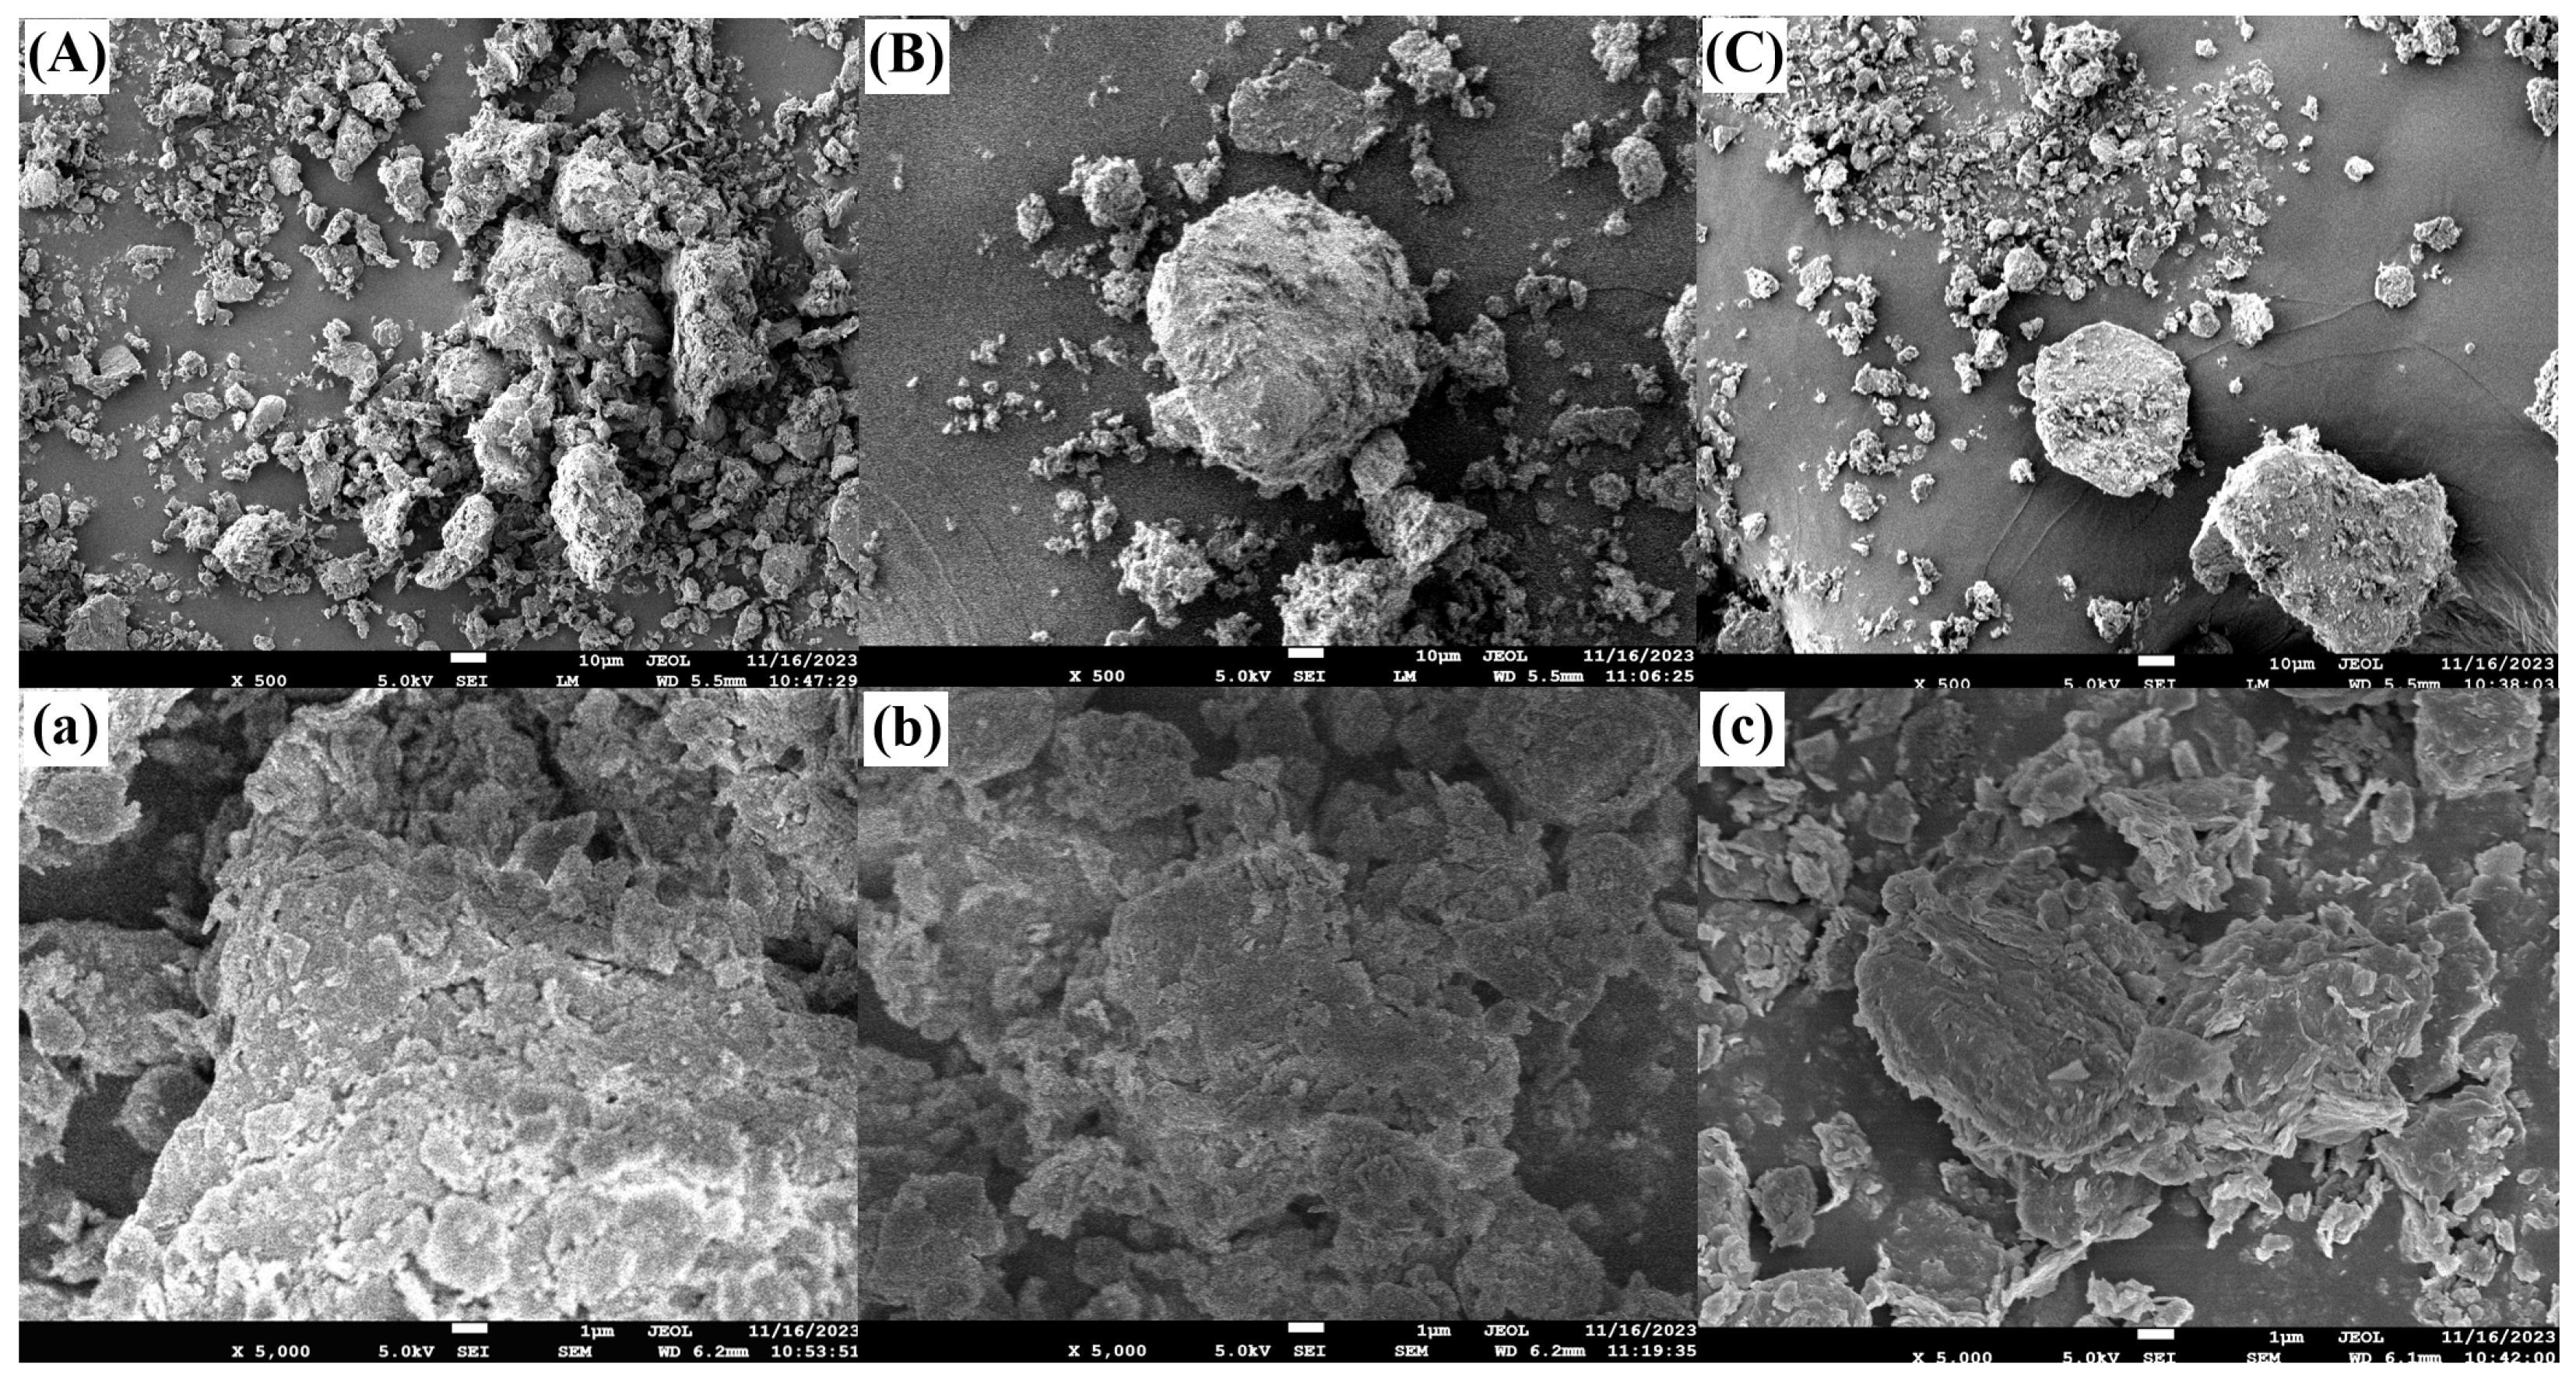
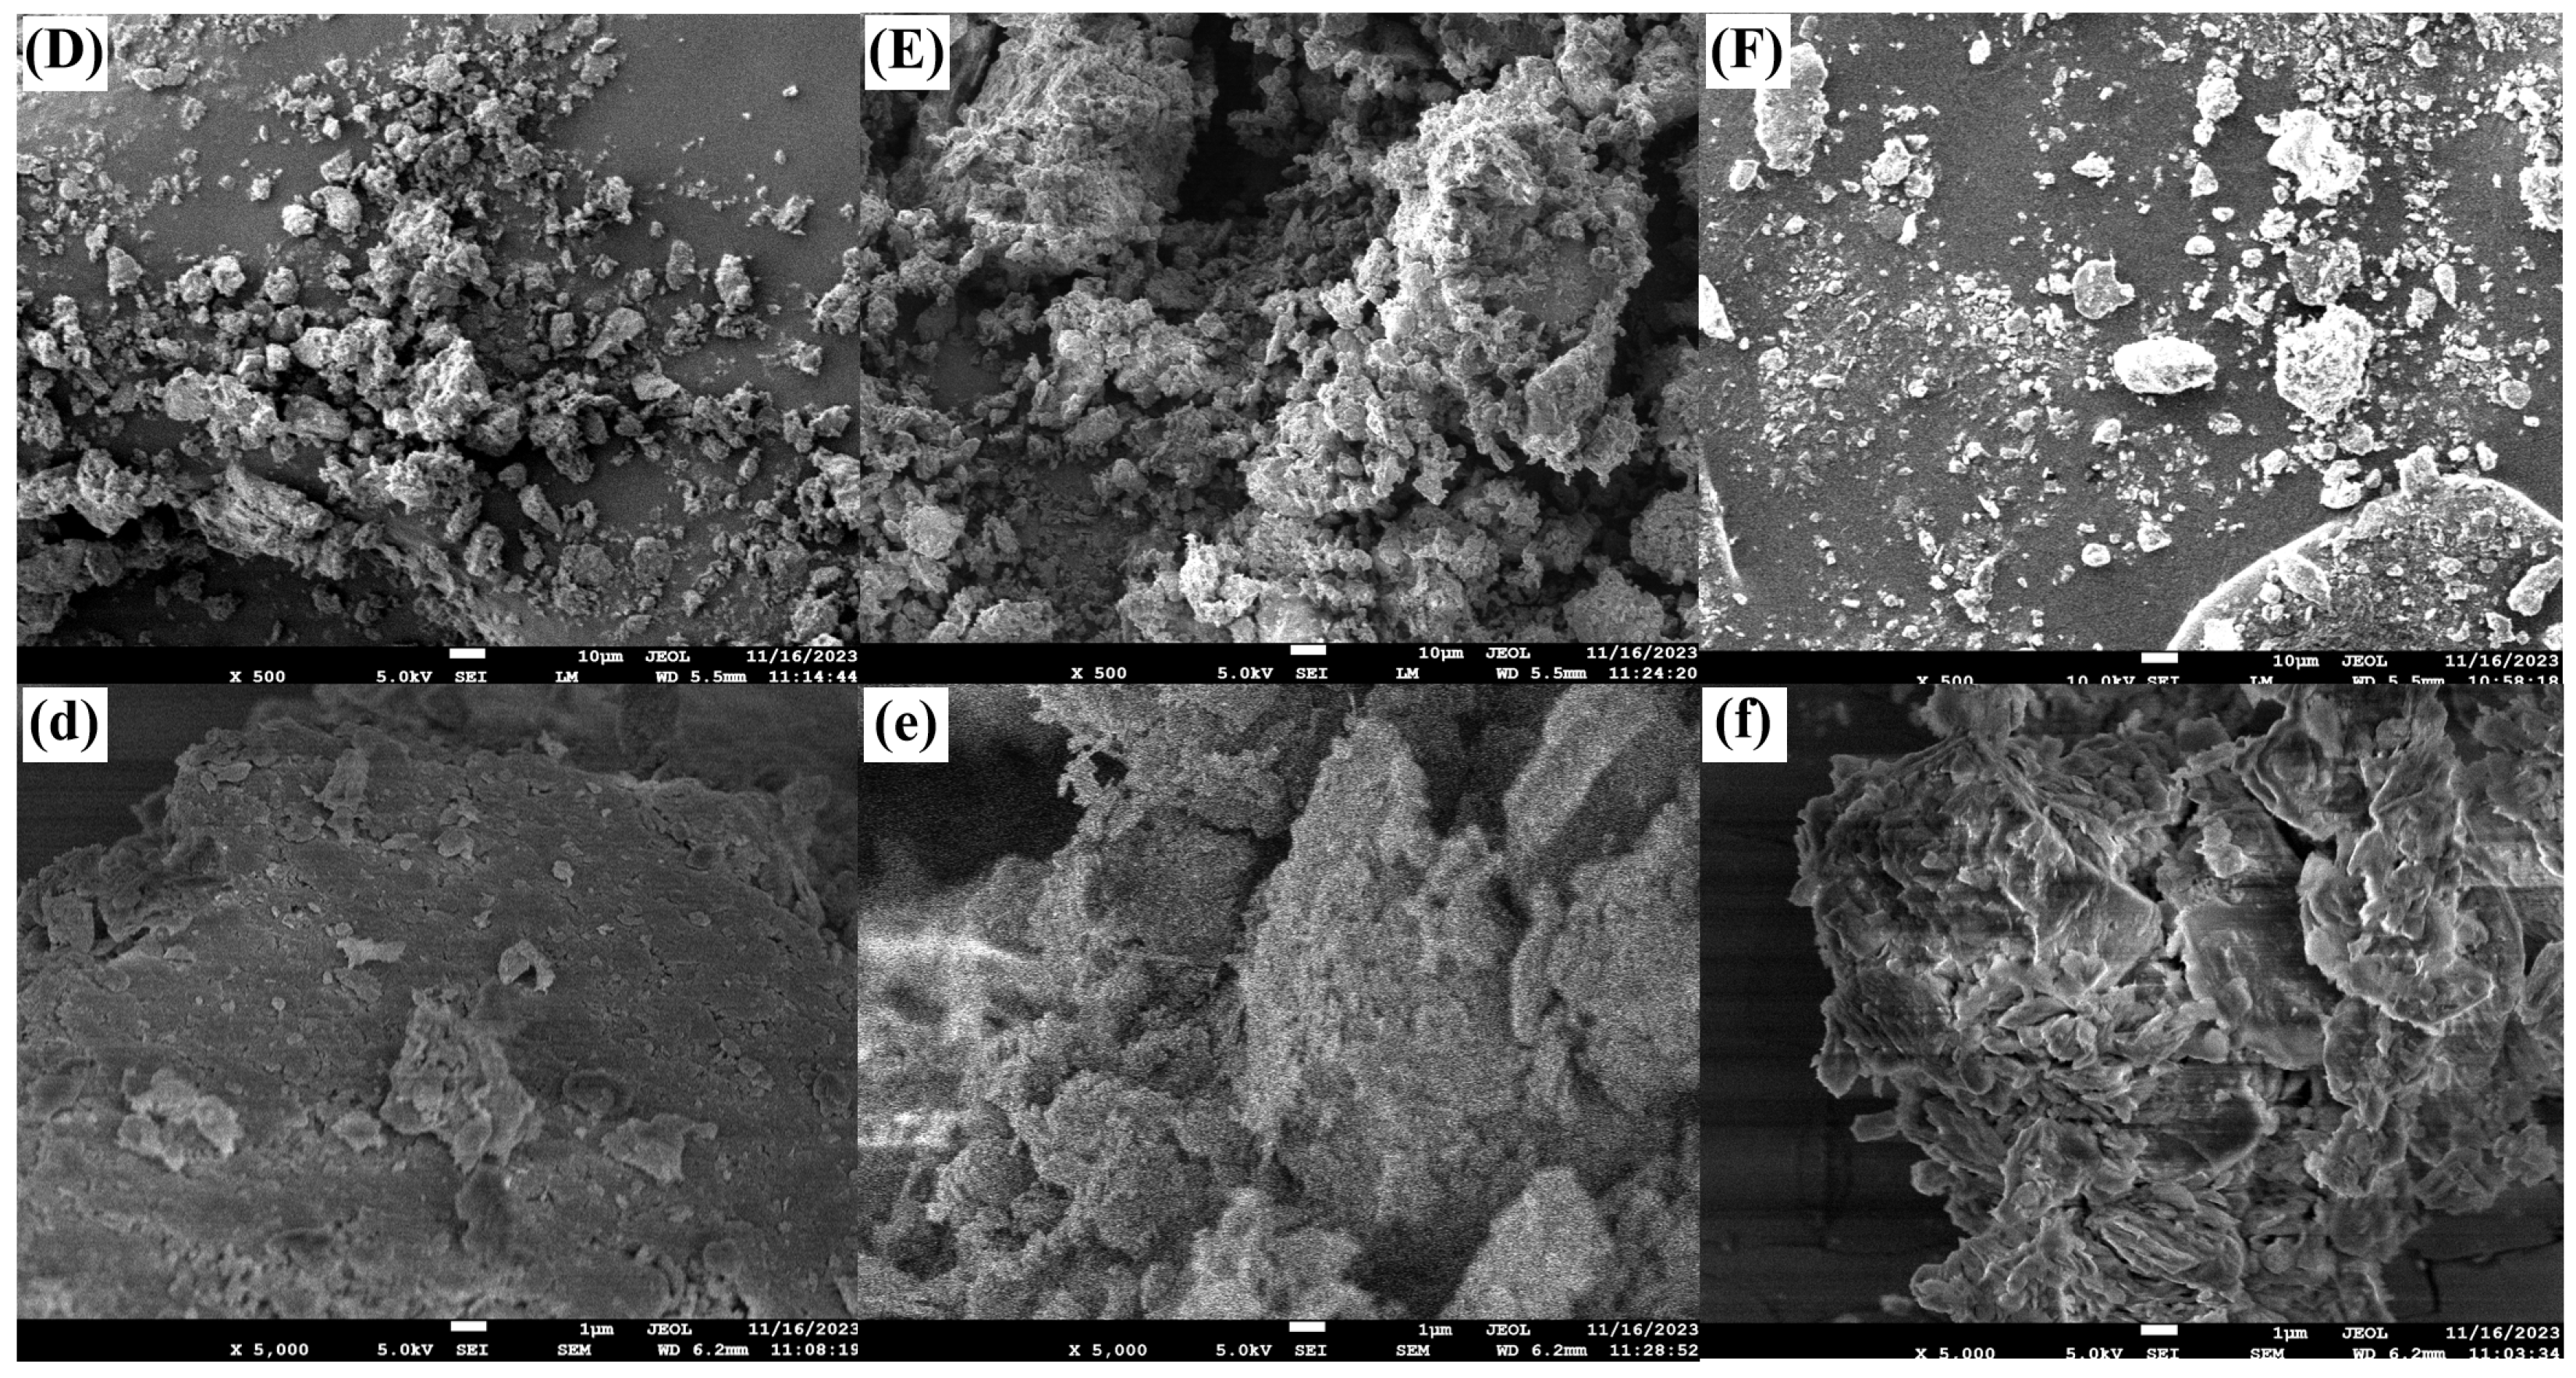
3.4. Soil SEM Analysis

The surface morphology and pore structure of the soil exhibited significant variations, which were found to be associated with straw incorporation and N application (Figure 4A–F). Under the same N level, the pore structure of soil particles under the S1 treatment was more complex and the specific surface area was larger than that under the other two treatments (Figure 4a–f). The soil particles treated under the N2 level exhibited a more complex pore structure under the same S treatment, among which the N2S1 treatment demonstrated the most favorable surface and pore structures (Figure 4E,e).

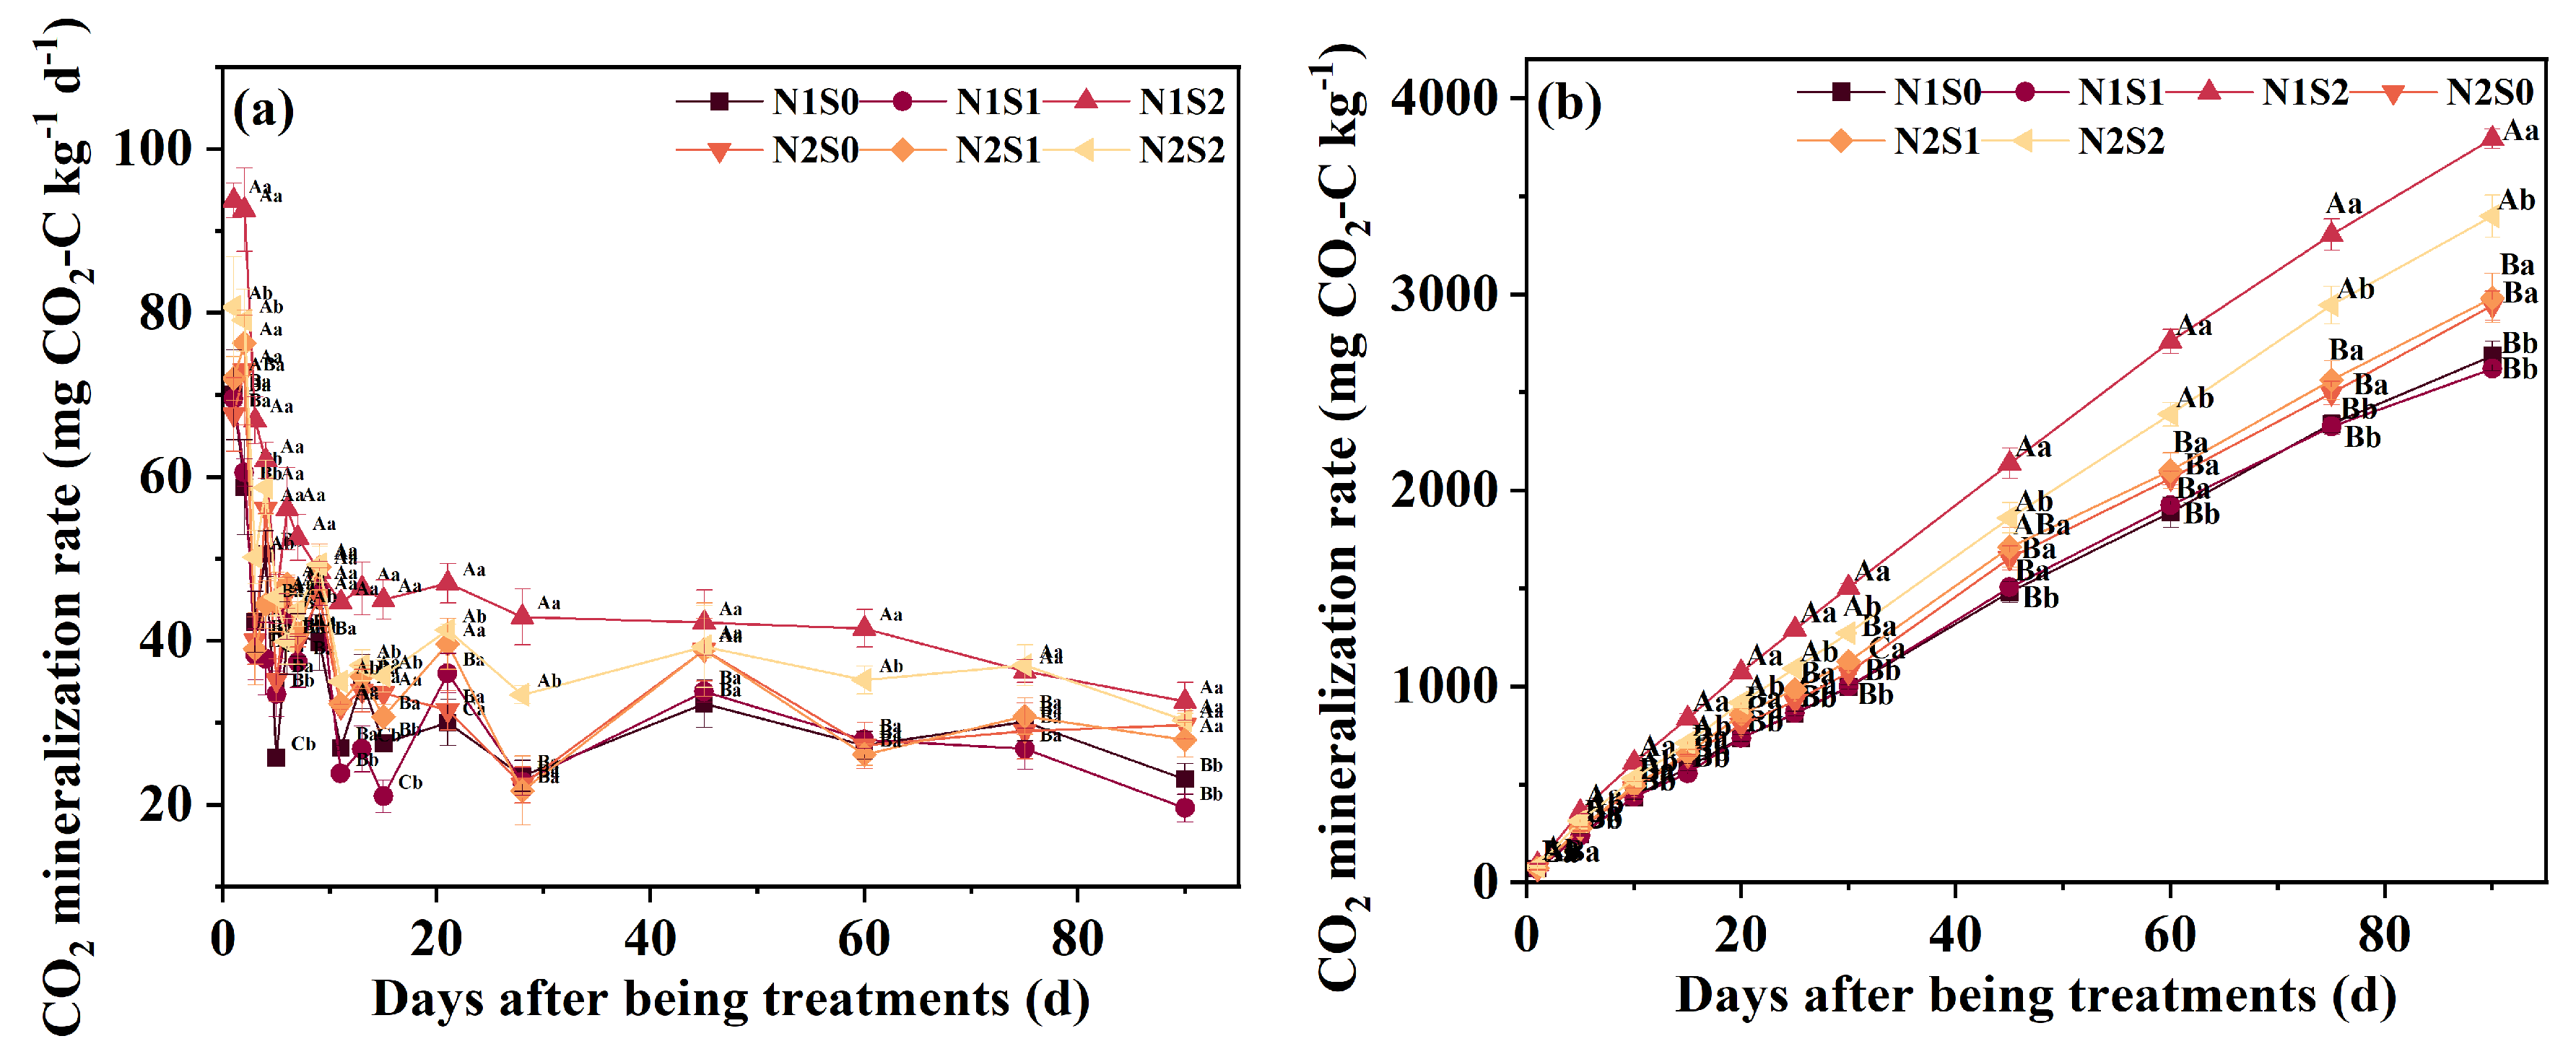
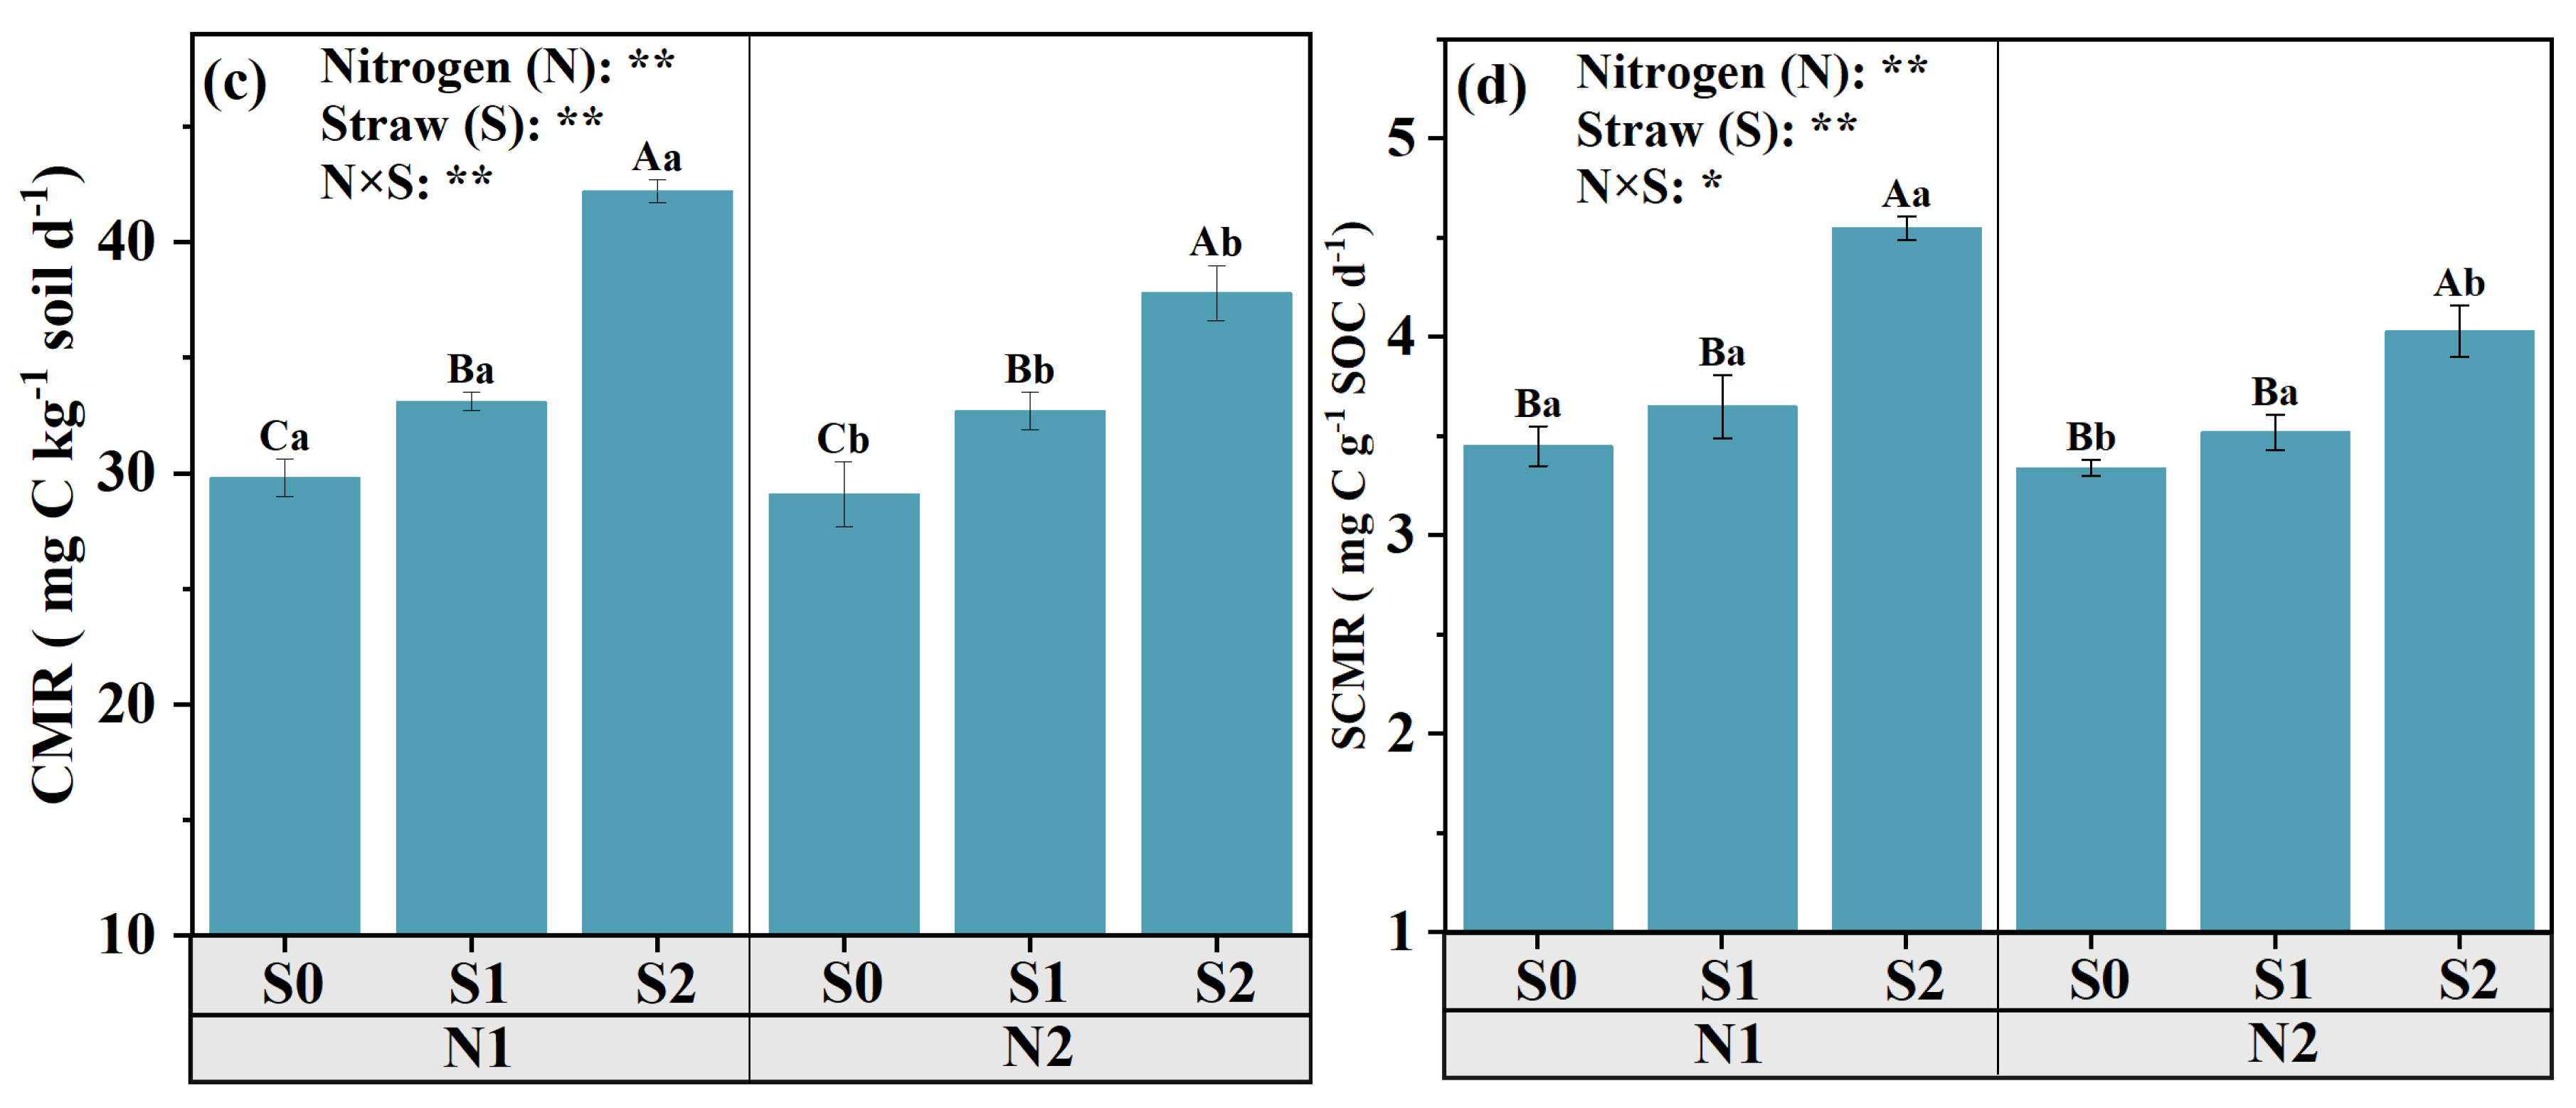
3.5. CO2 Efflux and OC Mineralization Index

During the 90-day cultivation process, the incorporation of straw significantly augmented the CO2 efflux rate and accumulated OC mineralization (OCmin) (Figure 5). Under the same N level, the CO2 efflux rate was increased with the incorporation of straw (Figure 5a). At the same time, the CO2 efflux rate in the S1 and S2 treatments significantly increased, especially in the initial stage of cultivation (first 9 days), and then decreased in the later stages. In comparison with the N1 level, the CO2 efflux amount of various treatments under the N2 level significantly decreased in the later stage of cultivation (30 days) (p ≤ 0.05). After 15 days of cultivation, it was observed that the changes in OCmin gradually stabilized. Under the same N level, the OCmin in the S2 treatment was significantly higher than that in the S0 and S1 treatments (p ≤ 0.05, Figure 5b). Between the two N levels, in the S0 and S1 treatments, the OCmin in the N1 level was significantly higher than in the N2 level, while, in the S2 treatment, it showed an opposite trend (p ≤ 0.05).
Under the same N level, CMR of the S1 and S2 treatments was increased by 11.07–12.37% and 41.6–29.90% compared with that of the S0 treatment (Figure 5c). And SCMR in S1 and S2 was also significantly increased, which was 5.80–5.39% and 31.88–20.66% higher than that in the S0 treatment, respectively (Figure 5d). Between the two N levels, the CMR of the N2 level showed a significant reduction with straw returning, which was decreased by 1.21% to 10.43% (p ≤ 0.05) when compared with the N1 level, and the same trend was also observed in SCMR.

3.6. Dynamic Changes in Bacteria

Through 16S rRNA gene amplicon sequencing, Gammaproteobacteria, Vicinamibacteria, Alphaproteobacteria, Actinobacteria, and Bacteroidia were the dominant groups of bacteria in all treatments (Figure 6). Under the N1 level, the richness (Ace, Chao 1 index) and diversity (Faith pd, observed features, and Shannon entropy index) in the S1 and S2 treatments were significantly higher than those in the S0 treatment (p ≤ 0.05). Under the N2 level, the Ace, Chao 1, and observed features index all showed a significant trend of S1 > S2 > S0. Under the N1 level, there was no significant difference in the relative abundance of populations between the S0, S1, and S2 treatments. Under the N2 level, compared with S0, the relative abundance of Vicinamibacteria of S1 and S2 was significantly increased by 25.16% and 24.15%, respectively (p ≤ 0.05), while the relative abundance of Actinobacteria and Bacteroidia was decreased by 38.03–40.13% and 32.18–45.49% (p < 0.05), respectively (Table S2). In the S2 treatment, the relative abundance of Gammaproteobacteria and Vicinamibacteria at the N2 level was significantly higher than that at the N1 level, while the relative abundance of Alphaproteobacteria at the N2 level was lower than that at the N1 level.
In this study, 121 bacterial evolutionary branches were identified as active biomarkers, showing statistically significant differences, as indicated by the LDA logistic score threshold > 4 (Figure 6). The representative differentially abundant bacterial taxa included Saccharimonadia (4.04 LDA), Saccharimonadales (4.03 LDA), Sphingomonadales (4.02 LDA), Patescibacteria (4.01 LDA) in N2S0, Alphaproteobacteria (4.36 LDA) in the N1S2 treatment, Chloroflexia (4.10 LDA), and Phycisphaerae (4.03 LDA) in the N1S0 treatment.

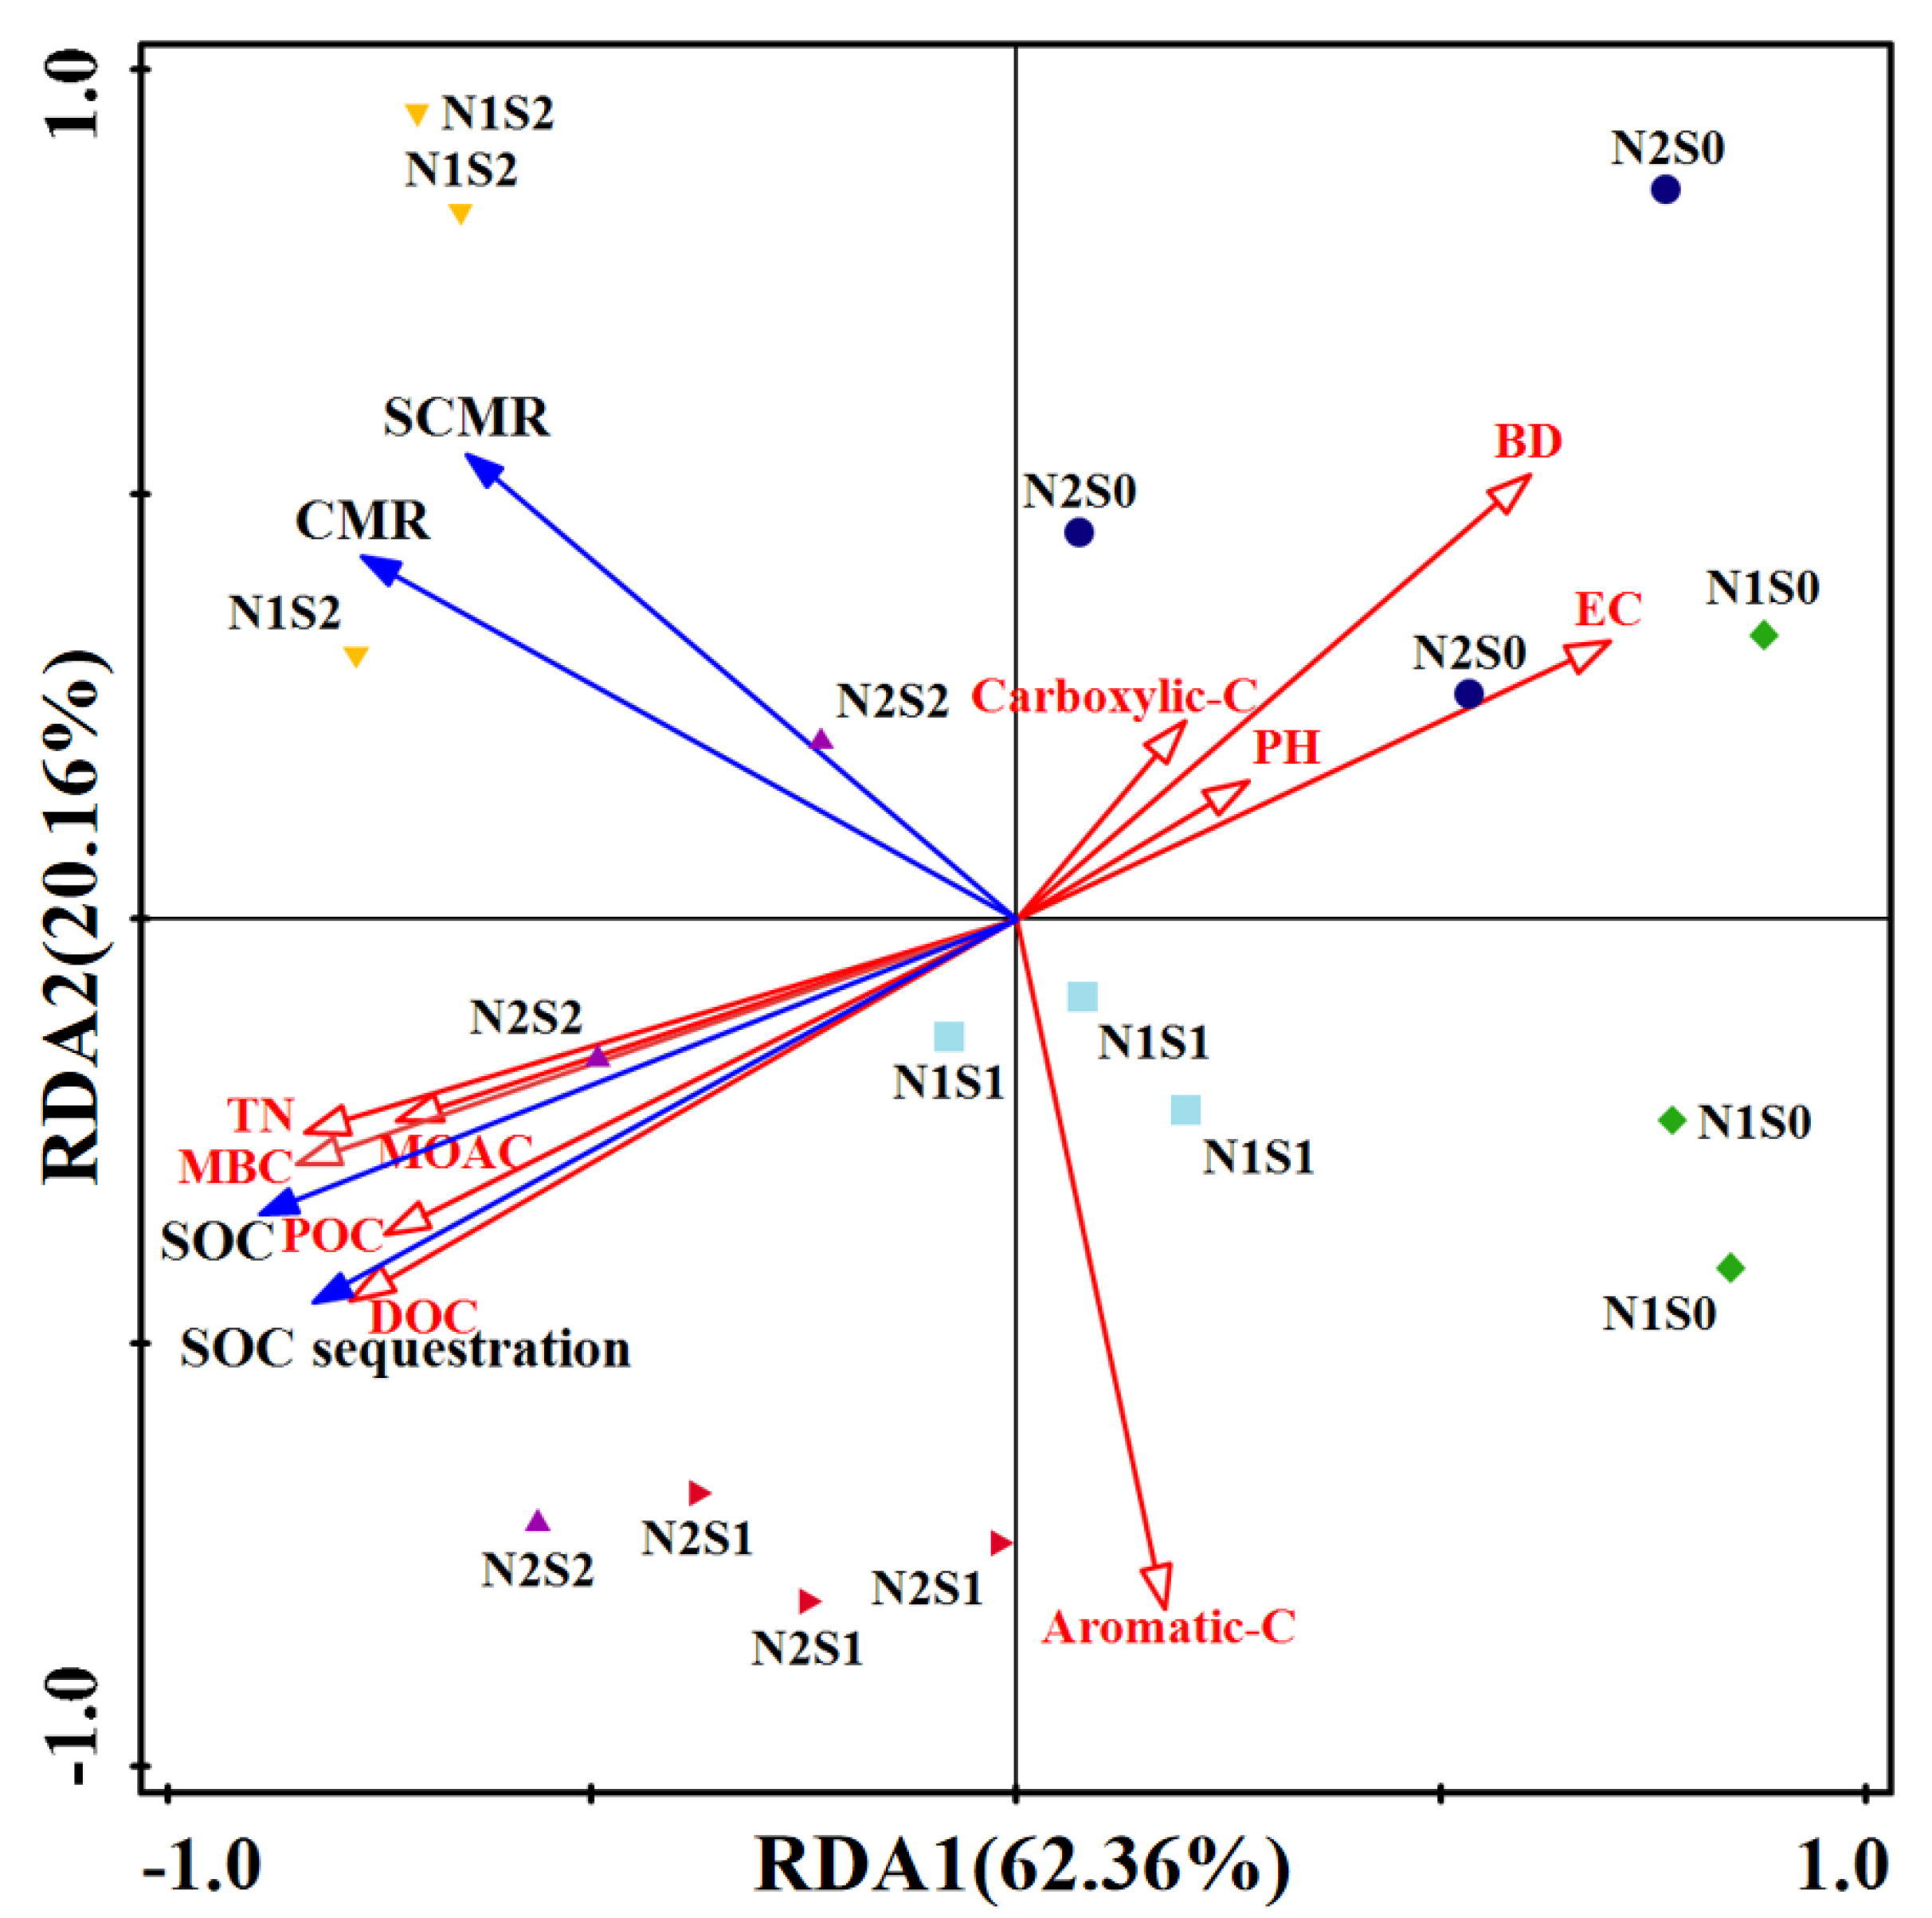
3.7. Correlation Analysis

The SOC sequestration was significantly and positively correlated with POC (r = 0.8678, p ≤ 0.05), MBC (r = 0.8246, p ≤ 0.05), and SCMR (r = 0.2198, p ≤ 0.05) and significantly negatively correlated with BD (r = 0.5480, p ≤ 0.05) and EC (r = 0.5480, p ≤ 0.05) (Figure 7a). Spearman correlation analysis showed that SOC sequestration was significantly positively correlated with the abundance of Verrucomicrobiae (r = 0.641, p ≤ 0.01) and Planctomycetes (r = 0.505, p ≤ 0.05) but negatively correlated with Chloroflexia (r = −0.490, p ≤ 0.05) (Figure 7b). The Verrucomicrobiae abundance was positively correlated with POC (r = 0.493, p ≤ 0.05), MBC (r = 0.564, p ≤0.05), and DOC (r = 0.593, p ≤ 0.05), respectively. Planctomycetes abundance was positively correlated with MBC (r = 0.664, p ≤ 0.01) and DOC (r = 0589, p ≤ 0.05), and negatively correlated with carboxylic-C (r = −0.558, p ≤ 0.05), respectively. Chloroflexia abundance was negatively correlated with POC (r = −0.579, p ≤ 0.05). Actinobacteria abundance had a significant negative correlation with aromatic-C (r = −0.485, p ≤ 0.05).
The cumulative variance percentage of soil properties was 82.52%, which was derived from 62.36% of the RDA axis 1 and 20.16% of axis 2 (Figure 8). RDA results showed that SOC and SOC sequestration were positively correlated with TN, POC, DOC, MAOC, and MBC, and negatively correlated with carboxylic-C, pH, EC, and BD, while CMR and SCMR were significantly negatively correlated with Aromatic-C.

4. Discussion

4.1. Responses of SOC Components to Straw Incorporation and N Application

POC primarily consists of partially decomposed plant matter (crop residues and other plant debris) and has a “fast turnover” characteristic, being sensitive to the addition of nutrients to the soil [39]. In this study, under the same N level, the POC, POC/MAOC, and POC/SOC increased significantly with the addition of straw, but there was no significant difference between different straw additions (Figure 1b–d). This could be due to the following reasons: (i) after applying straw, the straw residues were decomposed and combined into high molecular compounds by microorganisms, promoting the formation of POC [40]; (ii) straw incorporation improved the soil physical structure, and the protection of soil inherent structure and biochemical characteristics prevented the loss of POC [41]. In fact, the differences in soil structure were also clearly seen with SEM (Figure 4). Additionally, in our study, POC, POC/MAOC, and POC/SOC in the S1 treatment were increased with N reduction (Figure 1b–d), which was because the reduction in N provided to soil microorganisms led to a lower soil C mineralization, then improved C utilization efficiency [17,42]. Therefore, half straw incorporation and reduced N application could increase the content of POC and improve the POC/MAOC and POC/SOC ratios, which is beneficial to the fixation of SOC in saline–alkali soil.
Different SOC functional groups have different stability characteristics. For example, aromatic-C groups are more stable and less susceptible to decomposition, while carboxylic-C groups are easily decomposed by microorganisms [43]. Previous studies have found that long-term straw returning increases the proportion of stable aromatic-C in saline–alkali soil, and excessive N application increases the carboxylic-C proportion [15]. In this study, the N2S1 treatment significantly (p ≤ 0.05) increased the proportion of aromatic-C and decreased the proportion of carboxylic-C in saline–alkali soil (Table 3), which was supported by Ji et al. [4]. The results indicated that the chemical composition of SOC in saline soil could be improved by half straw incorporation and reducing N application. This could be due to the following two reasons: (i) exogenous organic substances (e.g., corn stalks) are efficiently degraded by soil microbes to produce low molecular weight substances, which bind to mineral surfaces to form stable OC reservoirs, thereby diminishing the decomposition of aromatic compounds [16]; (ii) reduced N application reduces the activation effect, resulting in the transformation of the bacterial community from r-strategy to k-strategy, thus limiting bacterial reproduction rates and increasing mortality, thereby reducing lignin degradation [9,44,45].

4.2. Reactivity of SOC Mineralization to Straw Incorporation and N Application

OC mineralization is an inevitable biochemical process that occurs after the addition of external C [46]. In our 90-day study, the CO2 efflux amount in each treatment reached its peak within the first 9 days and then declined continuously throughout the cultivation process (Figure 5). This change was primarily because (1) the easily decomposable components in straw are degraded in the initial stage, providing an unstable energy source for soil microorganisms [15]; (2) after 9 days, compared with the easily degradable components, the lignin, cellulose, and other difficult to decompose components in straw will take a relatively longer time to be degraded by soil microorganisms [11]. Meanwhile, during the cultivation process, the CO2 emission rate within the same N level increases with the increase in straw incorporation (Figure 5a), indicating that the increase in unstable C in straw decomposition would induce more OC mineralization [47]. In this study, CMR and SCMR under the same N level were positively correlated with the straw returning amount (Figure 5c,d). However, in the S2 treatment, CMR and SCMR under the N2 level were significantly lower than the under N1 level (Figure 5c,d), suggesting that a moderate reduction in N input could reduce OC mineralization and enhance C sequestration, which is due to the reduced N application reducing the input of unstable N, reducing the start-up effect of SOC, and thus reducing the loss of CO2 [48]. Therefore, high levels of straw and N fertilizer induce more OC mineralization rather than sequestration, which is detrimental to C fixation in saline–alkali soil.
Exogenous C can affect soil bacterial diversity and community structure [49]. In this study, the bacterial community structure was significantly regulated by straw incorporation (Figure 6). K-strategy microorganisms have larger individuals, longer life spans, and stronger defense capabilities, and can better accumulate and utilize organic matter in a stable environment [50]. In this study, straw incorporation and N application increased the relative abundance of Vicinamibacteria, especially in the presence of reduced N levels (N2S1, N2S2) (Figure 6). This is because Vicinamibacteria can reduce the soil C/N ratio by decomposing organic matter and promoting N fixation, thereby affecting the storage of soil C [51]. Actinomycetes can grow stably in resource-limited environments, with strong competitiveness and low growth rates [52]. In this study, the abundance of this flora in the S2 treatment was low, which may be due to the C source provided by excess straw incorporation, which changed the microbial community from k-strategy to r-strategy, increased the higher reproductive rate, and promoted the rapid growth of the population but weakened the accumulation of SOC (Figure 6). The activities of Bacteroidia in the soil help to absorb and fix nutrients in the soil while releasing substances that are available to plants, thus improving the nutritional status of plants [45]. In this study, the abundance of Bacteroidia in the S2 treatment at the N2 level was significantly lower than that in the S0 and S1 treatments (Figure 6). The decrease in the abundance of this bacterium may be due to the increased C/N ratio in the soil caused by the large amount of straw returned to the soil under the reduced N application, which in turn inhibited the activity of Bacteroidia [13]. Therefore, half straw incorporation and reduced N application can affect the bacterial activity related to soil C and N cycles, change the bacterial survival strategy from r-strategy to k-strategy, promote soil C accumulation, and thus improve the ability of saline soil to maintain OC.

4.3. Improvement Mechanism of SOC with Straw Incorporation and N Application

SOC is predominantly introduced via external C, crop residues, and microbial residues [14]. Straw incorporation can provide exogenous C and produce residues and secretions under the action of microorganisms to increase SOC [36]. In this study, SOC content and sequestration were significantly increased after straw incorporation and N application, especially in the N2S1 treatment (Figure 2a,b), indicating that appropriate straw incorporation and N application could increase SOC sequestration in saline–alkali soil. This may be due to the increase in MBC, POC, and DOC in half straw incorporation and reduced N application, which are major factors in SOC stability and sequestration in RDA results (Figure 8). This result is supported by Shi et al. [20], who found that bacterial community was one of the main factors for the increase in SOC. In this study, the addition of the N2S1 treatment increased MBC (Figure 1f), and the contribution of POC to SOC (POC/SOC) was also increased (Figure 1c,d), which may be due to the following: (i) straw incorporation and N application increased microbial diversity and richness, and then increased MBC [44]; (ii) half straw incorporation and reduced N application changed the survival strategy of bacteria in saline–alkali soil from r-strategy to k-strategy, and promoted SOC retention [53,54]. In conclusion, the survival strategy of bacteria in saline–alkali soil can be changed from r-strategy to k-strategy by half straw incorporation and reduced N application, and the diversity and stability of the bacterial community in saline–alkali soil can be enhanced, and the efficiency of C utilization can be improved, thus increasing SOC sequestration.

5. Conclusions

Straw incorporation and nitrogen (N) application could significantly increase soil organic carbon (SOC) sequestration in saline–alkaline soil. Compared with the N1 level, stable components and functional groups such as particulate organic carbon (POC) and aromatic-C increased under the N2 level, while the proportion of unstable carboxylic-C decreased, which might be the reason for the lower C and specific C mineralization rate (CMR, SCMR) under the N2 level. Meanwhile, compared with the N2S0 and N2S2 treatments, the stability of C components in the N2S1 treatment was highest. In addition, under the same N level, compared with the S2 treatment, the abundance of Verrucomicrobiae and Acidimicrobiia increased in the S1 treatment, and the abundance of Bacteroidia decreased. This suggests that the S1 treatment followed the k-strategy of oligotrophy, while the S2 treatment followed the r-strategy of syntrophy. Therefore, half straw incorporation and reduced nitrogen application optimizes SOC sequestration in saline–alkali soils by enhancing C structural stability through increased aromatic-C fractions and promoting oligotrophic bacterial communities that favor C retention.

Supplementary Materials

The following supporting information can be downloaded at: https://www.mdpi.com/article/10.3390/agronomy15051034/s1, Table S1: Bacterial community richness and diversity; Table S2: Succession of dominant populations under different treatments.

Author Contributions

Individual contributions: conceptualization, X.D. and Z.L.; methodology, X.D. and Z.L.; formal analysis, S.L., Z.S. and S.Z.; investigation, R.D. and Z.J.; data curation, Z.J.; writing—original draft preparation, S.L. and Z.J.; writing—review and editing, S.Z. All authors have read and agreed to the published version of the manuscript.

Funding

This research was funded by National Key Research and Development Project (2021YFD1900903), Modern Agricultural Industrial Technology System (SDAIT-17-05), Regional Agricultural Green Development Integration of Industry and Education Graduate Joint Training Demonstration Base (No. 015/1121001).

Data Availability Statement

The data that support the findings of this study are available from the corresponding author upon reasonable request.

Conflicts of Interest

The authors declare no conflicts of interest.

References

  1. Gu, W.; Wang, Y.; Sun, Y.; Liu, Z.; Wang, W.; Wu, D.; Zhang, Y.; Sun, W.; Wang, X.; Feng, Z.; et al. Assessing the formation and stability of paddy soil aggregate driven by organic carbon and Fe/Al oxides in rice straw cyclic utilization strategies: Insight from a six-year field trial. Sci. Total Environ. 2024, 951, 175607. [Google Scholar] [CrossRef] [PubMed]
  2. Han, C.; Chen, L.; Jia, Z.; Zou, H.; Ma, L.; Feng, B.; Li, J.; Zhou, G.; Zhang, C.; Ma, D.; et al. Joint regulation of the soil organic carbon accumulation by mineral protection and microbial properties following conservation practices. Catena 2024, 245, 108298. [Google Scholar] [CrossRef]
  3. Jing, Z.; Zhang, S.; Sun, Z.; Liu, Z.; Liu, S.; Ding, X. Straw incorporation and nitrogen fertilization enhance soil organic carbon sequestration by promoting aggregate stability and iron oxide transformation. Agronomy 2025, 15, 871. [Google Scholar] [CrossRef]
  4. Ji, X.; Jiang, J.; Wang, Y.; Colinet, G.; Feng, W. Small straw addition enhances straw decomposition and carbon stabilized in soil aggregates over time. Soil Tillage Res. 2024, 238, 106022. [Google Scholar] [CrossRef]
  5. Ma, W.; Ma, L.; Jiao, J.; Fahim, A.M.; Wu, J.; Tao, X.; Lian, Y.; Li, R.; Li, Y.; Yang, G.; et al. Impact of straw incorporation on the physicochemical profile and fungal ecology of saline-alkaline soil. Microorganisms 2024, 12, 277. [Google Scholar] [CrossRef]
  6. Meng, X.; Zhang, X.; Li, Y.; Jiao, Y.; Fan, L.; Jiang, Y.; Qu, C.; Filimonenko, E.; Jiang, Y.; Tian, X.; et al. Nitrogen fertilizer builds soil organic carbon under straw return mainly via microbial necromass formation. Soil Biol. Biochem. 2024, 188, 109223. [Google Scholar] [CrossRef]
  7. Liu, D.; Zhang, S.; Fei, C.; Ding, X. Impacts of straw returning and N application on NH4+-N loss, microbially reducible Fe(III) and bacterial community composition in saline-alkaline paddy soils. Appl. Soil Ecol. 2021, 168, 104115. [Google Scholar] [CrossRef]
  8. Dong, H.; Fan, S.; Sun, H.; Chen, C.; Wang, A.; Jiang, L.; Ma, D. Rhizosphere-associated microbiomes of rice (Oryza sativa L.) under the effect of increased nitrogen fertilization. Front. Microbiol. 2021, 12, 730506. [Google Scholar] [CrossRef]
  9. Song, Y.; Song, T.; An, Y.; Shan, L.; Su, X.; Yu, S. Soil ecoenzyme activities coupled with soil properties and plant biomass strongly influence the variation in soil organic carbon components in semi-arid degraded wetlands. Sci. Total Environ. 2024, 922, 171361. [Google Scholar] [CrossRef]
  10. Xu, Y.; Zhao, Y.; Cha, X.; Yang, W.; Zheng, M.; Liu, S.; Wang, Y.; Cai, A.; Han, X.; Yang, G.; et al. Nitrogen addition-driven soil organic carbon stability depends on the fractions of particulate and mineral-associated organic carbon. Nutr. Cycl. Agroecosystems 2024, 128, 269–281. [Google Scholar] [CrossRef]
  11. Zhang, H.; Liu, G.; Wu, J. The effect of land degradation and restoration on particulate and mineral-associated organic carbon. Appl. Soil Ecol. 2024, 196, 105322. [Google Scholar] [CrossRef]
  12. Cheng, Z.; Guo, J.; Jin, W.; Liu, Z.; Wang, Q.; Zha, L.; Zhou, Z.; Meng, Y. Responses of SOC, labile SOC fractions, and amino sugars to different organic amendments in a coastal saline-alkali soil. Soil Tillage Res. 2024, 239, 106051. [Google Scholar] [CrossRef]
  13. Lu, J.; Zhang, W.; Li, Y.; Liu, S.; Khan, A.; Yan, S.; Hu, T.; Xiong, Y. Effects of reduced tillage with stubble remaining and nitrogen application on soil aggregation, soil organic carbon and grain yield in maize-wheat rotation system. Eur. J. Agron. 2023, 149, 126920. [Google Scholar] [CrossRef]
  14. Chu, H.; Ni, H.; Su, W.; Fan, S.; Long, Y.; Sun, Y. Enhanced nitrogen fertilizer input alters soil carbon dynamics in moso bamboo forests, impacting particulate organic and mineral-associated carbon pools. Forests 2023, 14, 2460. [Google Scholar] [CrossRef]
  15. Liu, L.; Cheng, M.; Jin, J.; Fu, M. Effects of different nitrogen applications and straw return depth on straw microbial and carbon and nitrogen cycles in paddy fields in the cool zone. Sci. Rep. 2024, 14, 6424. [Google Scholar] [CrossRef]
  16. Xiong, S.; Zhu, J.; Yang, J.; Guo, Y.; Meng, X.; Ren, S.; Du, J.; Wen, S.; Jiang, Y.; Shi, J.; et al. Straw return plus zinc fertilization increased the accumulations and changed the chemical compositions of mineral-associated soil organic carbon. Agric. Ecosyst. Environ. 2023, 357, 108699. [Google Scholar] [CrossRef]
  17. Sun, T.; Mao, X.; Han, K.; Wang, X.; Cheng, Q.; Liu, X.; Zhou, J.; Ma, Q.; Ni, Z.; Wu, L. Nitrogen addition increased soil particulate organic carbon via plant carbon input whereas reduced mineral−associated organic carbon through attenuating mineral protection in agroecosystem. Sci. Total Environ. 2023, 899, 165705. [Google Scholar] [CrossRef]
  18. Tang, B.; Rocci, K.S.; Lehmann, A.; Rillig, M.C. Nitrogen increases soil organic carbon accrual and alters its functionality. Glob. Change Biol. 2023, 29, 1971–1983. [Google Scholar] [CrossRef]
  19. Wu, L.; Zhang, S.; Ma, R.; Chen, M.; Wei, W.; Ding, X. Carbon sequestration under different organic amendments in saline-alkaline soils. Catena 2021, 196, 104882. [Google Scholar] [CrossRef]
  20. Shi, Y.; Pan, Y.; Xiang, L.; Zhu, Z.; Fu, W.; Hao, G.; Geng, Z.; Chen, S.; Li, Y.; Han, D. Assembly of rhizosphere microbial communities in Artemisia annua: Recruitment of plant growth-promoting microorganisms and inter-kingdom interactions between bacteria and fungi. Plant Soil 2021, 470, 127–139. [Google Scholar] [CrossRef]
  21. Liu, L.; Cheng, M.; Yang, L.; Gu, X.; Jin, J.; Fu, M. Regulation of straw decomposition and its effect on soil function by the amount of returned straw in a cool zone rice crop system. Sci. Rep. 2023, 13, 15673. [Google Scholar] [CrossRef] [PubMed]
  22. Ma, Q.; Pan, W.; Tang, S.; Sun, X.; Xie, Y.; Chadwick, D.R.; Hill, P.W.; Si, L.; Wu, L.; Jones, D.L. Maize and soybean experience fierce competition from soil microorganisms for the uptake of organic and inorganic nitrogen and sulphur: A pot test using 13C, 15N, 14C, and 35S labelling. Soil Biol. Biochem. 2021, 157, 108260. [Google Scholar] [CrossRef]
  23. Zhang, Y.; Miao, S.; Song, Y.; Wang, X.; Jin, F. Biochar application reduces saline–alkali stress by improving soil functions and regulating the diversity and abundance of soil bacterial community in highly saline–alkali paddy field. Sustainability 2024, 16, 1001. [Google Scholar] [CrossRef]
  24. Bach, E.M.; Williams, R.J.; Hargreaves, S.K.; Yang, F.; Hofmockel, K.S. Greatest soil microbial diversity found in micro-habitats. Soil Biol. Biochem. 2018, 118, 217–226. [Google Scholar] [CrossRef]
  25. Hu, J.; Chen, H.; Yue, L.; Liu, S.; Wu, L.; Wang, B.; Chen, D. Elevational gradient regulates the effects of short-term nutrient deposition on soil microorganisms and SOM decomposition in subtropical forests. Plant Soil 2023, 489, 225–238. [Google Scholar] [CrossRef]
  26. Wang, X.; Bian, Q.; Jiang, Y.; Zhu, L.; Chen, Y.; Liang, Y.; Sun, B. Organic amendments drive shifts in microbial community structure and keystone taxa which increase C mineralization across aggregate size classes. Soil Biol. Biochem. 2021, 153, 108062. [Google Scholar] [CrossRef]
  27. Ma, S.; Kan, Z.; Qi, J.; Zhang, H. Effects of straw return mode on soil aggregates and associated carbon in the North China Plain. Agronomy 2020, 10, 61. [Google Scholar] [CrossRef]
  28. Chen, M.; Zhang, S.; Liu, L.; Wu, L.; Ding, X. Combined organic amendments and mineral fertilizer application increase rice yield by improving soil structure, P availability and root growth in saline-alkaline soil. Soil Tillage Res. 2021, 212, 105060. [Google Scholar] [CrossRef]
  29. Luo, Z.; Luo, Y.; Wang, G.; Xia, J.; Peng, C. Warming-induced global soil carbon loss attenuated by downward carbon movement. Glob. Change Biol. 2020, 26, 7242–7254. [Google Scholar] [CrossRef]
  30. Badia, D.; Marti, C.; Aguirre, A.J. Straw management effects on CO2 efflux and C storage in different Mediterranean agricultural soils. Sci. Total Environ. 2013, 465, 233–239. [Google Scholar] [CrossRef]
  31. Li, H.; Dai, M.; Dai, S.; Dong, X. Current status and environment impact of direct straw return in China’s cropland—A review. Ecotoxicol. Environ. Saf. 2018, 159, 293–300. [Google Scholar] [CrossRef] [PubMed]
  32. Ren, T.; Feng, H.; Xu, C.; Xu, Q.; Fu, B.; Azwar, E.; Wei, Y.; Lam, S.S.; Liu, G. Exogenous application and interaction of biochar with environmental factors for improving functional diversity of rhizosphere’s microbial community and health. Chemosphere 2022, 294, 133710. [Google Scholar] [CrossRef] [PubMed]
  33. Chen, A.; Zhang, W.; Sheng, R.; Liu, Y.; Hou, H.; Liu, F.; Ma, G.; Wei, W.; Qin, H. Long-term partial replacement of mineral fertilizer with in situ crop residues ensures continued rice yields and soil fertility: A case study of a 27-year field experiment in subtropical China. Sci. Total Environ. 2021, 787, 147523. [Google Scholar] [CrossRef] [PubMed]
  34. Berhane, M.; Xu, M.; Liang, Z.; Shi, J.; Wei, G.; Tian, X. Effects of long-term straw return on soil organic carbon storage and sequestration rate in North China upland crops: A meta-analysis. Glob. Change Biol. 2020, 26, 2686–2701. [Google Scholar] [CrossRef]
  35. Vance, E.D.; Brookes, P.C.; Jenkinson, D.S. An extraction method for measuring soil microbial biomass C. Soil Biol. Biochem. 1987, 19, 703–707. [Google Scholar] [CrossRef]
  36. Bei, S.; Li, X.; Kuyper, T.W.; Chadwick, D.R.; Zhang, J. Nitrogen availability mediates the priming effect of soil organic matter by preferentially altering the straw carbon-assimilating microbial community. Sci. Total Environ. 2022, 815, 152882. [Google Scholar] [CrossRef]
  37. Chen, M.; Song, X.; Liu, L.; Jing, Z.; Miao, J.; Ding, X.; Li, Y.; Zhang, S. Response of soil organic carbon stability and sequestration to long-term phosphorus application: Insight from a 9-year field experiment in saline alkaline paddy soil. Plant Soil 2023, 496, 415–429. [Google Scholar] [CrossRef]
  38. Caporaso, J.G.; Lauber, C.L.; Walters, W.A.; Berg-Lyons, D.; Lozupone, C.A.; Turnbaugh, P.J.; Fierer, N.; Knight, R. Global patterns of 16S rRNA diversity at a depth of millions of sequences per sample. Proc. Natl. Acad. Sci. USA 2010, 108, 4516–4522. [Google Scholar] [CrossRef]
  39. Zhao, Y.; Xu, Y.; Cha, X.; Zhang, P.; Li, Y.; Cai, A.; Zhou, Z.; Yang, G.; Han, X.; Ren, C. A global meta-analysis of land use change on soil mineral-associated and particulate organic carbon. Glob. Change Biol. 2025, 31, e70111. [Google Scholar] [CrossRef]
  40. Liu, B.; Xia, H.; Jiang, C.; Riaz, M.; Yang, L.; Chen, Y.; Fan, X.; Xia, X. 14 year applications of chemical fertilizers and crop straw effects on soil labile organic carbon fractions, enzyme activities and microbial community in rice-wheat rotation of middle China. Sci. Total Environ. 2022, 841, 156608. [Google Scholar] [CrossRef]
  41. Liu, B.; Li, W.; Li, Y.; Yuan, Z.; Wen, Z.; Shi, L.; Chen, Y. Ectomycorrhizal plant-mediated carbon fixation and microbial mechanisms of organic carbon stabilization in coastal saline soils. J. Soils Sediments 2025, 25, 811–824. [Google Scholar] [CrossRef]
  42. Jiang, Y.; Liu, D.; Zhang, S.; Wei, R.; Ding, X. Volatile fatty acids changed the microbial community during feammox in coastal saline-alkaline paddy soil. Environ. Sci. Pollut. Res. 2023, 30, 41755–41765. [Google Scholar] [CrossRef] [PubMed]
  43. Chen, W.; Su, F.; Nie, Y.; Zhong, B.; Zheng, Y.; Mo, J.; Xiong, B.; Lu, X. Divergent responses of soil microbial functional groups to long-term high nitrogen presence in the tropical forests. Sci. Total Environ. 2022, 821, 153251. [Google Scholar] [CrossRef] [PubMed]
  44. Abbott, K.M.; Quirk, T.; Fultz, L.M. Soil microbial community development across a 32-year coastal wetland restoration time series and the relative importance of environmental factors. Sci. Total Environ. 2022, 821, 153359. [Google Scholar] [CrossRef]
  45. Connell, R.K.; Zeglin, L.H.; Blair, J.M. Plant legacies and soil microbial community dynamics control soil respiration. Soil Biol. Biochem. 2021, 160, 108350. [Google Scholar] [CrossRef]
  46. Zhang, X.; Shen, S.; Xue, S.; Hu, Y.; Wang, X. Long-term tillage and cropping systems affect soil organic carbon components and mineralization in aggregates in semiarid regions. Soil Tillage Res. 2023, 231, 105742. [Google Scholar] [CrossRef]
  47. Zhang, J.; Zhang, F.; Yang, L. Continuous straw returning enhances the carbon sequestration potential of soil aggregates by altering the quality and stability of organic carbon. J. Environ. Manag. 2024, 358, 120903. [Google Scholar] [CrossRef]
  48. Kang, L.; Wu, J.; Zhang, C.; Zhu, B.; Chu, G. Alterations of soil aggregates and intra-aggregate organic carbon fractions after soil conversion from paddy soils to upland soils: Distribution, mineralization and driving mechanism. Pedosphere 2024, 34, 121–135. [Google Scholar] [CrossRef]
  49. Li, W.; Zhong, M.; Wang, H.; Shi, X.; Song, J.; Wang, J.; Zhang, W. Exogenous carbon inputs alleviated salt-induced oxidative stress to cotton in salinized field by improving soil aggregate structure and microbial community. Front. Plant Sci. 2025, 16, 1522534. [Google Scholar] [CrossRef]
  50. Shu, Q.; Gao, S.; Liu, X.; Yao, Z.; Wu, H.; Qi, L.; Zhang, X. Soil enzyme activities and microbial carbon pump promote carbon storage by influencing bacterial communities under nitrogen-rich conditions in tea plantation. Agriculture 2025, 15, 238. [Google Scholar] [CrossRef]
  51. Zhu, Y.; An, M.; Anwar, T.; Wang, H. Differences in soil bacterial community structure during the remediation of Cd-polluted cotton fields by biochar and biofertilizer in Xinjiang, China. Front. Microbiol. 2024, 15, 1288526. [Google Scholar] [CrossRef] [PubMed]
  52. Liu, S.; Wang, Z.; Niu, J.; Dang, K.; Zhang, S.; Wang, S.; Wang, Z. Changes in physicochemical properties, enzymatic activities, and the microbial community of soil significantly influence the continuous cropping of Panax quinquefolius L. (American ginseng). Plant Soil 2021, 463, 427–446. [Google Scholar] [CrossRef]
  53. Zhao, X.; Tian, P.; Zhang, W.; Wang, Q.; Guo, P.; Wang, Q. Nitrogen deposition caused higher increases in plant-derived organic carbon than microbial-derived organic carbon in forest soils. Sci. Total Environ. 2024, 925, 171752. [Google Scholar] [CrossRef] [PubMed]
  54. Zhou, J.; Zhang, S.; Hui, D.; Vancov, T.; Fang, Y.; Tang, C.; Jiang, Z.; Ge, T.; Cai, Y.; Yu, B.; et al. Pyrogenic organic matter decreases while fresh organic matter increases soil heterotrophic respiration through modifying microbial activity in a subtropical forest. Biol. Fertil. Soils 2024, 60, 509–524. [Google Scholar] [CrossRef]
Figure 1. Effect of straw incorporation and N application on MAOC (a), POC (b), POC/MAOC (c), POC/SOC (d), DOC (e), and MBC (f). * and ** showed significant and extremely significant correlations at the levels of 0.05 and 0.01 respectively. “ns” indicates no relevance. The different capital letters indicate significant difference among straw input amounts of the same N application at p < 0.05. Different lowercase letters indicated a significant difference among N application amounts of the same straw input at p < 0.05, error bar represents the standard deviation of the mean (n = 3).
Agronomy 15 01034 g001
Figure 2. Effect of straw incorporation and N application on (a) SOC content and (b) SOC sequestration. Values are means ± standard deviation (n = 3). * and ** showed significant and extremely significant correlations at the levels of 0.05 and 0.01 respectively. “ns” indicates no relevance. The different capital letters indicate significant difference among straw input amounts of the same N application at p < 0.05. Different lowercase letters indicate a significant difference among N application amounts of the same straw input at p < 0.05. N1 and N2 refer to N fertilization at 270 and 210 kg N ha−1, respectively. S0, S1, and S2 refer to straw returning levels at 0, 5000, and 10,000 kg C ha−1.
Agronomy 15 01034 g002
Figure 3. Effect of straw incorporation and N application on Fourier-transform infrared spectra.
Agronomy 15 01034 g003
Figure 4. SEM images of soil structure and morphology under various treatments, including S0, S1, and S2 processing at N1 and N2 levels with magnifications of 500× (AF) and 5000× (af).
Agronomy 15 01034 g004aAgronomy 15 01034 g004b
Figure 5. Effect of straw incorporation and N application on CO2 efflux rate (a), cumulative C mineralization (b), CMR (c), and SCMR (d). * and ** showed significant and extremely significant correlations at the levels of 0.05 and 0.01 respectively. The different capital letters indicate significant difference among straw input amounts of the same N application at p < 0.05. Different lowercase letters indicate a significant difference among N application amounts of the same straw input at p < 0.05. N1 and N2 refer to N fertilization at 270 and 210 kg N ha−1, respectively. S0, S1, and S2 refer to straw returning levels at 0, 5000, and 10,000 kg C ha−1.
Agronomy 15 01034 g005aAgronomy 15 01034 g005b
Figure 6. Effect of straw incorporation and N application on microbial lineages. The cladogram indicates the phylogenetic distribution of microbial lineages under different treatments by linear discriminant analysis of effect sizes. The average abundance of microbial taxa in three groups is used in the differential analysis. The LDA score of the taxa represents the odds of their distribution in different treatments. The phylum, class, and order are listed in order from the inside to the outside of each cladogram.
Agronomy 15 01034 g006
Figure 7. Correlations (a) and Spearman correlation analysis (b) illustrating the relationships between the bacterial community and soil properties. Mantel test heat map of correlation between environmental factors and amplicon sequence variant (ASV). k-strategy and r-strategy Spearman correlation heat maps of microorganisms and SOC physical and chemical fractions. *: p ≤ 0.05; **: p ≤ 0.01.
Agronomy 15 01034 g007
Figure 8. Redundancy analysis (RDA) of the relationship between soil properties and SOC stability and storage.
Agronomy 15 01034 g008
Table 1. The location, climate, and soil conditions of the experiment site.
Information
Location37°18′35″ N, 118°39′20″ E
Altitude (m)−1.2
Annual average precipitation (mm)555.9
Annual average sunshine duration (h)2234.0
Average daily temperature (°C)12.3
pH (soil: water = 1:5)8.79 ± 0.12
SOC (g kg−1)8.98 ± 0.13
EC (μS m−1)453.3 ± 21.1
Total N (TN, g kg−1)0.97 ± 0.03
Olsen-P (AP, mg kg−1)9.50 ± 0.31
Available potassium (AK, mg kg−1)254.48 ± 14.1
Table 2. Results of two-way ANOVA for soil physiochemical properties.
TreatmentspHBDECTNAPAKSOC
(g cm−3)(μS m−1)(g kg−1)(mg kg−1)(mg kg−1)(g kg−1)
N1S08.98 ± 0.11 Aa1.30 ± 0.07 Aa452.13 ± 15.66 Aa0.98 ± 0.07 Ba9.43 ± 0.15 Ba247.40 ± 13.01 Ba8.91 ± 0.22 Ba
S18.81 ± 0.05 Aa1.25 ± 0.03 Aa429.47 ± 11.40 ABa1.05 ± 0.03 ABa9.92 ± 0.29 Aa265.16 ± 8.61 ABa9.39 ± 0.11 Aa
S28.77 ± 0.24 Aa1.21 ± 0.05 Aa420.87 ± 8.08 Ba1.10 ± 0.04 Aa10.31 ± 0.12 Aa277.69 ± 18.74 Aa9.74 ± 0.24 Aa
N2S09.01 ± 0.50 Aa1.19 ± 0.03 Aa446.63 ± 11.43 Aa0.99 ± 0.05 Ba9.57 ± 0.13 Ba254.28 ± 17.15 Aa9.01 ± 0.53 Aa
S18.60 ± 0.14 Aa1.06 ± 0.03 Ba405.22 ± 5.48 Bb1.08 ± 0.04 ABa10.47 ± 0.65 ABa275.41 ± 14.83 Aa9.71 ± 0.27 Aa
S28.68 ± 0.28 Aa1.07 ± 0.03 Ba409.53 ± 12.46 Ba1.11 ± 0.05 Aa10.66 ± 0.55 Aa275.27 ± 4.63 Aa9.75 ± 0.38 Aa
N nsns*nsnsnsns
S ns***********
S × N nsnsnsnsnsnsns
Values are means ± standard deviation (n = 3). The different capital letters indicate significant difference among straw input amounts of the same N application at p < 0.05. Different lowercase letters indicate a significant difference among N application amounts of the same straw input at p < 0.05. * and ** showed significant and extremely significant correlations at the levels of 0.05 and 0.01 respectively. “ns” indicates no relevance. N1 and N2 refer to N fertilization at 270 and 210 kg N ha−1, respectively. S0, S1, and S2 refer to straw returning levels at 0, 5000, and 10,000 kg C ha−1. BD—soil bulk density; EC—electrical conductivity; TN—total nitrogen; AP—available phosphorus; AK—available potassium; SOC—soil organic carbon.
Table 3. Effect of straw incorporation and N application on OC functional groups.
TreatmentsOC Functional Groups (%)
Polysaccharide-CCarboxylic-CAromatic-CAliphatic-COH-C
N1S055.26 ± 2.04 Aa12.93 ± 1.18 Aa2.05 ± 0.25 Aa25.18 ± 2.33 Ba4.58 ± 0.25 Aa
S152.83 ± 2.99 Ba12.52 ± 0.80 Aa1.98 ± 0.28 Aa27.66 ± 2.20 Aa5.02 ± 0.49 Aa
S255.22 ± 1.46 ABa12.44 ± 0.83 Aa1.47 ± 0.08 Ba28.05 ± 0.80 Aa2.82 ± 0.23 Bb
N2S054.13 ± 3.07 Aa12.98 ± 0.47 Aa1.57 ± 0.15 Cb26.39 ± 2.58 Ba4.93 ± 0.21 Aa
S153.96 ± 1.42 Aa11.26 ± 0.34 Bb2.55 ± 0.17 Aa27.67 ± 1.78 Ba4.57 ± 0.20 Aa
S248.36 ± 3.32 Bb12.66 ± 0.42 Aa1.82 ± 0.16 Ba32.20 ± 2.99 Aa4.95 ± 0.33 Aa
N ******
S ***ns*
S × N ns**nsns
Values are means ± standard deviation (n = 3). The different capital letters indicate significant difference among straw input amounts of the same N application at p < 0.05. Different lowercase letters indicate a significant difference among N application amounts of the same straw input at p < 0.05. * and ** showed significant and extremely significant correlations at the levels of 0.05 and 0.01 respectively. “ns” indicates no relevance. N1 and N2 refer to N fertilization at 270 and 210 kg N ha−1, respectively. S0, S1, and S2 refer to straw returning levels at 0, 5000, and 10,000 kg C ha−1.
Disclaimer/Publisher’s Note: The statements, opinions and data contained in all publications are solely those of the individual author(s) and contributor(s) and not of MDPI and/or the editor(s). MDPI and/or the editor(s) disclaim responsibility for any injury to people or property resulting from any ideas, methods, instructions or products referred to in the content.

