Article

Combined Zinc and Selenium Biofortification of Durum Wheat in the South-West of Spain

by
Carlos García-Latorre
,
Angélica Rivera-Martín
,
María Dolores Reynolds-Marzal
and
Maria J. Poblaciones
*
Department of Agronomy and Forest Environment Engineering, University of Extremadura, Avda. Adolfo Suárez s/n, 06007 Badajoz, Spain
*
Author to whom correspondence should be addressed.
Agronomy 2025, 15(5), 1038; https://doi.org/10.3390/agronomy15051038
Submission received: 19 February 2025 / Revised: 7 April 2025 / Accepted: 23 April 2025 / Published: 25 April 2025

Abstract

:
Micronutrient malnutrition, often caused by the low bioavailability of zinc (Zn) and selenium (Se) in soil, poses serious health risks worldwide. To address these deficiencies, this study evaluated the efficacy of combined Se and Zn fertilization in durum wheat (Triticum durum) through a two-year field experiment conducted under semi-arid Mediterranean conditions. The experimental design was a split-split-plot, considering the growing season (2017/18 and 2018/19) as the main plot, an initial soil application of Zn (50 kg ZnSO4-7H2O ha−1 vs. no Zn) as the subplot, and different foliar treatments as the sub-subplot factor: no application (0F), 10 g Se ha−1 (SeF), 8 kg ZnSO4-7H2O ha−1 (ZnF), and a combination of ZnF + SeF. While Zn soil application resulted in a 16% increase in both grain and straw yields, the combined Zn and Se foliar application resulted in a significant 15% increase in grain yield, as well as for the highest concentrations of Zn (by 1.44- and 7.38-fold in grain and straw, respectively) and Se (by 3.41- and 4.41-fold in grain and straw, respectively). These results indicate that durum wheat is a promising crop for biofortification initiatives that could contribute to reducing Zn and Se deficiencies in human diets and livestock feed in the Mediterranean region.

1. Introduction

Micronutrient malnutrition, often referred to as “hidden hunger”, represents a growing global concern, particularly for zinc (Zn) and selenium (Se), affecting an estimated 2 billion people worldwide [1,2,3]. This issue is especially pronounced in crops like durum wheat (Triticum turgidum subsp. durum), a dietary staple in Mediterranean regions [4], where soil deficiencies in Zn and Se are prevalent [5], impacting crop yields and nutritional quality [6].
Approximately 50% of soils dedicated to cereal crops worldwide are deficient in Zn [5]. Similarly, Se deficiency is widespread, particularly in temperate and humid climates, where levels often fall below 120 µg kg−1 [7]. In regions such as the southwestern Iberian Peninsula, soil concentrations frequently fall below critical thresholds (25 mg Zn kg−1 [8] and 140 µg Se kg−1 [9]), which prevents the meeting of the recommended daily intake for both Zn (3–14 mg Zn per day) [10] and Se (60–70 µg Se per day) [11].
The intake of Zn and Se is closely correlated to their abundance in the soil and the ability of plants to effectively absorb and translocate these elements [12,13]. In this regard, Zn uptake is often limited by its strong adsorption to soil particles and low solubility, particularly in alkaline soils, while sandy or calcareous soils may lack sufficient amounts [12]. In contrast, the bioavailability of Se is influenced by the composition of the parent material of the soil, climate conditions, and competing ions, including sulfate, nitrate, or phosphate, which can displace it from soil adsorption complexes [13]. Additionally, the uptake of Zn by plants requires specific transporter proteins, the production of root exudates, and mycorrhizal associations [14], whereas Se is primarily absorbed as selenate or selenite through sulfate and phosphate transporters, respectively [15]. In this context, agronomic biofortification has emerged as a promising, more sustainable strategy for addressing these issues [16]. The objective of this approach is to increase the micronutrient concentration in the edible parts of crops through the targeted application of minerals, primarily through soil incorporation or foliar spraying [17].
Therefore, given the extensive cultivation areas and high consumption rates of cereals of this staple crop, the biofortification of durum wheat [4] may represent one of the most effective and readily controllable strategies for increasing the average daily intake of essential nutrients [18].
The efficacy of agronomic practices in boosting grain yield and the concentrations of essential nutrients, such as Zn [19] and Se [20], has been well-documented in cereals, particularly wheat species. In bread wheat, the foliar application of 8 kg ZnSO4-7H2O ha−1 has been shown to result in a 10-fold increase in grain Zn content [21]. Furthermore, the application of Zn has been demonstrated to markedly increase grain yield, although this appears to be predominantly associated with soil application rather than foliar application, which is more effective in promoting Zn accumulation [8]. It can thus be concluded that the combined application of both treatments may prove to be the most effective method for increasing these parameters. Similarly, the foliar application of 10 g ha−1 of Na2SeO4 to durum wheat has been demonstrated to elevate the concentration of Se in grain to levels that are beneficial for human and animal consumption, with grain concentrations of Se of approximately 1 mg kg⁻1, representing a threefold increase compared to the control [22].
Although individual Zn and Se biofortification strategies have demonstrated efficacy, there is a growing interest in combined approaches. The simultaneous application of Zn and Se in biofortification strategies has garnered increasing attention due to the potential for synergistic effects, cost-effectiveness, and comprehensive improvement in crop nutritional quality [23]. However, this combined approach requires careful management, as the interaction between Zn and Se can lead to a reduction in Se concentrations compared to Se application alone [24], which may be due to the above-mentioned differences in uptake pathways, which may lead to competitive or synergistic effects depending on the experiment conditions. Additionally, the regulation role of both nutrients on the expression of transporter genes [25] or the complex interplay with other nutrients like phosphorus [26] are other mechanisms that must be considered when exploring the interaction between Zn and Se in plants, which would change depending on the crop considered. In this sense, while the efficacy of combined Zn and Se biofortification has been demonstrated in bread wheat (Triticum aestivum L.) [21,24], its impact on durum wheat remains largely unexplored. This represents a critical gap in our understanding of cereal crop fortification. It is important to note that genetic differences in durum wheat, being tetraploid and lacking the D genome present in hexaploid bread wheat [27], may respond differently to Zn biofortification. This could affect nutrient uptake, translocation, and accumulation mechanisms, potentially leading to variations in the biofortification efficiency between the two wheat species. Additionally, investigating the impact of this combined biofortification on specific durum wheat quality parameters, such as kernel vitreosity, would be valuable, as it is a crucial factor for semolina production [28].
Based on the low bioavailability of Se and Zn in the soils of the Mediterranean area, the primary objective of this study was to evaluate the combined effects of Zn and Se biofortification on grain and straw yields, as well as their accumulation in durum wheat. We hypothesized that foliar application of Se and Zn would enhance grain yield and increase grain Se and Zn concentrations in bread wheat under rainfed conditions, regardless of seasonal rainfall variations. We aimed to provide insights into micronutrient interactions and their impact on the agronomic performance and nutritional profile of this important crop. The findings from this research have the potential to inform agricultural practices and contribute to the development of more effective strategies for improving the micronutrient content of durum wheat.

2. Materials and Methods

2.1. Study Site, Climatic and Soil Conditions

The field experiment was conducted over two consecutive growing seasons (2017/18 and 2018/19) in Badajoz, southern Spain (38°54′ N, 6°44′ W, 186 m above sea level) under rainfed Mediterranean conditions. This trial is part of a larger experiment that includes the study of combined Se and Zn biofortification in field pea [23], bread wheat [21], and the crop dealt with in this publication. Detailed information on the climatological data of the trial period can be found in both papers. Briefly, the two seasons exhibited significant variability, in fact, the sowing dates were 31 October 2017 and 31 December 2018: the 2017/18 season received near-average rainfall (477 mm), but March and April experienced an unusually high precipitation of 252 mm, which positively influenced crop growth. In contrast, the 2018/19 season was characterized by reduced precipitation, totaling only 295 mm, which is a 35% reduction from the long-term mean. This season also saw pronounced drought periods in February, March, May, and June, along with an unusually wet autumn that delayed sowing by two months. A climogram of the distribution of precipitations and temperature throughout the two-year period of the experiment is included in the Supplementary Material (Figure S1).
Four representative soil samples were collected in September 2017, before starting the assays. These samples were taken from a depth of 30 cm, air-dried, and passed through a 2 mm sieve for subsequent analysis [29]. Texture was determined by gravimetric analysis, pH using a calibrated pH meter (10 g soil:25 mL deionized H2O), and organic matter content by potassium dichromate oxidation (Sigma Aldrich, St. Louis, MO, USA) [30]; as the soil was a clay-loam texture (30% sand, 40% silt, and 30% clay), the pH was slightly acidic pH (6.4 ± 0.02) and the organic matter content was low (1.31 ± 0.09%). The electrical conductivity indicated a very mild salinity level (1321.4 ± 24.04 µS cm−1). The total nitrogen, POlsen, and extractable potassium levels were respectively determined through the application of the Kjeldahl (Kjeltec™8200 Auto Distillation Unit. FOSS Analytical. Hilleroed, Denmark), Olsen, and ammonium acetate (1 N) methods (Sigma Aldrich, St. Louis, MO, USA), resulting in 0.12 ± 0.01% N, P Olsen of 4.9 ± 0.05 g P kg−1, and 0.82 meq 100 g−1 of extractable potassium. For micronutrient analysis, DTPA extraction followed by inductively coupled plasma mass spectrometry (ICP-MS; Agilent 7500ce, Agilent Technologies, Palo Alto, CA, USA) was employed. The analysis revealed deficient concentrations of Se (1.27 ± 0.01 µg Se kg−1) and Zn (0.303 ± 0.03 mg kg−1).

2.2. Experimental Design

The experiment was arranged as a split-split-plot design with four replicates randomly distributed (Figure S2). The durum wheat variety used was Don Ricardo, provided by the Estação nacional de melhoramento de plantas, from the National Institute of Agricultural and Veterinary Research of Portugal. The main-plot factor was the study year, with two growing years: (1) 2017/2018 and (2) 2018/2019. The subplot factor was Zn soil application, with two treatments: (1) no Zn application (0 SZn) and (2) a single soil application of zinc sulfate heptahydrate (ZnSO4-7H2O; Sigma-Aldrich, St. Louis, MO), at a rate of 50 kg ZnSO4-7H2O ha−1 (equivalent to 11.4 kg Zn ha−1) prior to sowing in October 2017 (50SZn). The zinc sulfate was distributed as a solid on the soil surface and incorporated through tillage.
The sub-subplot was the foliar treatments, with four treatments: (1) no foliar application (0F), (2) two foliar applications of ZnSO4-7H2O at 4 kg ha−1 each (equivalent to 0.91 kg Zn ha−1) applied at the start of flowering and two weeks later (ZnF), according to previous experiments [8], (3) a foliar Se treatment involving a single foliar application of 24 g ha−1 of sodium selenate (Na2SeO4), providing 10 g Se ha−1, applied at the start of flowering (SeF) according to previous experiments [31], and (4) a combined treatment incorporating both foliar Zn and Se applications as previously described (ZnF + SeF).
Each treatment plot was 3 m × 5 m (15 m2) in size, with 0.5 m alleys to separate the plots. Foliar treatments were applied using an aqueous solution at a rate of 800 L ha−1, with spraying conducted in the late afternoon to ensure optimal leaf coverage and minimize the risk of plant damage. For the control treatment (OF), an equivalent volume of water was applied to the plots without any added Zn or Se to ensure consistency in the application procedure across all treatments. This approach ensured that any observed effects could be attributed solely to the Zn and Se applications, rather than differences in spraying or water use.

2.3. Crop Management

Prior to sowing, the seedbed was prepared using conventional tillage, and 200 kg ha−1 of N-P-K fertilizer (15-15-15) was applied (Harpo-Z, Bayer Crop Science S.L., Barcelona, Spain). The sowing dates differed between the two seasons due to variations in weather conditions, with the first occurring in early November 2017 and the second in late December 2018. In both cases, a seeding rate of 350 seeds m−2 was employed. To supplement the initial fertilization, topdressing of 100 kg N ha−1 was applied as urea (46%) at the tillering stage. Additionally, calcium ammonium nitrate (NAC 27) was applied at a rate of 50 kg ha−1 (Harpo-Z, Bayer Crop Science S.L., Barcelona, Spain) during the Zadoks stage 32 (second node detectable) [32]. Weed control was managed with the application of a pre-emergence herbicide (clortoluron 40% p/v + diflufenican 2.5% p/v) at a rate of 2.5 L ha−1 (Harpo-Z, Bayer Crop Science S.L., Barcelona, Spain).

2.4. Soil and Plant Sampling and Analysis

To monitor the residual effects of Zn treatments, soil samples were collected in September 2017, January 2018, May 2018, January 2019, and May 2019. At each time point, Zn-DTPA concentrations were measured. All results are presented on a dry weight basis.
Harvesting was performed using a trial harvester of the brand Wintersteiger model Nurserymaster Elite with a 1.5 m cutting width (Wintersteiger, Salt Lake City, UT, USA) and was conducted at maturity, on the 5th of July of 2018 and 2019, respectively. Grain and straw samples were then dried at 70 °C until reaching a constant weight, and the dry matter yield was recorded. In the grain samples, the measured parameters were grain yield, thousand-grain weight, hectoliter weight, protein content and vitreousness protein content, and concentrations of Se and Zn in grain. Additionally, in the straw, the analysis encompassed yield, Se and Zn concentrations, fiber fractions (ADF, NDF, ADL), and ash content. The thousand-grain weight was determined using a photoelectric seed counter (Sadkiewicz Instruments, Bydgoszcz, Poland), while the hectoliter weight was determined using an electronic citerometer (Kern, FL, USA). The vitreosity of durum wheat was evaluated through a visual examination of transverse cuts of 50 grains per sample using a farinometer (Pohl; Concereal, Barcelona, Spain). The opacity of each grain was then categorized. The protein content was determined through the analysis of nitrogen using the Kjeldahl method [33] using a Kjeltec™ 8200 Auto Distillation Unit (FOSS Analytical. Hilleroed, Denmark), which involved the digestion, distillation, and titration of the sample. The nitrogen content was multiplied by 6.25 in order to estimate the crude protein content. The fiber components, namely neutral detergent fiber (NDF), acid detergent fiber (ADF), and acid detergent lignin (ADL), were analyzed using a fiber analyzer (ANKOM8–98, ANKOM Technology, Macedon, NY, USA) [33]. The total ash content was determined by incineration in a muffle oven at 600 °C [33].
For mineral analysis (Se, Zn), samples of straw and grain were ground to a particle size of less than 0.45 mm, and 1 g was digested in a mixture of ultra-pure nitric acid and 30% hydrogen peroxide using a microwave digestion system (Mars X, CEM Corp, Matthews, NC, USA), The solution was diluted and analyzed by ICP-MS, with quality control ensured by the use of blanks and standard reference materials (tomato leaf, NIST 1573a), resulting in a 95% recovery rate for the minerals [34]. The total nutrient uptake was calculated by multiplying the grain yield by Zn and Se mineral concentrations, taking into account the dilution effects between growing seasons [21].

2.5. Statistical Analysis

All data were initially evaluated for normality and homoscedasticity using the Shapiro–Wilk and Levene’s tests, respectively. Split-split plot analysis of variance (ANOVA) within mixed-design models was employed to analyze the effects of the growing season (2017/18 and 2018/19), soil Zn application (0SZn and 50SZn), foliar treatments (0F, SeF, ZnF, SeF + ZnF), and their interactions on key crop parameters. The parameters examined included grain yield, thousand-grain weight, hectoliter weight, protein content and vitreousness protein content, and concentrations of Se and Zn in grain. Additionally, in the straw, the analysis encompassed yield, Se and Zn concentrations, fiber fractions (ADF, NDF, ADL), and ash content. The temporal changes in soil Zn-DTPA levels were assessed using a split-plot ANOVA, with the study year as the main-plot factor and Zn application as the subplot factor. When the results of the ANOVAs indicated significant differences, mean comparisons were performed using Fisher’s protected least significant difference (LSD) test, with a significance level of p ≤ 0.05. All the analyses were performed with the Statistix v. 8.10 (Analytical Software, Tallahassee, FL, USA) package.

3. Results

3.1. DTPA-Zn Evolution During the Experiment

The split-plot ANOVA, performed to evaluate the residual effect of the Zn applications on the concentration of Zn incorporated into the topsoil, showed sampling time (degree of freedom, df = 2, F value = 25.44, p < 0.001), Zn application (df = 2, F value = 18.55, p < 0.001), and their interaction (df = 4, F value = 4.95, p = 0.021) to be all significant variables (considering a p ≤ 0.05).
The level of Zn-DTPA incorporated into the topsoil increased from 0.303 mg kg−1 at the beginning of the experiment to an average of 1.37 Zn-DTPA mg kg−1 in January 2018 (first sampling after application) in both treatments that included Zn application to the soil. This content did not decrease significantly throughout the duration of the trial, with a mean level of 1.22 mg Zn-DTPA kg−1 at the last soil sampling. No differences were found between the levels reached by both applications, although a slightly higher level was observed in the combined soil + foliar application (Figure S3).

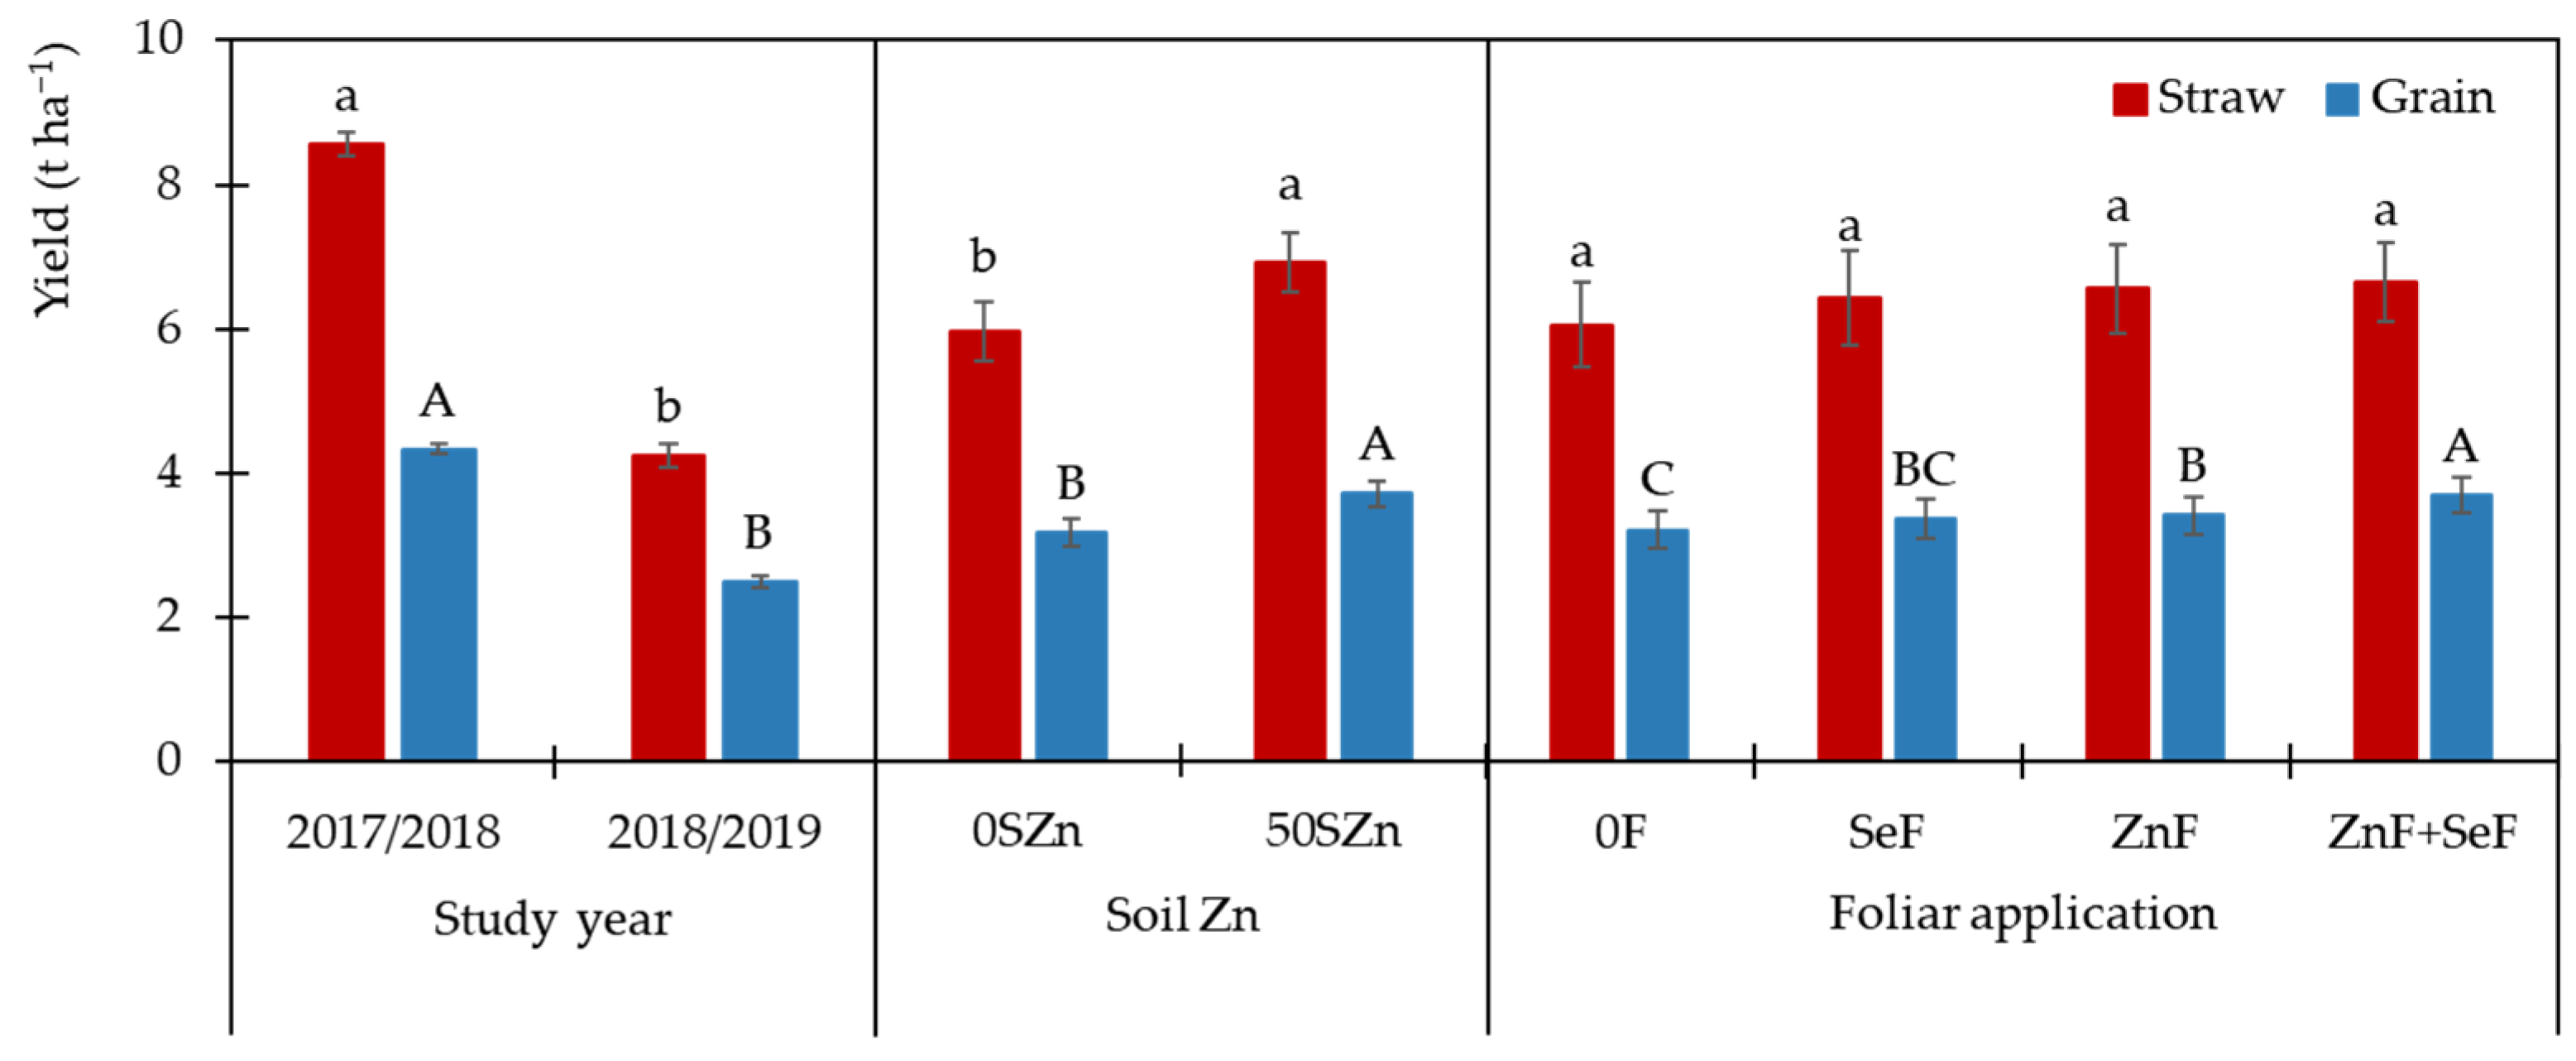
3.2. Grain and Straw Yields

As shown in Table 1, both grain and straw yields were significantly influenced by the year of study and soil Zn application. However, foliar application had a significant effect only on grain yield. None of the interactions had a significant impact on either type of yield.
Figure 1 shows that the first study year was significantly more productive than the second, with grain yields 1.74-fold higher and straw yields 2.0-fold higher. The application of Zn to the soil (50SZn) also resulted in higher grain and straw yields, namely 16.9 and 16.1%, respectively. The foliar application of Zn led to significant increases in grain yield with 6.2% observed in the case of Zn alone and 15.1% in the case of the combination of ZnF + SeF. For straw, although both Zn applications resulted in increases of more than 8%, the difference was not statistically significant.

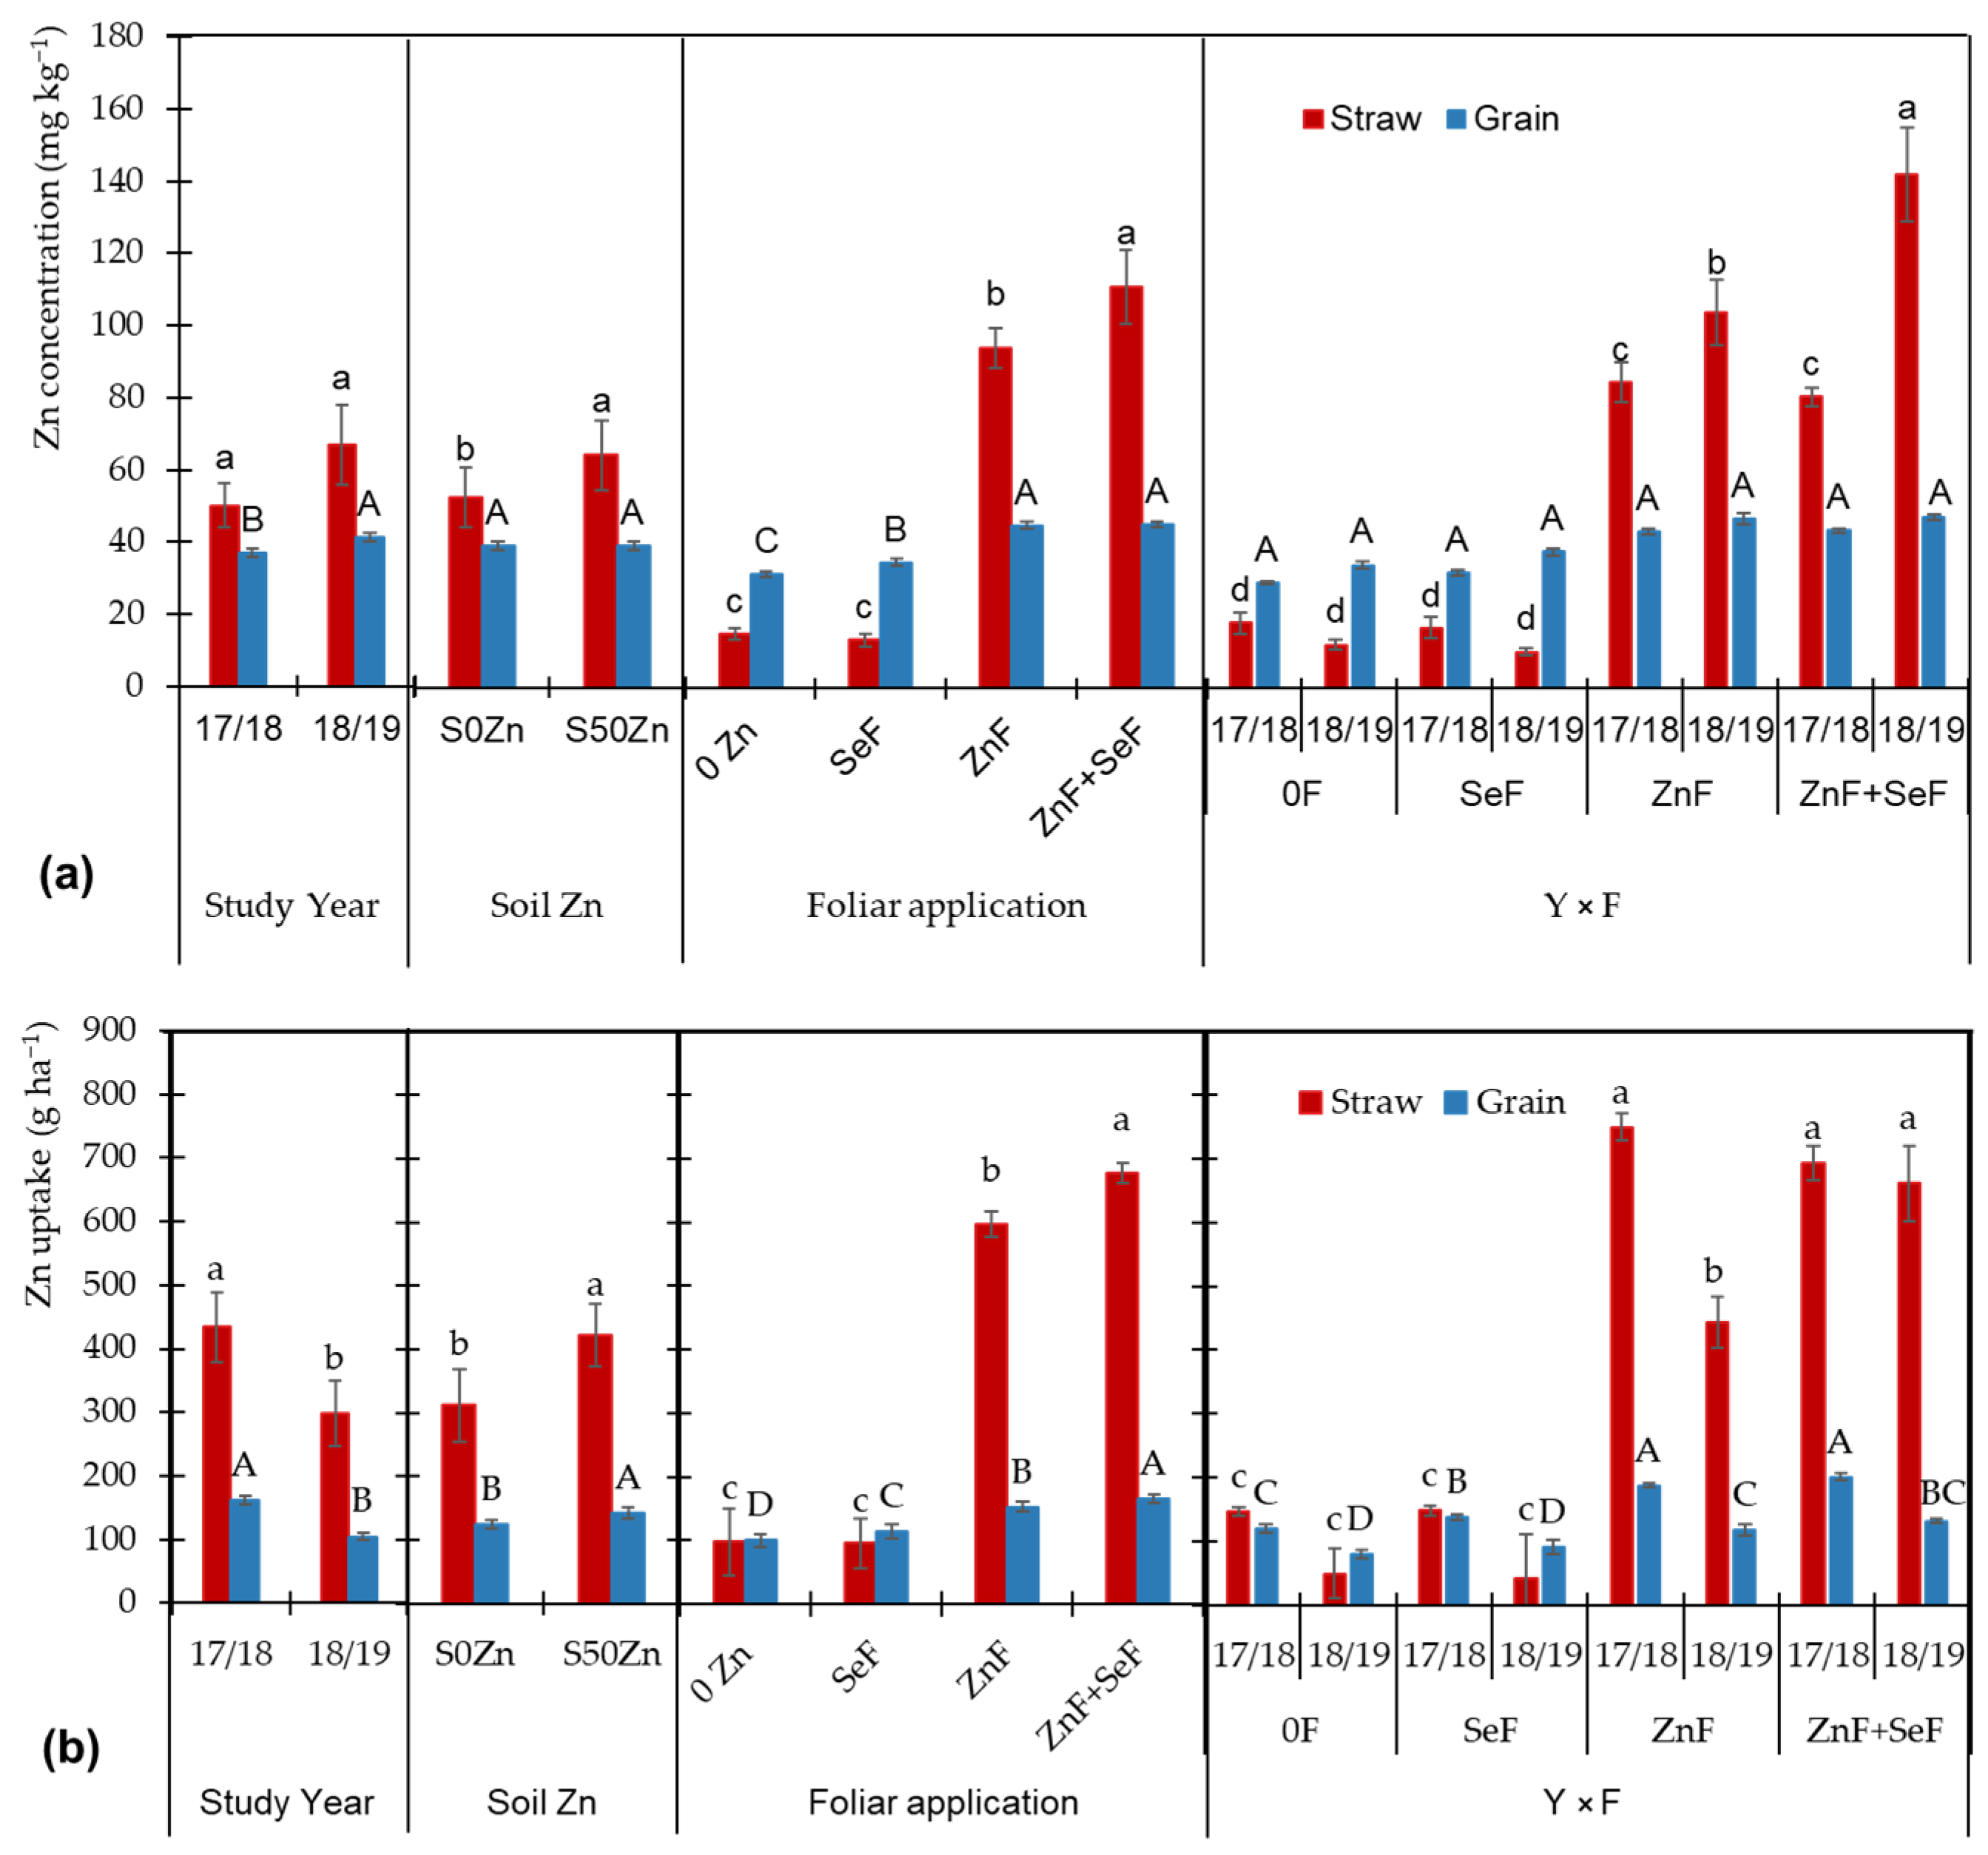
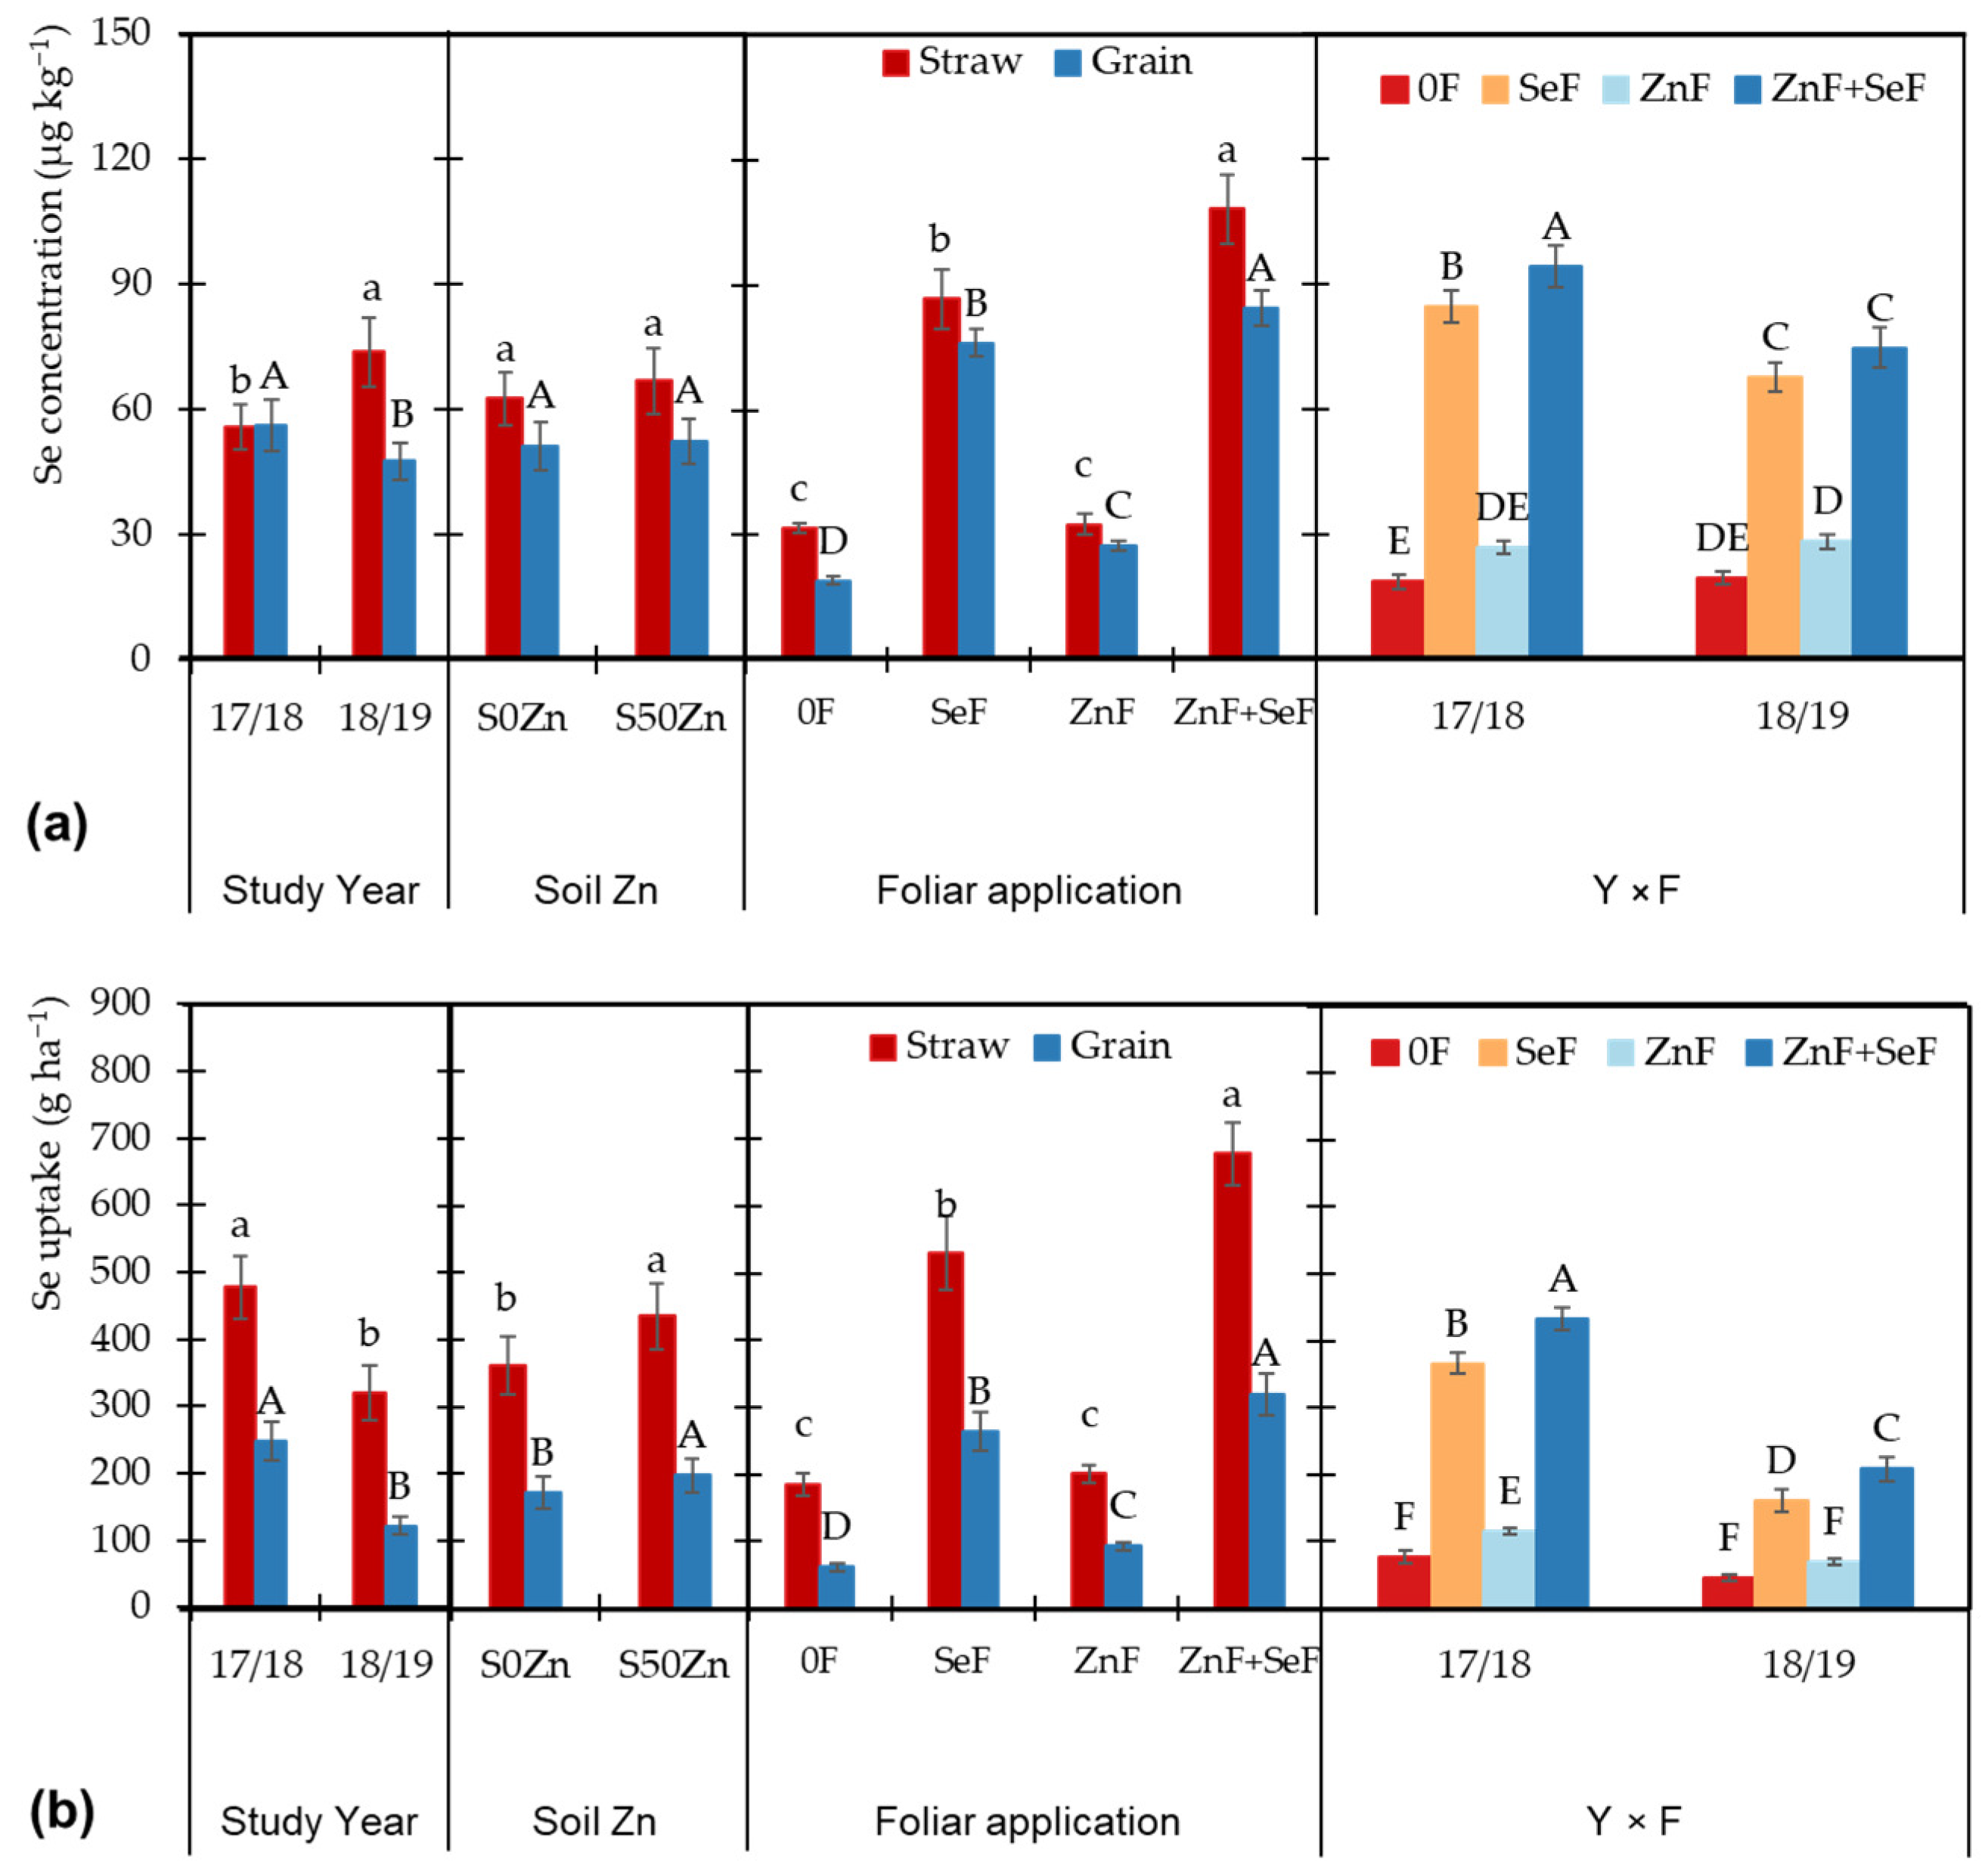
3.3. Zinc and Se Concentrations and Their Uptake in Grain and Straw

The analysis of variance revealed significant effects on Zn and Se concentration in durum wheat (Table 1). The concentration of Zn in the straw was found to be significantly affected by soil Zn application, foliar treatments, and year × foliar interaction. Conversely, grain Zn and Se accumulation, as well as straw Se accumulation, were significantly impacted by the study year and by foliar treatments (p ≤ 0.001). Additionally, grain Se was affected by the year × foliar interaction.
The total nutrient uptake (calculated by multiplying the nutrient concentration by the yield to account for dilution effects across growing seasons) for Zn and Se in both straw and grain was significantly affected by the main factors. The factors found to have a significant impact on nutrient uptake were year, soil Zn application, and foliar treatments. The interaction year × foliar had a significant effect on Zn uptake in both grain and straw, as well as on Se uptake in grain.
The concentrations of Zn in durum wheat straw and grain exhibited significant variability across treatments and growing seasons (Figure 2a). In the grain, Zn levels were found to be significantly higher in the second year, whereas no such effect was observed in the straw. Meanwhile, the application of Zn to the soil resulted in a notable increase in Zn levels in straw, but not in grain, compared to the control. However, foliar treatments had a more pronounced effect, with Zn (ZnF) and combined Zn-Se (ZnF + SeF) applications significantly increasing Zn concentrations, particularly in straw, compared to control (0F) and Se-only (SeF) treatments. Furthermore, grain Zn concentrations demonstrated an increase with ZnF and ZnF + SeF applications, though to a lesser extent than in straw. The foliar treatment of Se alone (SeF) had a minimal impact on Zn concentrations in the straw, resulting in a significant increase in grain Zn levels. Interestingly, the effects of foliar treatments were observed to be consistent across both growing seasons (2017/2018 and 2018/2019), with the ZnF and ZnF + SeF treatments consistently demonstrating the highest Zn concentrations.
Figure 3a shows that, while the total Se concentration was 17.9% higher in 2017/18 in grain, the straw accumulated 32.2% more Se in 2018/19. The effect of foliar application followed the same trend in both fractions, with SeF application resulting in significant increases of 3.97- and 2.74-fold in grain and straw, respectively, compared to the control. The combination of Zn and Se (ZnF + SeF) resulted in even higher increases, with control concentrations being multiplied by 4.41- and 3.41-fold in straw and grain, respectively. As seen in the interaction year × foliar for grain, the combination of Zn and Se exhibited this synergistic effect in both years.
When considering yields to determine Se uptake, significant differences emerge due to the large yield variations observed between the two years (Figure 3b). In the initial year, 2017/18, the highest levels of Se uptake were observed in both fractions. These values were found to be 104% and 49.4% higher, respectively, in the grain and straw. Soil Zn application increased Se uptake by 20.5% in grain and 15.3% in straw due to higher yields. Meanwhile, foliar applications maintained the established trends, with the SeF application standing out and the ZnF + SeF application showing the highest uptake. The interaction year × foliar in grain, in addition to the trend already found for the SeF and ZnF + SeF applications, highlighted the lower uptake found in the 2018/19 year and a higher Se uptake due to the ZnF application in the first year.

3.4. Yield Components and Quality Parameters of Grain and Straw

As can be seen from Table 1, the study year significantly influenced all yield components and quality parameters, with the exception of ash content. Soil Zn application significantly influenced hectoliter weight, while foliar application had a significant impact on 1000 grain weight, protein content, and vitreosity. The interactions year × foliar significantly influenced 1000 grain weight and hectoliter weight, year × soil significantly influenced 1000 grain weight and all fibers (NDF, ADF, and ADL), and soil × foliar significantly influenced 1000 grain weight and grain protein content.
While in 2017/18, grains had significantly higher 1000 grain weight (27.3%) and hectoliter weight (4.1%), grain protein content and vitreosity were lower by 23.2% and 8.6%, respectively (Table 2). The application to the soil of 50 kg ZnSO4-7H2O (50SZn) resulted in a significantly higher hectoliter weight by 1.4% than the 0SZn treatment. Foliar applications with Zn produced the best results, with ZnF + SeF resulting in the greatest improvement in 1000 grain weight and ZnF and ZnF + SeF demonstrating the most pronounced impact on vitreosity and protein content.
The combined ZnF + SeF, application, regardless of whether Zn was applied to the soil or not, produced the highest 1000 grains weights, with no significant differences among the other foliar treatments in the 50SZn treatment (Figure 4a). The hectoliter weight was observed to be higher in both years when Zn was not applied to the soil (Figure 4b). With regard to the fibers, the percentages of NDF, ADF, and ADL were lower in the second year, with lower values in ZnF in 2017/18 and in the control in 2018/19. However, these values remained within a similar range to those observed in the other foliar treatments studied (Figure 4d–f).

4. Discussion

4.1. Effect of Biofortification on Yield of Durum Wheat

This study presents critical insights into the factors driving inter-annual grain yield variability in durum wheat. Yield differences across the two growing seasons were primarily influenced by variations in total rainfall and its distribution during key vegetative and reproductive stages, a pattern consistent with previous findings under Mediterranean conditions [35].
In this sense, grain yield in 2017/18 (4.33 t ha−1) substantially exceeded that of 2018/19 (2.5 t ha−1) by 1.7-fold, likely due to more favorable growing conditions. The first season was characterized not only by higher total precipitation (477 mm vs. 295 mm) but also by better temporal distribution throughout critical phenological stages of the durum wheat cycle. The important precipitation events during March (175 mm) and April (80 mm) coinciding with the reproductive and grain-filling stages may have helped promote optimal yield formation. This yield difference aligns with the higher straw yield and with the higher thousand-grain weight and hectoliter weight in 2017/18, indicating better overall growing conditions and grain filling. In contrast, the 2018/19 season experienced more limited rainfall, with particularly reduced precipitation during spring. This situation may have led to a compensatory effect in grain quality parameters, resulting in significantly higher protein content (15.58% vs. 11.95%) and vitreosity (95.47% vs. 87.25%), a common inverse relationship with yield in durum wheat [36].
Soil Zn application (S50Zn) positively influenced both grain, along with higher hectoliter weight, and straw yields compared to the control (S0Zn), demonstrating the importance of Zn in cereal productivity [19]. Accordingly, foliar treatments that included Zn showed a progressive improvement in grain yield, with the combined Zn and Se treatment (ZnF + SeF) producing the highest yield (3.69 t ha−1). Meanwhile, the sole foliar application of Se did not significantly affect grain yield, which is consistent with the results of previous studies in bread wheat [37] or durum wheat [22], but it contrasts with other studies that reported an increase in bread wheat yield especially under conditions of water deficit [38], and, therefore, the effect of Se application must be related to the experiment conditions. However, the greater effect of the combined application of Zn and Se on yield aligns with findings from other studies [39], reaffirming the positive influence of their combination observed for Zn and Se uptake. In this sense, although yield differences were driven by environmental factors, notably rainfall, the effect of biofortification treatments on yield and nutrient content provides further insights into optimizing wheat performance across varied growing conditions. In this sense, despite differences in sowing dates and rainfall patterns between the two growing seasons, our results showed consistent trends in both yield response and micronutrient concentrations. This consistency across different environmental conditions suggests that foliar Se and Zn applications can be effective under varying rainfed conditions, which is particularly relevant for practical farming applications. The robust response to treatments, observed regardless of seasonal variations, supports the reliability of our findings and their applicability to real farming scenarios where planting dates often must be adjusted to rainfall patterns. Expanding this analysis to include economic feasibility, particularly under scenarios of prolonged biofortification, could further guide its practical adoption.

4.2. Effect of Biofortification on Zn and Se Concentrations in Durum Wheat

This study presents key findings on the effectiveness of biofortification strategies with Zn and Se in durum wheat. Conducted over two growing seasons, the results demonstrate a significant improvement in their accumulations. In particular, the consistent increase in Zn and Se concentrations observed with the combined ZnF + SeF treatment highlights the potential for an integrated approach targeting both elements, especially when considering the results without biofortification.
In the absence of biofortification, Zn concentrations averaged 15.1 mg kg−1 in straw and 31.6 mg kg−1 in grain, while Se concentrations were 31.7 µg kg−1 in straw and 19.2 µg Se kg−1 in grain. These concentrations fall below the recommended dietary intake for humans of 14 mg for Zn and 55 µg for Se [10,11]. Similarly, they are insufficient for livestock feed, which requires 35 mg Zn kg−1 and 0.1–0.5 mg Se kg−1 [40]. These deficiencies can be attributed to the low levels of Zn and Se in the soil, thereby underscoring the potential benefits of biofortification strategies in nutrient-poor soils.
The analysis of the year-to-year variability in Zn and Se accumulation suggests a dilution effect, particularly for Zn, associated with yield differences between years and emphasizes the importance of considering both concentration and total nutrient uptake (the product of mineral concentration and yield) when evaluating biofortification strategies. It is worth noting that environmental factors, particularly water availability, exert differential effects on the uptake and translocation of Zn and Se [41]. Therefore, the higher biomass production in the wetter 2017/18 season resulted in a greater total uptake of both Zn and Se, between 1.5- and 2-fold, despite lower grain Zn concentrations. This finding underscores the need for biofortification strategies that can retain efficacy across a range of environmental conditions, such as those prevalent in the Mediterranean climate [42].
A comparable pattern was observed in the initial application of 50 kg ZnSO4-7H2O ha−1, which did not significantly alter concentrations but markedly influenced the uptake of both Zn and Se in grain (an increase of 15% for both nutrients) and straw (an increase of 35% for Zn and of 20% for Se). The increase in soil Zn availability, achieved through the initial addition of Zn [37], likely provided a continuous source for root Zn uptake [19]. Additionally, it may have affected Se accumulation through changes in the amino acid profile as reported in a previous study [24].
However, the most pronounced effects on both Zn and Se accumulation were observed with foliar treatments. Notably, Se-only treatments resulted in enhanced Zn uptake, while Zn-only treatments led to increased Se uptake, albeit to a lesser extent than their respective single-nutrient applications. This mutual positive influence provides further evidence of a beneficial interaction between Zn and Se metabolism in durum wheat. The mechanisms behind this interaction may involve shared uptake pathways and enhanced translocation processes. For instance, the sulfate transporters may have been boosted by the application of ZnSO4-7H2O [43], potentially increasing the absorption of Se, since this element is absorbed by plants via sulfate permeases [15].
Moreover, it is essential to note that foliar application containing Se has always increased Se content, especially in grain and straw, to levels that meet the Se requirements of humans and animals, respectively. This outcome aligns with the results of previous studies indicating that the foliar application of selenate was effective in raising durum wheat Se content in grain [22].
The combined ZnF + SeF treatment proved to be particularly effective. This synergy could be explained by the complementary roles these micronutrients play in plant metabolism. While Zn is crucial for various enzymes and proteins, Se has the potential to confer physiological benefits, particularly in upregulating plant antioxidant activity under stress conditions [44]. The application of Se promotes reactive oxygen species (ROS) quenching and elevates the biosynthesis of superoxide dismutase (SOD), thus indirectly increasing Zn uptake in plants [45].
Our findings suggest that the combined application of these treatments may have improved overall plant health and nutrient uptake capacity. This outcome aligns with previous studies in bread wheat [46] and forage peas [23]. However, it contrasts with studies that found no impact of foliar Zn and Se application on Zn absorption in bread wheat [25]. These differences may be related to application conditions, the nutrient concentration and its chemical form, and crop-specific factors [46].
The year-specific patterns observed through the “year × foliar” effect in the accumulation of both nutrients emphasize the importance of environmental factors in biofortification outcomes. The more pronounced effects of treatments in 2017/18 compared to 2018/19 indicate that favorable environmental conditions may improve the efficacy of foliar applications. Factors such as temperature, rainfall, and solar radiation could influence leaf absorption, nutrient translocation, and overall plant nutrient and oxidative metabolism, thereby affecting the success of biofortification efforts. In this regard, the more consistent Se concentrations observed in the control and ZnF treatments across years, in comparison to the variable outcomes in Se-containing treatments, suggest that environmental conditions may exert a more pronounced influence on the efficacy of Se biofortification than on the baseline accumulation of Se [47]. Additionally, the combined ZnF + SeF treatment consistently outperformed other treatments in both Zn and Se accumulation in both years, especially in straw Zn and grain Se content.

4.3. Effect of Biofortification on Quality Traits in Durum Wheat

Biofortification, particularly the ZnF and ZnF + SeF treatments, also influenced important quality traits. Said treatments demonstrated notable effects on grain protein content and vitreosity, key factors for durum wheat’s nutritional and processing qualities [35]. Yield-protein trade-off in cereals is a well-documented phenomenon where increases in grain yield often correspond to decreases in grain protein content because nitrogen uptake does not increase proportionally, leading to a dilution effect on grain protein concentration and negatively impacting vitreosity [28,48]. However, the positive effect of the ZnF + SeF on both traits, together with the positive effect on yield, reinforces the crucial role that Zn plays in protein synthesis and grain quality in durum wheat [49]. This outcome also highlights the beneficial effect of these biofortification programs for the durum wheat industry, since higher protein content and vitreosity are associated with improved pasta-making quality, as they increase semolina yield and produce a more uniform particle size [28].
Thousand-grain weight shows marked differences between years and treatments. In 2017/18, all foliar treatments increased grain weight compared to the control, with SeF and ZnF + SeF treatments showing the highest values. This aligns with previous findings [50] that Se can enhance grain filling. In 2018/19, grain weights were generally lower, but the ZnF + SeF treatment still showed a significant increase over other treatments, suggesting a potential protective effect of combined Zn and Se application under less favorable conditions.
Interestingly, while soil Zn application increased both grain and straw yields, it did not significantly affect most quality parameters. This suggests that foliar application might be more effective in influencing grain quality, possibly due to more direct translocation of nutrients to the grain. Straw quality parameters (FND, FAD, LAD) generally showed higher values in 2017/18 compared to 2018/19, indicating potential differences in growing conditions or plant maturity at harvest between the two years.

4.4. Evolution of the Concentration of Zn in the Soil

The scope of this study aimed to assess the potential benefits of combined Zn and Se biofortification treatments on durum wheat in areas where soil deficiencies are prevalent. The study site, located in the southwest of Spain, exhibited deficient concentrations of available Se (1.27 µg Se kg−1) and Zn (0.303 mg Zn kg−1), as previously outlined [51].
Regarding the specific goal of assessing the evolution of Zn concentration in soil following biofortification treatments, the soil application of Zn increased the extractable soil Zn up to an average of 1.22 mg kg−1 during the two experimental years. Thus, the soil concentration remained consistently above the critical threshold of 0.5 mg kg−1 required to meet the crop needs, according to Sims and Johnson [52]. Therefore, it is confirmed that the applied dose is adequate to raise the bioavailable Zn above the minimum established in the literature. This increase in soil Zn availability is essential because of its critical role in various physiological functions, including enzyme activity and protein synthesis in plants [53]. Notably, the persistence of Zn levels for at least two seasons aligns with findings from previous studies [54] where an important Zn residual effect into the soil after a Zn sulfate fertilizer application was reported. However, further research is needed to understand the long-term dynamics of Zn levels, as no significant decrease is observed for at least two seasons, particularly considering the potential implications for future crop cycles and soil health.

5. Conclusions

This study underscores that biofortification with Zn and Se may be significant in improving the yield, Zn and Se accumulation, and quality traits of durum wheat under Mediterranean conditions. The application of Zn to soil improved both grain and straw yields, while the combined foliar application of Zn and Se proved to be the most effective strategy, yielding the highest grain weights and Zn and Se concentrations. Additionally, the improved grain quality parameters, particularly protein content and vitreosity, reinforce the essential role of Zn in supporting the nutritional and processing quality of durum wheat.
The observed inter-annual variability in grain yield underscores the critical influence of environmental factors, particularly rainfall, on crop productivity. While our study provides valuable insights, this limitation points towards important directions for future research. Future studies should consider longer-term trials to assess the sustainability and cumulative effects of these biofortification strategies over multiple growing seasons and multiple locations across different soil types and climatic zones. This would be crucial to validate and generalize our findings.

Supplementary Materials

The following supporting information can be downloaded at: https://www.mdpi.com/article/10.3390/agronomy15051038/s1, Figure S1. Monthly and annual rainfall and mean maximum and minimum temperatures in 2017/2018, 2018/2019 and in an average year from a 30-year period in the location of the study (Badajoz, Spain). Figure S2. Sketch of the experiment. Figure S3. Zn-DTPA concentration into topsoil of the study area as affected by the interaction “sampling time (5 times)∗Zn application (3 treatments: 0SZn, 50SZn + 0F and 50SZn + ZnF)”. Error bars indicate standard error (n = 3). Different letters mean significant differences between means according to the LSD test (p ≤ 0.05).

Author Contributions

Conceptualization, A.R.-M. and M.J.P.; Data curation, C.G.-L. and M.J.P.; Formal analysis, A.R.-M., M.D.R.-M. and M.J.P.; Funding acquisition, M.J.P.; Investigation, A.R.-M., M.D.R.-M. and M.J.P.; Methodology, A.R.-M., M.D.R.-M. and M.J.P.; Project administration, M.J.P.; Resources, M.J.P.; Software, C.G.-L.; Supervision, M.J.P.; Validation, C.G.-L., A.R.-M. and M.D.R.-M.; Visualization, C.G.-L.; Writing—original draft, C.G.-L. and M.J.P.; Writing—review and editing, C.G.-L., A.R.-M., M.D.R.-M. and M.J.P. All authors have read and agreed to the published version of the manuscript.

Funding

This research was funded by the Regional Government of Extremadura (Spain) and by the European Regional Development Fund (ERDF), grant number IB16093.

Data Availability Statement

The data supporting the findings of this study are available from the corresponding author if reasonable requests are made.

Acknowledgments

We would like to thank Teodoro García-White for his invaluable help with all the laboratory work.

Conflicts of Interest

The authors declare no conflicts of interest.

References

  1. Ruel-Bergeron, J.C.; Stevens, G.A.; Sugimoto, J.D.; Roos, F.F.; Ezzati, M.; Black, R.E.; Kraemer, K. Global update and trends of hidden hunger, 1995–2011: The hidden hunger Index. PLoS ONE 2015, 10, e0143497. [Google Scholar] [CrossRef] [PubMed]
  2. Younas, N.; Fatima, I.; Ahmad, I.A.; Ayyaz, M.K. Alleviation of zinc deficiency in plants and humans through an effective technique; biofortification: A detailed review. Acta Ecol. Sin. 2023, 43, 419–425. [Google Scholar] [CrossRef]
  3. Minich, W.B. Selenium Metabolism and Biosynthesis of Selenoproteins in the Human Body. Biochemistry 2022, 87, S168–S177. [Google Scholar] [CrossRef] [PubMed]
  4. Kabbaj, H.; Sall, A.T.; Al-Abdallat, A.; Geleta, M.; Amri, A.; Filali-Maltouf, A.; Belkadi, B.; Ortiz, R.; Bassi, F.M. Genetic Diversity within a Global Panel of Durum Wheat (Triticum durum) Landraces and Modern Germplasm Reveals the History of Alleles Exchange. Front. Plant Sci. 2017, 8, 1277. [Google Scholar] [CrossRef]
  5. Szerement, J.; Szatanik-Kloc, A.; Mokrzycki, J.; Mierzwa-Hersztek, M. Agronomic Biofortification with Se, Zn, and Fe: An Effective Strategy to Enhance Crop Nutritional Quality and Stress Defense—A Review. J. Soil Sci. Plant Nutr. 2022, 22, 1129–1159. [Google Scholar] [CrossRef]
  6. Suganya, A.; Saravanan, A.; Manivannan, N. Role of Zinc Nutrition for Increasing Zinc Availability, Uptake, Yield, and Quality of Maize (Zea mays L.) Grains: An Overview. Commun. Soil Sci. Plant Anal. 2020, 51, 2001–2021. [Google Scholar]
  7. Sobolev, O.I.; Gutyj, B.V.; Soboleva, S.V. Selenium in natural environment and food chains. A Review. Ukr. J. Ecol. 2020, 10, 148–158. [Google Scholar] [CrossRef]
  8. Gomez-Coronado, F.; Poblaciones, M.J.; Almeida, A.S.; Cakmak, I. Zinc (Zn) concentration of bread wheat grown under Mediterranean conditions as affected by genotype and soil/foliar Zn application. Plant Soil 2016, 401, 331–346. [Google Scholar] [CrossRef]
  9. Poblaciones, M.J.; Rodrigo, S.; Santamaria, O.; Chen, Y.; McGrath, S.P. Selenium accumulation and speciation in biofortified chickpea (Cicer arietinum L.) under Mediterranean conditions. J. Sci. Food Agric. 2014, 94, 1101–1106. [Google Scholar] [CrossRef]
  10. WHO. Keep Fit for Life: Meeting the Nutritional Needs of Older Persons; World Health Organization: Geneva, Switzerland, 2002.
  11. Kipp, A.P.; Strohm, D.; Brigelius-Flohé, R.; Schomburg, L.; Bechthold, A.; Leschik-Bonnet, E.; Heseker, H. Revised reference values for selenium intake. J. Trace Elem. Med. Biol. 2015, 32, 195–199. [Google Scholar] [CrossRef]
  12. Alloway, B.J. Soil factors associated with zinc deficiency in crops and humans. Environ. Geochem. Health 2009, 31, 537–548. [Google Scholar] [CrossRef] [PubMed]
  13. Winkel, L.H.E.; Vriens, B.; Jones, G.D.; Schneider, L.S.; Pilon-Smits, E.; Bañuelos, G.S. Selenium cycling across soil-plant-atmosphere interfaces: A critical review. Nutrients 2015, 7, 4199–4239. [Google Scholar] [CrossRef]
  14. Gupta, N.; Ram, H.; Kumar, B. Mechanism of Zinc absorption in plants: Uptake, transport, translocation and accumulation. Rev. Environ. Sci. Bio/Technol. 2016, 15, 89–109. [Google Scholar] [CrossRef]
  15. Schiavon, M.; Pilon-Smits, E.A.H. The fascinating facets of plant selenium accumulation—Biochemistry, physiology, evolution and ecology. New Phytol. 2017, 213, 1582–1596. [Google Scholar] [CrossRef] [PubMed]
  16. Naeem, A.; Aslam, M.; Ahmad, M.; Asif, M.; Yazici, M.A.; Cakmak, I.; Rashid, A. Biofortification of Diverse Basmati Rice Cultivars with Iodine, Selenium, and Zinc by Individual and Cocktail Spray of Micronutrients. Agronomy 2022, 12, 49. [Google Scholar] [CrossRef]
  17. Consentino, B.B.; Ciriello, M.; Sabatino, L.; Vultaggio, L.; Baldassano, S.; Vasto, S.; Rouphael, Y.; La Bella, S.; De Pascale, S. Current Acquaintance on Agronomic Biofortification to Modulate the Yield and Functional Value of Vegetable Crops: A Review. Horticulturae 2023, 9, 219. [Google Scholar] [CrossRef]
  18. Duborská, E.; Šebesta, M.; Matulová, M.; Zvěřina, O.; Urík, M. Current Strategies for Selenium and Iodine Biofortification in Crop Plants. Nutrients 2022, 14, 4717. [Google Scholar] [CrossRef]
  19. Cakmak, I.; Kutman, U.B. Agronomic biofortification of cereals with zinc: A review. Eur. J. Soil Sci. 2018, 69, 172–180. [Google Scholar] [CrossRef]
  20. Rodrigo, S.; Santamaria, O.; Poblaciones, M.J. Selenium Application Timing: Influence in Wheat Grain and Flour Selenium Accumulation Under Mediterranean Conditions. J. Agric. Sci. 2014, 6, 23. [Google Scholar] [CrossRef]
  21. Reynolds-Marzal, D.; Rivera-Martin, A.; Santamaria, O.; Poblaciones, M.J. Combined selenium and zinc biofortification of bread-making wheat under mediterranean conditions. Plants 2021, 10, 1209. [Google Scholar] [CrossRef]
  22. De Vita, P.; Platani, C.; Fragasso, M.; Ficco, D.B.M.; Colecchia, S.A.; Del Nobile, M.A.; Padalino, L.; Di Gennaro, S.; Petrozza, A. Selenium-enriched durum wheat improves the nutritional profile of pasta without altering its organoleptic properties. Food Chem. 2017, 214, 374–382. [Google Scholar] [CrossRef]
  23. Reynolds-Marzal, D.; Rivera-Martin, A.; Rodrigo, S.M.; Santamaria, O.; Poblaciones, M.J. Biofortification of Forage Peas with Combined Application of Selenium and Zinc Under Mediterranean Conditions. J. Soil Sci. Plant Nutr. 2021, 21, 286–300. [Google Scholar] [CrossRef]
  24. Ning, P.; Fei, P.; Wu, T.; Li, Y.Y.; Qu, C.; Li, Y.Y.; Shi, J.; Tian, X. Combined foliar application of zinc sulphate and selenite affects the magnitude of selenium biofortification in wheat (Triticum aestivum L.). Food Energy Secur. 2022, 11, e342. [Google Scholar] [CrossRef]
  25. Germ, M.; Pongrac, P.; Regvar, M.; Vogel-Mikus, K.; Stibilj, V.; Jacimovic, R.; Kreft, I.; Vogel-Mikuš, K.; Stibilj, V.; Jaćimović, R.; et al. Impact of double Zn and Se biofortification of wheat plants on the element concentrations in the grain. Plant Soil Environ. 2013, 59, 316–321. [Google Scholar] [CrossRef]
  26. Drissi, S.; Houssa, A.A.; Bamouh, A.; Coquant, J.-M.; Benbella, M. Effect of Zinc-Phosphorus Interaction on Corn Silage Grown on Sandy Soil. Agriculture 2015, 5, 1047–1059. [Google Scholar] [CrossRef]
  27. Requena-Ramírez, M.D.; Rodríguez-Suárez, C.; Ávila, C.M.; Palomino, C.; Hornero-Méndez, D.; Atienza, S.G. Bread Wheat Biofortification for Grain Carotenoid Content by Inter-Specific Breeding. Foods 2023, 12, 1365. [Google Scholar] [CrossRef] [PubMed]
  28. Sieber, A.-N.; Würschum, T.; Longin, C.F.H. Vitreosity, its stability and relationship to protein content in durum wheat. J. Cereal Sci. 2015, 61, 71–77. [Google Scholar] [CrossRef]
  29. IUSS Working Group WRB. World Reference Base for Soil Resources. International Soil Classification System for Naming Soils and Creating Legends for Soil Maps, 4th ed.; IUSS Working Group WRB: Vienna, Austria, 2022. [Google Scholar]
  30. Walkley, A.; Black, I.A. An examination of the Degthareff method for determining soil organica matter, and proposed modification of the chromic acid titration method. Soil Sci. 1934, 37, 29–38. [Google Scholar] [CrossRef]
  31. Poblaciones, M.J.; Santamaría, O.; García-White, T.; Rodrigo, S.M. Selenium biofortification in bread-making wheat under Mediterranean conditions: Influence on grain yield and quality parameters. Crop Pasture Sci. 2014, 65, 362–369. [Google Scholar] [CrossRef]
  32. Zadoks, J.C.; Chang, T.T.; Konzak, C.F. A decimal code for the growth stages of cereals. Weed Res. 1974, 14, 415–421. [Google Scholar] [CrossRef]
  33. AOAC. Official Methods of Analysis; Association of Official Analytical Chemists: Washington, DC, USA, 2006. [Google Scholar]
  34. Adams, M.L.; Lombi, E.; Zhao, F.J.; McGrath, S.P. Evidence of low selenium concentrations in UK bread-making wheat grain. J. Sci. Food Agric. 2002, 82, 1160–1165. [Google Scholar] [CrossRef]
  35. Radawiec, A.; Szulc, W.; Rutkowska, B. Selenium biofortification of wheat as a strategy to improve human nutrition. Agriculture 2021, 11, 144. [Google Scholar] [CrossRef]
  36. Sims, J.T.; Johnson, G.V. Micronutrient Soil Tests. In Micronutrients in Agriculture; SSSA Book Series; SSSA: Madison, WI, USA, 1991; pp. 427–476. ISBN 9780891188780. [Google Scholar]
  37. Dwivedi, R.; Srivastva, P.C. Effect of zinc sulphate application and the cyclic incorporation of cereal straw on yields, the tissue concentration and uptake of Zn by crops and availability of Zn in soil under rice–wheat rotation. Int. J. Recycl. Org. Waste Agric. 2014, 3, 53. [Google Scholar] [CrossRef]
  38. Shaver, T.M.; Westfall, D.G.; Ronaghi, M. Zinc Fertilizer Solubility and Its Effects on Zinc Bioailability Over Time. J. Plant Nutr. 2007, 30, 123–133. [Google Scholar] [CrossRef]
  39. Djouadi, K.; Mekliche, A.; Dahmani, S.; Ladjiar, N.I.; Abid, Y.; Silarbi, Z.; Hamadache, A.; Pisante, M. Durum Wheat Yield and Grain Quality in Early Transition from Conventional to Conservation Tillage in Semi-Arid Mediterranean Conditions. Agriculture 2021, 11, 711. [Google Scholar] [CrossRef]
  40. De Santis, M.A.; Soccio, M.; Laus, M.N.; Flagella, Z. Influence of Drought and Salt Stress on Durum Wheat Grain Quality and Composition: A Review. Plants 2021, 10, 2599. [Google Scholar] [CrossRef]
  41. Wang, M.M.; Ali, F.; Wang, M.M.; Dinh, Q.T.; Zhou, F.; Bañuelos, G.S.; Liang, D. Understanding boosting selenium accumulation in Wheat (Triticum aestivum L.) following foliar selenium application at different stages, forms, and doses. Environ. Sci. Pollut. Res. 2020, 27, 717–728. [Google Scholar] [CrossRef]
  42. Nawaz, F.; Ashraf, M.Y.; Ahmad, R.; Waraich, E.A.; Shabbir, R.N.; Bukhari, M.A. Supplemental selenium improves wheat grain yield and quality through alterations in biochemical processes under normal and water deficit conditions. Food Chem. 2015, 175, 350–357. [Google Scholar] [CrossRef]
  43. Poblaciones, M.J.; Rengel, Z. Combined foliar selenium and zinc biofortification in field pea (Pisum sativum): Accumulation and bioavailability in raw and cooked grains. Crop Pasture Sci. 2017, 68, 265–271. [Google Scholar] [CrossRef]
  44. Suttle, N. Mineral Nutrition of Livestock, 5th ed.; CABI: Cambridge, UK, 2022. [Google Scholar]
  45. D’Oria, A.; Courbet, G.; Billiot, B.; Jing, L.; Pluchon, S.; Arkoun, M.; Maillard, A.; Roux, C.P.-L.; Trouverie, J.; Etienne, P.; et al. Drought specifically downregulates mineral nutrition: Plant ionomic content and associated gene expression. Plant Direct 2022, 6, e402. [Google Scholar] [CrossRef]
  46. Rezzouk, F.Z.; de Lima, V.J.; Diez-Fraile, M.C.; Aparicio, N.; Serret, M.D.; Araus, J.L. Assessing performance of European elite bread wheat cultivars under Mediterranean conditions: Breeding implications. Field Crops Res. 2023, 302, 109089. [Google Scholar] [CrossRef]
  47. Na, G.; Salt, D.E. The role of sulfur assimilation and sulfur-containing compounds in trace element homeostasis in plants. Environ. Exp. Bot. 2011, 72, 18–25. [Google Scholar] [CrossRef]
  48. Galić, L.; Vinković, T.; Ravnjak, B.; Lončarić, Z. Agronomic biofortification of significant cereal crops with selenium—A review. Agronomy 2021, 11, 1015. [Google Scholar] [CrossRef]
  49. Gui, J.Y.; Rao, S.; Huang, X.; Liu, X.; Cheng, S.; Xu, F. Interaction between selenium and essential micronutrient elements in plants: A systematic review. Sci. Total Environ. 2022, 853, 158673. [Google Scholar] [CrossRef]
  50. Kong, L.; Tao, Y.; Xu, Y.; Zhou, X.; Fu, G.; Zhao, L.; Wang, Q.; Li, H.; Wan, Y. Simultaneous Biofortification: Interaction between Zinc and Selenium Regarding Their Accumulation in Wheat. Agronomy 2024, 14, 1513. [Google Scholar] [CrossRef]
  51. Carucci, F.; Moreno-Martín, G.; Madrid-Albarrán, Y.; Gatta, G.; De Vita, P.; Giuliani, M.M. Selenium Agronomic Biofortification of Durum Wheat Fertilized with Organic Products: Se Content and Speciation in Grain. Agronomy 2022, 12, 2492. [Google Scholar] [CrossRef]
  52. Fradgley, N.S.; Gardner, K.; Kerton, M.; Swarbreck, S.M.; Bentley, A.R. Trade-offs in the genetic control of functional and nutritional quality traits in UK winter wheat. Heredity 2022, 128, 420–433. [Google Scholar] [CrossRef]
  53. Kutman, U.B.; Yildiz, B.; Cakmak, I. Improved nitrogen status enhances zinc and iron concentrations both in the whole grain and the endosperm fraction of wheat. J. Cereal Sci. 2011, 53, 118–125. [Google Scholar] [CrossRef]
  54. Feng, R.; Wei, C.; Tu, S. The roles of selenium in protecting plants against abiotic stresses. Environ. Exp. Bot. 2013, 87, 58–68. [Google Scholar] [CrossRef]
Figure 1. Effect of the main factors: “year (Y)”, “soil Zn application (S)”, and “foliar application (F)” on both straw and grain yields. Bars indicate means (n = 4) and error bars, the standard error. Within each factor, different letters mean (lowercases for straw and uppercases for grain) significant differences between means according to the LSD test (p ≤ 0.05).
Agronomy 15 01038 g001
Figure 2. Zn concentration (a) and Zn uptake (b) in straw and grain as affected by the main effects ‘year (Y)’, ‘soil Zn application (S)’, ‘foliar application (F)’, and by the interaction ‘Y × F’. Bars indicate means (n = 4) and error bars, the standard error. Within each factor and plant part, different letters (lowercase for straw and uppercase for grain) mean significant differences between means according to the LSD test (p ≤ 0.05).
Agronomy 15 01038 g002
Figure 3. Concentration of Se (a) and total Se content (b) in the straw and grain as affected by the main effects ‘year (Y)’, ‘soil Zn application (S)’, ‘foliar application (F)’, as well as the effect of the interaction ‘Y × F’ in the grain. Bars indicate means (n = 4) and error bars, the standard error. Within each factor and plant part, different letters (lowercase for straw and uppercase for grain) mean significant differences between means according to the LSD test (p ≤ 0.05).
Agronomy 15 01038 g003
Figure 4. Effect of the interaction “year × foliar (Y × F)” on the (a) 1000 grains weight and (c) protein content of the grain, and for the percentage of (d) neutral detergent fiber (NDF), (e) acid detergent fiber (ADF) and (f) lignin detergent fiber (ADL) in the straw, and (b) the effect of the interaction “year × soil (Y × S)” on the hectoliter weight of the grain. Bars indicate means (n = 4), error bars, and the standard error. Within each factor and plant part, different letters mean significant differences between means according to the LSD test (p ≤ 0.05).
Agronomy 15 01038 g004
Table 1. Summary of the split-split-plot analysis of variance (ANOVAs) showing the influence of the year, the soil application of Zn, the foliar application, and their interactions on each parameter evaluated in straw and grain (n = 4).
ParameterPartYear (Y)Zn Soil (S)Foliar (F)Y × SY × FS × FY × S × F
df1131333
YieldStraw812.28 ***35.41 ***1.690.020.620.152.06
Grain1839.09 ***82.28 ***9.12 ***0.390.361.021.78
ZnStraw8.489.34 *1.57.05 ***0.9115.14 ***0.511.48
Grain35.17 **0.01190.27 ***2.941.272.281.53
SeStraw61.33 **0.4759.10 ***1.431.760.240.44
Grain68.4 **0.14234.58 ***1.246.66 **0.71.14
Zn uptakeStraw21.74 **17.94 *160.53 ***0.375.7 **1.240.39
Grain276.08 ***18.17 **71.18 ***4.454.53 *0.431.42
Se uptakeStraw90.21 **8.84 *65.77 ***2.871.770.720.54
Grain331.35 ***8.23 *245.48 ***2.539.86 ***0.520.93
1000 gwGrain695.93 ***0.076.04 **16.09 **3.10 *3.40 *0.95
Hect. W.Grain253.82 ***13.07 *1.385.98 *0.832.741.52
ProteinGrain441.72 ***1.976.79 ***0.252.392.92 *0.39
VitreosityGrain77.57 **1.373.01 *1.130.442.040.77
NDFStraw518.85 ***0.010.10.715.26 **2.360.5
AFDStraw1625.65 ***0.010.340.124.32 *1.870.59
ADLStraw17.73 *3.060.452.742.92 *0.480.23
AshStraw28.011.111.770.122.120.731.26
For each parameter, df (degree of freedom) and the F-value, including the level of significance (* p ≤ 0.05, ** p ≤ 0.01, *** p ≤ 0.001) are shown.
Table 2. Effect of “year (Y)”, “soil Zn application (S)” and “foliar application (F)” on the main quality parameters of grain and straw. Values are expressed as mean ± standard error (n = 4).
1000 gw (g)Hect. Weight
(kg hL−1)
Protein (%)Vitreosity (%)
Year2017/201846.99 ± 0.32 a81.43 ± 0.19 a11.95 ± 0.08 b87.25 ± 0.73 b
2018/201936.91 ± 0.50 b78.21 ± 0.52 b15.58 ± 0.15 a95.47 ± 0.60 a
SoilS0Zn41.88 ± 0.88 A79.23 ± 0.48 B13.64 ± 0.35 A92.03 ± 0.89 A
S50Zn42.01 ± 1.11 A80.41 ± 0.47 A13.89 ± 0.34 A90.69 ± 1.08 A
Foliar0 F40.83 ± 1.39 β79.30 ± 0.99 α13.41 ± 0.45 β89.81 ± 1.47 β
SeF41.61 ± 1.63 β79.76 ± 0.62 α13.57 ± 0.45 β90.44 ± 1.53 β
ZnF41.90 ± 1.38 β79.51 ± 0.54 α13.97 ± 0.50 α92.13 ± 1.24 α β
ZnF + SeF43.46 ± 1.22 α80.72 ± 0.45 α14.11 ± 0.55 α93.06 ± 1.30 α
Within each parameter and factor, different letters (lowercase for year, uppercase for soil treatment, and Greek letters for foliar treatment) mean significant differences between means according to the LSD test (p ≤ 0.05).
Disclaimer/Publisher’s Note: The statements, opinions and data contained in all publications are solely those of the individual author(s) and contributor(s) and not of MDPI and/or the editor(s). MDPI and/or the editor(s) disclaim responsibility for any injury to people or property resulting from any ideas, methods, instructions or products referred to in the content.

