

QTLs Mapping and Identification of Candidate Genes Associated with Stachyose and Sucrose in Soybean (Glycine max L.)

 ,
,
Abstract
1. Introduction
2. Materials and Methods
2.1. Plant Materials
2.2. Evaluation of the Content of Soluble Sugar Composition
2.3. Whole-Genome Re-Sequencing Analysis
2.4. High-Density Genetic Linkage Map Construction
2.5. QTL Mapping Analysis
2.6. Candidate Gene Mining and Sequence Alignment
2.7. Real-Time Quantitative PCR Analyses of Candidate Genes
2.8. Statistics and Analysis
3. Results
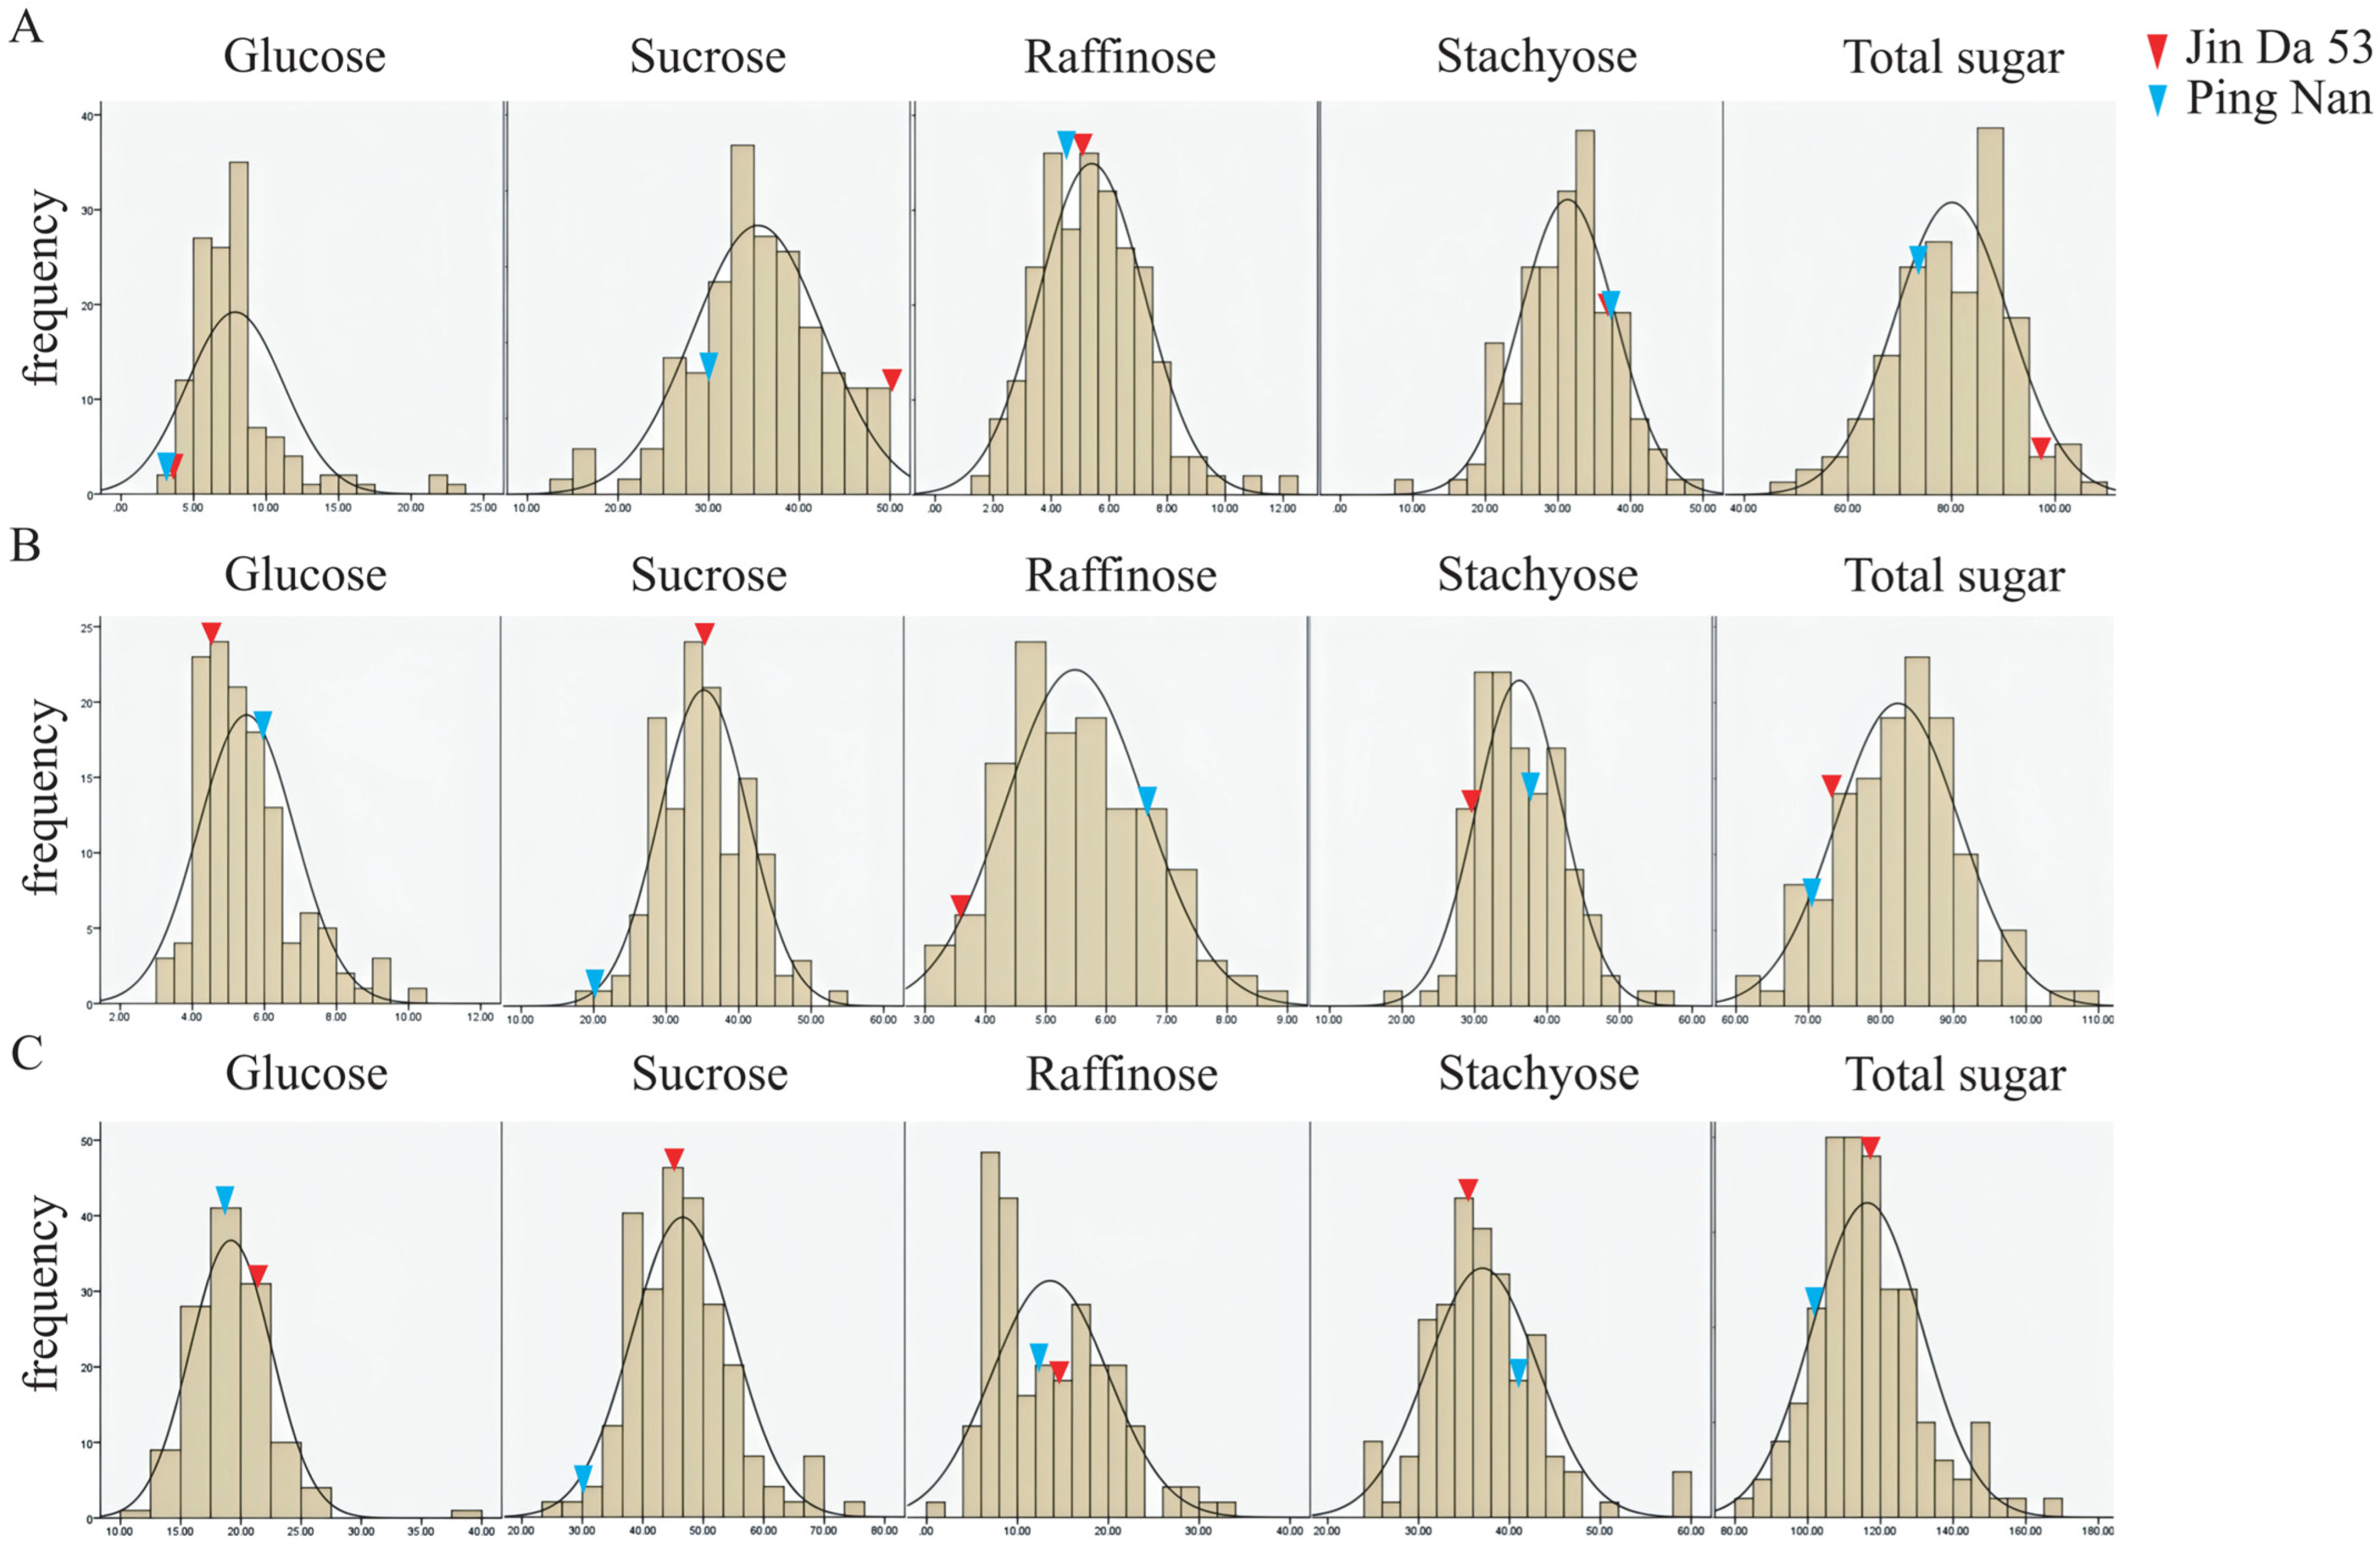
3.1. Phenotyping of Soluble Sugar Composition in Parents and RIL Individuals
3.1.1. Heredity Analysis of Soluble Sugar Traits in Soybean Seeds in Main Gene + Multigene Mixed Model
3.1.2. Genetic Model Fitness Test for Various Soluble Sugar Traits in Soybean Seeds
3.1.3. Estimation of Genetic Parameters for Soluble Sugar Traits in Soybean Seeds
3.2. SLAF-Seq Library Construction
3.3. Construction of the High-Density Genetic Map
3.4. QTL Analysis of Soluble Sugar Composition in Soybean
3.5. Screening of Candidate QTLs for Soluble Sugars and Their Components in Soybean Seed
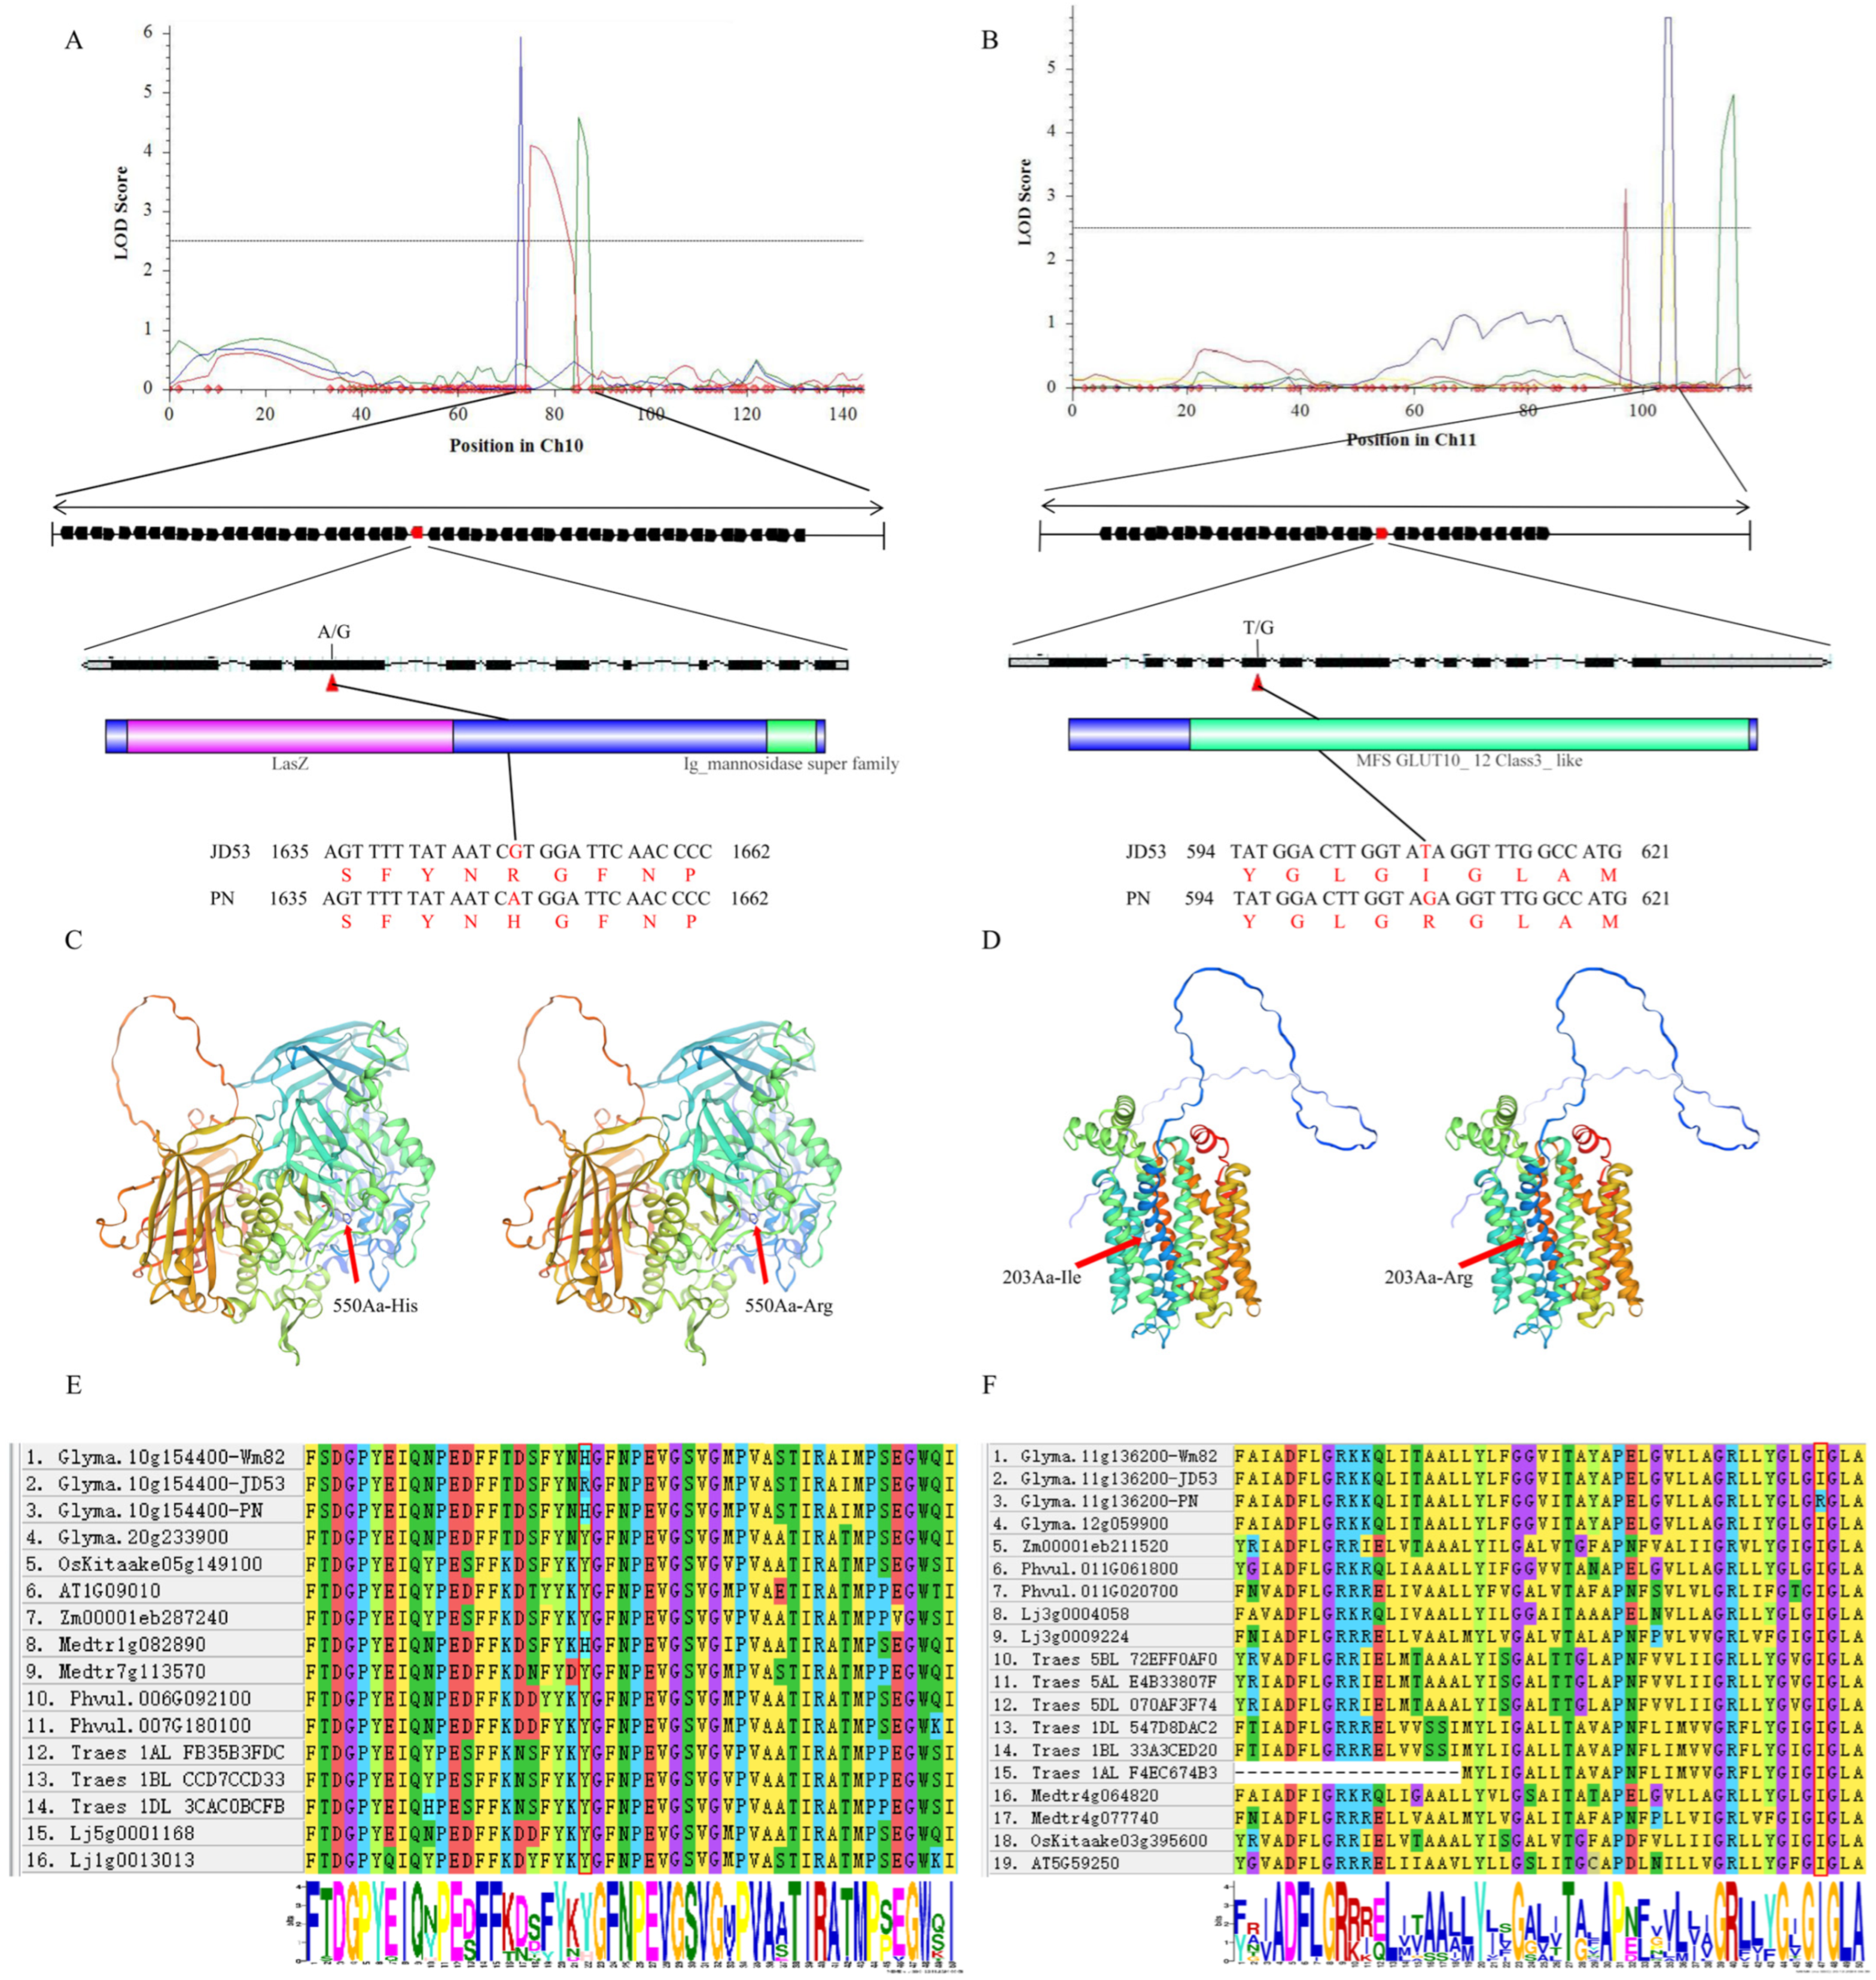
3.6. Characterization of Candidate Genes Associated with the Soluble Sugar Component QTLs in Soybean
4. Discussion
5. Conclusions
Supplementary Materials
Author Contributions
Funding
Data Availability Statement
Conflicts of Interest
References
- Ailin, L.; Sau-Shan, C.; Wai-Shing, Y.; Man-Wah, L.; Hon-Ming, L. Chapter Nine—Genetic regulations of the oil and protein contents in soybean seeds and strategies for improvement. Adv. Bot. Res. 2022, 102, 259–293. [Google Scholar]
- Maughan, P.J.; Maroof, M.A.S.; Buss, G.R. Identification of quantitative trait loci controlling sucrose content in soybean (Glycine max). Mol. Breed. 2000, 6, 105–111. [Google Scholar] [CrossRef]
- Karr-Lilienthal, L.K.; Kadzere, C.T.; Grieshop, C.M.; Fahey, G.C., Jr. Chemical and nutritional properties of soybean carbohydrates as related to nonruminants: A review. Livest. Prod. Sci. 2005, 97, 1–12. [Google Scholar] [CrossRef]
- Espinosa-Martos, I.; Rupérez, P. Soybean oligosaccharides. Potential as new ingredients in functional food. Nutr. Hosp. 2006, 21, 92–96. [Google Scholar]
- Keshun, L. Soybeans: Chemistry, Technology and Utilization; Springer: Berlin, Germany, 1997. [Google Scholar]
- Choct, M.; Dersjant-Li, Y.; McLeish, J.; Peisker, M. Soy Oligosaccharides and Soluble Non-starch Polysaccharides: A Review of Digestion, Nutritive and Anti-nutritive Effects in Pigs and Poultry. Asian Australas. J. Anim. Sci. 2010, 23, 1386–1398. [Google Scholar] [CrossRef]
- García, C.R.; Piernas, C.; Martínez-Rodríguez, A.; Hernández-Morante, J.J. Effect of glucose and sucrose on cognition in healthy humans: A systematic review and meta-analysis of interventional studies. Nutr. Rev. 2021, 79, 171–187. [Google Scholar] [CrossRef]
- Zeng, Z.; Zhang, Y.; He, J.; Yu, J.; Mao, X.; Zheng, P.; Luo, Y.; Luo, J.; Huang, Z.; Yu, B.; et al. Effects of soybean raffinose on growth performance, digestibility, humoral immunity and intestinal morphology of growing pigs. Anim. Nutr. 2021, 7, 393–399. [Google Scholar] [CrossRef]
- Ta, X.; Wang, B.; Bai, J.; Yu, J.; Chen, H.; Wang, C. The source, extraction, purification, physiological function, and application of stachyose in the food industry. Food Chem. 2024, 461, 140791. [Google Scholar] [CrossRef]
- Hartwig, E.E.; Kuo, T.M.; Kenty, M.M. Seed Protein and its Relationship to Soluble Sugars in Soybean. Crop Sci. 1997, 37, 770–773. [Google Scholar] [CrossRef]
- Lee, H.; Jo, E.; Song, J.; Min, J.; Song, Y.; Lee, H.; Choe, Y.; Cha, J.; Lee, H. Correlation between monosaccharide, oligosaccharide, and microbial community profile changes in traditional soybean brick (meju) fermentation. Food Res. Int. 2024, 184, 114233. [Google Scholar] [CrossRef]
- Gao, L.; Zhu, Q.; Li, H.; Wang, S.; Fan, J.; Wang, T.; Yang, L.; Zhao, Y.; Ma, Y.; Chen, L.; et al. Construction of a genetic linkage map and QTL mapping of the agronomic traits in Foxtail millet (Setaria italica). BMC Genom. 2025, 26, 152. [Google Scholar] [CrossRef] [PubMed]
- Shi, J.; Wang, Y.; Wang, C.; Wang, L.; Zeng, W.; Han, G.; Qiu, C.; Wang, T.; Tao, Z.; Wang, K.; et al. Linkage mapping combined with GWAS revealed the genetic structural relationship and candidate genes of maize flowering time-related traits. BMC Plant Biol. 2022, 22, 328. [Google Scholar] [CrossRef] [PubMed]
- Chen, B.; Li, Y.; Tian, M.; Su, H.; Sun, W.; Li, Y. Linkage mapping and QTL analysis of growth traits in Rhopilema esculentum. Sci. Rep. 2022, 12, 471. [Google Scholar] [CrossRef] [PubMed]
- Aguilar-Benitez, D.; Casimiro-Soriguer, I.; Maalouf, F.; Torres, A.M. Linkage mapping and QTL analysis of flowering time in faba bean. Sci. Rep. 2021, 11, 13716. [Google Scholar] [CrossRef]
- Guo, S.; Han, F.; Liu, M.; Han, H.; Dong, K.; Yang, J.; Zhang, L.; Gao, X.; Feng, B.; Yang, P. A genome-wide association study reveals the genetic architecture of 19 agronomic traits in broomcorn millet (Panicum miliaceum L.). Theor. Appl. Genet. 2025, 138, 89. [Google Scholar] [CrossRef]
- Tang, R.; Zhuang, Z.; Bian, J.; Ren, Z.; Ta, W.; Peng, Y. GWAS and Meta-QTL Analysis of Kernel Quality-Related Traits in Maize. Plants 2024, 13, 2730. [Google Scholar] [CrossRef]
- Sallam, A.; Eltaher, S.; Alqudah, A.M.; Belamkar, V.; Baenziger, P.S. Combined GWAS and QTL mapping revealed candidate genes and SNP network controlling recovery and tolerance traits associated with drought tolerance in seedling winter wheat. Genomics 2022, 114, 110358. [Google Scholar] [CrossRef]
- Izquierdo, P.; Kelly, J.D.; Beebe, S.E.; Cichy, K. Combination of meta-analysis of QTL and GWAS to uncover the genetic architecture of seed yield and seed yield components in common bean. Plant Genome 2023, 16, e20328. [Google Scholar] [CrossRef]
- Jia, D.; Shen, F.; Wang, Y.; Wu, T.; Xu, X.; Zhang, X.; Han, Z. Apple fruit acidity is genetically diversified by natural variations in three hierarchical epistatic genes: MdSAUR37, MdPP2CH and MdALMTII. Plant J. 2018, 95, 427–443. [Google Scholar] [CrossRef]
- Shen, S.; Xu, S.; Wang, M.; Ma, T.; Chen, N.; Wang, J.; Zheng, H.; Yang, L.; Zou, D.; Xin, W.; et al. BSA-Seq for the Identification of Major Genes for EPN in Rice. Int. J. Mol. Sci. 2023, 24, 14838. [Google Scholar] [CrossRef]
- Guo, J.; Qi, F.; Qin, L.; Zhang, M.; Sun, Z.; Li, H.; Cui, M.; Zhang, M.; Li, C.; Li, X.; et al. Mapping of a QTL associated with sucrose content in peanut kernels using BSA-seq. Front. Genet. 2023, 13, 1089389. [Google Scholar] [CrossRef] [PubMed]
- Xu, W.; Liu, H.; Li, S.; Zhang, W.; Wang, Q.; Zhang, H.; Liu, X.; Cui, X.; Chen, X.; Tang, W.; et al. GWAS and Identification of Candidate Genes Associated with Seed Soluble Sugar Content in Vegetable Soybean. Agronomy 2022, 12, 1470. [Google Scholar] [CrossRef]
- Lu, W.; Sui, M.; Zhao, X.; Jia, H.; Han, D.; Yan, X.; Han, Y. Genome-Wide Identification of Candidate Genes Underlying Soluble Sugar Content in Vegetable Soybean (Glycine max L.) via Association and Expression Analysis. Front. Plant Sci. 2022, 13, 930639. [Google Scholar] [CrossRef] [PubMed]
- Wright, B.; Farquharson, K.A.; McLennan, E.A.; Belov, K.; Hogg, C.J.; Grueber, C.E. From reference genomes to population genomics: Comparing three reference-aligned reduced-representation sequencing pipelines in two wildlife species. BMC Genom. 2019, 20, 453. [Google Scholar] [CrossRef]
- Zhang, S.; Hu, X.; Miao, H.; Chu, Y.; Cui, F.; Yang, W.; Wang, C.; She, Y.; Xu, T.; Zhao, L.; et al. QTL identification for seed weight and size based on a high-density SLAF-seq genetic map in peanut (Arachis hypogaea L.). BMC Plant Biol. 2019, 19, 537. [Google Scholar] [CrossRef]
- Zeng, J.; Li, M.; Qiu, H.; Xu, Y.; Feng, B.; Kou, F.; Xu, X.; Razzaq, M.K.; Gai, J.; Wang, Y.; et al. Identification of QTLs and joint QTL segments of leaflet traits at different canopy layers in an interspecific RIL population of soybean. Theor. Appl. Genet. 2022, 135, 4261–4275. [Google Scholar] [CrossRef]
- Yao, Y.; You, Q.; Duan, G.; Ren, J.; Chu, S.; Zhao, J.; Li, X.; Zhou, X.; Jiao, Y. Quantitative trait loci analysis of seed oil content and composition of wild and cultivated soybean. BMC Plant Biol. 2020, 20, 51. [Google Scholar] [CrossRef]
- Hu, L.; Wang, X.; Zhang, J.; Florez-Palacios, L.; Song, Q.; Jiang, G.L. Genome-Wide Detection of Quantitative Trait Loci and Prediction of Candidate Genes for Seed Sugar Composition in Early Mature Soybean. Int. J. Mol. Sci. 2023, 24, 3167. [Google Scholar] [CrossRef]
- Stombaugh, S.K.; Orf, J.H.; Jung, H.G.; Chase, K.; Lark, G.; Somers, D.A. Quantitative Trait Loci Associated with Cell Wall Polysaccharides in Soybean Seed. Crop Sci. 2004, 44, 2101–2106. [Google Scholar] [CrossRef]
- Wang, Y.; Chen, P.; Zhang, B. Quantitative trait loci analysis of soluble sugar contents in soybean. Plant Breed. 2014, 133, 493–498. [Google Scholar] [CrossRef]
- Akond, M.; Liu, S.; Kantartzi, S.K.; Maksem, K.; Bellaloui, N.; Lightfoot, D.A.; Kassem, M.A. Quantitative Trait Loci Underlying Seed Sugars Content in “MD96-5722” by “Spencer” Recombinant Inbred Line Population of Soybean. Food Sci. Nutr. 2015, 6, 964–973. [Google Scholar] [CrossRef]
- Murray, M.G.; Thompson, W.F. Rapid isolation of high molecular weight plant DNA. Nucleic Acids Res. 1980, 8, 4321–4325. [Google Scholar] [CrossRef] [PubMed]
- Sun, X.; Liu, D.; Zhang, X.; Li, W.; Liu, H.; Hong, W.; Jiang, C.; Guan, N.; Ma, C.; Zeng, H.; et al. SLAF-seq: An Efficient Method of Large-Scale De Novo SNP Discovery and Genotyping Using High-Throughput Sequencing. PLoS ONE 2013, 8, e58700. [Google Scholar] [CrossRef] [PubMed]
- Liu, D.; Ma, C.; Hong, W.; Huang, L.; Liu, M.; Liu, H.; Zeng, H.; Deng, D.; Xin, H.; Song, J.; et al. Construction and Analysis of High-Density Linkage Map Using High-Throughput Sequencing Data. PLoS ONE 2014, 9, e98855. [Google Scholar] [CrossRef]
- Ren, H.; Han, J.; Wang, X.; Zhang, B.; Yu, L.; Gao, H.; Hong, H.; Sun, R.; Tian, Y.; Qi, X.; et al. QTL mapping of drought tolerance traits in soybean with SLAF sequencing. Crop J. 2020, 8, 977–989. [Google Scholar] [CrossRef]
- Mackay, I.; Cockram, J.; Howell, P.; Powell, W. Understanding the classics: The unifying concepts of transgressive segregation, inbreeding depression and heterosis and their central relevance for crop breeding. Plant Biotechnol. J. 2021, 19, 26–34. [Google Scholar] [CrossRef]
- Ayalew, H.; Peiris, S.; Chiluwal, A.; Kumar, R.; Tiwari, M.; Ostmeyer, T.; Bean, S.; Jagadish, S.V.K. Stable sorghum grain quality QTL were identified using SC35 × RTx430 mapping population. Plant Genome 2022, 15, e20227. [Google Scholar] [CrossRef]
- Zhang, S.-Z.; Hu, X.-H.; Wang, F.-F.; Chu, Y.; Yang, W.-Q.; Xu, S.; Wang, S.; Wu, L.-R.; Yu, H.-L.; Miao, H.-R.; et al. A stable and major QTL region on chromosome 2 conditions pod shape in cultivated peanut (Arachis hyopgaea L.). J. Integr. Agric. 2023, 22, 2323–2334. [Google Scholar] [CrossRef]
- Qi, J.; Zhang, S.; Azam, M.; Shaibu, A.S.; Abdelghany, A.M.; Feng, Y.; Huai, Y.; Feng, H.; Liu, Y.; Ma, C.; et al. Profiling seed soluble sugar compositions in 1164 Chinese soybean accessions from major growing ecoregions. Crop J. 2022, 6, 1825–1831. [Google Scholar] [CrossRef]
- Matei, G.; Woyann, L.G.; Meneguzzi, C.; Todeschini, M.H.; Trevizan, D.M.; Rosa, A.C.; Benin, G. Profiling and genotype×environment interactions of seed sugar contents in Brazilian soybean genotypes. Euphytica 2017, 213, 203. [Google Scholar] [CrossRef]
- Liu, C.; Chen, H.; Yu, Q.; Gu, H.; Li, Y.; Tu, B.; Zhang, H.; Zhang, Q.; Liu, X. Identification of quantitative trait loci and candidate genes for seed sucrose and soluble sugar concentrations in soybean. Crop Sci. 2023, 63, 2976–2992. [Google Scholar] [CrossRef]
- Kim, H.K.; Kang, S.T.; Oh, K.W. Mapping of putative quantitative trait loci controlling the total oligosaccharide and sucrose content of Glycine max seeds. J. Plant Res. 2006, 119, 533–538. [Google Scholar] [CrossRef] [PubMed]
- Jamison, D.R.; Chen, P.; Hettiarachchy, N.S.; Miller, D.M.; Shakiba, E. Identification of Quantitative Trait Loci (QTL) for Sucrose and Protein Content in Soybean Seed. Plants 2024, 13, 650. [Google Scholar] [CrossRef] [PubMed]
- Kang, S.H.; Shin, S.Y.; Kang, B.H.; Chowdhury, S.; Lee, W.-H.; Kim, W.J.; Lee, J.-D.; Lee, S.; Choi, Y.-M.; Ha, B.-K. Screening Germplasms and Detecting Quantitative Trait Loci for High Sucrose Content in Soybean. Plants 2024, 13, 2815. [Google Scholar] [CrossRef]
- Knizia, D.; Bellaloui, N.; Yuan, J.; Lakhssasi, N.; Anil, E.; Vuong, T.; Embaby, M.; Nguyen, H.T.; Mengistu, A.; Maksem, K.; et al. Quantitative Trait Loci and Candidate Genes That Control Seed Sugars Contents in the Soybean ‘Forrest’ by ‘Williams 82’ Recombinant Inbred Line Population. Plants 2023, 12, 3498. [Google Scholar] [CrossRef]
- Zeng, A.; Chen, P.; Zhang, B.; Orazaly, M.; Florez-Palacios, L.; Brye, K.R. Identification and confirmation of quantitative trait loci for stachyose content in soybean seed. Plant Breed. 2015, 134, 178–185. [Google Scholar] [CrossRef]
- Pan, W.-J.; Han, X.; Huang, S.-Y.; Yu, J.-Y.; Zhao, Y.; Qu, K.-X.; Zhang, Z.-X.; Yin, Z.-G.; Qi, H.-D.; Zhang, Y.; et al. Identification of candidate genes related to soluble sugar contents in soybean seeds using multiple genetic analyses. Plant Genome 2022, 21, 17. [Google Scholar] [CrossRef]


| Trait | Year | Parents | RIL Population | |||||
|---|---|---|---|---|---|---|---|---|
| JD53 /mg·g−1 | Ping Nan /mg·g−1 | Mean /mg·g−1 | Range /mg·g−1 | Coefficient of Variation/% | Kurtosis | Skewness | ||
| Glucose | 2017 | 3.72 a | 3.13 a | 7.88 | 2.98~23.52 | 42.04 | 7.31 | 2.34 |
| 2018 | 4.52 ab | 5.96 ab | 5.50 | 3.16~10.49 | 24.14 | 1.55 | 1.19 | |
| 2019 | 21.60 d | 18.78 e | 19.18 | 11.31~39.65 | 17.62 | 9.66 | 1.74 | |
| Sucrose | 2017 | 51.06 f | 29.31 j | 35.45 | 13.19~49.47 | 20.24 | 0.41 | −0.42 |
| 2018 | 35.34 de | 20.21 g | 35.19 | 19.46~53.42 | 17.34 | −0.08 | 0.27 | |
| 2019 | 45.43 f | 30.12 i | 46.60 | 25.64~74.8 | 18.01 | 1.02 | 0.65 | |
| Raffinose | 2017 | 5.14 ab | 4.49 ab | 5.40 | 1.32~12.42 | 33.74 | 1.21 | 0.67 |
| 2018 | 3.60 b | 6.68 a | 5.48 | 3.16~8.69 | 20.92 | −0.28 | 0.35 | |
| 2019 | 14.75 c | 12.28 c | 13.57 | 0.02~32.29 | 47.02 | −0.19 | 0.62 | |
| Stachyose | 2017 | 37.18 g | 37.48 g | 31.34 | 8.83~49.49 | 20.86 | 0.61 | −0.23 |
| 2018 | 29.57 g | 37.86 f | 36.14 | 18.06~55.2 | 16.39 | 0.53 | 0.38 | |
| 2019 | 35.57 h | 41.14 g | 37.03 | 24.31~59.2 | 16.36 | 2.52 | 0.92 | |
| Total sugar | 2017 | 97.11 l | 74.40 m | 80.06 | 49.62~106.82 | 13.74 | −0.02 | −0.33 |
| 2018 | 73.03 k | 70.71 l | 82.31 | 60.67~108.64 | 10.32 | 0.25 | 0.05 | |
| 2019 | 117.36 n | 102.32 o | 116.37 | 80.8~167.71 | 12.89 | 0.89 | 0.68 | |
| Glucose | Sucrose | Raffinose | Stachyose | |
|---|---|---|---|---|
| Sucrose | −0.234 | |||
| Raffinose | 0.117 | 0.280 ** | ||
| Stachyose | −0.247 ** | 0.197 * | 0.299 ** | |
| Total sugar | 0.021 | 0.745 ** | 0.562 ** | 0.698 ** |
| Glucose | Sucrose | Raffinose | Stachyose | |
|---|---|---|---|---|
| Sucrose | 0.135 | |||
| Raffinose | 0.073 | −0.09 | ||
| Stachyose | −0.185 * | −0.065 | 0.236 ** | |
| Total sugar | 0.134 | 0.682 ** | 0.246 ** | 0.654 ** |
| Glucose | Sucrose | Raffinose | Stachyose | |
|---|---|---|---|---|
| Sucrose | 0.09 | |||
| Raffinose | 0.340 ** | 0.239 ** | ||
| Stachyose | −0.129 | 0.246 ** | 0.011 | |
| Total sugar | 0.368 ** | 0.781 ** | 0.640 ** | 0.517 ** |
| Year | Traits | Model | Single Effect | Interaction Effect | Major Gene Var | Heritability (Major Gene) (%) |
|---|---|---|---|---|---|---|
| 2017 | Glucose | 4MG-AI | 2.3537 | 1.5349 | 10.5655 | 95.5996 |
| Sucrose | 0MG | - | ||||
| Raffinose | 2MG-CE | 1.2176 | 1.0946 | 32.7648 | ||
| Stachyose | 0MG | |||||
| 2018 | Glucose | 2MG-CE | - | 1.3564 | 1.0995 | 61.8282 |
| Sucrose | 2MG-CE | - | 4.4152 | 15.0866 | 40.1834 | |
| Raffinose | 2MG-CE | 0.886 | 0.6204 | 46.8152 | ||
| Stachyose | 2MG-CE | 4.2367 | 13.6149 | 38.5054 | ||
| 2019 | Glucose | 0MG | ||||
| Sucrose | 2MG-CE | 6.0772 | 26.1128 | 36.791 | ||
| Raffinose | 3MG-AI | 4.2527 | 2.0075 | 32.4119 | 78.9812 | |
| Stachyose | 4MG-AI | 3.7659 | −0.1103 | 36.1668 | 97.7313 |
| Linkage Group ID | Marker Number | Genetic Distance (cM) | Average Distance (cM) | Maximum Gap (cM) | Gaps < 5 cM |
|---|---|---|---|---|---|
| Chr01 | 57 | 152.35 | 2.72 | 16.24 | 0.88 |
| Chr02 | 577 | 208.45 | 0.36 | 9.13 | 1.00 |
| Chr03 | 68 | 121.27 | 1.81 | 9.17 | 0.94 |
| Chr04 | 528 | 132.43 | 0.25 | 9.45 | 0.99 |
| Chr05 | 499 | 164.72 | 0.33 | 3.34 | 1.00 |
| Chr06 | 404 | 163.35 | 0.41 | 9.44 | 1.00 |
| Chr07 | 366 | 208.22 | 0.57 | 7.31 | 0.98 |
| Chr08 | 580 | 176.81 | 0.31 | 9.87 | 0.99 |
| Chr09 | 414 | 146 | 0.35 | 17.92 | 0.99 |
| Chr10 | 608 | 144.33 | 0.24 | 23.12 | 1.00 |
| Chr11 | 105 | 119.15 | 1.15 | 8.12 | 0.97 |
| Chr12 | 545 | 149.87 | 0.28 | 25.26 | 1.00 |
| Chr13 | 274 | 138.98 | 0.51 | 15.38 | 0.98 |
| Chr14 | 120 | 174.33 | 1.46 | 16.63 | 0.96 |
| Chr15 | 616 | 149.64 | 0.24 | 8.19 | 1.00 |
| Chr16 | 28 | 92.51 | 3.43 | 16.15 | 0.85 |
| Chr17 | 214 | 193.28 | 0.91 | 6.87 | 0.99 |
| Chr18 | 740 | 196.48 | 0.27 | 27.09 | 0.99 |
| Chr19 | 534 | 106.3 | 0.2 | 9.76 | 0.99 |
| Chr20 | 668 | 209.99 | 0.31 | 28.45 | 0.98 |
| Total | 7945 | 3148.46 | 0.81 | 28.45 | 0.97 |
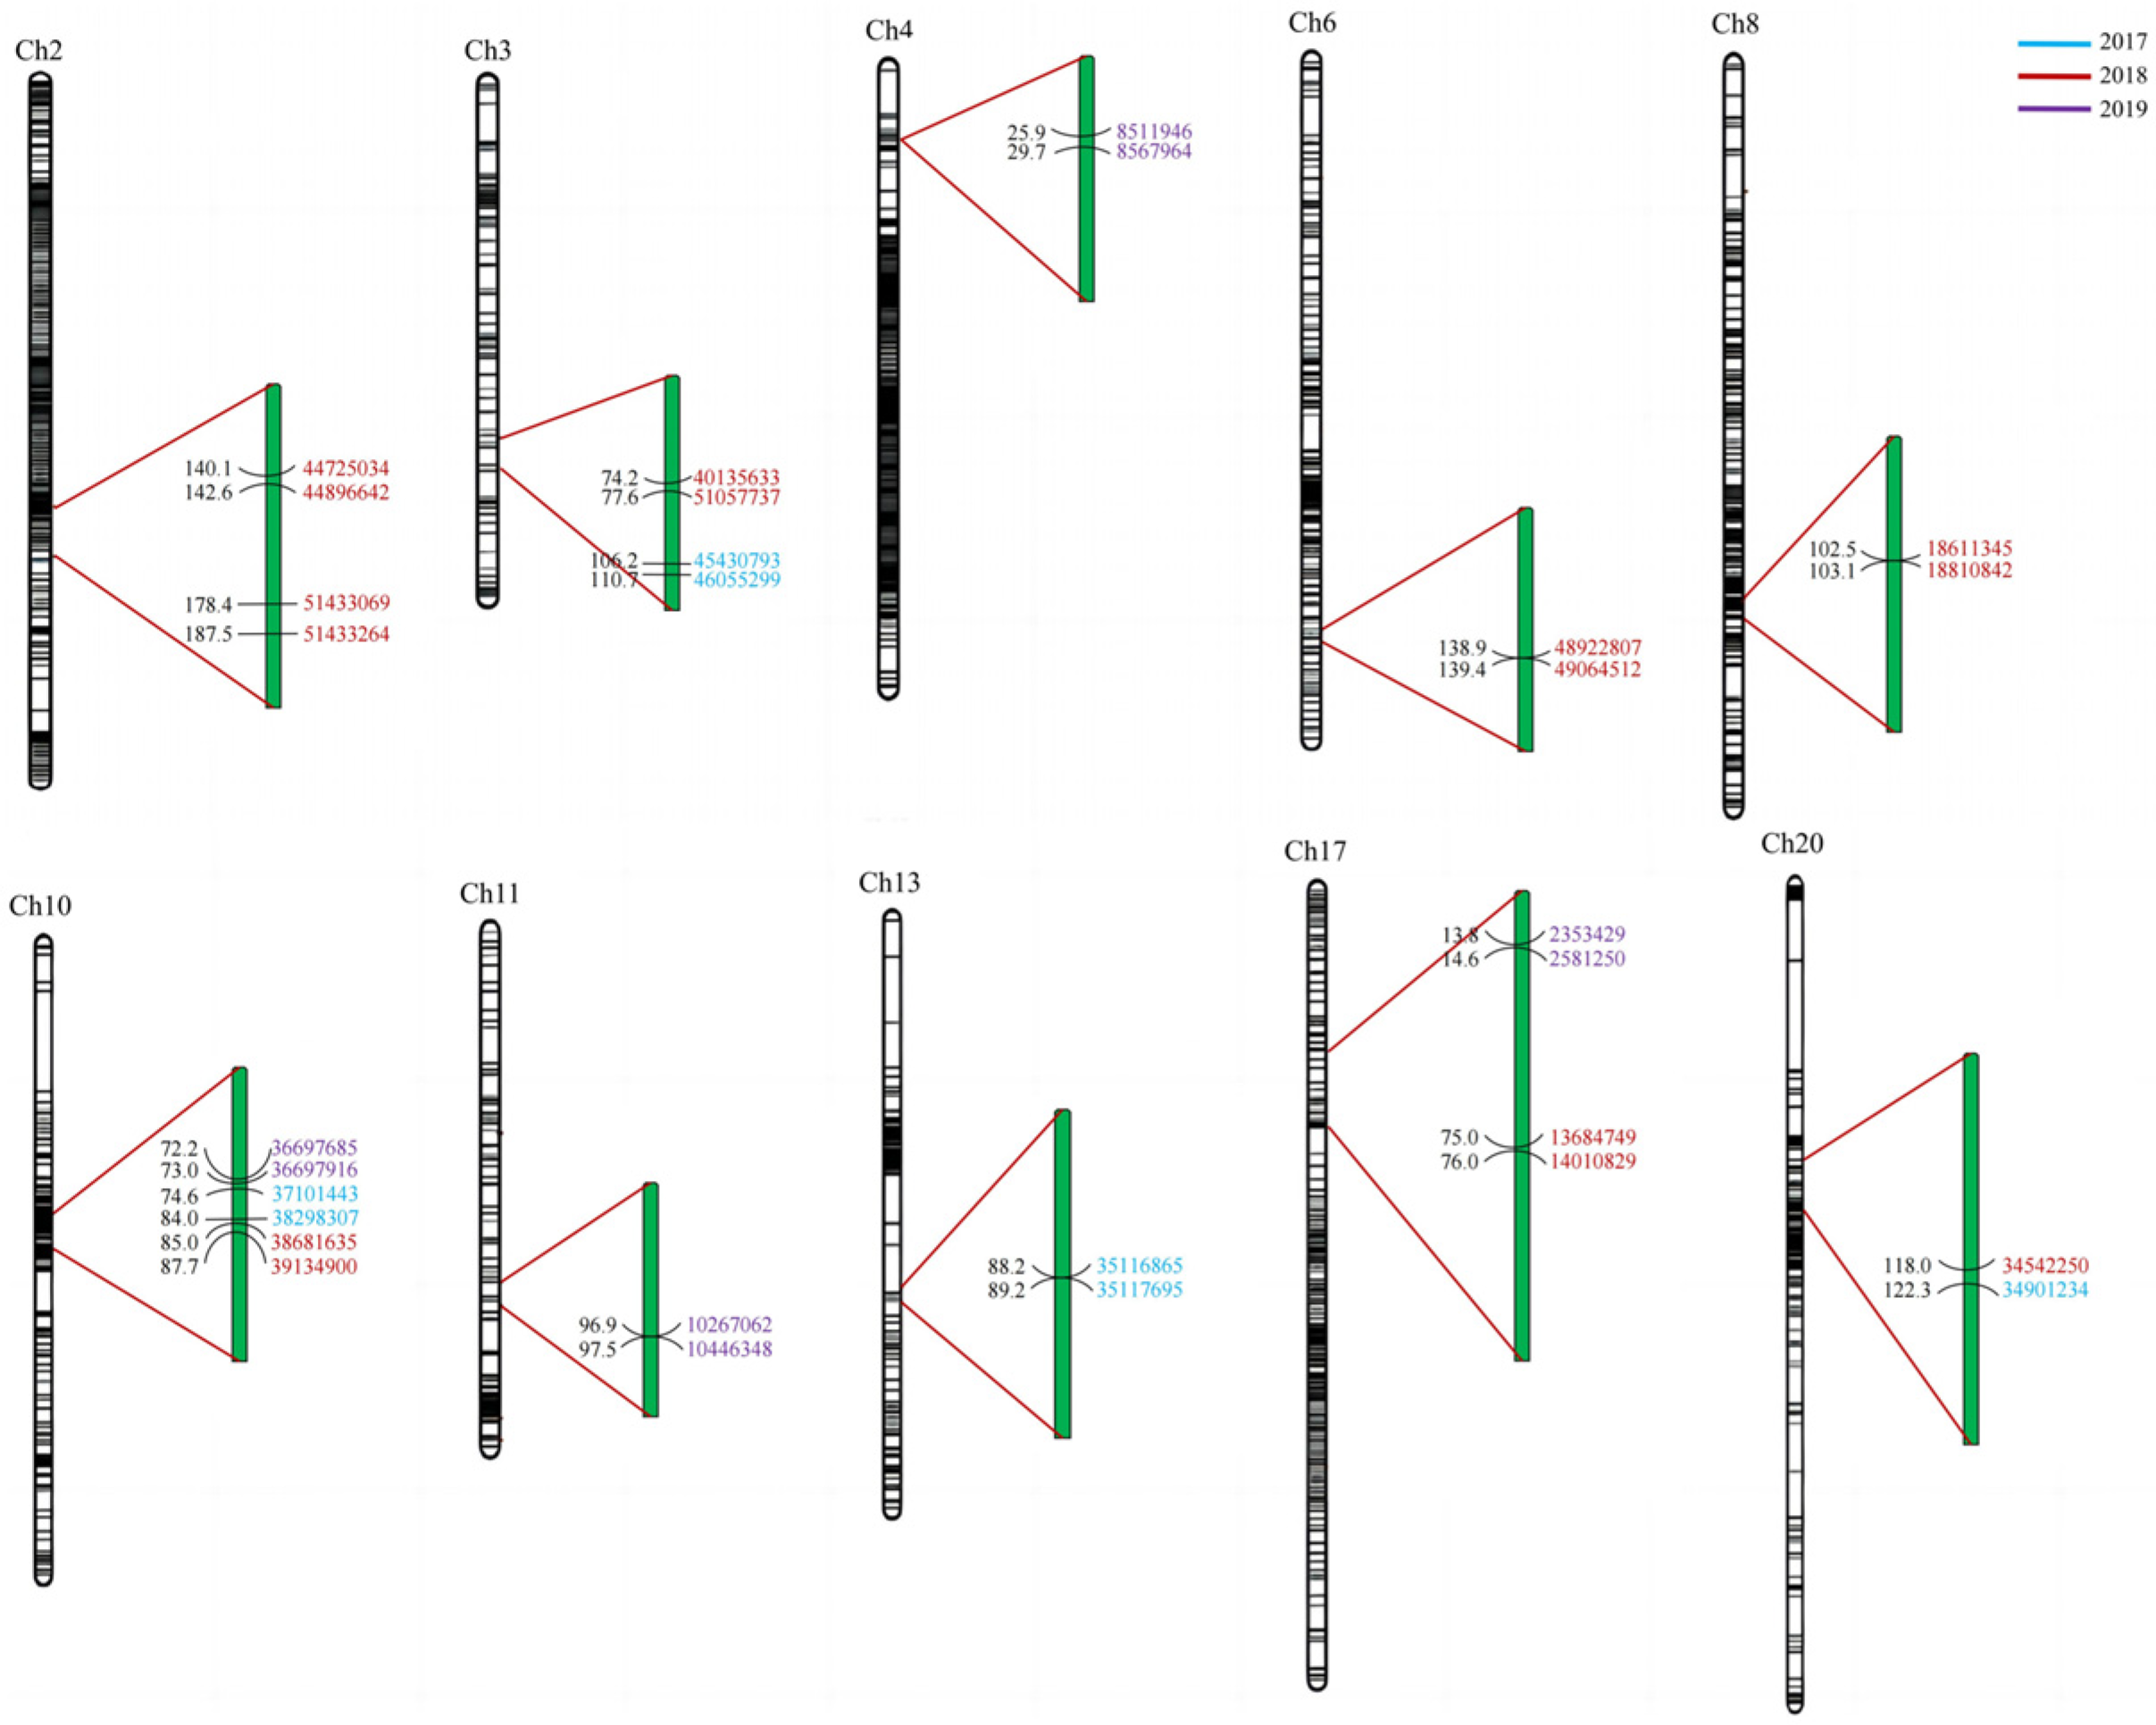
| Year | Chr | Position | Support Interval (cM) | LOD | PVE (%) | Add | Physical Interval (bp) | |
|---|---|---|---|---|---|---|---|---|
| Glucose | 2018 | 12 | 111 | 110.808–111.614 | 2.7866 | 6.804 | 0.3734 | 33506546–33603529 |
| 2018 | 20 | 118 | 117.986–122.335 | 4.3803 | 10.9411 | −0.4736 | 34542250–34901234 | |
| 2018 | 2 | 187 | 178.418–187.546 | 3.4754 | 8.8828 | −0.4331 | 51433069–51433264 | |
| 2019 | 1 | 40 | 36.795–40.082 | 3.2612 | 10.0056 | 1.0727 | 51571946–51900610 | |
| 2019 | 17 | 14 | 13.755–14.552 | 2.657 | 8.0716 | −0.9616 | 2353429–2581250 | |
| Sucrose | 2017 | 3 | 107 | 106.212–110.658 | 3.6513 | 10.516 | −2.3585 | 45430793–46055299 |
| 2017 | 13 | 89 | 88.201–89.242 | 2.794 | 7.685 | −2.0485 | 35116865–35117695 | |
| 2018 | 13 | 72 | 71.623–76.703 | 4.5916 | 14.565 | −2.3166 | - | |
| 2019 | 11 | 97 | 96.881–97.529 | 3.2553 | 12.8923 | 2.7784 | 10267062–10446348 | |
| Raffinose | 2018 | 2 | 142 | 140.059–142.562 | 2.9325 | 8.9174 | −0.3344 | 44725034–44896642 |
| 2018 | 3 | 76 | 74.183–77.576 | 2.9713 | 9.2941 | 0.3418 | 40135633–41057737 | |
| 2018 | 6 | 139 | 138.925–139.434 | 3.6425 | 10.9817 | 0.3711 | 48922807–49064512 | |
| 2019 | 4 | 26 | 25.918–29.706 | 2.8246 | 9.7633 | 1.9647 | 8511946–8567964 | |
| Stachyose | 2017 | 10 | 75 | 74.631–84.022 | 4.0954 | 13.7578 | 2.4643 | 37101443–38298307 |
| 2018 | 10 | 85 | 84.966–87.74 | 4.5797 | 13.8727 | 2.2303 | 38681635–39134900 | |
| 2019 | 10 | 73 | 72.231–73.025 | 5.5375 | 11.6685 | 2.5431 | 36697685–36697916 | |
| Total sugar | 2017 | 12 | 0 | 0–0.234 | 2.503 | 8.6088 | 3.2292 | 18170525–18191808 |
| 2018 | 1 | 34 | 33.309–36.795 | 3.3371 | 9.3353 | 2.6381 | 51900398–52608650 | |
| 2018 | 8 | 103 | 102.474–103.105 | 3.8742 | 10.485 | 2.7894 | 18611345–18810842 | |
| 2018 | 17 | 76 | 75.01–76.029 | 3.1687 | 8.4785 | 2.5277 | 13684749–14010829 |
| Marker interval | Chr | Genetic Interval (cM) | Traits of Mapping |
|---|---|---|---|
| S10_37101443–S10_38298307 | 10 | 74.631–84.022 | 2017-stachyose |
| S10_38681635–S10_39134900 | 10 | 84.966–87.740 | 2018-stachyose |
| S10_36697685–S10_36697916 | 10 | 72.231–73.025 | 2019-stachyose |
| S11_10267062–S11_10446348 | 11 | 96.881–97.529 | 2019-sucrose |
| Name | Location | Database ID | Annotation Type | Annotation Description |
|---|---|---|---|---|
| Glyma.10g154400.Wm82.a2.v1 | Gm10: 38941372–38947198 | GO:0005975 | GO-bp | carbohydrate metabolic process |
| Glyma.11g136200.Wm82.a2.v1 | Gm11: 10352301–10356496 | IPR003663 | InterPro | sugar/inositol transporter |
Disclaimer/Publisher’s Note: The statements, opinions and data contained in all publications are solely those of the individual author(s) and contributor(s) and not of MDPI and/or the editor(s). MDPI and/or the editor(s) disclaim responsibility for any injury to people or property resulting from any ideas, methods, instructions or products referred to in the content. |
© 2025 by the authors. Licensee MDPI, Basel, Switzerland. This article is an open access article distributed under the terms and conditions of the Creative Commons Attribution (CC BY) license (https://creativecommons.org/licenses/by/4.0/).
Share and Cite
He, C.; Wang, Y.; Li, C.; Yang, Y.; You, Q.; Yue, A.; Niu, J.; Wang, L.; Du, W.; Wang, M. QTLs Mapping and Identification of Candidate Genes Associated with Stachyose and Sucrose in Soybean (Glycine max L.). Agronomy 2025, 15, 972. https://doi.org/10.3390/agronomy15040972
He C, Wang Y, Li C, Yang Y, You Q, Yue A, Niu J, Wang L, Du W, Wang M. QTLs Mapping and Identification of Candidate Genes Associated with Stachyose and Sucrose in Soybean (Glycine max L.). Agronomy. 2025; 15(4):972. https://doi.org/10.3390/agronomy15040972
Chicago/Turabian StyleHe, Chuanrong, Yipu Wang, Changning Li, Yue Yang, Qian You, Aiqin Yue, Jingping Niu, Lixiang Wang, Weijun Du, and Min Wang. 2025. "QTLs Mapping and Identification of Candidate Genes Associated with Stachyose and Sucrose in Soybean (Glycine max L.)" Agronomy 15, no. 4: 972. https://doi.org/10.3390/agronomy15040972
APA StyleHe, C., Wang, Y., Li, C., Yang, Y., You, Q., Yue, A., Niu, J., Wang, L., Du, W., & Wang, M. (2025). QTLs Mapping and Identification of Candidate Genes Associated with Stachyose and Sucrose in Soybean (Glycine max L.). Agronomy, 15(4), 972. https://doi.org/10.3390/agronomy15040972