Article

Genome-Wide Identification of LACS Family Genes and Functional Characterization of CaLACS6/9 in Response to Cold Stress in Pepper (Capsicum annuum L.)

1
Key Laboratory of Molecular Breeding and Variety Creation of Horticultural Plants for Mountain Features in Guizhou Province, School of Life and Health Science, Kaili University, Kaili 556011, China
2
College of Horticulture, Sichuan Agricultural University, Chengdu 611130, China
*
Authors to whom correspondence should be addressed.
These authors contributed equally to this work.
Agronomy 2025, 15(4), 970; https://doi.org/10.3390/agronomy15040970
Submission received: 27 February 2025 / Revised: 3 April 2025 / Accepted: 14 April 2025 / Published: 17 April 2025
(This article belongs to the Section Crop Breeding and Genetics)

Abstract

:
Long-chain acyl-CoA synthetase (LACS) is a crucial enzyme involved in cellular lipid metabolism, playing a significant role in plant development and adaptation to environmental stress. However, our understanding of the CaLACS gene family in pepper remains limited. In this study, we identified nine members of the CaLACS gene in the ‘UCD-10X-F1’ pepper genome and named them CaLACS1-CaLACS9 based on their chromosomal distribution. Phylogenetic analysis revealed that the subfamily I-A includes CaLACS1, CaLACS3, and CaLACS7; the subfamily I-C contains CaLACS2; the subfamily II comprises CaLACS4 and CaLACS8; and the subfamily III consists of the remaining members. Collinearity analysis showed that there were twelve collinear pairs between six CaLACS genes and five AtLACS genes, and two fragment replication gene pairs in the nine CaLACS genes of pepper. Furthermore, numerous cis-acting elements associated with stress response, hormonal regulation, development, and light response were identified in the promoter regions of the CaLACS genes. RNA-seq analysis indicated that CaLACS genes exhibit tissue specificity and are widely expressed in pepper leaves following treatment with exogenous plant hormones, and under conditions of cold, heat, drought, and salt stress. Additionally, virus-induced gene silencing (VIGS) technology was employed to further investigate the roles of CaLACS6 and CaLACS9. Silencing these target genes in pepper seedlings increased their sensitivity to cold stress, as evidenced by the accumulation of reactive oxygen species (ROS), reduced antioxidant defense capacity, and decreased expression levels of cold-responsive and ROS-related genes. The findings of this study provide valuable insights into the functional roles of the CaLACS gene family and highlight CaLACS6 and CaLACS9 as promising candidate genes for enhancing cold tolerance in pepper.

1. Introduction

Long-chain acyl-CoA synthetases (LACSs) are derivatives of the acyl-CoA synthetase family and the most important subfamily in the acyl-activating enzyme (AAE) superfamily [1,2]. LACSs play a crucial role in the biosynthetic pathways of almost all fatty acid derived molecules [3]. They catalyze the activation of long-chain fatty acids (LCFAs) and very-long-chain fatty acids (VLCFAs), producing various acyl-CoAs. The resulting products participate in various metabolic pathways, including the production of triglycerides (TAGs), membrane lipids, and surface lipids [3]. Previous studies have shown that these precursors of fatty acids play an important role in controlling membrane permeability and protecting plant tissues from biotic and abiotic stress [4,5,6].
In higher plants, the gene members of LACS have been identified in many species [2,7,8,9,10,11,12,13]. Among them, as a model plant, the functions of AtLACS genes in Arabidopsis have been discovered and confirmed successively. For example, AtLACS1 exhibits C20–C30 (20–30 carbons) synthase activity for VLCFAs, with the highest specificity for C30 [1]. The AtLACS2 has overlapping functions with AtLACS1 in wax and keratin synthesis. Weng et al. [14] reported that AtLACS1 and AtLACS2 double-mutant plants display pleiotropic phenotypes including abnormal flower development and reduced seed sets, and are highly susceptible to drought stress. AtLACS3 was involved in the trafficking of intracellular lipids towards cuticle biosynthesis [15]. It was reported that the AtLACS4 mutant showed no differences in growth phenotype compared to the wild-type plants, whereas the stem wax amount of the AtLACS1/2/4 triple mutants decreased severely, to only 27% of that in wild-type plants [16]. Studies on AtLACS6 and AtLACS7 mutants showed that the seed lipid metabolism was blocked and required exogenous sucrose to form seedlings [16]. For AtLACS8 and AtLACS9, previous studies have demonstrated that these two genes seem to play the same role as AtLACS4 and are all required for normal vegetative growth [17]. AtLACS5 is expressed in anthers [2], and functional research on it has not been reported till now. In short, most of the AtLACS genes played important roles in plant development and the biosynthesis of cutin and cuticular wax, and to some extent, they have overlapping functions with each other.
In addition, a large number of studies have reported the functions of LACSs in other higher plants. In sunflowers, HaLACS1 and HaLACS2 are highly expressed in developing seeds and are involved in oil synthesis [18]. The BnaLACS8A03 gene, which is homologous to the AtLACS8 gene, is highly expressed in the leaves, flowers, and young siliques of rapeseed, and participates in the synthesis and transport of glucosinolates [19]. The expression levels of CiLACS9 and CiLACS9-1 in pecans were significantly upregulated under drought and salt stress, as indicated by quantitative reverse transcription polymerase chain reaction (RT-qPCR) analysis [20]. The GhLACS25 in cotton is primarily expressed in stems and leaves, playing a crucial role in salt stress resistance [11]. It has been demonstrated that PoLACS4 in peonies responds to both drought and salt stresses [21]. Additionally, MdLACS2 in apples, along with GhLCAS2 and GhLCAS3 in soybeans, enhance drought resistance in transgenic plants by reducing epidermal permeability and water loss [22,23]. ZmLACS9 in maize has been found to influence photosynthesis by affecting the structure and content of chloroplasts, leading to a decrease in heat tolerance in mutant plants [10]. In addition, the transcription levels of LACS6, LACS8, and LACS9 in maize root were up-regulated under cold stress, as showed by RNA-Seq analysis [24]. Wei et al. [25] identified two cDNAs encoding Rhododendron LACS in the cold-acclimated, but none in non-acclimated, expressed sequence tags (EST) data set, suggesting that these two genes are associated with cold response. Collectively, these studies demonstrate that LACSs are involved in responding to abiotic stresses, such as salt, drought, heat, and cold; however, their role in pepper remains unclear.
Pepper (Capsicum annuum L.), belonging to the Solanaceae family, is an annual or limited perennial herbaceous plant that is a worldwide vegetable or ornamental plant. As the world’s largest producer and consumer of pepper, China’s total planting area has reached about 200 million hectares in recent years [26]. Pepper is typically a cold-sensitive vegetable crop. Their seedlings, tissues, and fruits are subjected to physiological disorders caused by cold stress, especially when they are cultivated in open fields during the spring and winter [27,28,29]. Therefore, it is necessary to explore the molecular mechanism of pepper response to cold stress. Based on previous research indicating the importance of the LACS genes in various physiological programs, it would be of interest to conduct a systematic analysis of the LACS family in pepper. In this study, we identify the LACS gene family in the pepper genome using bioinformatics methods and reveal the chromosomal locations, phylogenetic relationships, gene structure features, synteny, and expression patterns of these genes. Additionally, we explore the functions of CaLACS6 and CaLACS9 in response to cold stress through experimental methods. Our results will provide insights into the mechanisms of action of the LACS gene, laying a theoretical foundation for cultivating a new cold tolerant pepper variety and expanding the production window of peppers.

2. Materials and Methods

2.1. Databases

The genome data of pepper ‘UCD-10X-F1’ was downloaded from NCBI database (https://www.ncbi.nlm.nih.gov/, accessed on 2 July 2024), and the genome sequences of Arabidopsis thaliana, rapeseed, maize, and tomato were downloaded from the Ensembl Plants database (http://plants.ensembl.org/, accessed on 2 July 2024). The LACS sequences of Ectocorpus siliculus and Galdieria sulphularia were derived from Zhang et al. [9].

2.2. Dentification of CaLACS Genes Family Member in Pepper

To obtain members of the pepper LACS family, a BLASTP search was performed using LACS sequences from Arabidopsis and maize with a cutoff value of 1 × 10⁻¹⁰. CD-search (https://www.ncbi.nlm.nih.gov/Structure/cdd/wrpsb.cgi, accessed on 6 August 2024) and Pfam (http://pfam-legacy.xfam.org/, accessed on 6 August 2024) methods were used to remove residue sequences lacking C-terminus, N-terminus, or C-N terminus; the remaining sequences were potential members of the pepper LACS family. We obtained a chromosome map from the GFF genome file of pepper and visualized the chromosome distribution of CaLACS genes on the MG2C website (http://mg2c.iask.in/mg2c_v2.1/, accessed on 15 August 2024). In addition, the physicochemical properties of CaLACS protein members were obtained using the ExPASy website (http://web.expasy.org/protparam/, accessed on 9 August 2024). The subcellular localization was detected using the CELLO website.

2.3. Sequence Analysis and Evolutionary Tree Construction of CaLACS Members

The multi-sequence alignment of structural domains in pepper and Arabidopsis was performed by ClustalX software (version 2.1) [30]. The similarity between sequences was determined using NCBI’s BlastP program. The protein sequence of pepper, Arabidopsis thaliana, tomato, maize, rapeseed, Galdieria sulphuraria, and Ectocarpus siliculosus were aligned using the ClustalW program with the default settings [30]. Subsequently, we constructed a phylogenetic tree using MEGAX64 combined with the maximum likelihood method, the parameters were the bootstrap method with 1000 replications; a threshold of 8; and the Poisson model setting in the substitution model . Finally, the phylogenetic tree was managed and displayed by the EvolEiew website (https://www.evolgenius.info/evolview-v2/#login, accessed on 21 August 2024).

2.4. Analysis of the Protein Conserved Motifs and Gene Structure

Amino acid sequences were used as input files to detect highly conserved motifs of CaLACS proteins on the MEME Suite website (version 5.5.7, https://meme-suite.org/meme/, accessed on 21 August 2024), with the maximum number of motifs set at 20 under the condition of E-value < 0.01 [31]. The GSDS website (version 2.0, https://gsds.gao-lab.org/, accessed on 25 August 2024) was used with the GFF3 file and NWK file to display the exon/intron structures of CaLACS genes [32].

2.5. Analysis of CaLACSs Promoter Region

To identify the cis-elements of the LACS gene in pepper, the sequences of 2 kb up-stream from the translation start site (ATG) were obtained using TBtools software (version 2.119) [33]. Subsequently, various cis-elements were analyzed and identified from the PlantCare database (http://bioinformatics.psb.ugent.be/webtools/plantcare/html, accessed on 1 September 2024).

2.6. Analysis of Gene Collinearity and Selective Pressure

The gene collinearity analysis was conducted using TBtools software (version 2.119) [33]. The whole protein of these two species was compared using BlastP with an E-value < 1 × 10⁻⁵, and then the blast results were imported into MCScanX to compute collinear blocks for pairs of chromosomes [34]. Finally, the results of collinear pairs are presented in the form of a circos map. The non-synonymous substitution rate (Ka), synonymous substitution rate (Ks), and the ratio of non-synonymous nucleotide substitution to synonymous nucleotide substitution (Ka/Ks) were calculated by DnaSP software (version 6) [35]. The evolutionary duplication time (T) was calculated by T = (Ks × 1 × 10⁻⁶)/2 λ (Mya), the λ = 7.85 × 10⁻⁹ in pepper [36].

2.7. CaLACS Gene Expression Analysis of RNA-seq Data Under Different Conditions

To analyze the expression levels of pepper CaLACS genes in different tissues, under different phytohormones and abiotic stresses, we downloaded the following RNA-seq data from the NCBI database: roots, stems, leaves, flowers, flower buds, fruit (immature stage, mature green stage, break stage, and maturity stage (PRJNA193077) [37]; 1, 3, 6, 12, and 24 h after treatment with MeJA, SA, ET, and ABA (PRJNA634831) [38]; And under salt, drought, cold, and heat stress for 1, 3, 6, 12, and 24 h (PRJNA525913) [39]. The FPKM values were used to estimate the expression level of assembled transcripts.

2.8. VIGS of CaLACS6 and CaLACS9 Genes in Pepper

The PTRV1, PTRV2, and recombinant vector PTRV2:PDS used in this experiment were provided by Professor Huanxiu Li from the College of Horticulture, Sichuan Agricultural University. We designed specific fragments of the CaLACS6 and CaLACS9 genes using the SGN VIGS Tool (https://vigs.solgenomics.net/, accessed on 1 September 2024) to improve silencing efficacy [40]. We constructed recombinant vectors TRV2:CaLACS6 and TRV2:CaLACS9 using double enzyme digestion with XbaI and BamHI, and subsequently transferred them into Agrobacterium strain GV3101 [41]. The experimental method of VIGS was based on Velásquez et al. [42]. Briefly, the silenced fragment of the target gene is inserted into the TRV2 vector to generate recombinant vectors TRV2:CaLACS6 and TRV2:CaLAC9. These vectors, along with TRV1, TRV2:00, and TRV2:PDS vectors, were transformed into Agrobacterium tumefaciens strain GV3101. Subsequently, TRV2:CaLACS6, TRV2:CaLAC9, TRV2:PDS, and TRV2:00 vectors were mixed with TRV1 in a 1:1 ratio and injected into the cotyledons of 2-week-old pepper plants. After being placed in a dark environment for 2 days, it was transferred to normal conditions for growth. After three weeks, the efficiency of CaLACS6 and CaLAC9 silencing was determined by RT-qPCR.

2.9. Plant Materials and Cold Stress Treatments

The pepper cultivar “Ganzi” was provided by Professor Huanxiu Li from the College of Horticulture, Sichuan Agricultural University. It was planted in the phytotron of Kaili University, with growth conditions of 25 °C day/20 °C night, 16 h light/8 h dark, and a relative humidity of 70%.
For RT-qPCR analysis, the pepper seedlings with 6–8 true leaves were subjected to cold treatment at 4 °C, and the third or fourth fully unfolded leaves were collected at 0 h, 3 h, 6 h, 12 h and 24 h, with each sample 0.1 g. To analyze the response of CaLACS6 and CaLACS9 to cold stress, plants with silencing of the target genes were treated at 4 °C for 12 h, a 15 min instantaneous treatment at 0 °C was carried out, and then treated at 4 °C for 12 h. Leaf samples were taken and stored at −80 °C after liquid nitrogen treatment for future use. Three biological replicates were set for each treatment.

2.10. Measurement of Physiological Indicators

The reagent kits used for physiological index determination in this experiment, including H2O2 content assay kit (AKAO009C), superoxide anion content assay kit (AKAO008C), MDA content assay kit (AKFA013C), SOD activity assay kit (AKAO001C-50s), CAT activity assay kit (AKAO003-2c), POD activity assay kit (AKAO005c), were all purchased from Beijing Boxbio Science & Technology Co., Ltd. (Beijing, China). The experimental method was operated according to the instructions of the above indicator.
The H2O2 and O2•− staining of pepper seedling leaves was performed according to Liu’s [43] method. The staining solutions for H2O2 and O2•− were 5 mmol·L−1 DAB solution and 750 μ mol·L−1 NBT solution, respectively. Briefly, we wash and dry fresh leaves treated with different methods, place them in a 50 mL centrifuge tube, and add 25 mL of staining solution, then incubate them at 28 °C for 6 h under a light intensity of 300 mol·m−2·s−1. We transfer the leaves to a centrifuge tube containing 25 mL of 95% ethanol, and finally immerse them in boiling water until the leaves turn white and take photos.

2.11. RNA Extraction and RT-qPCR

Total RNA was extracted from leaf samples using FastPure Cell/Tissue Total RNA Isolation Kit V2 (Vazyme, Nanjing, China), and the concentration of RNA was determined using the ultramicro spectrophotometer (Meixi, Shanghai, China). Subsequently, first strand cDNA synthesis was performed by hiscript III RT supermix for qPCR (+gDNA wiper) kit (Vazyme, Nanjing, China), followed by RT-qPCR analysis conducted using the CFX96 system (Bio-Rad, Hercules, CA, USA) with chamQ universal SYBR qPCR master mix kit (Vazyme, Nanjing, China). Relative gene expression normalized to the CaUbi3 (LOC107873556) gene [44] was calculated by the 2−∆∆ct method [45]. All primer sequences are listed in Table S2.

2.12. Statistical Analysis

The variance analysis was performed by SPSS 21.0 software (IBM, Armonk, NY, USA). All experiments were repeated thrice, and Duncan’s test was used to test significance with lowercase letters representing significant levels (p < 0.01). The Hisat2 (version 2.2.1), Stringtie (version 2.1.7), and ballgown (version 4.4.0) software packages were used to process RNA-seq data. All parameters used default settings. The heatmap of gene expression was constructed and edited using TBtools software (version 2.119) and Adobe illustrator (version 2021), respectively.

3. Results

3.1. Identification of CaLACS Family Genes in Pepper

After identifying and removing erroneous sequences by bioinformatics methods, nine LACS genes were identified in the ‘UCD-10X-F1’ genome and named CaLACS1CaLACS9 based on their chromosome positions (Table 1, Figure S1). Among these, CaLACS4, CaLACS5, CaLACS6, and CaLACS9 are located on chromosomes (Ch.) 3, 4, 7, and 9, respectively, while CaLACS1, CaLACS2, and CaLACS3 are located on Ch. 1, CaLACS7 and CaLACS8 are located on Ch. 8 (Figure S1). The length of the coding regions of CaLACS genes is between 1977 and 2181 bp, the number of encoded protein amino acids is between 658 and 726, the molecular weight of the protein is between 73.56 and 79.84 Kda, and the isoelectric point is between 5.87 and 8.54. The stability coefficient is less than 40, indicating that all CaLACS are stable proteins. In addition, the predicted subcellular localization showed that CaLACS4 was distributed in mitochondria, CaLACS8 was distributed in the plasma membrane, CaLACS9 was distributed in chloroplasts, and the rest were distributed in the cytoplasm, these results can be further confirmed by experiments.

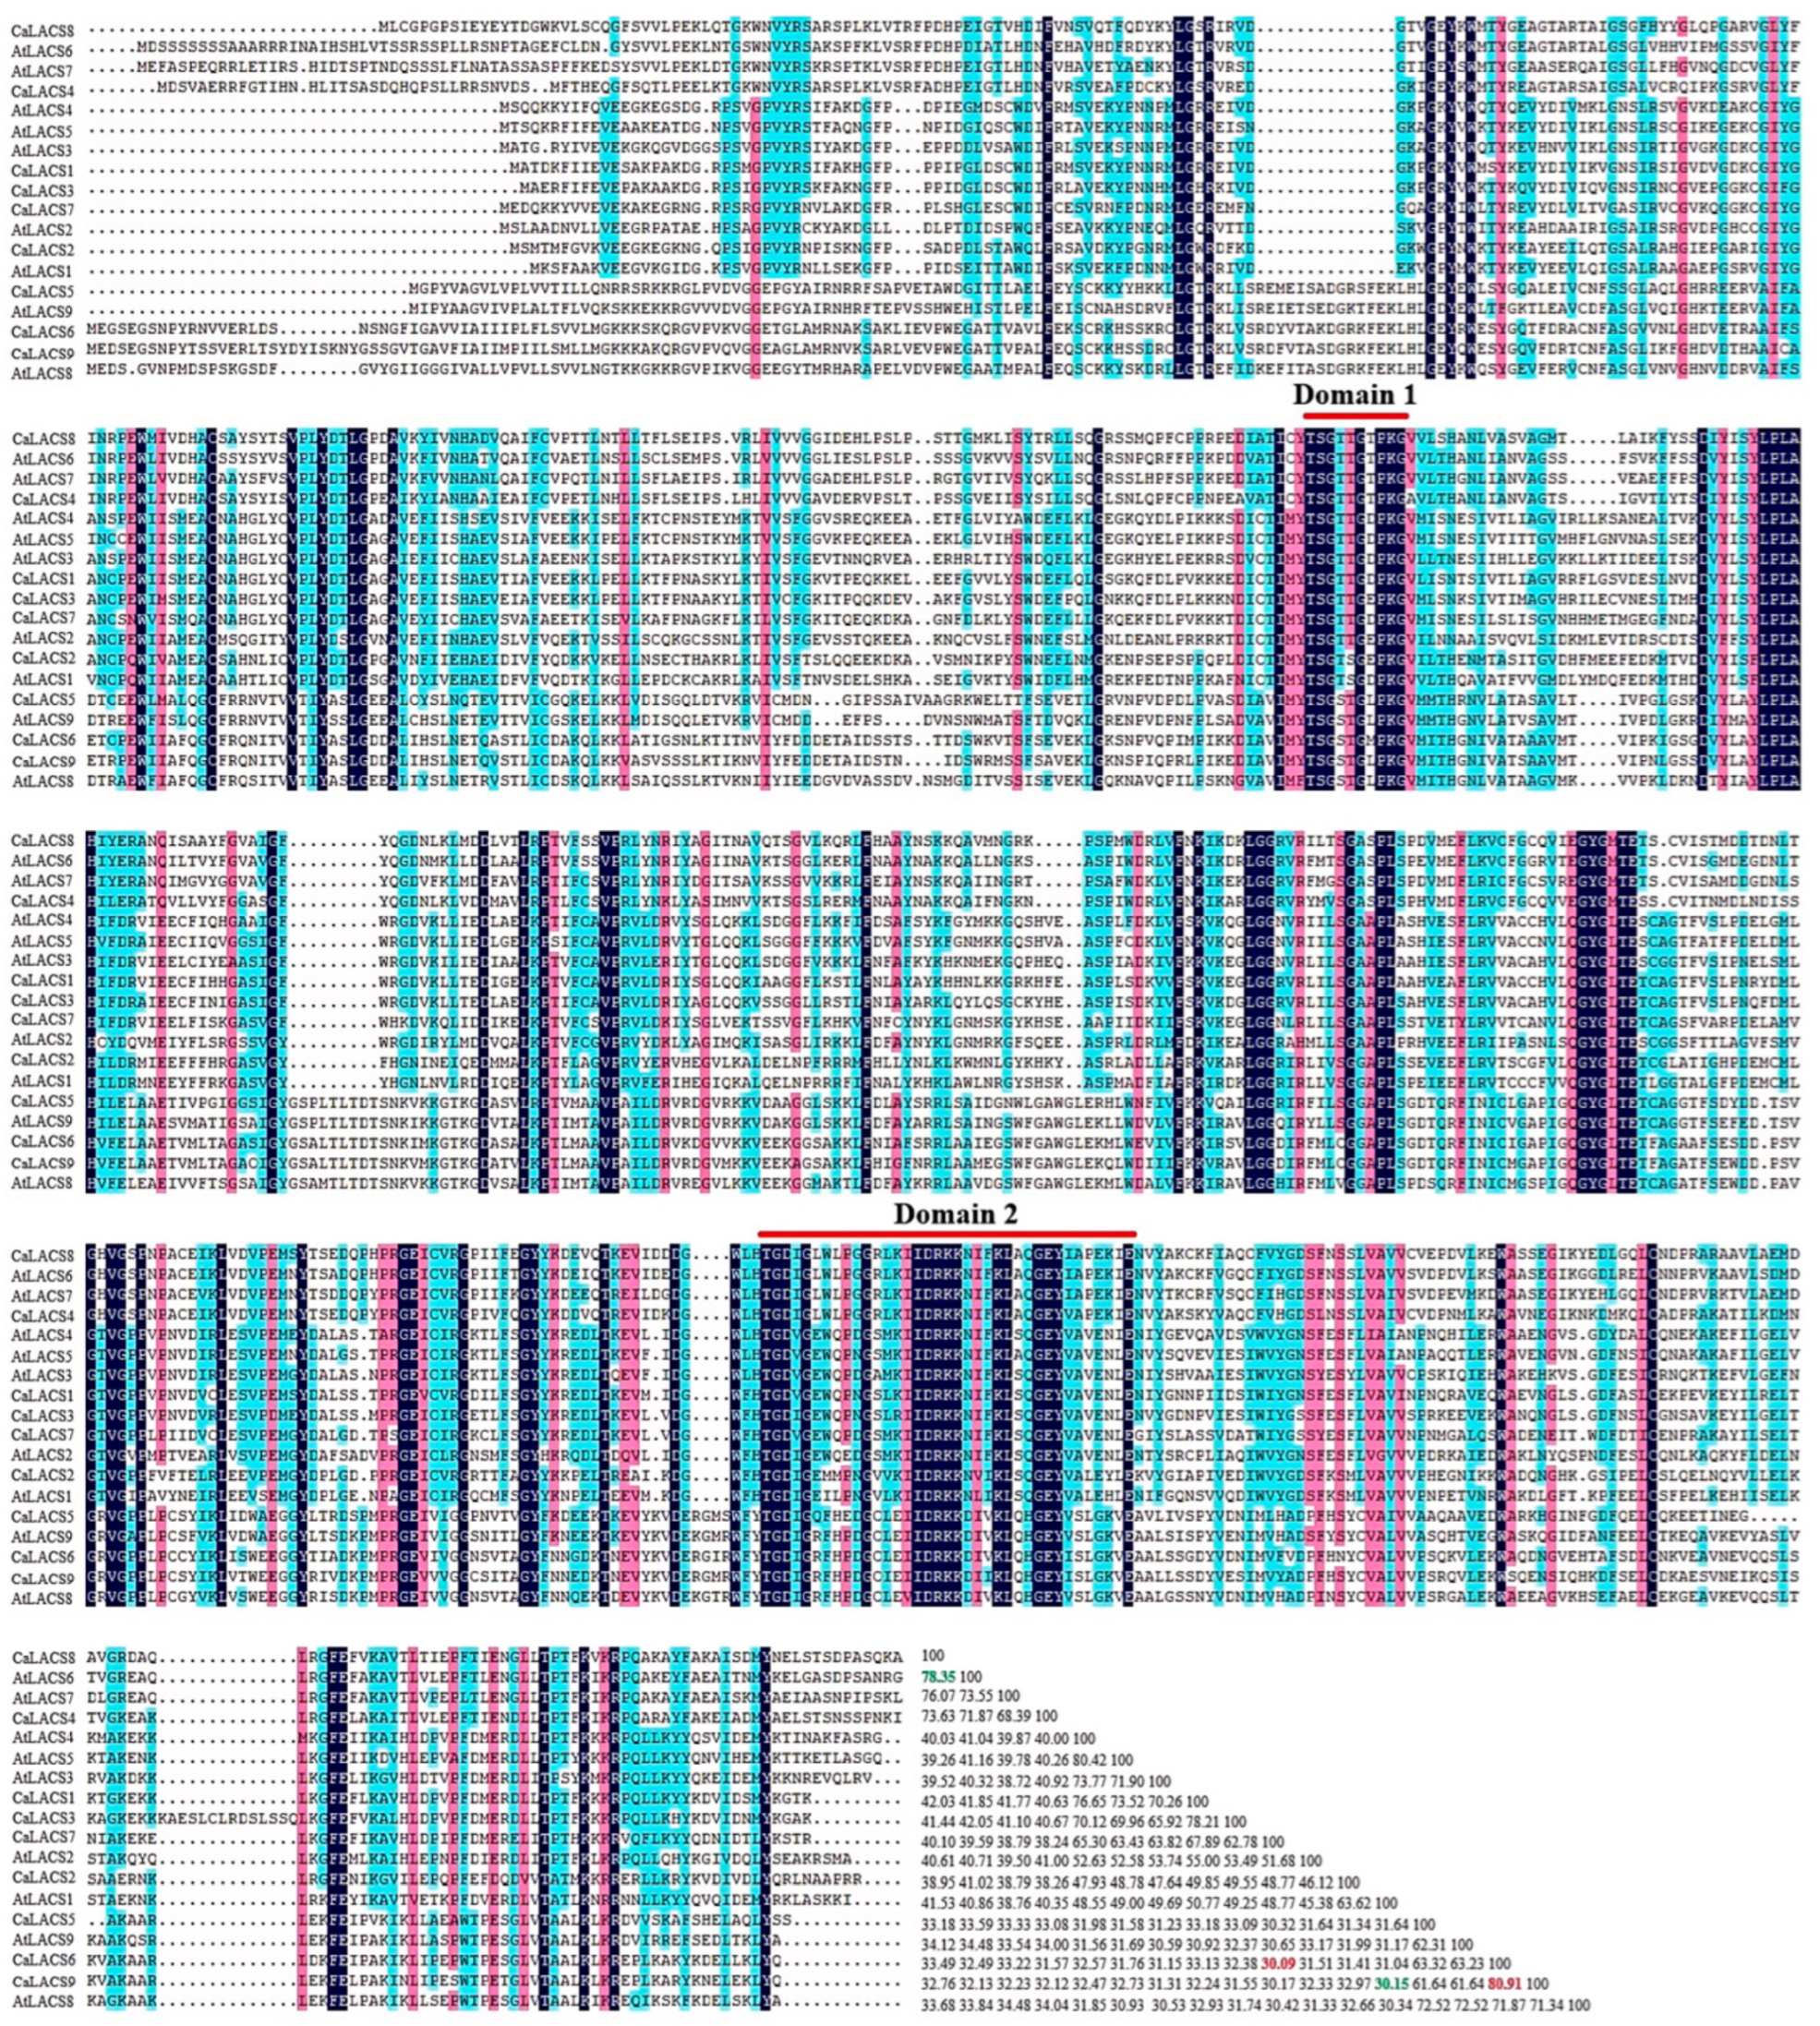
3.2. Sequence Alignment and Conserved Domains Analysis

To investigate the similarity and conservation of various LACS protein sequences, multiple sequence alignments were conducted using protein sequences from Arabidopsis and pepper (Figure 1). The results revealed significant differences among these LACS sequences. Among the different species, AtLACS6 and CaLACS8 exhibited the highest similarity, reaching 78.35%, while the similarity between AtLACS1 and CaLACS9 was only 30.15%. Within the CaLACS sequences in pepper, the highest similarity was observed between CaLACS6 and CaLACS9 at 80.91%, followed by 73.63% between CaLACS6 and CaLACS9, and 70.26% between CaLACS1 and CaLACS3. The similarity among the remaining CaLACS homologous pairs was less than 60%, with only 30.09% similarity between CaLACS6 and CaLACS7.
Research has demonstrated that plant acyl activators possess two highly conserved domains. The (T/S) (S/G) G (T/S) (T/E) GNPKG sequence is represented by domain 1, and domain 2 is composed of 36–37 amino acids and features a conserved arginine (R), represented by the pattern ‘TGDxxxxxGxxxxhx [DG] RxxxxhxxxxGxxhxx [EK] hE’, where ‘x’ denotes any amino acid and ‘h’ signifies a hydrophobic residue. The alignment of AtLACS sequences in Arabidopsis and CaLACS sequences in pepper reveals that all LACS proteins contain these two conserved domains (Figure 1).

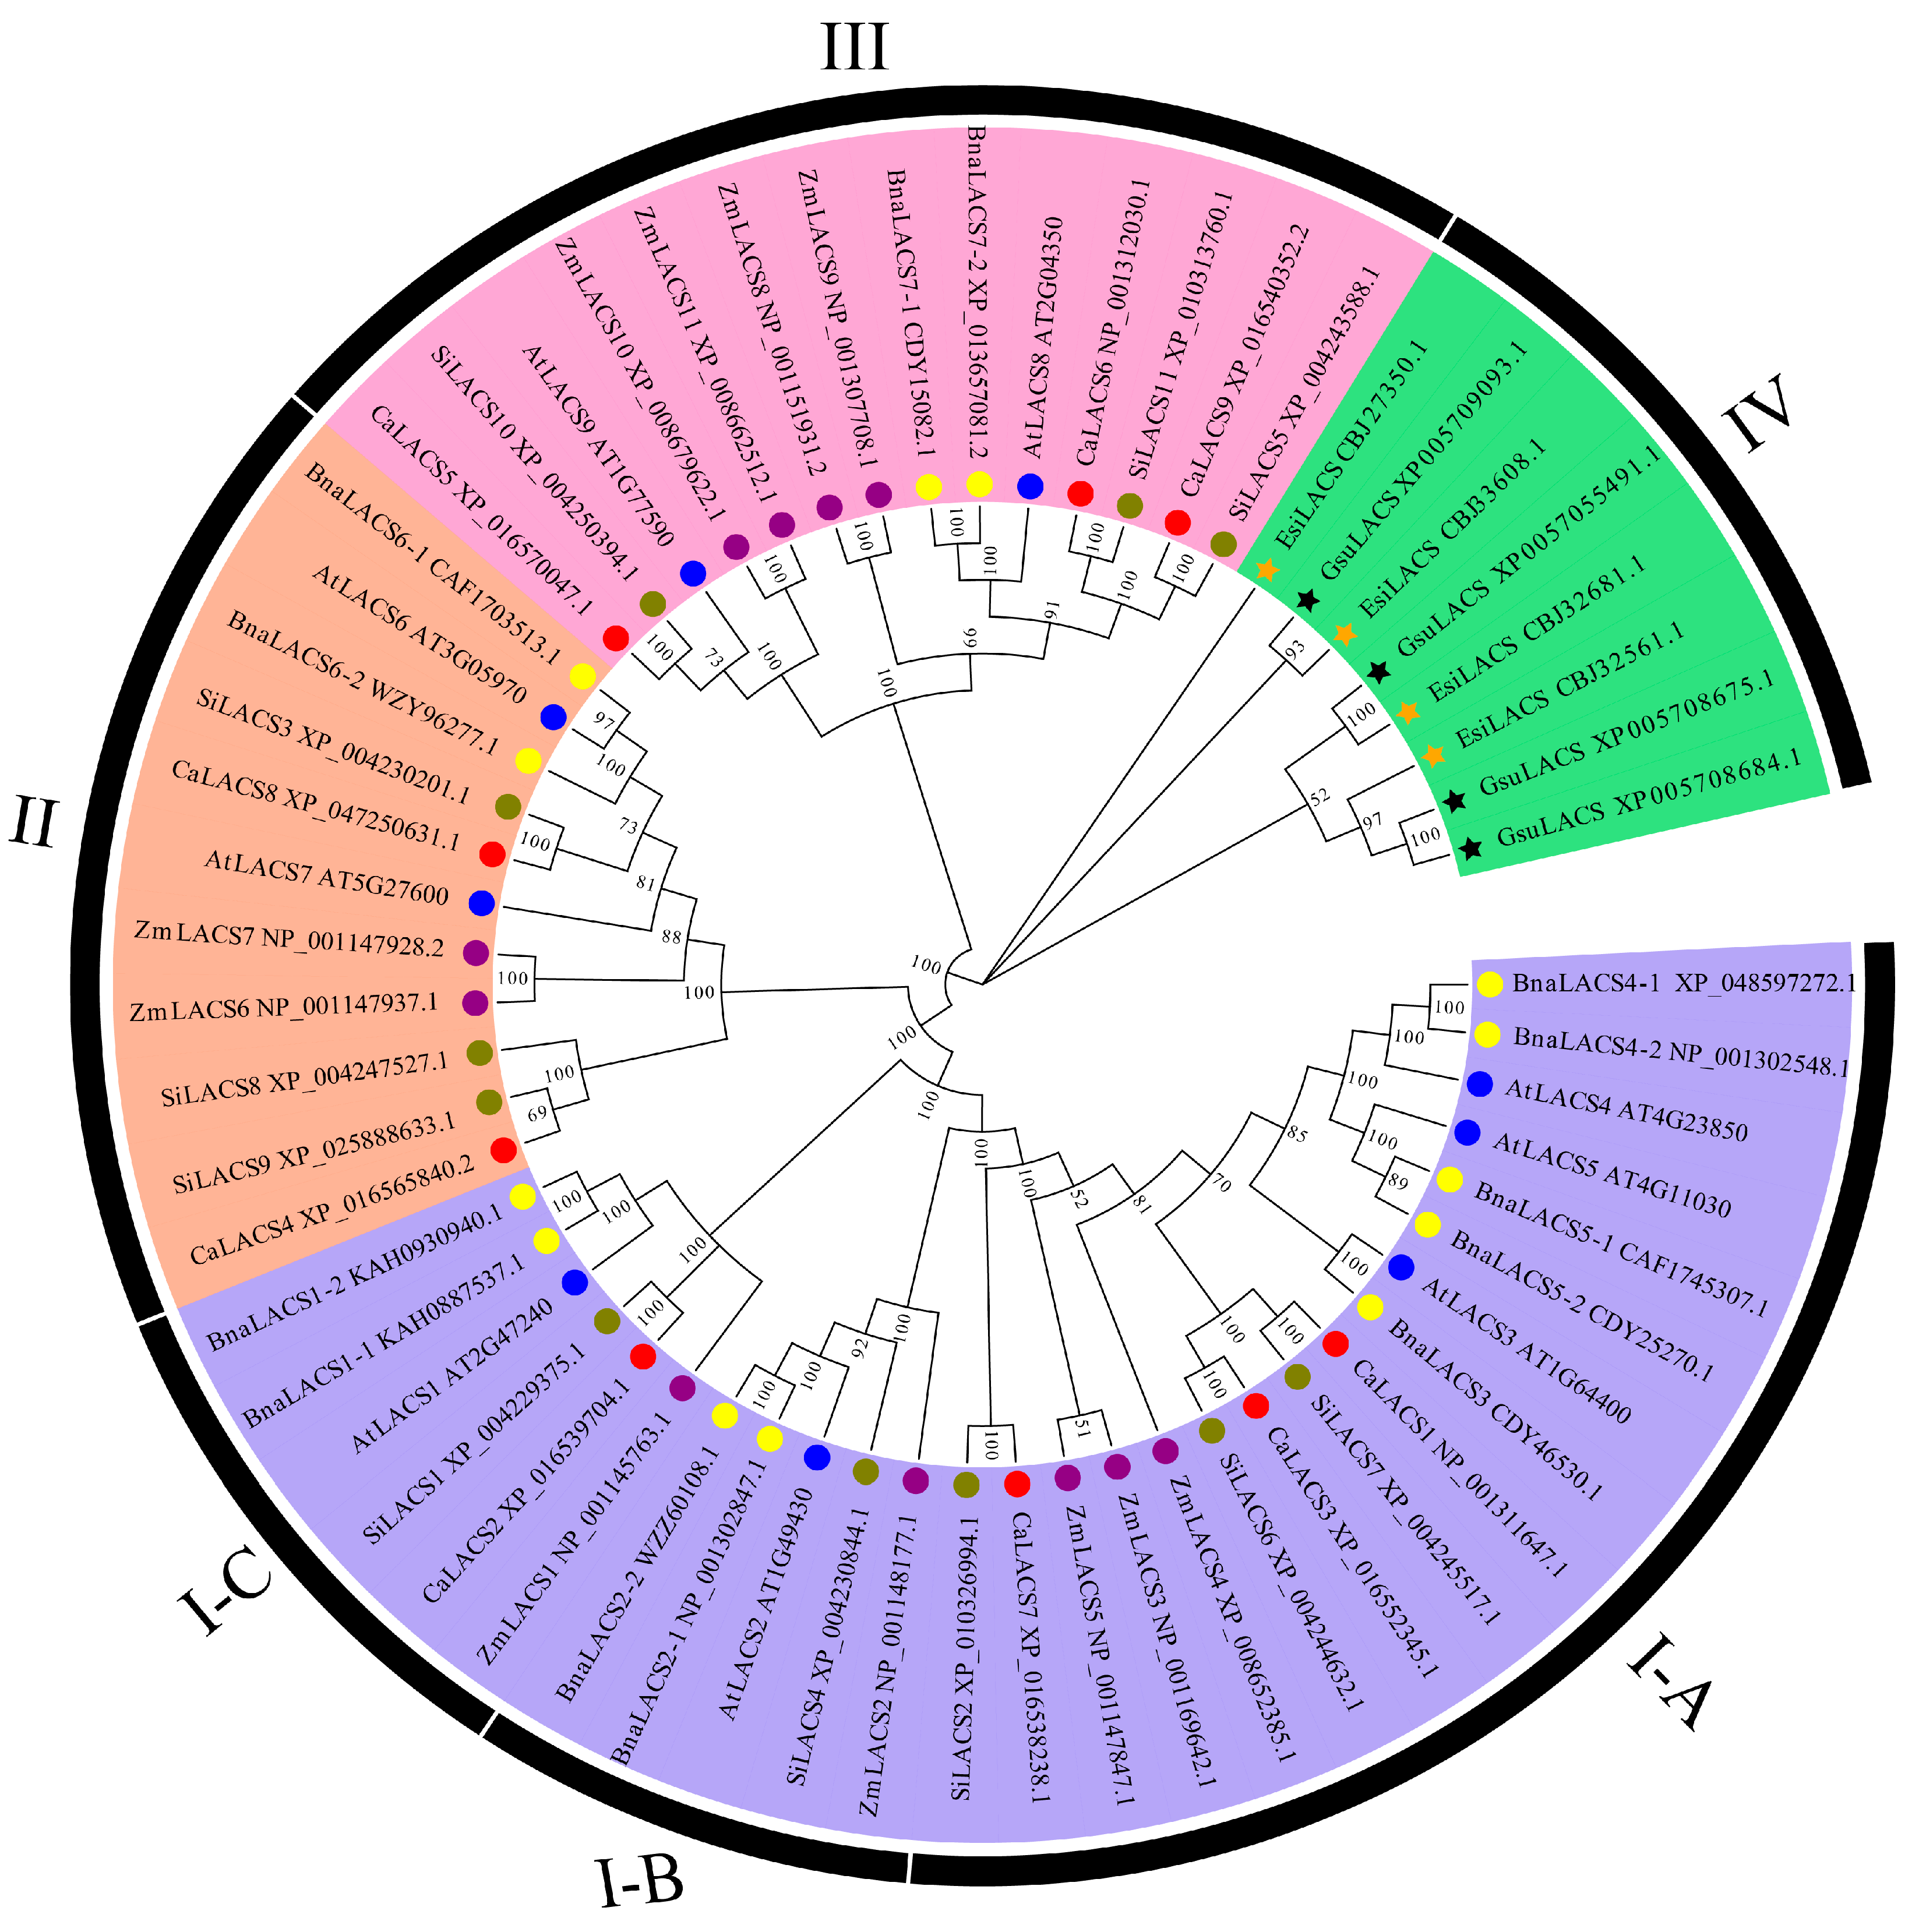
3.3. Phylogenetic Analysis of CaLACS Members in Pepper

To investigate the evolutionary relationships among CaLACS proteins, a phylogenetic tree was constructed using 61 LACS proteins from various species, including pepper, Arabidopsis thaliana, tomato, corn, and rapeseed (Figure 2). The results indicated that LACS proteins from seven species could be clustered into subfamilies I, II, III, and IV. LACS proteins from lower plant algae were grouped in subfamily IV, while those from higher plants were distributed across subfamilies I to III. Notably, subfamily I can be further divided into three subfamilies, as follows: I-A, I-B, and I-C. The proteins CaLACS1, CaLACS3, and CaLACS7 are found in subfamily I-A, CaLACS2 is located in subfamily I-C, and subfamily I-B does not contain any CaLACS members. Subfamily II includes two pepper LACS members, CaLACS4 and CaLACS8. Finally, subfamily III comprises CaLACS5, CaLACS6, and CaLACS9. These findings suggest that the LACS proteins in pepper share a strong phylogenetic relationship with those in tomato and Arabidopsis, indicating similar functional roles.

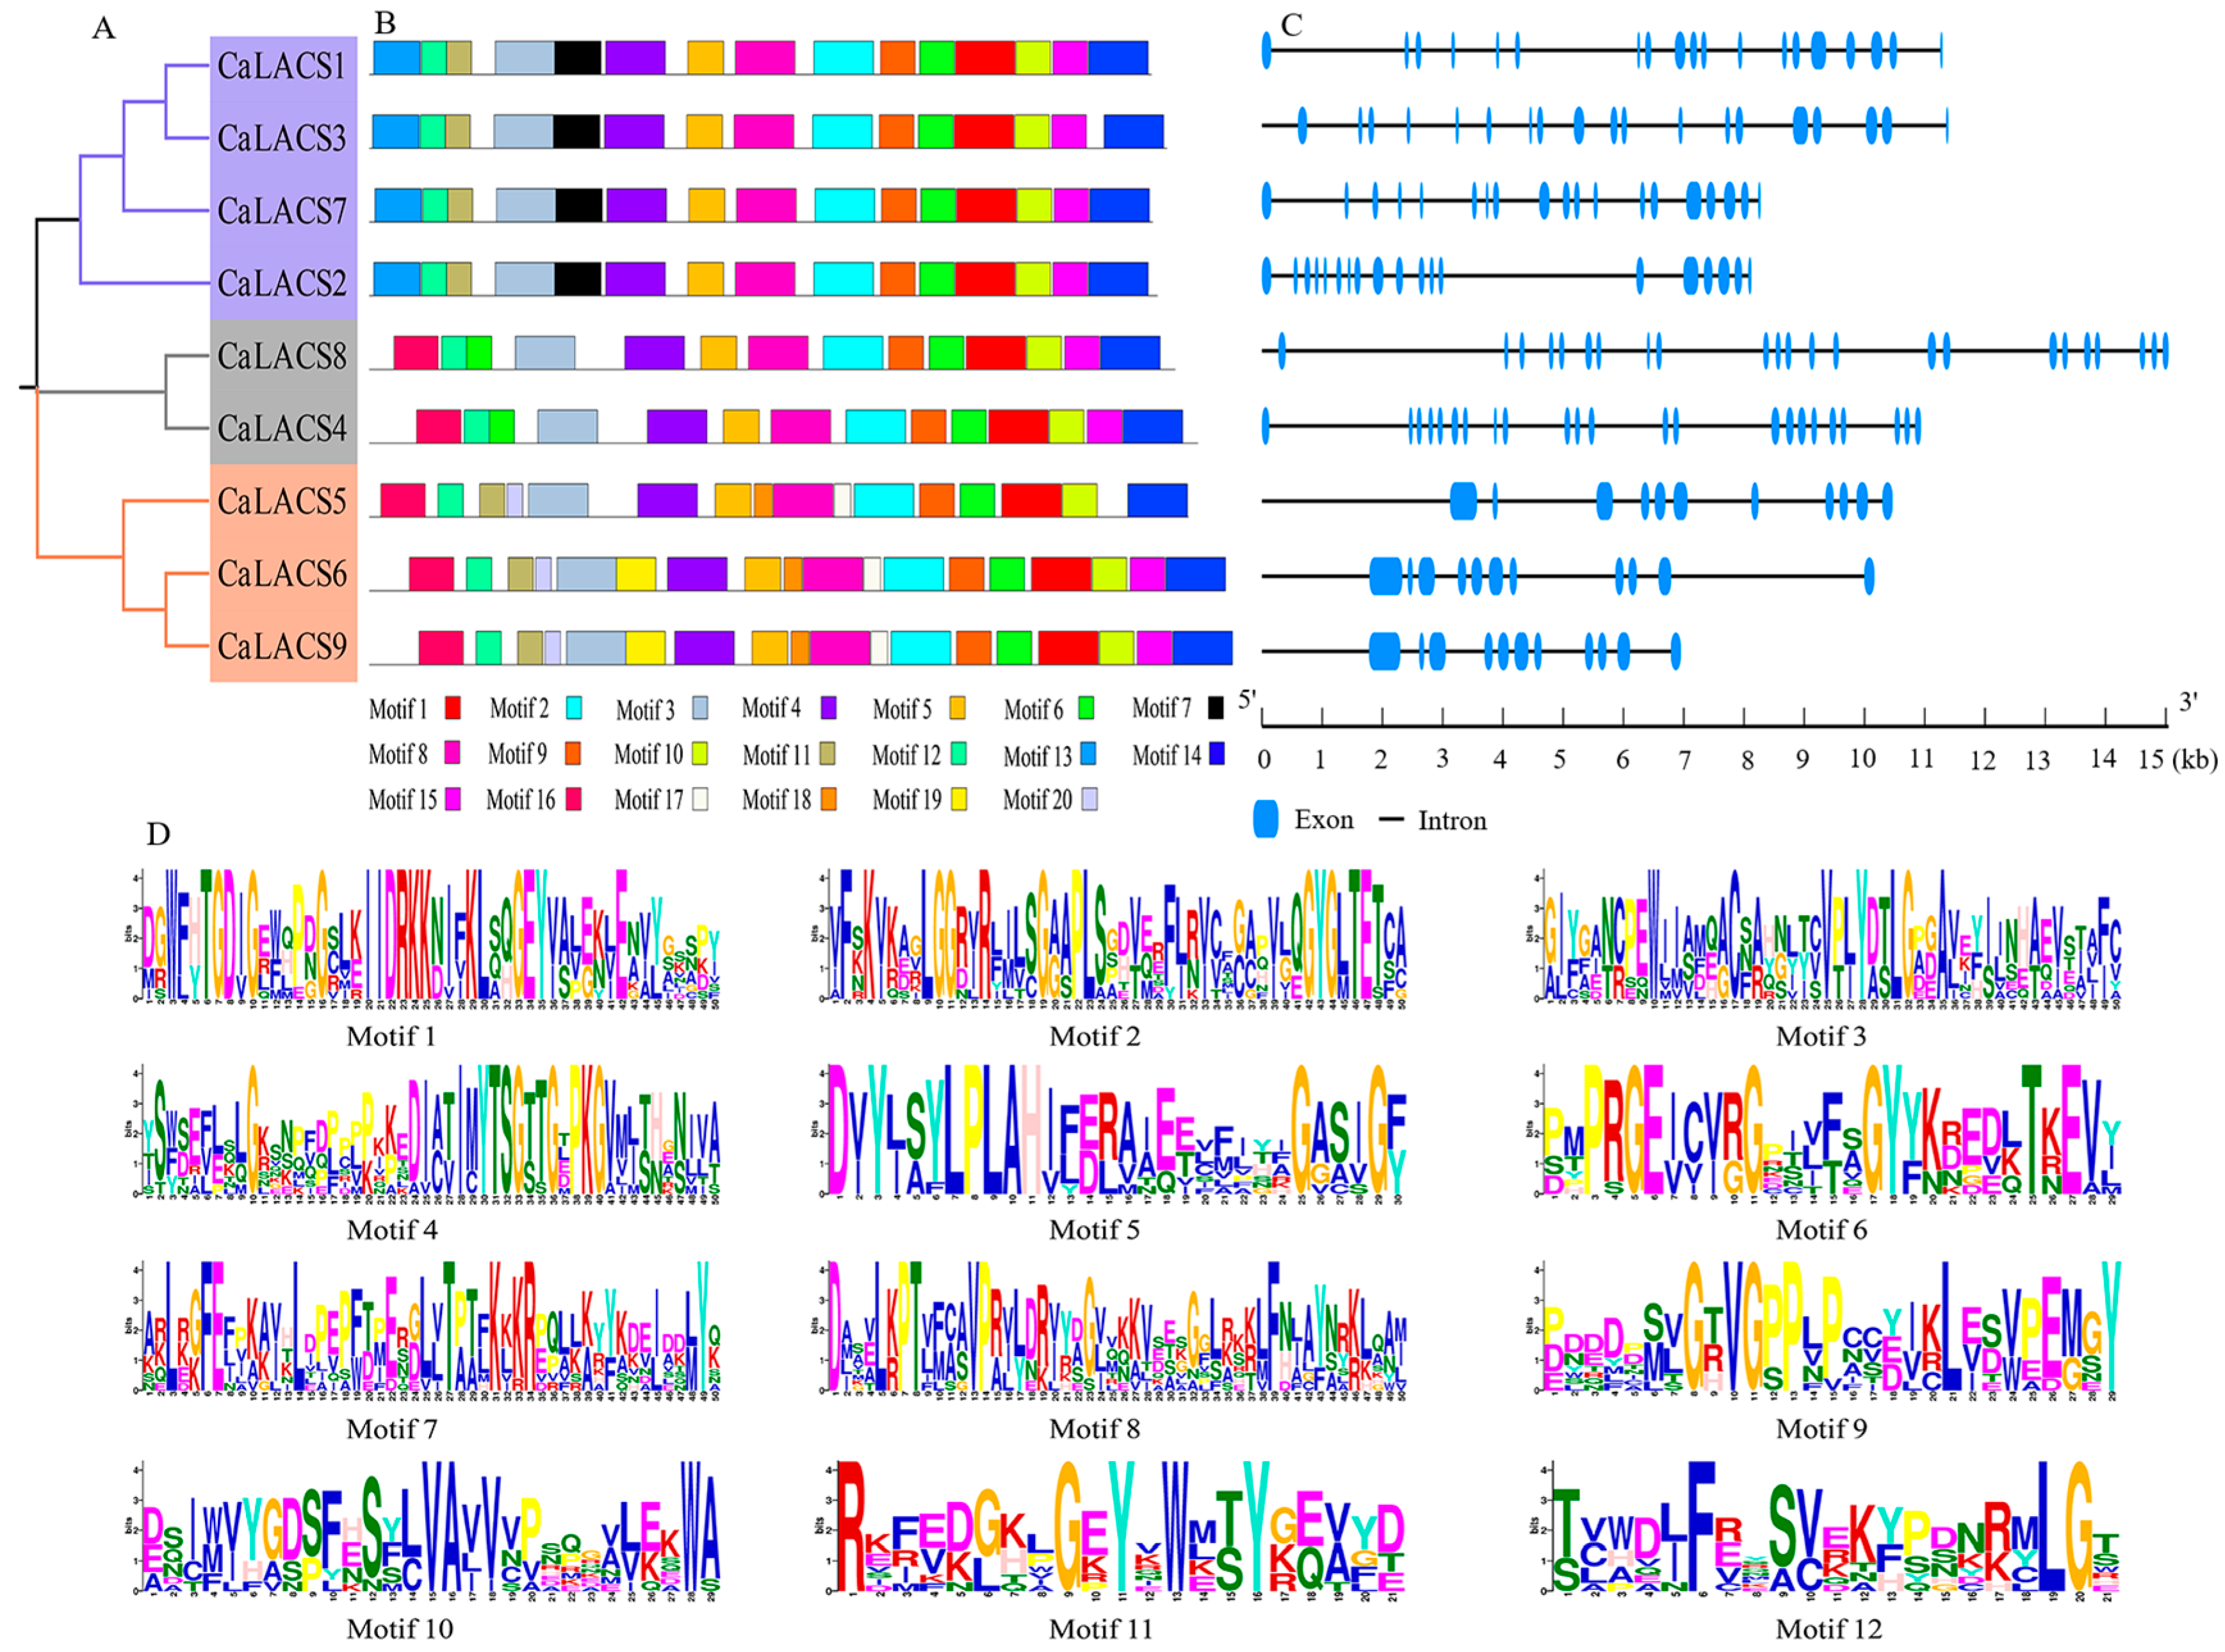
3.4. Motif and Structure of CaLACS Members in Pepper

Given that protein domains and gene structures play a crucial role in the evolution of gene families, we analyzed the phylogenetic relationships (Figure 3A), conserved motifs (Figure 3B,D and Figure S2), and gene structures (Figure 3C) of CaLACS members in pepper. According to the evaluation criteria of <1 × 10⁻³, a total of 20 motifs were identified, among which motif 1 to motif 12 are present in all CaLACS proteins, and these conserved motifs occupy similar positions across all CaLACS proteins (Figure 3D). Additionally, some unique motifs are found exclusively in certain subfamilies, such as motif 13 and motif 14 in subfamily I, motif 16 in subfamily II and III, motifs 17, 18, and 20 in subfamily III, and motif 19 in subfamily II only (Figure 3B). The analysis of gene structure reveals that the LACS gene architecture across each subfamily is fundamentally similar (Figure 3C). All CaLACS genes in subfamily I consist of 19 exons and 18 to 19 introns, with CaLACS1 and CaLACS3 exhibiting comparable lengths, as well as CaLACS7 and CaLACS2. In subfamily II, there are notable differences in the lengths of the CaLACS8 and CaLACS4 genes; however, both contain 23 exons. In subfamily III, the genes CaLACS5, CaLACS6, and CaLACS9 each possess nine exons and eight introns. Overall, LACS genes within the same subfamily exhibit similar structures and conserved motif distributions, suggesting that LACS proteins contain highly conserved amino acid residues and that members within the same cluster may fulfill analogous roles.

3.5. Cis-Element Analysis of the CaLACS Promoter in Pepper

To investigate the critical role of CaLACS genes in stress and hormone signaling transduction, we utilized PlantCARE to analyze the promoter region of the target gene, specifically the pre-2000 bp segment. We identified 28 hypothesized cis-acting elements, which were categorized into four groups: abiotic/biotic stress elements, hormone-responsive elements, photoresponsive elements, and growth/development-related elements (Figure 4, Table S1). For abiotic/biotic stress, all CaLACS genes contain MYB-acting elements. Additionally, anaerobic induction elements (ARE) and MYC elements are present in most CaLACS genes, except the ARE element, which was not identified in CaLACS1 and CaLACS4, and the MYC element, which was not identified in CaLACS1 and CaLACS3. In addition, other cis-acting elements are specific to CaLACS genes. For instance, the low-temperature responsive element (LTR) is found exclusively in the CaLACS6, CaLACS7, and CaLACS9 genes. The drought-responsive element (MBS) is present in the CaLACS5, CaLACS6, and CaLACS8 genes, while the MRE element is unique to CaLACS3. Regarding hormone-responsive elements, nearly all CaLACS genes contain abscisic acid-responsive elements (ABRE and AAGAA motif), jasmonate ketone-responsive elements (TGACG motif), and methyl jasmonate-responsive elements (CGTCA motif). The auxin-responsive element is present only in CaLACS1, CaLACS2, and CaLACS5. However, the gibberellin-responsive element (P-box), GARE-motif, and the auxin-responsive element (AuxRR core) are found solely in the CaLACS8, CaLACS2 CaLACS7 genes, respectively. Finally, photoresponsive and developmental elements are relatively abundant across all CaLACS genes, except the GARE motif, Gap box, and GA motif, which are only present in the CaLACS2, CaLACS7, and CaLACS8 genes, respectively (Figure 4B).

3.6. Collinearity Analysis and Selective Pressure of CaLACS Genes

To investigate the evolutionary relationships of CaLACS genes among different species, a collinearity analysis was conducted on pepper and Arabidopsis using TBtools (Version 2.119) software. The results showed that the LACS genes between pepper and Arabidopsis exhibit high homology, with twelve collinear gene pairs identified between six CaLACS genes and five AtLACS genes (Figure 5). Specifically, the CaLACS1, CaLACS3, and CaLACS7 genes from the pepper subfamily I-A are collinear with the AtLACS genes (AtLACS2, AtLACS4, AtLACS5) of Arabidopsis, while the CaLACS2 and CaLACS4 genes are collinear with AtLACS1, respectively. Additionally, CaLACS8 has a collinear relationship with AtLACS8. Furthermore, there are two fragment replication gene pairs among the nine CaLACS genes of pepper, with CaLACS1 being collinear with CaLACS3 and CaLACS7, respectively.
The ratio of non-synonymous substitution to synonymous substitutions (Ka/Ks) is a crucial indicator for assessing selection pressure and the timing of gene duplication. We calculated the Ka/Ks values for twelve pairs of collinear genes and two fragment replication gene pairs using KaKs_Calculator 2.0 software (Table 2). The results indicated that the Ka/Ks values for all gene pairs were less than 0.3, except for certain gene pairs (CaLACS2/AtLACS1, -4/-1, -7/-2, -7/-4, -8/-8) for which calculations could not be performed. The divergence time of LACS in pepper and Arabidopsis ranges from 119.75 million years ago (Mya) to 194.18 Mya, while the duplication time of CaLACS1/CaLACS3 in pepper is estimated to be 44.59 Mya, and the duplication time of CaLACS1/CaLACS3 occurs at 140.76 Mya.

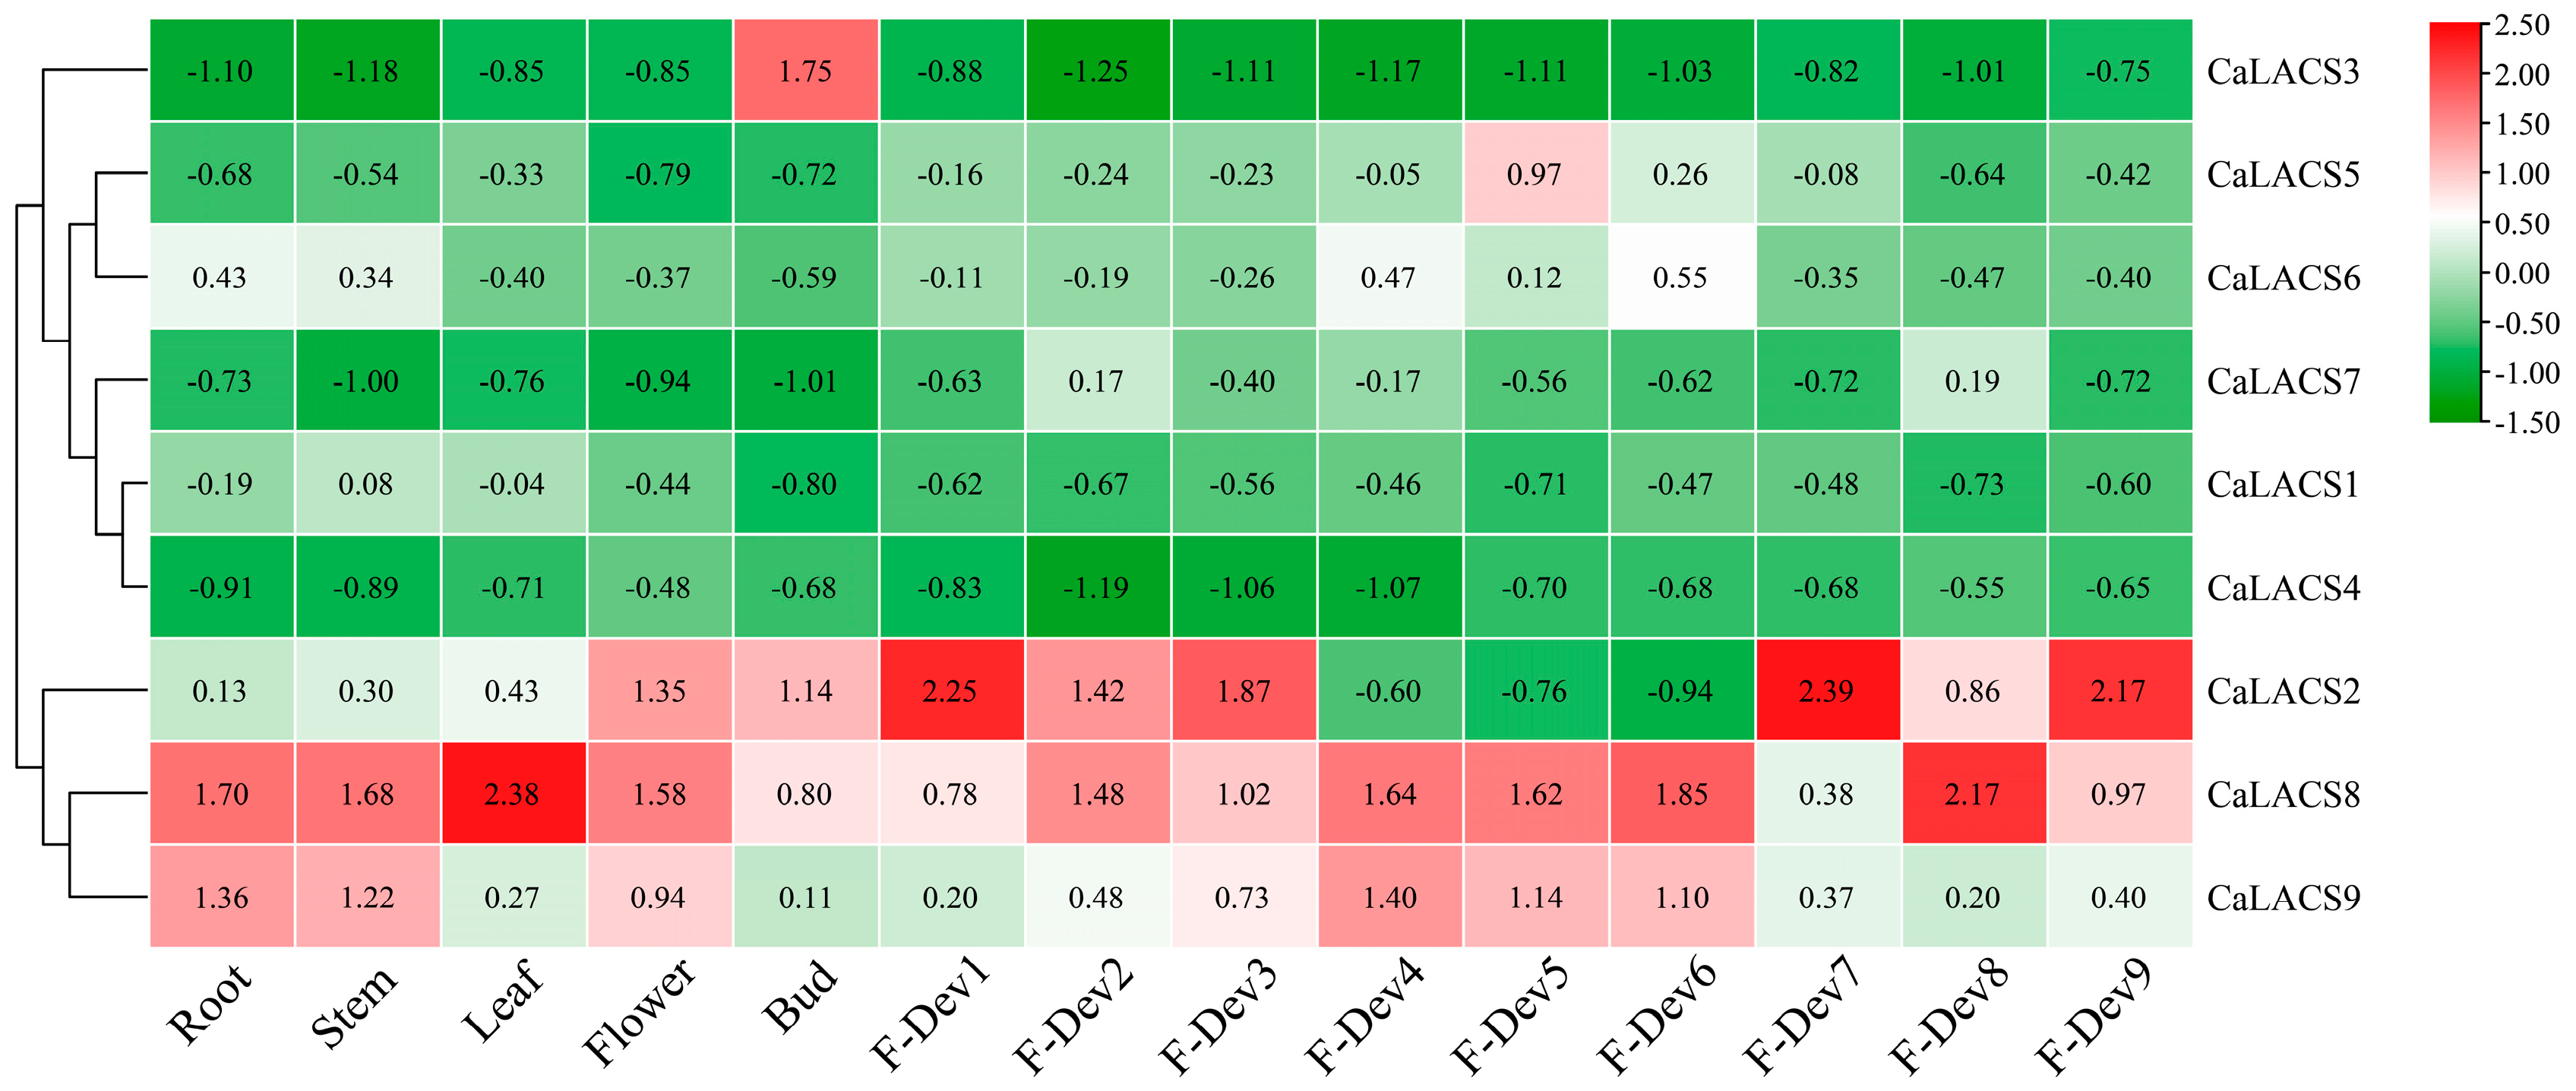
3.7. Expression of CaLACS Gene in Different Tissues

The expression of CaLACS members in roots, stems, leaves, flowers, buds, and fruits at different developmental stages was analyzed using RNA-seq data from the pepper variety ‘Zunla-1’ available on the NCBI website (Figure 6). The analysis revealed that CaLACS3, CaLACS5, CaLACS6, CaLACS7, CaLACS1, and CaLACS4 cluster together. Notably, the CaLACS3 gene is exclusively expressed in flower buds, while the CaLACS5 gene is expressed during the green ripening phase of fruits. In contrast, CaLACS1, CaLACS4, CaLACS6, and CaLACS7 exhibit lower expression levels across various tissues of the pepper plant. The expression levels of CaLACS2, CaLACS8, and CaLACS9 are relatively similar. It is evident that CaLACS8 shows comparatively high in all tissues, particularly in flowers, flower buds, and both immature and mature fruits, while exhibiting lower expression during the green maturity and color transformation stages. Conversely, the transcription level of CaLACS9 is elevated in roots, stems, flowers, and during the green maturity and color transformation stages, but is reduced in the mature stage.

3.8. Expression Analysis of CaLACS Genes Under Different Phytohormone and Stresses Treatments

To further elucidate the expression patterns of pepper LACS under plant hormone and abiotic stress conditions, we analyzed the transcriptome data from the NCBI database. The expression of CaLACS1 was upregulated following treatment with ABA, MeJA, and ET after 24 h. Similarly, the expression of CaLACS9 was upregulated after 24 h of ABA, MeJA, and SA treatment. The expression levels of CaLACS4 and CaLACS6 were significantly upregulated after 6 and 12 h of SA treatment, while CaLACS3 was only upregulated after 3 h of MeJA treatment. Compared to the control levels, there were no significant differences in the expression levels of CaLACS2 and CaLACS7 under phytohormone treatments, except for CaLACS2 after 12 h of MeJA treatment (Figure 7A). Additionally, the expression level of CaLACS4 was upregulated under heat stress (at 3 and 6 h), drought stress (at 24 h), and salt stress (at 24 h). CaLACS6 and CaLACS9 showed significant increases during the later phases of cold treatment (at 24 and 72 h), while CaLACS1 was upregulated at 72 h under cold and salt stress, with no significant differences observed under heat stress. The CaLACS2 and CaLACS8 genes exhibited an increasing and then decreasing trend under heat, drought, and salt stress, with peaks occurring at 6 or 12 h. The expression level of CaLACS3 showed no significant differences under abiotic stress treatment (Figure 7B).

3.9. Influence of CaLACS6 and CaLACS9 Silenced Pepper Plants to Cold Stress

It is speculated that CaLACS6 and CaLACS9 (CaLACS6/9) may play important roles in response to cold stress, as indicated by cis-elements and RNA-seq data analysis. Subsequently, we evaluated the expression pattern of CaLACS6/9 using RT-qPCR. The results demonstrated that the transcription levels of CaLACS6/9 were significantly elevated under cold stress, with peak expression levels observed at 6 h and 12 h, respectively (Figure S3).
The phytoene desaturase (PDS) gene is commonly utilized as a positive control to evaluate the reliability of VIGS technology and the duration of target gene silencing. In this study, the correctness of the recombinant vector was validated through double enzyme digestion (Figure S4). Subsequently, the transient transformation of PDS using TRV2 for three weeks resulted in the whitening of pepper seedlings, whereas TRV2:CaLACS6, TRV2:CaLACS9, and TRV2:00 did not exhibit any whitening (Figure S5A). Compared to the control, the transcription levels in TRV2:LACS6 and TRV2:LACS9 plants decreased by 67.01% and 70.31%, respectively, thereby confirming the reliability of the subsequent experiments (Figure S5B).
Under normal temperature conditions, there were no significant phenotypic differences between TRV2:CaLACS6/9 plants compared to the control. However, after cold treatment, the leaves of TRV2:CaLACS6/9 plants exhibited cold damage phenotypes, such as drooping and wilting (Figure 8A). We utilized 3,3-diaminobenzidine (DAB) and nitroblue tetrazolium (NBT) staining to detect the accumulation of hydrogen peroxide (H2O2) and superoxide anion (O2•−) in the plant leaves. Compared to TRV2:00 plants, the accumulation of reactive oxygen species (ROS) was significantly higher under cold stress (Figure 8B). Further quantitative analysis confirmed that low temperatures resulted in increased oxidative damage in TRV2:CaLACS6/9 plants (Figure 8C,D). In addition, under cold stress, the activities of the enzymes superoxide dismutase (SOD), peroxidase (POD), and catalase (CAT) in TRV2:CaLACS6/9 plants were significantly lower than those in the control plants. Conversely, malondialdehyde (MDA) accumulation was significantly higher in the TRV2:CaLACS6/9 plants compared to the control group (Figure 8E–H). These findings suggest that silencing TRV2:CaLACS6/9 diminishes antioxidant capacity, elevates reactive oxygen species levels, and increases the sensitivity of pepper plants to cold stress.
To further elucidate the molecular mechanisms underlying the response of pepper plants to cold stress, we employed RT-qPCR to analyze the expression levels of four cold-regulated (COR) genes (Figure 9A–D) and three ROS-related genes (Figure 9E–G). Under control conditions, no significant differences were observed in the expression of these genes between TRV2:00 and TRV2:CaLACS6/9 plants. However, under low-temperature conditions, the transcription levels of genes in the silenced plants were significantly downregulated. Specifically, the expression of four COR genes was reduced by 25.81% to 78.60% compared to the control, while the expression of three ROS-related genes decreased by 3.65% to 44.89%. These findings suggest that the CaLACS6/9 gene in pepper plays a crucial role in responding to cold stress by modulating the transcription levels of ROS-related and COR genes.

4. Discussion

The long-chain acyl-CoA synthetase (LACS) enzyme plays a crucial role in the synthesis and metabolism of fatty acids by catalyzing the conversion of free fatty acids into acyl-CoA, thereby activating long-chain fatty acids for degradation. Additionally, the genes that encode LACS proteins are involved in various physiological functions, including pollen formation, seed germination, and responses to abiotic stress [4,10,16,21,22,23]. To date, the LACS gene is represented by a limited family of plants, including cotton [12], rapeseed [19], apple [9], maize [10,13], and Arabidopsis [14,15,16]. However, research on LACS in pepper has not yet been conducted. In this study, a total of nine CaLACS members were identified in pepper through alignment, identification, and redundancy removal using LACS sequences from Arabidopsis and maize. These genes encode proteins with amino acid counts ranging from 658 to 726 and molecular weights ranging from 73.56 kDa to 79.84 kDa. The differences in the number of amino acids and molecular weights among the protein members are relatively small. Additionally, the multiple sequence alignment between CaLACS and AtLACS proteins, along with the presence of two conserved AMP domains, indicates that the LACS protein sequence is highly conserved.
The evolutionary analysis of LACS proteins indicates that the LACS family proteins can be categorized into four subfamilies: I (I-A, I-B, and I-C), II, III, and IV. In comparison to the subfamily IV, pepper LACS proteins are predominantly found in the I (I-A and I-C), II, and III subfamilies (Figure 2). It is evident that dicotyledonous plants or crops within the same family cluster together, while moss species are exclusively grouped in the subfamily IV. This clustering suggests that the differentiation of LACS proteins occurred prior to the emergence of moss species, which aligns with previous research findings [9]. Furthermore, members of the same subfamily of pepper LACS exhibit conserved gene structures. Analysis demonstrated that the CaLACS members of the subfamily I contain 19 introns (Figure 3C), while the subfamily II members possess 23 introns, and the subfamily III contains 11 introns. These findings are consistent with results observed in apples [9], maize [10], and cotton [12]. Overall, these results suggest that LACS genes are highly conserved throughout evolution and may share similar functions.
The collinearity analysis between Arabidopsis and pepper revealed significant conserved loci within the LACS genes (Figure 5). Notably, CaLACS1, CaLACS3, and CaLACS7 all demonstrate collinearity with Arabidopsis AtLACS2, AtLACS4, and AtLACS5, further underscoring the high degree of conservation among LACS genes. The ratio of Ka/Ks serves as a method for analyzing positive and negative selection of protein sequences across different species [46]. In this study, the calculation of the Ka/Ks ratio for replicated genes revealed that among the 12 pairs of collinear gene pairs between pepper and Arabidopsis, 5 pairs could not yield a Ka/Ks ratio (Table 2). The remaining collinearity comparison rates were all less than 1, indicating that the LACS family has undergone strong purifying selection, with differentiation times ranging from 119.75 Mya to 196.18 Mya. Within the collinearity of pepper, the differentiation times for CaLACS1, CaLACS3, and CaLACS7 are 44.59 Mya and 140.76 Mya, respectively. Interestingly, although these three genes belong to the same subfamily, their differentiation times are significantly different, suggesting that they may have distinct regulatory roles in the evolutionary process. However, further research is necessary to confirm this hypothesis.
We predict cis-elements through the utilization of conservation of the CaLACS genes at the transcriptional regulatory level. The results indicate that the promoters of the CaLACS genes are abundant in light-responsive and plant growth and development elements, suggesting that LACS family genes may play a significant role in the normal growth and development of plants. It is noteworthy that the promoter of LACS exhibits a high frequency of response to plant hormones and biotic/abiotic stress elements, indicating that LACS family genes have a function in plant hormone signal transduction and abiotic response.
It has been reported that overexpression of MdLACS1 in apple callus tissue enhances ABA tolerance [9]; Arabidopsis LACS4 modifies IAA content by regulating IBA enzyme activity. Furthermore, Arabidopsis AtLACS1 and AtLACS2 [14], peony PoLACS4 [21], sunflower LACS1 and LACS3 [18], and soybean GmLACS2 and GmLACS3 [47] are all implicated in the response to drought stress. The GhLACS25 gene in cotton is involved in salt stress regulation [11]; MdLACS2 and MdLACS4 are involved in salt stress [9], and in maize, the ZmLACS9 gene is involved in regulating heat stress [10]. In this study, we analyzed the transcriptome data from the public database. The analysis showed that under SA and ET treatments, the expression levels of CaLACS4, CaLACS6, and CaLACS9 were significantly increased, while the transcription levels of CaLACS2, CaLACS5, and CaLACS7 were significantly down-regulated. CaLACS1 and CaLACS9 exhibited significant up-regulation in the late stage (24 h) of ABA and MeJA treatment. This indicates that CaLACSs play a role in the response to plant hormone signals; however, their specific functions require further research. Additionally, studies have shown that pepper CaLACSs respond to abiotic stress by increasing the transcription levels of CaLACS1 and CaLACS4 to varying degrees during the later stages of drought and salt stress treatment. Heat stress also increased the expression of CaLACS2 and CaLACS5. Notably, we observed that CaLACS6 and CaLACS9 were induced by cold stress. RT-qPCR analysis revealed that CaLACS6 and CaLACS9 showed the same trend under cold stress, indicating that the CaLACS genes may be involved in regulating the cold tolerance of pepper.
To this end, we used VIGS to investigate the role of CaLACS6 and CaLACS9 in regulating the cold tolerance of pepper. During the experiment, TRV2:PDS plants exhibited an albino phenotype, indicating successful silencing of the PDS gene (Figure S5A). Furthermore, RT-qPCR analysis revealed a significant decrease in the expression of the target gene after silencing, confirming the reliability of the experiment. The physiological indicators of plants clearly demonstrate their cold tolerance. MDA serves as an indicator to measure the degree of membrane lipid peroxidation [48,49]. H2O2 and O2•−, the primary components of ROS, are inevitable byproducts of aerobic metabolism. Research has demonstrated that small quantities of ROS can function as signaling molecules, interact with Ca2+ and phosphatidic acids, and participate in stress response [50,51,52]. However, a substantial amount of ROS, as a toxic substance, results in functional impairment and, potentially, cell death in plants [53]. In the present study, the accumulation of H2O2 and O2•− in TRV2:CaLACS6/9 plants was greater than that in TRV2:00 plants, which reduced cold tolerance. This was corroborated by the increase in Pro and MDA contents (Figure 8C,D). To eliminate excessive ROS during environmental stress, plants have evolved antioxidant defense systems, including antioxidant enzymes SOD, POD, and CAT [54,55]. Antioxidant enzyme activity positively correlated with cold tolerance. COR genes such as CaCBF1a, CaCBF1b, CaKIN, and CaCOR47 contain one or more cis-elements regulated by C-repeat binding factors [56,57]. After cold treatment, the SOD, POD, and CAT activities of TRV2:CaLACS6/9 silenced plants were lower than those of TRV2:00 plants, which is consistent with the higher expression levels of COR-related genes and ROS-related genes (Figure 9). It can be inferred that silencing the TRV2:CaLACS6/9 gene reduces the capacity of pepper plants to mitigate reactive oxygen species damage and the expression of related genes, rendering them more susceptible to the effects of cold stress. However, it remains unclear how TRV2:LACS6 and TRV2:LACS9 participate in the cold resistance regulatory network to enhance the cold resistance of pepper, and further research is warranted.

5. Conclusions

In this study, we conducted a comprehensive analysis of the LACS gene family in pepper, identifying nine CaLACS genes, and named CaLACS1-CaLACS9 based on their chromosomal positions. These genes are distributed in families I-A, I-C, II, and III. Members of the same subfamily exhibited conserved motifs and structural domains. The expansion and evolution of the CaLACS family are driven by purifying selection. Promoters of CaLACS genes were found to be enriched with cis-elements related to abiotic/biotic stress, hormone-responsive, light response, and development. Expression analysis showed that the CaLACS genes have tissue expression specificity, and CaLACS6 and CaLACS9 may respond to cold stress. Subsequently, functional validation of these two genes was conducted using VIGS technology. This study comprehensively characterized the LACS gene in pepper for the first time and provided suitable candidate genes for cultivating cold tolerant pepper varieties.

Supplementary Materials

The following supporting information can be downloaded at: https://www.mdpi.com/article/10.3390/agronomy15040970/s1, Figure S1: Chromosomal distribution of CaLACS genes in pepper; Figure S2: Specific conserved motifs of the CALACS proteins; Figure S3: Expression profiling of CaLACS6 and CaLACS9 in response to cold stress by RT-qPCR; Figure S4: The recombinant vector double enzyme digestion of the silenced fragments of CaLACS6 and CaLACS9 in pepper; Figure S5: Silencing efficiency of CaLACS expression in pepper seedlings by the VIGS technique; Table S1: Information of Cis-elements in promoters of pepper CaLACS genes; Table S2: Primers used for the VIGS and RT-qPCR in pepper.

Author Contributions

Conceptualization, J.Z., Q.Y. and H.L; supervision, Q.Y. and H.L; methodology, D.W., Q.Y. and H.L; software, D.W., X.C. and Q.Y.; guidance for experimental, Q.Y.; test sample processing and collection, Y.C., J.H. and D.W.; experimental operation, Y.C. and J.H.; writing—original draft preparation, J.Z., Y.J. and H.L.; writing—review and editing, J.Z., Q.Y. and H.L.; funding acquisition, J.Z. All authors have read and agreed to the published version of the manuscript.

Funding

This work was supported by the Growth of Young Scientific and Technological Talents of Guizhou Educational Commission (Qian Jiaoji [2024]233), the Qiandongnan Science and Technology Plan Project (Qiandongnan kehejichu [2024]0009), the Specialized Fund for the Doctoral of Kaili University (grant No. BS20240213), the Key Laboratory of the Department of Education of Guizhou Province (No. Qianjiaoji [2022]053), and Guizhou Key Laboratory of Molecular Breeding for Characteristic Horticultural Crops (No. Qiankehepingtai [2025]027).

Data Availability Statement

The original contributions presented in this study are included in the article. Further inquiries can be directed to the corresponding authors.

Conflicts of Interest

The authors declare no conflicts of interest.

References

  1. Lü, S.Y.; Song, T.; Kosma, D.K.; Parsons, E.P.; Rowland, O.; Jenks, M.A. Arabidopsis CER8 encodes Long-Chain Acyl-Coa SynThetase 1 (LACS1) that has overlapping functions with LACS2 in plant wax and cutin synthesis. Plant J. 2009, 59, 553–564. [Google Scholar] [CrossRef] [PubMed]
  2. Shockey, J.M.; Fulda, M.S.; Browse, J.A. Arabidopsis contains nine long-chain acyl-coenzyme a synthetase genes that participate in fatty acid and glycerolipid metabolism. Plant Physiol. 2002, 129, 1710–1722. [Google Scholar] [CrossRef] [PubMed]
  3. Tonon, T.; Qing, R.W.; Harvey, D.; Li, Y.; Larson, T.R.; Graham, I.A. Identification of a long-chain polyunsaturated fatty acid acyl-Coenzyme a synthetase from the Diatom Thalassiosira pseudonana. Plant Physiol. 2005, 138, 402–408. [Google Scholar] [CrossRef]
  4. Schnurr, J.; Shochey, J.; Browse, J. The Acyl-CoA synthetase encoded by LACS2 is essential for normal cuticle development in Arabidopsis. Plant Cell 2004, 16, 629–642. [Google Scholar] [CrossRef] [PubMed]
  5. Fulda, M.; Schnurr, J.; Abbadi, A.; Heinz, E.; Browse, J. Peroxisomal acyl-CoA synthetase activity is essential for seedling development in Arabidopsis thaliana. Plant Cell 2004, 16, 394–405. [Google Scholar] [CrossRef]
  6. Kosma, D.K.; Bourdenx, B.; Bernard, A.; Parsons, E.P.; Lü, S.; Joubès, J.; Jenks, M.A. The impact of water deficiency on leaf cuticle lipids of Arabidopsis. Plant Physiol. 2009, 151, 1918–1929. [Google Scholar] [CrossRef]
  7. Liu, Y.J.; Liu, Z.H.; Zhang, H.S.; Yuan, S.H.; Li, Y.M.; Zhang, T.B.; Bai, J.F.; Zhang, L.P. Genome-wide identification and expression profiling analysis of the long-chain acyl-CoA synthetases reveal their potential roles in wheat male fertility. Int. J. Mol. Sci. 2022, 23, 11942. [Google Scholar] [CrossRef]
  8. Xiao, Z.C.; Li, N.N.; Wang, S.F.; Sun, J.J.; Zhang, L.Y.; Zhang, C.; Yang, H.; Zhao, H.Y.; Yang, B.; Wei, L.J.; et al. Genome-wide identification and comparative expression profile analysis of the long-chain acyl-CoA synthetase (LACS) gene family in two different oil content cultivars of brassica napus. Biochem. Genet. 2019, 57, 781–800. [Google Scholar] [CrossRef]
  9. Zhang, C.L.; Mao, K.; Zhou, L.J.; Wang, G.L.; Zhang, Y.L.; Li, Y.Y.; Hao, Y.J. Genome-wide identification and characterization of apple long-chain Acyl-CoA synthetases and expression analysis under different stresses. Plant Physiol. Biochem. 2018, 132, 320–332. [Google Scholar] [CrossRef]
  10. Wang, X.C.; Tian, X.; Zhang, H.R.; Li, H.T.; Zhang, S.D.; Li, H.; Zhu, J.T. Genome-wide analysis of the maize LACS gene family and functional characterization of the ZmLACS9 responses to heat stress. Plant Stress 2023, 10, 100271. [Google Scholar] [CrossRef]
  11. Xu, Y.C.; Fu, S.Y.; Huang, Y.W.; Zhou, D.Y.; Wu, Y.Z.; Peng, J.; Kuang, M. Genome-wide expression analysis of LACS gene family implies GhLACS25 functional responding to salt stress in cotton. BMC Plant Biol. 2024, 24, 392. [Google Scholar] [CrossRef]
  12. Zhong, Y.K.; Wang, Y.B.; Li, P.T.; Gong, W.K.; Wang, X.Y.; Yan, H.L.; Ge, Q.; Liu, A.Y.; Shi, Y.Z.; Shang, H.H.; et al. Genome-wide analysis and functional characterization of LACS gene family associated with lipid synthesis in cotton (Gossypium spp.). Int. J. Mol. Sci. 2023, 24, 8530. [Google Scholar] [CrossRef]
  13. Yan, Z.W.; Hou, J.; Leng, B.Y.; Yao, G.Q.; Ma, C.L.; Sun, Y.; Liu, Q.T.; Zhang, F.J.; Mu, C.H.; Liu, X. Genome-wide identification and characterization of maize Long-chain acyl-CoA snthetases and their expression profiles in different tissues and in response to multiple abiotic stresses. Genes 2024, 15, 983. [Google Scholar] [CrossRef] [PubMed]
  14. Weng, H.; Molina, I.; Shockey, J.; Browse, J. Organ fusion and defective cuticle function in a lacs1 lacs2 double mutant of Arabidopsis. Planta 2010, 231, 1089–1100. [Google Scholar] [CrossRef] [PubMed]
  15. Pulsifer, I.P.; Kluge, S.; Rowland, O. Arabidopsis long-chain acyl-CoA synthetase 1 (LACS1), LACS2, and LACS3 facilitate fatty acid uptake in yeast. Plant Physiol. Biochem. 2012, 51, 31–39. [Google Scholar] [CrossRef] [PubMed]
  16. Zhao, L.F.; Haslam, T.M.; Sonntag, A.; Molina, I.; Kunst, L. Functional overlap of long-chain acyl-CoA synthetases in Arabidopsis. Plant Cell Physiol. 2019, 60, 1041–1054. [Google Scholar] [CrossRef]
  17. Zhao, L.F.; Katavic, V.; Li, F.L.; George, W.; Ljerka, H. Insertional mutant analysis reveals that long-chain acyl-CoA synthetase 1 (LACS1), but not LACS8, functionally overlaps with LACS9 in Arabidopsis seed oil biosynthesis. Plant J. 2010, 64, 1048–1058. [Google Scholar] [CrossRef]
  18. Aznar-Moreno, J.A.; Calerón, M.V.; Martínez-Force, E.; Garcés, R.; Mullen, R.; Gidda, S.K.; Salas, J.J. Sunflower (Helianthus annuus) long-chain acyl-coenzyme A synthetases expressed at high levels in developing seeds. Physiol. Plant. 2014, 150, 363–373. [Google Scholar] [CrossRef]
  19. Tan, X.L. Cloning and functional identification of a Long-chain acyl-CoA synthase gene (BnaLACS8A03) from Brassica napus L. Master’s Thesis, Jiangsu University, Zhenjiang, China, 2021; pp. 45–66. [Google Scholar] [CrossRef]
  20. Ma, W.J.; Zhu, K.K.; Zhao, J.; Chen, M.Y.; Wei, L.; Qiao, Z.B.; Tan, P.P.; Peng, F.R. Genome-wide identification, characterization, and expression analysis of long-chain acyl-CoA synthetases in Carya illinoinensis under different treatments. Int. J. Mol. Sci. 2023, 24, 11558. [Google Scholar] [CrossRef]
  21. Zhang, H.Y.; Zhang, S.; Li, M.; Wang, J.; Wu, T. The PoLACS4 gene may participate in drought stress resistance in tree peony (Paeonia ostia ‘Feng Dan Bai’). Genes 2022, 13, 1591. [Google Scholar] [CrossRef]
  22. Zhang, C.L.; Hu, X.; Zhang, Y.L.; Liu, Y.; Wang, G.L.; You, C.X.; Li, Y.Y.; Hao, Y.J. An apple long-chain acyl-CoA synthetase 2 gene enhances plant resistance to abiotic stress by regulating the accumulation of cuticular wax. Tree Physiol. 2020, 40, 1450–1465. [Google Scholar] [CrossRef]
  23. Ayaz, A.; Huang, H.D.; Zheng, M.L.; Zaman, W.; Li, D.H.; Saqib, S.; Zhao, H.Y.; Lü, S.Y. Molecular cloning and functional analysis of GmLACS2-3 reveals its involvement in cutin and suberin biosynthesis along with abiotic stress tolerance. Int. J. Mol. Sci. 2021, 22, 9175. [Google Scholar] [CrossRef]
  24. Zhao, X.C.; Wei, Y.L.; Zhang, J.J.; Yang, L.; Liu, X.Y.; Zhang, H.Y.; Shao, W.J.; He, L.; Li, Z.T.; Zhang, Y.F.; et al. Membrane lipids’ metabolism and transcriptional regulation in maize roots under cold stress. Front. Plant Sci. 2021, 12, 639132. [Google Scholar] [CrossRef]
  25. Wei, H.; Dhanaraj, A.L.; Arora, R.; Rowland, L.J.; Fu, Y.; Sun, L. Identification of cold acclimation-responsive Rhododendron genes for lipid metabolism, membrane transport and lignin biosynthesis: Importance of moderately abundant ESTs in genomic studies. Plant Cell Environ. 2006, 29, 558–570. [Google Scholar] [CrossRef]
  26. Zou, Z.Y.; Zou, X.X. Geographical and Ecological Differences in Pepper Cultivation and Consumption in China. Front Nutr. 2021, 596, 718517. [Google Scholar] [CrossRef]
  27. Ou, L.J.; Wei, G.; Zhang, Z.Q.; Dai, X.Z.; Zou, X.X. Effects of low temperature and low irradiance on the physiological characteristics and related gene expression of different pepper species. Photosynthetica 2015, 53, 85–94. [Google Scholar] [CrossRef]
  28. Zhu, Y.L.; Wang, H.J.; Wang, T.; Guo, D. Extreme spring cold spells in North China during 1961-2014 and the evolving processes. Atmos. Ocean. Sci. Lett. 2018, 11, 6. [Google Scholar] [CrossRef]
  29. Li, J.; Yang, P.; Fu, H.B.; Li, J.; Wang, Y.Z.; Zhu, K.Y.; Yu, J.H.; Li, J. Transcriptome analysis reveals key regulatory networks and genes involved in the acquisition of cold stress memory in pepper seedlings. BMC Plant Biol. 2024, 24, 959. [Google Scholar] [CrossRef]
  30. Thompson, J.D.; Gibson, T.J.; Higgins, D.G. Multiple sequence alignment using ClustalW and ClustalX. Curr. Protoc. Bioinform. 2002, 2, 3. [Google Scholar] [CrossRef]
  31. Bailey, T.L.; Johnson, J.; Grant, C.E.; Noble, W.S. The MEME Suite. Nucleic Acids Res. 2015, 43, W39–W49. [Google Scholar] [CrossRef]
  32. Hu, B.; Jin, J.P.; Guo, A.Y.; Zhang, H.; Luo, J.C.; Gao, C. GSDS 2.0: An upgraded gene feature visualization server. Bioinformatics 2015, 31, 1296–1297. [Google Scholar] [CrossRef]
  33. Chen, C.; Chen, H.; Zhang, Y.; Thomas, H.R.; Frank, M.H.; He, Y.; Xia, R. TBtools: An integrative Toolkit developed for interactive analyses of big biological data. Mol. Plant 2020, 13, 1194–1202. [Google Scholar] [CrossRef]
  34. Wang, Y.P.; Tang, H.B.; DeBarry, J.D.; Tan, X.; Li, J.P.; Wang, X.Y.; Lee, T.H.; Jin, H.Z.; Marler, B.; Guo, H.; et al. MCScanX: A toolkit for detection and evolutionary analysis of gene synteny and collinearity. Nucleic Acids Res. 2012, 40, e49. [Google Scholar] [CrossRef]
  35. Rozas, J.; Ferrer-Mata, A.; Sánchez-DelBarrio, J.C.; Guirao-Rico, S.; Librado, P.; Ramos-Onsins, S.E.; Sánchez-Gracia, A. DnaSP 6: DNA Sequence polymorphism analysis of large datasets. Mol. Biol. Evol. 2017, 34, 3299–3302. [Google Scholar] [CrossRef]
  36. Kim, S.; Park, M.; Yeom, S.; Kim, Y.M.; Lee, J.M.; Lee, H.A.; Seo, E.; Choi, J.; Cheong, K.; Kim, K.T.; et al. Genome sequence of the hot pep-per provides insights into the evolution of pungency in Capsicum species. Nat. Genet. 2014, 46, 270–278. [Google Scholar] [CrossRef]
  37. Qin, C.; Yu, C.S.; Shen, Y.O.; Fang, X.D.; Chen, L.; Min, J.M.; Cheng, J.W.; Zhao, S.C.; Xu, M.; Luo, Y.; et al. Whole-genome sequencing of culti-vated and wild pepper provides insights into capsicum domesti-cation and specialization. Proc. Natl. Acad. Sci. USA 2014, 111, 5135–5140. [Google Scholar] [CrossRef]
  38. Lee, J.; Nam, J.Y.; Jang, H.; Kim, N.; Kim, Y.M.; Kang, W.H.; Yeom, S.I. Comprehensive transcriptome resource for response to phytohormone-induced signaling in Capsicum annuum L. BMC Res. Notes 2020, 13, 440. [Google Scholar] [CrossRef]
  39. Kang, W.H.; Sim, Y.M.; Koo, N.; Nam, J.Y.; Lee, J.; Kim, N.; Jang, H.; Kim, Y.M.; Yeom, S.I. Transcriptome profiling of abiotic responses to heat, cold, salt, and osmotic stress of Capsicum annuum L. Sci. Data 2020, 7, 17. [Google Scholar] [CrossRef]
  40. Fernandez-Pozo, N.; Rosli, H.G.; Martin, G.B.; Mueller, L.A. The SGN VIGS Tool: User-friendly software to design virus-induced gene silencing (VIGS) constructs for functional genomics. Mol. Plant 2014, 8, 486–488. [Google Scholar] [CrossRef]
  41. Song, J.; Sun, P.P.; Kong, W.N.; Xie, Z.Z.; Li, C.L.; Liu, J.H. SnRK2.4-mediated phosphorylation of ABF2 regulates ARGININE DECARBOXYLASE expression and putrescine accumulation under drought stress. New Phytol. 2023, 238, 216–236. [Google Scholar] [CrossRef]
  42. Velásquez, A.; Chakravarthy, S.; Martin, G. Virus-induced gene silencing (VIGS) in Nicotiana benthamiana and tomato. J. Vis. Exp. 2009, 28, e1292. [Google Scholar] [CrossRef]
  43. Liu, J.; Lu, H.Y.; Wan, Q.; Qi, W.C.; Shao, H.B. Genome-wide analysis and expression profiling of respiratory burst oxidase homologue gene family in Glycine max. Environ. Exp. Bot. 2019, 161, 344–356. [Google Scholar] [CrossRef]
  44. Yin, Y.X.; Wang, S.B.; Xiao, H.J.; Zhang, H.X.; Zhang, Z.; Jing, H.; Zhang, Y.L.; Chen, R.G.; Gong, Z.H. Overexpression of the CaTIP1-1 pepper gene in tobacco enhances resistance to osmotic stresses. Int. J. Mol. Sci. 2014, 15, 20101–20116. [Google Scholar] [CrossRef]
  45. Livak, K.J.; Schmittgen, T.D. Analysis of relative gene expression data using real-time quantitative PCR and the 2−ΔΔCT Method. Methods 2001, 25, 402–408. [Google Scholar] [CrossRef]
  46. Ito, T.M.; Trevizan, C.B.; Santos, T.B.D.; Souza, S.G.H.D. Genome-wide identification and characterization of the Dof transcription factor gene family in Phaseolus vulgaris L. Am. J Plant Sci. 2017, 8, 3233–3257. [Google Scholar] [CrossRef]
  47. Ayaz, A.; Saqib, S.; Huang, H.D.; Zaman, W.; Lu, S.Y.; Zhao, H.Y. Genome-wide comparative analysis of long-chain acyl-CoA synthetases (LACSs) gene family: A focus on identification, evolution and expression profiling related to lipid synthesis. Plant Physiol. Biochem. 2021, 161, 1–11. [Google Scholar] [CrossRef]
  48. Dimitrios, T. Assessment of lipid peroxidation by measuring malondialdehyde (MDA) and relatives in biological samples: Analytical and biological challenges. Anal. Biochem. 2017, 524, 13–30. [Google Scholar] [CrossRef]
  49. Rio, D.D.; Stewart, A.J.; Pellegrini, N. A review of recent studies on malondialdehyde as toxic molecule and biological marker of oxidative stress. Nutr. Metab. Cardiovasc. Dis. 2005, 15, 316–328. [Google Scholar] [CrossRef]
  50. Kazemi-Shahandashti, S.S.; Maali-Amiri, R. Global insights of protein responses to cold stress in plants: Signaling, defence, and degradation. J. Plant Physiol. 2018, 226, 123–135. [Google Scholar] [CrossRef]
  51. Baxter, A.; Suzuki, N.; Mittler, R. ROS as key players in plant stress signalling. J. Exp. Bot. 2014, 65, 1229–1240. [Google Scholar] [CrossRef]
  52. Liu, W.C.; Song, R.F.; Qiu, Y.M.; Zheng, S.Q.; Li, T.T.; Wu, Y.; Song, C.P.; Lu, Y.T.; Yuan, H.M. Sulfenylation of ENOLASE2 facilitates H2O2-conferred freezing tolerance in Arabidopsis. Dev. Cell 2022, 57, 1883–1898. [Google Scholar] [CrossRef]
  53. Guo, Q.; Han, J.; Li, C.; Hou, X.; Zhao, C.; Wang, Q.; Wu, J.; Mur, L.A.J. Defining key metabolic roles in osmotic adjustment and ROS homeostasis in the recretohalophyte Karelinia caspia under salt stress. Physiol. Plant. 2022, 174, e13663. [Google Scholar] [CrossRef] [PubMed]
  54. Huchzermeyer, B.; Menghani, E.; Khardia, P.; Shilu, A. Metabolic Pathway of Natural Antioxidants, Antioxidant Enzymes and ROS Providence. Antioxidants 2022, 11, 761. [Google Scholar] [CrossRef] [PubMed]
  55. Liu, H.H.; Chong, P.F.; Liu, Z.H.; Bao, X.G.; Tan, B.B. Exogenous hydrogen sulfide improves salt stress tolerance of Reaumuria soongorica seedlings by regulating active oxygen metabolism. PeerJ 2023, 24, e15881. [Google Scholar] [CrossRef] [PubMed]
  56. Shi, Y.T.; Ding, Y.L.; Yang, S.H. Molecular regulation of CBF signaling in cold acclimation. Trends Plant Sci. 2018, 23, 623–637. [Google Scholar] [CrossRef]
  57. Tang, B.Q.; Xie, L.L.; Yang, H.P.; Li, X.M.; Chen, Y.; Zou, X.X.; Liu, F.; Dai, X.G. Analysis of the expression and function of key genes in pepper under low-temperature stress. Front Plant Sci. 2022, 13, 852511. [Google Scholar] [CrossRef]
Figure 1. Alignment of pepper and Arabidopsis LACS protein sequences. The sequences of two conserved domains are marked with red lines. The similarity of each amino acid sequence is shown at the end of the alignment, with red numbers indicating the maximum and minimum values of consistency between pepper sequences, and green numbers indicating consistency between pepper and Arabidopsis sequences.
Agronomy 15 00970 g001
Figure 2. Evolutionary tree analysis of LACS proteins. Proteins in pepper, tomato, Arabidopsis, maize, and oilseed rape are labeled in red, olive, blue, purple, and yellow dots, respectively; the yellow and black stars represent Ectocarpus siliculosus and Galdieria sulphuraria, respectively. Si: tomato (Solanum lycopersicum L.); At: Arabidopsis (Arabidopsis thaliana); Ca: pepper (Capsicum annuum L.); Zm: maize (Zea mays L.); Bn: oilseed rape (Brassica napus L.); Esi: Ectocarpus siliculosus; Gsu: Galdieria sulphuraria.
Agronomy 15 00970 g002
Figure 3. Multiple sequence alignment, motifs, and gene structure of CaLACS family members. (A) Phylogenetic tree of CaLACS protein sequences. (B) Schematic distributions of conserved motifs among CaLACS proteins. (C) Analysis of CaLACS gene structures. (D) The 12 conserved sequences are contained in all the CALACS proteins.
Agronomy 15 00970 g003
Figure 4. Analysis of cis-elements in the CaLACS gene promoter. (A) The distribution of cis-elements predicted in the CaLACS gene promoter. (B) Statistics of the number and classification of cis-elements.
Agronomy 15 00970 g004
Figure 5. Collinearity analysis of the LACS genes between pepper and Arabidopsis. The gray line represents all the collinear blocks between genomes, the red line represents collinear gene pairs of LACS in pepper, and the blue line represents collinear gene pairs of LACS in pepper and Arabidopsis. The inner circle represents gene density.
Agronomy 15 00970 g005
Figure 6. Expression of the CaLACS gene in different tissues and stages of fruit development of the ‘Zunla-1’ pepper. The different stages of fruit development include the following: immature stage (F-Dev1, F-Dev2, F-Dev3, and F-Dev4), mature green stage (F-Dev5), break stage (F-Dev6), maturity stage (F-Dev7, F-Dev8, and F-Dev9). Red represents high gene expression levels , green represents low gene expression levels. The fragments per kilobase of exon model per million mapped reads (FPKM) values were used for expression.
Agronomy 15 00970 g006
Figure 7. Expression profiles of pepper LACS genes under (A) phytohormone treatments and (B) different types of abiotic stress. The phytohormone treatments included abscisic acid (ABA), methyl jasmonate (MeJA), salicylic acid (SA), and ethylene (ET). Abiotic stresses included cold, heat, drought (D-mannitol), and salt (NaCl). The phytohormone treatments included methyl jasmonate (MeJA), salicylic acid (SA), ethylene (ET), and abscisic acid (ABA). Time points include 1, 3, 6, 12, and 24 h. The control group is indicated by a mock label. Red indicates a high relative abundance of transcripts. Green indicates a low relative abundance of transcripts.
Agronomy 15 00970 g007
Figure 8. Effect of CaLACS6/9 silencing on pepper tolerance to cold stress. (A) Phenotype, (B) tissue staining, (C) H2O2 content, (D) O2•− content, (E) MDA content, (F) SOD activity, (G) POD activity, and (H) CAT activity of TRV2:00 and TRV2:CaLACS6/9 plants after cold treatment. CK, control check; TRV:LACS6, pepper with LACS6 gene silencing; TRV:LACS9, pepper with LACS9 gene silencing. Each value represents the mean ± SE of three biological replicates. The error bars represented the SDs. Lowercase letters represent significant differences based on one-way ANOVA in SPSS 21.0 followed by the Dunnett t-test (p < 0.01).
Agronomy 15 00970 g008
Figure 9. Expression levels of (A) CaCBF1a, (B) CaCBF1b, (C) CaKIN, (D) CaCOR47, (E) CaSOD, (F) CaPOD, and (G) CaCAT2 of TRV2:00 and TRV2:CaLACS6/9 plants under cold stress. CK, control check; TRV:LACS6, pepper with LACS6 gene silencing; TRV:LACS9, pepper with LACS9 gene silencing. Each value represents the mean ± SE of three biological replicates. The error bars represented the SDs. Lowercase letters represent significant differences based on one-way ANOVA in SPSS 21.0 followed by the Dunnett t-test (p < 0.01).
Agronomy 15 00970 g009
Table 1. Details of the LACS gene family in pepper.
Gene NameGene SymbolProtein IDORF
(bp)
Protein LengthMolecular Mass (KDa)PIInstability IndexSubcellular
Localization
CaLACS1LOC107855307NP_001311647.1197765873.566.9033.10Cytoplasmic
CaLACS2LOC107840375XP_016539704.1199266375.116.5038.29Cytoplasmic
CaLACS3LOC107851776XP_016552345.1201667174.887.7639.70Cytoplasmic
CaLACS4LOC107864092XP_016565840.2209469777.198.4437.90Mitochondrial
CaLACS5LOC107868016XP_016570047.1207068975.437.1530.91Cytoplasmic
CaLACS6LOC107878096NP_001312030.1218172678.378.5425.06Cytoplasmic
CaLACS7LOC107839318XP_016538238.1198065973.705.8724.88Cytoplasmic
CaLACS8LOC107854884XP_047250631.1203767875.036.4832.99Plasma Membrane
CaLACS9LOC107840916XP_016540352.2216372079.847.4928.59Chloroplast
Table 2. Ka, Ks, Ka/Ks, and time calculation of LACS pairs.
SpeciesHomologous Gene PairsKaKsKa/KsDivergent/
Duplication Time (Mya)
Pepper/
Arabidopsis
CaLACS1/AtLACS20.212.780.08177.07 a
CaLACS1/AtLACS40.172.140.08136.31 a
CaLACS1/AtLACS50.181.880.10119.75 a
CaLACS2/AtLACS10.27---
CaLACS3/AtLACS20.232.110.11134.39 a
CaLACS3/AtLACS40.193.080.06196.18 a
CaLACS3/AtLACS50.192.110.09134.39 a
CaLACS4/AtLACS1----
CaLACS7/AtLACS2----
CaLACS7/AtLACS4----
CaLACS7/AtLACS50.262.580.10164.33 a
CaLACS8/AtLACS81.81---
Pepper/PepperCaLACS1/CaLACS30.110.700.1644.59 b
CaLACS1/CaLACS70.232.210.10140.76 b
Note: - represents that there is no value. a represents the divergent time, and b represents the duplication time.
Disclaimer/Publisher’s Note: The statements, opinions and data contained in all publications are solely those of the individual author(s) and contributor(s) and not of MDPI and/or the editor(s). MDPI and/or the editor(s) disclaim responsibility for any injury to people or property resulting from any ideas, methods, instructions or products referred to in the content.

