Article

Biodegradability of Textiles Made from Natural Fibers During Composting and Vermicomposting

Department of Agro-Environmental Chemistry and Plant Nutrition, Czech University of Life Sciences Prague, 165 00 Prague, Czech Republic
*
Author to whom correspondence should be addressed.
Agronomy 2025, 15(12), 2700; https://doi.org/10.3390/agronomy15122700
Submission received: 30 October 2025 / Revised: 15 November 2025 / Accepted: 20 November 2025 / Published: 24 November 2025
(This article belongs to the Special Issue Innovations in Composting and Vermicomposting)

Abstract

The increasing generation of natural fiber textile waste highlights the urgent need for sustainable management strategies. This study investigated the biodegradation of textiles made from viscose, cotton, and linen under controlled composting and vermicomposting conditions in a four-month cycle to assess their decomposition dynamics and the quality of the resulting products. Composting was performed by an outdoor method and under controlled conditions, while vermicomposting included outdoor and home-scale variants using Eisenia andrei. Textile biodegradability and quality of the final product were quantified by weight loss, microscopic evaluation, and changes in pH, electrical conductivity, volatile solids, the carbon-to-nitrogen ratio (C/N), macroelement content, and levels of potentially toxic compounds. By month 2, textiles reached complete (100%) degradation in outdoor composting and in both vermicomposting systems; controlled composting achieved 87% degradability at month 2, 94% at month 3, and 99% at month 4. Across all systems, the C/N ratio stabilized around 11, and the resulting compost and vermicompost met quality standards for nutrients and safety criteria for toxicity. The findings confirm that both composting and vermicomposting are suitable methods for processing natural fiber textile waste, yielding environmentally safe and agronomically valuable products that support circular waste management in the textile sector.

1. Introduction

The textile industry is one of the largest generators of solid waste worldwide, driven by rapid consumption cycles, synthetic fiber dominance, and a lack of effective end-of-life management. Growing environmental concern and the need for circularity in textile value chains have stimulated interest in sustainable recycling and recovery technologies, including biological degradation of natural and regenerated fibers [1,2,3,4,5,6,7].
Natural and regenerated cellulosic fibers differ considerably in morphology, crystallinity, and the presence of non-cellulosic components, which determines their accessibility to microbial and enzymatic degradation. Cotton is a natural cellulose fiber with a highly ordered crystalline structure and typical twisted ribbon morphology, while viscose is a regenerated cellulose fiber with lower crystallinity, greater amorphous content, and higher hydrophilicity, which enhance its biodegradability. Linen (flax), a bast fiber, contains cellulose embedded in hemicellulose, pectin, and lignin matrices that can hinder microbial attack but contribute to mechanical strength and durability [8,9,10,11,12,13,14,15,16,17,18,19]. These three fibers, cotton, viscose, and linen, were therefore selected as representative examples of commonly used and structurally diverse textile materials appearing in current household and industrial waste streams. Their comparison in this study allows for a better understanding of how intrinsic fiber characteristics influence decomposition kinetics and the quality of composted and vermicomposted products.
Waste management’s current goals for recycling rather than energy recovery or landfilling tie in perfectly with composting and vermicomposting methods for the biodegradation and transformation of natural textile fibers into nutrient-rich compost and vermicompost. Composting, as a controllable microbial process, utilizes optimal temperature and moisture conditions to accelerate the breakdown of cellulose fibers, while vermicomposting additionally involves the activity of earthworms, which accelerate the transformation of organic material into usable fertilizer [20]. Vermicomposting has also been used to increase the rate and efficiency of biodegradation of textile industry sludge and dye sludge [21]. Natural fibers such as cotton and hemp have been shown to decompose more efficiently under composting conditions, depending on their chemical composition and processing [7]. Composting promotes cellulose-degrading fungal communities and overall biodiversity, substantially accelerating the breakdown of cellulose-rich substrates [22]. Vermicomposting can be even more effective through the activity of earthworms, which not only increase the breakdown of natural textile fibers [23] but also enrich the resulting compost with nutrients [24]. Composting and vermicomposting provide a sustainable solution for utilizing large volumes of natural-fiber textile waste that would otherwise end up in the landfill. The resulting compost or vermicompost enhances soil fertility and reduces the use of synthetic fertilizers [25].
Previous research has documented the degradation of textile materials after soil burial or under laboratory conditions, but comparative studies examining the biodegradation of different natural and regenerated cellulosic textiles under practical composting and vermicomposting systems remain scarce. Furthermore, most existing studies have focused on physical decomposition or microbial aspects, with little attention to the agronomic quality and safety of the resulting composts or vermicomposts. A systematic evaluation linking fiber degradation dynamics with compost maturity, nutrient profile, and potential contamination by trace elements is still lacking.
The present study addresses these knowledge gaps by comparing the biodegradation of viscose, cotton, and linen fabrics under four biological treatment scenarios: outdoor composting, controlled aerated composting, outdoor vermicomposting, and home-scale vermicomposting with Eisenia andrei. The objectives were to (i) evaluate the degradation efficiency of each fiber type under different systems, (ii) assess how fiber structure affects the rate and completeness of decomposition, and (iii) determine whether incorporating textile fibers affects the physicochemical and agronomic properties of the resulting compost and vermicompost. Based on these aims, three hypotheses were formulated: (1) vermicomposting accelerates biodegradation compared with traditional composting; (2) fibers differ significantly in their biodegradability due to variations in structural and chemical characteristics; and (3) the incorporation of textile fibers does not negatively affect the agronomic quality or safety of the final compost/vermicompost. By linking fiber degradation kinetics with compost quality indicators, this study contributes to a better understanding of sustainable management options for biodegradable textile waste within circular bioeconomic frameworks.

2. Materials and Methods

2.1. Feedstocks

Textiles based on natural fibers (viscose, cotton and linen) were supplied by the Czech company PRO LEN Ltd. (Sumperk, Czech Republic), which specializes in the development and production of textile products from natural materials. The company uses dyes and materials certified as biocompatible to ensure minimal toxicity. The supplied fiber types were processed into final products (shirts, T-shirts), which were cut into specific sizes and incorporated into composting and vermicomposting mixtures.
The compost and vermicompost substrates consisted of compost, fruit and vegetable scraps, wood chips and shredded paper. The weights and volume ratios, and bulk density of components in the mixture are given in Table 1.
Compost was added to provide a microbial inoculant and to simulate home and outdoor small-scale composting, where the substrate is already partially or completely matured compost. The compost consisted of partially mature earthen material from the composting site of the demonstration plot of the Czech University of Life Sciences and mature compost from the composting plant in Uholicky near Prague. The latter constituted 55% by weight and 64% by volume of the total amount of both composts. Raw materials included fruit processing residues (mainly apple pomace) and vegetable scraps (carrot, pepper, cabbage, corn). Wood chips were also added to improve the structure and aeration of the compost pile. Shredded paper was added to increase the C:N ratio and water absorption capability. A fruit- and vegetable-based earthworm substrate was used for vermicomposting (Table 2).

2.2. Composting and Vermicomposting Tests

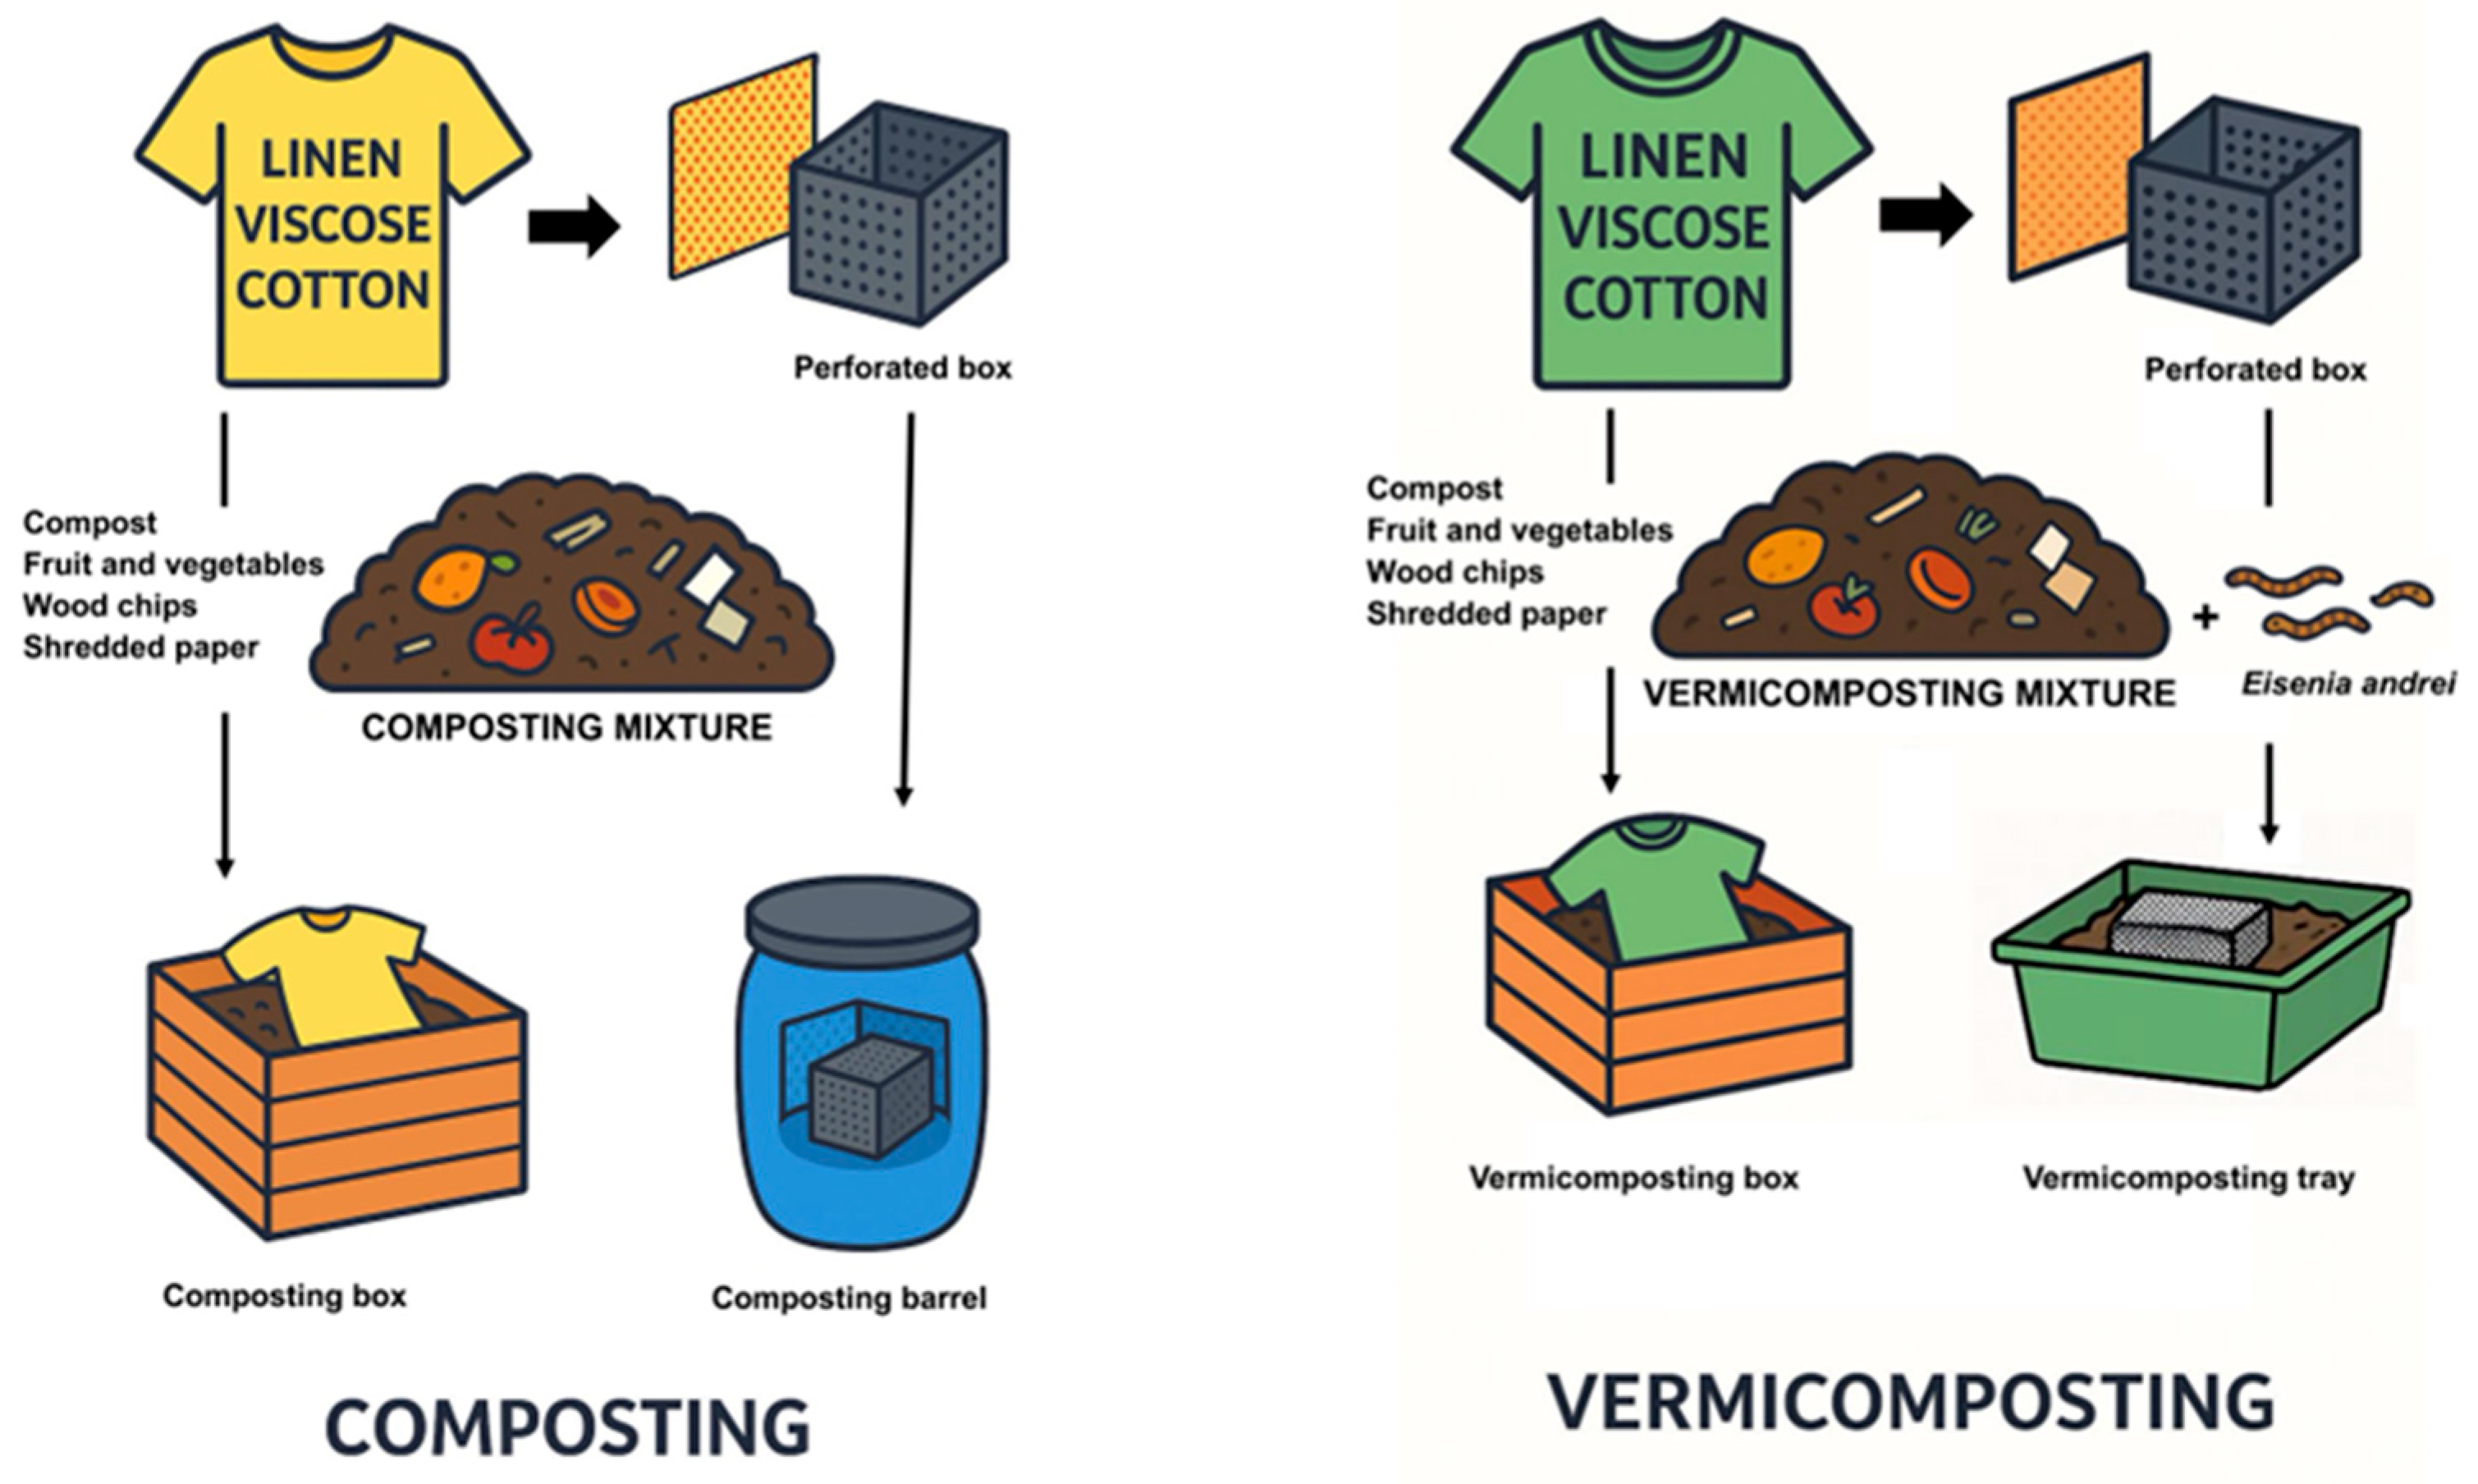
Scheme of textile composting and vermicomposting tests is illustrated in Figure 1.

2.2.1. Composting Tests

Two types of composting system were set up to monitor the biodegradation of natural-fiber textiles: simulation of outdoor composting used by citizenry and controlled composting used in composting plants. To simulate outdoor composting, perforated boxes were used in the following groups: four perforated boxes (one as control without textile, and one each for cotton, viscose, and linen) containing composting mixture (35 kg) and soaked textile (700 g of dry textile (4 × 4 cm) presoaked in water at 20 °C for one hour to yield 1540 g of wet textile). The ratio of wet mixture to dry textile was 50:1 and the ratio of wet mixture to wet textile was 23:1. A narrower ratio could not be chosen due to the low bulk density of the textile and the creation of a homogeneous mixture.
For weight loss measurements and microscopy, perforated plastic envelopes containing 10 g of dry textile (which was subsequently moistened) were put into perforated metal boxes filled with compost mixture, and these metal boxes were placed into the above perforated boxes. To visually monitor the decomposition of an entire pieces of clothing, three perforated boxes (one each for cotton, viscose, and linen) were set up containing composting mixture plus entire soaked textile products (no buttons or hems).
To simulate controlled composting, three composting barrels were used: one each for cotton, viscose, and linen containing 63 L of composting mixture plus a perforated metal box of mixture with textile in the same percentage as in outdoor composting and sealed perforated plastic envelopes with the addition of 10 g of dry textile, subsequently moistened. The barrels were aerated from the bottom using a program of five minutes of aeration at 6 L/min and 25 min of pause.

2.2.2. Vermicomposting Tests

To assess the biodegradation of natural fiber textiles in vermicompost, two types of vermicomposting systems were implemented: simulation of outdoor vermicomposting and simulation of home vermicomposting. To imitate outdoor vermicomposting, four perforated boxes (one as control without textile, and one each for cotton, viscose, and linen) containing composting mixture and earthworm substrate with Eisenia andrei at a ratio of 5:1 (35 kg total) and soaked textile (700 g of dry textile, 4 × 4 cm, presoaked in water at 20 °C for one hour to give 1540 g of wet textile). The ratio of wet mixture plus earthworm substrate to dry textile was 50:1 and the ratio of wet mixture to wet textile was 23:1. A narrower ratio could not be chosen due to the low bulk density of the textile and the creation of a homogeneous mixture. For weight loss determination and microscopy, a sealed perforated plastic envelope containing a dry 10 g piece of relevant textile (which was subsequently moistened) was put into a perforated metal box filled with compost mixture and earthworm substrate. These metal boxes were placed into perforated boxes as described above.
Vermicomposting trays were used to simulate home vermicomposting in a vermicomposter. Nine vermicomposting trays were prepared containing mixtures and earthworm substrate with Eisenia andrei at a ratio of 5:1. Perforated metal boxes contained mixture and earthworm substrate with textile in the same ratio as described above. Dry pieces (10 g) of relevant textile were inserted into perforated plastic envelopes, moistened, sealed and put into the trays.

2.3. Determination of Biodegradability, Biological Properties, and Agrochemical Parameters

Samples were taken at two months (1st uptake), three months (2nd uptake) and four months (3rd uptake) from the beginning of the experiment. The following properties were determined in the samples.

2.3.1. Biodegradability of Textiles

Biodegradability of the textiles was determined by three methods. First the weight lost from the original 10 g (dry matter (DM)) of textile in the envelope placed in a metal box in the compost or vermicompost bin was measured. The box was removed from the composted or vermicomposted material at the end of the sampling period, the envelope was taken out of the box and the textile piece washed in demineralized water and dried. The envelope was opened and the textile was weighed. The percent weight loss was calculated based on the difference between the initial weight and the final weight. The remains of the cleaned textile samples from the envelopes were microscopically examined using a Nikon SMZ 800 stereomicroscope, and digitally imaged to identify the fiber type, evaluate and compare the structural changes. The decomposition of whole garments of cotton, viscose, and linen in the vermi/composting mixtures was also monitored visually. Because of the fragility of the disintegrating textile it was impossible to obtain a representative sample for measuring the percentage of undecomposed textile.

2.3.2. Biological Properties

The number and biomass of earthworms in vermicomposting tests were determined by manually separating them from a 1 kg sample of soil and counting them, then leaving them in a Petri dish for 24 h to empty their digestive tract and weighing them.

2.3.3. Agrochemical Parameters

The pH and specific electrical conductivity (EC) were measured in the aqueous leachate. Ten gram samples were taken, mixed with 50 mL of demineralized water, and shaken for 10 min on a mechanical shaker. The particles were allowed to settle out and the pH was measured using a WTW pH 340i meter (Weilheim, Germany). The suspension was then filtered, and the EC was measured with a WTW Cond 730 InoLab® conductivity meter (Weilheim, Germany). To quantify volatile solids (VS), 2 g samples (DM) were weighed into individual beakers, which were covered and placed on a hotplate for consecutive evaporation at the following temperatures for one hour each: 160 °C, 220 °C, 280 °C, and 350 °C. After the four hours of evaporation, the beakers were transferred to a muffle furnace, where combustion was carried out at temperatures up to 500 °C for 12 h. The beakers were then removed, allowed to cool, and weighed to determine the final mass of the combusted samples. The content of vs. was expressed as percent by weight (DM) and was calculated according to the following equation:
% vs. = (mimr)/(mime) ∗ 100%
where % vs. = VS content as a percentage of dry matter, me = weight of the empty beaker (g), mr = weight of the beaker containing the mineral residue after ignition (g), and mi = weight of the beaker (g) containing the initial dried sample.
The determination of total carbon and nitrogen content in ground, dried samples was carried out using the CHNS analyzer Vario MacroCube (Elementar Analysensysteme GmbH, Langenselbold, Germany). Approximately 25 mg of each sample was burned in the catalytic furnace of this device, and the C and N values were determined by thermal conductivity detector. Macroelements and potentially toxic elements (PTEs) were determined by wet digestion using a closed system with microwave heating Ethos 1, MLS GmbH, Leutkirch im Allgäu, Germany. The total contents of the elements were determined by inductively coupled plasma optical emission spectrometry (ICP-OES) using a Varian VistaPro (Agilent Technologies, CA, USA. The detection limits for elements from the PTEs group were: As, 0.75 mg kg−1; Cd, 0.03 mg kg−1; Pb, 0.50 mg kg−1; Cr, 0.13 mg kg−1; Cu, 0.13 mg kg−1; Ni, 0.13 mg kg−1; and Zn, 0.05 mg kg−1. Sewage sludge (ANOK01 Analytica) was used as certified reference material.

2.4. Statistical Analysis

Statistical analysis was performed in the RStudio software environment (version R 4.4.3). To ensure the correctness of the procedures, the data were first tested for normality using the Shapiro–Wilk test. Based on the results of normal data distribution, analysis of variance (ANOVA) was selected as the statistical tool. For deviations from normality, the non-parametric Kruskal–Wallis test was used. For statistical significance defined as p < 0.05), Tukey’s HSD post hoc test was applied for ANOVA and Dunn’s test with the Benjamini–Hochberg correction for Kruskal–Wallis. For ease of interpretation, statistically homogeneous groups were given letter designations using the multcompView (version 0.1-10) and R-companion packages (version 2.5.1).

3. Results

3.1. Biodegradability of Textiles

3.1.1. Weight Loss of Textiles in Envelopes

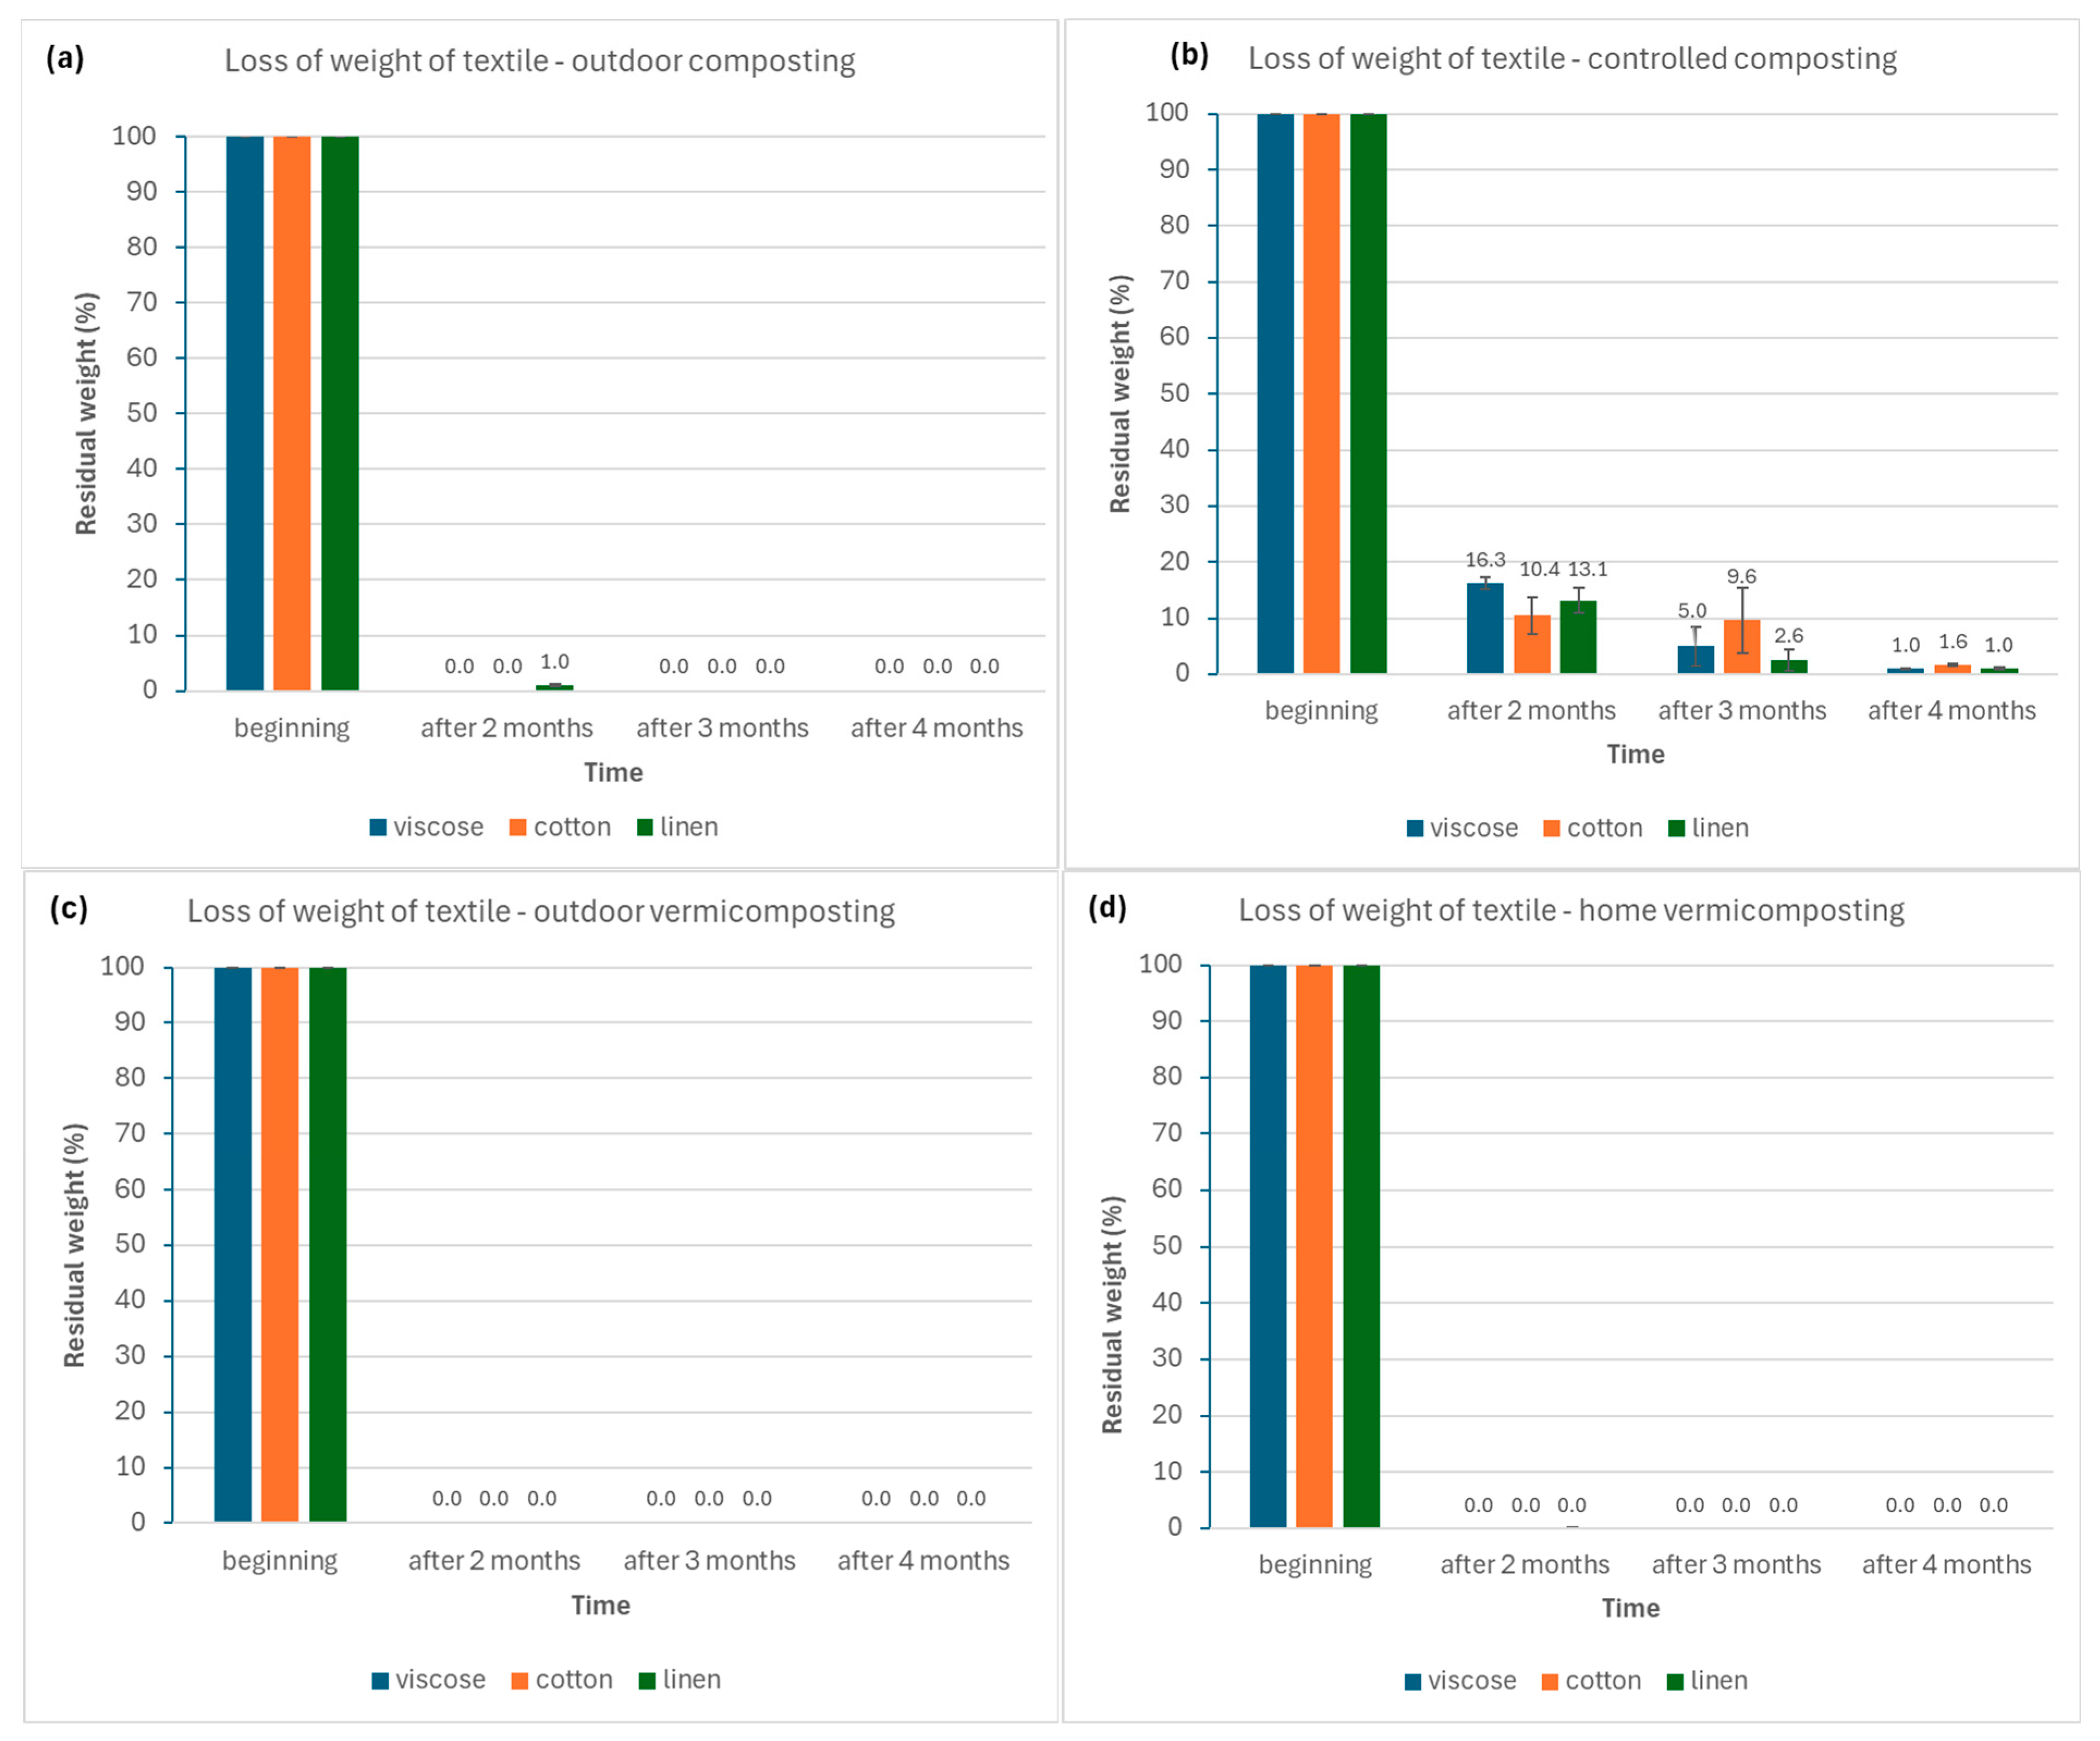
In the experiment on the degradability of textiles in perforated envelopes, significant differences were observed between composting and vermicomposting, as well as between controlled and home composting. After two months of vermicomposting, 100% decomposition was observed for linen, cotton and viscose textiles. In the case of composting, the decomposition of textiles proceeded more slowly than in vermicomposting, and home composting proved to be more effective than controlled composting. After the first sampling, viscose and cotton were completely decomposed, while linen was 99% degraded. After three months, all materials showed 100% degradation.
According to the data in Figure 2, controlled composting was the least successful. The average degradability after the first sampling was 87% (i.e., a weight loss of 13%), while after the second sampling it reached 94%, and 99% after the third sampling (Figure 2b).

3.1.2. Microscopic Images of Textiles from Envelopes

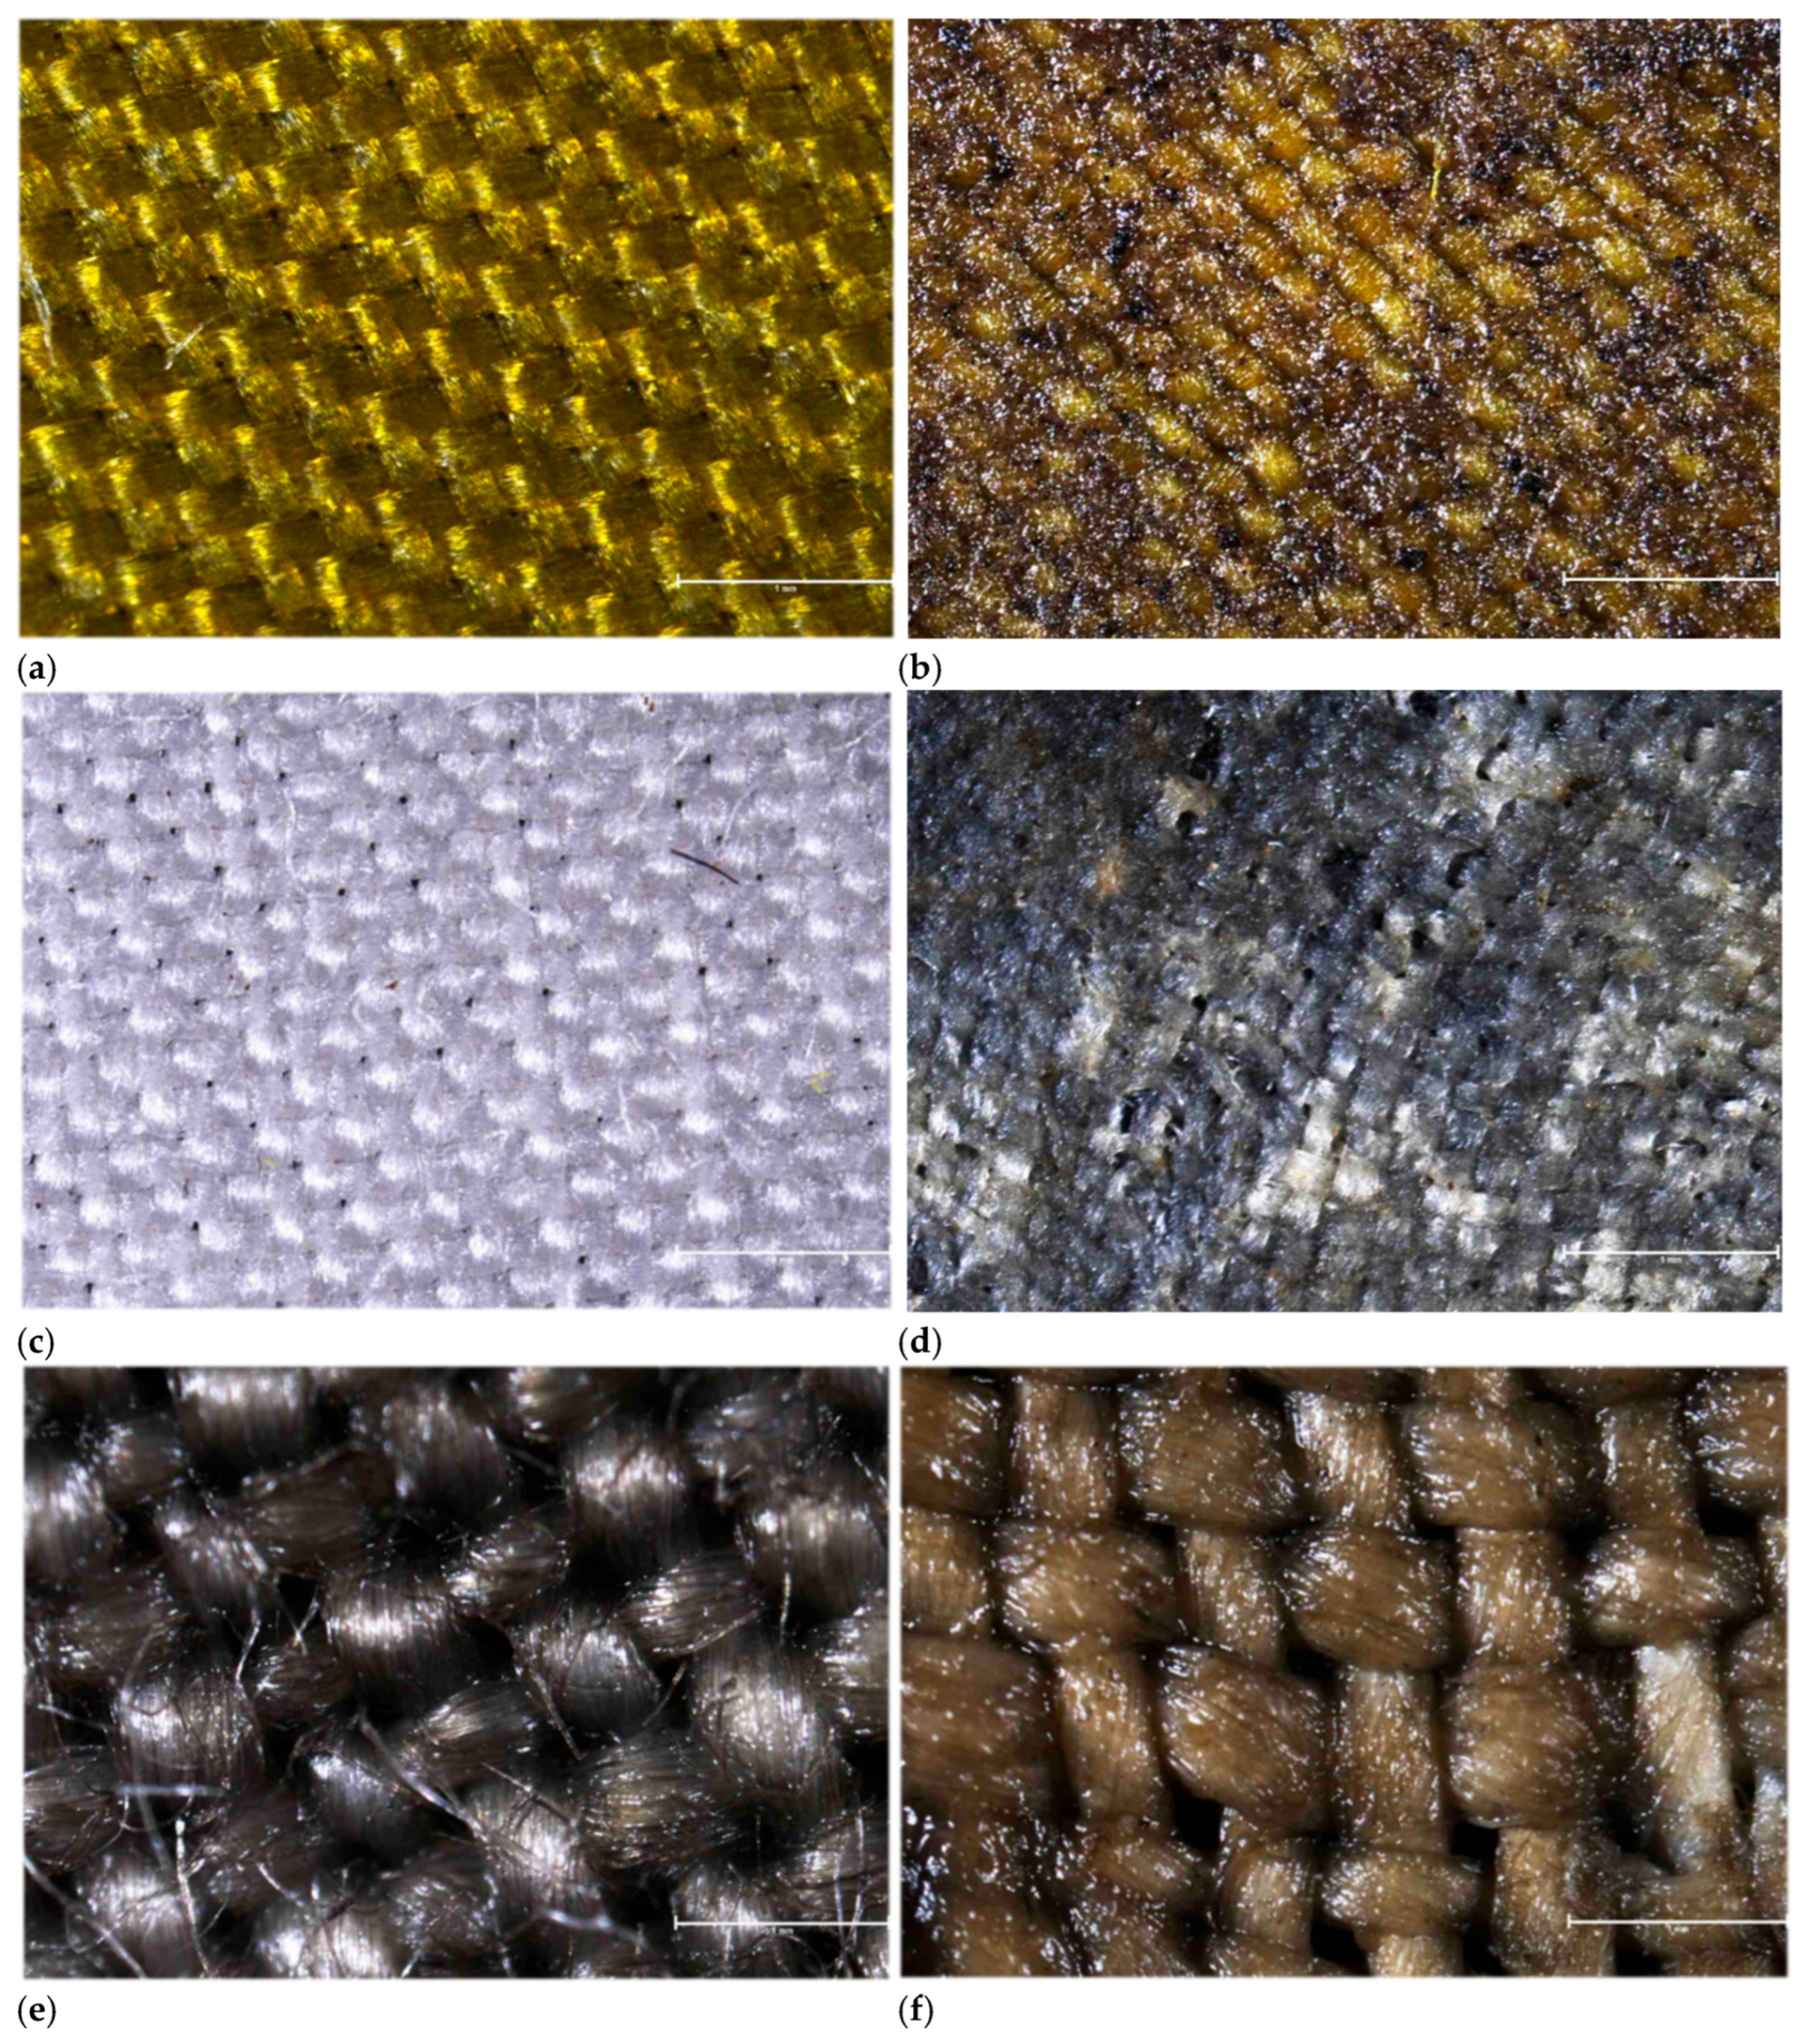
Microscopic observations revealed clear differences between the input textiles and the residues after three months of controlled composting. In the case of viscose (Figure 3a,b), the input fibers exhibited a smooth, compact, and homogeneous surface with a well-defined linear structure. After three months, the residues were thinner, extensively fragmented, and showed surface irregularities, pores, and mechanical disruptions. For cotton (Figure 3c,d), the input fibers had the typical twisted morphology with a firm, coherent cell wall and smooth surface. The composted material was distinctly degraded with fibers partially split into fibrils, disrupted structure, and low overall cohesion. Regarding linen (Figure 3e,f), the input material consisted of thick fibers with compact bundles of elementary fibers and a relatively smooth surface with only natural defects. After composting, the residues showed clear disintegration, frequent splitting of fiber bundles, surface erosion, and a general loosening of the structure. Overall, while the input textiles were compact and structurally intact, the residues after composting exhibited pronounced signs of biological degradation, including fragmentation, thinning, surface erosion, and bundle disintegration. These microscopic findings are consistent with the results of gravimetric measurements, which confirmed substantial weight loss of the textiles during composting.

3.1.3. Decomposition of Garments Made from Textile

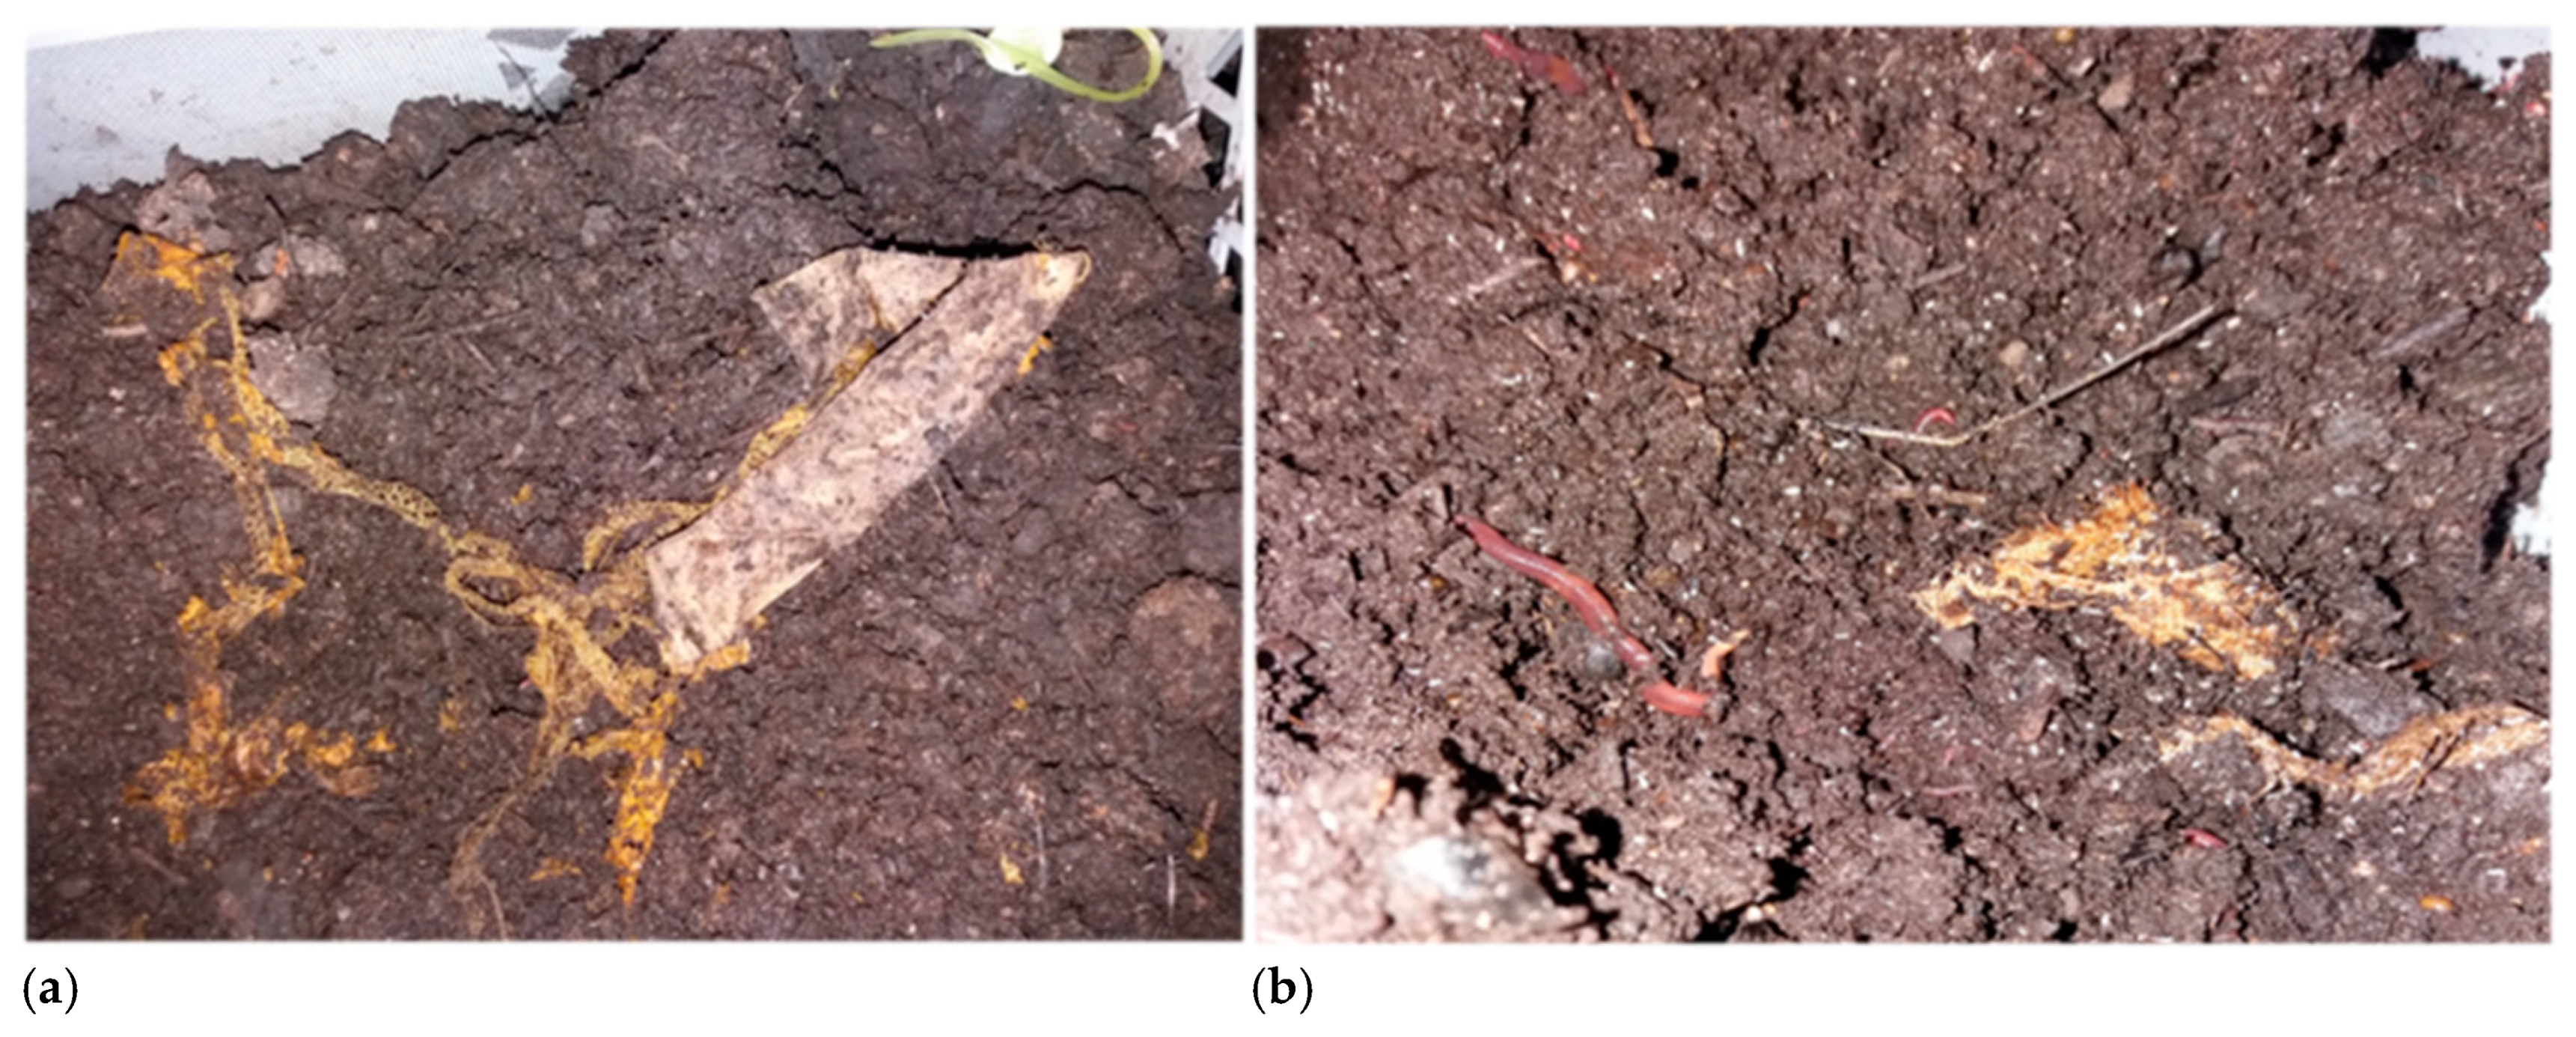
The degree of decomposition of whole garments made from viscose, cotton or linen in composting and vermicomposting boxes was high, but unlike the textile samples in perforated envelopes, complete decomposition was not achieved by the first sampling; only cotton pieces in composting boxes were completely decomposed. After the second sampling, the entire piece of cotton textile was also decomposed in vermicomposting boxes. During the third sampling, residual pieces of viscose and linen were found in both composting and vermicomposting boxes. These residues, as shown in Figure 4a,b, mainly consisted of seams and doubled places on the garment.

3.2. Number of Earthworms and Worm Biomass

Table 3 shows the number of earthworms in the substrate with the addition of viscose fiber. In outdoor vermicomposting, there was a significant increase in the number of earthworms at the third time point (p = 0.01). While the first two samplings showed similar values (102 and 105 pcs), the third sampling showed a significant increase in the number of earthworms to 200 pcs, which was confirmed by post hoc analysis.
The results in Table 4 show that outdoor vermicomposting of cotton, produced no significant differences between samples (p = 0.75). The number of earthworms remained relatively stable in the range of 142–162 individuals. On the contrary, in the case of indoor vermicomposting, there were statistically significant differences between samplings (p = 0.04). The highest number of earthworms was recorded in the second sampling (297 pcs), which was significantly different from the first sampling (130 pcs). The third sampling (155 pcs) was not statistically different from either the first or the second, which indicates some variability over time.
For linen textiles in Table 5, statistically significant differences in the number of earthworms between individual samplings were recorded. In outdoor vermicomposting, a statistically significant difference was also confirmed (p = 0.03), with the lowest number of earthworms found in the second collection (95 pcs) and the highest in the first collection (148 pcs), while the third collection (137 pcs) was not statistically different from both groups (ab). The results indicate fluctuations in the number of earthworms during biodegradation. In home vermicomposting, the number of earthworms was highest in the second sampling (253 pcs) and significantly different from the first (88 pcs) and third collection (117 pcs). This indicates a statistically significant difference (p = 0.00).
When comparing the numbers of earthworms for the different type of textile, specific differences in the dynamics of occurrence during individual samplings can be observed. The variant with cotton showed significant differences in the number of earthworms in the indoor home vermicompost, while there were no statistically significant changes in the outdoor method. The variant with viscose, on the other hand, showed stable numbers of earthworms in the home environment, but in the outdoor vermicompost there was a statistically significant increase in the third sampling. The variant with linen showed the greatest variability. Significant differences were recorded in both home and outdoor vermicomposting.

3.3. Agrochemical Properties of Compost and Vermicompost

3.3.1. Comparison of pH Measurements for Different Textiles

The pH values of substrates containing viscose fibers showed mild alkalinity throughout the experiment, with significant differences observed mainly in the composting systems (Table 6). In outdoor composting, the pH ranged from 8.86 to 9.14, with the second sampling significantly higher than the first and third (p = 0.00), suggesting increased microbial activity during the mid-phase of biodegradation. Controlled composting also revealed statistically significant differences (p = 0.01), as pH increased from 8.87 to 9.12 and then slightly decreased to 8.96 in the final sampling. In contrast, outdoor (p = 0.83) and home vermicomposting (p = 0.914) did not show significant changes, maintaining relatively stable pH from 8.8 to 9.3, which indicates a well-buffered environment with stable biological processes.
For cotton-based substrates, pH values remained relatively stable in all composting systems, varying only slightly within the alkaline range of 8.75–9.27 (Table 7). No statistically significant differences were detected across sampling times for any system (all p > 0.05). Outdoor composting maintained an average pH of about 9.0, while controlled composting and both vermicomposting variants showed homogeneous pH (p = 0.23–0.96). The stable pH profile indicates that cotton degradation proceeds under consistent biochemical conditions without acidification or strong alkalization phases.
Linen-containing substrates exhibited greater variability in pH among the systems (Table 6). Significant differences were recorded during controlled composting (p = 0.038), where the pH increased from 8.63 to 9.04 and then slightly decreased to 8.98. A similar trend was observed in outdoor composting (p = 0.01), with the highest value (9.11) during the second sampling, followed by a minor decline to 8.96 in the third. In contrast, outdoor (p = 0.11) and home vermicomposting (p = 0.33) maintained stable values from 8.9 to 9.2 without statistically significant differences. This stability in vermicomposting systems suggests that the worm-assisted process buffered pH fluctuations more effectively than traditional composting.

3.3.2. Electrical Conductivity (EC)

EC reflects the dynamics of mineralization and nutrient release during biodegradation of the tested textiles (Table 7). For viscose, the EC values showed a general downward trend during composting, while vermicomposting systems remained more stable. In outdoor composting, EC decreased from 1750 μS cm−1 at the first sampling to 1551 μS cm−1 and 1565 μS cm−1 at the second and third samplings, respectively, with statistically significant differences among all samplings (letters c, a, b). In controlled composting, a continuous decrease was recorded (1730 → 1630 → 1332 μS cm−1; a, ab, b), confirming a gradual reduction in soluble ion concentration as the compost matured. In outdoor vermicomposting, EC values (1536, 1500 and 1910 μS cm−1; b, a, b) significantly differed, showing a temporary increase in the final sampling, possibly due to enhanced mineral release through worm activity. Home vermicomposting displayed only minor variations (1749, 1751 and 1711 μS cm−1; b, a, b), yet with statistically detectable differences, indicating a mild but balanced ionic fluctuation.
Cotton-based substrates exhibited a similar pattern. In outdoor composting, EC decreased from 1836 to 1390 and 1530 μS cm−1 (a, b, b), revealing a significant reduction compared to the initial phase. Controlled composting (1644, 1680 and 1474 μS cm−1; all a) showed no significant differences, confirming a homogeneous decomposition process. Outdoor vermicomposting presented more pronounced variability (1604, 1580 and 1624 μS cm−1; c, a, b), whereas home vermicomposting (1835, 1640 and 1799 μS cm−1; a, b, b) demonstrated a decrease at the second sampling followed by partial recovery.
For linen, the EC in outdoor composting decreased markedly from 1908 to 1530 and 1481 μS cm−1 (b, a, ab), reflecting stabilization of soluble ions during organic matter decomposition. Controlled composting (1726, 1610 and 1434 μS cm−1; all a) revealed no significant changes, while outdoor vermicomposting (1682, 1560 and 1483 μS cm−1; c, a, b) exhibited a consistent decline. In home vermicomposting, EC values remained stable (1908, 1580 and 1913 μS cm−1; all a), indicating well-buffered conditions with no measurable accumulation of salts.

3.3.3. Volatile Solids (VS)

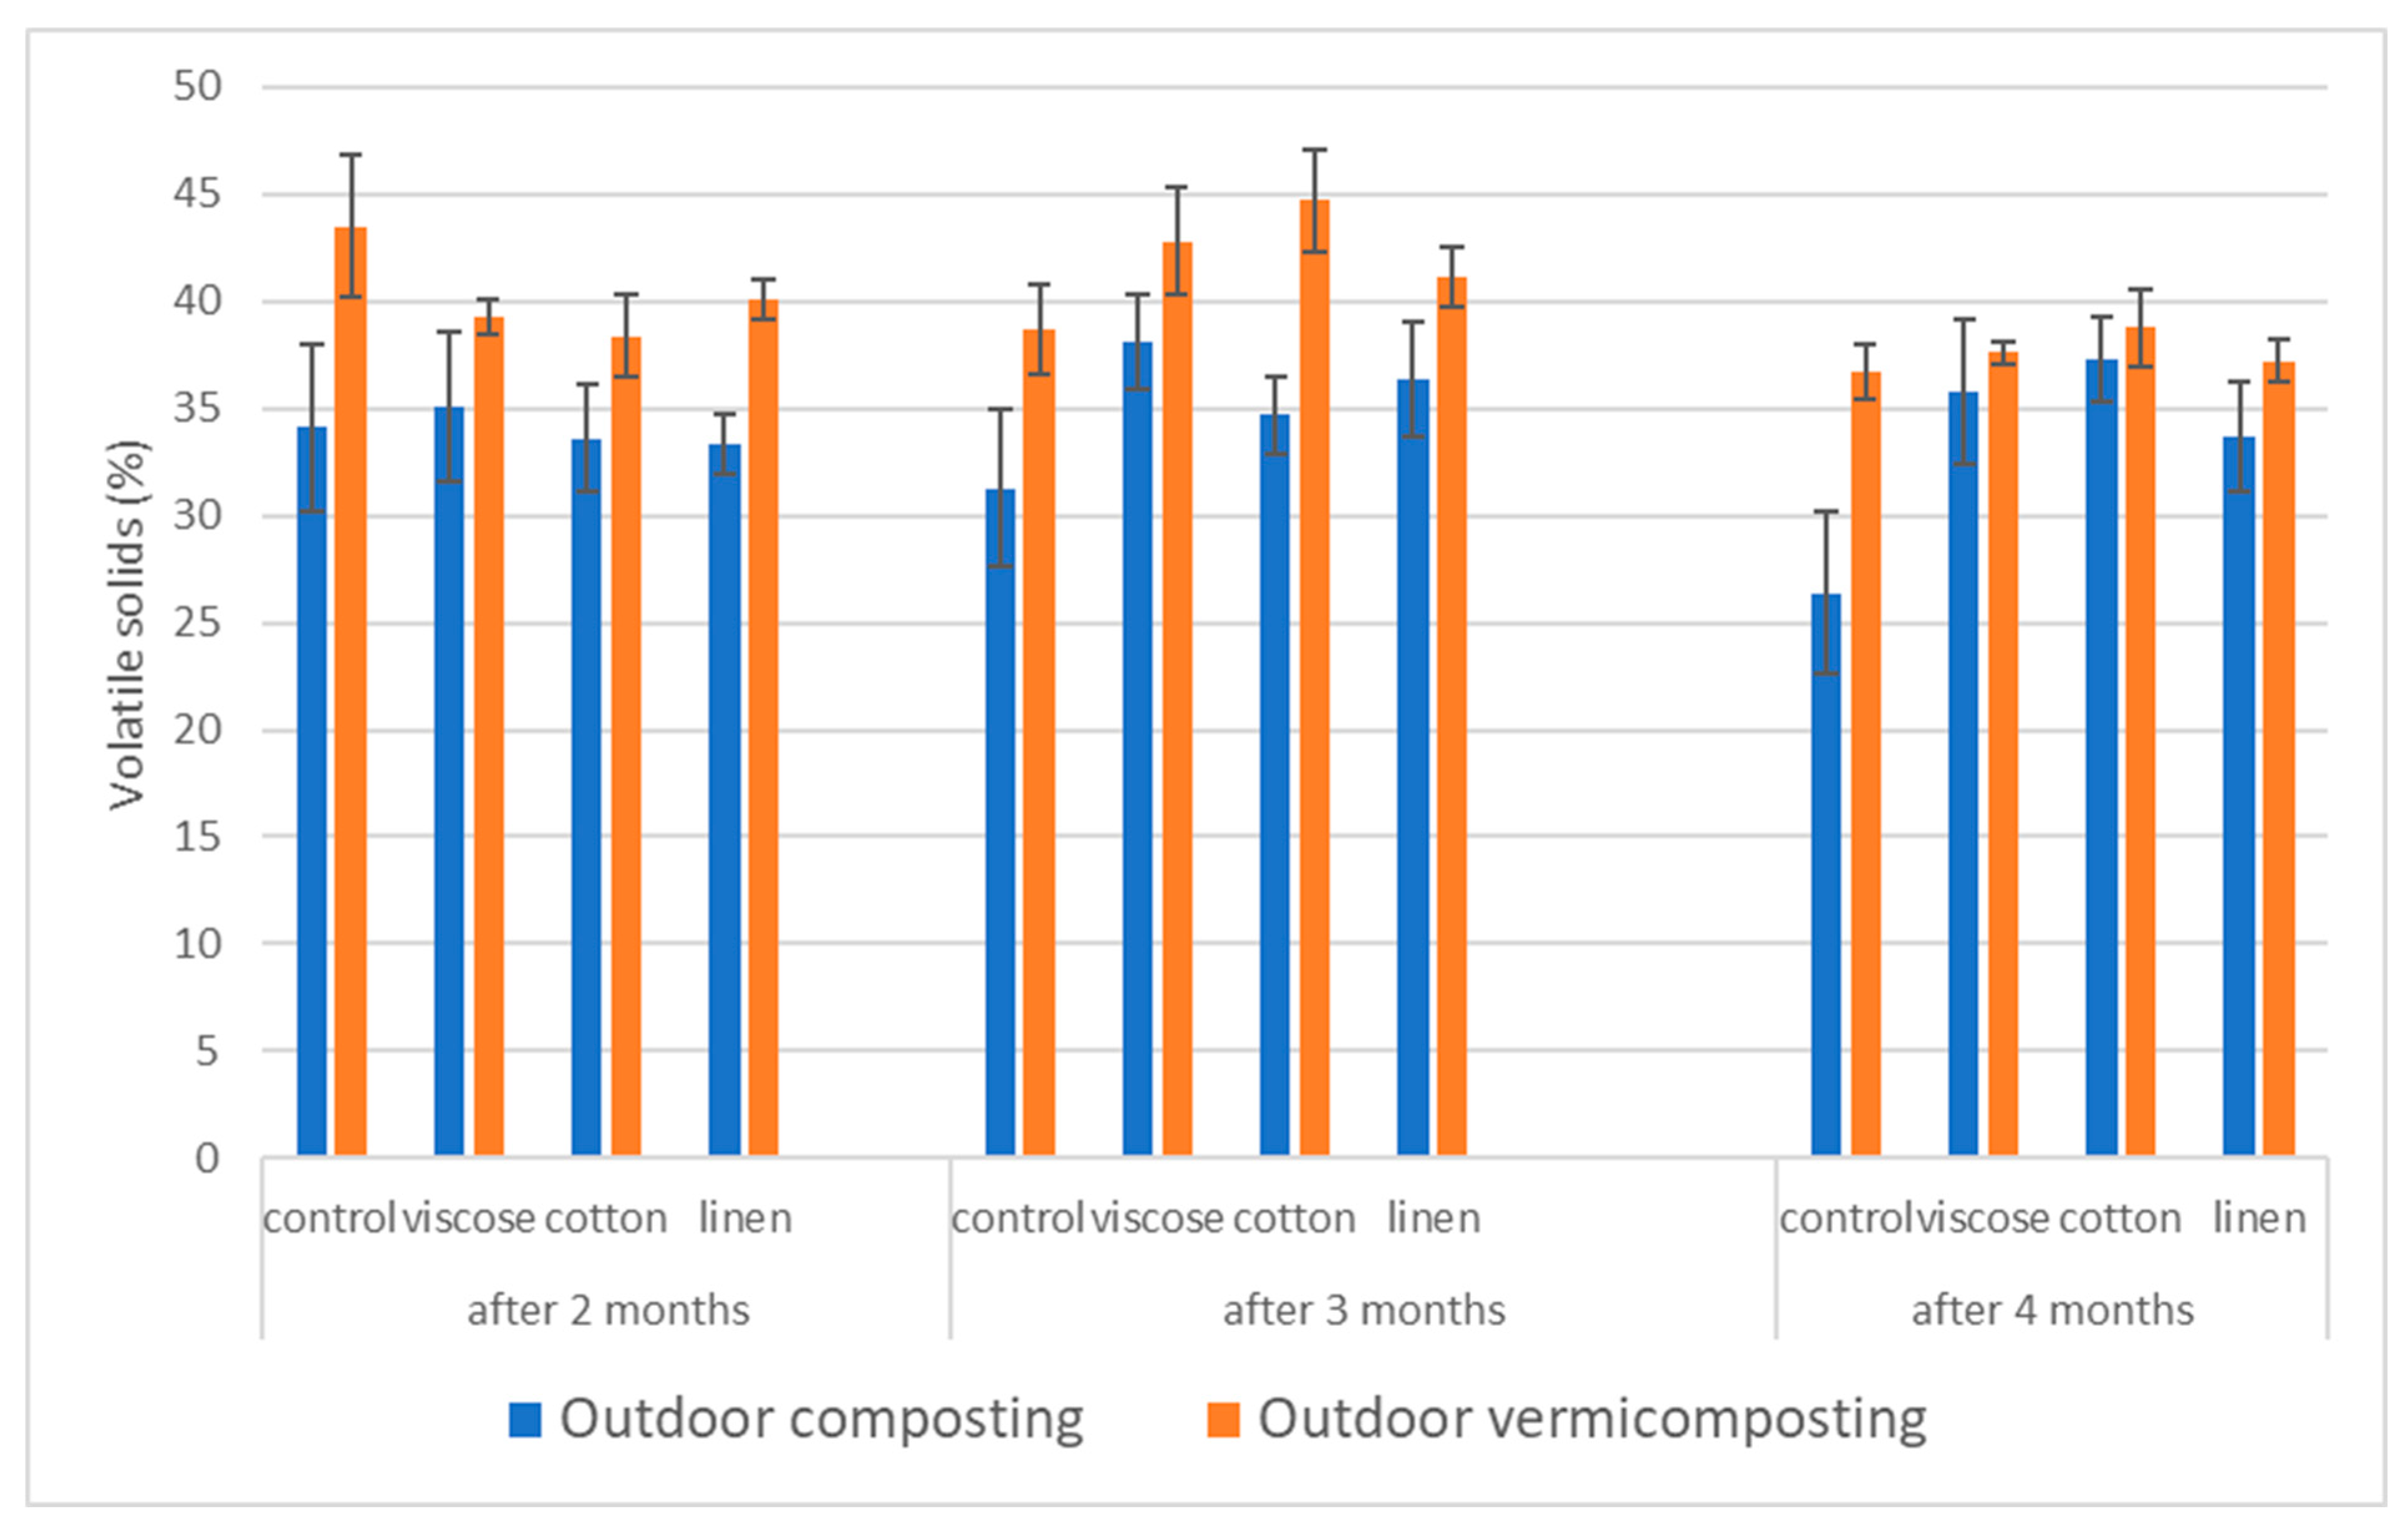
The proportion of vs. represents the percentage of organic matter subject to microbial degradation and serves as an indirect indicator of mineralization progress (Figure 5).
For viscose, the outdoor composting system exhibited the highest vs. content at the second sampling (three months), followed by a gradual decline toward the third sampling, in line with organic matter stabilization. In outdoor vermicomposting, vs. values were initially higher than in composting systems but decreased steadily over time, reflecting enhanced decomposition mediated by earthworms.
In the case of cotton, outdoor composting initially showed values similar to those of other textiles (~34%), while at the final sampling the cotton variant maintained the highest vs. content among composts. Outdoor vermicomposting showed the highest vs. fraction at the second sampling, remaining elevated even after the third, suggesting slower degradation of cellulose-rich fibers under vermicomposting conditions.
Linen substrates displayed a decreasing trend in vs. during outdoor composting, consistent with continuing biodegradation. In outdoor vermicomposting, linen achieved the highest vs. proportion among all vermicomposts during the first sampling (~40%), which subsequently declined toward the final phase, reflecting progressive mineralization of fibrous material.

3.3.4. Carbon and Nitrogen Contents and the C/N Ratio

The balance of total carbon and nitrogen, expressed as the C/N ratio, provides insight into microbial activity and substrate stability. The biodegradation of viscose-containing substrates showed only minor fluctuations in total C and N contents across all composting and vermicomposting systems (Table 8). Total C ranged from 15.1 to 21.7%, while N varied from 1.4 to 1.9%. The resulting C/N ratios remained stable, typically 11.0–11.6, suggesting balanced microbial activity and efficient organic matter stabilization. In outdoor composting, no significant differences were found between sampling times, whereas in controlled composting, a slight increase in C/N ratio was observed at the final sampling (10.7–11.6, p ≤ 0.05), indicating mild carbon enrichment during the maturation phase. Outdoor vermicomposting displayed small but measurable variations (10.9–11.6), while home vermicomposting maintained a steady ratio near 11.3, with only marginal declines in both C and N at the last sampling.
In substrates containing cotton fibers, C and N dynamics remained stable throughout the composting and vermicomposting processes (Table 9). Total C ranged from 16.8 to 20.3%, while total N varied between 1.47 and 1.8%. The C/N ratio stayed within a narrow range of 10.9–11.5, indicating balanced microbial decomposition and uniform organic matter stabilization across all systems. Neither outdoor nor controlled composting showed statistically significant differences between samplings (p > 0.05). Similarly, both outdoor and home vermicomposting maintained consistent C and N levels, reflecting steady mineralization without accumulation or loss of nutrients. The slight fluctuations observed were within natural variability and did not affect substrate maturity.
In substrates containing linen fibers, C and N concentrations remained relatively stable across all composting and vermicomposting systems (Table 10). Total C ranged between 16.1 and 20.9%, while N varied from 1.5 to 1.8%, indicating steady organic matter decomposition. The C/N ratio fluctuated only slightly, remaining between 10.7 and 11.8, which is characteristic of well-stabilized composted material. In outdoor composting, C and N contents showed no statistically significant changes between samplings (p > 0.05), and the C/N ratio remained close to 11. Controlled composting exhibited similar stability, with minor fluctuations (C/N 10.7–11.6), confirming balanced microbial mineralization. In outdoor vermicomposting, the C/N ratio slightly decreased from 11.4 to 10.7 during the second sampling, then increased again to 11.3 in the final sampling, reflecting normal biological variability (p ≤ 0.05). Home vermicomposting displayed the most consistent results, maintaining a nearly constant C/N ratio (11.6–11.8) throughout the process.

3.3.5. Macroelements

During composting, the content of macroelements, specifically phosphorus (P), potassium (K) and magnesium (Mg), were monitored in the samples containing the textile fibers (Table 11). In the case of phosphorus, slightly significant differences were observed only in the substrate with flax (p = 0.02761), where the P content in the first sampling was higher than in the following ones. The other groups (cotton, viscose, control) did not show significant differences between samplings (p > 0.05). For K, no statistically significant differences were found between individual samplings or between individual textiles (p > 0.05). The values ranged from 9375 to 12,536 mg/kg and the variability between groups was low, which indicates stable behavior during the process. For Mg, statistically significant differences were observed especially in the cotton and linen variants, while the viscose and control variants did not show significant variability (p > 0.05). For the cotton substrate (p = 0.01043), the highest magnesium content was recorded at the first sampling, after which the concentration decreased. For the flax substrate, the differences were also significant (p = 0.02278), with the first sampling showing significantly higher values than the subsequent samplings.
In vermicomposting (Table 12), different trends appeared between the samples and materials for all monitored macroelements. For P, statistically significant differences were recorded with viscose (p = 0.01) and flax (p = 0.03). For both viscose and linen variants, the value in the second sample was lower than in the first and third. For the variant with cotton and the control, the differences between samples were nonsignificant (p = 0.06 and p = 0.13). For K, the differences between samples were less pronounced. Statistically significant changes were found only with cotton (p = 0.02), where the K concentration increased in the third sample (14,483 mg/kg). For other fibers and the control, the differences between the samples were nonsignificant (p > 0.05).
The most significant differences were observed in Mg concentrations. With cotton, a significantly higher Mg content was found in the first and third compared to the second samples (p = 0.00). A similar trend was also observed with viscose (p = 0.01) and linen (p = 0.03), while in the control these changes were also significant (p = 0.01), with the lowest value in the second sample. Overall, it can be said that the content of the monitored elements was partially influenced by the sample timing, with Mg showing the greatest variability. However, differences between individual textiles were often comparable to the control, suggesting that these changes may be more related to the properties and dynamics of the vermicompost itself than to the type of fiber used.
When comparing classical composting and vermicomposting, certain differences in the dynamics of nutrient concentrations have been observed with the most significant differences being recorded for Mg. In general, vermicompost has a higher Mg content, while the differences between the samples were more often statistically significant than for traditional compost. This may be due to the activity of earthworms, which accelerate the decomposition and mineralization of organic matter and mobilization of Mg. As for P, in vermicompost, significant differences between samples were recorded more often, especially for viscose and linen, while in compost, the changes were less pronounced and mostly not statistically significant. This result may be related to differences in microbial composition and the presence of earthworms, which affect the P cycle and its release from organic residues. For K, the values were relatively stable in both compost types, and most of the changes in K between compost and vermicompost samples were not statistically significant, indicating the relative stability of this element during the biodegradation process.
These data suggest greater variability in vermicomposting in the content of some nutrients, particularly Mg and P, probably because of the biological activity of the earthworms. Composting shows more stability but slower mineralization.

3.3.6. Potentially Toxic Elements (PTEs)

In Table 13, the concentrations of seven PTEs (Cd, Pb, As, Cr, Cu, Ni and Zn) were measured in the compost and vermicompost during three samplings for different types of fibers (cotton, viscose, flax) and the control. The PTE levels in all of the analyzed samples were well below the limits specified in Regulation (EU) 2019/1009 of the European Parliament and of the Council [26], verifying the environmental safety of these composted materials. For Cd, significant differences were recorded only in the control (p = 0.01), while for textiles the values were above the significance limit: cotton (p = 0.19), viscose (p = 0.05), and linen (p = 0.13). The levels of Pb did not differ significantly between samplings in any of the samples (p > 0.05). For Ni, linen did not show statistical significance (p = 0.01). Arsenic showed very significant differences in all samples with lower As content observed during the sampling period. Chromium changed significantly in the cotton variant (p = 0.02) and in the linen variant (p = 0.03), while in the viscose variant and the control sample the differences were statistically nonsignificant (p = 0.56 and p = 0.31). Cu changed significantly only in the viscose variant (p = 0.03), while for the other types of fibers the p-values were >0.1. Zinc showed statistically significant differences in the cotton variant (p = 0.03) and the linen variant (p = 0.03). In the viscose variant and the control samples the differences were not significant (p = 0.50 and p = 0.65).
In terms of the effect of composting time on PTE concentrations, a slight decrease in the values of some hazardous elements was observed during the sampling, especially for As, where this trend was evident across all monitored textile types and the control sample. Similar decreasing trends were noted for Cd and Pb in some samples, although these changes were not always statistically significant. These results suggest that partial immobilization or transformation of some metals may occur during composting, thus reducing their bioavailability.
The content of PTEs in vermicompost (Table 14) differed slightly between textiles, but none of the measured values exceeded the limits of toxic concentrations set by European Union legislation [26]. In the case of Cd, similar concentrations were measured in most samples. Statistically significant differences were recorded for cotton (p = 0.03) and viscose (p = 0.01), which indicates a change in Cd concentration during sampling. In the control, the values were also statistically significant (p = 0.03). In the case of Pb, the values were again lower than the limit. In the cotton variant, the differences between the samples were statistically significant (p = 0.00), while in the other textiles the differences were not statistically significant. Interesting results were found for As, where it significantly decreased over time in all fiber types. The p-values were very low for all textiles (p <0.00), confirming a statistically significant decrease in the content of this element.
Chromium changed significantly in most textiles: cotton (p = 0.01), viscose (p = 0.00) and linen (p = 0.02). However, in the control, the differences between the samples were not significant (p = 0.08). In the case of Cu, the changes in values were statistically significant, but still lower than the limit with all textiles: cotton (p = 0.03), viscose (p = 0.01), linen (p = 0.01) and control (p = 0.05). This trend, namely that the value increased significantly from the second sample to the third, was seen for all three types of textiles and the control. In the case of Ni, the differences between the samples in most textiles were significant: cotton (p = 0.00), viscose (p = 0.04) and linen (p = 0.01). However, the values remained well below the toxicity limits. The control was nonsignificant (p = 0.08). Zinc was the most abundant element, but its content remained well below the toxicity limit (800 mg kg−1). Statistically significant differences were observed with viscose (p = 0.01) and linen (p = 0.01), but the variant with cotton was right at the limit of significance (p = 0.05) and the control was not significant (p = 0.08). Here again, a trend of increasing values from the second to the third sampling was evident.
The differences between compost and vermicompost in terms of PTE content were generally moderate, but in some cases statistically significant. For example, for As, both types of biodegradation showed significant decreases in concentrations during the sampling period, with p-values being highly significant in all cases. For Cu and Cr, statistically significant differences between sampling periods were more common in vermicompost than in compost, which may be related to the biological activity of earthworms and their influence on the mobilization or accumulation of these elements. For Cd and Pb, the contents were comparable and well below the toxicity limits, but in vermicompost, statistically significant fluctuations between sampling periods were recorded in several samples. In contrast, Ni and Zn did not show dramatic differences between biodegradation types, although their variability was somewhat higher in vermicompost. Overall, none of the monitored PTEs exceeded the legislative limits, and the differences between compost and vermicompost can be attributed to biological activity and process dynamics rather than the presence of the textile itself.
4. Discussion

4.1. Biodegradability of Textiles

The results of this study demonstrate that the natural textiles, cotton, viscose, and linen, all underwent complete biodegradation under simulated household and outdoor vermicomposting conditions, as well as in simulated outdoor composting within two months. In the case of controlled composting, degradation reached 98–99% after four months. These composting biodegradation values are comparable to those reported by Arshad et al. [27], who examined the biodegradation of four types of natural fibers (flax, jute, cotton, and wool) in soil. In their experiments, textile samples (5 × 5 cm squares) were placed in 1 L glass containers filled with stabilized compost derived from the organic fraction of municipal waste. The containers were kept in a climate-controlled chamber with constant high humidity (95–100%) and a temperature of 29 °C for four weeks. Textile samples were periodically removed to assess the degree of decomposition. The most rapid degradation was observed for flax, which after two weeks could no longer be easily separated from the compost. Cotton degraded more slowly, over approximately three weeks. Microscopic analysis revealed that the biodegradation of cellulose-based textile materials proceeded similarly to that of non-cellulosic materials (wool), with the only difference being the rate of decomposition. Wool exhibited greater resistance to microbial attack due to its molecular structure and surface properties.
In contrast, our experiments focused on simulating household composting and vermicomposting. The biodegradation did not occur in a controlled climatic chamber with stabilized compost, but rather in mixtures prepared from commonly available biowaste supplemented with mature compost. The mixtures were sampled and inspected at two, three, and four months, and agrochemical parameters (pH, EC) of the resulting composts were also evaluated.
The findings of a study by Esmaeilzadeh and Rashidi [28] confirmed the high biodegradability of linen fabric, with disintegration reaching 55% and weight loss up to 61%. Their composting experiment, conducted under controlled temperature conditions, indicated that the most efficient degradation occurred within temperature ranges of 39–44 °C and 65–70 °C. Similarly, the research of Sülar and Devrim [29] investigated the biodegradation of fabrics made from cotton, viscose, modal, Tencel, polylactic acid, polyethylene terephthalate, and polyacrylonitrile. They used the soil burial method under microbial activity for one and four months. Textile pieces (5 × 5 cm) were placed in 1 L acrylic boxes containing a mixture of white and black peat under controlled conditions of 25 °C and 95% RH. The study showed that cellulosic fabric samples exhibited notable physical and chemical changes at one month. Among the cellulosic fibers, modal, cotton, and viscose fabrics experienced approximately 90% weight loss, indicating high degradation, while Tencel showed the lowest degradation (60%) after four months. Among the synthetic fabrics, only polylactic acid exhibited measurable weight loss.
The slower and more variable degradation of flax fibers observed in this study can be attributed to their complex biochemical composition and hierarchical fiber structure. Flax contains high proportions of crystalline cellulose tightly bound with hemicelluloses, pectins, and lignin, forming compact fiber bundles that restrict enzymatic and microbial accessibility [30]. The lignin–hemicellulose network provides both a physical barrier and chemical recalcitrance, limiting cellulase penetration and slowing the onset of microfracturing during biodegradation. In contrast, viscose, with its regenerated amorphous cellulose and lack of lignin, is readily depolymerized by microbial enzymes, leading to rapid mass loss. Studies have shown that lignin content and cellulose crystallinity are key determinants of degradation kinetics in lignocellulosic materials, as higher crystallinity and lignin crosslinking markedly reduce enzymatic hydrolysis rates [31].
Within vermicomposting systems, mechanical fragmentation and bioturbation by Eisenia andrei promote fiber disruption and partial delamination of lignified bundles, while enhanced microbial activity and secretion of ligninolytic enzymes (such as laccase and peroxidase) further accelerate the decomposition of lignin-rich substrates. The higher degradation efficiency observed in vermicomposting compared to composting can be attributed to the synergistic interaction between earthworms and microorganisms. The ingestion and fragmentation of fibers by Eisenia spp. increase the surface area available for microbial attack, while the worm gut and casts create favorable niches for cellulolytic and ligninolytic microbiota [32,33]; enzyme-mediated depolymerization further accelerates this process. Vermicomposting systems show characteristic dynamics of microbial biomass and increased activities of cellulases/CMCase during processing and aging of vermicompost [34,35]. In parallel, continuous bioturbation by earthworms improves aeration, moisture distribution, and mixing, helping to sustain aerobic conditions and stimulate microbial metabolism. As a result of these combined physicochemical and biological effects, vermicomposting achieves faster disintegration and stabilization of organic substrates than conventional composting in comparative studies [36,37]. Enhanced fungal activation associated with Eisenia activity also contributes to more efficient cellulose digestion in vermicomposting matrices [38], and direct comparisons of aerobic composting vs. vermicomposting show stronger depletion of cellulose/lignin and improved nutrient status in the latter [39].

4.2. Increase in Earthworm Abundance During Vermicomposting

Our results indicated that the number of earthworms varied across different types of vermicompost during the sampling periods. Differences were observed not only between the types of textiles but also between the vermicomposting systems used. With household vermicomposting, the number of earthworms increased during the second sampling period but declined again in the third. This could be attributed to environmental conditions initially favorable to population growth that declined over time. A similar but less pronounced pattern was observed in the outdoor vermicomposting system. Statistically significant changes occurred particularly with linen and viscose. Optimal moisture and aeration, combined with the presence of biodegradable organic matter, play a critical role in determining the activity and population dynamics of earthworms [40]. In a previous experiment, the presence of cotton textiles in the vermicomposted substrate did not negatively affect the population of Eisenia fetida, which increased over a three-month period [25].
Vermicomposting of lignocellulosic feedstock under various stocking densities of Eisenia fetida and Eudrilus eugeniae has shown that earthworm populations increased significantly under lower stocking densities, while higher densities (15 individuals/kg) were associated with physiological stress. X-ray diffraction (XRD) analysis of cellulose crystallinity indicated that the fragmentation efficiency of Eisenia and Eudrilus was optimal at stocking densities of 7 and 10 individuals/kg, respectively. Additionally, 5 to 7 earthworms per kg of substrate effectively stimulated microbial activity, enhancing NPK mineralization and the carbon humification balance. These findings suggest that stocking densities of 5–7 worms per kg are optimal for high-quality, sanitized vermicompost [41].
In our vermicomposting trial, a worm substrate containing 100 individuals per kg was used. This was mixed with biowaste in a ratio of 1:5, resulting in an initial number of 16 earthworms per kg of the starting mixture, to which textile material was added. After two months of vermicomposting, the number of earthworms increased sevenfold in both the household and outdoor systems. After three months, even greater increases were recorded, 17-fold and 8-fold relative to the initial population in the household and outdoor systems, respectively. However, after four months, the earthworm population declined to near initial levels, likely due to the depletion of available organic matter from both the biowaste and the added textile material.

4.3. Agrochemical Characteristics During Composting and Vermicomposting

Statistically significant differences in pH among the different textile types were not observed. In most cases, the pH remained mildly alkaline (8.6–9.3). The cotton variant exhibited the most stable pH, with no significant differences between sampling intervals, while viscose and linen textiles showed slight variability. Regarding electrical conductivity, the textile fibers demonstrated minor fluctuations throughout the biodegradation processes. Cotton again displayed the highest stability, with most composting and vermicomposting systems showing no statistically significant differences between sampling points. Viscose and linen textiles exhibited the greatest variability, with the most pronounced differences observed with linen, likely due to its higher lignin content. Previous studies have reported that the decomposition of flax-based biocomposites results in significant structural fiber changes and corresponding chemical fluctuations [17].
In this study, the cotton textile also showed the most stable carbon-to-nitrogen (C/N) ratio, with only slight variations recorded over time. In contrast, the viscose and linen variants showed a broader range of C/N values. A study by Singh et al. [25] also investigated cotton textile biodegradation in a vermicomposting system. Their experiments involved a two-phase process: a four-week pre-composting period with a mixture of biowaste, manure, and shredded cotton textile, followed by a three-month vermicomposting trial with Eisenia fetida. The initial C/N ratio was adjusted to 25:1, which declined to 14–15 by the end of the experiment. The presence of textile material did not negatively affect the quality of the resulting vermicompost. In contrast, our experiments did not include a pre-composting phase. Textiles were added directly into the composting mixture or worm substrate, containing pre-stabilized compost, simulating common household practices. Nevertheless, complete textile decomposition was observed within two months, and the C/N ratio remained stable from 10.7 to 11.8.
The macronutrient content, specifically P, K, and Mg, was also monitored to assess potential enrichment of the final substrate. All three textile types showed some fluctuations in nutrient levels over time; however, no substantial differences were found between the materials. Once again, the cotton textile demonstrated the lowest variability. Linen showed significant differences, particularly in P concentrations, while viscose maintained relatively stable values.
When comparing composting and vermicomposting methods, differences in nutrient contents were apparent. The most notable difference was observed in Mg content, which was higher in vermicompost. Phosphorus showed greater variability in vermicompost, whereas in composted samples of all textile types, P levels remained relatively stable. Potassium levels were consistent across all environmental conditions.
From these findings, it can be concluded that the cotton variant was the most stable textile across all measured parameters, including pH and macronutrient content. The linen variant showed the highest variability, likely due to its complex fiber structure and potentially higher lignin content, along with the presence of pectin and hemicellulose [17]. The viscose variant behaved relatively consistently, with changes in measured values likely attributed to differences in biodegradation conditions rather than the properties of the fiber itself. The results also suggest differences in stability between the two biodegradation methods. The most consistent trends in both pH and EC were repeatedly observed in controlled composting systems. Here, smaller differences and lower standard deviations were noted between sampling intervals. This trend to more even decomposition is likely due to the controlled temperature, moisture, and oxygen availability, along with the addition of pre-stabilized compost to the mixtures. As this compost was already undergoing minimal biochemical changes, differences between sampling periods were not statistically significant in some cases. In contrast, outdoor composting and household vermicomposting exhibited greater variability in measured values, likely influenced by fluctuating conditions, microbial activity, and inconsistent distribution of composted material. Despite the higher variability, both methods demonstrated consistent degradation patterns for all tested natural fiber textiles.

4.4. Potentially Toxic Elements (PTEs) During Composting and Vermicomposting

The results showed that in all analyzed samples, the concentrations of PTEs remained well below the limits established by the applicable legislation. This confirms the potential for using natural fiber waste in composting and vermicomposting systems. The highest values were recorded for zinc, copper, and chromium. In contrast, arsenic and cadmium occurred at very low concentrations in some samples. Statistical analysis revealed significant differences between sampling periods for several elements. This may indicate their release or migration within the decomposition process. In the cotton variant with its greater stability, the differences were minimal, whereas statistically significant differences were observed with linen and viscose. Differences were also evident between the two biodegradation types. During vermicomposting, more statistically significant differences between sampling times were detected compared to traditional composting, which may be related to higher biological activity and more variable environmental conditions.
The results indicate that, despite minor fluctuations in the contents of the monitored PTEs during biodegradation, none of the tested textiles represent an environmental threat in terms of PTE content. These findings support the hypothesis that natural textiles can be safely processed through composting and vermicomposting without the risk of soil contamination by heavy metals. This trend is also consistent with the findings of Galashina et al. [17], who reported that natural fibers, particularly linen, exhibited biodegradation capability with minimal risk of soil contamination. They also noted that observed variations in contents are more likely influenced by microbial activity rather than composition of the textile material.

5. Conclusions

The study demonstrated that textiles made from natural fibers undergo rapid biodegradation in both composting and vermicomposting systems, with vermicomposting showing a faster degradation rate. This finding confirms the first hypothesis and highlights the potential of vermicomposting as an effective method for the treatment of natural fiber textiles. Significant differences in degradation behavior were observed among fiber types, with cotton exhibiting the highest stability, viscose degrading the fastest, and linen showing intermediate performance, confirming the second hypothesis.
The addition of natural fibers did not adversely affect the quality of the final compost or vermicompost. Parameters such as pH, electrical conductivity, content of macroelements and PTEs remained within standard limits, confirming the third hypothesis. All measured PTE levels were well below regulatory thresholds, indicating the safety of natural fiber textile waste in compost and vermicompost for agricultural use. Moreover, an increase in nutrient content was observed in some treatments, suggesting potential agronomic benefits from textile fiber addition. Active pH/H2O and EC in the final compost/vermicompost were 8.9 and 1.6 mS cm−1, respectively. The carbon-to-nitrogen ratio was stable around 11, with a total N content of 1.7% in DM, a total P content of 0.3% in DM, a total K content of 1.3% in DM and a total Mg content of 0.4% in DM. Based on the nutrient content observed, the final compost and vermicompost could be applied to soil at conventional rates (e.g., 20 tons per hectare once every three years) to improve soil fertility without risk of toxic element accumulation.
Overall, the results indicate that natural textiles can be safely included as a component of biowaste intended for composting or vermicomposting without compromising product quality or environmental safety. Future research should address the biodegradability of hybrid or blended fiber textiles (natural–synthetic fiber mixes) under composting and vermicomposting conditions. Since modern textile waste often contains blends like cotton/polyester fabrics, investigating their decomposition dynamics and impact on compost quality is a critical next step. This will clarify how synthetic components influence biodegradation and will guide sustainable waste management strategies for mixed textile materials. Future studies should also include additional parameters, such as microbial activity dynamics and greenhouse gas emissions, to more fully assess the environmental implications of textile biodegradation.

Author Contributions

Conceptualization, A.H.; methodology, A.H.; formal analysis, M.H., T.H., T.P. and D.K.; investigation, P.M. and T.P.; resources, A.H.; data curation, T.H.; writing—original draft preparation, A.H. and T.P.; writing—review and editing, A.H. and T.P.; visualization, T.H.; supervision, A.H.; project administration, A.H.; funding acquisition, A.H. All authors have read and agreed to the published version of the manuscript.

Funding

This research was funded by the Czech University of Life Sciences, Prague, under project no. SV24-9-21140.

Institutional Review Board Statement

Not applicable.

Data Availability Statement

All data created during the study is included in the current publication.

Acknowledgments

The authors would like to thank Gary Bentley, for professionally reviewing and editing the English text.

Conflicts of Interest

The authors declare no conflicts of interest. The funders had no role in the design of the study; in the collection, analyses, or interpretation of data; in the writing of the manuscript; or in the decision to publish the results.

References

  1. Ellen MacArthur Foundation. Fashion and the Circular Economy—Deep Dive. 2021. Available online: https://www.ellenmacarthurfoundation.org/fashion-and-the-circular-economy-deep-dive (accessed on 15 October 2025).
  2. Deepika, G.; Thennarasu, P.; Ramratan, G. Explores the role of fast fashion in sustainability: Stylish killer for the environment. J. Text. Eng. Fash. Technol. 2022, 8, 59–63. [Google Scholar] [CrossRef]
  3. Rapsikevičienė, J.; Gurauskienė, I.A.; Jučienė, A. Model of industrial textile waste management. Environ. Res. Eng. Manag. 2019, 75, 43–55. [Google Scholar] [CrossRef]
  4. Sutha, T. Sustainability issues in fast fashion clothing. Int. J. Multidiscip. Res. 2024, 6, 1–9. [Google Scholar]
  5. Miranda, J.A.; Roldán, A. Fast fashion—A Successful Business Model Forced to Transform. In Book The Routledge History of Fashion and Dress, 1800 to the Present, 1st ed.; Pouillard, V., Dubé-Senécal, V., Eds.; Taylor & Francis Group: London, UK, 2023; pp. 266–285. [Google Scholar]
  6. Jönsson, C.; Wei, R.; Biundo, A.; Landberg, J.; Bour, L.S.; Pezzotti, F.; Toca, A.; Jacques, L.M.; Bornscheuer, U.T.; Syrén, P.O. Biocatalysis in the recycling landscape for synthetic polymers and plastics towards circular textiles. ChemSusChem 2021, 14, 4028–4040. [Google Scholar] [CrossRef] [PubMed]
  7. Collie, S.; Brorens, P.; Hassan, M.; Fowler, I. Biodegradation behavior of wool and other textile fibers in aerobic composting conditions. Int. J. Environ. Sci. Technol. 2024, 22, 2113–2125. [Google Scholar] [CrossRef]
  8. Hubbe, M.A.; Daystar, J.S.; Venditti, R.A.; Pawlak, J.J.; Zambrano, M.C.; Barlaz, M.; Ankeny, M.; Pires, S. Biodegradability of cellulose fibers, films, and particles: A Review. BioResources 2025, 20, 2391–2458. [Google Scholar] [CrossRef]
  9. Kim, S.; Cho, Y.; Park, C.H. Effect of cotton fabric properties on fiber release and marine biodegradation. Text. Res. J. 2022, 92, 2121–2137. [Google Scholar] [CrossRef]
  10. Smith, S.; Ozturk, M.; Frey, M. Soil biodegradation of cotton fabrics treated with common finishes. Cellulose 2021, 28, 4485–4494. [Google Scholar] [CrossRef]
  11. Neto, C.B.S.; Gomes, T.G.; Filho, E.X.F.; Fontes, W.; Ricart, C.A.O.; de Almeida, J.R.M.; de Siqueira, F.G.; Miller, R.N.G. An enzymatic and proteomic analysis of Panus lecomtei during biodegradation of gossypol in cottonseed. J. Fungi 2024, 10, 321. [Google Scholar] [CrossRef]
  12. Seisl, S.; Hengstmann, R. Manmade Cellulosic Fibers (MMCF)—A Historical Introduction and Existing Solutions to a More Sustainable Production. In Sustainable Textile and Fashion Value Chains, 1st ed.; Matthes, A., Beyer, K., Cebulla, H., Arnold, M.G., Schumann, A., Eds.; Springer International Publishing: Heidelberg, Germany, 2021; pp. 3–22. [Google Scholar]
  13. Niu, J.T.; Zhang, X.Y.; Pei, N.N.; Tian, Q.L. Biodegradability of cellulose fibers and the fabrics in activated sludge. Appl. Mech. Mater. 2012, 217–219, 91–8922. [Google Scholar] [CrossRef]
  14. Forsberg, D.C.R.; Bengtsson, J.; Hollinger, N.; Kaldéus, T. Towards sustainable viscose-to-viscose production: Strategies for recycling of viscose fibres. Sustainability 2024, 16, 4127. [Google Scholar] [CrossRef]
  15. Preisner, M.; Wojtasik, W.; Szopa, J.; Kulma, A. The development, differentiation and composition of flax fiber cells. Postep. Biochem. 2015, 61, 416–429. [Google Scholar]
  16. Alimuzzaman, S.; Gong, R.H.; Akonda, M. Biodegradability of nonwoven flax fiber reinforced polylactic acid biocomposites. Polym. Compos. 2014, 35, 2094–2102. [Google Scholar] [CrossRef]
  17. Galashina, V.N.; Moryganov, P.A.; Dymnikova, N.S. Bio-protected flax nanocomposites as basis for manufacturing of high-tech eco-products. Russ. J. Gen. Chem. 2012, 82, 2270–2278. [Google Scholar] [CrossRef]
  18. Moryganov, P.A.; Galashina, V.N.; Zavadskii, A.E. Biodegradation of flax fibers in the presence of silver nanoparticles. Russ. J. Appl. Chem. 2010, 83, 1615–1621. [Google Scholar] [CrossRef]
  19. Gupta, L.; Saini, H.K. Achieving sustainability through zero waste fashion- review. Curr. World Environ. 2020, 15, 154–162. [Google Scholar] [CrossRef]
  20. Hanč, A.; Hřebečková, T. Compostability and vermicompostability of greaseproof wrapping paper. Sustain. Chem. Pharm. 2023, 32, 101014. [Google Scholar] [CrossRef]
  21. Selvam, R.; Ramesh, P.; Pitchaimani, J.; Gilbert Ross Rex, K.G.; Santhamoorthy, M.; Sadasivam, S.K. Biotransformation of textile industry sludge through vermicomposting with Eudrilus eugeniae: Investigation of GC–MS and genotoxic assessment. Soil Sediment. Contam. 2025, 34, 2393–2418. [Google Scholar] [CrossRef]
  22. Miao, Y.; Li, Y.; Niu, Y.; He, T.; Liu, D.; Ding, W. Long-term compost amendment spurs cellulose decomposition by driving shifts in fungal community composition and promoting fungal diversity and phylogenetic relatedness. mBio 2022, 13, e00323-22. [Google Scholar] [CrossRef]
  23. Shanmugam, V.; Subbaiyan, B.; Shakshi, P.; Begum, B.; Selvam, R.; Gnanendra, T.S.; Balasubramanian, R. Vermicomposting: A potential technology facilitating sustainable textile waste management. J. Mater. Cycles Waste Manag. 2025, 27, 3055–3075. [Google Scholar] [CrossRef]
  24. Chowdhury, A.; Sarkar, A. Vermicomposting—The sustainable solid waste management. In Waste Management and Resource Recycling in the Developing World, 1st ed.; Singh, P., Verma, P., Singh, R., Ahamad, A., Batalhao, A.C.S., Eds.; Elsevier: Amsterdam, The Netherlands, 2023; pp. 701–719. [Google Scholar]
  25. Singh, V.; Wyatt, J.; Zoungrana, A.; Yuan, Q. Evaluation of vermicompost produced by using post-consumer cotton textile as carbon source. Recycling 2022, 7, 10. [Google Scholar] [CrossRef]
  26. Regulation (EU) 2019/1009 of the European Parliament and of the Council of 5 June 2019 Laying Down Rules on the Making Available on the Market of EU Fertilising Products and Amending Regulations (EC) No 1069/2009 and (EC) No 1107/2009 and repealing Regulation (EC) No 2003/2003. Official Journal of the European Union L 170/1. Available online: https://eur-lex.europa.eu/eli/reg/2019/1009/oj (accessed on 29 October 2025).
  27. Arshad, K.; Skrifvars, M.; Vivod, V.; Volmajer, J.; Voncina, B. Biodegradation of natural textile materials in soil. Tekstilec 2014, 57, 118–132. [Google Scholar] [CrossRef]
  28. Esmaeilzadeh, M.J.; Rashidi, A. Evaluation of the disintegration of linen fabric under composting conditions. Environ. Sci. Pollut. Res. 2018, 25, 29070–29077. [Google Scholar] [CrossRef]
  29. Sülar, V.; Devrim, G. Biodegradation Behaviour of different textile fibres: Visual, morphological, structural properties and soil analyses. Fibres Text. East. Eur. 2019, 27, 100–111. [Google Scholar] [CrossRef]
  30. Morvan, C.; Andème-Onzighi, C.; Girault, R.; Himmelsbach, D.S.; Driouich, A.; Akin, D.E. Building flax fibres: More than one brick in the wall. Plant Physiol. Biochem. 2003, 41, 935–944. [Google Scholar] [CrossRef]
  31. Peng, F.; Peng, P.; Xu, F.; Sun, R.C. Fractional Purification and Bioconversion of Hemicelluloses. Biotechnol. Adv. 2012, 30, 879–903. [Google Scholar] [CrossRef] [PubMed]
  32. Vuković, A.; Velki, M.; Ečimović, S.; Vuković, R.; Štolfa Čamagajevac, I.; Lončarić, Z. Vermicomposting—Facts, benefits and knowledge gaps. Agronomy 2021, 11, 1952. [Google Scholar] [CrossRef]
  33. Domínguez, J.; Edwards, C.A. Vermicomposting organic wastes: A review. In Soil Zoology for Sustainable Development in the 21st Century; Shakir Hanna, S.H., Mikhaïl, W.Z.A., Eds.; Cairo, Egypt, 2004; pp. 369–395. Available online: https://jdguez.webs.uvigo.es/wp-content/uploads/2011/10/cairo1.pdf (accessed on 29 October 2025).
  34. Aira, M.; Monroy, F.; Domínguez, J. Microbial Biomass Governs Enzyme Activity Decay during Vermicompost Aging of worm-worked substrates through vermicomposting. J. Environ. Qual. 2007, 36, 448452. [Google Scholar] [CrossRef]
  35. Aira, M.; Domínguez, J. Earthworm effects without earthworms: Inoculation of raw organic matter with worm-worked substrates alters microbial community functioning. PLoS ONE 2011, 6, e16354. [Google Scholar] [CrossRef]
  36. Lazcano, C.; Gómez-Brandón, M.; Domínguez, J. Comparison of the effectiveness of composting and vermicomposting. Chemosphere 2008, 72, 1013–1019. [Google Scholar] [CrossRef]
  37. Cai, L.; Gong, X.; Sun, X.; Li, S.; Yu, X. Comparison of chemical and microbiological changes during the aerobic composting and vermicomposting of green waste. PLoS ONE 2018, 13, e0207494. [Google Scholar] [CrossRef] [PubMed]
  38. Aira, M.; Monroy, F.; Domínguez, J. Eisenia fetida (Oligochaeta, Lumbricidae) activates fungal growth, triggering cellulose decomposition during vermicomposting. Microb. Ecol. 2006, 52, 738–747. [Google Scholar] [CrossRef] [PubMed]
  39. Gómez-Brandón, M.; Aira, M.; Lores, M.; Domínguez, J. Changes in microbial community structure and function during vermicomposting of pig slurry. Bioresour. Technol. 2011, 102, 4171–4178. [Google Scholar] [CrossRef]
  40. Hanc, A.; Hrebeckova, T.; Grasserova, A.; Cajthaml, T. Conversion of spent coffee grounds into vermicompost. Bioresour. Technol. 2021, 341, 125925. [Google Scholar] [CrossRef]
  41. Devi, J.; Pegu, R.; Mondal, H.; Roy, R.; Bhattacharya, S.S. Earthworm stocking density regulates microbial community structure and fatty acid profiles during vermicomposting of lignocellulosic waste: Unraveling the microbe-metal and mineralization-humification interactions. Bioresour. Technol. 2023, 367, 128305. [Google Scholar] [CrossRef] [PubMed]
Figure 1. Scheme of textile composting and vermicomposting.
Agronomy 15 02700 g001
Figure 2. Loss of weight of textiles after 2, 3 and 4 months as a percentage of initial dry matter, during outdoor composting (a), controlled composting (b), outdoor vermicomposting (c) and home vermicomposting (d); mean ± SD, n = 3.
Agronomy 15 02700 g002
Figure 3. Microscopic images (30×) of viscose, cotton, and linen textile samples under controlled composting conditions. (a) input material, viscose; (b) viscose residue after three months of controlled composting; (c) input material, cotton; (d) cotton residue after three months of controlled composting; (e) input material, linen; (f) linen residue after three months controlled composting. The scale bar of 1 mm is at the bottom right of each picture.
Agronomy 15 02700 g003
Figure 4. (a) Remains of viscose garment after three months of composting. (b) Remains of linen garment (including earthworms) after three months of vermicomposting.
Agronomy 15 02700 g004
Figure 5. Comparison of volatile solids in outdoor composting and outdoor vermicomposting after 2, 3 and 4 months; mean ± SD, n = 3.
Agronomy 15 02700 g005
Table 1. Weight (%) and volume (%) ratio, and bulk density (g/L) of raw materials for composting and vermicomposting of textiles (same for both).
Raw Material% By Weight% By VolumeBulk Density (g/L)
Compost *5954770
Fruit and vegetable scraps3837738
Wood chips37289
Shredded paper0.3380
* The original compost mixture was composed of grass clippings, fruit and vegetable scraps, chipped branches, and weeds.
Table 2. Basic properties of the earthworms and the substrate used.
PropertyAverage ± Standard
Deviation
Bulk density of substrate with earthworms (g/L)555 ± 16.2
Number of earthworms (pcs/kg of substrate)100 ± 12.4
Biomass of earthworms (g/kg of substrate)16 ± 2.6
Biomass of earthworms after lyophilization (g/kg of substrate)2.4 ± 0.4
Dry matter of the substrate without earthworms (%)20.4 ± 1.2
Table 3. Number of Eisenia andrei earthworms in samples with viscose.
Type of VermicompostingUptakeNumber of Earthworms (Pieces/kg of Vermicompost)
Outdoor1st102 ± 14.5 a
Outdoor2nd105 ± 16.3 a
Outdoor3rd200 ± 32.4 b
Home1st107 ± 51.8 a
Home2nd262 ± 34.7 a
Home3rd170 ± 42.6 a
Different letters in the column indicate statistically significant differences between samples (ANOVA, p ≤ 0.05), mean ± SD, n = 3.
Table 4. Number of Eisenia andrei earthworms in samples with cotton.
Type of VermicompostingUptakeNumber of Earthworms (Pieces/kg of Vermicompost)
Outdoor1st142 ± 42.9 a
Outdoor2nd162 ± 14.3 a
Outdoor3rd143 ± 19.3 a
Home1st130 ± 43.2 b
Home2nd297 ± 65.1 a
Home3rd155 ± 51.2 ab
Different letters in the column indicate statistically significant differences between samples (ANOVA, p ≤ 0.05), mean ± SD, n = 3.
Table 5. Number of Eisenia andrei earthworms in samples with linen.
Type of VermicompostingUptakeNumber of Earthworms (Pieces/kg of Vermicompost)
Outdoor1st148 ± 6.2 b
Outdoor2nd95 ± 12.2 a
Outdoor3rd137 ± 23.9 ab
Home1st88 ± 8.5 b
Home2nd253 ± 28.4 a
Home3rd117 ± 31.2 b
Different letters in the column indicate statistically significant differences between samples (ANOVA test for outdoor vermicomposting; Kruskal–Wallis test for home vermicomposting; p ≤ 0.05), mean ± SD, n = 3.
Table 6. Values of pH in individual uptakes of different types of biodegradation.
Type of BiodegradationUptakepH
Viscose
pH
Cotton
pH
Linen
Outdoor composting1st8.86 ± 0.10 a8.75 ± 0.08 a8.86 ± 0.02 a
Outdoor composting2nd9.14 ± 0.04 a9.17 ± 0.08 a9.11 ± 0.19 a
Outdoor composting3rd8.93 ± 0.03 b8.88 ± 0.07 a8.96 ± 0.02 b
Controlled composting1st8.87 ± 0.03 ab8.86 ± 0.13 a8.63 ± 0.20 ab
Controlled composting2nd9.12 ± 0.13 a9.00 ± 0.18 a9.04 ± 0.05 a
Controlled composting3rd8.96 ± 0.06 b8.93 ± 0.14 a8.98 ± 0.12 b
Outdoor vermicomposting1st8.80 ± 0.06 a8.86 ± 0.07 a8.86 ± 0.02 a
Outdoor vermicomposting2nd9.23 ± 0.13 a9.19 ± 0.05 a9.21 ± 0.04 a
Outdoor vermicomposting3rd8.95 ± 0.06 a8.93 ± 0.03 a8.94 ± 0.02 a
Home vermicomposting1st8.86 ± 0.10 a8.86 ± 0.07 a8.86 ± 0.02 a
Home vermicomposting2nd9.30 ± 0.06 a9.19 ± 0.05 a9.26 ± 0.01 a
Home vermicomposting3rd8.93 ± 0.15 a8.93 ± 0.03 a8.94 ± 0.19 a
Different letters in the column indicate statistically significant differences between samples (ANOVA test, p ≤ 0.05), mean ± SD, n = 3.
Table 7. Electrical conductivity values (EC) in individual uptakes of different types of biodegradation.
Type of BiodegradationUptakeEC (μS cm−1) ViscoseEC (μS cm−1) CottonEC (μS cm−1) Linen
Outdoor composting1st1750 ± 47 c1836 ± 111 a1908 ± 168 b
Outdoor composting2nd1551 ± 70 a1390 ± 100 b1530 ± 30 a
Outdoor composting3rd1565 ± 300 b1530 ± 127 b1481 ± 98 ab
Controlled composting1st1730 ± 87 a1644 ± 167 a1726 ± 91 a
Controlled composting2nd1630 ± 70 ab1680 ± 80 a1610 ± 60 a
Controlled composting3rd1332 ± 95 b1474 ± 70 a1434 ± 99 a
Outdoor vermicomposting1st1536 ± 60 b1604 ± 217 c1682 ± 15 c
Outdoor vermicomposting2nd1500 ± 40 a1580 ± 120 a1560 ± 100 a
Outdoor vermicomposting3rd1910 ± 118 b1624 ± 84 b1483 ± 47 b
Home vermicomposting1st1749 ± 47 b1835 ± 111 a1908 ± 168 a
Home vermicomposting2nd1751 ± 110 a1640 ± 11 b1580 ± 50 a
Home vermicomposting3rd1711 ± 122 b1799 ± 122 b1913 ± 369 a
Different letters in the column indicate statistically significant differences between samples (ANOVA test, p ≤ 0.05), mean ± SD, n = 3.
Table 8. Changes in carbon, nitrogen, and C/N during biodegradation of viscose-containing substrates.
Type of BiodegradationUptakeC (%)N (%)C/N
Outdoor composting1st20.2 ± 1.99 a1.7 ± 0.19 a11.9 ± 0.31 a
Outdoor composting2nd16.4 ± 0.04 a1.5 ± 0.03 a10.9 ± 0.15 a
Outdoor composting3rd20.0 ± 3.34 a1.8 ± 0.24 a11.1 ± 0.37 a
Controlled composting1st15.3 ± 0.99 a1.4 ± 0.07 a10.7 ± 0.18 a
Controlled composting2nd15.1 ± 0.04 a1.4 ± 0.5 a10.8 ± 0.01 a
Controlled composting3rd16.3 ± 2.85 a1.4 ± 0.25 a11.6 ± 0.07 b
Outdoor vermicomposting1st19.8 ± 1.37 a1.7 ± 0.15 a11.6 ± 0.28 b
Outdoor vermicomposting2nd18.5 ± 0.73 a1.7 ± 0.07 a10.9 ± 0.06 a
Outdoor vermicomposting3rd20.6 ± 1.36 a1.8 ± 0.13 a11.4 ± 0.10 ab
Home vermicomposting1st17.6 ± 1.13 ab1.6 ± 0.08 ab11.0 ± 0.32 a
Home vermicomposting2nd21.7 ± 0.86 a1.9 ± 0.07 a11.4 ± 0.09 a
Home vermicomposting3rd18.0 ± 2.07 b1.6 ± 0.20 b11.3 ± 0.10 a
Different letters in the column indicate statistically significant differences between samples (ANOVA test, p ≤ 0.05), mean ± SD, n = 3.
Table 9. Changes in carbon, nitrogen, and C/N during biodegradation of substrates with cotton.
Type of BiodegradationUptakeC (%)N (%)C/N
Outdoor composting1st16.9 ± 1.51 a1.5 ± 0.12 a11.5 ± 0.28 a
Outdoor composting2nd20.3 ± 0.30 a1.8 ± 0.03 a11.3 ± 0.17 a
Outdoor composting3rd18.9 ± 2.27 a1.7 ± 0.26 a11.1 ± 0.48 a
Controlled composting1st16.8 ± 2.38 a1.5 ± 0.15 a11.2 ± 0.54 a
Controlled composting2nd18.9 ± 1.54 a1.7 ± 0.12 a11.1 ± 0.33 a
Controlled composting3rd18.9 ± 2.05 a1.7 ± 0.19 a11.1 ± 0.04 a
Outdoor vermicomposting1st18.1 ± 0.84 a1.6 ± 0.04 a11.3 ± 0.30 a
Outdoor vermicomposting2nd20.0 ± 0.71 a1.8 ± 0.07 a11.1 ± 0.50 a
Outdoor vermicomposting3rd19.0 ± 3.19 a1.7 ± 0.30 a11.2 ± 0.13 a
Home vermicomposting1st17.6 ± 2.79 a1.6 ± 0.36 a11.0 ± 0.65 a
Home vermicomposting2nd19.7 ± 2.11 a1.8 ± 0.22 a10.9 ± 0.15 a
Home vermicomposting3rd18.2 ± 1.86 a1.6 ± 0.12 a11.4 ± 0.38 a
Different letters in the column indicate statistically significant differences between samples (ANOVA test, p ≤ 0.05), mean ± SD, n = 3.
Table 10. Changes in carbon, nitrogen, and C/N during biodegradation of substrates with linen.
Type of BiodegradationUptakeC (%)N (%)C/N
Outdoor composting1st17.8 ± 0.28 a1.5 ± 0.97 a11.3 ± 0.09 a
Outdoor composting2nd18.2 ± 1.39 a1.6 ± 0.10 a11.4 ± 0.16 a
Outdoor composting3rd18.6 ± 2.38 a1.7 ± 0.24 a10.9 ± 0.31 a
Controlled composting1st17.4 ± 0.48 a1.5 ± 0.05 a11.6 ± 0.38 a
Controlled composting2nd16.1 ± 2.72 a1.5 ± 0.28 a10.7 ± 0.26 a
Controlled composting3rd18.2 ± 1.63 a1.6 ± 0.09 a11.4 ± 0.57 a
Outdoor vermicomposting1st19.3 ± 2.30 a1.7 ± 0.21 a11.4 ± 0.09 b
Outdoor vermicomposting2nd19.3 ± 2.49 a1.8 ± 0.25 a10.7 ± 0.10 a
Outdoor vermicomposting3rd20.3 ± 0.10 a1.8 ± 1.11 a11.3 ± 0.08 ab
Home vermicomposting1st18.9 ± 4.00 a1.6 ± 0.37 a11.8 ± 0.34 a
Home vermicomposting2nd19.9 ± 1.08 a1.7 ± 0.01 a11.7 ± 0.54 a
Home vermicomposting3rd20.9 ± 1.61 a1.8 ± 0.08 a11.6 ± 0.59 a
Different letters in the column indicate statistically significant differences between samples (ANOVA test, p ≤ 0.05), mean ± SD, n = 3.
Table 11. Changes in phosphorus, potassium and magnesium during outdoor composting in substrates with different types of textiles.
TextileUptakeP (mg kg−1)K (mg kg−1)Mg (mg kg−1)
Control1st2834 ± 656 a11,774 ± 1676 a3480 ± 542 a
Control2nd2993 ± 217 a10,717 ± 1311 a2897 ± 229 a
Control3rd2445 ± 11 a9375 ± 1435 a2977 ± 145 a
Viscose1st2889 ± 197 a11,565 ± 937 a3503 ± 203 a
Viscose2nd3452 ± 510 a11,151 ± 880 a4246 ± 156 a
Viscose3rd2744 ± 164 a11,713 ± 946 a4110 ± 170 a
Cotton1st3364 ± 169 a12,536 ± 1030 a4303 ± 373 a
Cotton2nd2844 ± 624 a11,044 ± 606 a2877 ± 251 a
Cotton3rd3122 ± 626 a12,222 ± 362 a3355 ± 369 a
Linen1st4150 ± 719 b11,435 ± 593 a3960 ± 307 a
Linen2nd2947 ± 394 ab11,357 ± 1130 a2870 ± 495 b
Linen3rd2791 ± 215 a11,257 ± 328 a3179 ± 187 ab
Different letters in the column indicate statistically significant differences between samples (Kruskal–Wallis test for control and viscose treatments; ANOVA test for cotton and linen, p ≤ 0.05), mean ± SD, n = 3.
Table 12. Changes in phosphorus, potassium and magnesium during outdoor vermicomposting in substrates with different types of textiles.
TextileUptakeP (mg kg−1)K (mg kg−1)Mg (mg kg−1)
Control1st4114 ± 774 a13,810 ± 769 a4017 ± 94 b
Control2nd2620 ± 917 a12,726 ± 1921 a2768 ± 561 a
Control3rd3657 ± 621 a13,839 ± 1562 a3817 ± 158 b
Viscose1st3708 ± 319 b12,111 ± 1136 a3858 ± 206 b
Viscose2nd2423 ± 293 a12,498 ± 256 a2596 ± 437 a
Viscose3rd3611 ± 432 b12,587 ± 1601 a3780 ± 326 b
Cotton1st3424 ± 737 a11,955 ± 1112 a3628 ± 183 b
Cotton2nd2187 ± 270 a11,512 ± 418 a2170 ± 186 a
Cotton3rd3579 ± 217 a14,483 ± 1214 b3895 ± 131 b
Linen1st4026 ± 286 a12,423 ± 364 a4027 ± 186 b
Linen2nd2382 ± 435 b13,515 ± 601 a2777 ± 596 a
Linen3rd3437 ± 402 ab13,533 ± 1308 a3726 ± 423 ab
Different letters in the column indicate statistically significant differences between samples (ANOVA test, p ≤ 0.05), mean ± SD, n = 3.
Table 13. Changes in potentially toxic elements during traditional outdoor composting of substrates with different types of textiles.
Type of TextileUptakeCd (mg kg−1)Pb (mg kg−1)As (mg kg−1)Cr (mg kg−1)Cu (mg kg−1)Ni (mg kg−1)Zn (mg kg−1)
Control1st0.2 ± 0.02 a10.1 ± 1,9 a3.5 ± 0.8 a11.1 ± 0.9 a18.5 ± 4.5 a3.5 ± 1.0 a98.5 ± 21.7 a
Control2nd0.2 ± 0.01 a10.3 ± 4.0 a3.7 ± 0.3 a11.2 ± 20 a17.1 ± 1.5 a4.3 ± 0.6 a89.2 ± 9.4 a
Control3rd0.2 ± 0.01 a11.1 ± 6.1 a1.1 ± 0.1 b13.2 ± 2.2 a16.9 ± 1.3 a4.6 ± 0.7 a89.3 ± 1.4 a
Viscose1st0.2 ± 0.04 a12.5 ± 2.9 a4.5 ± 0.6 a12.5 ± 2.4 a21.8 ± 1.2 ab5.1 ± 1.5 a109.0 ± 22.3 a
Viscose2nd0.3 ± 0.04 a12.1 ± 1.3 a4.6 ± 0.7 a10.9 ± 1.3 a24.1 ± 0.6 a4.3 ± 0.3 a103.8 ± 16.3 a
Viscose3rd0.2 ± 0.03 a8.8 ± 0.6 a1.0 ± 0.03 a11.8 ± 0.7 a21.3 ± 1.1 b3.9 ± 0.2 a92.2 ± 10.5 a
Cotton1st0.3 ± 0.01 a15.9 ± 3.9 a4.9 ± 0.4 c18.5 ± 3.1 a21.5 ± 2.9 a6.6 ± 1.6 a124.3 ± 3.5 a
Cotton2nd0.2 ± 0.03 a9.5 ± 0.7 a3.3 ± 0.5 a10.2 ± 1.3 a15.1 ± 1.7 a3.8 ± 1.2 a74.9 ± 8.8 b
Cotton3rd0.3 ± 0.05 a29.2 ± 4.9 a1.0 ± 0.2 b12.2 ± 1.0 a20.1 ± 3.6 a3.9 ± 0.5 a102.0 ± 19.6 ab
Linen1st0.3 ± 0.02 a13.2 ± 0.2 a5.1 ± 0.6 a23.6 ± 8.0 b22.3 ± 2.4 a5.3 ± 1.0 b133.6 ± 23.3 b
Linen2nd0.2 ± 0.04 a10.3 ± 2.4 a3.2 ± 0.5 ab10.5 ± 1.0 a17.5 ± 2.9 a3.0 ± 0.2 a79.1 ± 12.0 a
Linen3rd0.3 ± 0.05 a9.8 ± 1.9 a1.0 ± 0.2 b12.2 ± 1.0 ab32.5 ± 3.6 a4.1 ± 0.5 ab94.6 ± 19.6 ab
Toxicity Limits 1.512040- *30050800
Different letters in the column indicate statistically significant differences between samples (ANOVA test, p ≤ 0.05), mean ± SD, n = 3. * There is limit only for hexavalent CrVI (2 mg kg−1).
Table 14. Changes in potentially toxic elements during outdoor vermicomposting of substrates with different types of textiles.
Type of TextileUptakeCd (mg kg−1)Pb (mg kg−1)As (mg kg−1)Cr (mg kg−1)Cu (mg kg−1)Ni (mg kg−1)Zn (mg kg−1)
Control1st0.3 ± 0.04 ab10.4 ± 1.9 a4.1 ± 0.5 c11.5 ± 2.3 a22.1 ± 1.5 a4.6± 0.8 b160.9 ± 48.8 a
Control2nd0.2 ± 0.06 a8.6 ± 4.0a2.5 ± 0.5 a8.8 ± 1.2 a14.4 ± 5.4 a2.4 ± 0.8 a69.5 ± 29.9 a
Control3rd0.3 ± 0.04 b15.3 ± 6.1 a1.0 ± 0.2 b12.7 ± 1.6 a23.1 ± 2.7 a4.1 ± 0.5 ab127.8 ± 31.2 a
Viscose1st0.2 ± 0.02 ab10.7 ± 2.1 a4.3 ± 0.5 c12.5 ± 0.5 b24.5 ± 3.5 b4.2 ± 0.3 a147.0 ± 29.6 b
Viscose2nd0.2 ± 0.03 a7.9 ± 1.7 a2.7 ± 0.5 a9.4 ± 0.5 a16.5 ± 1.5 a2.5 ± 0.5 a68.2 ± 12.4 a
Viscose3rd0.3 ± 0.03 b11.3 ± 1.7 a1.0 ± 0.2 b12.6 ± 0.8 b26.2 ± 2.5 b4.3 ± 1.1 a116.9 ± 16.4 ab
Cotton1st0.2 ± 0.01 ab7.9 ± 1.06 a4.0 ± 0.2 c11.4 ± 1.9 b17.2 ± 1.6 ab4.2 ± 0.8 b109.6 ± 7.4 a
Cotton2nd0.1 ± 0.03 a7.1 ± 1.05 a2.0 ± 0.2 a7.4 ± 1.0 a12.3 ± 1.7 a2.1 ± 0.2 a63.4 ± 8.0 a
Cotton3rd0.2 ± 0.01 b11.9 ± 1.04 a1.0 ± 0.02 b12.8 ± 0.3 b22.8 ± 1.8 b4.6 ± 0.2 b114.5 ± 9.3 a
Linen1st0.3 ± 0.04 a13.9 ± 3.4 a4.6 ± 0.2 b14.9 ± 2.4 b25.6 ± 2.2 b5.8 ± 0.5 b145.5 ± 22.6 b
Linen2nd0.2 ± 0.07 a7.9 ± 1.6 a2.3 ± 1.0 a9.1 ± 1.5 a14.6 ± 2.8 a2.4 ± 0.2 a74.3 ± 12.8 a
Linen3rd0.3 ± 0.08 a10.3 ± 1.9 a1.0 ± 0.2 a14.1 ± 1.6 b25.3 ± 4.3 b4.5 ± 1.3 b110.8 ± 15.5 ab
Toxicity Limits 1.512040- *30050800
Different letters in the column indicate statistically significant differences between samples (ANOVA test, p ≤ 0.05), mean ± SD, n = 3. * There is limit only for hexavalent CrVI (2 mg kg−1).
Disclaimer/Publisher’s Note: The statements, opinions and data contained in all publications are solely those of the individual author(s) and contributor(s) and not of MDPI and/or the editor(s). MDPI and/or the editor(s) disclaim responsibility for any injury to people or property resulting from any ideas, methods, instructions or products referred to in the content.