Article

LSES1, Encoding a Member of the Casein Kinase 1 Family, Is Involved in the Regulation of Leaf Senescence in Rice

1
Key Laboratory of Ministry of Education for Genetics, Breeding and Multiple Utilization of Crops, Key Laboratory of Ministry of Agriculture and Rural Affair for Biological Breeding for Fujian and Taiwan Crops, Fujian Provincial Key Laboratory of Crop Breeding by Design, College of Agriculture, Fujian Agriculture and Forestry University, Fuzhou 350002, China
2
Fujian Key Laboratory of Crop Genetic Improvement and Innovative Utilizationfor Mountain Area, Sanming Academy of Agricultural Sciences, Sanming 365500, China
3
School of Life Sciences, Xiamen University, Xiamen 361005, China
*
Authors to whom correspondence should be addressed.
These authors contributed equally to this work.
Agronomy 2025, 15(11), 2601; https://doi.org/10.3390/agronomy15112601 (registering DOI)
Submission received: 31 August 2025 / Revised: 5 November 2025 / Accepted: 7 November 2025 / Published: 12 November 2025

Abstract

The normal metabolism of transient starch in leaves plays a vital role in determining photosynthesis and final crop yield. However, the molecular mechanisms linking abnormal transient starch metabolism to premature leaf senescence remain unclear. Here, we isolate a rice mutant, lses1, with leaf yellowing and premature senescence, as well as excessive accumulation of starch granules in chloroplasts. Genetic analysis revealed that this trait is controlled by a single recessive nuclear gene. Through BSA-seq preliminary gene mapping, map-based cloning, and sequencing alignment, the candidate gene was pinpointed to LOC_Os02g40860 on chromosome 2, which encodes OsCKI1, a casein kinase I family member. The identity of LSES1 was confirmed functionally: genetic complementation with the native genomic sequence rescued the wild-type phenotype, while CRISPR/Cas9 knockout of the gene in wild-type plants recapitulated the premature senescence. This confirmed that LSES1/OsCKI1 is involved in the regulation of leaf senescence. Notably, one improved knockout line, KO-2, displayed significant agronomic improvements in grain length, grain width, number of productive ears, and number of filled grains per panicle, along with a significant increase in grain yield per plant, highlighting its potential breeding value. Subcellular localization and tissue-specific expression analysis showed that LSES1 is primarily nuclear-localized and constitutively expressed.

1. Introduction

Leaves are crucial metabolic sources for photosynthesis and organic energy production in plants. Premature leaf senescence significantly impacts crop yield and quality. Leaf senescence is a complex biological process involving multiple regulatory pathways such as chloroplast development, chlorophyll synthesis and metabolism, programmed cell death, and hormonal regulation, with numerous associated genes and intricate genetic mechanisms [1]. The normal degradation and conversion of transient starch in leaves play a vital role in determining final crop yield. During the day, transient starch formed in chloroplasts is hydrolyzed and phosphorylated at night [2]. Disruptions in leaf starch degradation can lead to excessive transient starch accumulation, damage thylakoid structures, impair photosynthesis, and induce leaf senescence [3]. Thus, excessive transient starch accumulation may be a key mechanism underlying premature leaf senescence. To date, several rice mutants exhibiting premature leaf senescence with enriched chloroplast starch granules and transient starch accumulation phenotypes have been reported, including esl9 [4], esl11 [5], pls5 [6], ossac4 [7], lps1 [8], and ossac3 [9]. However, the molecular mechanisms linking abnormal transient starch metabolism to premature leaf senescence remain unclear.
The overexpression of casein kinase 1 AELs causes premature leaf senescence, suggesting their regulatory roles in this process [10]. Casein kinase (CK) is a highly conserved serine/threonine kinase in eukaryotes, classified into type I (casein kinase 1, CK1) and type II (casein kinase 2, CK2) based on physicochemical and structural differences [11]. CK1s are monomeric enzymes with a highly conserved kinase domain but significant variability in the length and amino acid sequences of their N-terminal extensions and C-terminal non-catalytic domains. Studies have shown that CK1s play critical regulatory roles in various physiological and signaling processes, including circadian rhythms, DNA damage repair, cell division, signal transduction, and morphogenesis [12]. In plants, CK1s are increasingly implicated in multiple developmental aspects, such as hormone signaling, photomorphogenesis, flowering time, and epigenetic regulation [11,12,13,14,15]. For instance, Arabidopsis CK1.3 and CK1.4 phosphorylate the blue light receptor cryptochrome 2 (CRY2), playing a pivotal role in blue light responses [16]. CK1.8 regulates ethylene biosynthesis by phosphorylating ACS5 (ACC synthase 5), promoting its interaction with the E3-ubiquitin ligase and ETO1 (Ethylene Overproduction 1) [17]. Casein kinase 1 AELs phosphorylate the transcription factor WRKY22 at Thr57, Thr60, and Ser69 residues, enabling its binding to the promoter of ACS7 (an ACS5 homolog) to stimulate ethylene biosynthesis and accelerate leaf senescence [10]. The recent studies showed that AELs phosphorylate SMXL6/7/8, the core transcriptional repressors of the strigolactone (SL) signaling pathway, to inhibit their interaction with MAX2 and prevent SL-induced ubiquitination, thereby enhancing SMXL protein stability and promoting shoot branching in Arabidopsis [18]. CKL6 regulates intercellular communication by mediating tubulin phosphorylation, influencing cortical microtubule dynamics and anisotropic cell growth in Arabidopsis [19]. Under high temperatures, transcription factors GhMYB73 and GhMYB4 bind to the GhCK1 promoter region (−168 to −478 bp) to upregulate its expression, inhibiting starch synthase activity and disrupting anther starch metabolism. This triggers premature programmed cell death (PCD) in pollen sacs, leading to male sterility in upland cotton [20]. In maize, CK1 interacts with the 202nd threonine residue (Thr-202) of the key endosperm-filling regulator Opaque2 (O2) to phosphorylate it, enhancing the transcriptional activation ability of O2 to promote the transcription of downstream genes such as zein and pyruvate pyrophosphate kinase (PPDK), thereby coordinating maize yield and nutritional quality [21]. OsCKI1, a rice casein kinase I family member also known as hbd2/LTRPK1/LTG1/DTG1, is involved in hybrid weakness, root development, hormone responses, cold adaptation, and the regulation of tiller number and grain size [22,23,24,25,26]. So far, extensive research has been conducted on the roles of CK1s in plant growth and development, but there is no clear genetic evidence to confirm that OsCKI1 regulates leaf senescence in rice.
In this work, we isolated a rice mutant, lses1 (leaf starch excess and senescence 1), with distinct leaf yellowing and premature senescence. Via map-based cloning and phenotypic validation, we cloned the LSES1 gene, which encodes OsCKI1, and demonstrate here that LSES1/OsCKI1 is involved in the regulation of leaf senescence. Meanwhile, we obtained an improved knockout line KO-2 with potential breeding value. In addition, subcellular localization and tissue-specific expression analysis showed that LSES1 is primarily nuclear-localized and constitutively expressed.

2. Materials and Methods

2.1. Plant Materials and Growth Conditions

The yellowing and premature leaf senescence mutant lses1 was isolated in 2017 from indica rice (Oryza sativa L. subsp. indica Kato) cultivar HH1014, with HH1014 serving as its wild-type variety. For genetic analysis, reciprocal crosses were made using the lses1 mutant and the japonica rice (Oryza sativa L. subsp. japonica Kato) cultivar Nip (Nipponbare) as parents in the early season of 2020 (mid-March to mid-July). Additionally, the lses1 mutant was used as the maternal parent and crossed with 02428, HZ (Huazhan), ZS97B (Zhenshan97-B), and MH2155 (Minghui2155), separately. The F1 plants from all hybrid combinations were self-pollinated to produce F2 seeds in the late season of 2020 (late July to late November). The total segregating F2 population derived from different combinations was planted in the early season of 2021. The segregating F2 population derived from the “lses1/Nip” cross was used as the mapping population.
For preliminary gene mapping based on BSA-seq, 1132 segregating individuals were planted in the field in the late season of 2021. For fine mapping using the map-based cloning approach, the F2 segregating population was expanded and planted in the early season of 2022. For mutant locus detection, 16 wild-type germplasms with normal leaf phenotypes and five mutant materials were selected, and planted in the late season of 2022. The wild-type germplasms included HH1014, Nip, 02428, CO39, AJNT (Aijiaonante), QZ10 (Quanzhen10), JFZ (Jiafuzhan), HZ, Samba, MH2155, DJ (Dongjing), HHZ (Huanghuazhan), LS (Lansheng), Kos (Koshihikari), ZS97-B, and MXZ2 (Meixiangzhan2). The five mutant materials comprised the original mutant lses1 and four randomly selected mutant phenotype individuals from the lses1/Nip-F2 population (labeled as MT1-F2, MT2-F2, MT3-F2, and MT4-F2). All rice plants were cultivated under natural field conditions in the net-house paddy field at Fujian Agriculture and Forestry University, Fuzhou (25°15′–26°39′ N, 118°08′–120°31′ E), China. Seedlings were transplanted at a spacing of 20 cm × 20 cm, with field management practices consistent with conventional cultivation.
The T0-generation transgenic plants were grown in pots (60 cm × 40 cm× 30 cm) in a greenhouse with 16 h light/8 h dark (25 °C/18 °C) in the late season of 2023. The T1-, T2-, and T3-generation transgenic plants were grown in the net-house paddy field at Fujian Agriculture and Forestry University (Fuzhou, China) in the early season of 2024, the late season of 2024, and the early season of 2025, respectively.

2.2. Cytological Observation

In the six-leaf stage of the main stem of the seedlings, sampling and processing were performed on the leaf base and tip of the second leaf from the top of the wild-type HH1014 and the lses1 mutant, following the method described by Gothandam et al. [27]. The cross-sections of the leaves were observed using a JEM-2100HC high-contrast transmission electron microscope (JEM-2100HC, JEOL, Tokyo, Japan).

2.3. Genetic Analysis

Reciprocal crosses were made using the lses1 mutant and Nip as parents. Additionally, the lses1 mutant was used as the maternal parent and crossed with 02428, HZ, ZS97B, and MH2155, respectively. The F1 plants from all hybrid combinations were self-pollinated to produce F2 seeds. The leaf phenotypes, normal growth or yellowing and premature senescence, of the F1 plants and the F2 segregating populations grown in the field were observed, and the segregation patterns of leaf phenotypes in the F2 populations were investigated and statistically analyzed.

2.4. Preliminary Gene Mapping Based on BSA-Seq

Preliminary gene mapping was conducted using the bulked segregant analysis method based on high-throughput sequencing (BSA-seq) [28]. The F2 population derived from the “lses1/Nip” cross was used as the mapping population, with 1132 segregating individuals planted in the field. In the tillering stage when the mutant phenotype was clearly visible, 50 mutant-type plants and 50 wild-type plants were randomly selected from the F2 segregating population. Approximately 2 g of young leaves from each plant were collected and stored at −20 °C for later use. Leaves from the parental lses1 plant were also stored under the same conditions. A 1 cm segment of the cryopreserved leaves from each plant was taken, and equal amounts of leaf tissue from the 50 mutant-type and wild-type plants were pooled to construct the mutant-type DNA pool (MT-pool, recessive pool) and the wild-type DNA pool (WT-pool, dominant pool), respectively. Additionally, cryopreserved leaves of lses1 were used to extract the mutant parental genomic DNA (MuParent). The leaf samples were ground in liquid nitrogen, and DNA was extracted using a plant genomic DNA rapid extraction kit (Sangon Biotech, Shanghai, China). After RNase treatment, the DNA concentration was measured to ensure that each sample contained at least 10 μg of DNA. The three DNA samples were sent to Xiamen Ronjin Biotechnology Co., Ltd. (Xiamen, China) for high-throughput next-generation sequencing and related bioinformatics analysis. Following standard procedures for read quality control, alignment, and variant detection, polymorphic molecular markers of the hybrid combinations were identified through BSA-seq analysis to map the single gene controlling the qualitative trait. The reference genome used was Nipponbare (assembly version Oryza sativa Japonica Group IRGSP-1.0., accessible at http://rice.plantbiology.msu.edu/ (accessed on 14 July 2021)) [29], with the gene set annotation version MSU7 and the SNPEff variant annotation database rice7. In brief, following high-throughput next-generation sequencing of three DNA samples, including the parental lses1, the mutant phenotype DNA pool (recessive homozygous pool), and the wild-type phenotype DNA pool (dominant heterozygous pool), bioinformatics analysis was conducted using the Nip (Nipponbare) genome as the reference genome. Variant sites (including SNPs and InDels) were identified across the entire genome through the joint variant detection. Using the 2PFLT and HETFLT criteria, the polymorphic SNP and InDel markers between the parents were identified genome-wide. Allele frequencies were estimated in the recessive homozygous pool (recessive pool) and the dominant heterozygous pool (dominant pool), separately. The allele frequency difference (AFD) between the recessive and dominant pools was calculated and raised to the third power (AFD3) to generate Manhattan plots, which show major peaks on chromosomes, for visualization.

2.5. Map-Based Cloning

The F2 segregating population derived from the “lses1/Nip” cross was expanded, and fine mapping was performed using the map-based cloning approach. From the F2 population, 10 plants exhibiting the mutant phenotype and 10 plants with the wild-type phenotype were selected to establish mutant and wild-type DNA bulks, respectively. Additionally, 1900 mutant phenotype individuals were identified from the F2 population in the tillering stage, when the mutant phenotype is most pronounced. Approximately 2 g of young leaves from each mutant plant were collected and stored at −20 °C for later use. Then, a 1 cm segment of the cryopreserved leaves from each plant was taken from each plant and collected for genomic DNA extraction using the simplified plant DNA extraction method reported by Edwards et al. [30].
Based on the genomic variation information between parental lines within the preliminary mapping interval provided by BSA-seq, new InDel molecular marker primers were designed. After primer synthesis, polymorphism screening between the parental lines was conducted, yielding six polymorphic InDel markers (Table S1). These six new InDel primers, combined with publicly reported SSR markers within the preliminary mapping interval, were used for fine mapping.
The PCR was performed according to the instructions provided by Sangon Biotech (Shanghai, China). The total volume of the reaction mixture was 10 μL. It contained 0.5 μL DNA template (20–50 ng/μL), 5 μL of 2 × Taq PCR Master Mix, 1 μL primer pair (10 mM), and 3.5 μL ddH2O. The 2 × Taq PCR Master Mix is a pre-mixed product containing Taq DNA polymerase, dNTPs, MgCl2, PCR buffer, PCR reaction enhancer, and stabilizers (B639295, Sangon Biotech). The PCR amplification program began with pre-denaturation at 94 °C for 5 min. This was followed by 32 cycles of denaturation at 94 °C for 30 s, annealing at 55 °C for 30 s, and extension at 72 °C for 30 s. A final extension step was carried out at 72 °C for 5 min. The reaction was then held at 4 °C. After amplification, the PCR products were separated using 10% SDS-PAGE gels and visualized by rapid silver staining [31].

2.6. Sequencing Verification of Candidate Gene Mutation Sites

A total of 21 distinct rice germplasms, including 16 wild-type germplasms with normal leaf phenotypes and five mutant materials (refer to Section 2.1 for details), were used for sequencing verification of candidate gene mutation sites. A 1 cm segment of young leaves from the plant was collected to be tested. After grinding in liquid nitrogen, genomic DNA was extracted using the Rapid Plant Genomic DNA Isolation Kit (B518231, Sangon Biotech, Shanghai, China). Primers L1-F′ and L1-R′ were designed and synthesized to target the coding region (nucleotides 800 to 1300) of the candidate gene LOC_Os02g40860, encompassing the SNP mutation site. The sequences (5′ to 3′) of primers L1-F′ and L1-R′ are TAGCATCTTTTCCTTGCTTC and TGTGGGCCTTCTTTTATCTA, respectively. This pair of primers was used to perform PCR amplification on the DNA of the test germplasm materials. The amplified products were subsequently sent to Sangon Biotech Co., Ltd. (China) for sequencing identification.

2.7. Vector Construction and Genetic Transformation

A 1 cm segment of wild-type HH1014 young leaves was ground in liquid nitrogen, and genomic DNA was extracted using a Rapid Plant Genomic DNA Isolation Kit (B518231, Sangon Biotech, Shanghai, China). Using the genomic DNA of wild-type HH1014 as the template, the full-length LSES1 genomic sequence of 7660 bp (including the 1668 bp promoter region upstream of the start codon ATG and the 1060 bp sequence downstream of the stop codon TGA) was divided into two fragments for cloning: a 4382 bp LSES1-1 fragment and a 4145 bp LSES1-2 fragment. The two fragments share an 867 bp overlapping region, which contains a unique SacI restriction site that can be used to assemble the two fragments into a complete full-length sequence (Figure 1). Briefly, the LSES1-2 fragment (with an EcoRI restriction site introduced at the 3′ end) was amplified using primers LSES1-2-F and LSES1-2-R (Table S2) and cloned into the pTOPO vector (CV17; Aidlab Biotechnologies Co., Ltd.; Beijing, China). After sequencing verification, the fragment was double-digested with SacI and EcoRI, and the 3278 bp fragment from LSES1-2 was recovered and ligated with the pCAMBIA1300 vector (VT1375; YouBio Biotechnology Co., Ltd.; Changsha, China) to obtain the intermediate vector pC1300-LSES1-2. The LSES1-1 fragment, 4382 bp in length (with a BamHI restriction site introduced at the 5′ end), was amplified using primers LSES1-1-F and LSES1-1-R (Table S2), cloned into the pTOPO vector, and verified by sequencing. The LSES1-1 fragment obtained by double digestion with BamHI and SacI was then ligated into the intermediate vector pC1300-LSES1-2, ultimately yielding the complementation vector pC1300-LSES1, which contains the full-length genomic sequence driven by the native LSES1 promoter. After sequencing confirmed the accuracy of the full-length LSES1 sequence, the vector was introduced into Agrobacterium EHA105 and transformed into the original mutant lses1 with the Oryza sativa subsp. indica HH1014 background.
Based on the principles of CRISPR/Cas9 gene editing, the online analysis tool CRISPRdirect (Available online: http://crispr.dbcls.jp/ (accessed on 2 November 2022)) [32] was used to select the gRNA knockout site. The selected gRNA position was as close as possible to the start codon ATG to minimize off-target effects. A target site with PAM sequence characteristics was selected from the LOC_Os02g40860 gene sequence to construct the knockout vector. The target primers CRP-LSES1-F and CRP-LSES1-R (Table S2) were annealed to form double-stranded primers, which were then ligated into the intermediate vector pEntryA using BsaI restriction enzyme sites. Subsequently, the U6-gRNA expression cassette was ligated into the gene editing vector pRHCas9 via PstI and SpeI restriction enzyme sites. After sequencing verification with primers CRP-LSES1-R and SeqbfUbiR (Table S2), the gene knockout vector pRHCas9-LSES1 was obtained. The resulting vector was introduced into Agrobacterium tumefaciens EHA105 and transformed into the japonica rice cultivar Nip. Both the genetic complementation and gene knockout vectors were entrusted to Wuhan Biorun Biosciences Co., Ltd. (Biorun BioSciences, Wuhan, China) for genetic transformation.

2.8. Phenotypic Identification of Transgenic Lines

After obtaining the T0 generation lines of genetic complementation and gene knockout, the T1 and T2 generation target lines were sequentially acquired through self-pollination combined with corresponding molecular detection and phenotypic evaluation. Primers COM-LSES1-F and COM-LSES1-R, and KO-LSES1-F and KO-LSES1-R (Table S2) were designed and synthesized to detect genetically complementary transgenic plants and gene-knockout transgenic plants, respectively. From the seedling stage onward, the leaf phenotypes and other agronomic traits of each generation were observed and recorded until maturity. For the T2-generation plants, various agronomic traits were examined in the maturation stages. For genetically complementary transgenic plants, plant height and panicle length were examined. For gene-knockout transgenic plants, plant height, panicle length, grain length, grain width, grain thickness, number of productive ears, number of filled grains per plant, number of filled grains per panicle, thousand-grain weight, and grain yield per plant were examined. For the T3-generation plants of gene-knockout transgenic plants, grain yield per plant was examined.

2.9. Subcellular Localization

Leaf cDNA of wild-type HH1014 served as the template. The coding sequence of LOC_Os02g40860 (LSES1) plus a linker was amplified with primers GFP-LSES1-F and GFP-LSES1-R (Table S2). The PCR product was purified and recovered. The fragment was cloned into pRTV-nGFP. The resulting plasmid was named pRTV-nGFP-LSES1. In this vector, GFP is fused to the N-terminus of LSES1. Green fluorescence from the fusion protein indicates the subcellular location of LSES1 in protoplasts. The transcription factor WRKY45 is highly expressed in the nucleus, and the plasmid pRTV-nRFP-WRKY45 encodes a fusion protein of red fluorescent protein and WRKY45 (RFP fused to the N-terminus of WRKY45) in protoplasts, displaying red fluorescence in the nuclear region for co-localization with nuclear proteins. The red fluorescent nuclear localization vector pRTV-nRFP-WRKY45 plus empty GFP vector pRTV-nGFP was used as the control group, and the red fluorescent nuclear localization vector pRTV-nRFP-WRKY45 plus LSES1 subcellular localization vector pRTV-nGFP-LSES1 was used as the experimental group. The two groups were transferred into rice protoplasts for transient expression, separately. The fluorescent signals were observed using a confocal laser scanning microscope (LSM 900, Zeiss, Oberkochen, Germany) with an excitation wavelength of 488 nm for GFP and 561 nm for RFP.

2.10. RT-qPCR Analysis

Eight different tissues of the wild-type variety HH1014 in different growth and development stages, including roots, clums, leaves, and leaf sheaths in the tillering stage; young panicles (in developmental stage 5, about 4–5cm, YP); panicles in the flowering stage (PF); panicles in the grain-filling stage (PG); and panicles in the mature stage (PM), were harvested. The fresh samples were quickly frozen in liquid nitrogen and stored at −80 °C for future use. Three biological replicates of each sample were performed. Total RNA was extracted from each sample using the Fast Pure Universal Plant Total RNA Isolation Kit (RC411, Vazyme, Nanjing, China) and reverse-transcribed into cDNA using the HiScript IV 1st Strand cDNA Synthesis Kit (R412, Vazyme, Nanjing, China). Following the manufacturer’s instructions, real-time PCR was performed on an ABI 7500 Real-Time PCR System (ABI 7500, Applied Biosystems, Foster City, CA, USA) using the SYBR Green Pro Taq HS Premix qPCR Kit (AG11701, Accurate Biology, Changsha, China). OsActin (LOC_Os03g50885) was used as an internal reference to normalize gene expression data, and relative gene expression levels were calculated using the 2−∆∆CT method.

2.11. Statistical Analysis

The leaf phenotypes, normal growth or yellowing and premature senescence, of F2 generations from different combinations were observed in the tillering stage. The frequency distributions of leaf phenotypes were determined, and the χ2 test was performed with Statistical Analysis Software (SAS, release 8, SAS Institute Inc., Cary, NC, USA). In the assay of phenotypic identification of transgenic lines (including genetically complementary transgenic lines and gene-knockout transgenic lines), five randomly selected mature plants were used as five replicates for the measurement of different agronomic traits. For phenotypic identification in two independent complementary transgenic lines COM-1 and COM-2, the phenotypic values were measured in WT (HH1014), lses1, COM-1, and COM-2, and p values were determined using Student’s t-test compared with WT. For phenotypic identification in two independent gene-knockout transgenic lines KO-1 and KO-2, the phenotypic values were measured in Nip, KO-1, and KO-2, and p values were determined using Student’s t-test compared with Nip. In the RT-qPCR analysis, for each target gene, three biological replicates were performed. The relative gene expression levels of each target gene were normalized by the expression level of internal reference gene OsActin. The two-tailed Student’s t test, data analysis, and creation of the column chart were carried out on all of the data using GraphPad Prism 8.0.2 (GraphPad Software, Boston, MA, USA). Significance was accepted at p < 0.05 and p < 0.01.

3. Results

3.1. Phenotypic Characteristics of the lses1 Mutant

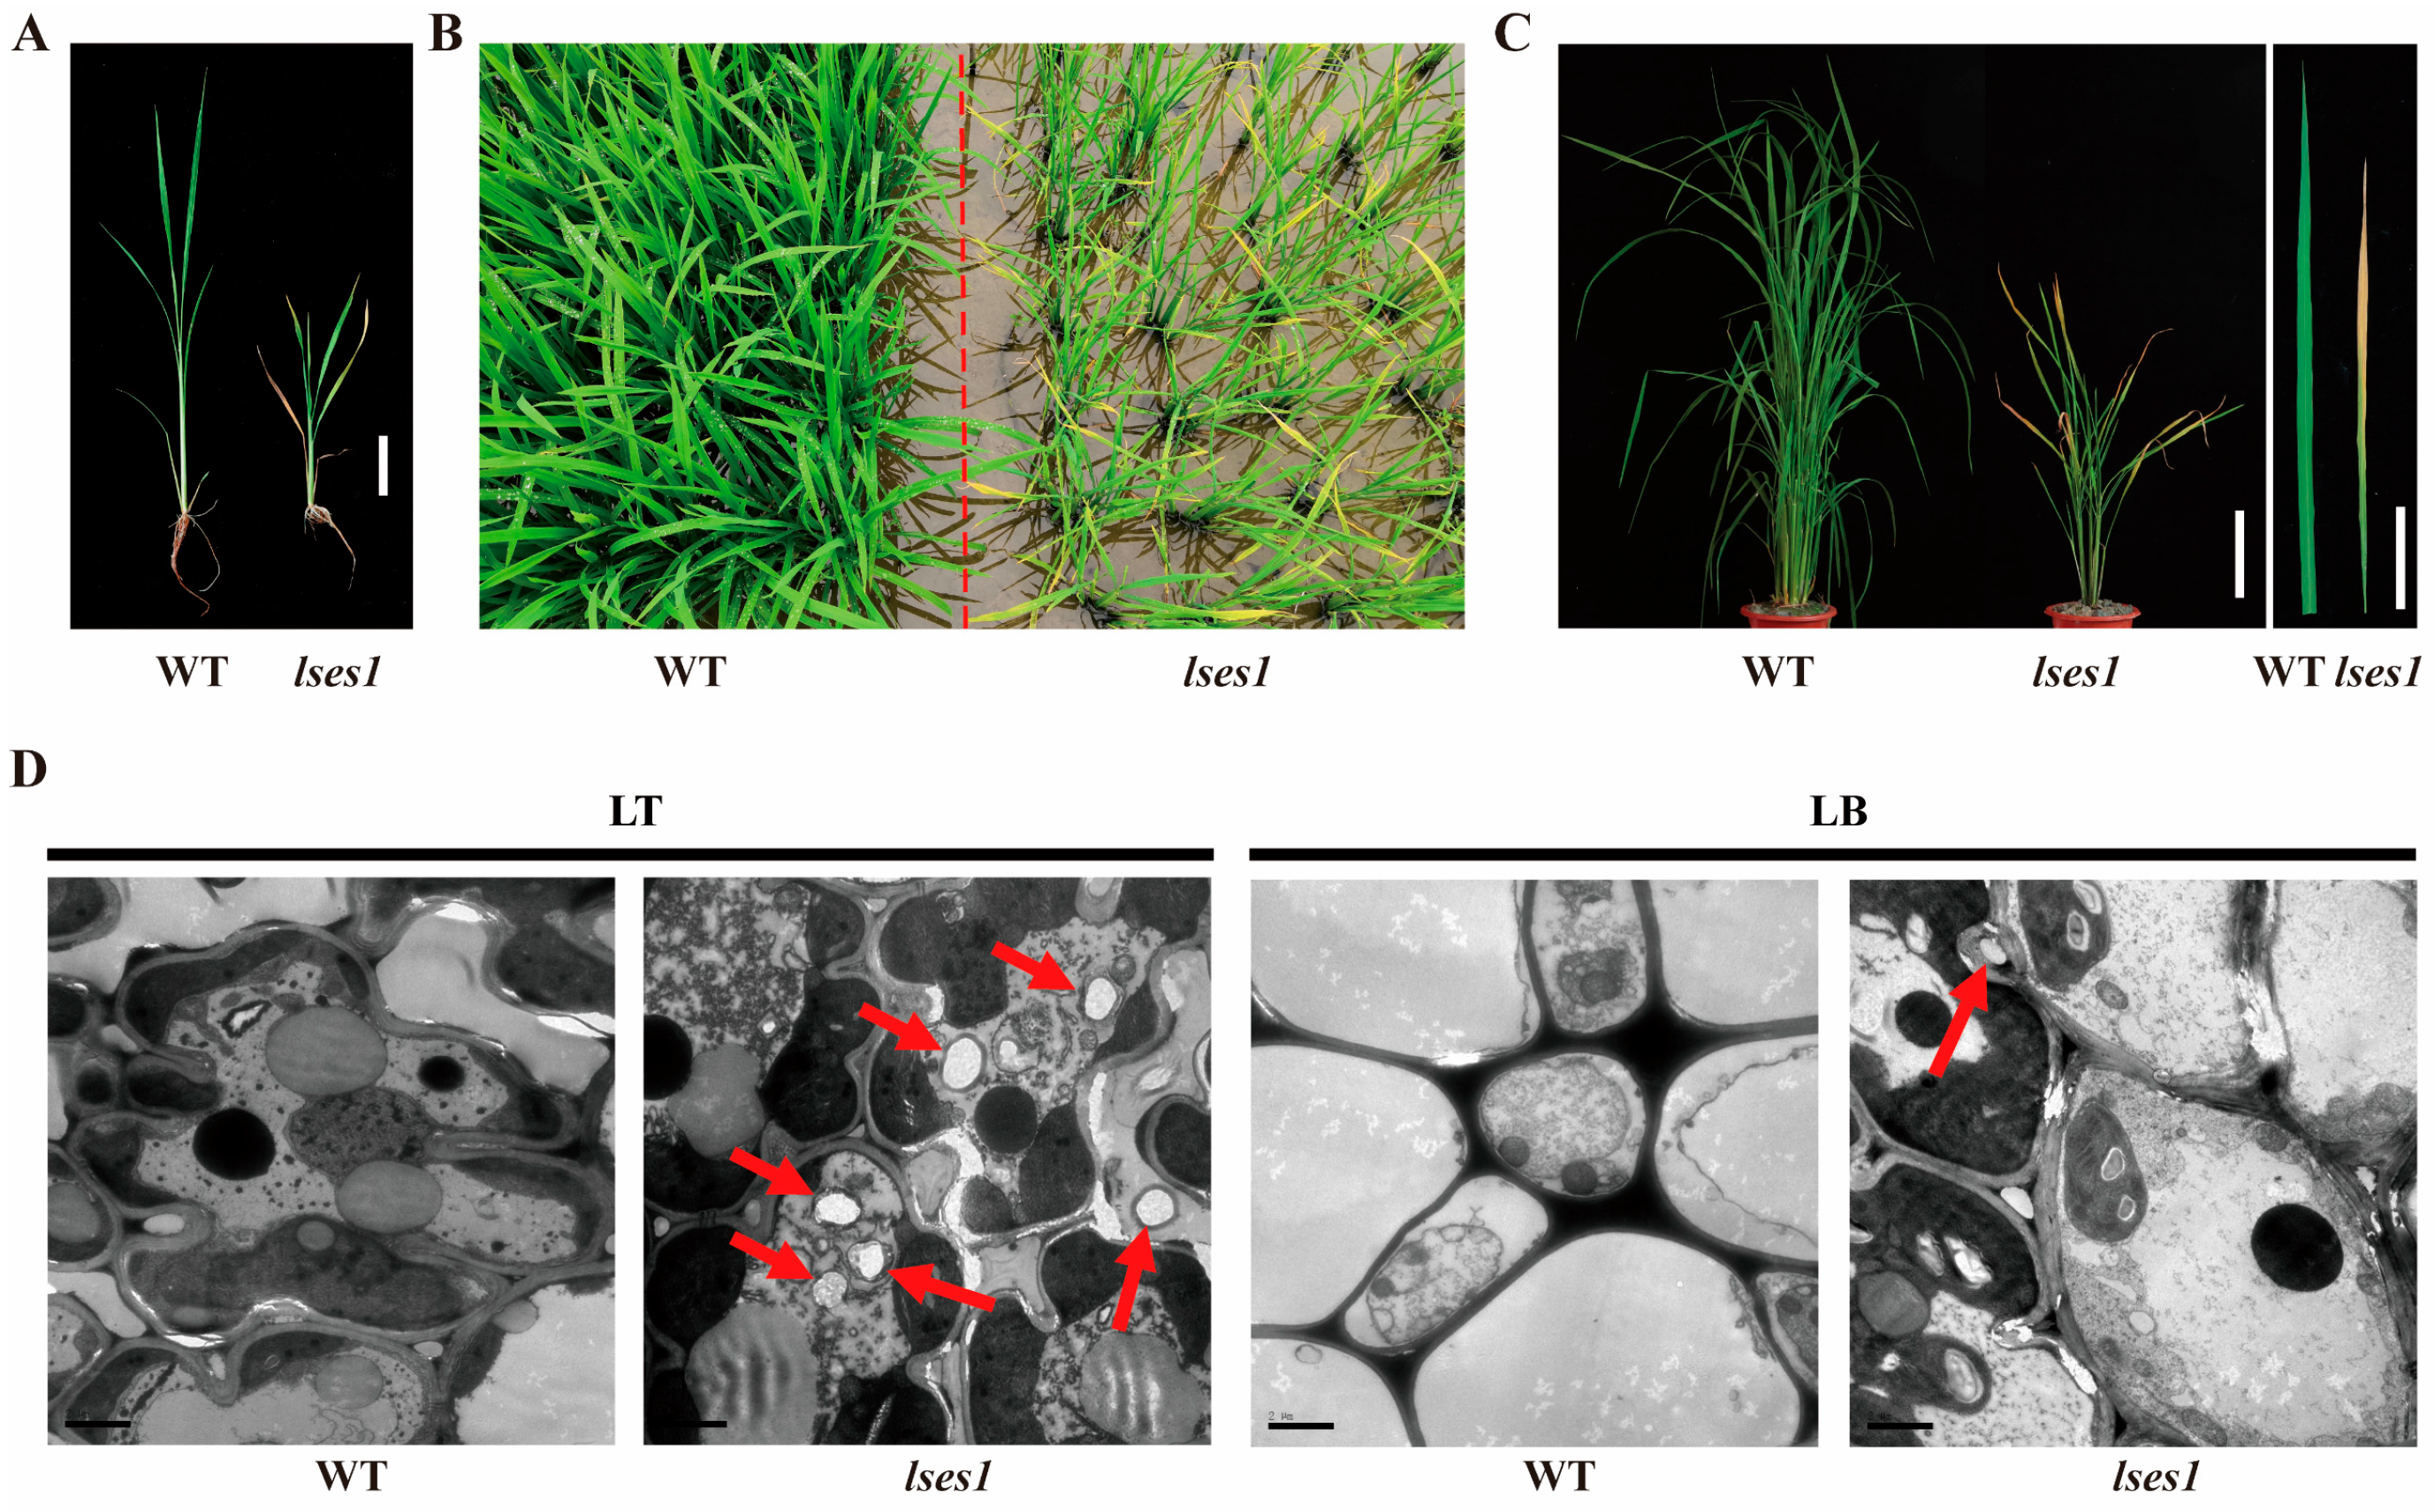
Compared with the wild-type variety HH1014 (WT), the lses1 mutant exhibited obvious premature leaf senescence during the seedling stage (Figure 2A,B). The yellowing and premature senescence initially appeared at the leaf tip and gradually extended toward the leaf base. As plant development progressed, the premature leaf senescence advanced from lower to higher leaf positions. The yellowing and premature senescence phenotype became more pronounced during the panicle differentiation stage (Figure 2C) than the tillering stage, and persisted until maturity.

3.2. Ultrastructure of Mesophyll Cells

Transmission electron microscopy of mesophyll cells revealed significant differences in the ultrastructure of leaf tip cells between the lses1 mutant and the wild type. Compared with the wild-type HH1014, the mesophyll cells of the lses1 mutant leaf tip contained abundant starch granules, and the thylakoids in the chloroplasts were compressed and damaged, leading to severe structural disruption of the chloroplasts. In the leaf base cells, the ultrastructural differences between the lses1 mutant and the wild type were less pronounced, although a small number of starch granules had begun to accumulate in the mesophyll cells of the mutant (Figure 2D). These results suggest that the excessive accumulation of starch granules in the leaf mesophyll cells of lses1 may be associated with its leaf yellowing and premature senescence phenotype.

3.3. Genetic Analysis of the Leaf Phenotype in the lses1 Mutant

Genetic analysis showed that in both reciprocal crosses between the lses1 mutant and the japonica wild-type variety Nip, as well as in crosses where the lses1 mutant was used as the maternal parent and 02428, HZ, ZS97B, and MH2155 as paternal parents, all F1 hybrid plants displayed normal leaf phenotypes like the wild type. In the F2 segregation populations of these crosses, two phenotypic types were observed: plants with normal leaf color and those with yellowing and premature senescence at the leaf tip. Chi-square (χ2) tests confirmed that the segregation ratio of normal to mutant phenotypes fit a 3:1 ratio (χ2 value < 3.84 (χ20.05,1), Table 1), indicating that the mutant trait is controlled by a single recessive nuclear gene.

3.4. Preliminary Gene Mapping of LSES1

The F2 segregating population derived from the “lses1/Nip” cross was used as the mapping population, and preliminary gene mapping was performed using BSA-seq. Through joint variant detection, a total of 4,721,085 variant sites (including SNPs and InDels) were identified across the entire genome. Using the 2PFLT and HETFLT criteria, 2,031,332 polymorphic SNP and InDel markers between the parents were identified genome-wide. Among these, SNPs accounted for 1,792,036, with a Ti/Tv ratio of 2.4; INS (insertions) totaled 108,893 and DEL (deletions) totaled 131,102, with InDels comprising approximately 11.8% of the total.
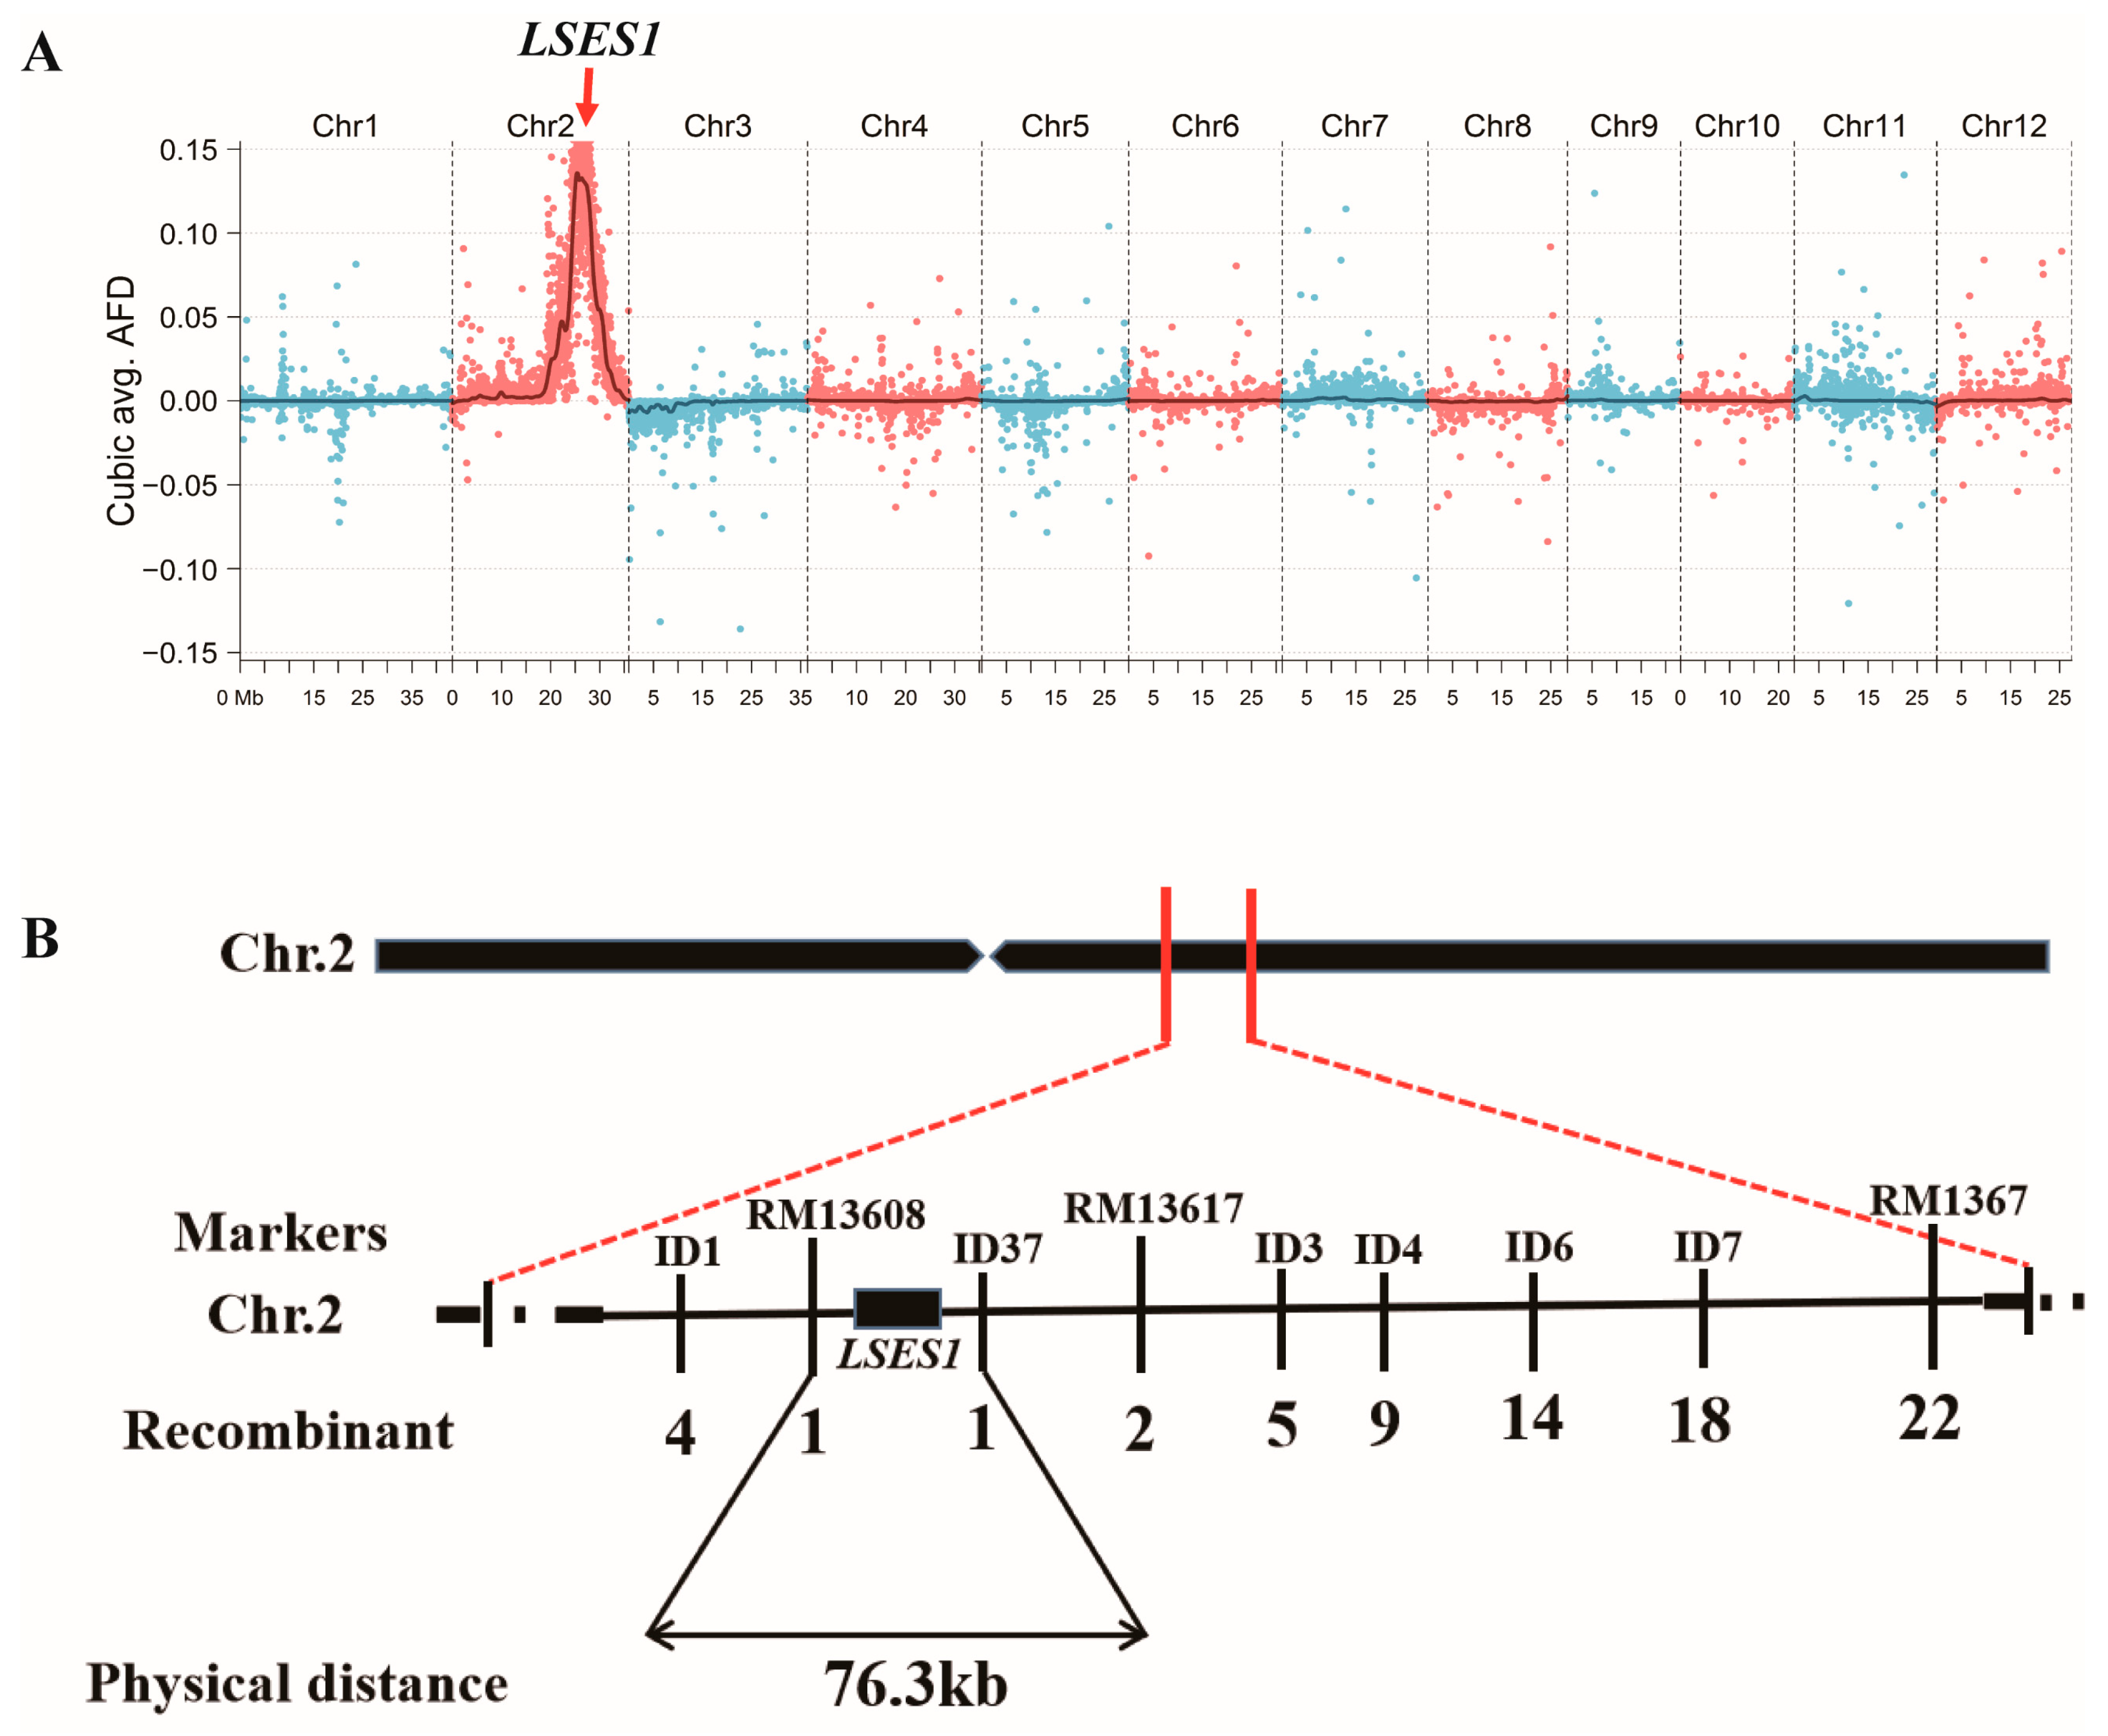
After allele frequency estimation, AFD calculation, and conversion to AFD3 for visualization, the resulting Manhattan plot shows a single major peak on chromosome 2 (Figure 3A). By performing interval estimation on the statistical fitting curve for Chr.2, the candidate region was inferred to lie between 24 and 28 Mb (physical distance) on Chr.2, with the peak near 26 Mb. Bioinformatics analysis and literature review indicated no previously reported genes related to rice leaf premature senescence within this candidate region, suggesting that LSES1 may be a novel gene controlling rice leaf premature senescence.
Further screening of molecular markers within the preliminary BSA-seq mapping interval identified 519 InDel markers with sequence length differences ≥5 bp, which can be used for subsequent fine mapping of the gene.

3.5. Map-Based Cloning of LSES1

Based on preliminary mapping, six pairs of polymorphic InDel primers (Table S1) and three pairs of SSR markers previously reported within the initial mapping interval were used to screen for single recombinants among 1900 mutant phenotype plants in the F2 segregating population of “lses1/Nip.” Using the newly designed InDel marker ID1 and SSR primer RM13608, 4 and 1 heterozygous single recombinants were identified, respectively, with the single recombinant from RM13608 overlapping with that from ID1. Additionally, 1, 2, 5, 9, 14, 18, and 22 single recombinants were screened using ID37, RM13617, ID3, ID4, ID6, ID7, ID8, and RM1367, respectively, showing a regular incremental overlap. Notably, none of the single recombinants from RM1367 overlapped with those from ID1 (Figure 3B). Based on the distribution of these single recombinants between ID1 and RM1367, the LSES1 gene was finely mapped between SSR marker RM13608 and InDel marker ID37 (Figure 3B). This interval spans approximately 76.3 kb and contains 14 candidate genes.
Analysis of the BSA-seq results for the 14 candidate genes within the fine-mapping interval revealed an SNP in the exon of LOC_Os02g40860 (at position 1070 of the coding region) between the parental lines lses1 and Nip, which could lead to an amino acid substitution. Sixteen wild-type accessions with normal leaf phenotypes (including HH1014, Nip, 02428, CO39, AJNT, QZ10, JFZ, HZ, Samba, MH2155, DJ, HHZ, LS, Kos, ZS97-B, and MXZ2) and five mutant materials (including the original mutant lses1 and four randomly selected mutant phenotype individuals from the lses1/Nip-F2 population) were selected. Genomic DNA was extracted from their leaves as templates to amplify the coding region sequence from positions 800 to 1300 of LOC_Os02g40860, followed by sequencing validation. The sequencing results showed that all 16 wild-type accessions had the same base “T” at this SNP site, while all mutant materials with the mutant phenotype had the base “A” (Figure 4A). This SNP caused a missense mutation at position 1070 of the coding region in the mutant lses1, changing the base from “T” to “A,” which subsequently led to an amino acid substitution from isoleucine to lysine at position 357 (I357K) of the encoded protein sequence (Figure 4B). Therefore, LOC_Os02g40860, which encodes a rice casein kinase I family member OsCKI1, was hypothesized to be the candidate target gene of LSES1.

3.6. Genetic Complementation Verification of LSES1

A genetic complementation test was conducted to confirm that the 1 bp missense mutation in LOC_Os02g40860 was responsible for the lses1 mutant phenotype. The 7660 bp genomic fragment of LSES1 containing the 1668 bp upstream promoter region, the entire LSES1 gene comprising 14 exons and 13 introns, and the 1060 bp downstream region was divided into two fragments, the 4382 bp LSES1-1 and the 4145 bp LSES1-2, which share an 867 bp overlapping region (Figure 1). The two fragments were separately cloned and sequentially ligated into the vector plasmid pC1300. After sequencing verification, the genetic complementation vector pC1300-LSES1 carrying the 7660 bp genomic fragment (Figure 1) was obtained and introduced into the lses1 mutant with the indica rice HH1014 background. The resulting T0-generation lines were self-pollinated. Through molecular detection and phenotypic evaluation, the T1- and T2-generation target lines were successively obtained. PCR amplification using the primers COM-LSES1-F and COM-LSES1-R (Table S2) was performed in the transgenic lines of each generation to detect the integration of the vector T-DNA region. Two independent complementary transgenic lines COM-1 and COM-2, in which the T-DNA region was successfully integrated and the leaf phenotype was restored, were selected.
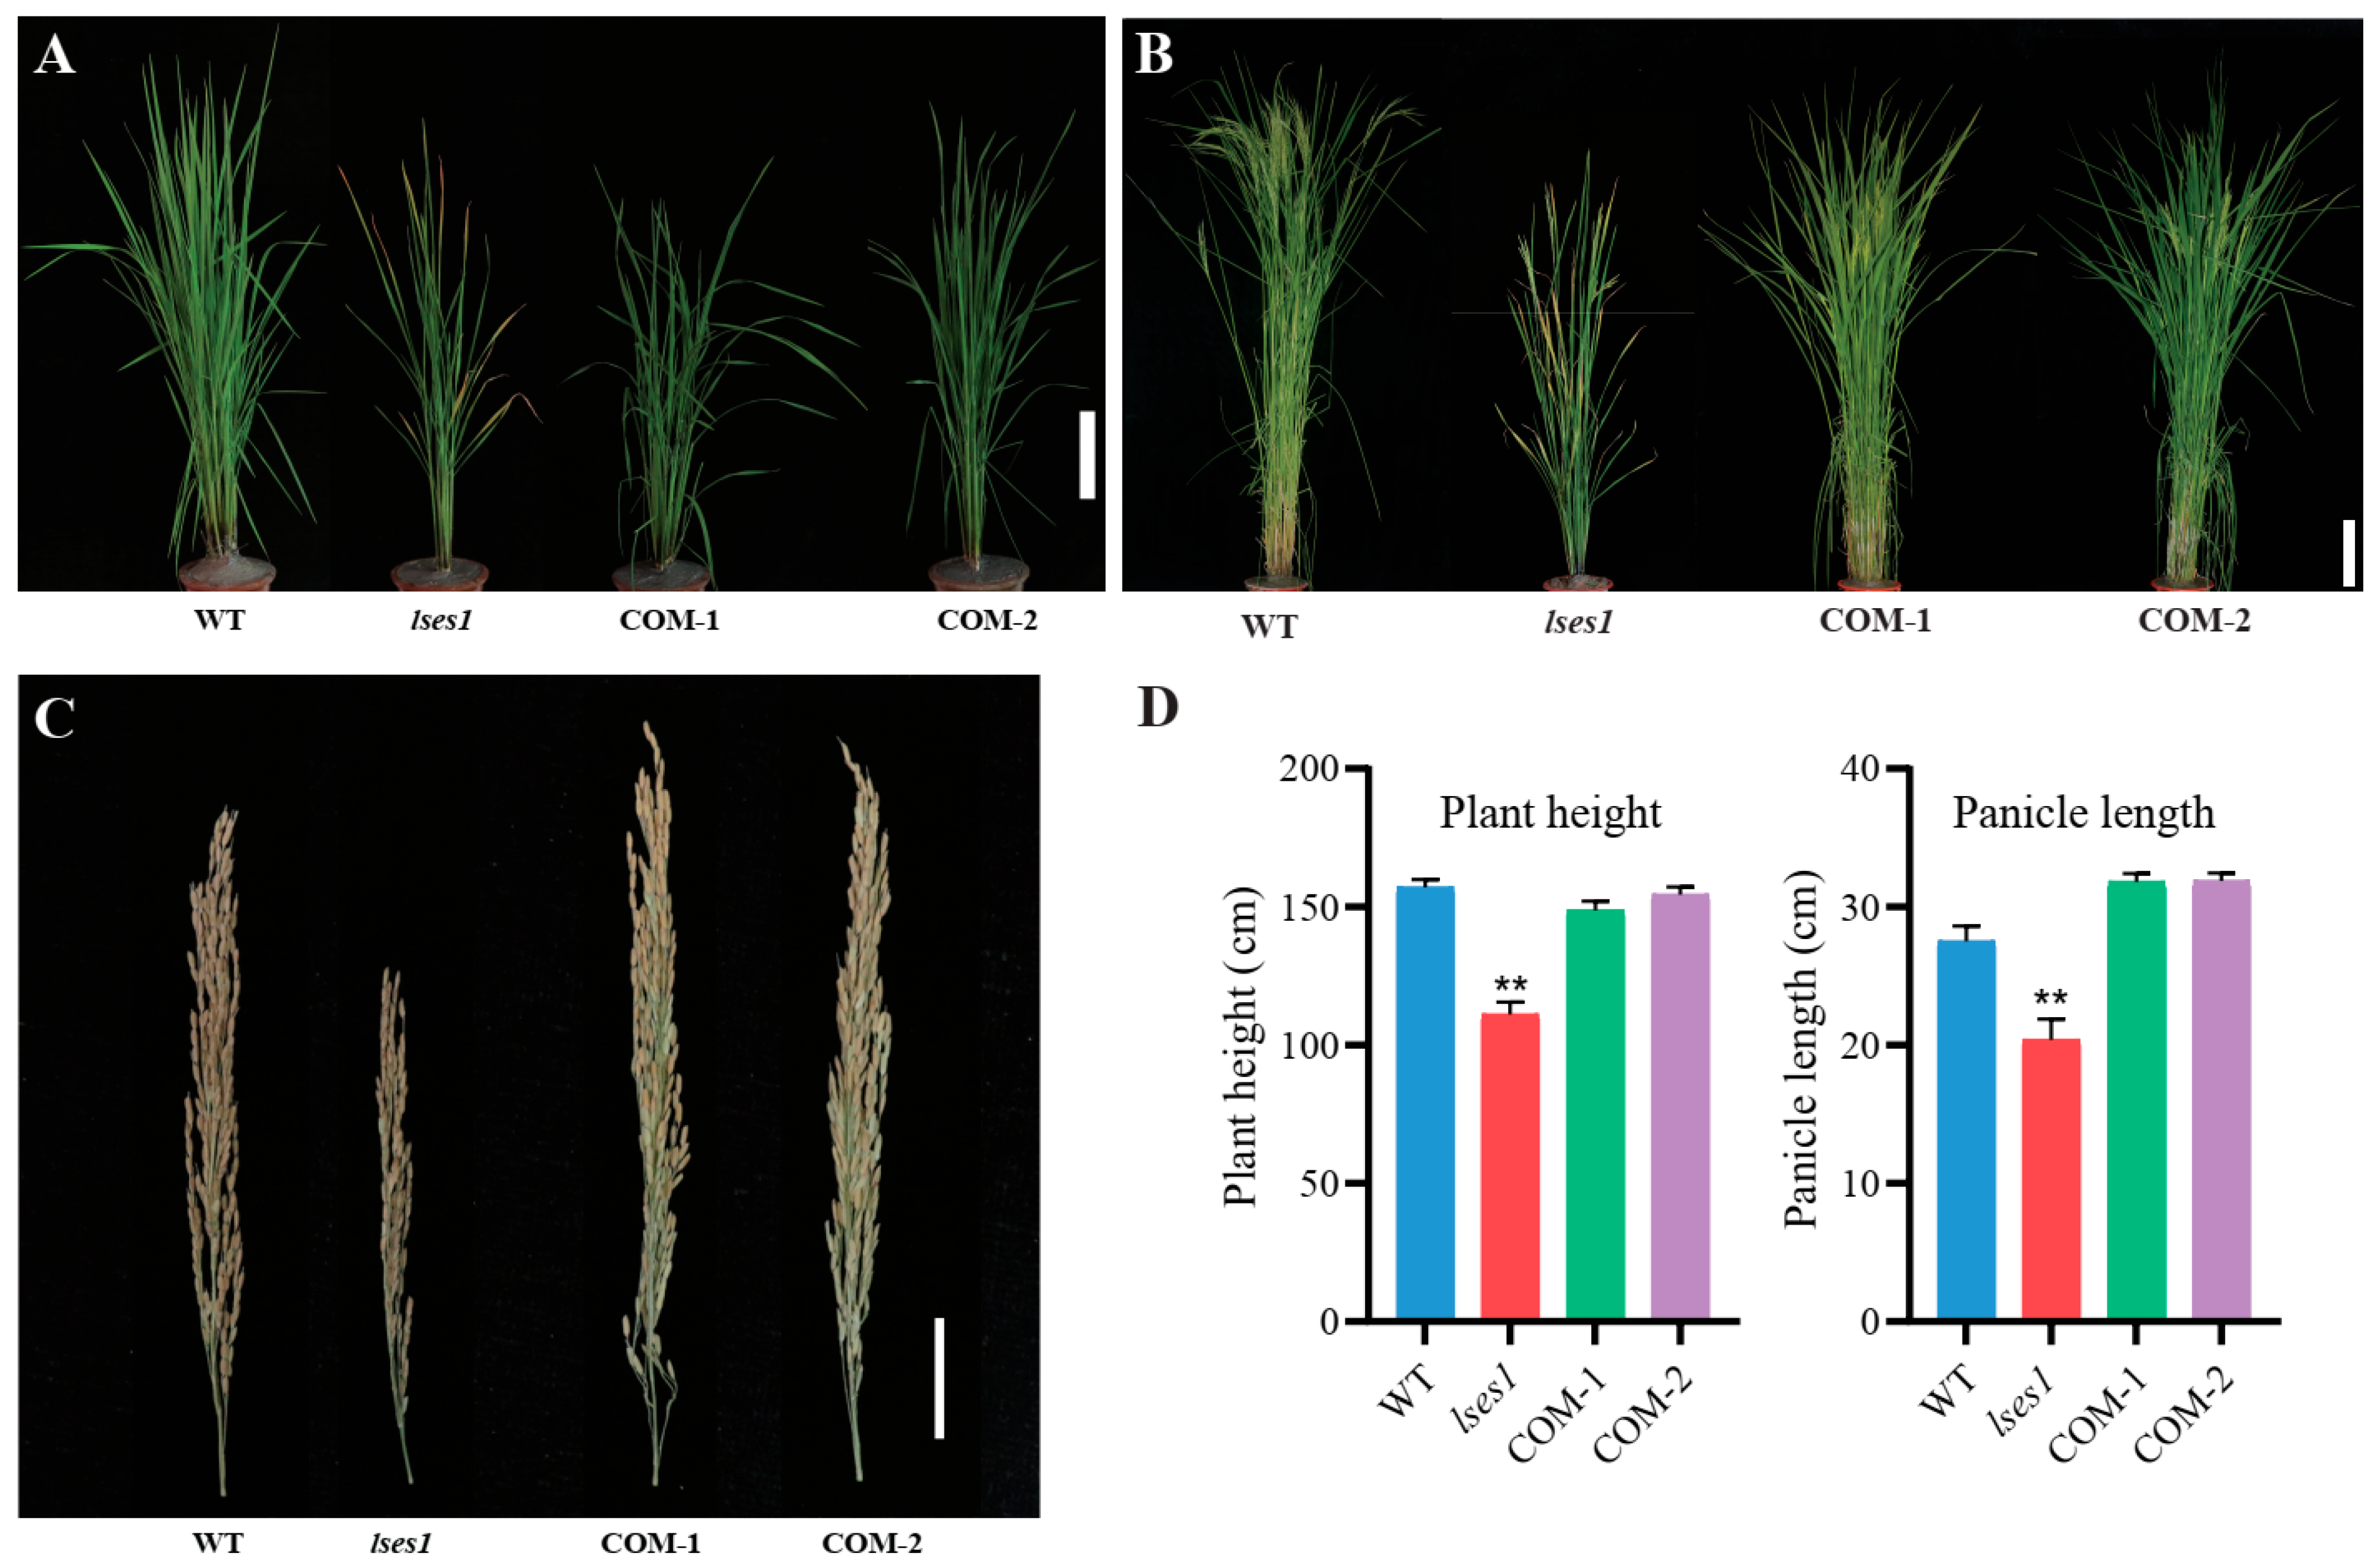
Phenotypic observation of the T2-generation transgenic complementation plants revealed that COM-1 and COM-2 exhibited normal leaf phenotypes during the tillering and heading-grain filling stages, which was consistent with those of the wild-type variety HH1014 (Figure 5A,B), indicating that the premature leaf senescence phenotype of the lses1 mutant was restored in the complementation transgenic plants. Additionally, the plant height of COM-1 and COM-2 increased by approximately 34% compared with the lses1 mutant, approaching that of the wild-type HH1014 (Figure 5B,D). It suggested that the dwarfing phenotype of the lses1 mutant was also restored in the complementation transgenic plants (Figure 5B,D; Table S3). Evaluation of panicle traits (Figure 5C,D; Table S3) showed that the panicle length of COM-1 and COM-2 significantly increased compared with lses1 and even exceeded that of the wild-type HH1014 (Figure 5C,D), demonstrating that the shortened panicle phenotype associated with the lses1 mutant was restored in the complementation transgenic plants as well. These genetic complementation results verified that LOC_Os02g40860 is indeed the responsible gene of LSES1. Meanwhile, the premature leaf senescence phenotype of the lses1 mutant was caused by the single-base missense mutation in LOC_Os02g40860 (OsCKI1), leading to the I357K substitution.

3.7. Validation of LSES1 Knockout and Acquisition of Improved Lines

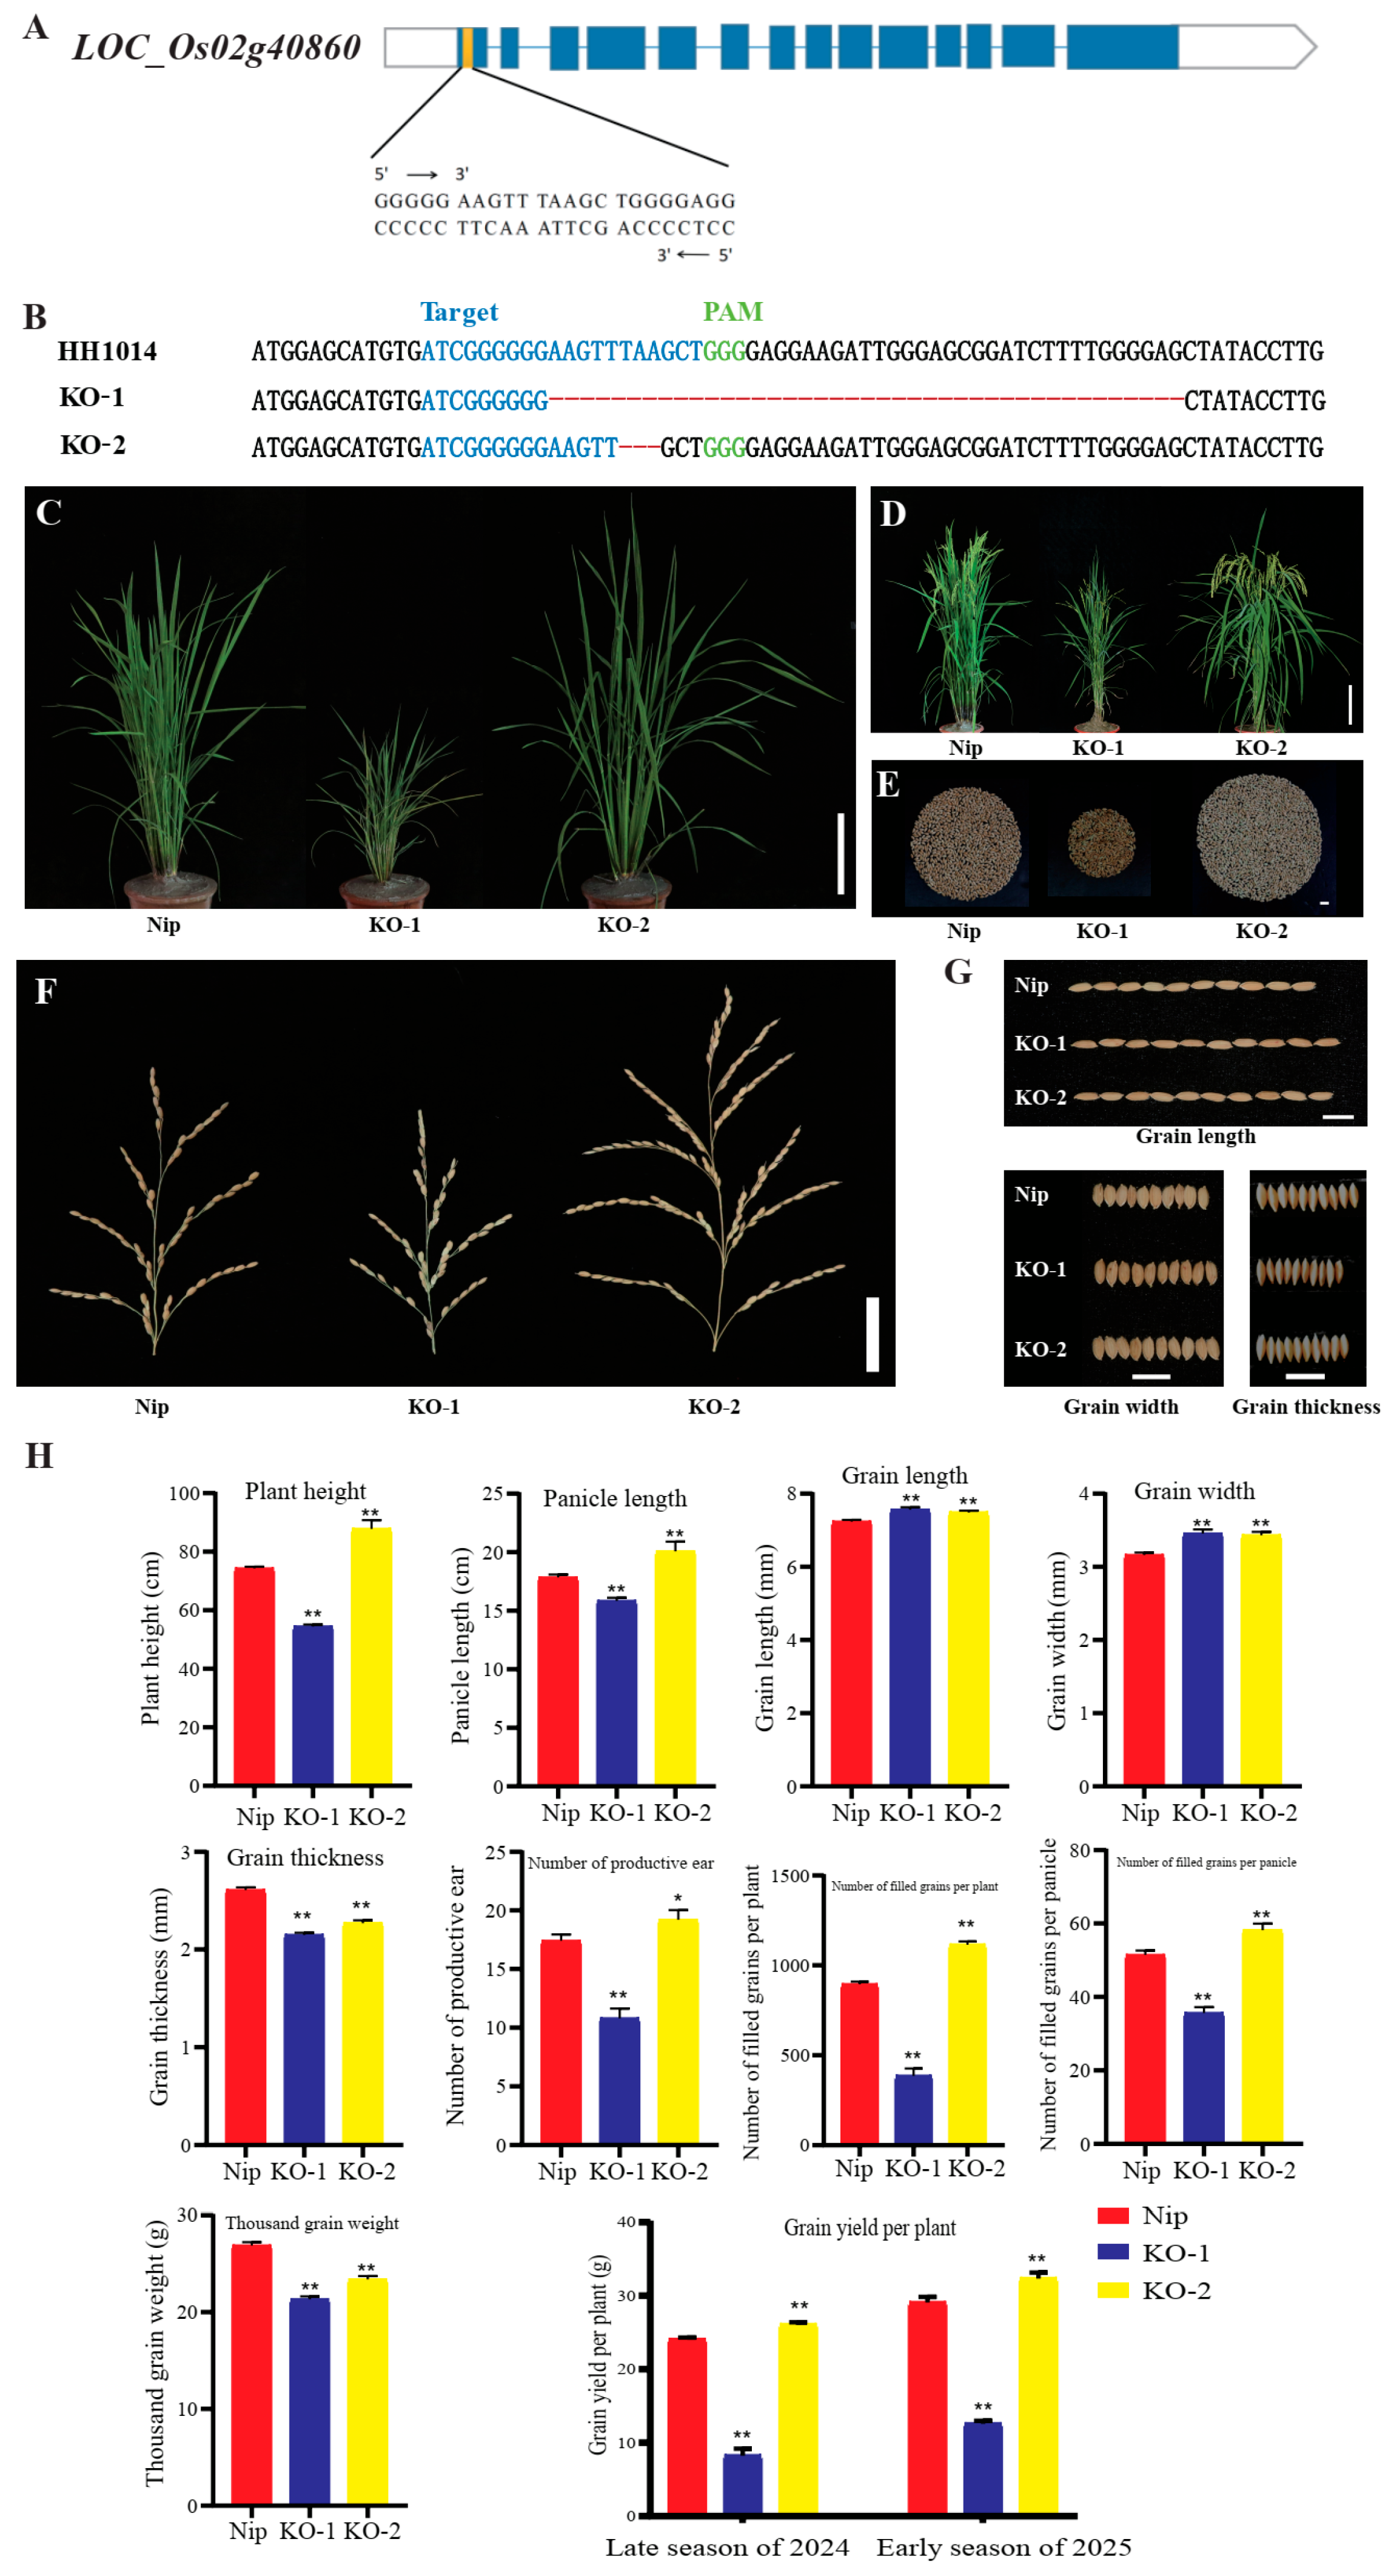
Based on the CRISPR/Cas9 technology, the knockout vector pRHCas-LSES1 was constructed, targeting the 17th to 39th bases of the first exon of LSES1 (Figure 6A), and transformed into the japonica rice variety Nip. A total of 15 T0-generation knockout mutant lines were obtained. However, 13 of these lines could not be preserved, due to excessively severe premature senescence phenotypes across the entire plant. Only two lines, named KO-1 and KO-2, exhibiting normal seed setting and were retained. The gene-editing sites of two knockout T2-generation lines were verified by sequencing with the primers KO-LSES1-F and KO-LSES1-R (Table S2). The results revealed that, compared to the wild-type HH1014, KO-1 has a deletion of 45 base pairs (bps) in the targeted editing region, whereas KO-2 had a 3 bp deletion (Figure 6B).
Phenotypic observations of the knockout transgenic plants showed that KO-1 exhibited similar traits to the lses1 mutant, displaying obvious premature leaf senescence and significant dwarfing throughout the growth period compared with the wild-type Nip (Figure 6C,D). The analysis of the related agronomic traits demonstrated that KO-1 had significantly reduced plant height (26.7% decrease) and panicle length (11.1% decrease), compared with the wild-type Nip (Figure 6D,F,H). Interestingly, in terms of grain shape (Figure 6G,H), KO-1 showed significant increases in grain length (4.5% increase) and grain width (9.3% increase), with significant decreases in grain thickness (17.6% decrease), compared with wild-type Nip. Additionally, KO-1 exhibited drastic reductions in number of productive ears (37.9% decrease), number of filled grains per plant (56.9% decrease), number of filled grains per panicle (30.6% decrease), thousand-grain weight (20.6% decrease), and grain yield per plant (65.7% decrease in late season of 2024 and 56.7% decrease in early season of 2025), all reaching the extremely significant levels (p < 0.01) (Figure 6E,F,H; Table S4). These results further confirmed that the premature leaf senescence phenotype of the lses1 mutant is caused by mutations in LOC_Os02g40860.
The KO-2 line displayed normal leaves without premature senescence and exhibited superior growth vigor compared with the wild-type Nip (Figure 6C,D). The plant height and panicle length of KO-2 increased by 18.1% and 12.5%, respectively, compared with Nip (Figure 6D,F,H; Table S4). In terms of grain shape, KO-2 showed significant increases in grain length (3.5% increase) and grain width (8.6% increase) (Figure 6E), and a significant decrease in grain thickness (13.0% decrease), similar to KO-1 (Figure 6G,H; Table S4). However, the thousand-grain weight of KO-2 decreased by approximately 13.0% compared to Nip, possibly due to the sharp decrease in grain thickness. Additionally, unlike KO-1, KO-2 exhibited significant increases in the number of productive ears (10.3% increase), number of filled grains per plant (26.6% increase), number of filled grains per panicle (13.0% increase), and grain yield per plant, compared with Nip (Figure 6E–H; Table S4). Grain yield per plant of KO-2 in the late season of 2024 and early season of 2025 showed significant increases with 8.4% and 11.3% (Figure 6E,H; Table S4), respectively. These results indicate that KO-2 has a certain yield-enhancing effect relative to the wild-type Nip, making it an improved LSES1 line with potential breeding application value.

3.8. Subcellular Localization and Tissue-Specific Expression

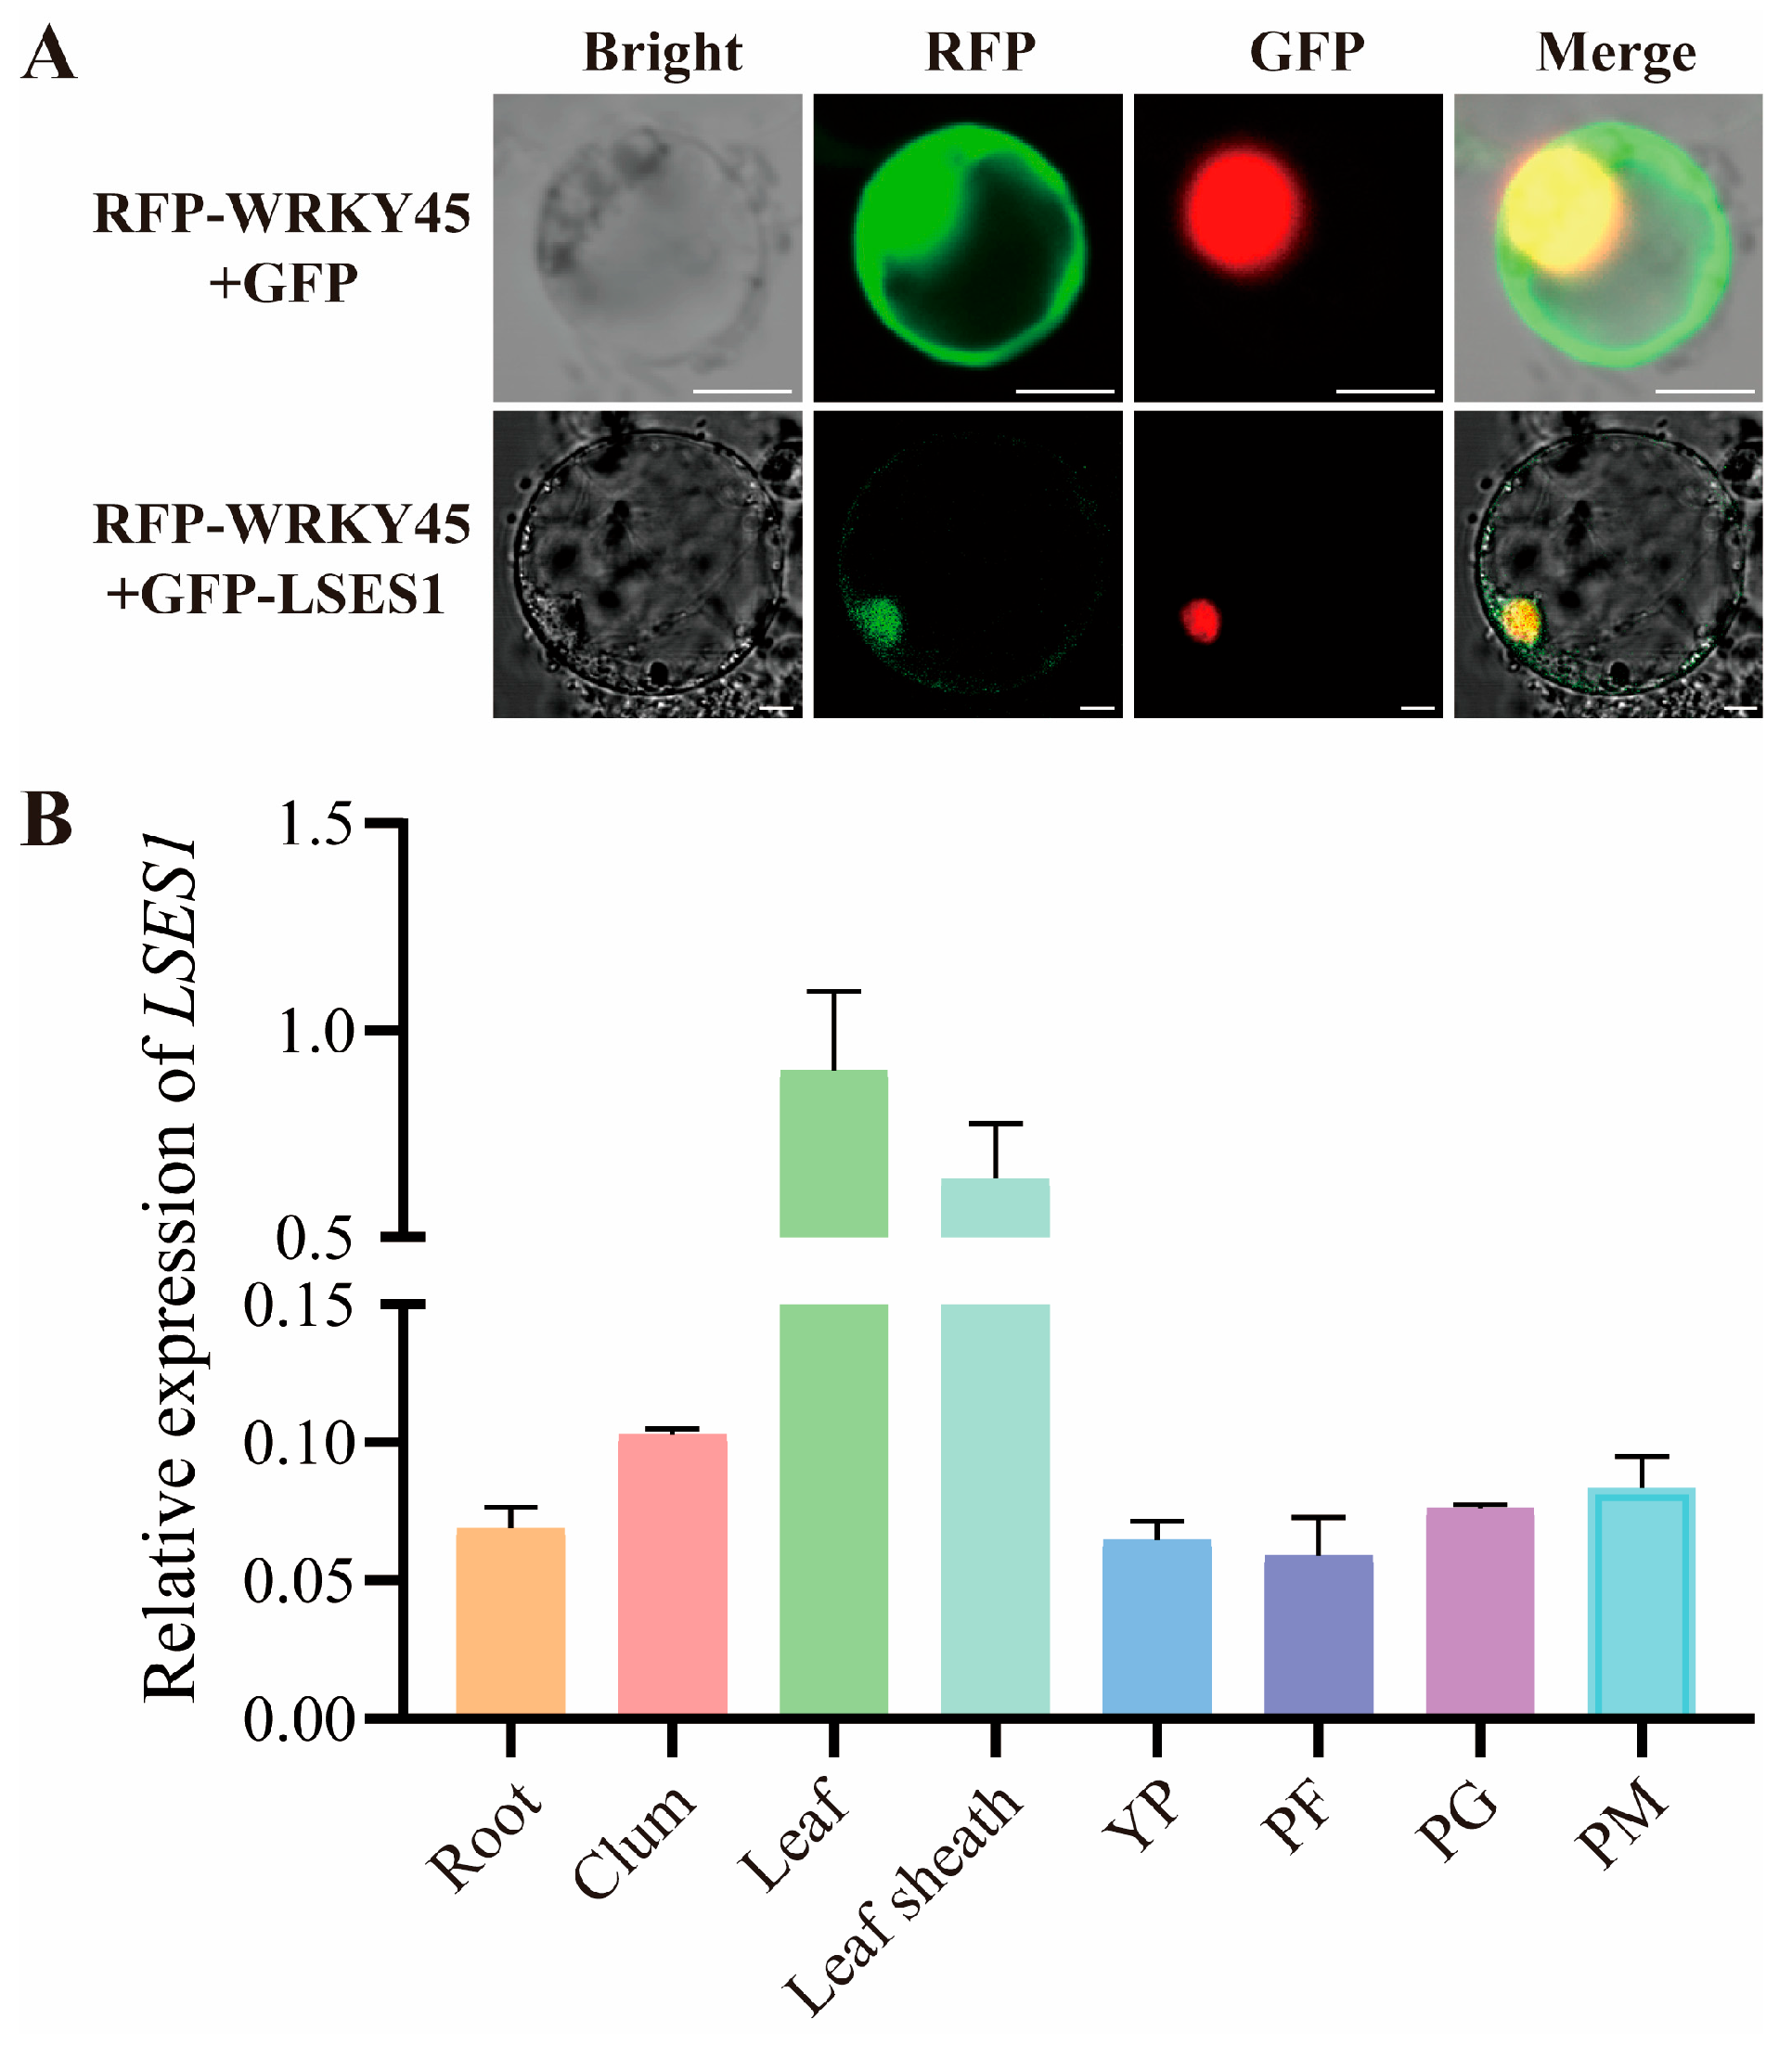
The subcellular localization of LSES1 was detected using the transient expression system of rice protoplasts. In both the control group (pRTV-nRFP-WRKY45 + pRTV-nGFP) and experimental group (pRTV-nRFP-WRKY45 + pRTV-nGFP-LSES1), red and green fluorescence were detected (excluding the bright field), indicating the successful plasmid transformation and expression in the protoplasts (Figure 7A). In the control group (pRTV-nRFP-WRKY45 + pRTV-nGFP), the green fluorescence was distributed throughout the cell, while the nuclear-localized RFP-WRKY45 red fluorescence was confined to the nucleus (Figure 7A). In the experimental group (pRTV-nRFP-WRKY45 + pRTV-nGFP-LSES1), both the red and green fluorescence were exclusively localized in the nucleus, demonstrating the co-localization of GFP-LSES1 with RFP-WRKY45 (Figure 7A). This revealed that the LSES1 protein is localized in the nucleus.
The expression levels of LSES1 were detected by RT-qPCR in the eight different tissues of the wild-type HH1014 in the different stages: the root, clum, leaf, and leaf sheath in the tillering stage; young panicles; and panicles in the flowering stage, grain-filling stage, and mature stage, respectively. Normalized by the reference gene OsActin, the expression profile of LSES1 was analyzed (Figure 7B, Table S5). The results indicated that LSES1 is expressed in various tissues and developmental stages of the wild type, with the highest expression levels observed in leaf and leaf sheath, suggesting that LSES1 is a constitutively expressed gene.

4. Discussion

4.1. The lses1 Mutant Exhibits Obvious Physiological Characteristics of Premature Leaf Senescence and Excessive Starch Accumulation

Premature leaf senescence in plants is a complex biological process involving diverse regulatory pathways and genetic mechanisms. Among these, excessive starch accumulation in leaves is a significant contributing factor to premature senescence, though its molecular mechanisms remain unclear. The lses1 mutant displays a gradual yellowing and withering of the older leaves starting from the leaf tips in the seedling stage, which progressively extends toward the mid-leaf regions and higher leaf positions during growth, accompanied by the reduced plant height and panicle yield. Our previous studies, through the starch content measurements and iodine-potassium iodide staining, demonstrated that the lses1 mutant leaves exhibit excessive starch accumulation [33]. The ultrastructural observations of the mesophyll cells in this study further confirmed this characteristic, exhibiting abundant starch granule accumulation in the chloroplasts of the lses1 mutants. The lses1 mutant shares the physiological characteristics of both leaf premature senescence and excessive starch accumulation with previously reported rice leaf early senescence mutants, such as esl9 [4], esl11 [5], pls5 [6], ossac4 [7], lps1 [8], and ossac3 [9]. Starch in leaves is synthesized through photosynthesis and temporarily stored in chloroplasts. During the night, it is broken down into glucose and maltose via respiration, and transported from the chloroplasts to the cytosol for sucrose synthesis and maintenance of plant growth metabolism. If the leaf starch fails to be exported in time, then the prolonged starch accumulation will weaken the photosynthetic assimilation, impairing the normal growth. The transmission electron microscopy (TEM) ultrastructural analysis in this study revealed a high density of starch granules in the chloroplasts of the second-top leaf tip in the lses1 mutants in the six-leaf stage, accompanied by severe chloroplast structural damage. Our previous physiological analyses showed that, compared with the wild-type plants, the lses1 mutant leaves exhibited significantly reduced chlorophyll contents and protective enzyme activities, along with elevated levels of reactive oxygen species (ROS) and malondialdehyde (MDA). Integrated transcriptomic and proteomic analyses further highlighted a strong correlation between the physiological changes in the lses1 mutant leaves and the alterations in the expression profiles of mRNAs and proteins, emphasizing the role of excessive starch accumulation in accelerating leaf senescence [33]. Thus, it suggested that the excessive accumulation of starch granules in the lses1 mutant leaves would compress and damage thylakoids, disrupting chloroplast structure, leading to severe chlorophyll degradation, a marked decline in photosynthetic efficiency, and ultimately triggering the premature leaf senescence phenotype.

4.2. LSES1 Is Involved in the Regulating of Leaf Senescence in Rice

Genetic analysis of multiple hybrid crosses in this study demonstrated that the premature leaf senescence trait of the lses1 mutant is controlled by a single recessive nuclear gene. Using BSA-seq-based preliminary mapping, map-based cloning, and mutation site sequencing, we identified LOC_Os02g40860 as the candidate gene for LSES1. Genetic complementation and knockout experiments confirmed LOC_Os02g40860 as indeed LSES1, validating its biological role in regulating leaf senescence.
A missense mutation at the 1070th nucleotide (T → A) in the coding region of LOC_Os02g40860 results in an amino acid substitution from isoleucine to lysine (I357K) in the lses1 mutant. LOC_Os02g40860 encodes OsCKI1, a member of the rice casein kinase I family. Previous studies have reported multiple allelic variants of this gene, including OsCKI1, HBD2, LTRPK1, LTG1, and DTG1, which are involved in diverse physiological processes such as root development and hormone response, hybrid weakness, cold adaptation, and regulation of tiller number and grain size [22,23,24,25,26], suggesting its multifunctional biological roles. Notably, three allelic mutants, including HBD2, LTG1, and DTG1, share the same I357K substitution as the lses1 mutant, indicating that this site is a key functional site of LSES1/OsCKI1.
Phenotypic validation showed that two genetic complementation transgenic lines, COM-1 and COM-2, exhibited normal leaf morphology, effectively rescuing the premature leaf senescence phenotype of lses1. Conversely, the knockout line KO-1 in the Nip background displayed premature leaf senescence similar to lses1. These results confirmed that LOC_Os02g40860 should be the target gene LSES1, an allele of OsCKI1 with a demonstrated role in regulating leaf senescence.

4.3. LSES1 Likely Possesses Diverse Biological Regulatory Functions

In the genetic complementation experiment, in addition to rescuing the leaf early senescence phenotype, COM-1 and COM-2 also restored the dwarfism and short-panicle traits associated with the lses1 mutant (Figure 5B–D). The knockout line KO-1 similarly exhibited dwarfing and weakened panicle-related traits (Figure 6C–H), mirroring the lses1 mutant. Intriguingly, despite sharing the I357K substitution, allelic mutants HBD2 [22], LTG1 [25], and DTG1 [26] were reported to regulate hybrid weakness, cold adaptation, and tiller number and grain size, respectively, distinct from the leaf senescence, which is the focus of this study. These findings collectively suggest that LSES1/OsCKI1 may have pleiotropic regulatory functions, potentially influencing multiple agronomic traits in rice.
Subcellular localization revealed that the LSES1 protein resides in the nucleus, consistent with the reported localization of DTG1 [26]. The expression levels of LSES1 were detected by RT-qPCR analysis in roots, clums, leaves, and leaf sheaths in the seedling stage, young panicles, and panicles in the flowering, grain-filling, and maturity stages, indicating its constitutive expression throughout the rice life cycle. This aligns with the GUS staining results for LTG1 [25] and the RT-qPCR data for DTG1 [26], supporting a potential link between ubiquitous expression and functional versatility.
As a casein kinase I family member, OsCKI1 is supposed to phosphorylate multiple target proteins, enabling modular regulation of diverse physiological processes. Through yeast two-hybrid, bimolecular fluorescence complementation (BiFC), and luciferase complementation imaging assay (LCI), it was demonstrated that DTG1/OsCKI1 interacts with GW2 to co-regulate grain size [26]. Our prior integrated transcriptomic and proteomic analysis of the lses1 mutant identified the upregulated expression of four ABA-related proteins and three starch biosynthesis-related CKI targets [33], suggesting LSES1 may influence transient starch accumulation, senescence via phosphorylation, ABA signaling, and starch metabolic pathways. These findings lay a foundation for future identification of LSES1 kinase substrates and elucidation of its molecular modules in leaf senescence regulation.
Using CRISPR/Cas9, we generated a three-base deletion knockout line, KO-2, which exhibited enhanced growth vigor and higher yield than the wild-type Nip, suggesting LSES1 editing as a promising breeding strategy. Similar to DTG1 knockouts [26], KO-2 showed increased grain length (3.5%) and width (8.6%) (Figure 6G,H; Table S4). However, its thousand-grain weight decreased significantly (13.0%), possibly due to reduced grain filling, especially the sharp decrease in grain thickness (13.0% decrease), contrasting with the DTG1 results [26]. This difference may be related to the different editing sites of OsCKI1/LSES1/DTG1. In the study of Li et al. [26], compared to the wild-type 02428, the editing sites of three DTG1/OsCKI1 knockout lines, Cr-1, Cr-2, and Cr-3, were all in the second exon. Cr-1 and Cr-2 exhibit deletion of the 21st base and 7 bases starting from the 17th base, respectively, with both resulting in frameshifts of the encoded amino acid; Cr-3 has an A-to-T mutation at the 22nd base, leading to a mismatch in the encoded amino acid. In this study, compared to the wild-type Nip, the LSES1/OsCKI1 knockout line KO-2 has a deletion of 3 bases starting from the 27th base in the first exon, causing a frameshift of the encoded amino acid. The different effects of editing site differences on grain shape composition factors reflect the precise regulation of OsCKI1/LSES1/DTG1 on grain shape.
The grain yield per plant of KO-2 significantly increased by 8.4% and 11.3% in the late season of 2024 and early season of 2025 (Figure 6H, Table S4), respectively, mainly attributable to higher number of productive ear and number of filled grains per panicle, mirroring the DTG1 findings [26]. Additionally, KO-2 displayed greater plant height and panicle length than the wild-type Nip, indicating superior growth potential. These results position KO-2 as an improved LSES1 line with breeding value, offering a novel genetic resource for further research.

5. Conclusions

The rice mutant lses1 exhibits obvious physiological characteristics of premature leaf senescence and excessive starch accumulation. The candidate gene for LSES1 was identified as LOC_Os02g40860, which encodes OsCKI1, a member of the rice casein kinase I family. It was found that a missense mutation from T to A occurred at the 1070th nucleotide in its coding region, resulting in an amino acid substitution from isoleucine to lysine (I357K) in the encoded protein of the mutant lses1. Both genetic complementation and gene knockout verification experiments confirmed that LOC_Os02g40860 (OsCKI1) is the target gene of LSES1, and LSES1/OsCKI1 is involved in the regulation of leaf senescence in rice. Meanwhile, an LSES1-improved line KO-2 was identified from the knockout lines, which showed significant improvements in grain yield per plant compared with the wild-type Nip, and has potential breeding application value. Analysis of subcellular localization and tissue-specific expression showed that LSES1 is mainly expressed in the nucleus, and LSES1 is a constitutively expressed gene.

Supplementary Materials

The following supporting information can be downloaded at https://www.mdpi.com/article/10.3390/agronomy15112601/s1, Table S1: Newly developed polymorphic InDel markers within the preliminary mapping interval provided by BSA-seq; Table S2: Key primers for construction of genetic complementation vector; Table S3: Plant height and panicle length of wild type (HH1014, WT), the lses1 mutant (MT), and functionally complemented plants (COM-1 and COM-2); Table S4: Detection data of various important agronomic traits of Nip and gene knockout-edited lines (KO-1 and KO-2); Table S5: Detection data of RT-qPCR analysis of relative LSES1 expression levels in various tissues of wild-type HH1014.

Author Contributions

F.C., K.L., and Q.J. conceived and designed the study. F.C., Q.Z., Z.C., M.X., R.H., T.H., M.Z., and Y.G. performed the experiments. Q.Z. analyzed sequencing data. F.C., Q.Z., X.W., and Q.J. analyzed the data as a whole and wrote the manuscript. All authors have read and agreed to the published version of the manuscript.

Funding

This work was supported by the Natural Science Foundation of Fujian Province (2023J01444, 2024J01380), the Open Program of Fujian Key Laboratory of Crop Genetic Improvement and Innovative Utilization for Mountain Area (2023SKF01), and grants from the Seed Industry Innovation and Industrialization Project of Fujian Province (zycxny2021003).

Data Availability Statement

The original contributions presented in this study are included in the article/Supplementary Materials. Further inquiries can be directed to the corresponding author.

Acknowledgments

The authors are grateful to Caiming Wu and Luming Yao (Analysis and Testing Center, School of Life Sciences, Xiamen University) for her help in transmission electron microscope observation.

Conflicts of Interest

The authors declare no conflicts of interest. The funders had no role in the design of the study; in the collection, analyses, or interpretation of data.

Abbreviations

The following abbreviations are used in this manuscript:
AELArabidopsis EL1-like
LSES1Leaf Starch Excess and Senescence 1
CKCasein kinase
CRY2Cryptochrome 2
ACS5ACC Synthase 5
ETO1Ethylene Overproduction 1
ACS7ACC Synthase 7
SMXLThe suppressor of MAX2 1-like
SLStrigolactone
MAX2More Axillary Growth 2
CKL6Casein kinase-like 6
PCDProgrammed cell death
O2Opaque2
PPDKPyruvate phosphate dikinase
hbd2hybrid breakdown 2
LTRPK1Low-temperature Response Protein Kinase 1
LTG1Low-Temperature Growth 1
DTG1Defective Tiller Growth 1
ROSReactive oxygen species
MDAMalondialdehyde
ABAAbscisic acid
BSA-seqBulked segregant analysis sequencing
SSRsSimple sequence repeats
InDelInsertion–deletion
PCRPolymerase chain reaction
COMComplementary transformant
KOKnockout
GFPGreen fluorescent protein
RFPRed fluorescent protein
YPYoung panicles
PFPanicles in the flowering stage
PGPanicles in the grain-filling stage
PMPanicles in the mature stage
CRISPR/Cas9Clustered regularly interspaced short palindromic repeats/CRISPR-associated protein 9
RT-qPCRReverse-transcription quantitative PCR
TEMTransmission electron microscopy
ChrChromosome
SNPSingle-nucleotide polymorphism
BiFCBimolecular fluorescence complementation
LCIluciferase complementation imaging assay
GW2Grain Width 2

References

  1. Guo, Y.; Ren, G.; Zhang, K.; Li, Z.; Miao, Y.; Guo, H. Leaf senescence: Progression, regulation, and application. Mol. Hortic. 2021, 1, 5. [Google Scholar] [CrossRef]
  2. Lloyd, J.R.; Kossmann, J. Transitory and storage starch metabolism: Two sides of the same coin? Curr. Opin. Biotech. 2015, 32, 143–148. [Google Scholar] [CrossRef]
  3. Hirose, T.; Aoki, N.; Harada, Y.; Masaki, O.; Yoichi, H.; Ryu, O.; Miyao, A.; Hirohiko, H.; Tomio, T. Disruption of a rice gene for α-glucan water dikinase, OsGWD1, leads to hyperaccumulation of starch in leaves but exhibits limited effects on growth. Front. Plant Sci. 2013, 4, 147–156. [Google Scholar] [CrossRef] [PubMed]
  4. Xiao, Y.H.; Chen, X.L.; Du, D.; Xing, Y.D.; Zhang, T.Q.; Zhu, M.D.; Liu, M.M.; Zhu, X.Y.; Sang, X.C.; He, G.H. Identification and gene mapping of starch accumulation and early senescence leaf mutant esl9 in rice. Acta Agron. Sin. 2017, 43, 473–482. (In Chinese) [Google Scholar] [CrossRef]
  5. Wang, Y.T.; Wang, X.W.; Xie, J.; Yin, W.Z.; Zhang, T.; Zhu, X.Y.; Yu, P.; Huang, J.Y.; Yang, Z.L.; He, G.H.; et al. Identification and gene mapping of an early senescent leaf mutant esl11 of rice. Crop Sci. 2018, 58, 1932–1941. [Google Scholar] [CrossRef]
  6. Lin, T.; Sun, L.; Gong, H.; Liu, L.; Zhao, Z.; Dong, H.; Wang, Y.; Jiang, L.; Wan, J. Identification and gene mapping of a premature leaf senescence 5 mutant with starch accumulation in rice leaves. J. Nanjing Agric. Univ. 2020, 43, 414–422. (In Chinese) [Google Scholar] [CrossRef]
  7. Zhu, M.D.; Chen, X.L.; Zhu, X.Y.; Xing, Y.D.; Du, D.; Zhang, Y.Y.; Liu, M.M.; Zhang, Q.L.; Lu, X.; Peng, S.S.; et al. Identification and gene mapping of the starch accumulation and premature leaf senescence mutant ossac4 in rice. J. Integr. Agr. 2020, 19, 2150–2164. [Google Scholar] [CrossRef]
  8. Chu, X.; Lu, T.; Ye, H.; Wang, S.; Lin, H.; Wu, X.; He, R.; Yan, G.; Wang, Y.; Li, S.; et al. Cloning and functional analysis of leaf senescence gene LPS1 in Oryza sativa. Chin. J. Rice Sci. 2021, 35, 427–438. (In Chinese) [Google Scholar]
  9. Xie, Z.; Zhao, B.; Zhang, M.; Sang, X.; Zhao, F.; Feng, P.; He, G.; Zhu, X. Mutation of OsSAC3, encoding the xanthine dehydrogenase, caused early senescence in rice. Int. J. Mol. Sci. 2022, 23, 11053. [Google Scholar] [CrossRef]
  10. Zhu, G.Q.; Qu, L.; Xue, H.W. Casein kinase 1 AELs promote senescence by enhancing ethylene biosynthesis through phosphorylating WRKY22 transcription factor. New Phytol. 2024, 244, 116–130. [Google Scholar] [CrossRef]
  11. Pinna, L.A.; Meggio, F. Protein kinase CK2 (“casein kinase-2”) and its implication in cell division and proliferation. Prog. Cell Cycle Res. 1997, 3, 77–97. [Google Scholar]
  12. Chen, H.H.; Xue, H.W. Casein kinase 1 in plants. Chin. Bull. Life Sci. 2018, 30, 1184–1192. (In Chinese) [Google Scholar]
  13. Robinson, L.C.; Menold, M.M.; Garrett, S.; Culbertson, M.R. Casein kinase I-like protein kinases encoded by YCK1 and YCK2 are required for yeast morphogenesis. Mol. Cell Biol. 1993, 13, 2870–2881. [Google Scholar] [PubMed]
  14. Robinson, L.C.; Bradley, C.; Bryan, J.D.; Jerome, A.; Kweon, Y.; Panek, H.R. The Yck2 yeast casein kinase 1 isoform shows cell cycle-specific localization to sites of polarized growth and is required for proper septin organization. Mol. Biol. Cell 1999, 10, 1077–1092. [Google Scholar] [CrossRef] [PubMed]
  15. Cohen, P. The origins of protein phosphorylation. Nat. Cell Biol. 2002, 4, E127–E130. [Google Scholar] [CrossRef]
  16. Tan, S.T.; Dai, C.; Liu, H.T.; Xue, H.W. Arabidopsis casein kinase1 proteins CK1.3 and CK1.4 phosphorylate cryptochrome2 to regulate blue light signaling. Plant Cell 2013, 25, 2618–2632. [Google Scholar] [CrossRef]
  17. Tan, S.T.; Xue, H.W. Casein kinase 1 regulates ethylene synthesis by phosphorylating and promoting the turnover of ACS5. Cell Rep. 2014, 9, 1692–1702. [Google Scholar] [CrossRef]
  18. Su, X.; Xue, H.W. Plant-specific casein kinases phosphorylate and stabilize SMXL6/7/8 to suppress strigolactone signaling and promote shoot branching. Mol. Plant 2025, 18, 1458–1471. [Google Scholar] [CrossRef]
  19. Ben-Nissan, G.; Cui, W.; Kim, D.J.; Yang, Y.; Yoo, B.C.; Lee, J.Y. Arabidopsis casein kinase 1-like 6 contains a microtubule-binding domain and affects the organization of cortical microtubules. Plant Physiol. 2008, 148, 1897–1907. [Google Scholar] [CrossRef]
  20. Li, Y.; Fu, Y.; Li, Y.; Zhang, R.; Yang, J.; Ma, H.; Min, L.; Zhang, X. Reversing anther thermotolerance by manipulating the cis-elements in the promoter of a high-temperature upregulated gene Casein Kinase I in upland cotton. Sci. China Life Sci. 2025, 68, 1558–1569. [Google Scholar] [CrossRef]
  21. Liao, L.; Huang, Y.; Wang, S.; Zhang, H.; Pan, J.; Long, Z.; Huang, Y.; Li, X.; Chen, D.; Yang, T. The CK1-Opaque2 module orchestrates endosperm filling and nutrient storage in maize seeds. Crop J. 2025, 13, 192–203. [Google Scholar] [CrossRef]
  22. Yamamoto, E.; Takashi, T.; Morinaka, Y.; Lin, S.Y.; Wu, J.Z.; Matsumoto, T.; Kitano, H.; Matsuoka, M.; Ashikari, M. Gain of deleterious function causes an autoimmune response and Bateson-Dobzhansky-Muller incompatibility in rice. Mol. Genet. Genom. 2010, 283, 305–315. [Google Scholar] [CrossRef]
  23. Liu, W.; Xu, Z.H.; Luo, D.; Xue, H.W. Roles of OsCKI1, a rice casein kinase I, in root development and plant hormone sensitivity. Plant J. 2003, 36, 189–202. [Google Scholar] [CrossRef] [PubMed]
  24. Liu, W.; Ji, S.X.; Fang, X.L.; Wang, Q.G.; Li, Z.; Yao, F.Y.; Hou, L.; Dai, S.J. Protein kinase LTRPK1 influences cold adaptation and microtubule stability in rice. J. Plant Growth Regul. 2013, 32, 483–490. [Google Scholar] [CrossRef]
  25. Lu, G.W.; Wu, F.Q.; Wu, W.X.; Wang, H.J.; Zheng, X.M.; Zhang, Y.H.; Chen, X.L.; Zhou, K.N.; Jin, M.N.; Cheng, Z.J.; et al. Rice LTG1 is involved in adaptive growth and fitness under low ambient temperature. Plant J. 2014, 78, 468–480. [Google Scholar] [CrossRef]
  26. Li, J.; Zhou, D.; Li, D.; Wang, G.; Qin, R.; Gong, C.; Chen, K.; Tong, Y.; Li, L.; Liu, K.; et al. The dual role of casein kinase 1, DTG1, in regulating tillering and grain size in rice. Crop J. 2024, 12, 1569–1582. [Google Scholar] [CrossRef]
  27. Gothandam, K.M.; Kim, E.S.; Cho, H.J.; Chung, Y.Y. OsPPR1, a pentatricopeptide repeat protein of rice is essential for the chloroplast biogenesis. Plant Mol. Biol. 2005, 58, 421–433. [Google Scholar] [CrossRef] [PubMed]
  28. Takagi, H.; Tamiru, M.; Abe, A.; Yoshida, K.; Uemura, A.; Yaegashi, H.; Obara, T.; Oikawa, K.; Utsushi, H.; Kanzaki, E.; et al. MutMap accelerates breeding of a salt-tolerant rice cultivar. Nat. Biotechnol. 2015, 33, 445–449. [Google Scholar] [CrossRef]
  29. Oryza sativa Japonica Group IRGSP-1.0. Available online: http://rice.plantbiology.msu.edu/ (accessed on 14 July 2021).
  30. Edwards, K.; Johnstone, C.; Thompson, C. A simple and rapid method for the preparation of plant genomic DNA for PCR analysis. Nucleic Acids Res. 1991, 19, 1349. [Google Scholar] [CrossRef]
  31. Panaud, O.; Chen, X.; McCouch, S.R. Development of microsatellite markers and characterization of simple sequence length poly-morphism (SSLP) in rice (Oryza sativa L.). Mol. Gen. Genet. 1996, 252, 597–607. [Google Scholar]
  32. CRISPRdirect. Available online: http://crispr.dbcls.jp/ (accessed on 2 November 2022).
  33. Chen, Z.; Wang, Y.; Huang, R.; Zhang, Z.; Huang, J.; Yu, F.; Lin, Y.; Guo, Y.; Liang, K.; Zhou, Y.; et al. Integration of transcriptomic and proteomic analyses reveals several levels of metabolic regulation in the excess starch and early senescent leaf mutant lses1 in rice. BMC Plant Biol. 2022, 22, 137. [Google Scholar] [CrossRef] [PubMed]
Figure 1. Construction diagram of the genetic complementation vector pC1300-LSES1 (containing entire LOC_Os02g40860). LSES1 refers to the genomic sequence of LSES1 from the start codon ATG to the stop codon TGA. LSES1-1 and LSES1-2 refer to the first and the second fragment of the full-length LSES1 genomic sequence, comprising 4382 bp and 4145 bp, respectively. Overlapping region refers to the 867 bp overlapping fragment between LSES1-1 and LSES1-2, facilitating seamless assembly. LB and RB refer to the left and right T-DNA border sequences of the pCAMBIA1300 vector, respectively. Promoter refers to the cis-regulatory sequence upstream of the LSES1 start codon ATG. 3′UTR refers to the 3′ untranslated region downstream of the LSES1 stop codon TGA. BamHI, EcoRI, and SacI refer to the restriction endonuclease recognition sites engineered for cloning. HygR refers to the selectable marker gene conferring hygromycin B resistance.
Agronomy 15 02601 g001
Figure 2. Plant phenotypes and ultrastructure of mesophyll cell of the wild type (WT) and lses1 mutant. (A) Plant phenotypes of WT and lses1 in the seedling stage. Bar = 5 cm. (B) Plant phenotypes of WT and lses1 in the tillering stage in the field. The red dashed line marks the field boundary between WT and lses1 planting areas. (C) Phenotypes of the plants and leaves of WT and lses1 in the young panicle differentiation stage. Phenotypes of the WT and lses1 (left) plants. Bar = 20 cm; phenotypes of the second leaves from the top of WT and lses1 (right). Bar = 10 cm. (D) Ultrastructure of mesophyll cells of the second leaves from the top of the WT and lses1 in the six-leaf stage. Bar = 2 μm. LT and LB refer to the leaf tip and leaf base, respectively. The red arrow points to the starch granules.
Agronomy 15 02601 g002
Figure 3. Genetic mapping of LSES1. (A) Preliminary localization of LSES1 based on BSA-seq analysis. This image displays the visualization results of the differences between the recessive pool and the dominant pool. The Y-axis represents the third power of the average allele frequency difference (avg. AFD) of a block, the X-axis represents the physical position of 12 rice chromosomes (unit: Mb), the light colored scatter points represent the blocks (10 kb in size), and the dark curves are the lines connecting the fitted values of the block statistic (average allele frequency). The scatter points and lines of adjacent chromosomes are represented by light/dark blue and light/dark red colors spaced apart from each other. The candidate interval for allele frequency difference (AFD) has been preliminarily determined to be between Chr.2 24–28 Mb, with the peak located near 26 Mb. (B) Fine mapping of LSES1. Numbers under the markers indicate the number of recombinants.
Agronomy 15 02601 g003
Figure 4. Sequencing analysis of mutation sites in the LSES1 candidate gene LOC_Os02g40860. (A) Sequence alignment analysis of the 1070th base mutation site in the coding region of LOC_Os02g40860 among different germplasms. (B) Gene structure of LOC-Os02g40860 and sequencing analysis of the mutation site of the lses1 mutant.
Agronomy 15 02601 g004
Figure 5. Phenotypic validation of genetic complementation transgenic lines for LOC_Os02g40860. (A) Plant phenotypes of the wild type (WT, HH1014), lses1, and the genetic complementation transgenic lines in the lses1 background, COM-1, and COM-2, in the tillering stage. Bar = 20 cm. (B) Plant phenotypes of WT, lses1, COM-1, and COM-2 in the heading stage. Bar = 20 cm. (C) Panicle morphology of WT, lses1, COM-1, and COM-2. Bar = 10 cm. (D) Values of plant height and panicle length of WT, lses1, COM-1, and COM-2. Values are means ± SD (n = 5). p values were determined using Student’s t-test compared with WT (HH1014). **, p < 0.01.
Agronomy 15 02601 g005
Figure 6. Phenotypic validation of LOC_Os02g40860 gene knockout editing. (A) Gene structure of LOC_Os02g40860 and the CRISPR-Cas9-based gene knockout target location. The blue box, blue line, white box, yellow box, and base sequence represent the exons, introns, untranslated regions (UTRs), the location of the gene knockout target, and the knockout target sequence, respectively. (B) Sequencing validation of editing sites in the CRISPR/Cas9-mediated LOC_Os02g40860 gene knockout edited lines KO-1 and KO-2 in the Nip background. (C) Plant phenotypes of the wild-type variety Nip and gene knockout editing lines KO-1 and KO-2 in the tillering stage. (D) Plant phenotypes of Nip, KO-1, and KO-2 in the heading stage. (E) Filled grains per plant of Nip, KO-1, and KO-2. Bar = 1 cm. (F) Panicle morphology of Nip, KO-1, and KO-2. Bar = 10 cm. (G) Grain length (above, bar = 1 cm), grain width (lower left, bar = 1 cm), and grain thickness (lower right, bar = 1 cm) of Nip, KO-1, and KO-2. (H) Statistical charts of various important agronomic traits in Nip, KO-1, and KO-2. Values are means ± SD (n = 5). p values were determined using Student’s t-test compared with Nip. *, p < 0.05; **, p < 0.01.
Agronomy 15 02601 g006
Figure 7. Subcellular localization and tissue-specific expression. (A) Subcellular localization of LSES1 in rice protoplasts. Bar = 5 μm. The LSES1-GFP was co-expressed with the nuclear marker nRFP-WRKY45. (B) RT-qPCR analysis of the relative LSES1 expression levels in various tissues of the wild-type HH1014. The Y-axis represents the relative expression levels, and the X-axis represents the different tissues in the different stages. YP, young panicles (4–5 cm). PF, panicles in the flowering stage. PG, panicles in the grain-filling stage. PM, panicles in the mature stage. Relative expression levels were normalized to that of OsActin. Values are means ± SD (n = 3).
Agronomy 15 02601 g007
Table 1. Segregation of leaf phenotypes in F2 population derived from lses1 and different parents.
Hybrid CombinationNormal Phenotype StrainMutant Phenotype StrainTotal Number of Plantsχ2C
(3:1)
lses1/Nip289933820.09
Nip/lses1206662720.08
lses1/02428162512130.13
lses1/HZ214752890.12
lses1/ZS97B229733020.11
lses1/MH2155194672610.34
Disclaimer/Publisher’s Note: The statements, opinions and data contained in all publications are solely those of the individual author(s) and contributor(s) and not of MDPI and/or the editor(s). MDPI and/or the editor(s) disclaim responsibility for any injury to people or property resulting from any ideas, methods, instructions or products referred to in the content.