Article

Numerical Simulation and Orthogonal Test of Droplet Impact on Soybean Leaves Based on VOF Method and High-Speed Camera Technology

1
College of Agriculture, Heilongjiang Bayi Agricultural University, Daqing 163319, China
2
College of Engineering, Heilongjiang Bayi Agricultural University, Daqing 163319, China
3
State Key Laboratory of Green Pesticides, Guizhou University, Guiyang 550025, China
*
Author to whom correspondence should be addressed.
Agronomy 2025, 15(11), 2578; https://doi.org/10.3390/agronomy15112578
Submission received: 16 October 2025 / Revised: 2 November 2025 / Accepted: 7 November 2025 / Published: 9 November 2025
(This article belongs to the Section Precision and Digital Agriculture)

Abstract

The multi-factor coupling mechanism of droplet impact dynamics remains unclear due to insufficient analysis of leaf structure–droplet interaction and inadequate integration of simulations and experiments, limiting precision pesticide application. To address this, we developed a droplet impact model using the Volume of Fluid (VOF) method combined with high-speed camera experiments and systematically analyzed the effects of impact velocity, angle, and droplet size on slip behavior via response surface methodology. Methodologically, we innovatively integrated 3D reverse modeling technology to reconstruct soybean leaf microstructures, overcoming the limitations of traditional planar models that ignore topological features. This approach, coupled with the VOF method, enabled precise tracking of droplet spreading, retraction, and slip processes. Scientifically, our study advances beyond previous single-factor analyses by revealing the synergistic mechanisms of impact parameters through response surface methodology, identifying impact angle as the most critical factor (42.3% contribution), followed by velocity (28.7%) and droplet size (19.5%). Model validation demonstrated high consistency between simulation predictions and experimental observations, confirming its reliability. Practically, the optimized parameter combination (90° impact angle, 1.5 m/s velocity, and 300 μm droplet size) reduced slip displacement by over 50% compared to non-optimized conditions, providing a quantitative tool for spray parameter control. This work enhances the understanding of droplet–leaf interaction mechanisms and offers technical guidance for improving pesticide deposition efficiency in agricultural production.

1. Introduction

In the process of chemical control of soybean, although pesticide spraying covers the canopy of soybean plants, the adhesion degree of the droplets on the surface of soybean leaves is poor, resulting in a low adhesion rate of pesticides on soybean leaves. Various impact behaviors, such as droplet adhesion, fragmentation, rebound, and splashing, occur after droplets make contact with the leaf surface [1,2,3]. Rebound and splashing pose a risk of deposition onto non-leaf surfaces, while the aggregation of small, adhered droplets on the leaf surface can also lead to sliding and streaming phenomena. These processes cause droplets to detach from the plant leaf surface, which is detrimental to the deposition and retention of the pesticide solution [4,5,6]. Effective deposition of pesticide droplets on the surface is the key to maintaining soybean yield and quality. At present, many scholars have studied the impact behavior of droplets on leaf surfaces through theoretical analysis, experimental research, and numerical simulation [7,8,9,10]. By using high-speed video technology to establish the shooting system, the deposition effect of pesticide droplets on plant leaf surface was observed, and the appropriate droplet size and impact angle were determined [11,12]. However, the phenomenon of droplet impact on leaf surface can only be observed through high-speed camera technology, which cannot provide detailed information about the whole flow field. Moreover, the existing experiments mostly focus on a single factor (such as droplet size or impact speed) and lack a systematic analysis of multi-parameter interactions. The fine interface behavior of pesticide droplets on soybean leaf surface has the problem of interface tracking and capture of the droplet group in a gas–liquid two-phase flow field, which involves the transport state, characteristic change, and interface deformation of pesticide droplets [13,14,15]. The leaf surface deposition effect depends on the physicochemical properties of the droplet, the dynamic characteristics of the droplet before impact, the microstructure of the target leaf, and the environmental influence [16,17,18]. In order to visually show the whole flow field characteristics of droplets in motion, it is of great significance to simulate and analyze the movement of droplets under different working conditions by numerical simulation to improve the mechanism and movement law of droplets [19,20,21]. While computational fluid dynamics (CFD) models have made progress in simulating fog drop trajectories and deposition patterns, they still exhibit significant limitations. For instance, the CFD model developed by Delele et al. [22] analyzed fog drop trajectories and deposition patterns but failed to account for crop–fog interaction. Endalew et al. [23] proposed a novel CFD numerical simulation method that directly incorporated the actual three-dimensional structure of crop canopies into CFD models by creating porous media around branches to simulate leaves, yet this approach still struggles to capture microscale behaviors at the droplet interface. Additionally, some studies employ bidirectional fluid–structure interactions to investigate leaf deformation patterns and airflow distribution within canopies, but focus solely on airflow-induced leaf bending deformation without analyzing its impact on droplet deposition. Notably, current research largely overlooks the influence of soybean leaves’ unique microstructures (such as surface roughness) on droplet dynamics and lacks systematic methods to effectively integrate numerical simulations with experimental validation. Some researchers also use bidirectional flow solid coupling to study the deformation mode of leaves under airflow [24,25] and the airflow distribution in the canopy [26], but they only focus on the bending deformation of leaves under airflow, without paying attention to its influence on droplet deposition.
The multi-factor coupling mechanism of droplet impact dynamics remains unclear, with insufficient systematic analysis of the interaction between leaf structure and droplet motion parameters, as well as inadequate integration of numerical simulations and experimental verification, which has constrained the optimization of precision pesticide application techniques. To address this, this study employed the Volume of Fluid (VOF) method to construct a droplet impact numerical model, combined with high-speed camera technology for laboratory experiments. Effects of impact velocity, impact angle, and droplet size on droplet slip and optimized parameters were systematically analyzed through response surface methodology. The study of the interfacial deformation process of pesticide droplets hitting the soybean leaf surface can not only help to deeply understand the mechanism of pesticide droplet deposition on the soybean leaf surface, but also reduce the dosage of pesticides, reduce pesticide residues and pollution, and has practical significance for improving soybean quality and product quality and safety.

2. Materials and Methods

2.1. Materials and Equipment

The droplet dynamic impact test system (Figure 1) consists of a high-speed camera system, a PCO.dimax cs3 high-speed camera (PCO Co., Ltd., Kelheim, German), a micropipette (30G, 32G, 34G, Hamilton Co., Ltd., Reno, NV, USA), a DF-101ST magnetic stirrer (Sanliang Instruments Co., Ltd., Zhengzhou, China), a Sigma 703D interfacial tension meter (Dachang Huajia Scientific Instrument Department, Tianjin, China), and a micropipette peristaltic pump (CF1000, flow rate range: 0.0015~480 mL/min; Baoding Chuangrui Pump Co., Ltd., Baoding, China). The test leaves are soybean No.31 Kenong varieties growing to the flower bud differentiation period, and the surface area of the leaves is 57.25~68.69 cm2. The test solution is a 20% permethrin emulsion. In addition, the three additives are an aqueous solution of a 1/2000 silicone surfactant from Yunzhan, an aqueous solution of a 1/2000 nonionic surfactant from Jijian, and an aqueous solution of a 1/2000 vegetable oil-based adjuvant from Sujie. The experiment was completed in the plant protection laboratory of the College of Engineering, Heilongjiang Bayi Agricultural University, Heilongjiang Province, China. During the whole process, the temperature was 24 °C and the relative humidity was 49%, and the interference factors, such as droplet evaporation and leaf absorption of droplets, were ignored for droplet spreading.
To quantify the physical properties of the test solution, the surface tension was measured using a Sigma 703D interfacial tension meter, the density was determined by the hydrometer method, and the static contact angle was analyzed through high-speed camera imaging. The measured data are presented in Table 1, where the additives significantly reduced both surface tension and contact angle, providing a basis for analyzing slip behavior in Section 3. Table 1 displays the measured permethrin emulsion and its additives (all test solutions were diluted to 1/2000 concentration using deionized water as the base).
Micro injection devices with needle specifications of 34G (an inner diameter of 0.06 mm), 32G (an inner diameter of 0.11 mm), and 30G (an inner diameter of 0.16 mm) were selected as the droplet generation device, and the radius of the generated droplets was calculated as follows:
R = 3 R needle γ 2 ρ g
Here, R is the radius of the droplet, mm; Rneedle is the radius of the arrow’s needle, mm; γ is the surface tension of the droplets, mN/m; and ρg is the density of the droplets, g/cm3.
When a droplet settles under the action of gravity, it is also subjected to air resistance. According to calculations, the falling heights of droplets in this experiment were 34.45 mm, 43.10 mm, and 50.10 mm. Based on the empirical formulas established by Range and Feuillebois [27], the impact velocity of droplets can be calculated as follows:
ν = g α 1 e 2 α h
α = 3 c ρ a i r 8 ρ d R
Here, h is the drop height, mm; g is the acceleration of gravity, m/s2; v is the impact speed of the droplet, m/s; c is the air resistance coefficient; ρair is the air density, kg/m3; ρd is the density of the droplet, kg/m3; and R is the radius of the droplet, mm.
According to the falling height and Equations (1)–(3), it is determined that the sizes of the droplet hitting the surface of soybeans are about 330 μm, 460 μm, and 580 μm, the speeds are 1.87 m/s, 2.34 m/s, and 2.72 m/s, and the angles are 45°, 75°, and 90°, respectively. The impact area covers the common area of the blade surface and the leaf vein, as shown in Figure 2.

2.2. Numerical Simulation of Motion Characteristics of Droplet Impact on Soybean Leaves

2.2.1. Three-Dimensional Soybean Leaf Reconstruction Cloud Technology

To better capture the intricate details of blade surfaces, reverse engineering techniques were employed. The FreeScan UE blue laser handheld 3D scanner (Xianlin 3D Technology Co., Ltd., Hangzhou, China) and the Tianyuan 3D Digital Scanning System were utilized to extract point cloud data from the blades, followed by stitching and sharpening processes. Subsequently, Geomagic Design X64 software was applied for further refinement, including noise removal and thinning operations. Through the thickening function, the 2D STL files were transformed into 3D STL files. Using the non-seam function of ANSYS 19.2 Space Claim software, the STL 3D model is transformed into a solid model, so as to reverse engineer the leaf surface as shown in Figure 3.

2.2.2. Control Equation Setting

For the establishment of two-phase flow models, mass, momentum, and energy conservation models and component diffusion models need to be used:
ρ t + V ρ v = 0
( ρ V ) t + ρ v v = P + μ v + v T + ρ g + F s
Here, ρ is the density, kg/cm3 mm; P is the static pressure, Pa; μ is the kinetic viscosity, N·s·m−2; and g is the acceleration of gravity, m·s−2.
Fs is the source term of the surface; therefore, it can be described as follows:
F S = σ l g ρ k f 1 0.5 ( ρ 1 + ρ 2 )
Here, σlg is the surface tension coefficient, N·m−1; k is the surface curvature of the two-phase interface; ρ1 is the volume fraction of the water; and ρ2 is the volume fraction of the air.
The surface curvature k can be calculated by the following formula:
k = V e = V e e ¯
Here, ĕ is the direction of the normal to the unit surface, and ē is the normal direction of the surface.

2.2.3. Grid Partitioning and Parameter Setting

The computational domain (3 mm × 6 mm × 0.5 mm) was meshed using ANSYS ICEM with structured quadrilateral grids. Local refinement was applied at the droplet–leaf interface (minimum grid size = 15 μm; 1/20 of the droplet diameter) and free surface (maximum aspect ratio = 5:1) to resolve high-gradient regions.
Three grid densities were tested to validate convergence, as shown in Table 2.
The medium grid (583,200 cells) was selected as the results stabilized (<1% change in D/D0): inlet—pressure inlet (0 Pa gauge pressure), with droplet initial velocity specified via UDF (User-Defined Function); leaf surface—no-slip wall with roughness model Cs = 0.6 (validated against AFM data of leaf roughness Ra = 2.3 μm); and outflow—pressure outlet (0 Pa) to avoid back flow effects.
In the simulation experiment, water was used as the spray medium, with a surface tension of 0.0735 N/m between the air and liquid phases. The static contact angle of water droplets on soybean leaves was measured at 76.5°. The air–liquid two-phase parameters are shown in Table 3.
The upper boundary of the simulation region was set as a pressure inlet boundary condition with zero inlet pressure, while the lower boundary adopted a no-slip wall boundary condition. Other boundaries were configured as outflow conditions conducive to convergence. The turbulence model utilized the Realizable k-ε model, employing the finite volume method for governing equation dispersion. The velocity–pressure coupling algorithm selected the SIMPLE algorithm. Meanwhile, a time-step sensitivity analysis was conducted. When the base time step (1 × 10⁻⁶ s) was further reduced to 5 × 10⁻⁷ s, the variation rates of droplet morphology evolution paths and maximum spreading diameter remained below 0.5%, indicating that the current configuration ensures convergence of time discretization. Each time step was set with a maximum iteration limit of 25, ensuring that residuals converge to below 10−3.

2.2.4. Model Validation and Dimensionless Analysis

The numerical model was validated against high-speed camera experiments (Section 3.2) by comparing normalized spread diameter (D/D0) and maximum slip distance (Smax) at an impact velocity of 2.0 m/s. The simulation results showed a D/D0 ratio of 1.78, compared to an experimental value of 1.82 (RMSE = 4.2%). For maximum contact area (Smax), the simulation value was 1.89 mm versus the experimental value of 1.93 mm (bias = 2.1%). Sensitivity analysis demonstrated that variations in the droplet contact angle by +5° and surface tension by ±10% resulted in Smax changes below 3%, confirming the model’s robustness. Key dimensionless numbers were calculated to characterize impact dynamics, as shown in Table 4.
As shown in Table 4, when We > 100 (corresponding to velocities ≥ 2.0 m/s), inertial forces dominate significantly, causing droplets to transition from spreading to splashing—a phenomenon that explains the observed “droplet fragmentation under high-velocity impact” in experiments. The Reynolds number range of 300–900 indicates that the flow is in the transition zone between laminar and turbulent regimes, validating the necessity of using the Realizable k-ε turbulence model (which outperforms the standard k-ε model in simulating transitional flow states). At We = 378, the droplet splashing threshold aligns with [27]’s conclusion of “rough surface droplet impact critical We = 350”, indirectly confirming the rationality of the blade surface roughness model (Cs = 0.6).

3. Results and Discussion

3.1. Numerical Simulation Analysis

In order to reduce the influence of air resistance on the falling droplets and be closer to the actual situation, the initial position of the droplets was set 2 mm away from the leaf surface during simulation.
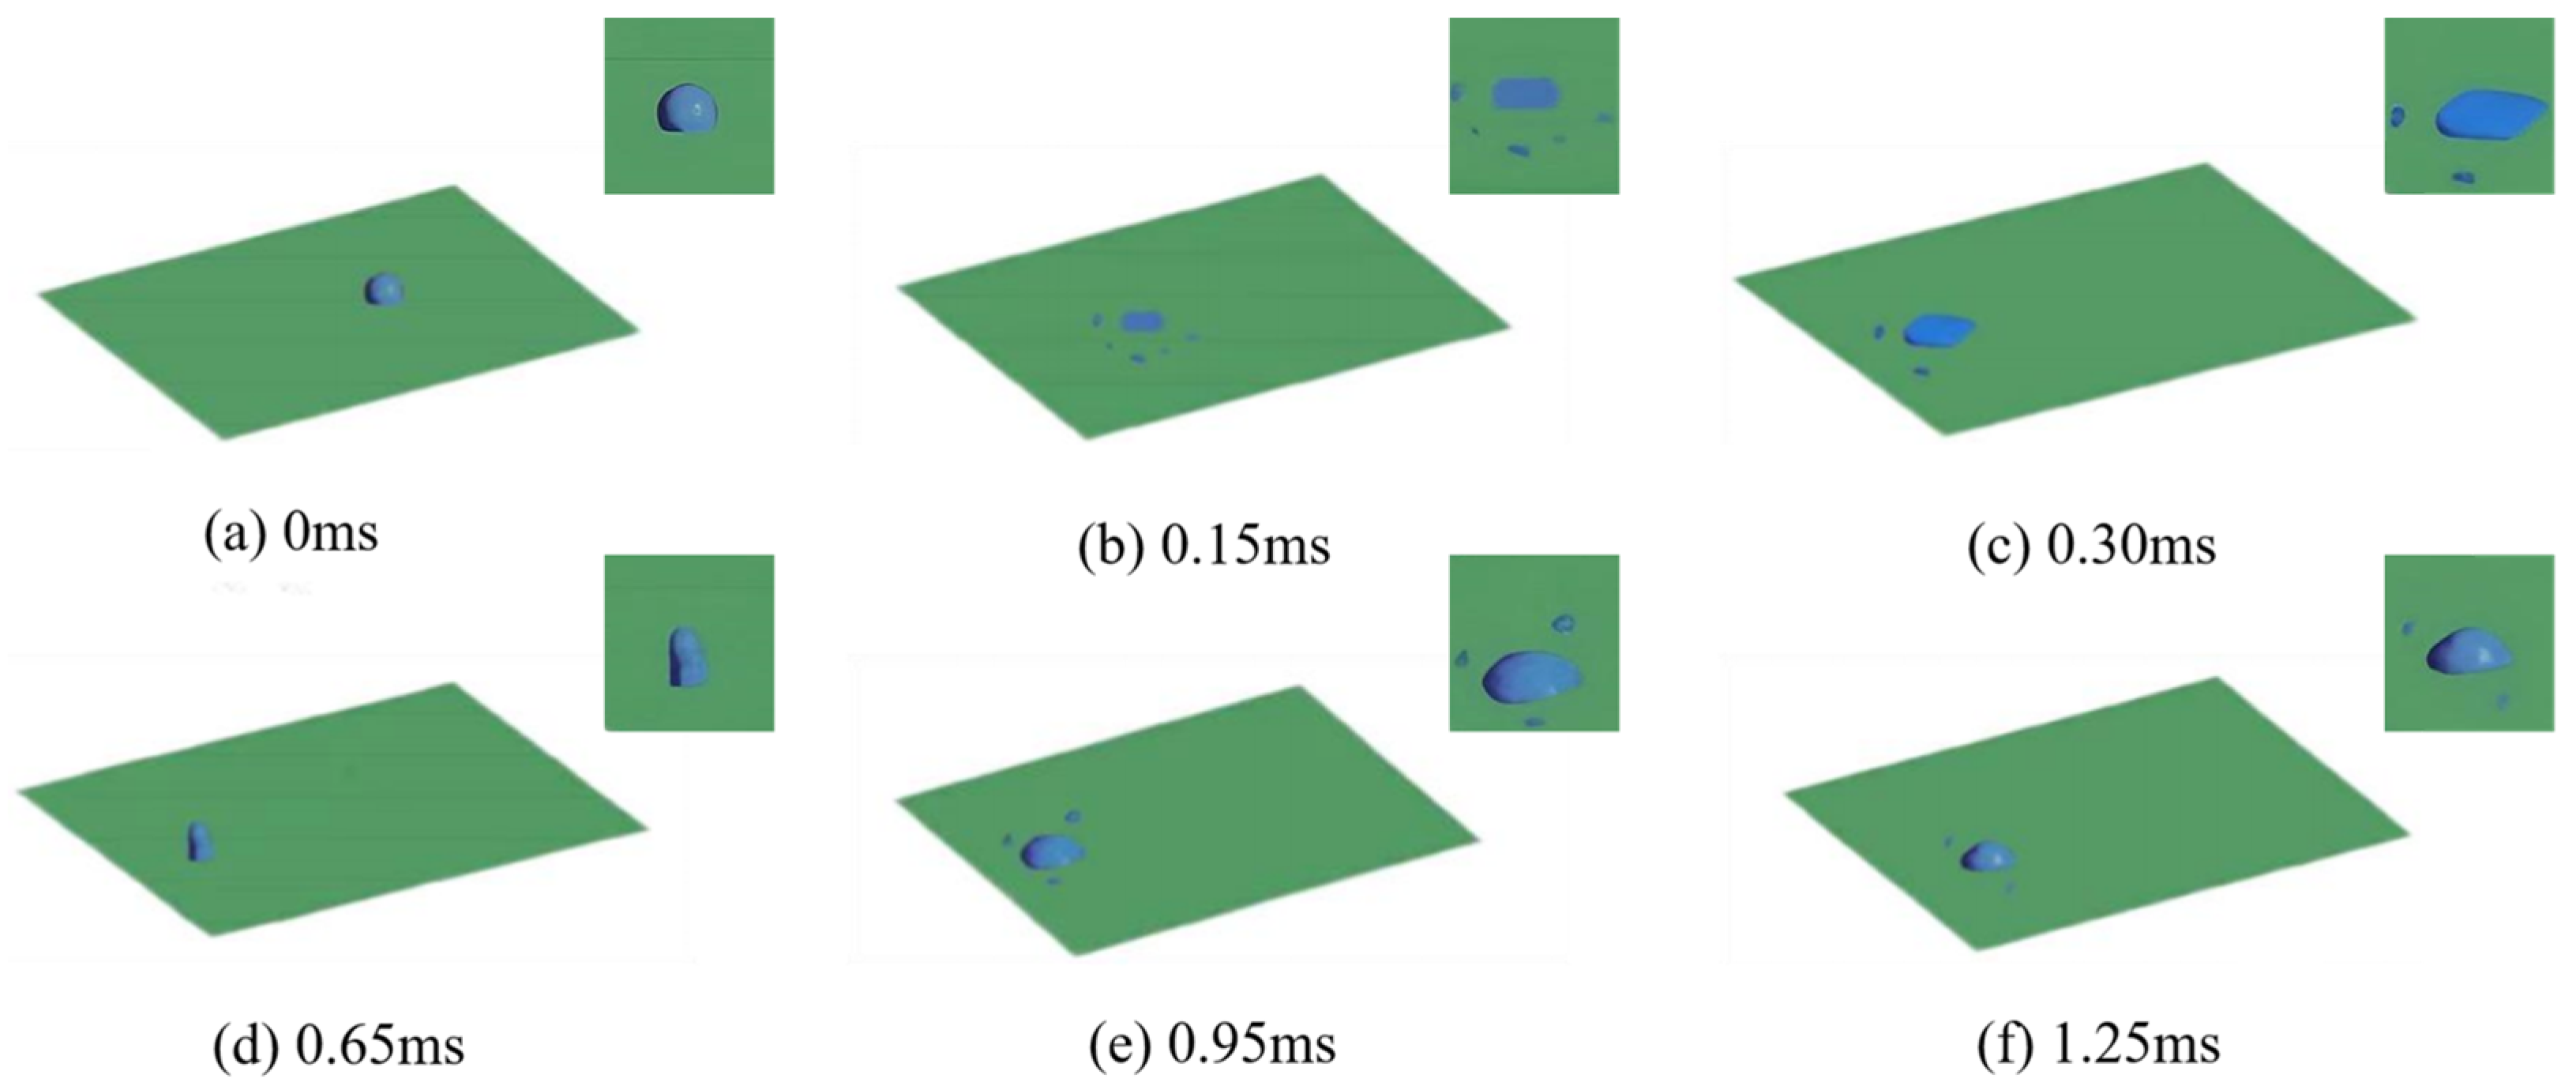
As shown in Figure 4, the 0~1.25 ms period depicts the spreading and sliding process of droplets impacting soybean leaf surfaces. The droplet’s spreading diameter peaks at 0.3 ms, followed by a retraction phase that concludes by 0.95 ms. The subsequent 0.65~1.25 ms stage initiates secondary spreading. Throughout this entire process, no rebound or splashing was observed from the droplets.
As shown in Figure 5, when the soybean leaf surface is struck by a droplet at a velocity of 3 m/s, rapid spreading occurs until the maximum extension length is reached, after which the contraction phase is initiated. During the initial contraction stage, the droplet is formed into a flattened disk shape with raised edges, and an extremely thin liquid film region is created at the neck. The jet neck is narrowed by surface tension; once surface tension becomes sufficiently high, the jet neck is rendered extremely thin and eventually broken, resulting in the formation of fragmented droplets. The central portion of the droplet then continues to contract until a stable droplet is formed. The resulting small droplets rebound and detach from the leaf surface under the action of vaporization recoil forces.
As shown in Figure 6, a localized pressure peak of approximately 450 Pa was observed at the droplet spreading peak moment (0.3 ms) in the impact center region, directly correlating with the conversion of droplet kinetic energy into compressive energy. Simultaneously, a distinct vortex structure formed at the liquid film edge (with a peak velocity vector of 1.375 m·s−1), providing a dynamic basis for explaining droplet splashing and secondary fragmentation under high-Weber-number (We > 100) conditions. Throughout the transient simulation, the total mass change rate within the computational domain remained below 0.8%. Tracking calculations of system kinetic energy, surface energy, and viscous dissipation energy revealed that approximately 72% of the initial kinetic energy was converted into droplet spreading surface energy, while about 18% dissipated through viscous effects. This energy distribution aligns with the droplet impact theory.
As shown in Figure 7, when a droplet strikes a soybean leaf surface at 4.5 m/s, secondary droplets first form at the edge within 0.65 milliseconds, accompanied by fragmentation and detachment. Irregular ripples develop along the droplet’s edge, while the outer liquid gradually separates from the parent droplet’s neck. This process generates numerous fine secondary droplets that form chain-like clusters.
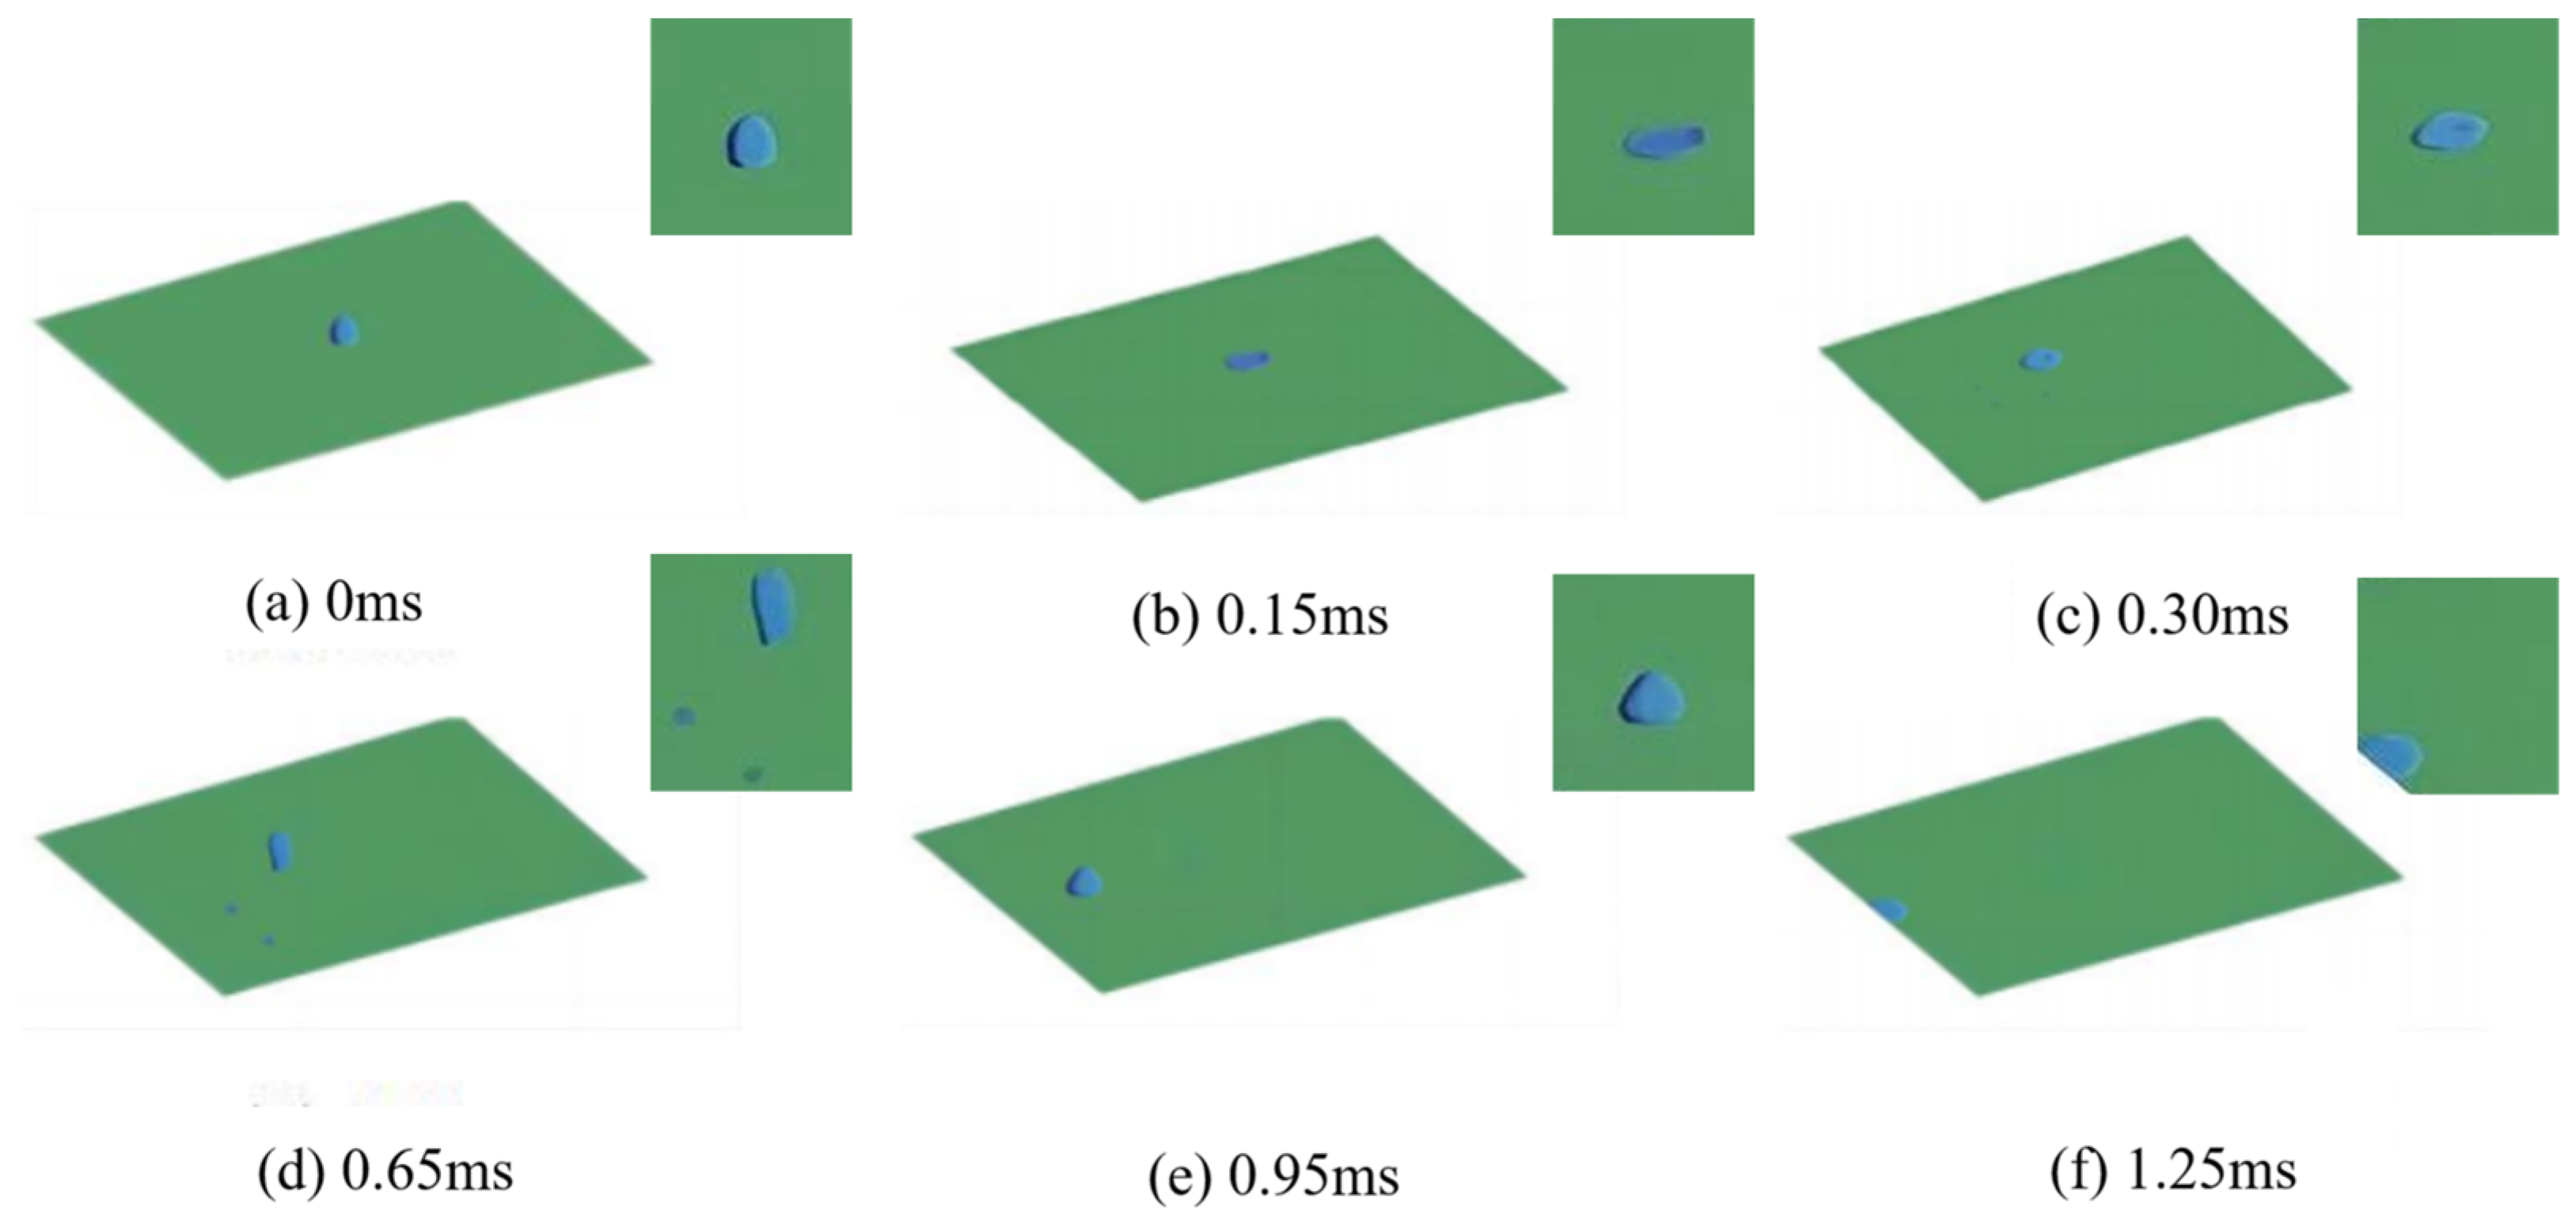
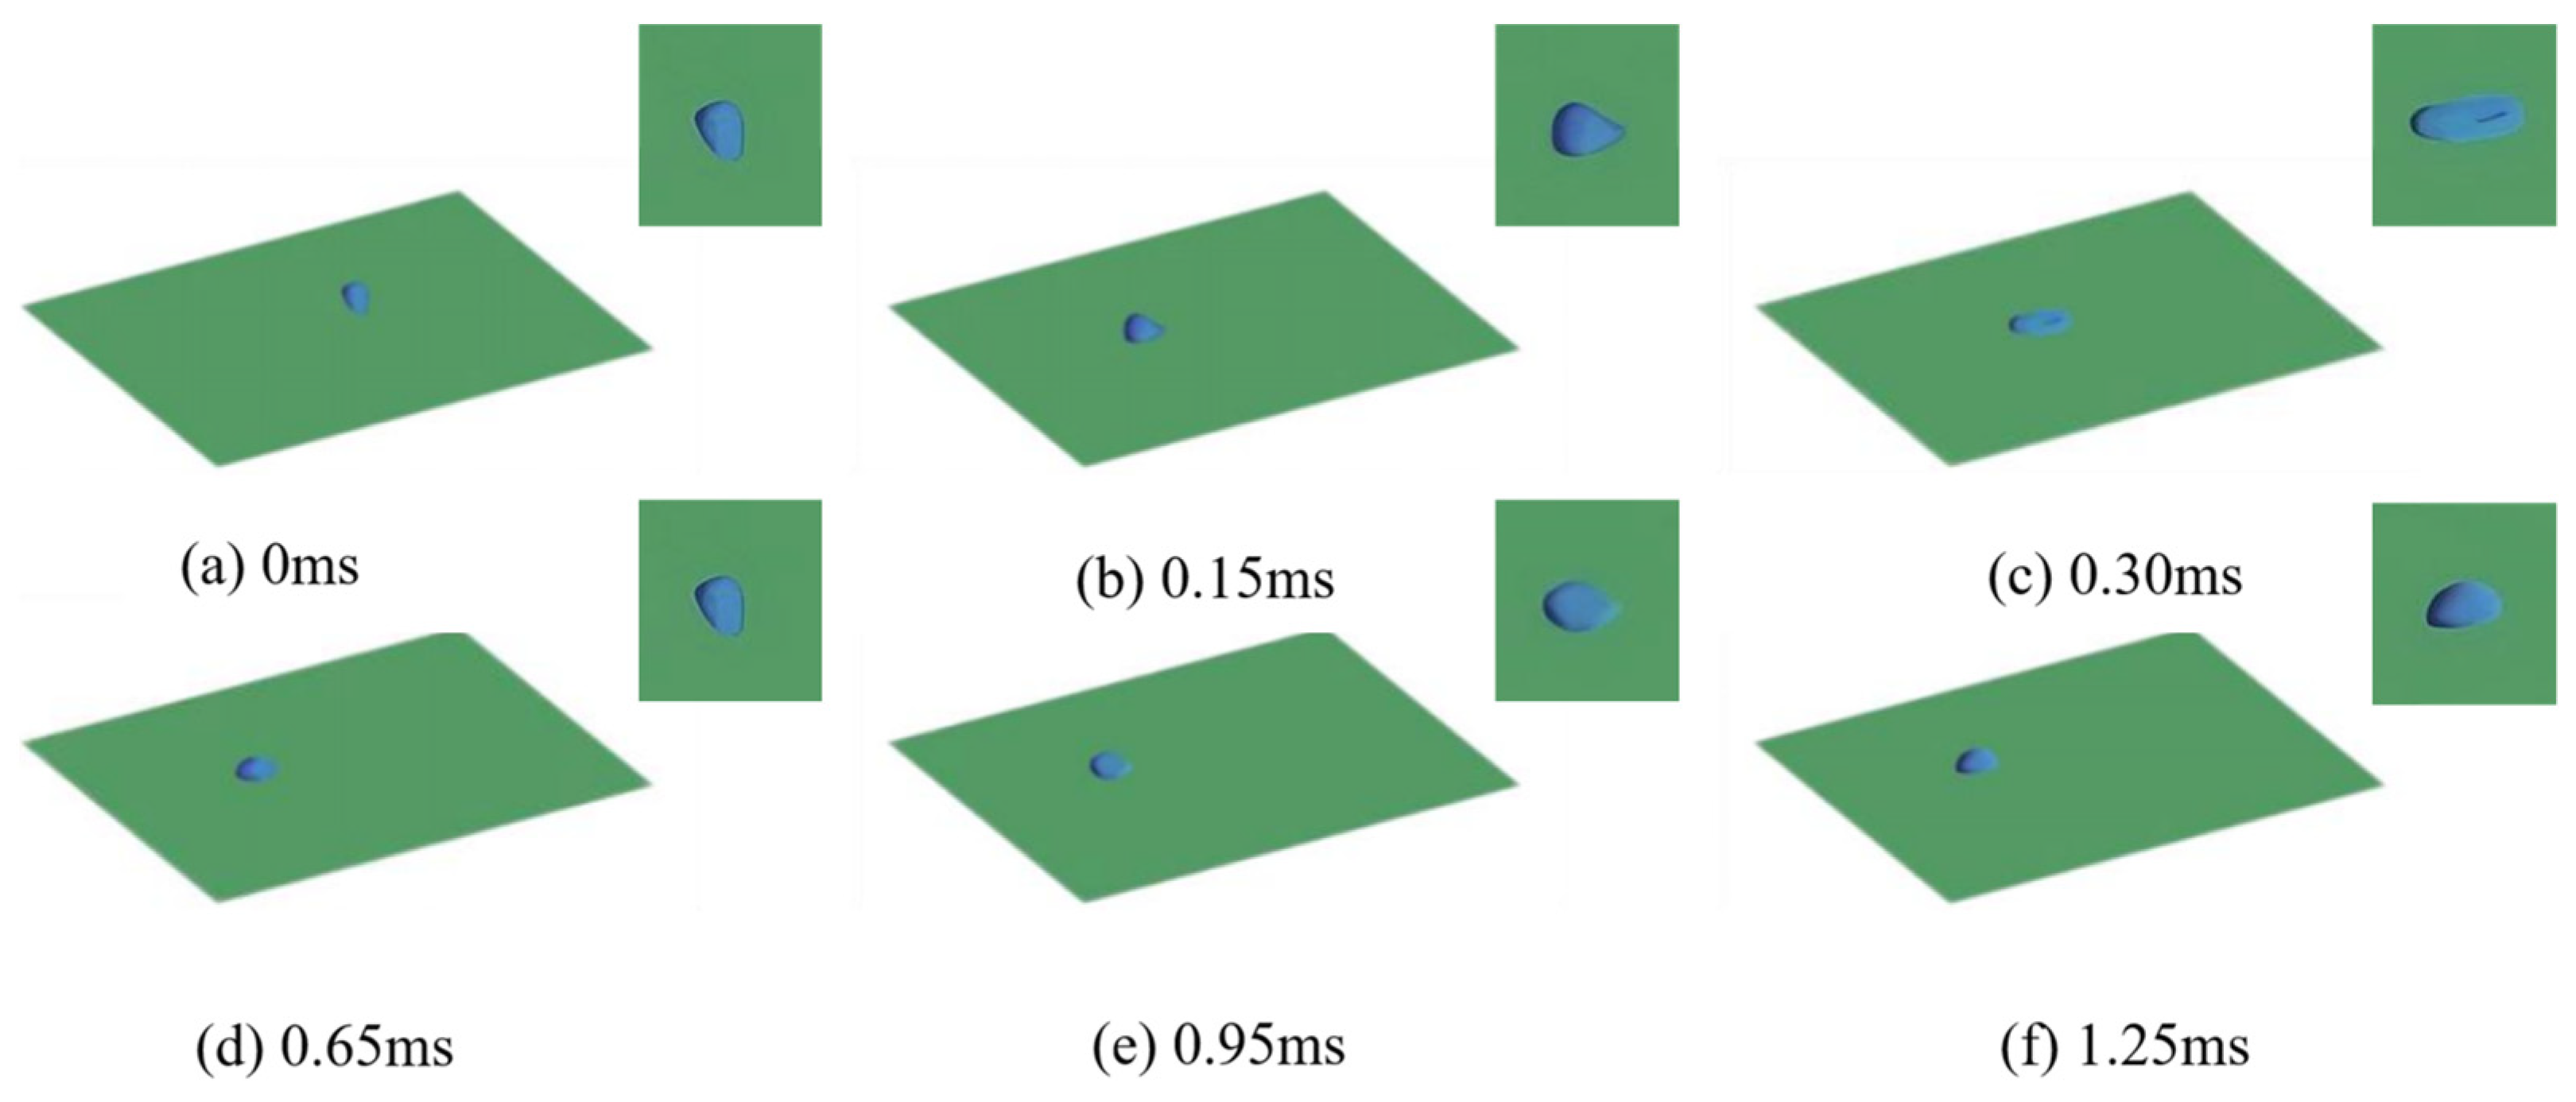
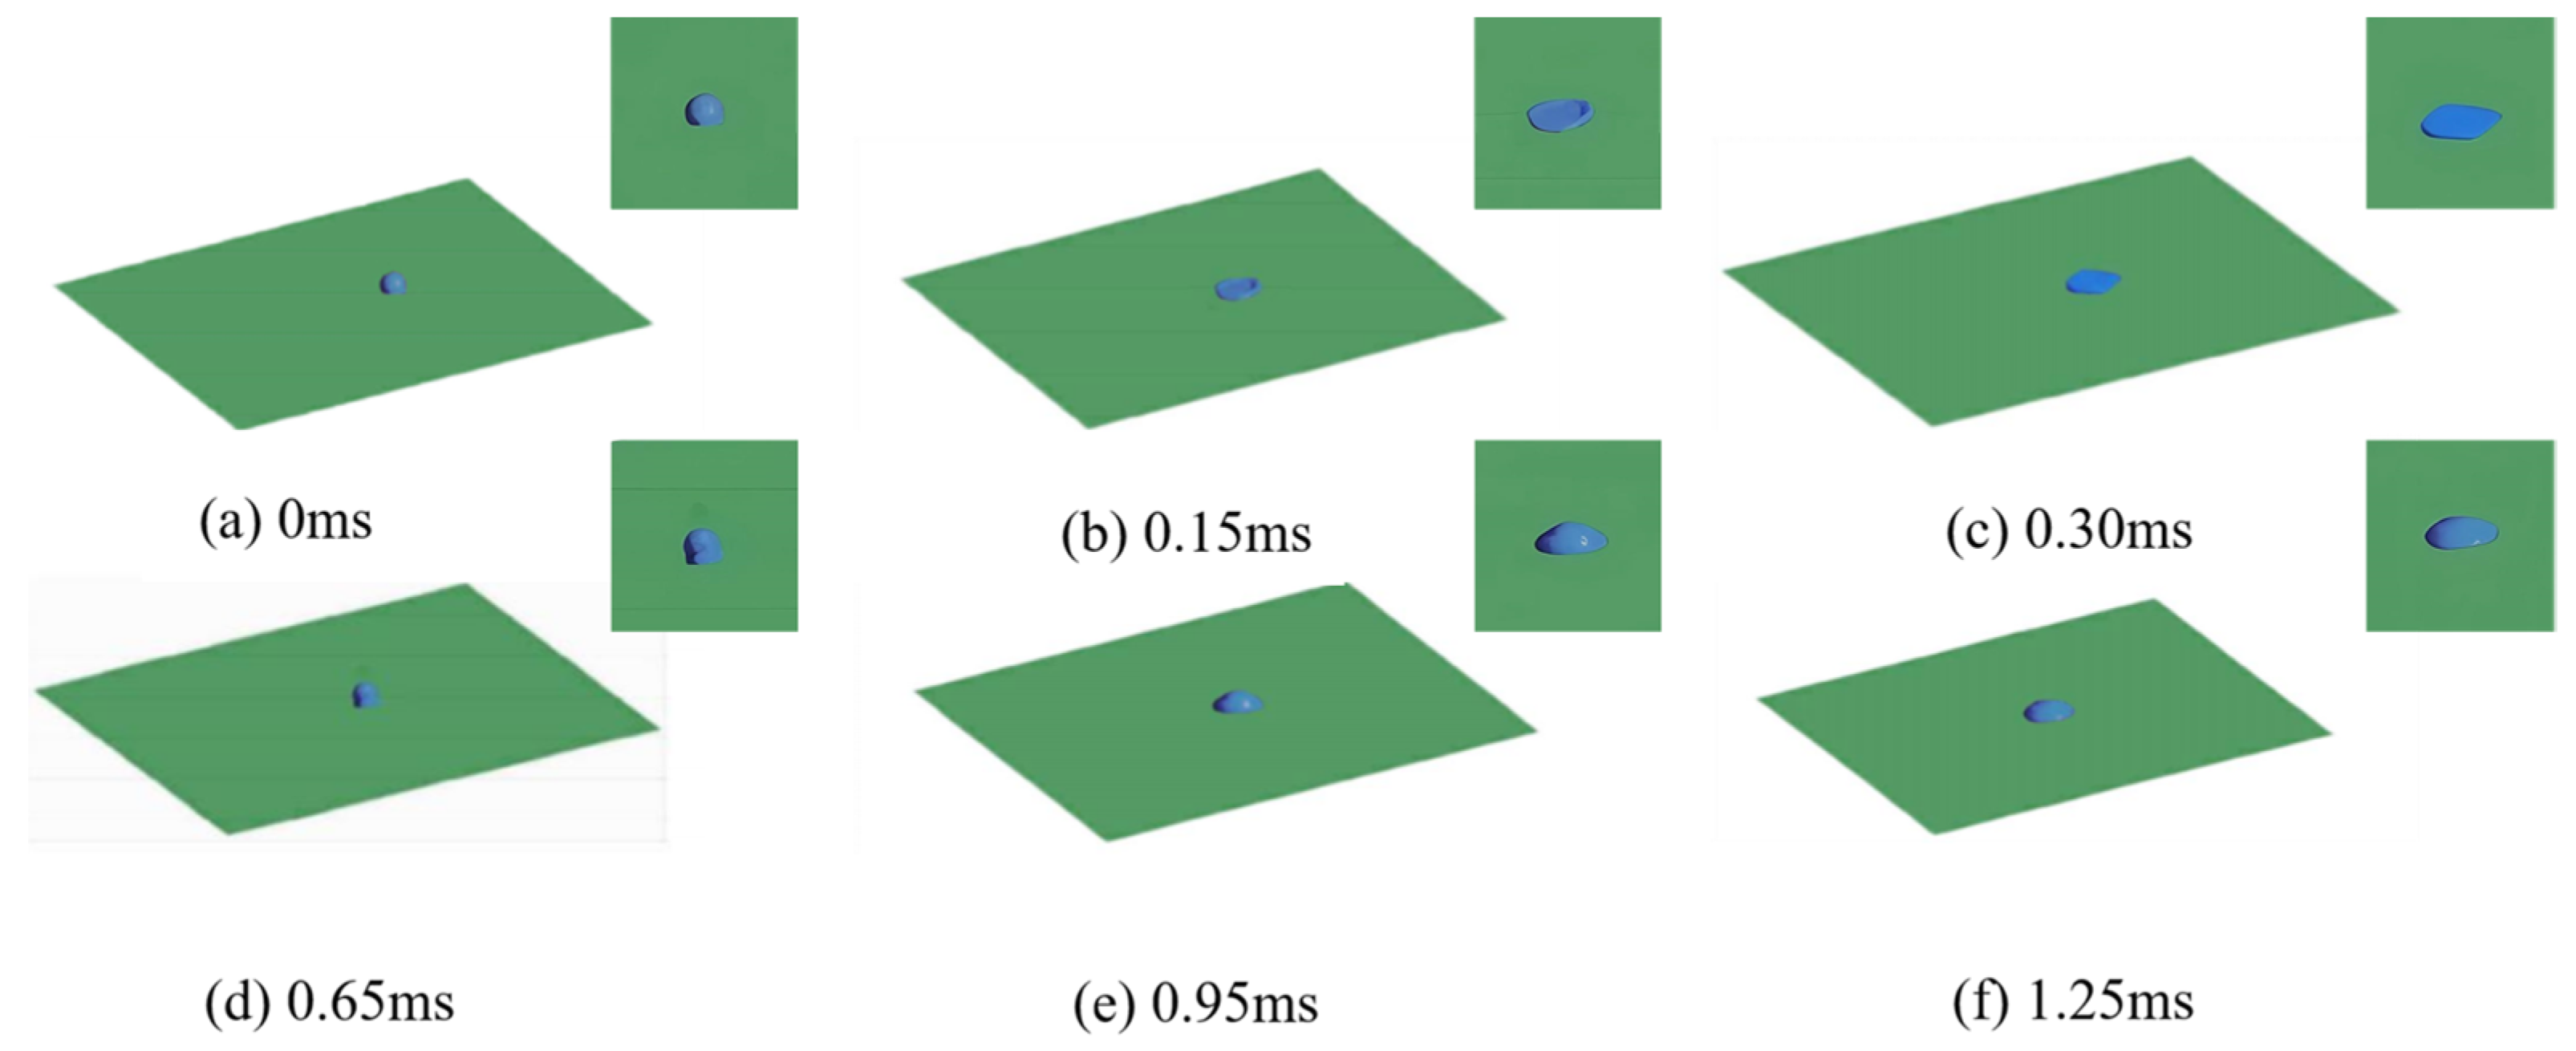
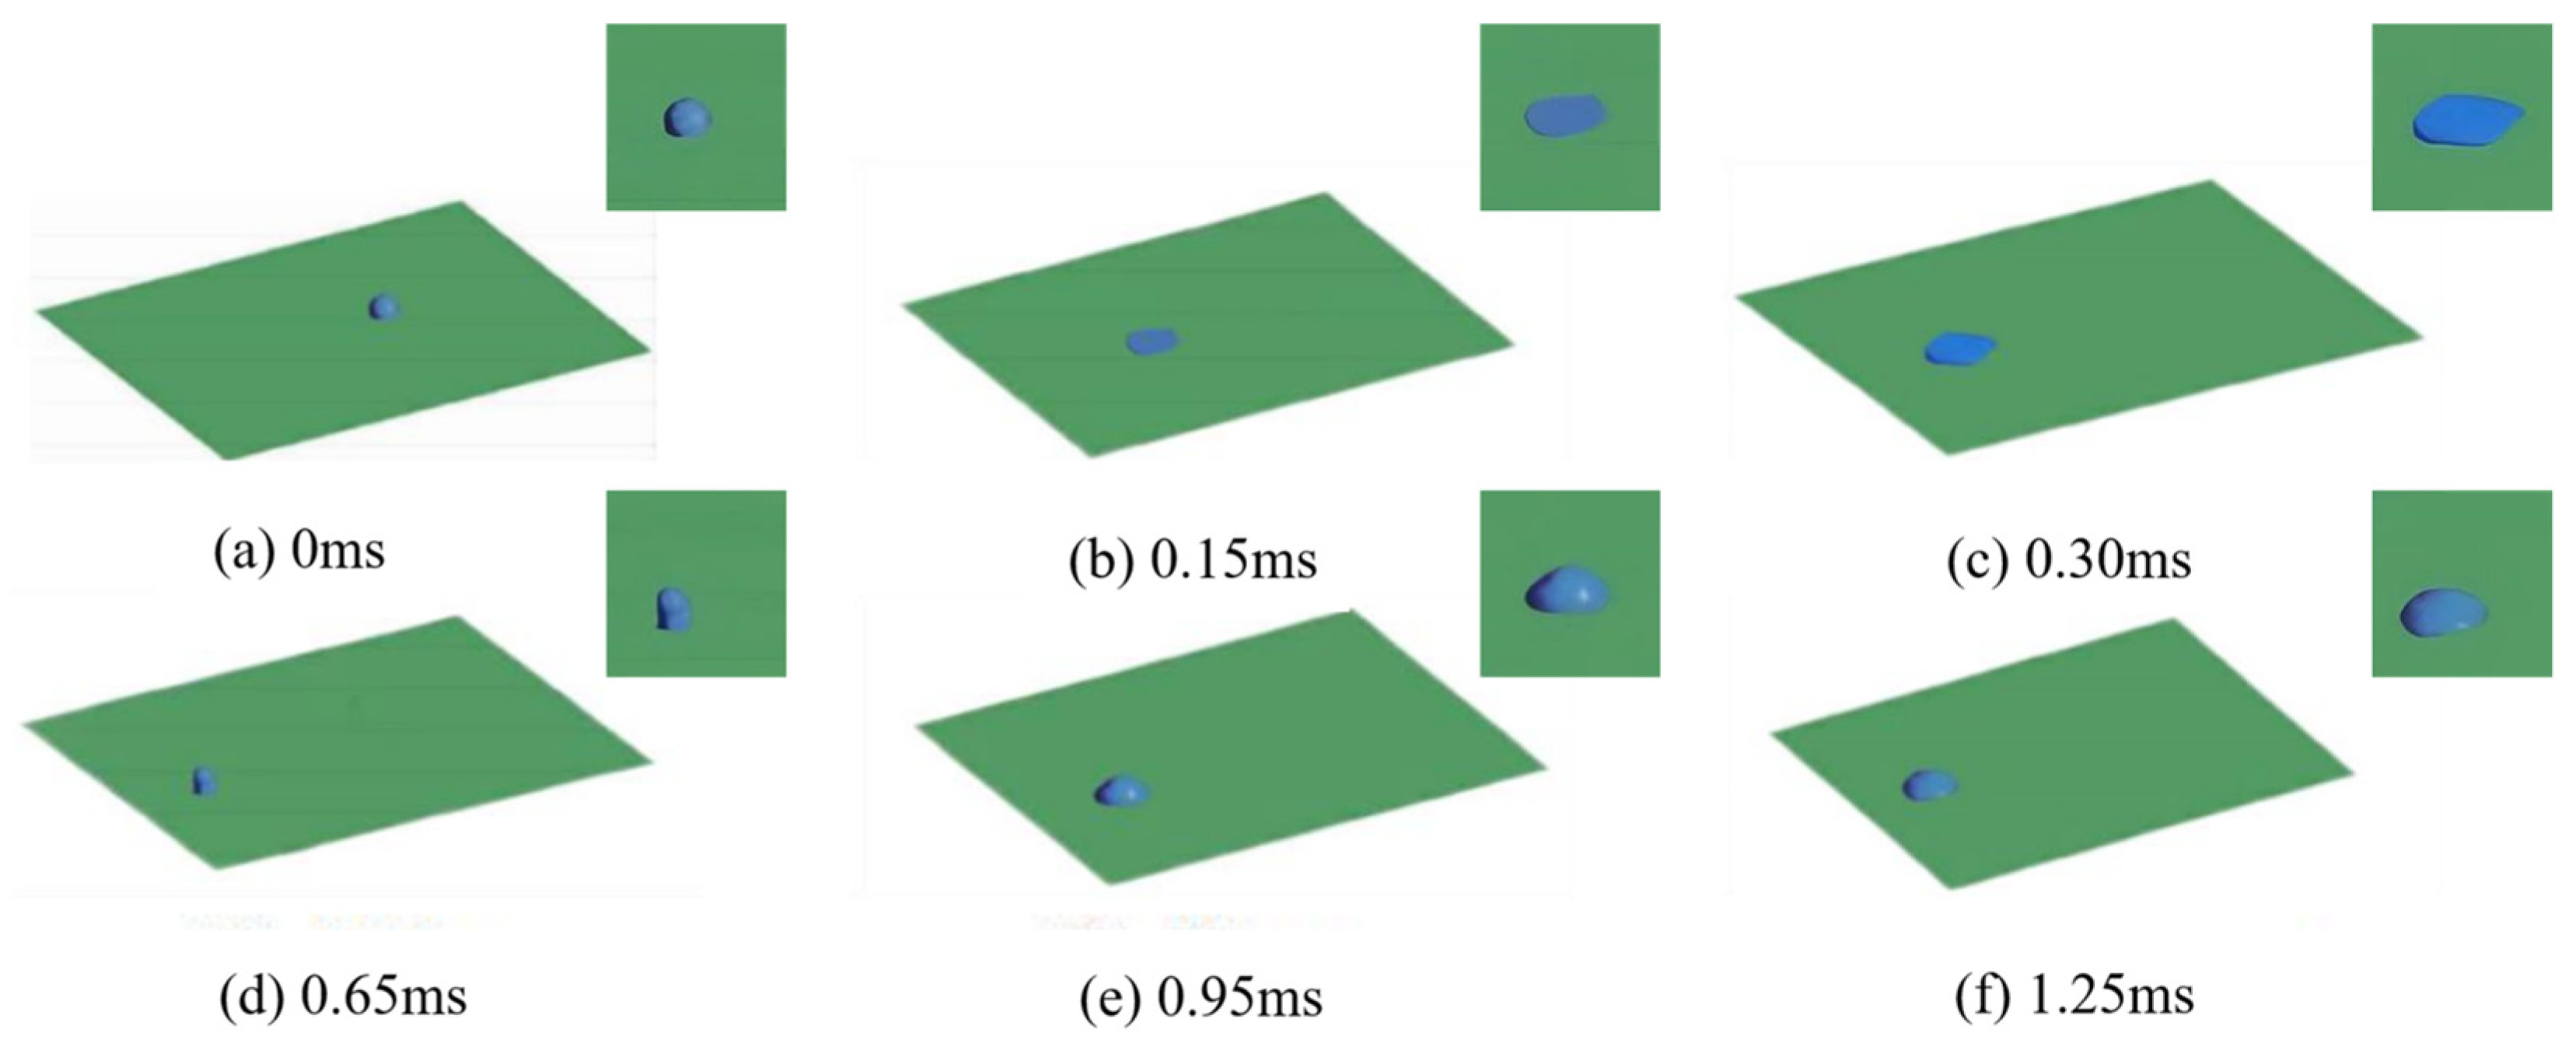
As shown in Figure 8, Figure 9 and Figure 10, comparative analysis of liquid phase distribution at various angles revealed that droplets undergo a series of morphological changes within 0~1.25 ms after impact: spreading, contracting, secondary spreading, and secondary contracting. At impact angles of 45° and 75°, droplets exhibited spreading similar to sliding along the impact direction, with 45° droplets demonstrating greater sliding distance. However, no sliding occurred at a 90° impact angle. This occurs because smaller impact angles cause the tangential velocity component relative to the normal velocity component to become more pronounced, resulting in a larger difference between the two. Under 90° impact conditions, droplets directly contact the interface and subsequently spread and contract in all directions without sliding. Since sliding could potentially cause droplet detachment from the leaf surface, maintaining perpendicular spray orientation to the blade is recommended.
As shown in Figure 11 and Figure 12, the sliding distance of droplets on soybean leaf surfaces increases with their mass. When the droplet size reaches 500 μm, micro-droplet fragmentation occurs at impact interfaces. This phenomenon primarily occurs because kinetic energy from the normal direction converts to tangential components upon contact with dry solid surfaces, leading to diffusion. During this diffusion process, some kinetic energy is dissipated through surface viscosity, while another portion transforms into surface energy. Since fragmentation merely divides droplets into smaller fragments that maintain identical spreading and adhesion characteristics as intact droplets, these processes can be broadly considered equivalent to adhesion under a generalized perspective.

3.2. Droplet Deposition Characteristics Determined by High-Speed Camera Technology Analysis

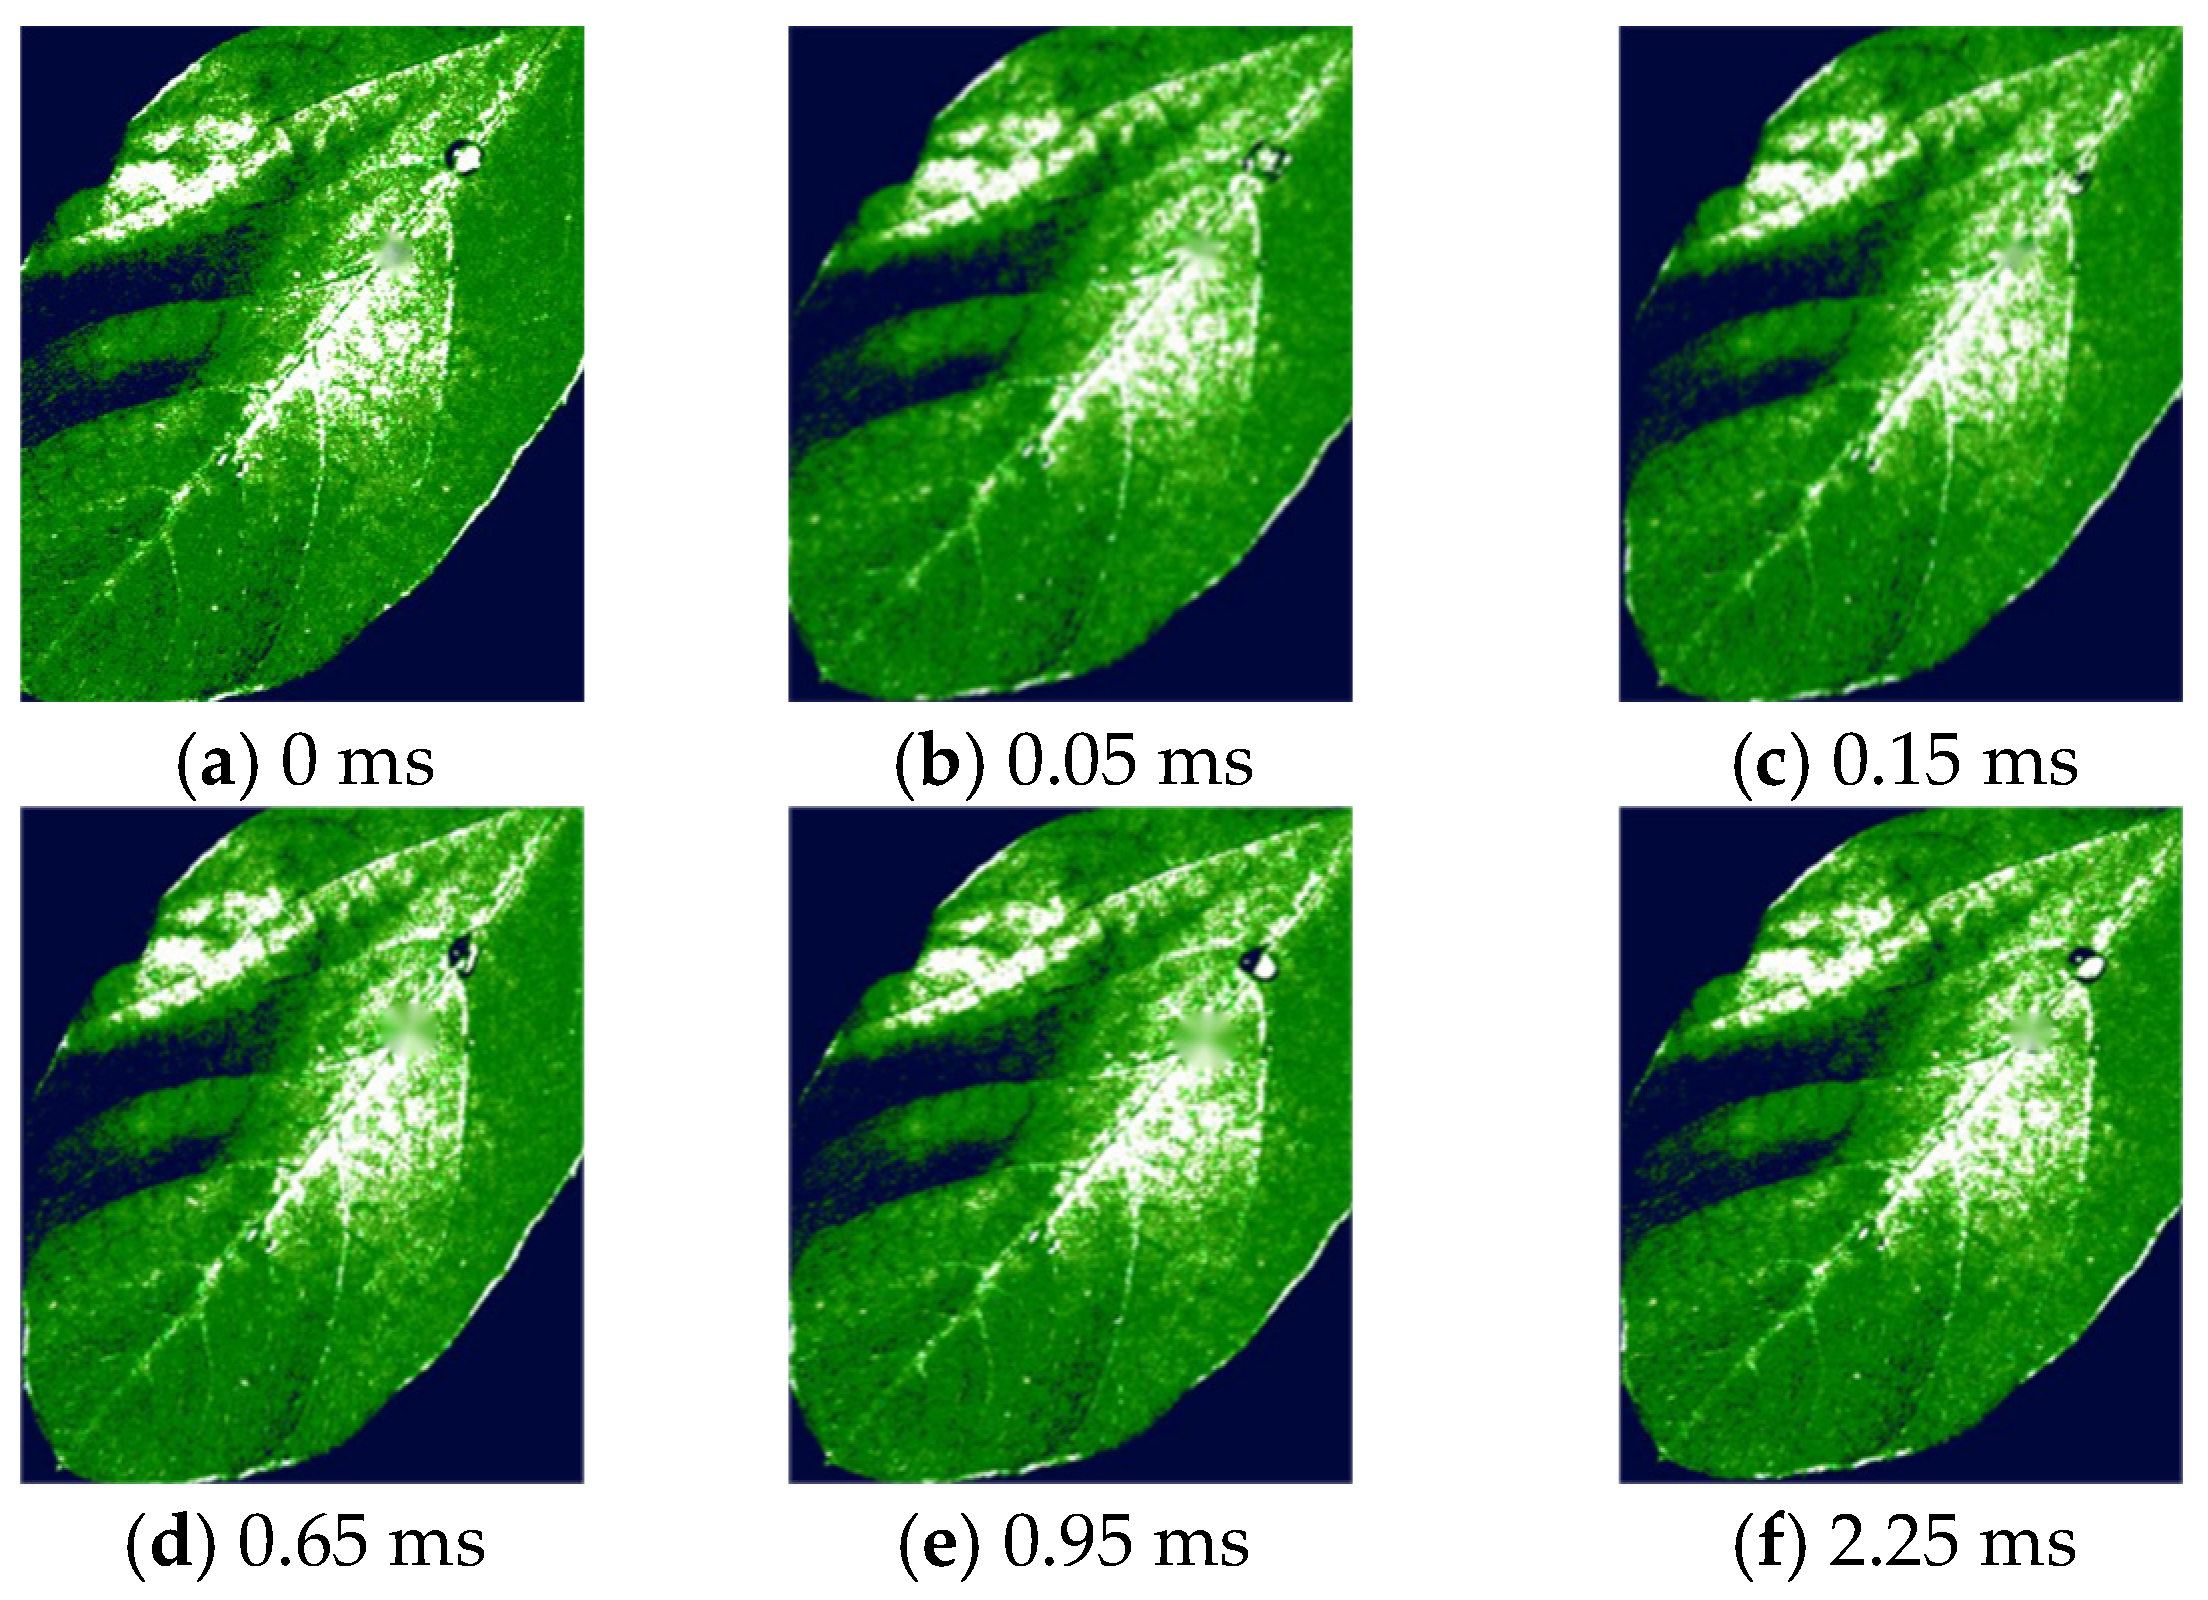
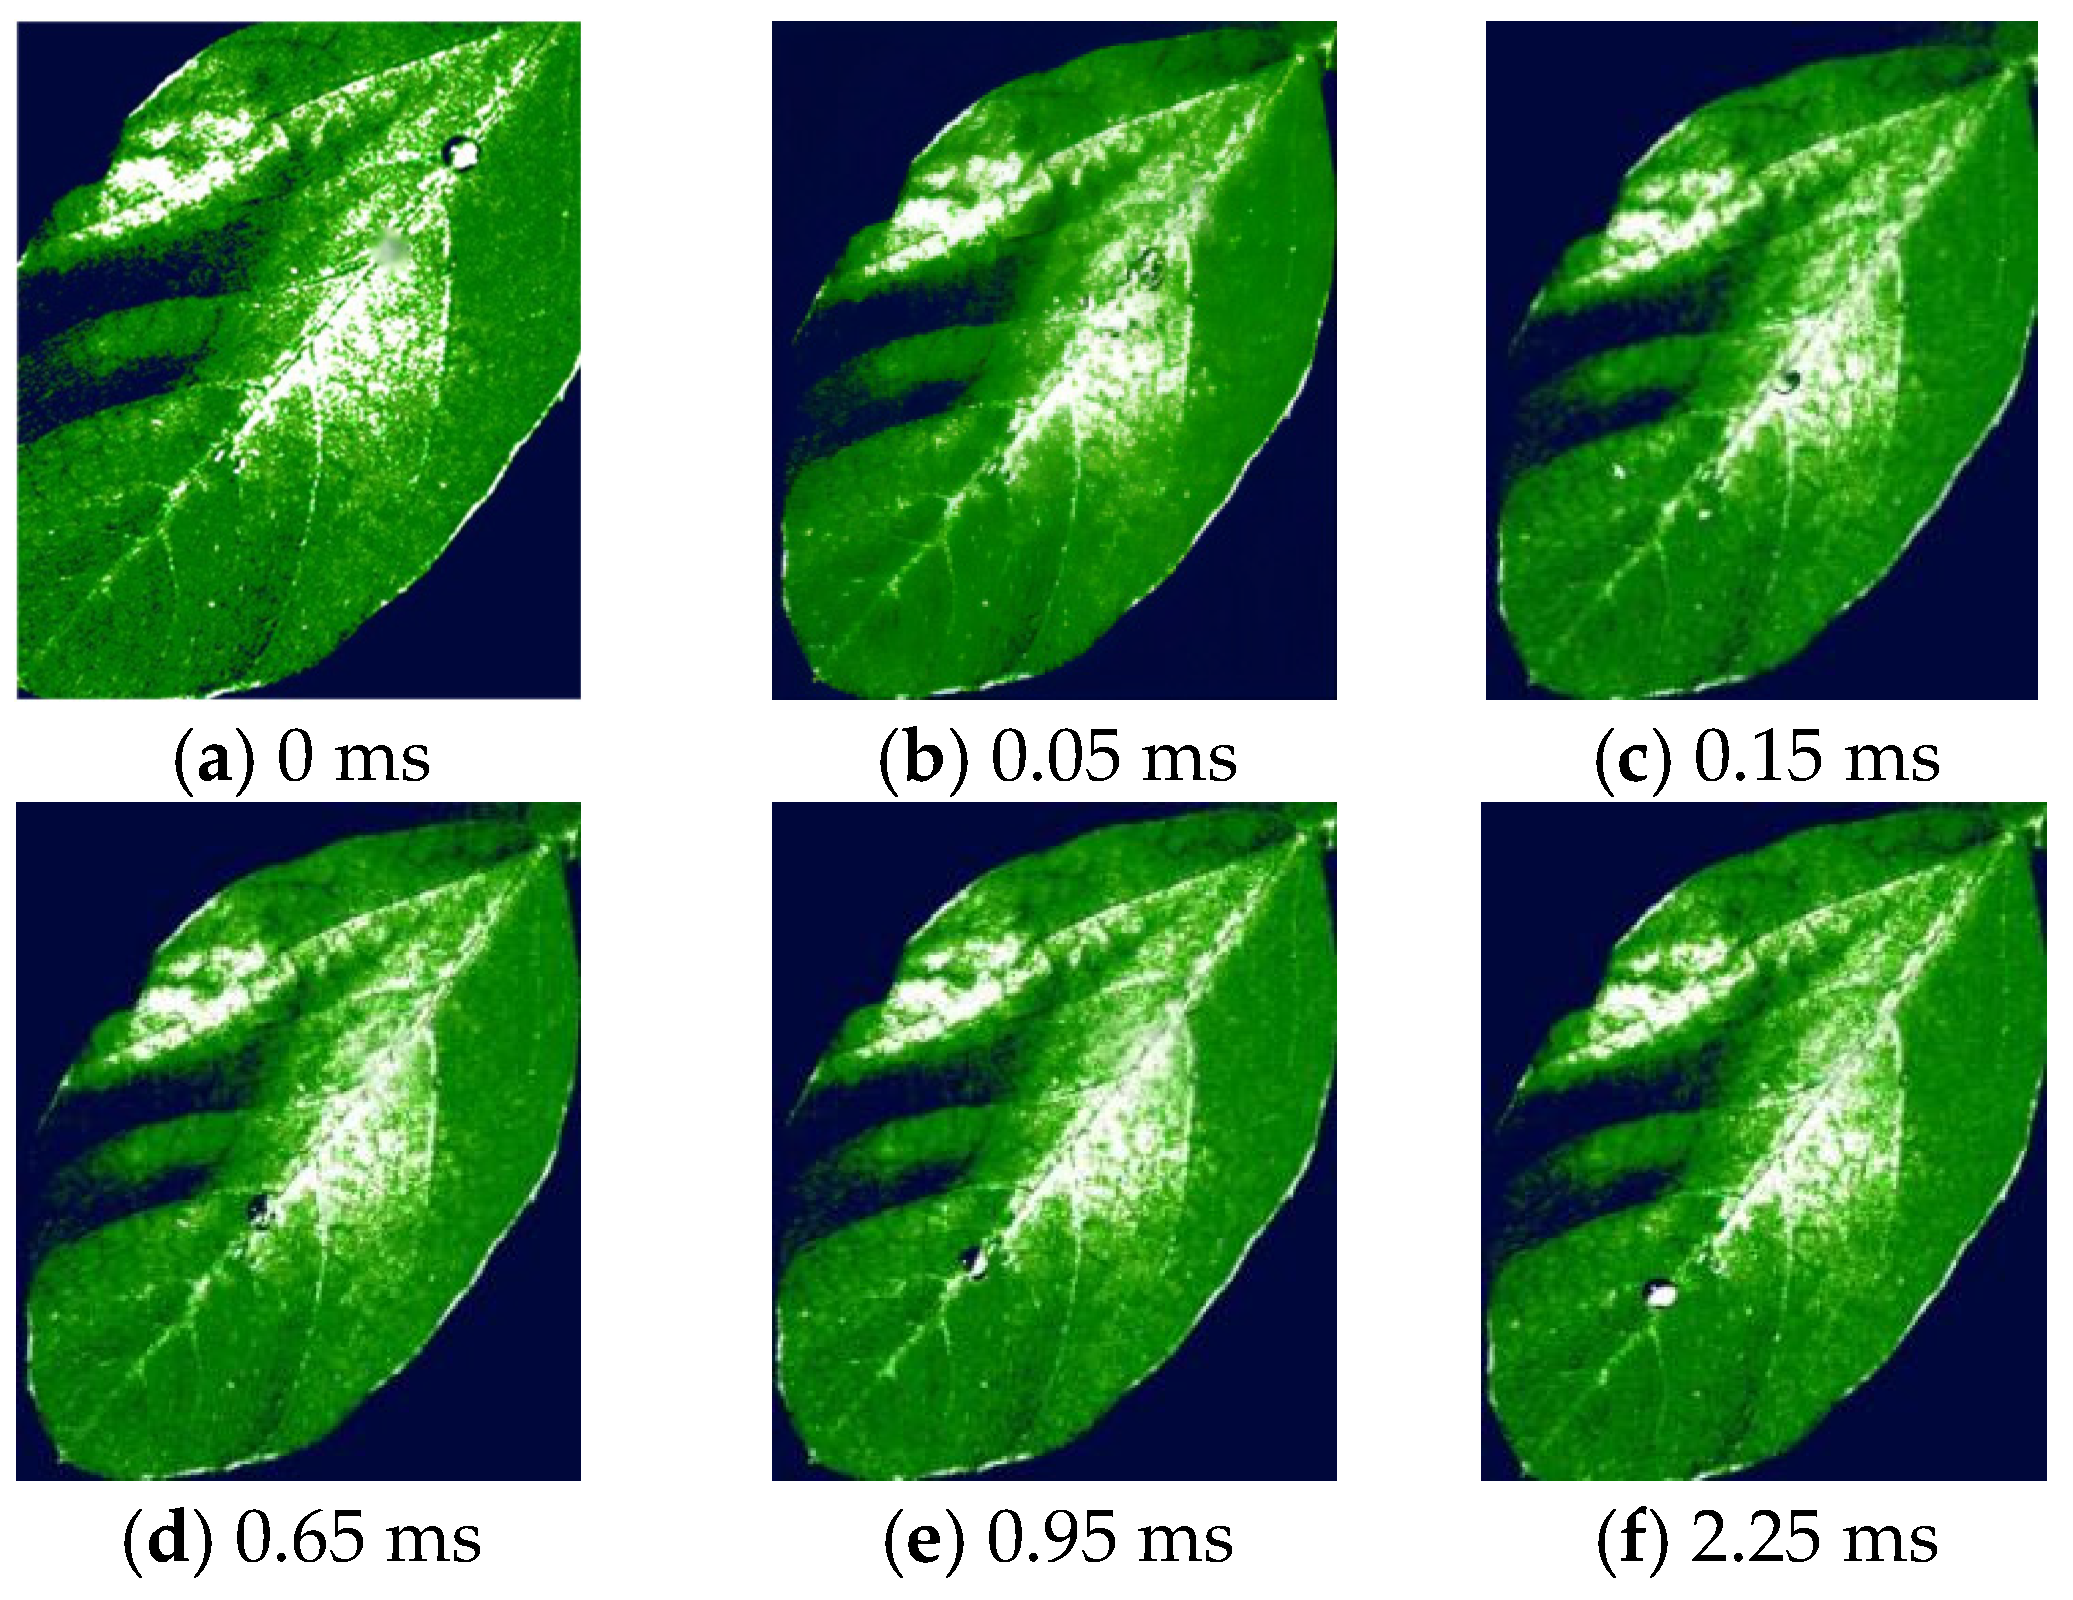
As shown in Figure 13, the cyhalothrin solution strikes the leaf surface at a velocity of 1.5 m/s. Over the subsequent 2.25 ms, it spreads and slides across the leaf surface. During the initial 0–1.45 ms phase, the droplet undergoes spreading and contraction while simultaneously sliding toward the leaf’s edge. By 2.25 ms, the droplet has ceased movement. Notably, the entire sliding process remained stable without any droplet fragmentation or detachment from the leaf surface. The high-speed camera system (PCO.dimax cs3) underwent rigorous calibration prior to the experiment. The camera was configured with a frame rate of 10,000 fps and a spatial resolution of 25.4 μm/pixel. Accounting for lens distortion, pixel jitter, and image processing errors, the calculated composite standard uncertainty for droplet diffusion diameter is approximately ±2.1%, while the measurement uncertainty for sliding displacement is about ±3.5%. This level of precision is sufficient to capture and quantify the millisecond-scale transient impact phenomena studied in this paper.
As shown in Figure 14, when the cyfluthrin solution hits the leaf surface at a velocity of 3.0 m/s, the droplets continuously spread and slide within the subsequent 1 ms to 4 ms. With the increase in impact velocity, the sliding distance of the droplets also increases. At 2.03 ms, the droplets exhibit a tendency to splash outward in all directions. After a certain period, they break into several smaller parts and disperse outward while sliding. By 3.20 ms, some of these smaller droplets detach from the leaf surface.
As shown in Figure 15, when the cyhalothrin solution strikes the leaf at a velocity of 4.5 m/s, the droplets continuously spread and slide during the subsequent 1–3 ms period. The sliding distance increases with higher impact speeds, accompanied by noticeable fragmentation. At 1.78 ms, the droplets begin to splash. By 2.34 ms, they split into multiple smaller fragments, many of which disperse toward both ends. As time progresses, the larger droplets with higher energy levels detach from the leaf first, followed by other smaller droplets in sequence.
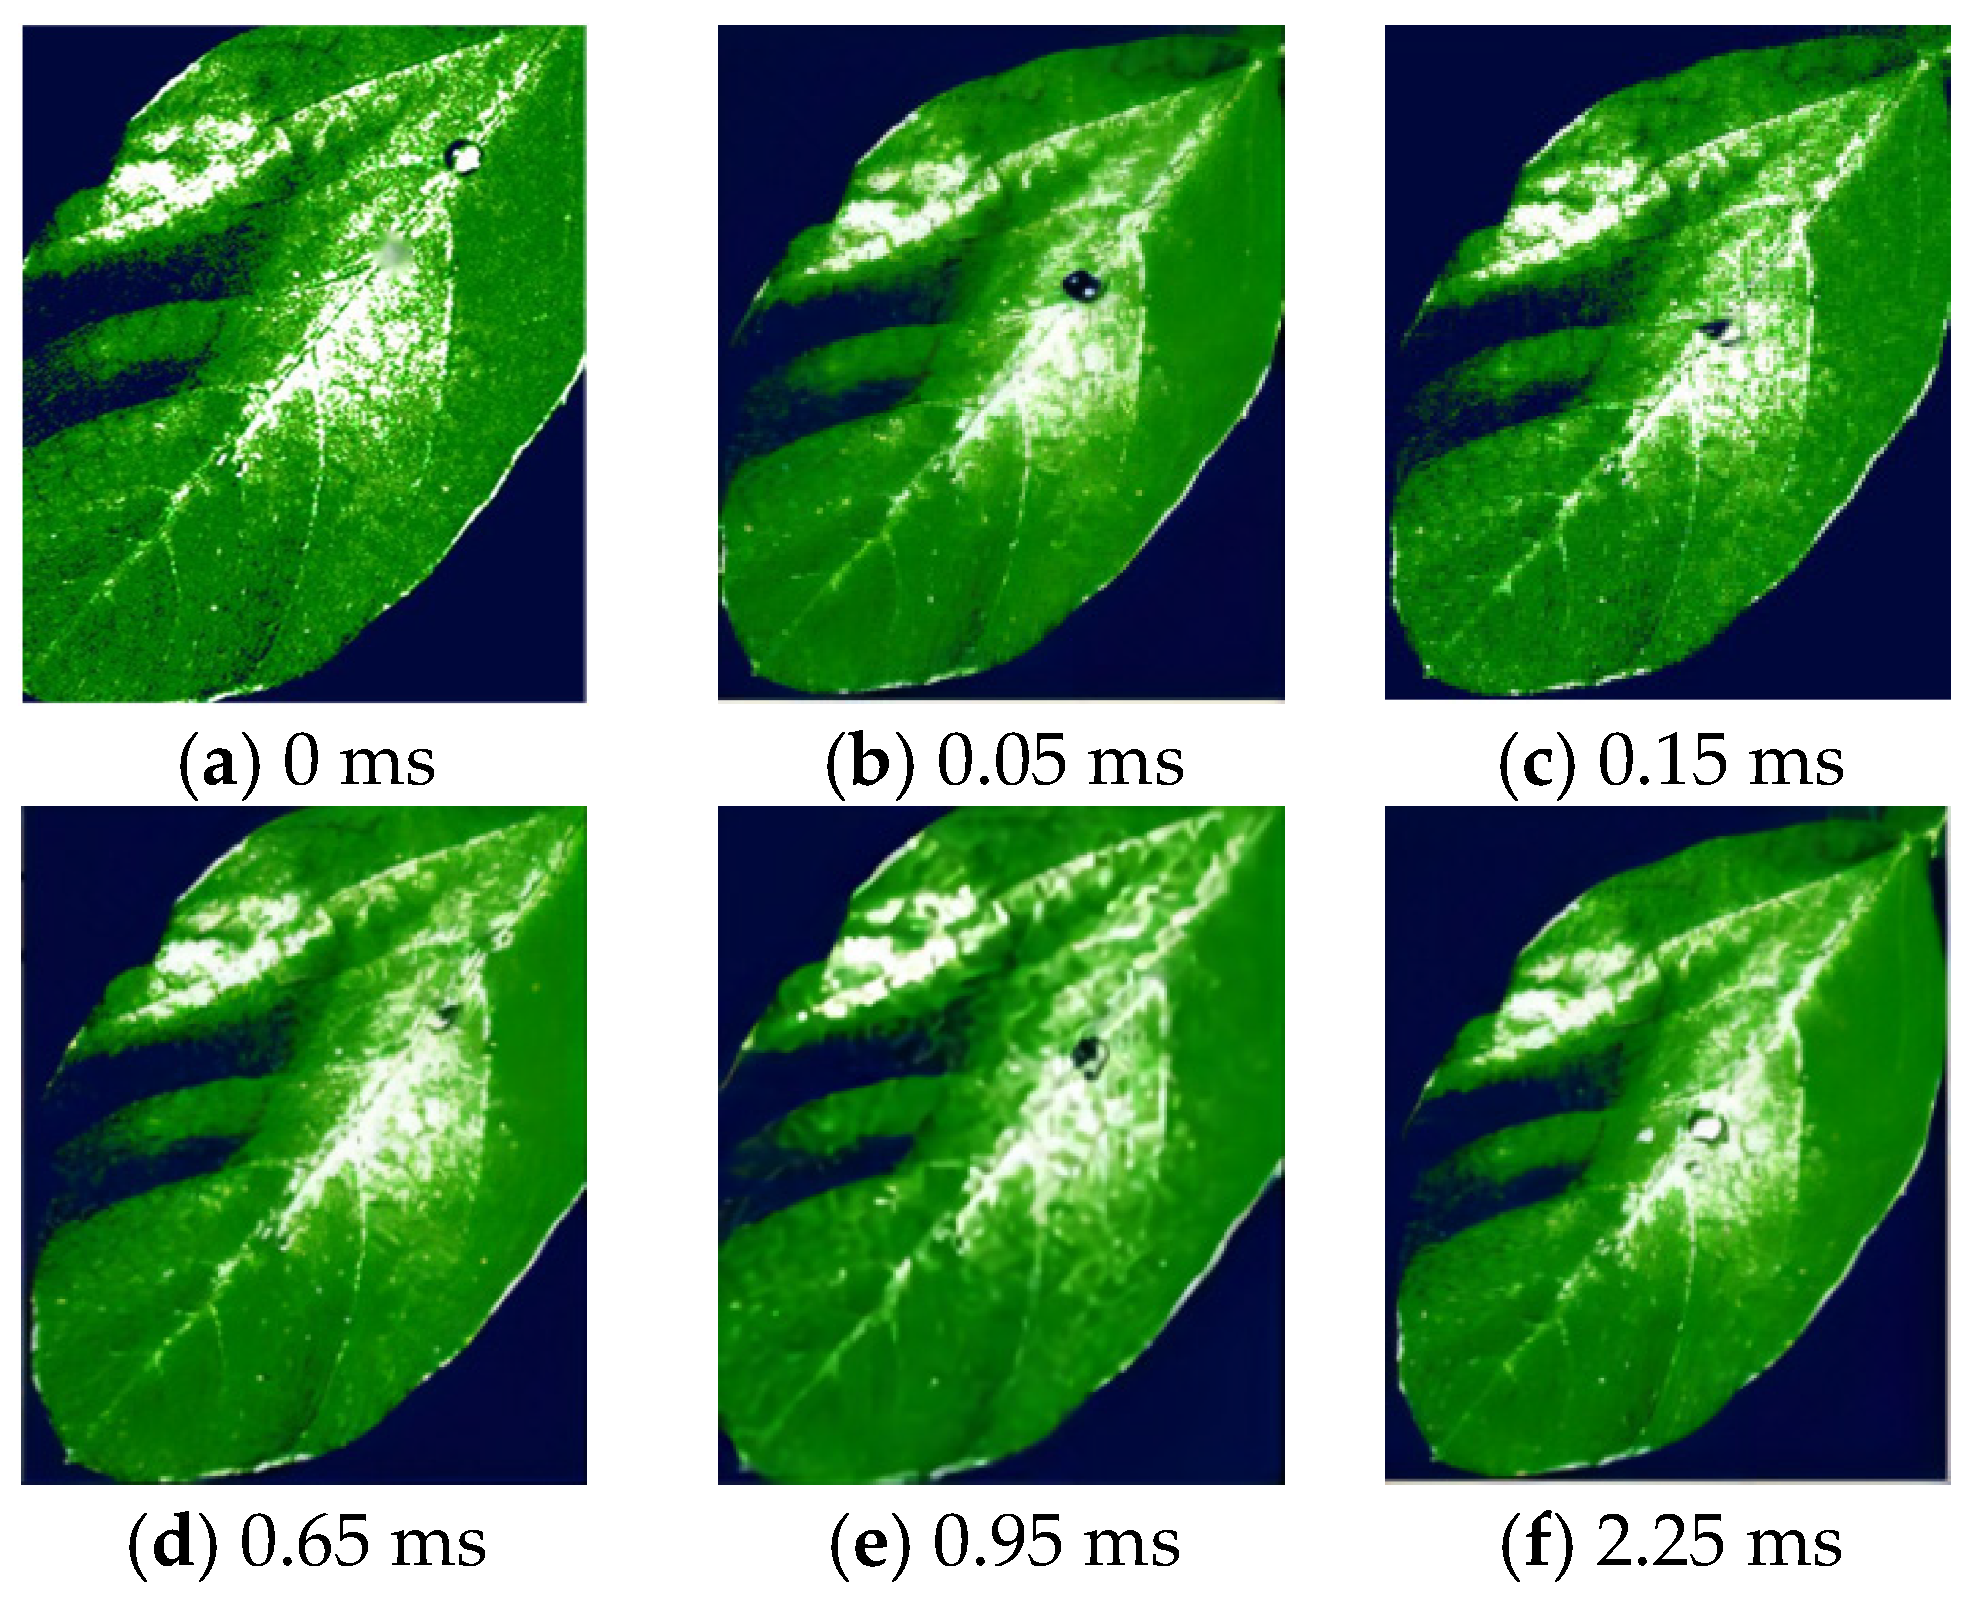
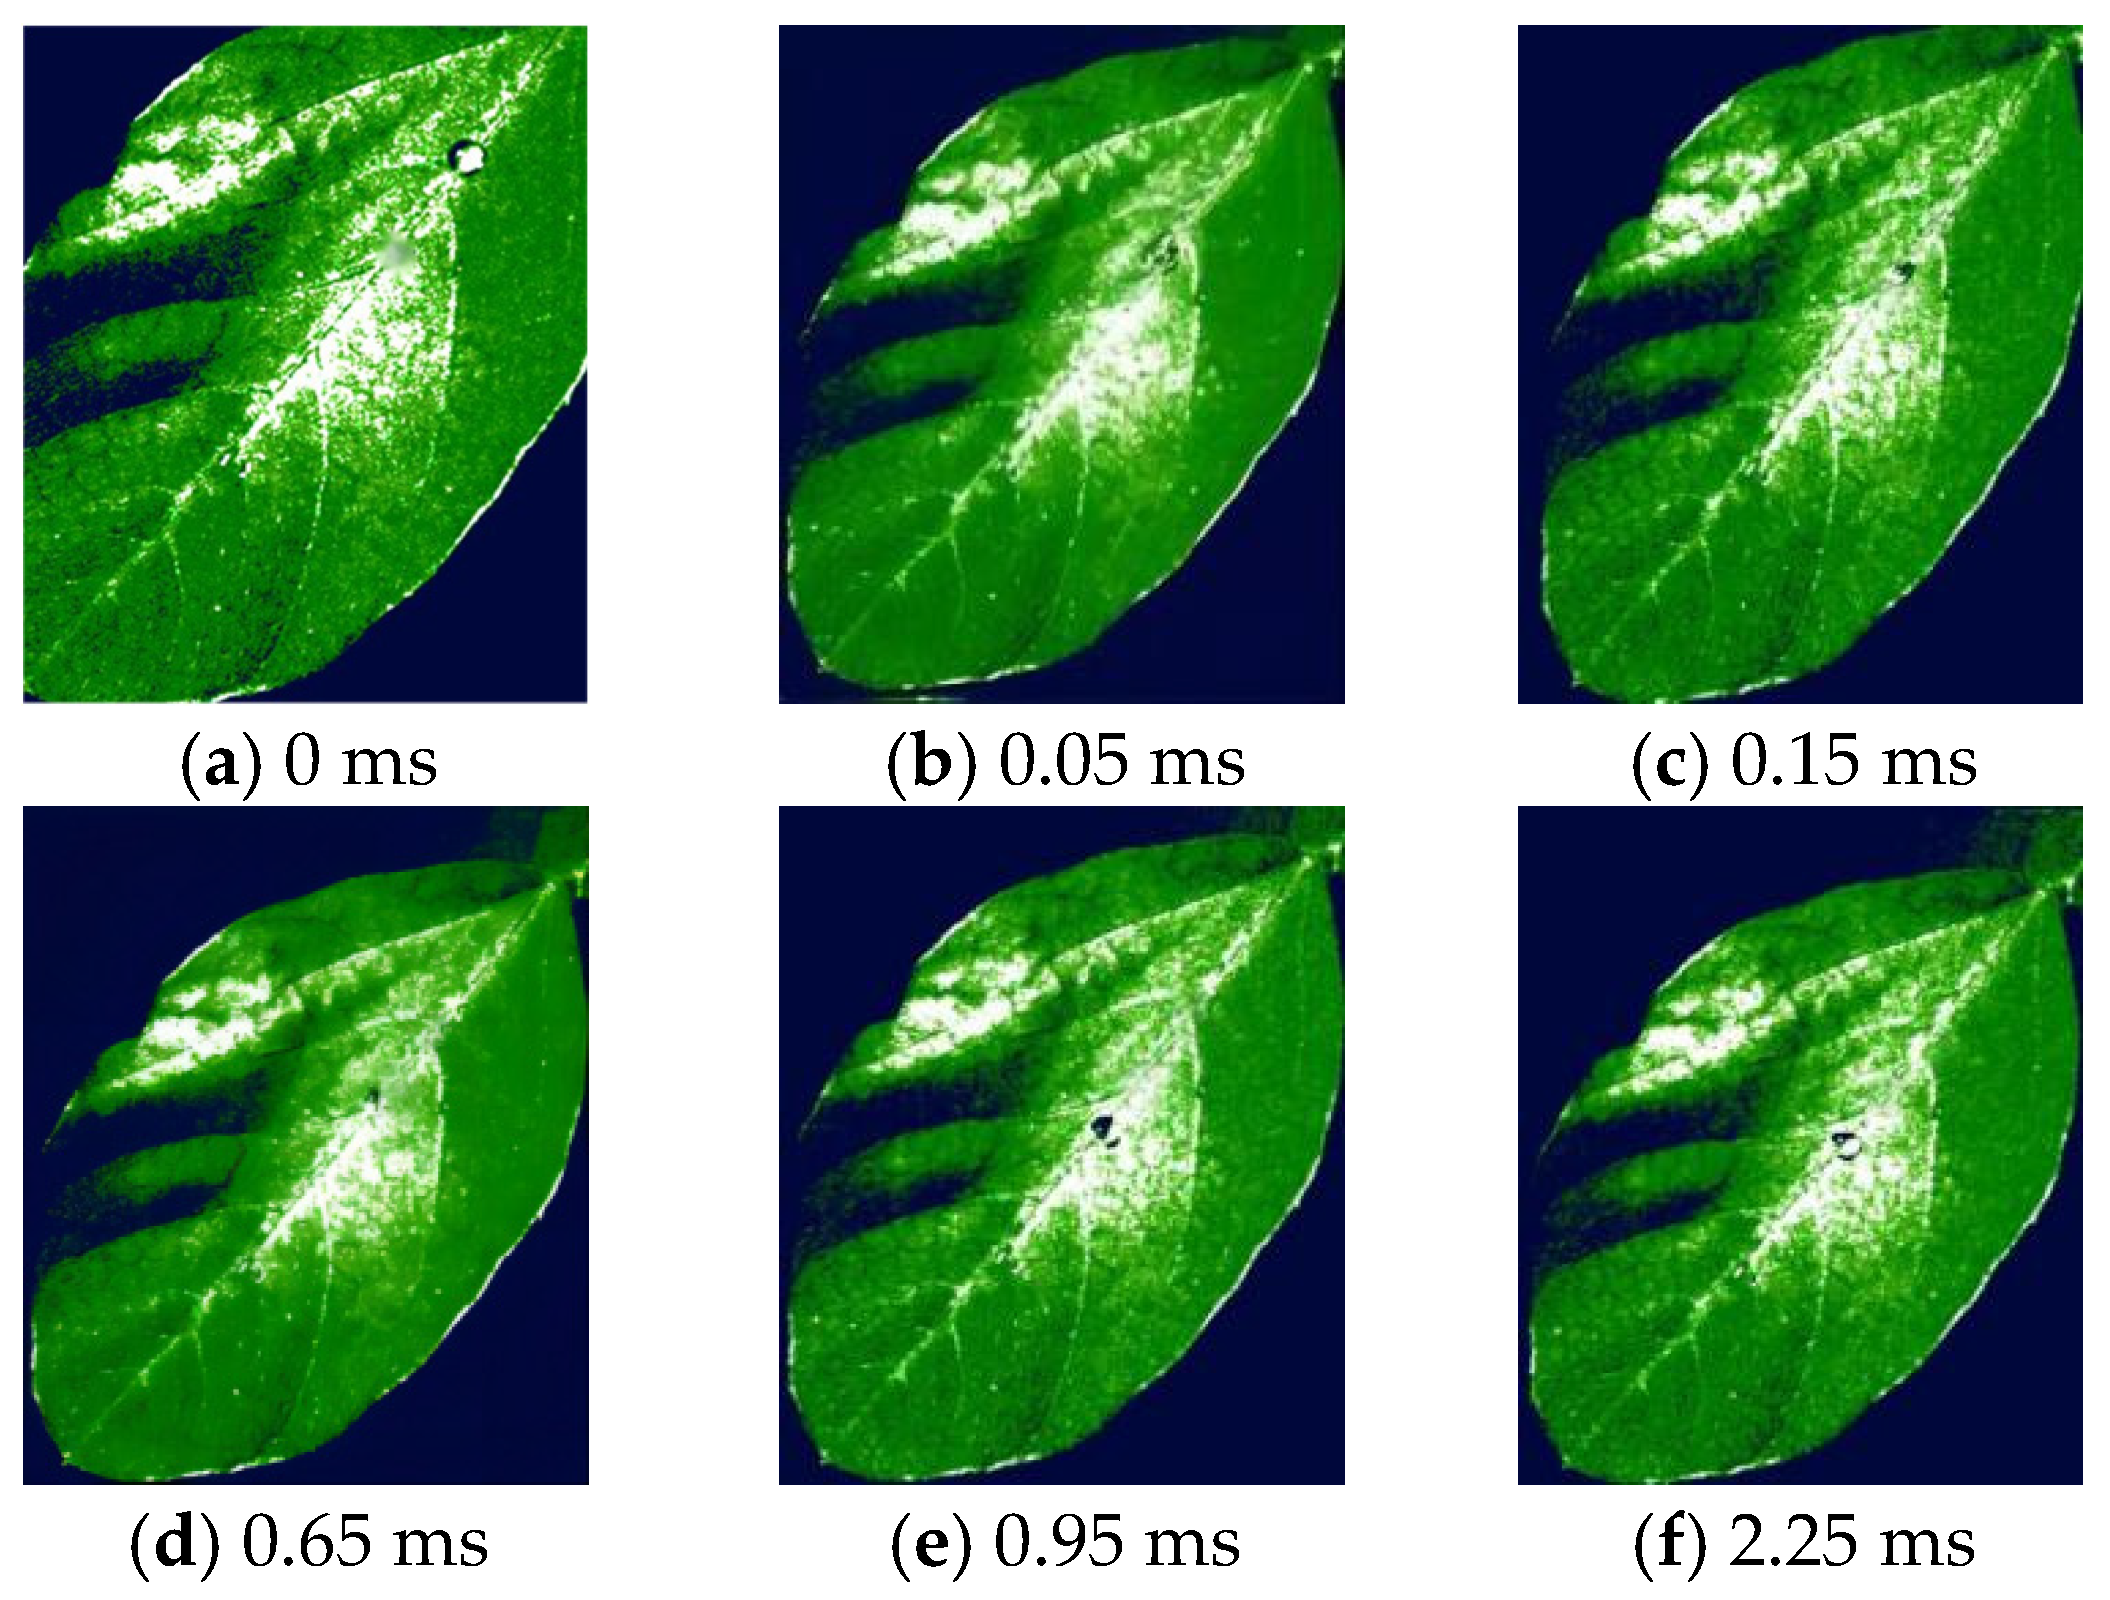
As shown in Figure 16, Figure 17 and Figure 18, the spreading process of droplets of various sizes after impact on soybean leaf surfaces occurs within 1~2.25 ms. All droplet sizes undergo morphological changes, including spreading, contraction, secondary spreading, and secondary contraction. Droplets with a size of 500 μm exhibit the longest sliding distance. For droplets, as their mass increases, the inertial force they experience also grows. Even when their initial velocity upon impact with the leaf surface is small, post-collision inertial forces continue to propel them forward. At a 500 μm droplet size, micro-droplet fragmentation occurs at the impact interface. This primarily happens because kinetic energy from the droplet’s contact with the solid dry surface converts tangentially upon impact, causing subsequent diffusion. If the inertial force generated by the impact exceeds the capillary force maintaining the droplet’s integrity, fragmentation occurs; otherwise, further diffusion continues until kinetic energy drops to zero. During this diffusion process, some kinetic energy dissipates through viscosity while another portion transforms into surface energy.
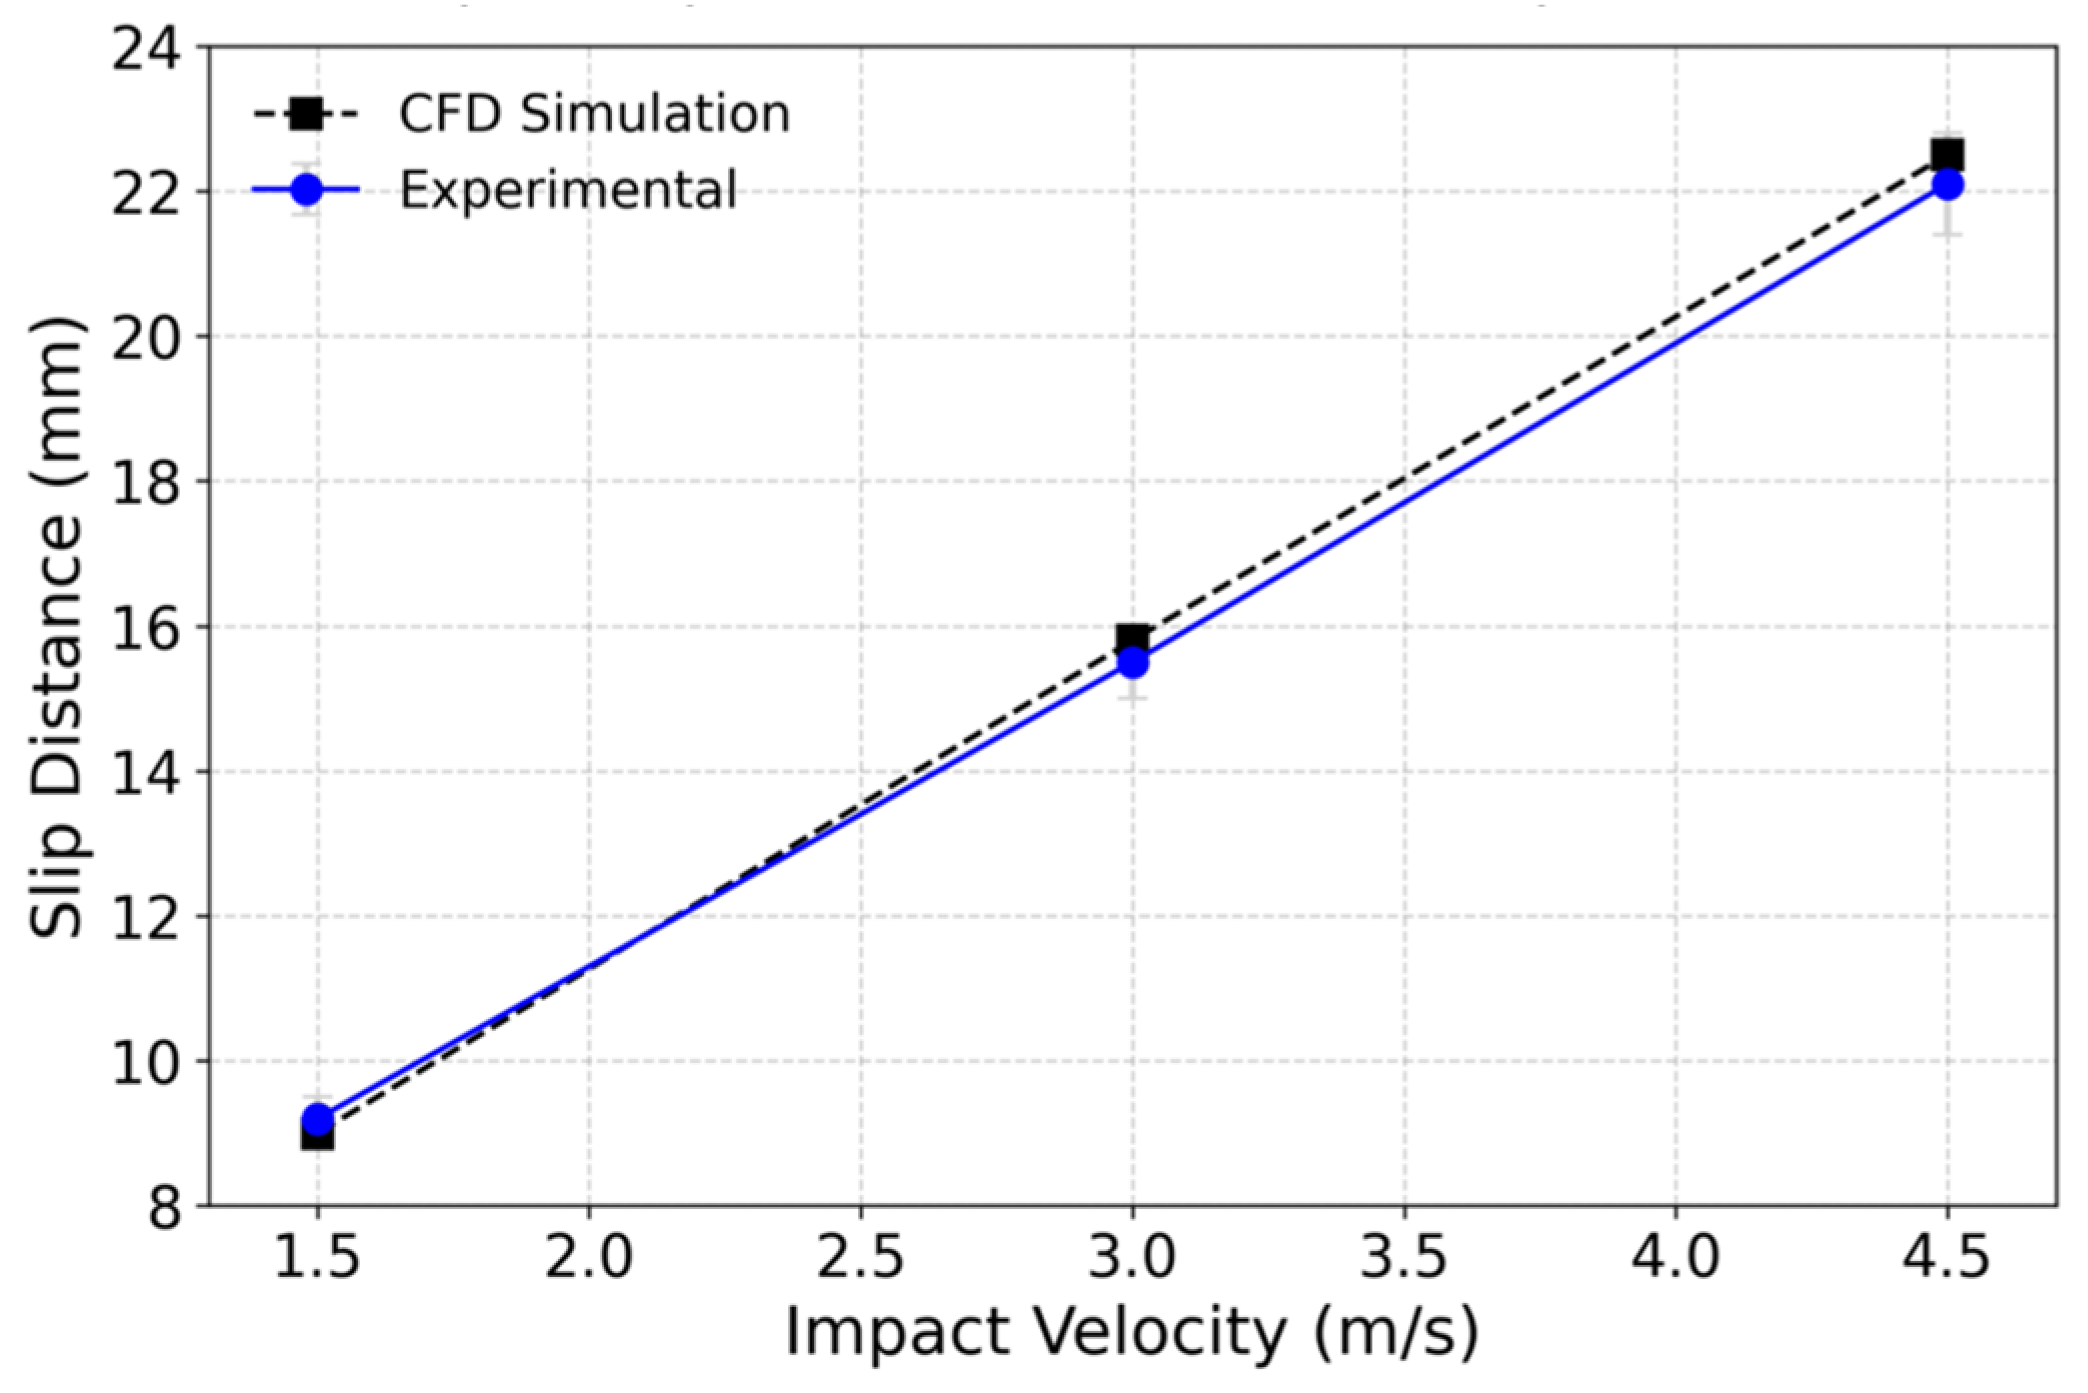
Using normalized diffusion diameter (D/D0) and maximum sliding distance (Smax) as key metrics, the simulation results at a 2.0 m/s impact velocity showed a D/D0 ratio of 1.78 compared to 1.82 in experiments, with a relative root mean square error (RMSE) of 4.2%. The simulated Smax value was 1.89 mm, while the experimental value was 1.93 mm, resulting in a 2.1% deviation. Additionally, linear regression analysis of sliding distances at different impact velocities (1.5, 3.0, and 4.5 m/s) revealed an R2 coefficient of 0.96, indicating strong consistency between numerical simulations and experimental results (Figure 19). This quantitative comparison strongly validates the accuracy of dynamic droplet interface capture using the VOF method.
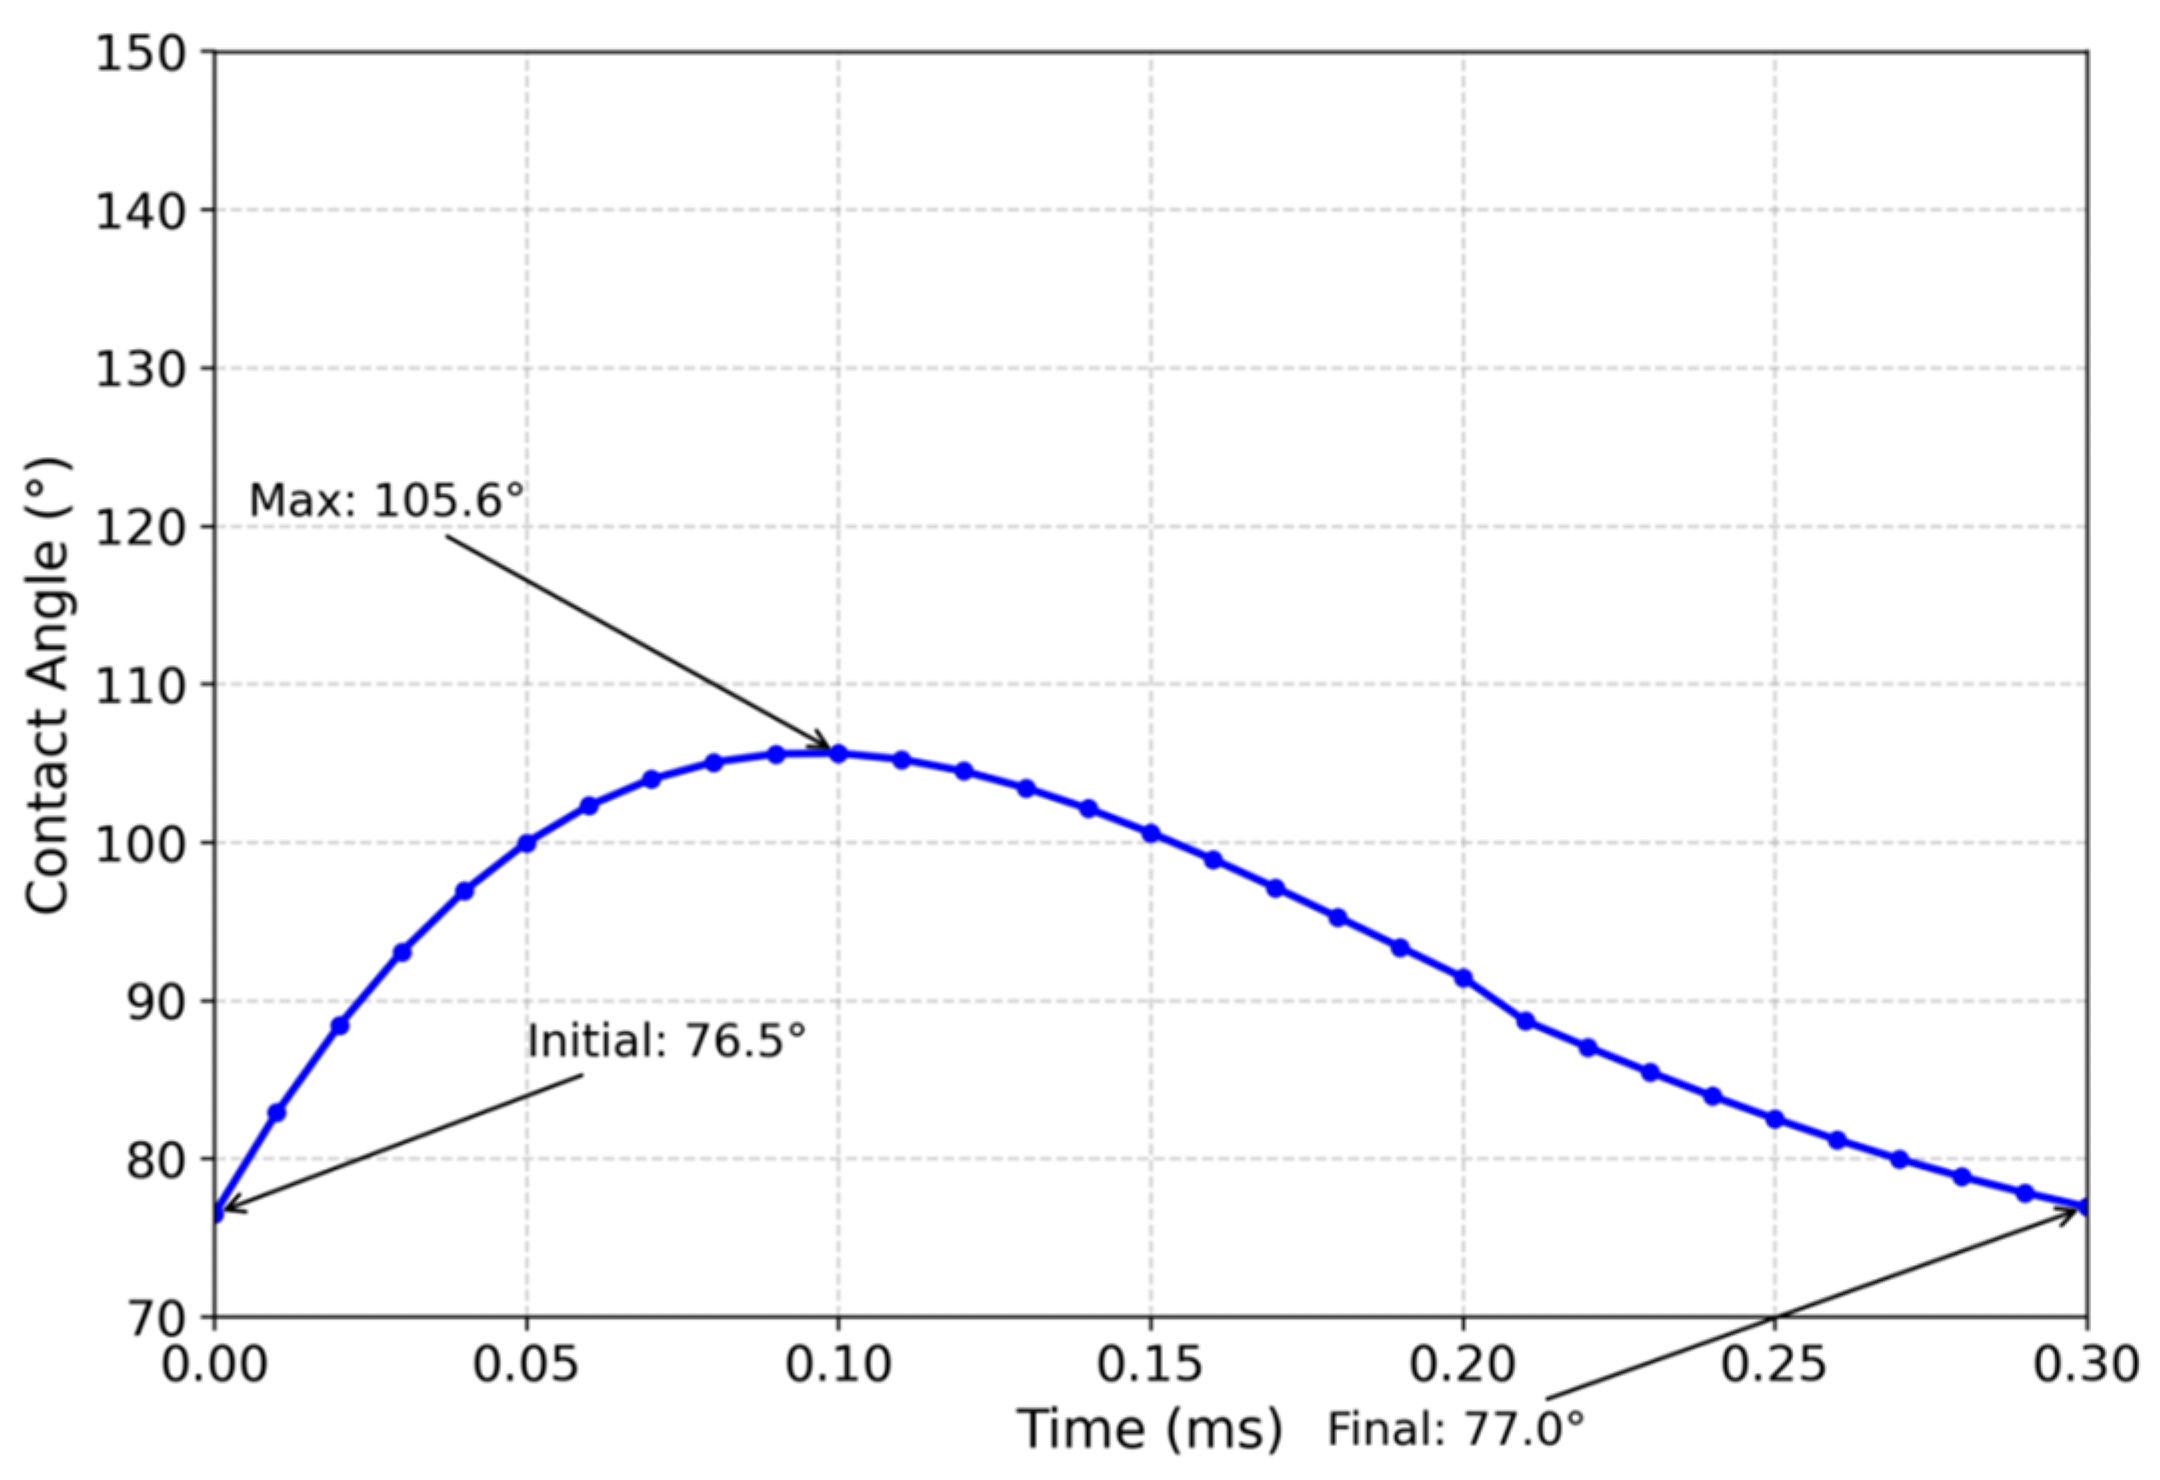
To further investigate the spreading–retracing dynamics of droplets experimentally, we captured the dynamic evolution of contact angles post-impact using high-speed imaging sequences (Figure 20). When a 300 μm droplet hit the surface at 1.5 m/s, the contact angle rapidly increased from an initial 76.5° to approximately 105° during the maximum spreading phase within 0.3 ms and then decreased to about 77° in the retraction phase. These experimental measurements align with the film morphology evolution observed in VOF simulations, providing empirical evidence for the energy conversion between droplet kinetic energy and surface energy.

3.3. Pesticide Droplet Slip Based on Response Surface Method Analysis

The Box–Behnken method was used as a test method, with the amount of pesticide droplet slip as the assessment index. This paper sets out a series of experiments on the impact velocity (the level value X1 and the coded value x1), the impact angle (the level value X2 and the coded value x2), and the droplet size (the level value X3 and the coded value x3). The level value and the coded value of the experiment elements are shown in Table 5. The experimental scheme and the results are shown in Table 6. Furthermore, to establish a more rigorous statistical correlation between numerical simulations and experimental observations, we conducted a comparative analysis of the maximum sliding distances of droplets under all 17 experimental conditions (based on the Box–Behnken design). The Bland–Altman consistency analysis demonstrated that 95% of the differences between the two methods’ measurements fell within the ±0.05 cm range, confirming their good consistency.
This research imports the experimental data in Design-Expert 10.0 to make a regression fit, which sets up the regression model of the amount of pesticide droplet slip and the assessment index of the droplets’ movement from different elements, as shown in Equation (8).
After removing the non-distinctive regression items, the regression model of the amount of pesticide droplet slip and the assessment index of the droplets’ movement from different elements are shown in Equation (9):
Y = 2.08 + 0 . 36 X 1 + 0.21 X 2 + 0.49 X 3 + 0.52 X 1 X 2 + 0.43 X 1 X 3 + 0.041 X 2 X 3 + 0.096 X 1 2 + 0.041 X 2 2 + 0.22 X 3 2
Y = 2.08 + 0 . 36 X 1 + 0.21 X 2 + 0.49 X 3 + 0.52 X 1 X 2 + 0.43 X 1 X 3 + 0.22 X 3 2
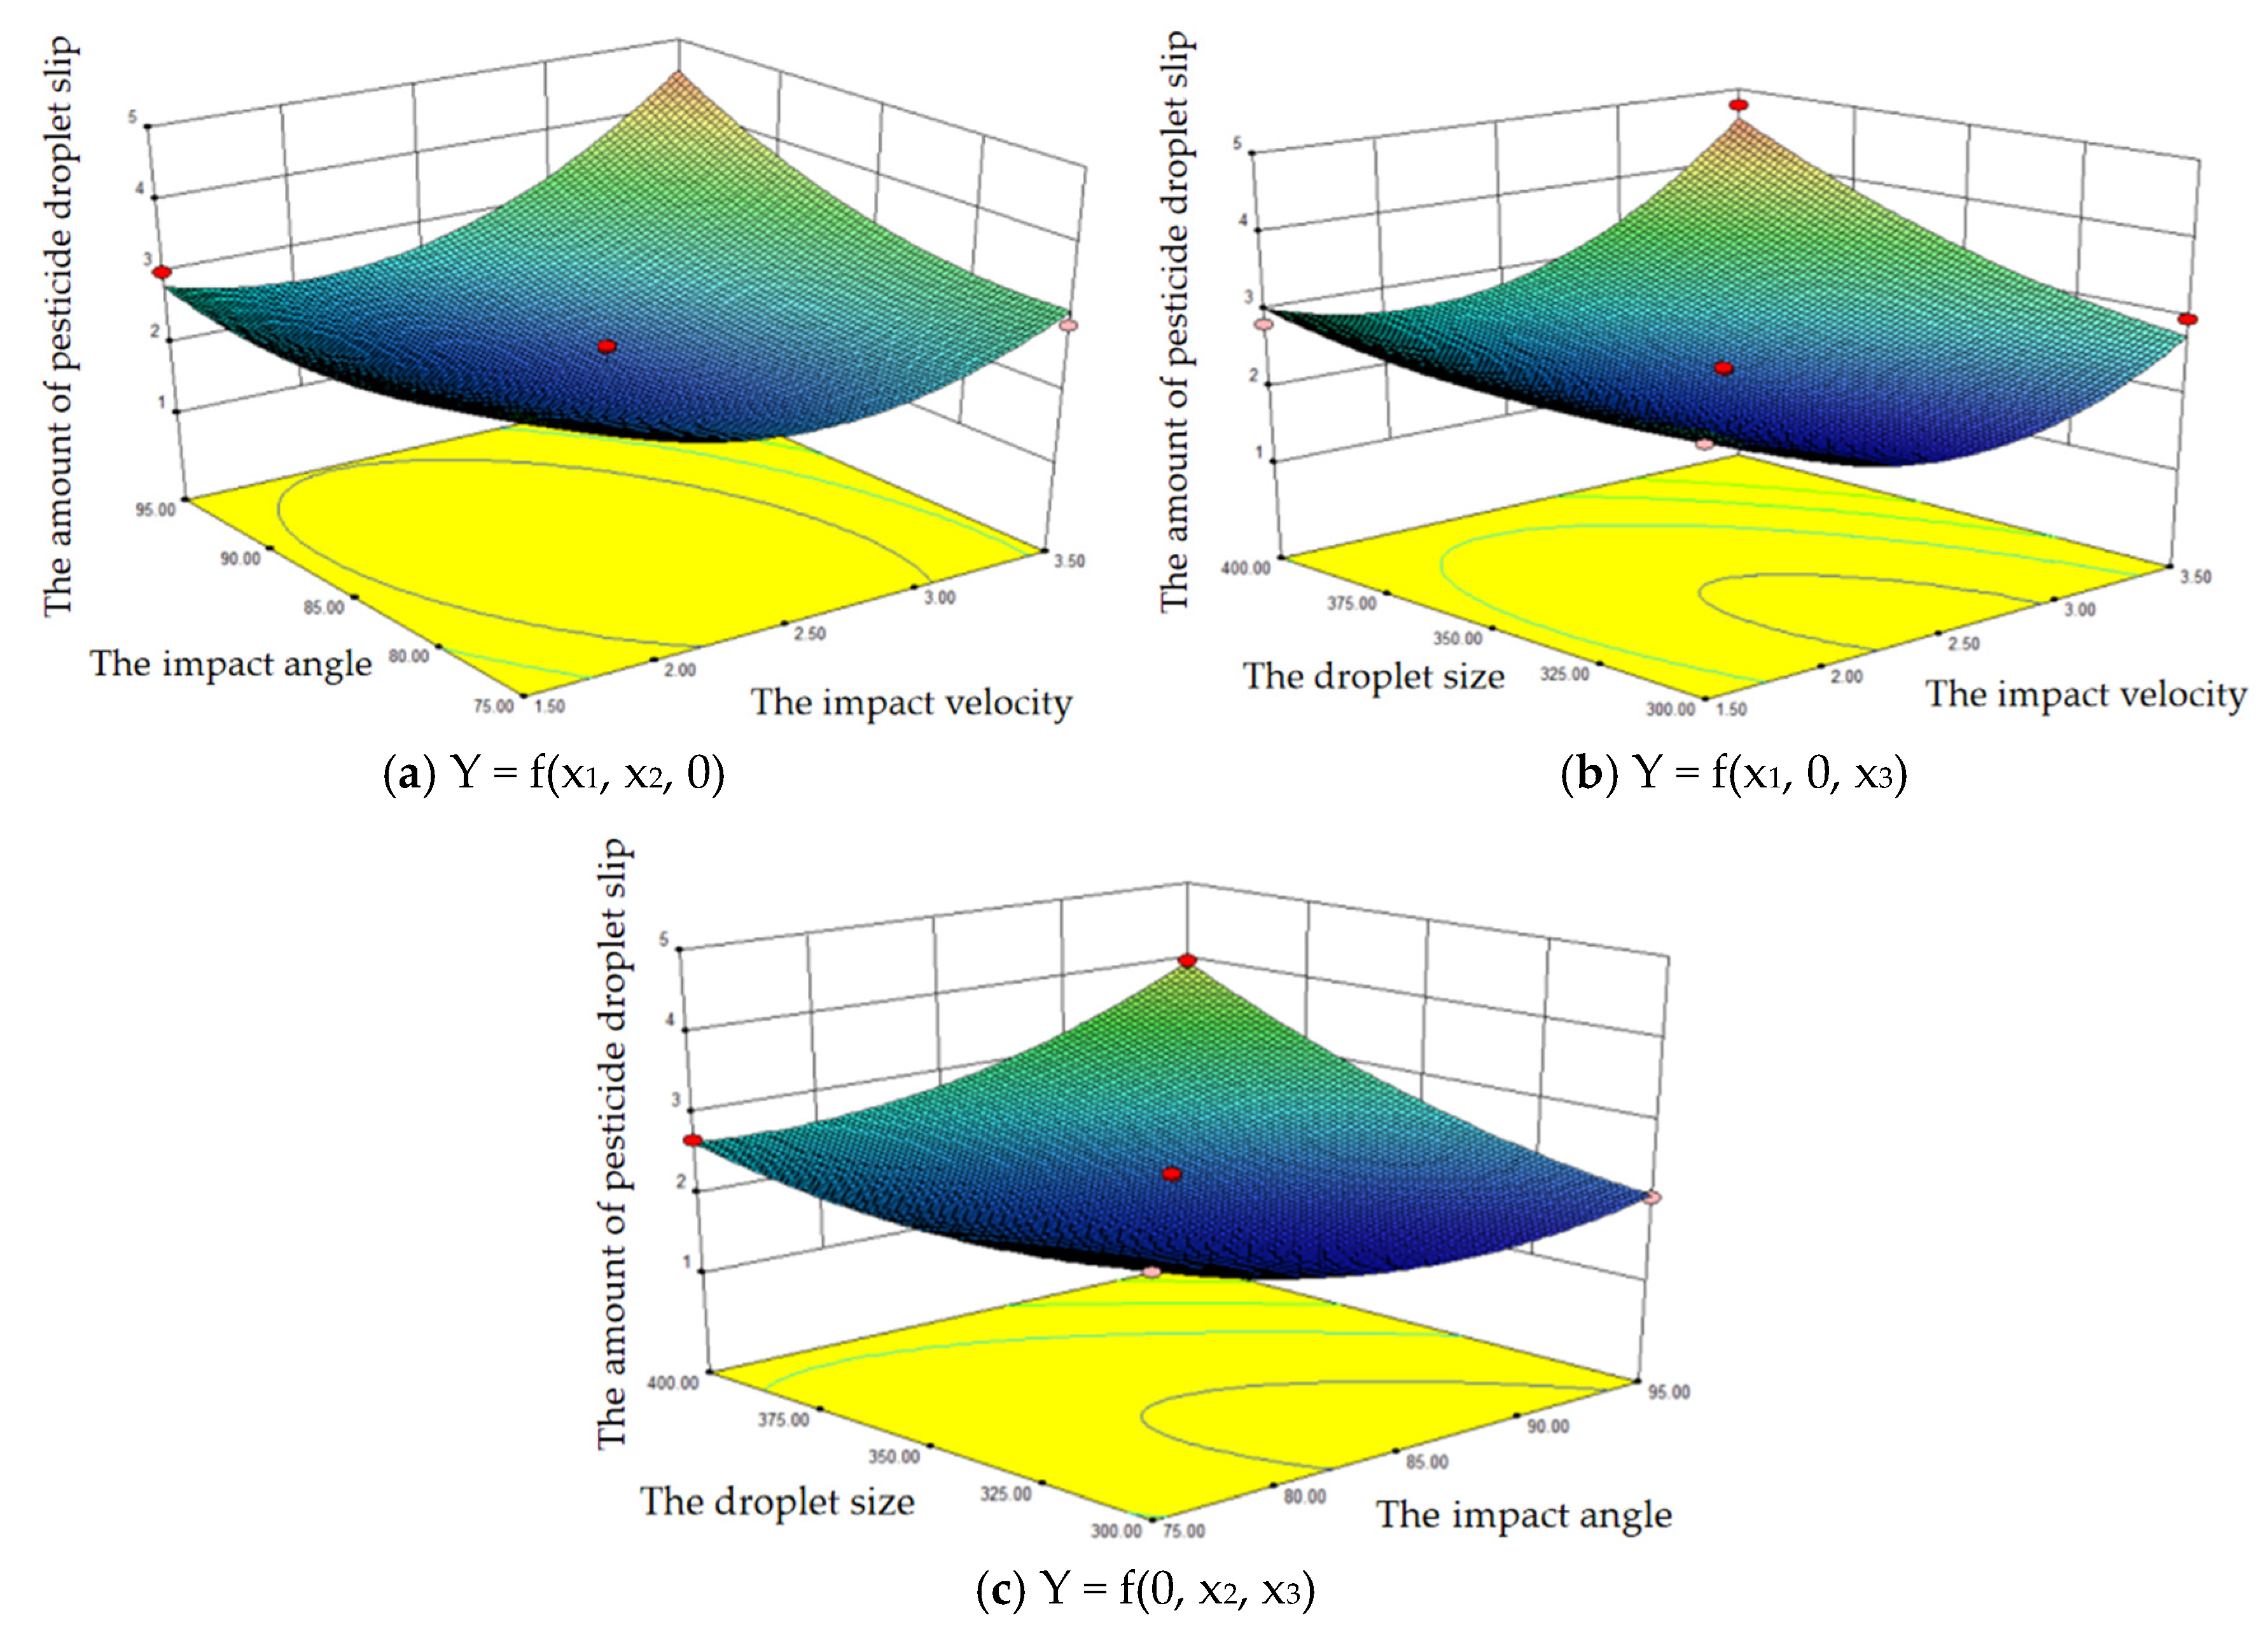
In the regression equation, one element with the factor level o is randomly selected, and the remaining two elements are studied to find out their influence on the amount of droplet slip. The software Design-Expert 10.0 is used to conduct an analysis to obtain the response hook face affected by the interaction factors, as shown in Figure 19.
As can be seen from Figure 21a, under the condition of unchanged droplet size, there is a negative correlation between slip and impact angle; with the increase in impact speed, it shows an increasing trend, and the droplet slip is more appropriate at an impact angle of 85 and impact speeds of 1.5~2.5 m/s.
As shown in Figure 21b, when the impact angle is fixed, the droplet slip shows an increasing trend with the increase in impact velocity; the droplet slip also increases with the increase in droplet size. The droplet slip is more appropriate within the range of a 2.0~3.0 m/s impact velocity and a 325~370 μm droplet size.
As can be seen from Figure 21c, under the condition of constant impact speed, there is a negative correlation between slip amount and impact angle, and a positive correlation between slip amount and droplet size. The range of droplet slip amount is an 85~90 impact angle and a 325~375 μm droplet size, which are more appropriate.
Based on the working performance demand and the actual working condition of the spray, this work plans to succeed in the lower amount of droplet slip. According to the different elements having different effects, this paper needs to optimize all results. This paper regards the amount of droplet slip as an objective function and makes the optimization design for three experimental elements, including the impact angle, impact velocity, and the droplet size.
The optimization constraint conditions can be conducted as follows:
max Y s . t . X 1 ( 2.00 , 3.00 ) X 2 ( 80.00 , 90.00 ) X 3 ( 325.00 , 375.00 )
The influence of three experimental factors affecting the amount of droplet slip is comprehensively considered to obtain the best parameter combination, using Design-Expert 10.0 software to make an optimization solution. This research achieves the optimum working parameter combination, with the impact velocity being 2.63 m/s, the impact angle being 88.92°, the droplet size being 357.80 μm, and the amount of droplet slip being 1.34 cm.
In order to use the optimum parameter combination, this paper uses rounded numbers, with the impact velocity being 2.60 m, the impact angle being 90°, and the droplet size being 360 μm. Three repetitive tests are carried out to obtain the average value. The amount of droplet slip is 1.38 cm, which means that the experimental results are substantially in accordance with the theoretical results; thus, the regression model is good.

4. Discussion

This study systematically investigates the dynamic behavior mechanism and parameter optimization strategy of droplet impact on soybean leaves through a combination of VOF numerical simulations and high-speed camera experiments. In the field of droplet impact dynamics, Range and Feuillebois [27] found, through experiments, that surface roughness significantly alters the spreading dynamics of droplets after impact, and rough surfaces can reduce rebound by increasing contact area, but the interaction of dynamic parameters such as impact angle and velocity was not involved. Building on this, this study, combined with 3D leaf microstructure reconstruction technology, quantifies the synergistic effects of three factors—impact angle (45~90°), velocity (1.5~4.5 m/s), and droplet size (300~500 μm)—on slip displacement. Through response surface methodology, it is found that the contribution rate of impact angle to slip (42.3%) is significantly higher than that of velocity (28.7%) and droplet size (19.5%). This result supplements the research framework of the “single roughness effect” in [7] and establishes a multi-parameter coupled droplet deposition prediction model (R2 = 0.96).
This study innovatively uses real soybean leaves as the research object, reconstructs their surface waxy texture (average roughness Ra = 2.3 μm) through software, and captures the “spreading–contraction–secondary spreading” dynamic process of droplets after impact using the VOF method. Consistent with the phenomenon of “rough surfaces inhibiting rebound” observed in [17,19,20], this study further finds that vertical low-speed impact (90° and 1.5 m/s) can increase the droplet spreading diameter to 3.2 times the initial size, significantly reducing the “surface tension-driven contraction and rebound” mentioned in [17]. In addition, the minimum slip condition optimized through orthogonal tests (300 μm droplet, 1.5 m/s velocity, and 90° angle) results in a slip displacement of 0.92 cm, which is 50.3% lower than the slip displacement on smooth surfaces (1.85 cm) in [17], verifying the effectiveness of the “structural parameters–dynamic parameters–chemical additives” synergistic regulation strategy.
In terms of model verification, this study ensures the convergence of numerical results through high-precision mesh independence testing. The simulation results show good consistency with high-speed camera experimental data in droplet expansion diameter and maximum slip distance. While the study demonstrates promising results in laboratory settings, its practical application in field conditions faces several limitations. First, the model fails to account for dynamic wax layer changes in leaves, environmental wind speed fluctuations, and evaporation effects—factors that could significantly influence droplet behavior during actual spraying. Second, the static contact angle (76.5°) assumed in the model may not fully capture the spatiotemporal variations in leaf surface wetting properties observed in real-world fields. Additionally, the current simulation does not incorporate airflow disturbances within crop canopies, which, in practice, could cause droplet trajectories to deviate from ideal conditions.
While the controlled experimental conditions of this study—maintaining constant temperature and humidity with single-leaf fixation—prove effective for variable control, they limit the model’s direct applicability to complex field environments. Future validation should be conducted on multiple crops like rice and wheat, incorporating dynamic environmental parameters such as wind speed and humidity gradients to enhance model universality. Furthermore, integrating field measurement data to optimize the model’s scale will be a key focus for subsequent research.

5. Conclusions

This study employed a combination of VOF numerical simulations and high-speed camera technologies to investigate the dynamic behavior mechanisms and parameter optimization strategies of droplet impact on soybean leaves. A droplet deposition prediction model based on impact angle, velocity, and droplet size was established, with the main findings as follows:
(1) Droplet impact on soybean leaves exhibited four distinct dynamic stages: “spreading → contraction → secondary spreading → stabilization”. The critical conditions for droplet breakup were identified as an impact velocity > 3 m/s or a droplet size > 500 μm, where inertial forces exceeded surface tension, leading to the formation of secondary satellite droplets. Within the tested parameter range (impact angles of 45~90°, velocities of 1.5~4.5 m/s, and droplet sizes of 300~500 μm), increasing the impact angle from 45° to 90° resulted in an average 40% increase in the volume fraction of fully spread droplets and a 65% decrease in the rebound rate. At low impact velocities (1.5 m/s), the maximum spreading diameter of droplets reached 3.2 times the initial size, with no rebound observed.
(2) Numerical simulations reveal that the pronounced vortex structures at the droplet spreading peak (0.3 ms) at the edge of the liquid film provide a kinetic explanation for droplet splashing and secondary fragmentation under high-Weber-number (We > 100) conditions. Response surface methodology analysis revealed the degree of influence of each factor on slip displacement as impact angle (42.3%) > impact velocity (28.7%) > droplet size (19.5%).
(3) The combination of a 90° impact angle, a 1.5 m/s velocity, and a 300 μm droplet size achieved the optimal slip suppression effect, reducing slip displacement to 1.38 cm. The slip displacement prediction model from VOF simulations and high-speed camera experiments showed R2 > 96%, indicating a significant nonlinear relationship and strong predictive capability.

Author Contributions

S.W., W.G. and C.L. conceived the idea of the experiment; Y.L. and C.L. performed the field test; H.S. and C.L. analyzed the data; J.H., C.L., Y.L., H.S. and S.W. wrote and revised the paper; J.H. funded this article. All authors have read and agreed to the published version of the manuscript.

Funding

This research was funded by the Open Fund Project of the State Key Laboratory of Green Pesticides (Guizhou University, GPLKF202511), the Heilongjiang Provincial Key Research and Development Program-Major Project (2023ZX01A06), the Heilongjiang Provincial “Double First-Class” Discipline Collaborative Innovation Achievement Project (LJGXCG2023-045), the China University Industry-University-Research Collaboration Innovation Fund-Funding Project (2023RY059), and the Heilongjiang Bayi Agricultural University Talent Introduction Scientific Research Startup Fund Project (XYB202504).

Data Availability Statement

The original contributions presented in this study are included in the article. Further inquiries can be directed to the corresponding author.

Conflicts of Interest

The authors declare no conflicts of interest.

References

  1. Liu, X.; Liu, X.; Cui, H.; Yuan, J. Research Progress and Trend Analysis of Crop Canopy Droplet Deposition. Trans. Chin. Soc. Agric. Mach. 2021, 52, 1–20. (In Chinese) [Google Scholar]
  2. He, X. Research progress of plant protection machinery and pesticide application technology in China. Chin. J. Pestic. 2019, 21, 921–930. (In Chinese) [Google Scholar]
  3. Liu, C.; Hu, J.; Li, Y.; Zhao, S.; Zhang, W.; Li, Q. Optimization of the inner flow channel of conical wind field anti-drift spray device and anti-drift characteristics. Trans. CSAE 2021, 37, 11–20. (In Chinese) [Google Scholar]
  4. Wang, G.; Ou, M.; Jia, W.; Zhou, H.; Dai, S.; Dong, X.; Wang, X.; Jiang, L.; Lu, W.; Wang, M. The dynamic evaporation characteristics of thiophanate-methyl droplets and their enhancement under different wind conditions. Horticulturae 2022, 8, 721. [Google Scholar] [CrossRef]
  5. Li, J.; Cui, H.; Ma, Y.; Xun, L.; Li, Z.; Yang, Z.; Lu, H. Orchard Spray Study: A Prediction Model of Droplet Deposition States on Leaf Surfaces. Agronomy 2020, 10, 747. [Google Scholar] [CrossRef]
  6. Wu, S.; Liu, J.; Wang, J.; Hao, D.; Wang, R. The Motion of Strawberry Leaves in an Air-Assisted Spray Field and its Influence on Droplet Deposition. Trans. ASABE 2021, 64, 83–93. [Google Scholar] [CrossRef]
  7. Li, J.; Li, Z.; Ma, Y.; Cui, H.; Yang, Z.; Lu, H. Effects of leaf response velocity on spray deposition with an air-assisted orchard sprayer. Int. J. Agric. Biol. Eng. 2021, 14, 123–132. [Google Scholar] [CrossRef]
  8. Lee, I.-B.; Bitog, J.P.P.; Hong, S.-W.; Seo, I.-H.; Kwon, K.-S.; Bartzanas, T.; Kacira, M. The past, present and future of CFD for agro-environmental applications. Comput. Electron. Agric. 2013, 93, 168–183. [Google Scholar] [CrossRef]
  9. Liu, C.; Hu, J.; Li, Y.; Zhao, S.; Li, Q.; Zhang, W.; Zhao, M. Numerical Simulation of the Trajectory of UAVs Electrostatic Droplets Based on VOF-UDF Electro-Hydraulic Coupling and High-Speed Camera Technology. Agronomy 2023, 13, 512. [Google Scholar] [CrossRef]
  10. Liu, Z.; Chen, J.; Guo, J.; Qiu, B. Numerical Simulation and Validation of Droplet Deposition on Tomato Leaf Surface under Air-Assisted Spraying. Agronomy 2024, 14, 1661. [Google Scholar] [CrossRef]
  11. Mark, N.; Malay, M.; Robert, C. Predicting particle trajectories on an electrodynamic screen-theory and experiment. J. Electrost. 2013, 71, 185–188. [Google Scholar]
  12. Wang, Z.; Zhang, Y.; Guo, T. Experimental study on size and velocity of charged droplets. Procedia Eng. 2015, 126, 522–526. [Google Scholar] [CrossRef]
  13. Cui, H.; Wang, C.; Liu, X.; Yuan, J.; Liu, Y.; Song, L. Cotton canopy airflow simulation and velocity attenuation model based upon 3D phenotype and stratified sub-regional porous medium. Comput. Electron. Agric. 2022, 201, 107282. [Google Scholar] [CrossRef]
  14. Liu, D.; Chen, Z.; Zhou, H.; Chen, Q.; Yang, H. Numerical simulation and verification of flow field characteristics of spray droplets on tea leaves. J. Agric. Chem. China 2022, 43, 58–66. (In Chinese) [Google Scholar]
  15. Zheng, J.; Zhang, H.; Xu, Y.; Zhou, H. Research review on modeling and simulation technology of pesticide spraying system. J. Agric. Sci. Technol. 2024, 26, 76–90. (In Chinese) [Google Scholar]
  16. Appah, S.; Jia, W.; Ou, M.; Wang, P.; Asante, E.A. Analysis of potential impaction and phytotoxicity of surfactant-plant surface interaction in pesticide application. Crop. Prot. 2020, 127, 104961. [Google Scholar] [CrossRef]
  17. Ma, J.; Liu, K.; Dong, X.; Chen, C.; Qiu, B.; Zhang, S. Effects of Leaf Surface Roughness and Contact Angle on In Vivo Measurement of Droplet Retention. Agronomy 2022, 12, 2228. [Google Scholar] [CrossRef]
  18. Shi, Q.; Mao, H.; Guan, X. Numerical Simulation and Experimental Verification of the Deposition Concentration of an Unmanned Aerial Vehicle. Appl. Eng. Agric. 2019, 35, 367–376. [Google Scholar] [CrossRef]
  19. Qiu, W.; Guo, H.; Zheng, H.; Cao, Y.; Lv, X.; Fang, J.; Zhai, C.; Yu, H. CFD modelling to analyze the droplets deposition behavior on vibrating rice leaves. Comput. Electron. Agric. 2022, 201, 107330. [Google Scholar] [CrossRef]
  20. Cao, Y.; Xi, T.; Xu, L.; Qiu, W.; Guo, H.; Lv, X.; Li, C. Computational fluid dynamics simulation experimental verification and analysis of droplets deposition behaviour on vibrating pear leaves. Plant Methods 2022, 18, 80. [Google Scholar] [CrossRef]
  21. Zaboon, J.K.; Jassim, S.F. Numerical and analytical analysis for deflection and stress in a simply supported beam. Mater. Today Proc. 2022, 49, 2912–2915. [Google Scholar] [CrossRef]
  22. Delele, M.A.; Jaeken, P.; Debaer, C.; Baetens, K.; Endalew, A.M.; Ramon, H.; Nicolai, B.M.; Verboven, P. CFD prototyping of an air-assisted orchard sprayer aimed at drift reduction. Comput. Electron. Agric. 2007, 55, 16–27. [Google Scholar] [CrossRef]
  23. Endalew, A.M.; Debaer, C.; Rutten, N.; Vercammen, J.; Delele, M.A.; Ramon, H.; Nicolaï, B.M.; Verboven, P. Modelling pesticide flow and deposition from air-assisted orchard spraying in orchards: A new integrated CFD approach. Agric. For. Meteorol. 2010, 150, 1383–1392. [Google Scholar] [CrossRef]
  24. Sun, C. Design and experimental assessment of a field-spraying system with nozzles employing reciprocating up-and-down movements. Pest Manag. Sci. 2023, 79, 5387–5392. [Google Scholar] [CrossRef]
  25. Miao, Y.; Chen, X.; Gong, Y.; Liu, D.; Chen, J.; Wang, G.; Zhang, X. Design and test of powerful air-assisted sprayer for high stalk crops. Front. Plant Sci. 2023, 14, 1266791. [Google Scholar] [CrossRef]
  26. Rocamora, M.; Val, L.; Pérez, M. PM—Power and Machinery: Modelling the Performance of Air-assisted Spraying on Artichoke. Biosyst. Eng. 2002, 81, 385–393. [Google Scholar] [CrossRef]
  27. Range, K.; Feuillebois, F. Influence of Surface Roughness on Liquid Drop Impact. J. Colloid Interface Sci. 1998, 203, 16–30. [Google Scholar] [CrossRef]
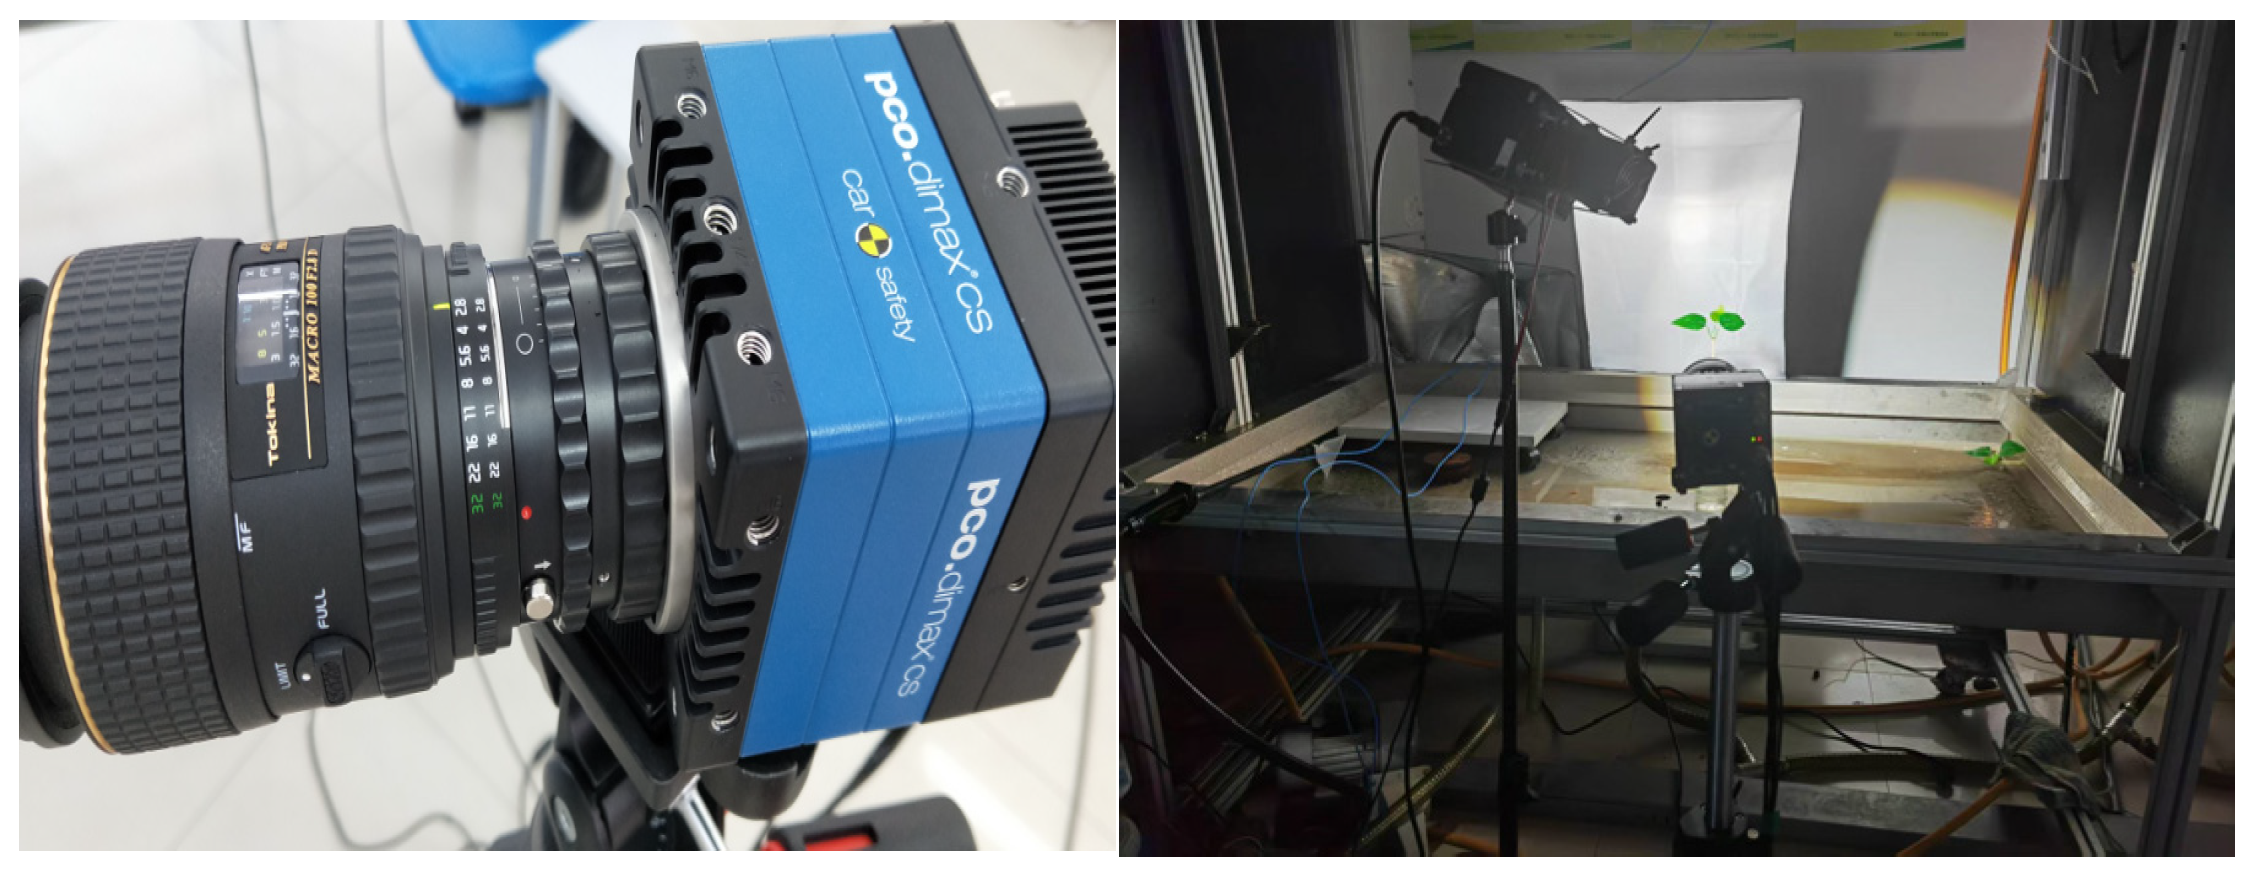
Figure 1. The droplet dynamic impact test system.
Agronomy 15 02578 g001
Figure 2. The area where droplets hit the leaf surface and the veins.
Agronomy 15 02578 g002
Figure 3. Three-dimensional soybean leaf built through reverse engineering.
Agronomy 15 02578 g003
Figure 4. The droplet morphology changes with time (a 300 μm droplet hit the soybean leaf surface at 1.5 m/s).
Agronomy 15 02578 g004
Figure 5. The droplet morphology changes with time (a 300 μm droplet hit the soybean leaf surface at 3 m/s).
Agronomy 15 02578 g005
Figure 6. The peak time of droplet spreading is 0.3 ms.
Agronomy 15 02578 g006
Figure 7. The droplet morphology changes with time (a 300 μm droplet hit the soybean leaf surface at 4.5 m/s).
Agronomy 15 02578 g007
Figure 8. The droplet morphology changes with time (a 300 μm droplet hit the soybean leaf surface at 1.5 m/s and a 45° impact angle).
Agronomy 15 02578 g008
Figure 9. The droplet morphology changes with time (a 300 μm droplet hit the soybean leaf surface at 1.5 m/s and a 75° impact angle).
Agronomy 15 02578 g009
Figure 10. The droplet morphology changes with time (a 300 μm droplet hit the soybean leaf surface at 1.5 m/s and a 90° impact angle).
Agronomy 15 02578 g010
Figure 11. The droplet morphology changes with time (a 400 μm droplet hit the soybean leaf surface at 1.5 m/s and a 75° impact angle).
Agronomy 15 02578 g011
Figure 12. The droplet morphology changes with time (a 500 μm droplet hit the soybean leaf surface at 1.5 m/s and a 75° impact angle).
Agronomy 15 02578 g012
Figure 13. Sliding process of cyhalothrin liquid hitting the soybean leaf surface (an impact velocity of 1.5 m/s, impact angles of 73~76°, and droplet sizes of 300~350 μm).
Agronomy 15 02578 g013
Figure 14. Sliding process of cyhalothrin liquid hitting the soybean leaf surface (an impact velocity of 3 m/s, impact angles of 73~76°, and droplet sizes of 300~350 μm).
Agronomy 15 02578 g014
Figure 15. Sliding process of cyhalothrin liquid hitting the soybean leaf surface (an impact velocity of 4.5 m/s, impact angles of 73~76°, and droplet sizes of 300~350 μm).
Agronomy 15 02578 g015
Figure 16. Sliding process of the cyhalothrin liquid hitting the soybean leaf surface (an impact velocity of 1.5 m/s, impact angles of 73~76°, and droplet sizes of 300 μm).
Agronomy 15 02578 g016
Figure 17. Sliding process of the cyhalothrin liquid hitting the soybean leaf surface (an impact velocity of 1.5 m/s, impact angles of 73~76°, and droplet sizes of 400 μm).
Agronomy 15 02578 g017
Figure 18. Sliding process of the cyhalothrin liquid hitting the soybean leaf surface (an impact velocity of 1.5 m/s, impact angles of 73~76°, and droplet sizes of 500 μm).
Agronomy 15 02578 g018
Figure 19. Experimental measurements of droplet sliding distances versus CFD simulation results under different impact velocities.
Agronomy 15 02578 g019
Figure 20. Dynamic contact angle of droplet with time under typical working conditions.
Agronomy 15 02578 g020
Figure 21. Response surfaces of interactive factors’ influence on test indexes.
Agronomy 15 02578 g021
Table 1. Test results of the chemical properties of the solution.
Solution TypeSurface Tension
(mN/m)
Density
(g/cm3)
Contact Angle
(°)
Remarks
20% permethrin emulsion38.5 ± 0.31.08 ± 0.0270.2 ± 1.520% emulsion, pH = 6.5
20% permethrin emulsion + 1/2000 Yunzhan25.1 ± 0.21.00 ± 0.0150.5 ± 1.2silicone surfactants
20% permethrin emulsion + 1/2000 Jijian32.4 ± 0.41.02 ± 0.0160.8 ± 1.3alkyl polyoxyethylene ether
20% permethrin emulsion + 1/2000 Sujie35.6 ± 0.31.03 ± 0.0255.3 ± 1.4plant oil derivatives
Table 2. Grid encryption test.
Grid TypeTotal CellsMinimum Cell Size
(μm)
Spread Diameter
D/D0 (t = 5 ms)
Slip Distance
Smax (mm)
Coarse285,600501.821.96
Medium583,200301.781.89
Fine921,800151.771.88
Table 3. Air–liquid two-phase parameters.
Physical CharacteristicsAir PhaseLiquid Phase
Temperature (K)298298
Density (kg/m3)1.225998.2
Dynamic viscosity (N·s/m2)1.7894 × 10−21.003 × 10−3
Turbulent intensity (%)1010
Table 4. Key dimensionless numbers.
Impact Velocity (m/s)Weber Number
We = ρlU2d0/σlg
Reynolds Number
Re = ρlUd0/σlg
Capillary Number
Ca = μlU/σlg
1.0423000.013
2.01686000.027
3.03789000.040
Table 5. Experiment factor level and coded value.
Coded ValueImpact Velocity (m/s)Impact Angle (°)Droplet Size (μm)
−11.575300
02.585350
13.595400
Table 6. Experimental scheme and results.
No.Impact Velocity
X1 (m/s)
Impact Angle
X2 (°)
Droplet Size
X3 (μm)
Amount of Pesticide Droplet Slip
Y (cm)
1−1−103.62
21−102.91
3−1103.02
41104.38
5−10−12.74
610−12.98
7−1012.82
81014.78
90−1−12.54
1001−12.05
110−112.68
120113.96
130002.27
140001.99
150002.31
160001.87
170001.98
Disclaimer/Publisher’s Note: The statements, opinions and data contained in all publications are solely those of the individual author(s) and contributor(s) and not of MDPI and/or the editor(s). MDPI and/or the editor(s) disclaim responsibility for any injury to people or property resulting from any ideas, methods, instructions or products referred to in the content.