Article

Responses of Photosynthetic Activity in Flag Leaves and Spikes as well as Seed Development of Wheat (Triticum aestivum L.) to Artificial Shading

1
Institute of Life Sciences, Gyeongsang National University, Jinju 52828, Republic of Korea
2
Department of Applied Biological Science, Gyeongsang National University, Jinju 52828, Republic of Korea
3
Department of Agronomy, Gyeongsang National University, Jinju 52828, Republic of Korea
*
Author to whom correspondence should be addressed.
These authors contributed equally to this work.
Agronomy 2025, 15(11), 2577; https://doi.org/10.3390/agronomy15112577 (registering DOI)
Submission received: 10 October 2025 / Revised: 2 November 2025 / Accepted: 7 November 2025 / Published: 9 November 2025
(This article belongs to the Section Plant-Crop Biology and Biochemistry)

Abstract

The accumulation of photoassimilates in the sinks during the grain filling stage is affected by the conditions of the various source organs. This study was conducted to investigate changes in various source and sink organs when the flag leaves and spikes were shaded from heading to harvest in wheat. Shading the flag leaves increased chlorophyll content and chlorophyll fluorescence in the uppermost leaves by 34.9% and 0.3% in 2022 and 75.3% and 3.3% in 2023, respectively, maintaining a relatively high photosynthetic rate from heading to the mid-grain filling stage. However, shading the spikes had a more substantial negative impact on spike growth than the flag leaf shading. On the other hand, the uppermost leaves continued to serve as a source more actively even when the flag leaves were shaded, implying a compensating effect. At 35 days after treatment (DAT), the relative water content (RWC) of the spike in the spike shading (SS) treatment was 19.4% and 49.7% higher than that of the control in 2022 and 2023, respectively. However, grain weight in the SS treatment decreased by 39.7% in 2022 and 5.3% in 2023 compared with the control. In the flag leaf shading (FS) treatment, grain weight declined by 3.5% and 6.2% in 2022 and 2023, respectively. These results indicate that the reduction in grain weight due to shading was less pronounced in the SS treatment than in the FS and combined flag leaf and spike shading (FSS) treatments. The results suggest that spikes play a buffering role when assimilate-transport functions decline in the source organs. Our results provide a better understanding of the architectural properties, including flag leaf, spike, and the uppermost leaf, for photosynthetic contribution to grain filling in wheat. Also, identifying target characteristics for improving photosynthetic source organs will be valuable for developing wheat varieties with high yield stability.

1. Introduction

Photosynthates are produced in leaves (source) and translocated to various organs, where they are either utilized for growth or stored as reserve molecules (sink). The movement and accumulation of the photosynthates into sinks depend on the amount of photosynthetic organs, the size of sink organs, the development of the vascular system, and environmental conditions. In C3 grain crops such as wheat, seed growth occurs through redistribution in photosynthates produced in leaves, stems, and heads [1,2,3,4,5], the presence of flag leaf, glumes, husk, and awns influence not only the source–sink relation but also yield in wheat. Among them, the flag leaf is considered the most active organ in photosynthesis during seed development and serves as a key selection criterion for seed yield, contributing 41 to 43% of seed dry weight in wheat [6,7]. This is because the upper layer leaves shade the lower leaves and do not directly participate in light absorption [8,9]. According to Kramer and Didden [10], the removal of flag leaves in the bulk selection population of spring wheat led to a 3.66% reduction in the number of seeds per spike. Furthermore, a correlation has been observed between the photosynthesis duration of the flag leaf and yield in wheat [11,12].
Flag leaves are a major contributor to seed development as a source of photosynthates, while other photosynthetic organs have been recognized as having a low contribution. However, within spike, the husk and glumes have been reported to play an important role in providing assimilation products for seed growth [13,14,15,16,17]. Additionally, refixation of carbon dioxide from respiration is higher in the husk and glumes than in the leaves [13,14,18,19]. Moreover, the role of photosynthesis in the spike is higher than that of the flag leaf in terms of seed growth for potential yield [20]. Even with increasing CO2 concentrations, the photosynthesis of the spikes is higher than the photosynthesis of the leaves in terms of contribution to grain yield [18].
Most experiments on the source–sink relationship of photosynthates are based on spike or flag leaf removal and leaf shading treatment [21], as flag leaf is known to play a significant role in seed growth [5,22]. However, studies examining changes in other organs, such as the uppermost leaves, in response to flag leaf and spike shading are rare, and little is known about the changes in the storage of photosynthates. The purpose of this study was to investigate how leaf and spike shading influence the growth of the uppermost leaves and seed growth in wheat from heading, and these insights may contribute to breeding wheat cultivars with enhanced proportions and prolonged activity of photosynthetic organs during the grain filling stage.
Considering the finding that physiological resilience occurs in response to pretreated shading [23], compensatory interactions related to resilience among plant organs are essential for maintaining stable crop yields. The study on such adaptive physiological memory would strengthen the rationale for exploring organ-specific shading responses, particularly as shading alters carbon assimilation and water relations under mild shading stress. This study focused on elucidating the compensatory role of the uppermost leaf under flag leaf shading in grain growth, and how the weakened source strength of the shaded spike—despite enhanced relative water content—negatively influences grain development.

2. Materials and Methods

2.1. Experimental Materials and Growth Conditions

The wheat for this study was winter wheat (cv. Jokyeong), cultivated at Gyeongsang National University Experimental Farm located in Jinju, Genogram Province, in the 2021–2022 and 2022–2023 growing seasons. The soil of the experimental field was sandy loam. The pH and EC were 6.5 and 0.55 dS m−1, soil organic matter and available P2O5 content were 17.4 g kg−1 and 150 mg kg−1, respectively, and cation exchange capacity was 17.4 cmol kg−1.
The wheat was planted on 29 October and 1 November in 2021 and 2022, respectively, with a 25 cm row spacing at the sowing rate of 15 kg seeds per 10 a (330 seeds m−1). Fertilizer application rates were set at 195 kg N ha−1, 162 kg P ha−1, and 53 kg K ha−1. Nitrogen fertilization was performed in three splits at 79 kg N ha−1, 58 kg N ha−1, and 58 kg N ha−1 as a basal, 1st, and 2nd top-dressing fertilizer, respectively. Top dressings were applied at the beginning of regrowth after overwintering and 20 days later. Pest control was carried out with recommended practices, while hand weeding was conducted on the 18th and 45th day after the planting. To impose shading treatment, the leaves and spikes of the wheat were wrapped entirely with aluminium foil immediately at heading, 11 April 2022, and 19 April 2023. Five plants from each treatment were sampled weekly after heading (Figure 1).

2.2. Experimental Design

The field trials were conducted with a randomized block design in both 2022 and 2023. Four different shading treatments were applied and each treatment applied in three plots. The size of each plot was 200 m2 (8 m × 25 m). Shading treatments applied by wrapping the organs at heading with aluminum foil for complete shading include non-treated control, flag leaf shading (FS), spike shading (SS), and flag leaf and spike shading (FSS). The shading treatments persist until harvest. For aeration inside the wrapping and to prevent mechanical damage, two pencils were placed on the side of the flag leaf and spike and then pulled out after wrapping. Leaves used for physiological measurements were removed, and the corresponding plants were excluded from subsequent experiments.

2.3. Physiological Measurements

From the 7 days after treatment to the 28 days after treatment (DAT), physiological measurements were conducted on the flag leaves and the uppermost leaves (located just below the flag leaf). Parameters assessed included leaf chlorophyll content, chlorophyll fluorescence (Fv/Fm), photosynthesis rate, transpiration rate, and stomatal conductance. The chlorophyll content and photosynthesis were measured using a portable chlorophyll meter (SPAD-502, Minolta, Osaka, Japan) and a handheld photosynthesis system (CID-340, Bio-Science, Camas, WA, USA) at the midpoint of the leaf, respectively. Chlorophyll fluorescence was measured on the leaf which was dark-adapted for 30 min using a chlorophyll fluorometer (OS-30p, Opti-Sciences, Hudson, NH, USA). Photosynthetic traits were measured between 12:00 and 14:00 under natural sunlight (1450–1570 µmol·m−2s−1). Physiological characteristics, including photosynthetic rate, chlorophyll fluorescence, and SPAD value, were measured with three-plant replications in a plot, and each replication was the average of three measurements. The photosynthetic characteristics, SPAD, and chlorophyll fluorescence of Al foil-wrapped organs were measured instantly after removing the foil, and the organs were wrapped again as soon as possible after measuring. Additionally, leaf temperature was measured using a thermal imaging camera (Ti 400, Fluke, Avery, WA, USA).

2.4. Measurements of Spike and Grain Growth

Four spikes per replication and twenty grains from the middle region of a spike were collected from 0 DAT to 35 DAT, which corresponded to initial and late grain filling stage, and the glumes and husk, including palea and lemma, were separated using forceps from each grain. After measuring fresh weight (FW) and water-saturated turgid weight (TW) by floating on distilled water for 6 h, fresh samples were dried at 80 °C for 48 hr in a forced-air convection oven to determine dry weight (DW) measurement. Relative water content (RWC) of each part was calculated using Formula (1).
RWC (%) = ((FW − DW) × 100)/(TW − DW)
The relative growth rate (RGR) of spike, glume, and grain was calculated based on the weight at 7 DAT (DW1 at T1) and 35 DAT (DW2 at T2) as the following Formula (2).
RGR = (ln DW2ln DW1)/(T2 − T1)

2.5. Data Analysis

All data for physiological and growth characteristics were expressed as mean values over three replications. Statistical analysis was performed using SAS version 9.4 (Statistical Analysis Systems Inst., Raleigh, NC, USA). One-way ANOVA was performed using the PROC ANOVA procedure to evaluate differences among shading treatments, and mean values were separated with Tukey’s test at p < 0.05.

3. Results

3.1. Leaf Chlorophyll Content and Chlorophyll Fluorescence

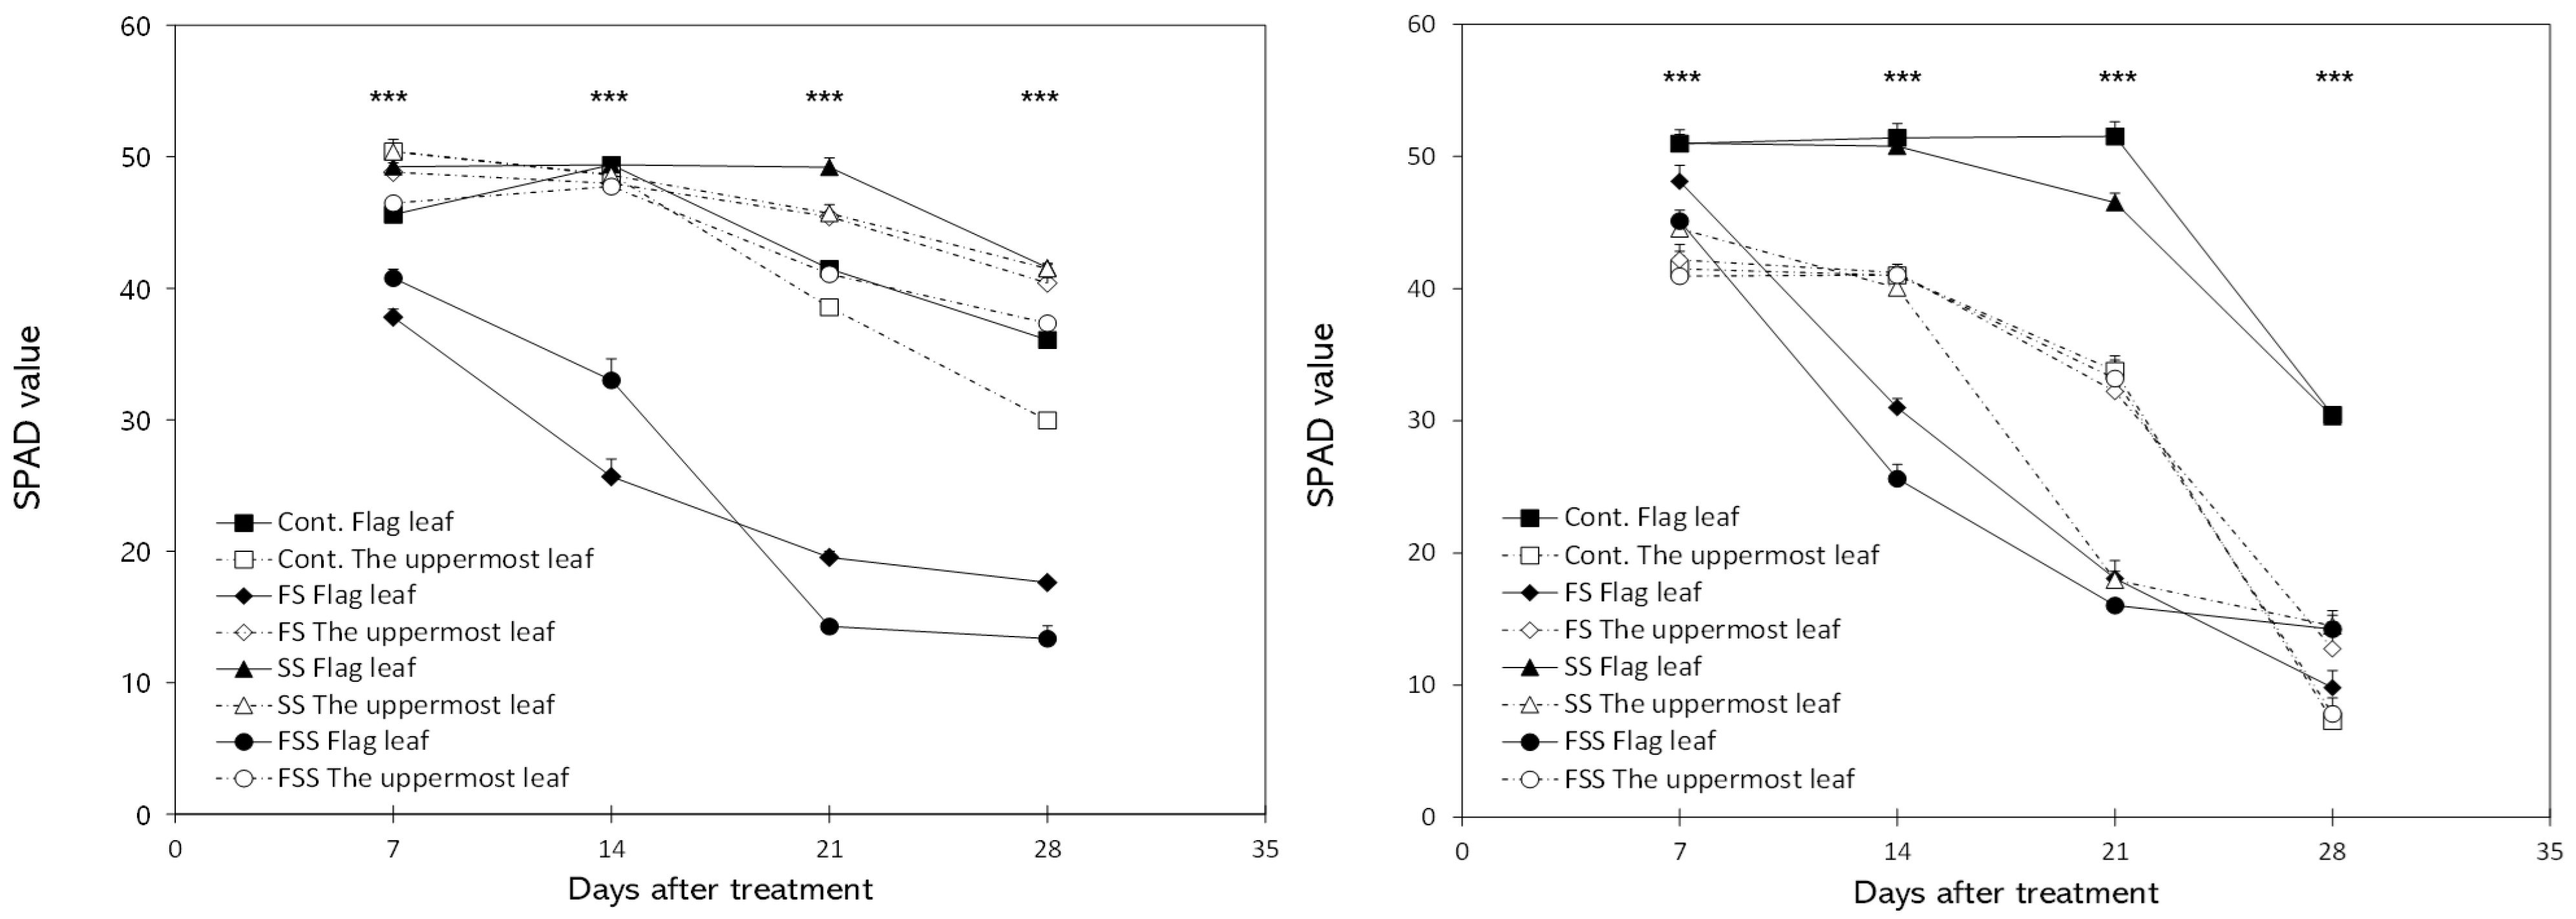
In 2022, shading treatment from day 7 to day 28 led to a decrease in the SPAD values of flag leaves in the control and spike shading (SS) by 9.5 and 7.7, respectively, reflecting a slight decline after heading. However, flag leaf shading (FS) and flag leaf and spike shading treatment (FSS) highly reduced the SPAD value of flag leaf by 20.5 and 27.4, respectively. These results suggest that shading the flag leaf accelerates leaf senescence after heading. In 2023, similar results were observed. The SPAD values of flag leaves in the control and SS treatment decreased by 20.5 and 20.7, respectively, from 7 DAT to 28 DAT. However, FS and FSS treatment resulted in a greater decrease by 38.3 and 30.9, respectively (Figure 2), consistent with the trends observed in the 2021–2022 season. The SPAD values of the uppermost leaf were notably reduced by 20.5 in the control from 7 to 28 DAT. In contrast, the value was decreased by 9.1, 8.9, and 8.4 in FSS, SS, and FS, respectively. In 2023, SPAD value was decreased by 34.2 in the control, while it was lowered by 33.1, 30.1, and 29.4 in FSS, SS, and FS treatment, respectively (Figure 2). The changes in chlorophyll content in the SS treatment were greater in the flag leaf than in the uppermost leaf.
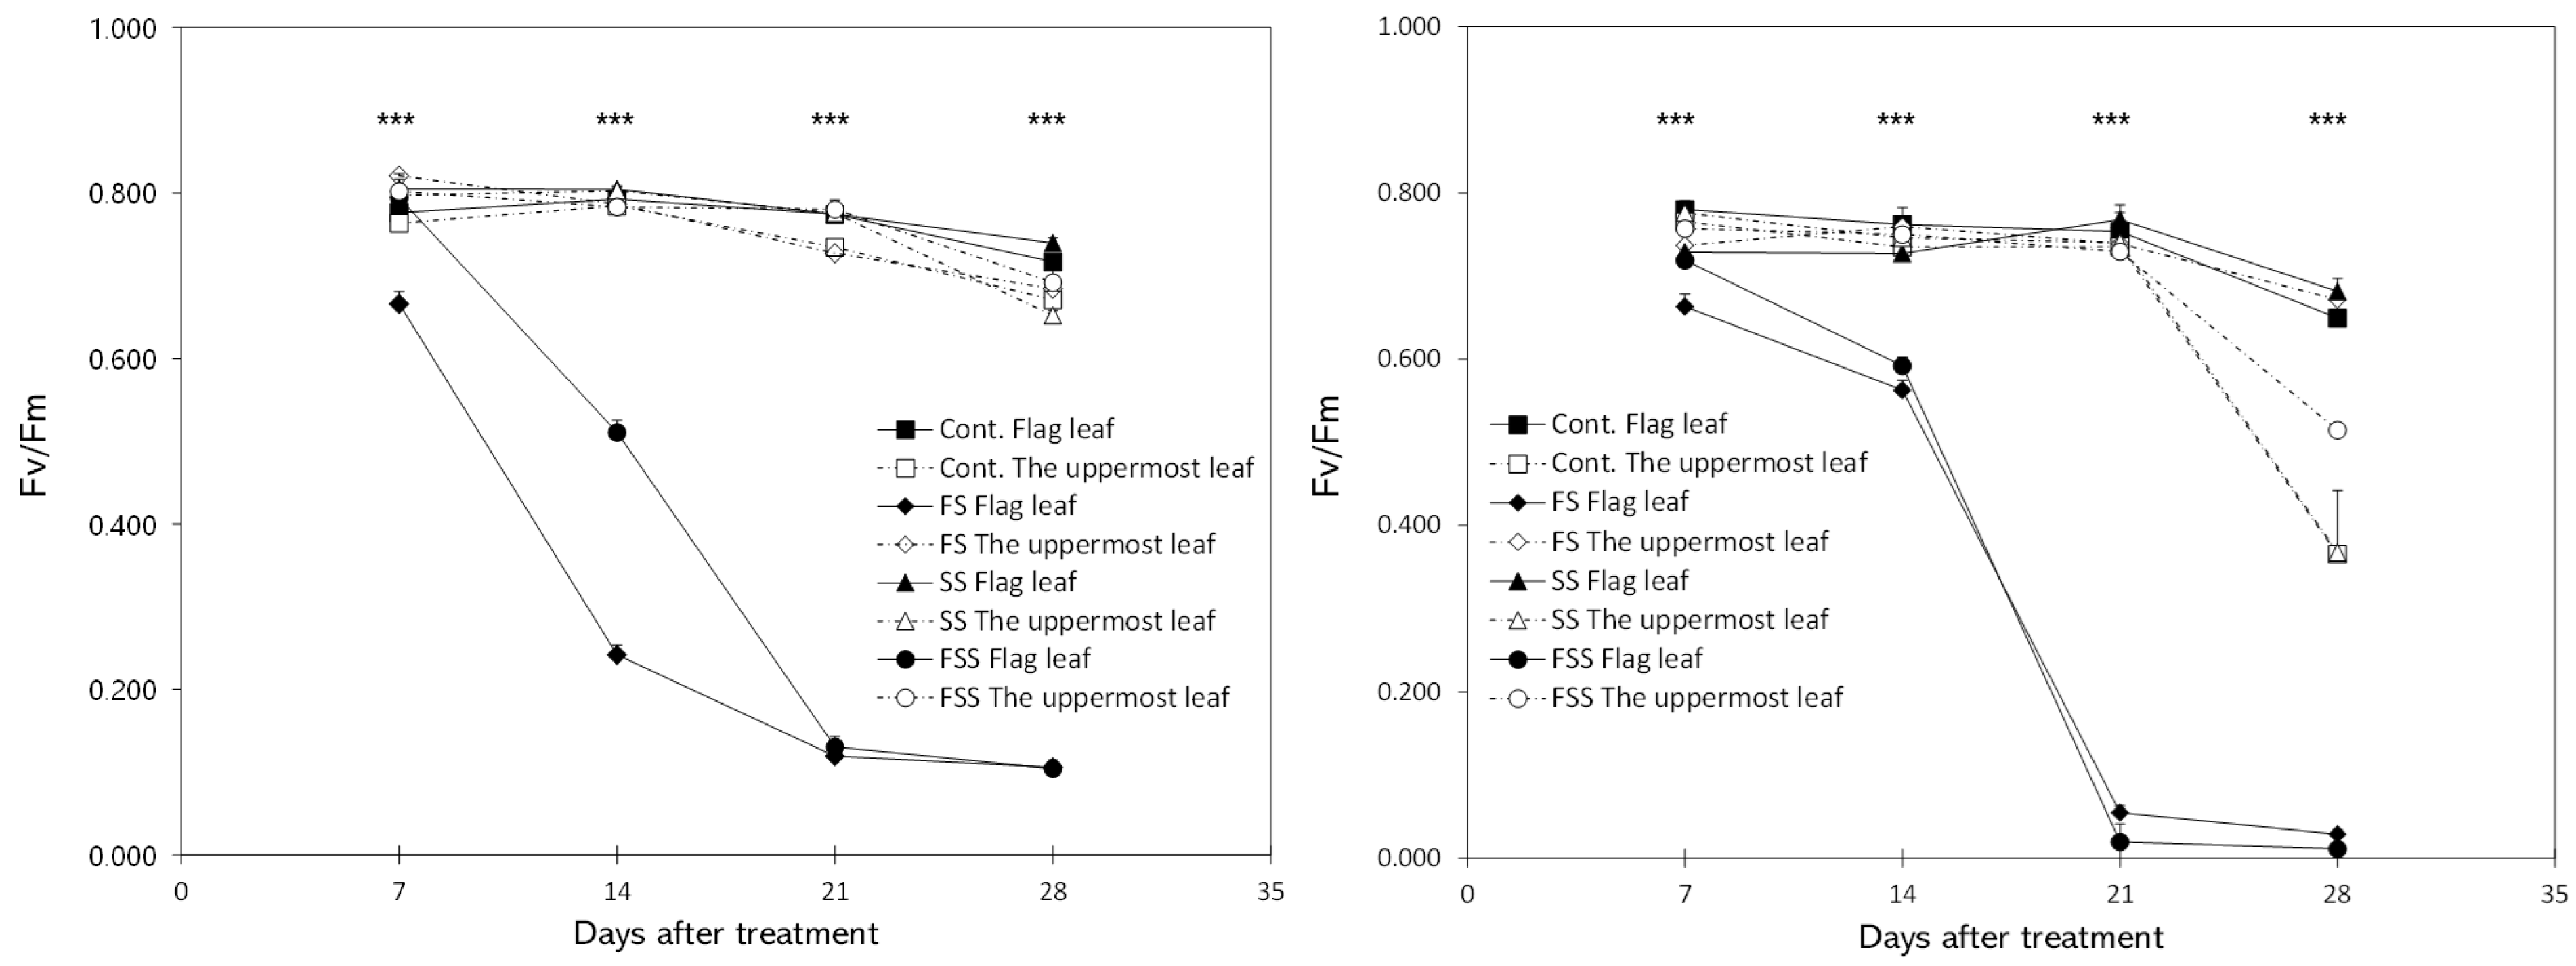
Chlorophyll fluorescence (Fv/Fm) of the flag leaf was slightly decreased by 0.059 in the control from 7 to 28 DAT in 2022. However, the Fv/Fm was dramatically lowered by 0.708 in the FSS treatment. The results from the 2022–2023 season differed; the least decrease was observed in the SS treatment, whereas the remarkable decline occurred in the FSS treatment (Figure 3). From 7 to 28 DAT, the Fv/Fm of the uppermost leaf exhibited less change compared to the flag leaf. In 2022, the control showed the least decrease (0.093), while the FS treatment showed a noticeable decline (0.145). However, in 2023, the FS treatment exhibited the most minor decrease (0.065).

3.2. Changes in Photosynthetic Rate

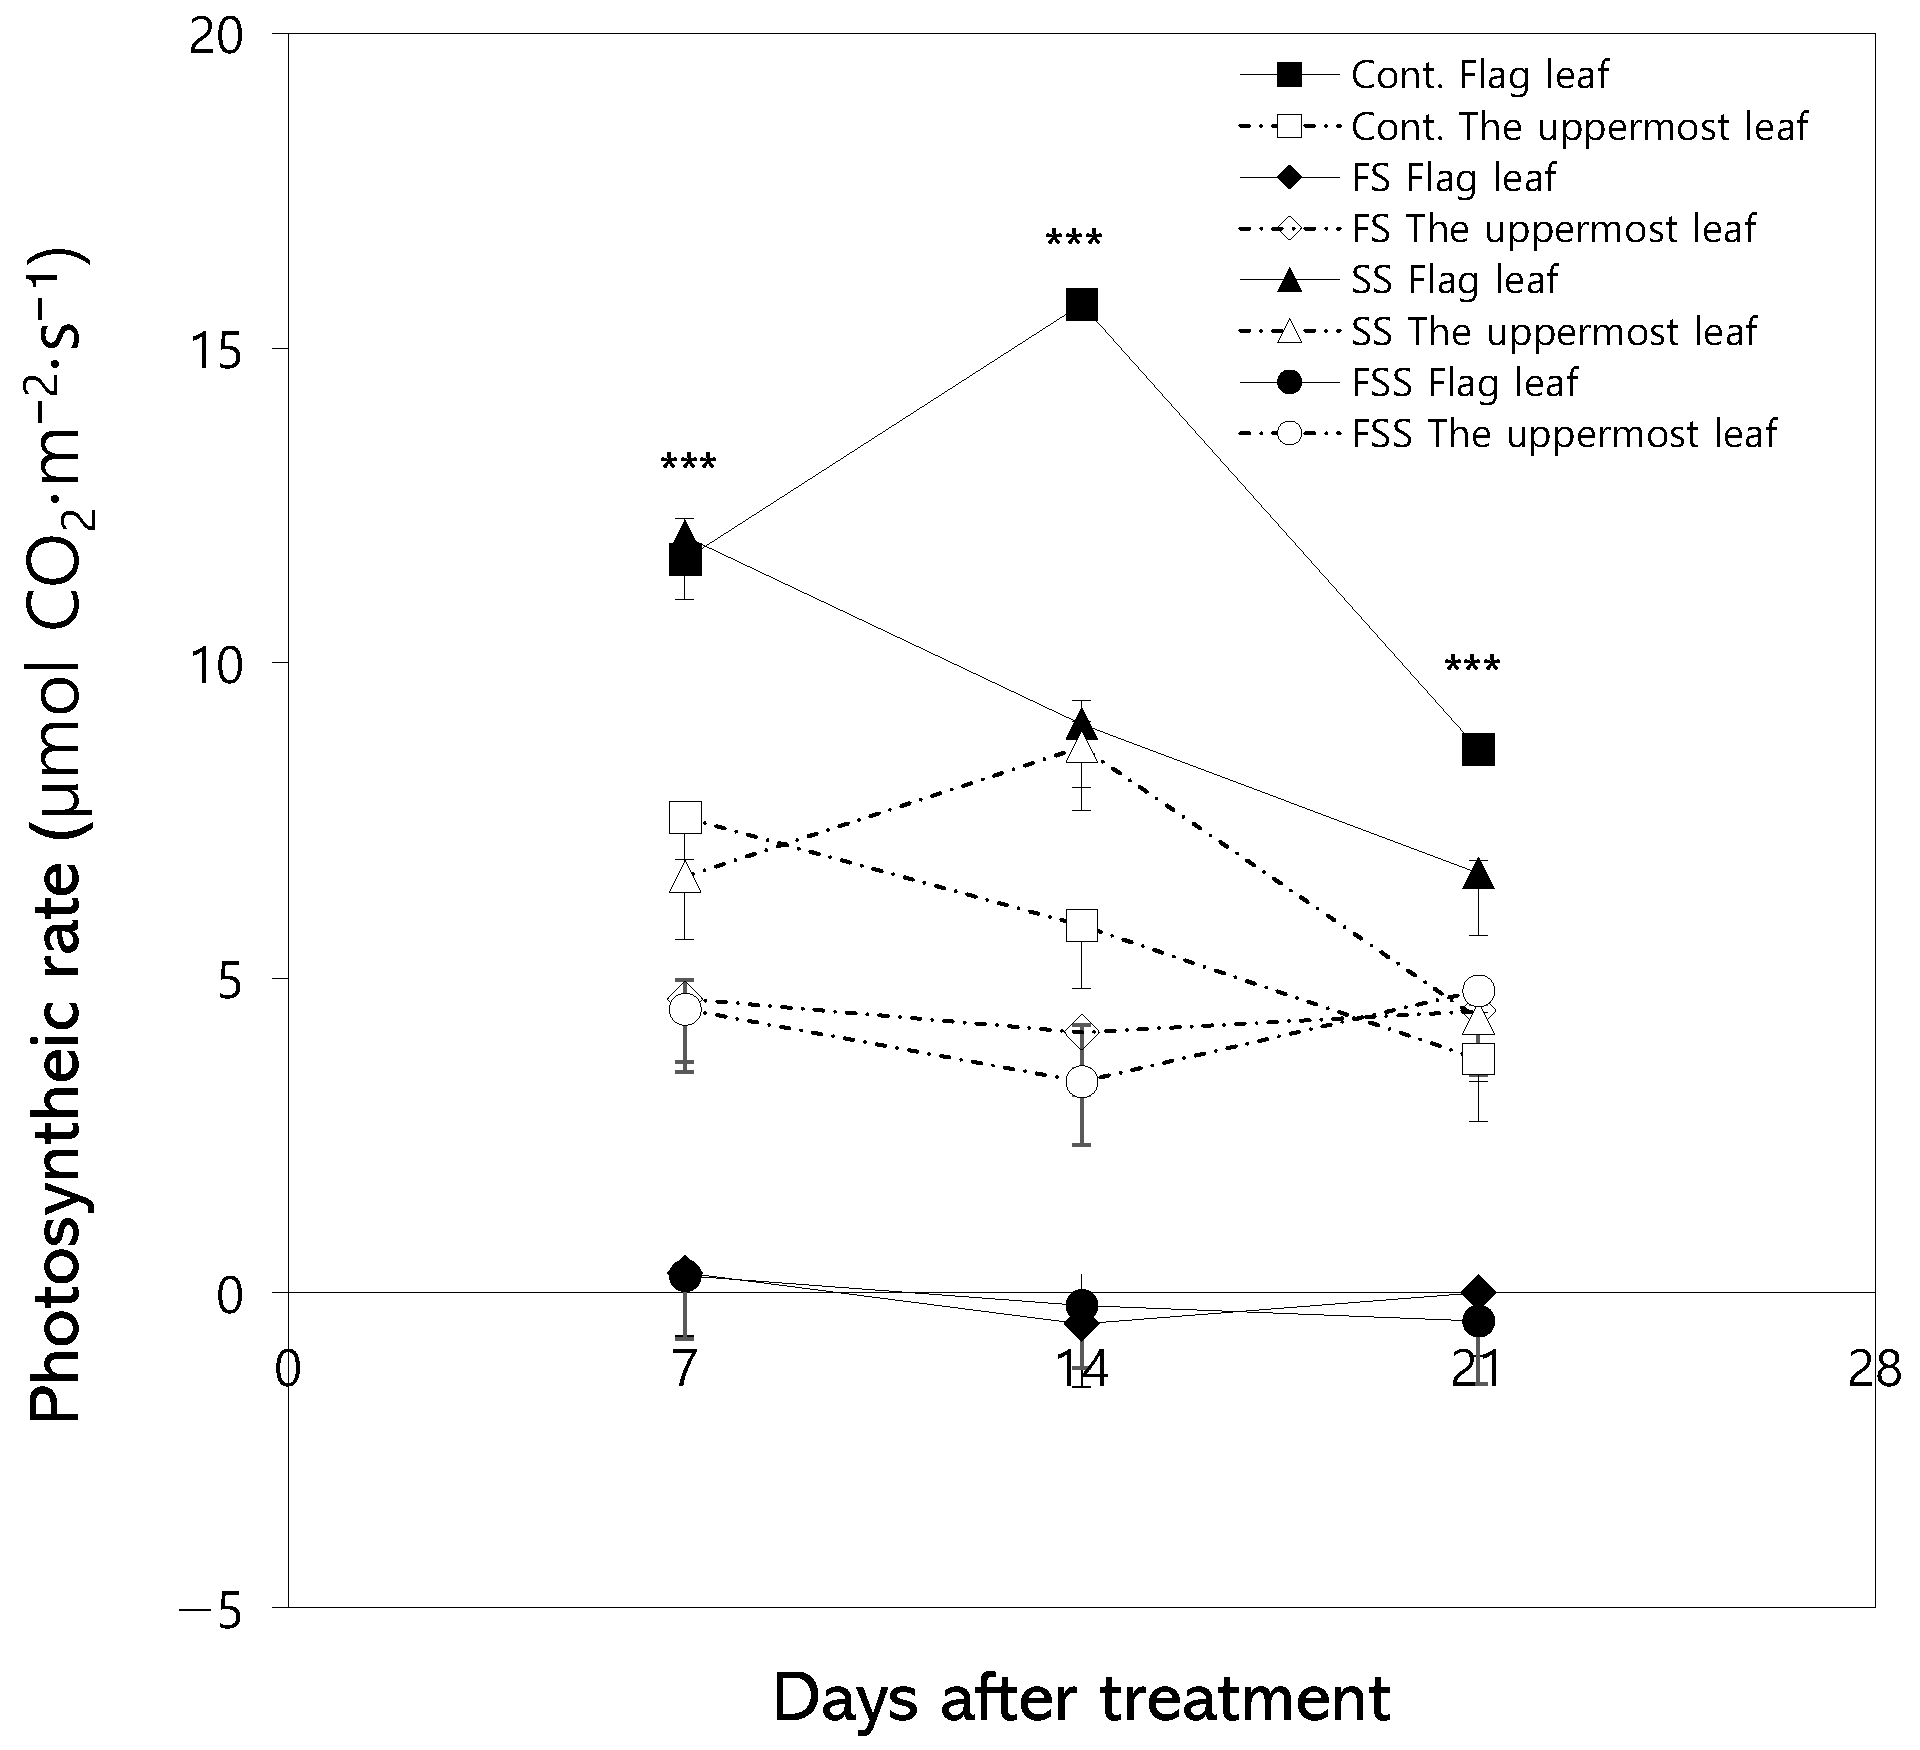
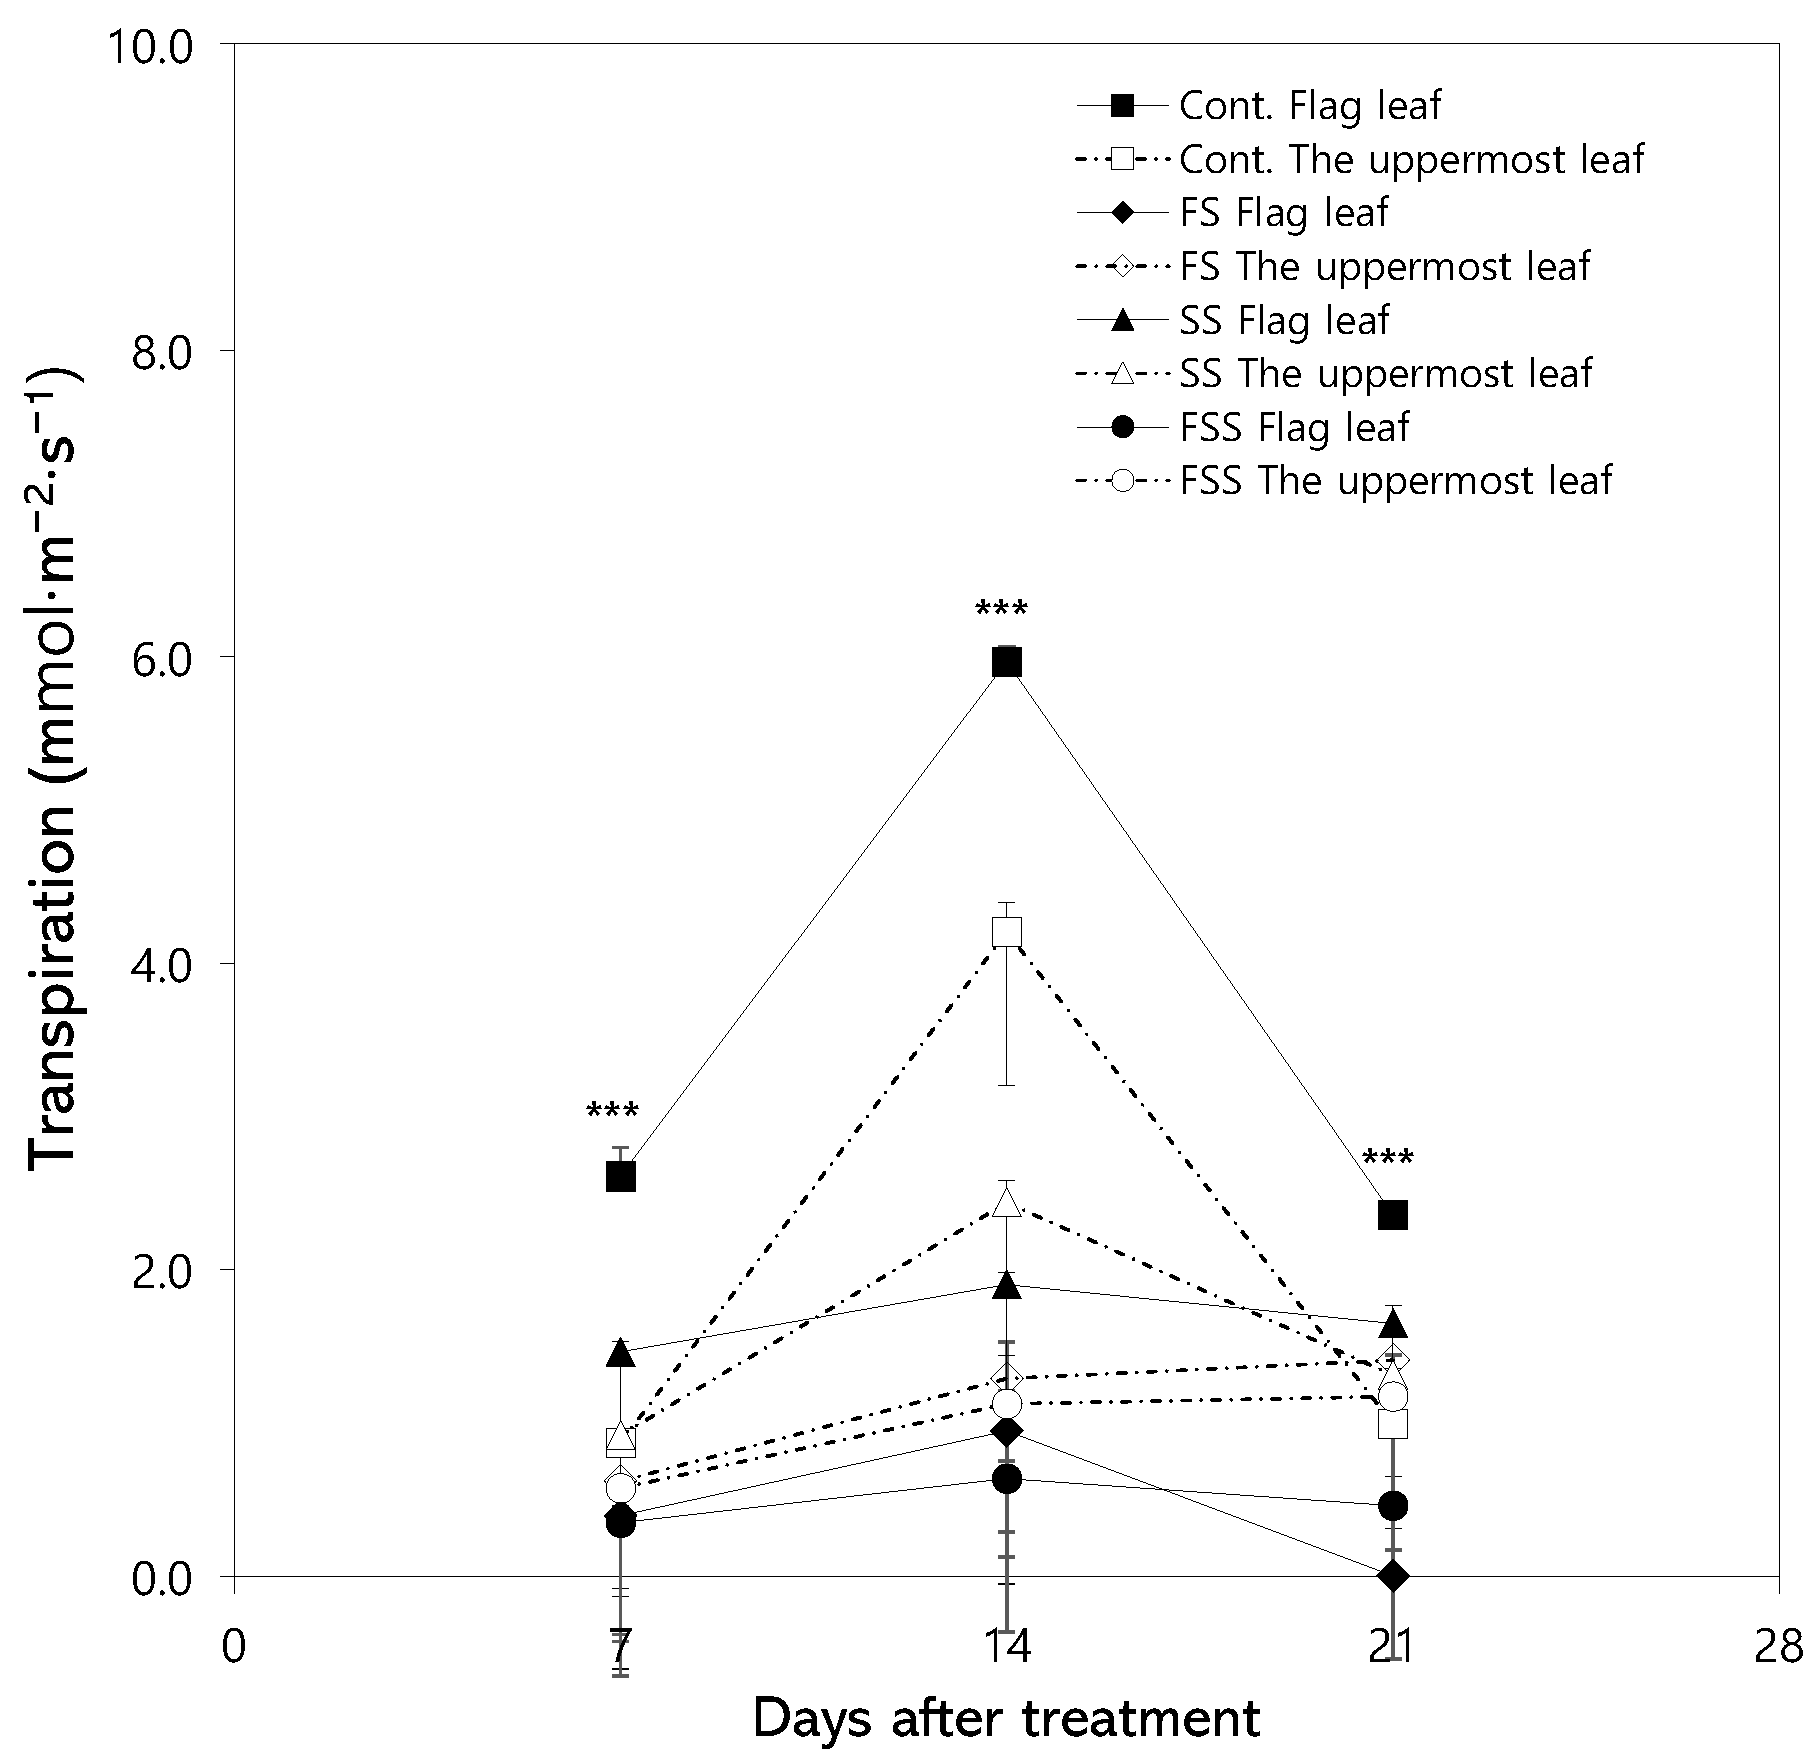
The photosynthetic rate of the flag leaf was −0.5 μmol CO2 m−2s−1 and −0.2 μmol CO2 m−2s−1 in the treatment of FS and FSS, respectively, implying the wrapping completely block the effevtive light and occurred respiration. In contrast, the photosynthetic rate of the uppermost leaf was 4.6 μmol CO2 m−2s−1 and 4.8 μmol CO2 m−2s−1, respectively, in the FS and FSS treatments at 14 DAT in 2023 (Figure 4). At 21 DAT in 2023, the transpiration rate of the flag leaf in the control was 2.7 mmol m−2s−1, which was higher than the FS and FSS treatments. However, the transpiration rate of the uppermost leaf in the control (1.0 mmol m−2s−1) was lower than that of FS (1.4 mmol m−2s−1) and FSS treatment (1.5 mmol m−2s−1) (Figure 5).
The stomatal conductance in the flag leaf and the uppermost leaf revealed that, over two years, the stomatal conductance of the flag leaf was the lowest in the FSS treatment. In contrast, the stomatal conductance of the uppermost leaf in the SS treatment was higher than that in both the FS and FSS at 14 DAT in 2022 and 2023 (Figure 6). Notably, the stomatal conductance of the uppermost leaf in the control decreased over time, whereas in the shading treatments (FS, SS, FSS), it increased as time progressed.

3.3. Temperature Changes of Spike and Flag Leaf According to Shading Treatments

Shading differed leaf temperatures in 2022 (Table 1). The spike temperature in the SS treatment was the highest at 26.5 °C at 14 DAT. Additionally, the flag leaf temperature in the FS treatment had the highest value (27.8 °C). The spike and flag leaf temperatures were lower in the control than in the other treatments (FS, SS, and FSS) at 21 DAT. The uppermost leaf temperature in the control was 0.7 °C higher than the flag leaf temperature. In contrast, in the other shading treatments, the flag leaf temperature was higher than the uppermost leaf temperature by 3.7 °C in FS, 2.6 °C in SS, and 0.8 °C in FSS.
Temperature changes induced by shading were evident in the flag leaf, with elevated temperatures observed regardless of which organ was shaded. In contrast, spike temperatures tended to be lower than those of other organs under shading treatments.

3.4. Changes in Dry Weight and Relative Growth Rate in Treatments

In 2023, the dry weight of the shoot at 35 days after treatment was the highest in the control at 3.44 g plant−1, followed by the SS treatment at 3.26 g per plant, the FS treatment at 3.17 g per plant, and the FSS treatment at 2.81 g per plant (Figure 7). The growth of the reproductive parts, such as the spike and grain, was compared based on dry weight across treatments from the seed-setting period to physiological maturity (Figure 8 and Table 2). At 35 DAT both in 2022 and 2023, the spike weight of the control was the highest at 1447 and 1972 mg, respectively, while the dry weight of the spike in the FSS treatment was the lowest at 496 and 1215 mg, respectively (Figure 8). Similarly, the grain weight of the control was high at 46.9 and 51.2 mg, respectively, whereas the dry weight of the grain in the FSS treatment was lower at 17.0 and 47.2 mg, respectively (Figure 8). The relative growth rate of the spike was highest in the control at 7.0 mg day−1 in 2022, whereas it was lowest in the FSS treatment at 6.0. The relative growth rate of glume and grain was higher in the control at 2.0 and 3.8 mg d−1, respectively, and lower in the FSS treatment at 1.6 and 2.8 mg d−1, respectively (Table 2).

3.5. Relationship Between Relative Water Content and Dry Weight of Yield Components

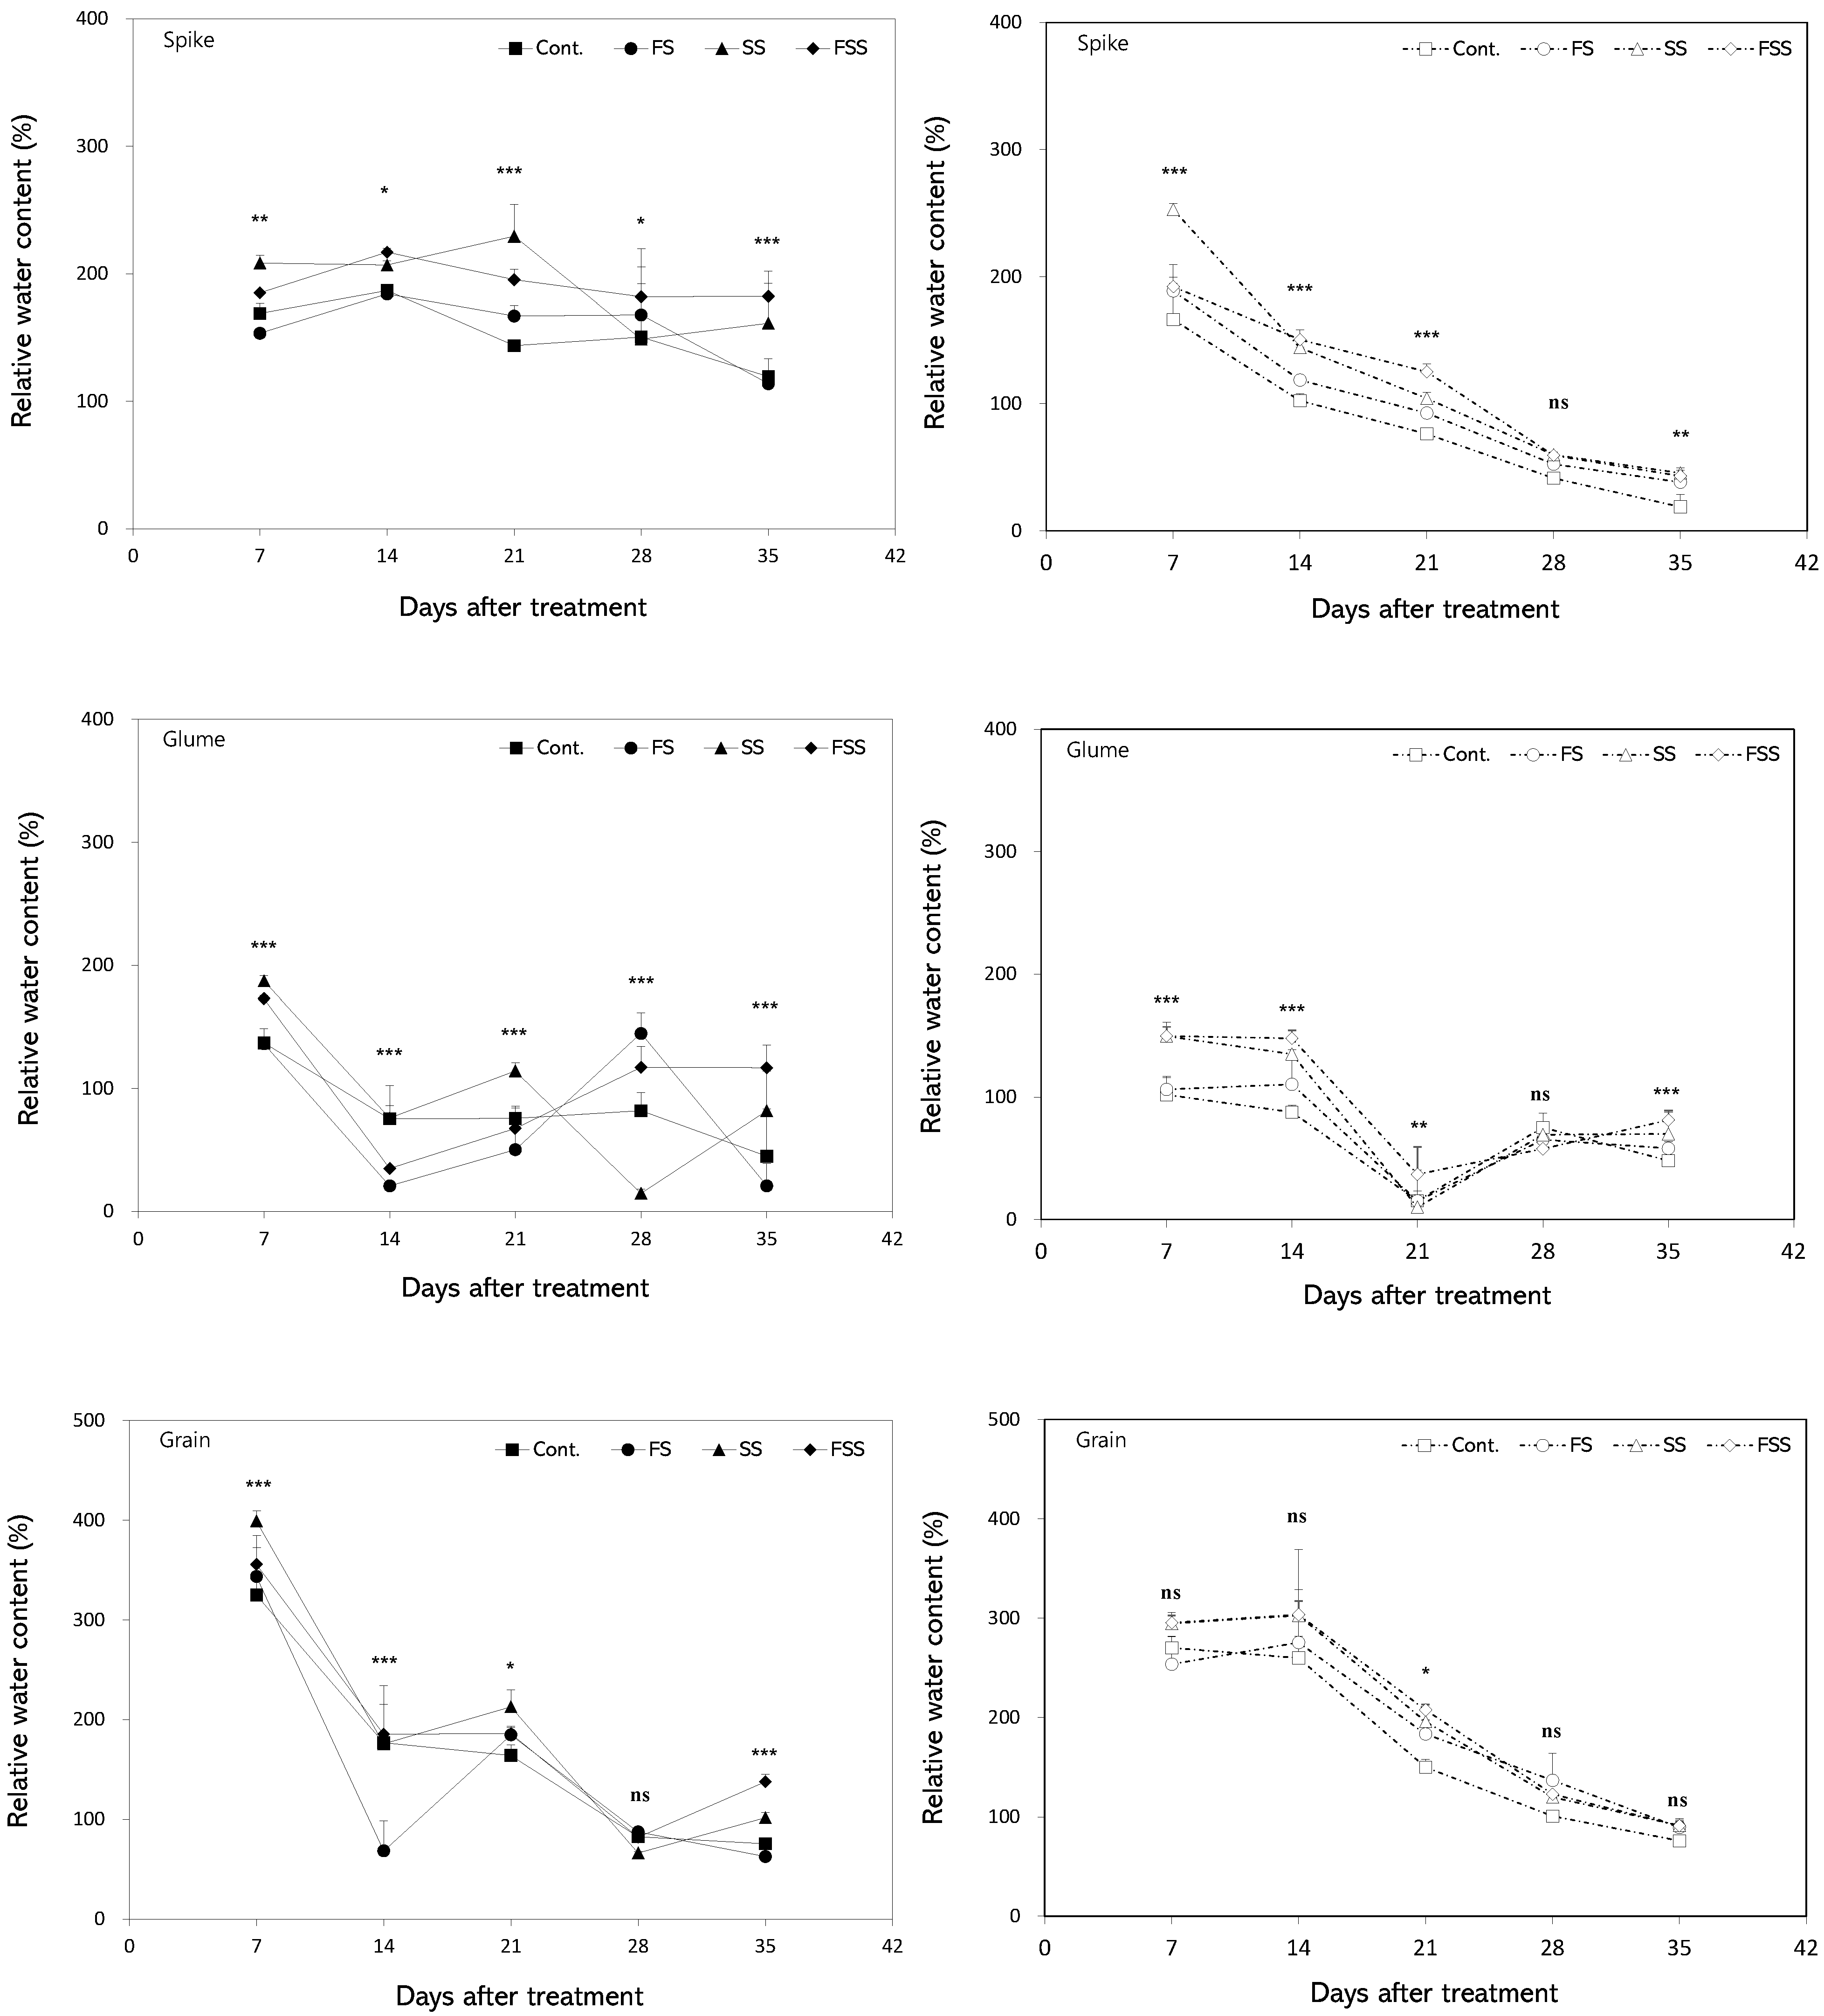
In 2022, the relative water content (RWC) of the spike at 28 DAT was 151% of dry matter in the control, 168% in the FS treatment, and 149% in the SS treatment. At 21 DAT in 2023, the RWC of spikes in the control was 76% of dry weight, while it was 93% in the FS treatment and 104% in the SS treatment. In FSS treatment, the RWC was the highest at 125%, but the spike dry weight was the lowest at 864 mg (Figure 9).
At 14 DAT in 2022, the RWC was 187% of grain dry weight in the control, while it was 184% in the FS treatment, 207% in the SS treatment, and highest at 217% in the FSS treatment. The grain dry weight was low in the SS treatment (370 mg) and the FSS treatment (376 mg). Similarly, at 14 DAT in 2023, the RWC of grains was 102% in the control, increasing to 119% in the FS treatment, 144% in the SS treatment, and 151% in the FSS treatment. However, the dry weight of grains was lowest at 663 mg in the FSS treatment (Figure 8). In 2022, at 7 DAT, the RWC of glumes in the control was 137% of dry weight, identical to that in the FS treatment. In the SS treatment, it was highest at 187%, while in the FSS treatment, it was 173%. The dry weight of glumes was 4.5 mg in the control, 4.1 mg in the FS treatment, 4.8 mg in the SS treatment, and 5.0 mg in the FSS treatment. Similarly, at 7 DAT in 2023, the RWC of glumes was 102% in the control, 106% in the FS treatment, and 150% in the FSS treatment. However, the dry weight of glumes was highest in the FSS treatment at 10.6 mg (Figure 8).

4. Discussion

4.1. Physiological Responses of Flag Leaves and the Uppermost Leaves to Shading Treatment

The chlorophyll content reflects the photosynthetic capacity to produce organic products for crop growth [24]. The SPAD value that reflects chlorophyll content responded differently to shading treatments. Therefore, we could use the value to evaluate the contribution of each organ as a source for translocation. Chlorophyll fluorescence refers to the re-emission of a portion of light energy not utilized in photochemical reactions of photosynthesis. Chlorophyll fluorescence, which indicates the photosynthetic efficiency and is closely associated with crop yield [25], showed a similar tendency to SPAD value according to shading treatments. De Simone et al. [26] and Borrill et al. [27] reported that crop varieties with delayed leaf senescence had higher chlorophyll content and photosynthetic rates after heading than ordinary wheat varieties. The flag leaf plays as the principal source contributing 40–60% of photosynthetic performance and over 40% of assimilates for grain-filling in wheat [28,29]. Therefore, the physiological activity of the flag leaf is crucial for yield determination. In this experiment, the SPAD values and chlorophyll fluorescence of the flag leaves in the FS treatment and the FSS treatment were lower than in the control in both 2022 and 2023. Considering that a decrease in chlorophyll in the flag leaf indicates senescence [30], this result appears to be due to delayed leaf senescence caused by shade (Figure 2 and Figure 3). On the 14th and 21st days of treatment, the photosynthetic rates of the flag leaves of the FS treatment and the FSS treatment revealed negative values, implying that, due to leaf senescence, the consumption of photosynthates in the flag leaf exceeds the photosynthesis in flag leaves (Figure 4). Additionally, the SPAD values and chlorophyll fluorescence of the uppermost leaves in the shading treatments were consistently higher and exhibited less decline over time than the control. These findings, which have not been previously reported, underscore the need for further research to understand better the physiological changes of flag leaves and the uppermost leaves under shading conditions.

4.2. Growth of Spikes and Grains

According to the study conducted by Rivera-Amado et al. [31], the spike positioned above the flag leaf in wheat may reduce photosynthesis in the flag leaf but significantly contributes to grain development. In both growing seasons, the SPAD values and chlorophyll fluorescence values (Fv/Fm) of the flag leaves decreased in the FS treatment due to alteration of chlorophyll synthesis caused by shading. In contrast, the uppermost leaves showed similar or higher values compared to the results of the flag leaves. The photosynthetic rate of the flag leaves was negative, whereas the photosynthetic rate of the uppermost leaves was positive. In contrast, in the SS treatment, SPAD, chlorophyll fluorescence, and photosynthetic rates were high in both the flag leaves and the uppermost leaves (Figure 2, Figure 3 and Figure 4). This result indicates that t the SS treatment can improve the photosynthesis of the flag leaf located in the highest position to enhance the role of the flag leaf as a source.
Post-flowering leaf senescence reduces viable leaf area, thereby limiting the supply of assimilates for grain growth [32,33]. In both 2022 and 2023, the spike weight in the FS treatment was lower than in the control. However, contrary to previous reports, the spike weight in the FS treatment was higher than in the SS treatment (Figure 8). Based on the SPAD value, delayed senescence of the flag leaves and uppermost leaves was observed (Figure 2). Liang et al. [34] reported that yield and photosynthesis are positively correlated, noting that the correlation was greater during the grain filling and maturity stages than at the heading stage. In our experiment, flag leaf shading at the heading stage did not significantly affect grain growth, as the uppermost leaves likely assumed the role of source from the senescent flag leaves. Furthermore, Maydup et al. [35] suggested that spikes act as a buffering agent against damage in ordinary source–sink relations when the supply of assimilates is constrained. Our findings indicated that while the FS treatment restricted photosynthate production in the flag leaves, the spikes compensated as a buffering agent for the source–sink relationships.
In contrast, the FS treatment did not significantly limit photosynthate production. However, the inadequate function of the sink likely hindered proper nutrient translocation to the spikes. Additionally, the glume weight was higher in the FS treatment than in the SS treatment in 2022 and 2023 (Figure 8). In the 2023 experiment, the stem dry weight was highest in the unshaded control, followed by the SS treatment, which reflects poor remobilization from flag leaves to spike via the stem. In wheat, shading increases chlorophyll content, thereby enhancing light absorption capacity and improving light-use efficiency to compensate for the effects of low light [36,37]. Therefore, it can be deduced that the unshaded organs enhance photosynthetic production and sustain production activity for a longer period as a compensatory mechanism in this study.

4.3. Relationship Between Reproductive Organ Growth and the Uppermost Leaves

Among the vegetative organs of wheat, the flag leaf is the last to develop and is widely recognized as a key source of photo-assimilates for grain growth [38,39,40]. While extensive research has been conducted on the role of the flag leaf in grain growth, studies specifically examining the uppermost leaf positioned below the flag leaf remain scarce. In this study, we investigated the physiological changes of the uppermost leaves resulting from flag leaf shading in 2022 and 2023. Notably, the highest stomatal conductance in the uppermost leaves was observed in the unshaded treatment, followed by the spike shading treatment (Figure 6).
The drastic decrease in transpiration rate under FS and FSS treatments suggests that transpiration effectively reflects the plant’s response to shading, even though its pattern closely resembles that of the photosynthetic rate. The differential responses of plant organs to shading may result from compensatory mechanisms regulated by altered cellular conditions, including changes in sugar content, chlorophyll concentration, and hormone levels [41]. Since changes in source activity during senescence under adverse conditions are critical for improving grain yield, further research is needed to identify the key factors regulating source leaf activity.
At 21 days after treatment, the relative water content of the spikes was higher in the spike shading treatment than in the flag leaf shading treatment, but the spike weight was higher in the flag leaf shading treatment than in the spike shading treatment. Because the water content decreases after the mid-stage of grain filling [42], the higher water content means that the grain accumulates nutrients and has more time until the end of grain filling. Considering that maintaining high water use efficiency and photosynthesis rates during grain filling is a crucial function of the spikes [18], this suggests that the higher water content at 21 DAT in the spike treated by the spike shading might closely linked to higher photosynthesis. Regarding crop water relations, spike shading increases the relative water content of the spikes. Considering that senescence leads to a decline in RWC, the higher RWC observed in shaded spikes—despite an overall decrease in RWC across all organs over time—is likely attributed to sustained cellular water retention resulting from delayed senescence, rather than increased water uptake or reduced water loss [43]. Although this does not lead to an increase in grain dry weight or spike dry weight [44,45], it may contribute to lessening the adverse influence of shading.

4.4. Temperature Changes in Spikes, Flag Leaves, and the Uppermost Leaves Due to Shading Treatment

Photosynthesis is affected by temperature in plants. The photosynthetic rate varies significantly over a wide range of 10–35 °C in temperate grasses. However, exposure to temperatures outside this range can cause irreversible damage to the photosynthetic system. In 2022, the leaf temperature was higher in the flag leaf than in other organs in the shading treatments, but lower than the uppermost leaf in the control at 28 DAT (Table 1). The higher flag leaf temperature over the favorable temperature is related to the lowered photosynthetic rate by shading treatments (Figure 4) because within a favorable temperature range, photosynthesis increases with leaf temperature, and stomatal conductance follows a similar trend [46]. Stomatal conductance also plays a critical role in the temperature response of photosynthesis due to its effect on the CO2 levels within the stomata [47]. In this study, the stomatal conductance of the uppermost leaves was higher in the shading treatments than in the control at 21 DAT. Notably, in the FS and FSS treatments, the stomatal conductance of the uppermost leaf was higher than that of the flag leaf (Figure 6). The results that the temperature of the uppermost leaf was lower in the FS treatment and the SS treatment, and similar in the FSS treatment, suggest that the uppermost leaf treated with no shading could strengthen the photosynthesis to compensate for the lowered photosynthesis in other organs by shading.
Although there is some notice that spike-shading applied to measure photosynthesis in spikes during the grain filling stage alters spike temperature [48], the spike shading increased the temperature of each organ very slightly. According to Wardlaw and Wrigley [49], the grain weight of wheat decreases by 3–5% for every 1 °C rise above 15 °C during the grain filling stage. This report is similar to our results, where the spike temperature in the SS and FSS treatments was higher than the control at 28 DAT in 2022 (Table 1). High temperatures are known to inhibit seed growth by reducing photosynthesis, accelerating senescence, and suppressing starch accumulation [50]. Therefore, in this study, it is assumed that shading-induced senescence and the consequent reduction in photosynthesis contributed to inhibited seed growth.

5. Conclusions

Shading the flag leaves increased chlorophyll content and chlorophyll fluorescence in the uppermost leaves, maintaining a relatively high photosynthetic rate during grain filling because the uppermost leaves continued to serve as a source. Spikes showed enhanced functioning as a source when the decline in the function of a flag leaf was caused by shading. Further research is needed to more precisely examine the effects of shading on different wheat organs by analyzing changes in stored nutrient content and physiological activity after heading. Our research results can serve as fundamental data for breeding programs and management practices aimed at improving radiation-use efficiency through optimized canopy architecture and regulating the appropriate longevity of individual organs in wheat.

Author Contributions

Conceptualization, K.S. and S.S.; methodology, K.S., S.H. and S.S.; software, K.S. and S.H.; validation, K.S. and S.H.; formal analysis, K.S. and S.H.; investigation, K.S.; writing—original draft preparation, K.S. and S.H.; writing—review and editing, S.S.; visualization, K.S. and S.H.; supervision, S.S.; funding acquisition, K.S. and S.S. All authors have read and agreed to the published version of the manuscript.

Funding

This research was financially supported by the Rural Development Administration (RDA), Korea, with the program “Research Program for Agricultural Science & Technology, Project No. RS-2025-02215554”.

Data Availability Statement

The original contributions presented in this study are included in the article. Further inquiries can be directed at the corresponding author.

Acknowledgments

We thank Dongjin Park from Gyeongsang National University for field experiment management.

Conflicts of Interest

The authors declare no conflicts of interest.

References

  1. Blum, A. Improving wheat grain filling under stress by stem reserve mobilisation. Euphytica 1998, 100, 77–83. [Google Scholar] [CrossRef]
  2. Foulkes, M.J.; Sylvester-Bradley, R.; Weightman, R.; Snape, J.W. Identifying physiological traits associated with improved drought resistance in winter wheat. Field Crops Res. 2007, 103, 11–24. [Google Scholar] [CrossRef]
  3. Molero, G.; Reynolds, M.P. Spike photosynthesis measured at high throughput indicates genetic variation independent of flag leaf photosynthesis. Field Crops Res. 2020, 255, 107866. [Google Scholar] [CrossRef]
  4. Zhang, M.; Gao, Y.; Zhang, Y.; Fischer, T.; Zhao, Z.; Zhou, X.; Wang, Z.; Wang, E. The contribution of spike photosynthesis to wheat yield needs to be considered in process-based crop models. Field Crops Res. 2020, 257, 107931. [Google Scholar] [CrossRef]
  5. Racz, I.; Hirişcău, D.; Berindean, I.; Kadar, R.; Muntean, E.; Tritean, N.; Russu, F.; Ona, A.; Muntean, L. The influence of flag leaf removal and its characteristics on main yield components and yield quality indices on wheat. Agronomy 2022, 12, 2545. [Google Scholar] [CrossRef]
  6. Ibrahim, H.A.; Elenein, R.A. The relative contribution of different wheat leaves and awns to the grain yield and its protein content. Z. Acker Pflanzenbau 1977, 144, 1–77. [Google Scholar]
  7. Evans, L.T.; Wardlaw, I.F. Wheat. In Photoassimilate Distribution in Plants and Crops: Source—Sink Relationships; Zamski, E., Schaffer, A.A., Eds.; Marcel Dekker, Inc.: New York, NY, USA, 1996; pp. 501–518. [Google Scholar]
  8. Briggs, K.; Aytenfisu, A. Relationships between morphological characters above the flag leaf node and grain yield in spring wheats. Crop Sci. 1980, 20, 350–354. [Google Scholar] [CrossRef]
  9. Birsin, M.A. Effects of removal of some photosynthetic structures on some yield components in wheat. Tarim. Bilim. Derg. 2005, 11, 364–367. [Google Scholar]
  10. Kramer, T.; Didden, F.A.M. The influence of awns on grain yield and kernel weight in spring wheat (Triticum aestivum L.). Cereal Res. Commun. 1981, 9, 25–30. [Google Scholar]
  11. Kichey, T.; Hirel, B.; Heumez, E.; Dubois, F.; Le Gouis, J. In winter wheat (Triticum aestivum L.), post-anthesis nitrogen uptake and remobilisation to the grain correlates with agronomic traits and nitrogen physiological markers. Field Crops Res. 2007, 102, 22–32. [Google Scholar] [CrossRef]
  12. Gaju, O.; Allard, V.; Martre, P.; Snape, J.W.; Heumez, E.; LeGouis, J.; Moreau, D.; Bogard, M.; Griffiths, S.; Orford, S.; et al. Identification of traits to improve the nitrogen-use efficiency of wheat genotypes. Field Crops Res. 2011, 123, 139–152. [Google Scholar] [CrossRef]
  13. Bort, J.; Febrero, A.; Amaro, T.; Araus, J.L. Role of awns in ear water-use efficiency and grain weight in barley. Agronomie 1994, 14, 133–139. [Google Scholar] [CrossRef]
  14. Gebbing, T.; Schnyder, H. 13C labeling kinetics of sucrose in glumes indicates significant refixation of respiratory CO2 in the wheat ear. Funct. Plant Biol. 2001, 28, 1047–1053. [Google Scholar] [CrossRef]
  15. Lopes, M.S.; Cortadellas, N.; Kichey, T.; Dubois, F.; Habash, D.Z.; Araus, J.L. Wheat nitrogen metabolism during grain filling: Comparative role of glumes and the flag leaf. Planta 2006, 225, 165–181. [Google Scholar] [CrossRef]
  16. Aranjuelo, I.; Cabrera-Bosquet, L.; Morcuende, R.; Avice, J.C.; Nogués, S.; Araus, J.L.; Martínez-Carrasco, R.; Pérez, P. Does ear C sink strength contribute to overcoming photosynthetic acclimation of wheat plants exposed to elevated CO2? J. Exp. Bot. 2011, 62, 3957–3969. [Google Scholar] [CrossRef]
  17. Sanchez-Bragado, R.; Molero, G.; Reynolds, M.P.; Araus, J.L. Relative contribution of shoot and ear photosynthesis to grain filling in wheat under good agronomical conditions assessed by differential organ δ13C. J. Exp. Bot. 2014, 65, 5401–5413. [Google Scholar] [CrossRef]
  18. Zhu, C.; Zhu, J.; Zeng, Q.; Liu, G.; Xie, Z.; Tang, H.; Cao, J.; Zhao, X. Elevated CO2 accelerates flag leaf senescence in wheat due to ear photosynthesis which causes greater ear nitrogen sink capacity and ear carbon sink limitation. Funct. Plant Biol. 2009, 36, 291–299. [Google Scholar] [CrossRef]
  19. Kong, L.; Sun, M.; Xie, Y.; Wang, F.; Zhao, Z. Photochemical and antioxidative responses of the glume and flag leaf to seasonal senescence in wheat. Front. Plant Sci. 2015, 6, 358. [Google Scholar] [CrossRef]
  20. Zhou, B.; Sanz-Sáez, Á.; Elazab, A.; Shen, T.; Sánchez-Bragado, R.; Bort, J.; Serret, M.D.; Araus, J.L. Physiological traits contributed to the recent increase in yield potential of winter wheat from Henan Province, China. J. Integr. Plant Biol. 2014, 56, 492–504. [Google Scholar] [CrossRef]
  21. Serrago, R.A.; Alzueta, I.; Savin, R.; Slafer, G.A. Understanding grain yield responses to source–sink ratios during grain filling in wheat and barley under contrasting environments. Field Crops Res. 2013, 150, 42–51. [Google Scholar] [CrossRef]
  22. Stamp, P.; Herzog, H. Flag-leaf senescence and grain growth in certain German varieties of spring wheat (Triticum aestivum L.). Z. Pflanzenzuechtung 1976, 77, 330–338. [Google Scholar]
  23. Gámez, A.L.; Vicente, R.; Sanchez-Bragado, R.; Jauregui, I.; Morcuende, R.; Goicoechea, N.; Aranjuelo, I. Differential flag leaf and ear photosynthetic performance under elevated (CO2) conditions during grain filling period in durum wheat. Front. Plant. Sci. 2020, 11, 587958. [Google Scholar] [CrossRef]
  24. Barutcular, C.; Yildirim, M.; Koc, M.; Dizlek, H.; Akinci, C.; El Sabagh, A.; Saneoka, H.; Ueda, A.; Islam, M.; Toptas, I.; et al. Quality traits performance of bread wheat genotypes under drought and heat stress conditions. Fresenius Environ. Bull. 2016, 25, 6159–6165. [Google Scholar]
  25. Araus, J.L.; Alegre, L.; Tapia, L.; Calafell, R. Relationship between leaf structure and gas exchange in wheat leaves at different insertion levels. J. Exp. Bot. 1986, 37, 1323–1333. [Google Scholar] [CrossRef]
  26. De Simone, V.; Soccio, M.; Borrelli, G.M.; Pastore, D.; Trono, D. Stay-green trait-antioxidant status interrelationship in durum wheat (Triticum durum) flag leaf during post-flowering. J. Plant Res. 2014, 127, 159–171. [Google Scholar] [CrossRef]
  27. Borrill, P.; Fahy, B.; Smith, A.M.; Uauy, C. Wheat grain filling is limited by grain filling capacity rather than the duration of flag leaf photosynthesis: A case study using NAM RNAi plants. PLoS ONE 2015, 10, e0134947. [Google Scholar] [CrossRef]
  28. Ba, Q.; Zhang, L.; Chen, S.; Li, G.; Wang, W. Effects of foliar application of magnesium sulfate on photosynthetic characteristics, dry matter accumulation and its translocation, and carbohydrate metabolism in grain during wheat grain filling. Cereal Res. Commun. 2020, 48, 157–163. [Google Scholar] [CrossRef]
  29. Du, B.; Wu, J.; Islam, M.S.; Sun, C.; Lu, B.; Wei, P.; Liu, D.; Chen, C. Genome-wide meta-analysis of QTL for morphological related traits of flag leaf in bread wheat. PLoS ONE 2022, 17, e0276602. [Google Scholar] [CrossRef]
  30. Zhang, C.J.; Chen, G.X.; Gao, X.X.; Chu, C.J. Photosynthetic decline in flag leaves of two field-grown spring wheat cultivars with different senescence properties. S. Afr. J. Bot. 2006, 72, 15–23. [Google Scholar] [CrossRef]
  31. Rivera-Amado, C.; Molero, G.; Trujillo-Negrellos, E.; Reynolds, M.; Foulkes, J. Estimating organ contribution to grain filling and potential for source upregulation in wheat cultivars with a contrasting source–sink balance. Agronomy 2020, 10, 1527. [Google Scholar] [CrossRef]
  32. Estrada-Campuzano, G.; Slafer, G.A.; Miralles, D.J. Differences in yield, biomass and their components between triticale and wheat grown under contrasting water and nitrogen environments. Field Crops Res. 2012, 128, 167–179. [Google Scholar] [CrossRef]
  33. Xue, Q.; Zhu, Z.; Musick, J.T.; Stewart, B.A.; Dusek, D.A. Physiological mechanisms contributing to the increased water-use efficiency in winter wheat under deficit irrigation. J. Plant Physiol. 2006, 163, 154–164. [Google Scholar] [CrossRef] [PubMed]
  34. Liang, X.; Liu, Y.; Chen, J.; Adams, C. Late-season photosynthetic rate and senescence were associated with grain yield in winter wheat of diverse origins. J. Agron. Crop Sci. 2018, 204, 1–12. [Google Scholar] [CrossRef]
  35. Maydup, M.L.; Antonietta, M.; Guiamet, J.J.; Graciano, C.; López, J.R.; Tambussi, E.A. The contribution of ear photosynthesis to grain filling in bread wheat (Triticum aestivum L.). Field Crops Res. 2010, 119, 48–58. [Google Scholar] [CrossRef]
  36. Li, H.; Jiang, D.; Wollenweber, B.; Dai, T.; Cao, W. Effects of shading on morphology, physiology and grain yield of winter wheat. Eur. J. Agron. 2010, 33, 267–275. [Google Scholar] [CrossRef]
  37. Pires, S.N.; Souza, F.R.d.; Silva, B.E.P.; Fagundes, N.d.S.; Lucho, S.R.; Avila, L.A.d.; Deuner, S. Effects of shading on Metabolism and Grain Yield of Irrigated Rice During Crop Development. Plants 2025, 14, 2491. [Google Scholar] [CrossRef]
  38. Cabrera-Bosquet, L.; Albrizio, R.; Araus, J.L.; Nogués, S. Photosynthetic capacity of field-grown durum wheat under different N availabilities: A comparative study from leaf to canopy. Environ. Exp. Bot. 2009, 67, 145–152. [Google Scholar] [CrossRef]
  39. Naruoka, Y.; Sherman, J.D.; Lanning, S.P.; Blake, N.K.; Martin, J.M.; Talbert, L.E. Genetic analysis of green leaf duration in spring wheat. Crop Sci. 2012, 52, 99–109. [Google Scholar] [CrossRef]
  40. Spano, G.; Di Fonzo, N.; Perrotta, C.; Platani, C.; Ronga, G.; Lawlor, D.W.; Napier, J.A.; Shewry, P.R. Physiological characterization of ‘stay green’ mutants in durum wheat. J. Exp. Bot. 2003, 54, 1415–1420. [Google Scholar] [CrossRef]
  41. Xie, A.; Lv, M.; Zhang, D.; Shi, Y.; Yang, L.; Yang, X.; Du, J.; Sun, L.; Sun, X. Effects of slight shading in summer on the leaf senescence and endogenous hormone and polyamine contents in herbaceous peony. Sci. Rep. 2023, 13, 18714. [Google Scholar] [CrossRef]
  42. Xie, Q.; Mayes, S.; Sparkes, D.L. Carpel size, grain filling, and morphology determine individual grain weight in wheat. J. Exp. Bot. 2015, 66, 6715–6730. [Google Scholar] [CrossRef]
  43. Yang, K.; Sun, H.; Liu, M.; Zhu, L.; Zhang, K.; Zhang, Y.; Li, A.; Zhang, H.; Zhu, J.; Liu, X.; et al. Morphological and physiological mechanisms of melatonin on delaying drought-induced leaf senescence in cotton. Int. J. Mol. Sci. 2023, 24, 7269. [Google Scholar] [CrossRef]
  44. Ding, H.; Liu, D.; Liu, X.; Li, Y.; Kang, J.; Lv, J.; Wang, G. Photosynthetic and stomatal traits of spike and flag leaf of winter wheat (Triticum aestivum L.) under water deficit. Photosynthetica 2018, 56, 687–697. [Google Scholar] [CrossRef]
  45. Zeng, H.G.; Yi, K.; Yang, S.F.; Jiang, Y.W.; Mao, P.S.; Yu, Y.; Feng, Y.; Dong, Y.X.; Dou, L.; Li, M.L. Photosynthetic performance of glumes of oat spikelets is more stable for grain-filling stage under drought stress. Plant Physiol. Biochem. 2024, 214, 108890. [Google Scholar] [CrossRef]
  46. Ye, M.; Zhang, Z.; Huang, G.; Li, Y. Leaf photosynthesis and its temperature response are different between growth stages and N supplies in rice plants. Int. J. Mol. Sci. 2022, 23, 3885. [Google Scholar] [CrossRef]
  47. Berry, J.; Björkman, O. Photosynthetic response and adaption to temperature in higher plants. Annu. Rev. Plant Physiol. 1980, 31, 491–543. [Google Scholar] [CrossRef]
  48. Araus, J.L.; Brown, H.R.; Febrero, A.; Bort, J.; Serret, M.D. Ear photosynthesis, carbon isotope discrimination and the contribution of respiratory CO2 to differences in grain mass in durum wheat. Plant Cell Environ. 1993, 16, 383–392. [Google Scholar] [CrossRef]
  49. Wardlaw, I.F.; Wrigley, C.W. Heat tolerance in temperate cereals: An overview. Aust. J. Plant Physiol. 1994, 21, 695–703. [Google Scholar] [CrossRef]
  50. Shrestha, S.; Mahat, J.; Shrestha, J.; Madhav, K.C.; Paudel, K. Influence of high-temperature stress on rice growth and development. A review. Heliyon 2022, 8, e12651. [Google Scholar] [CrossRef]
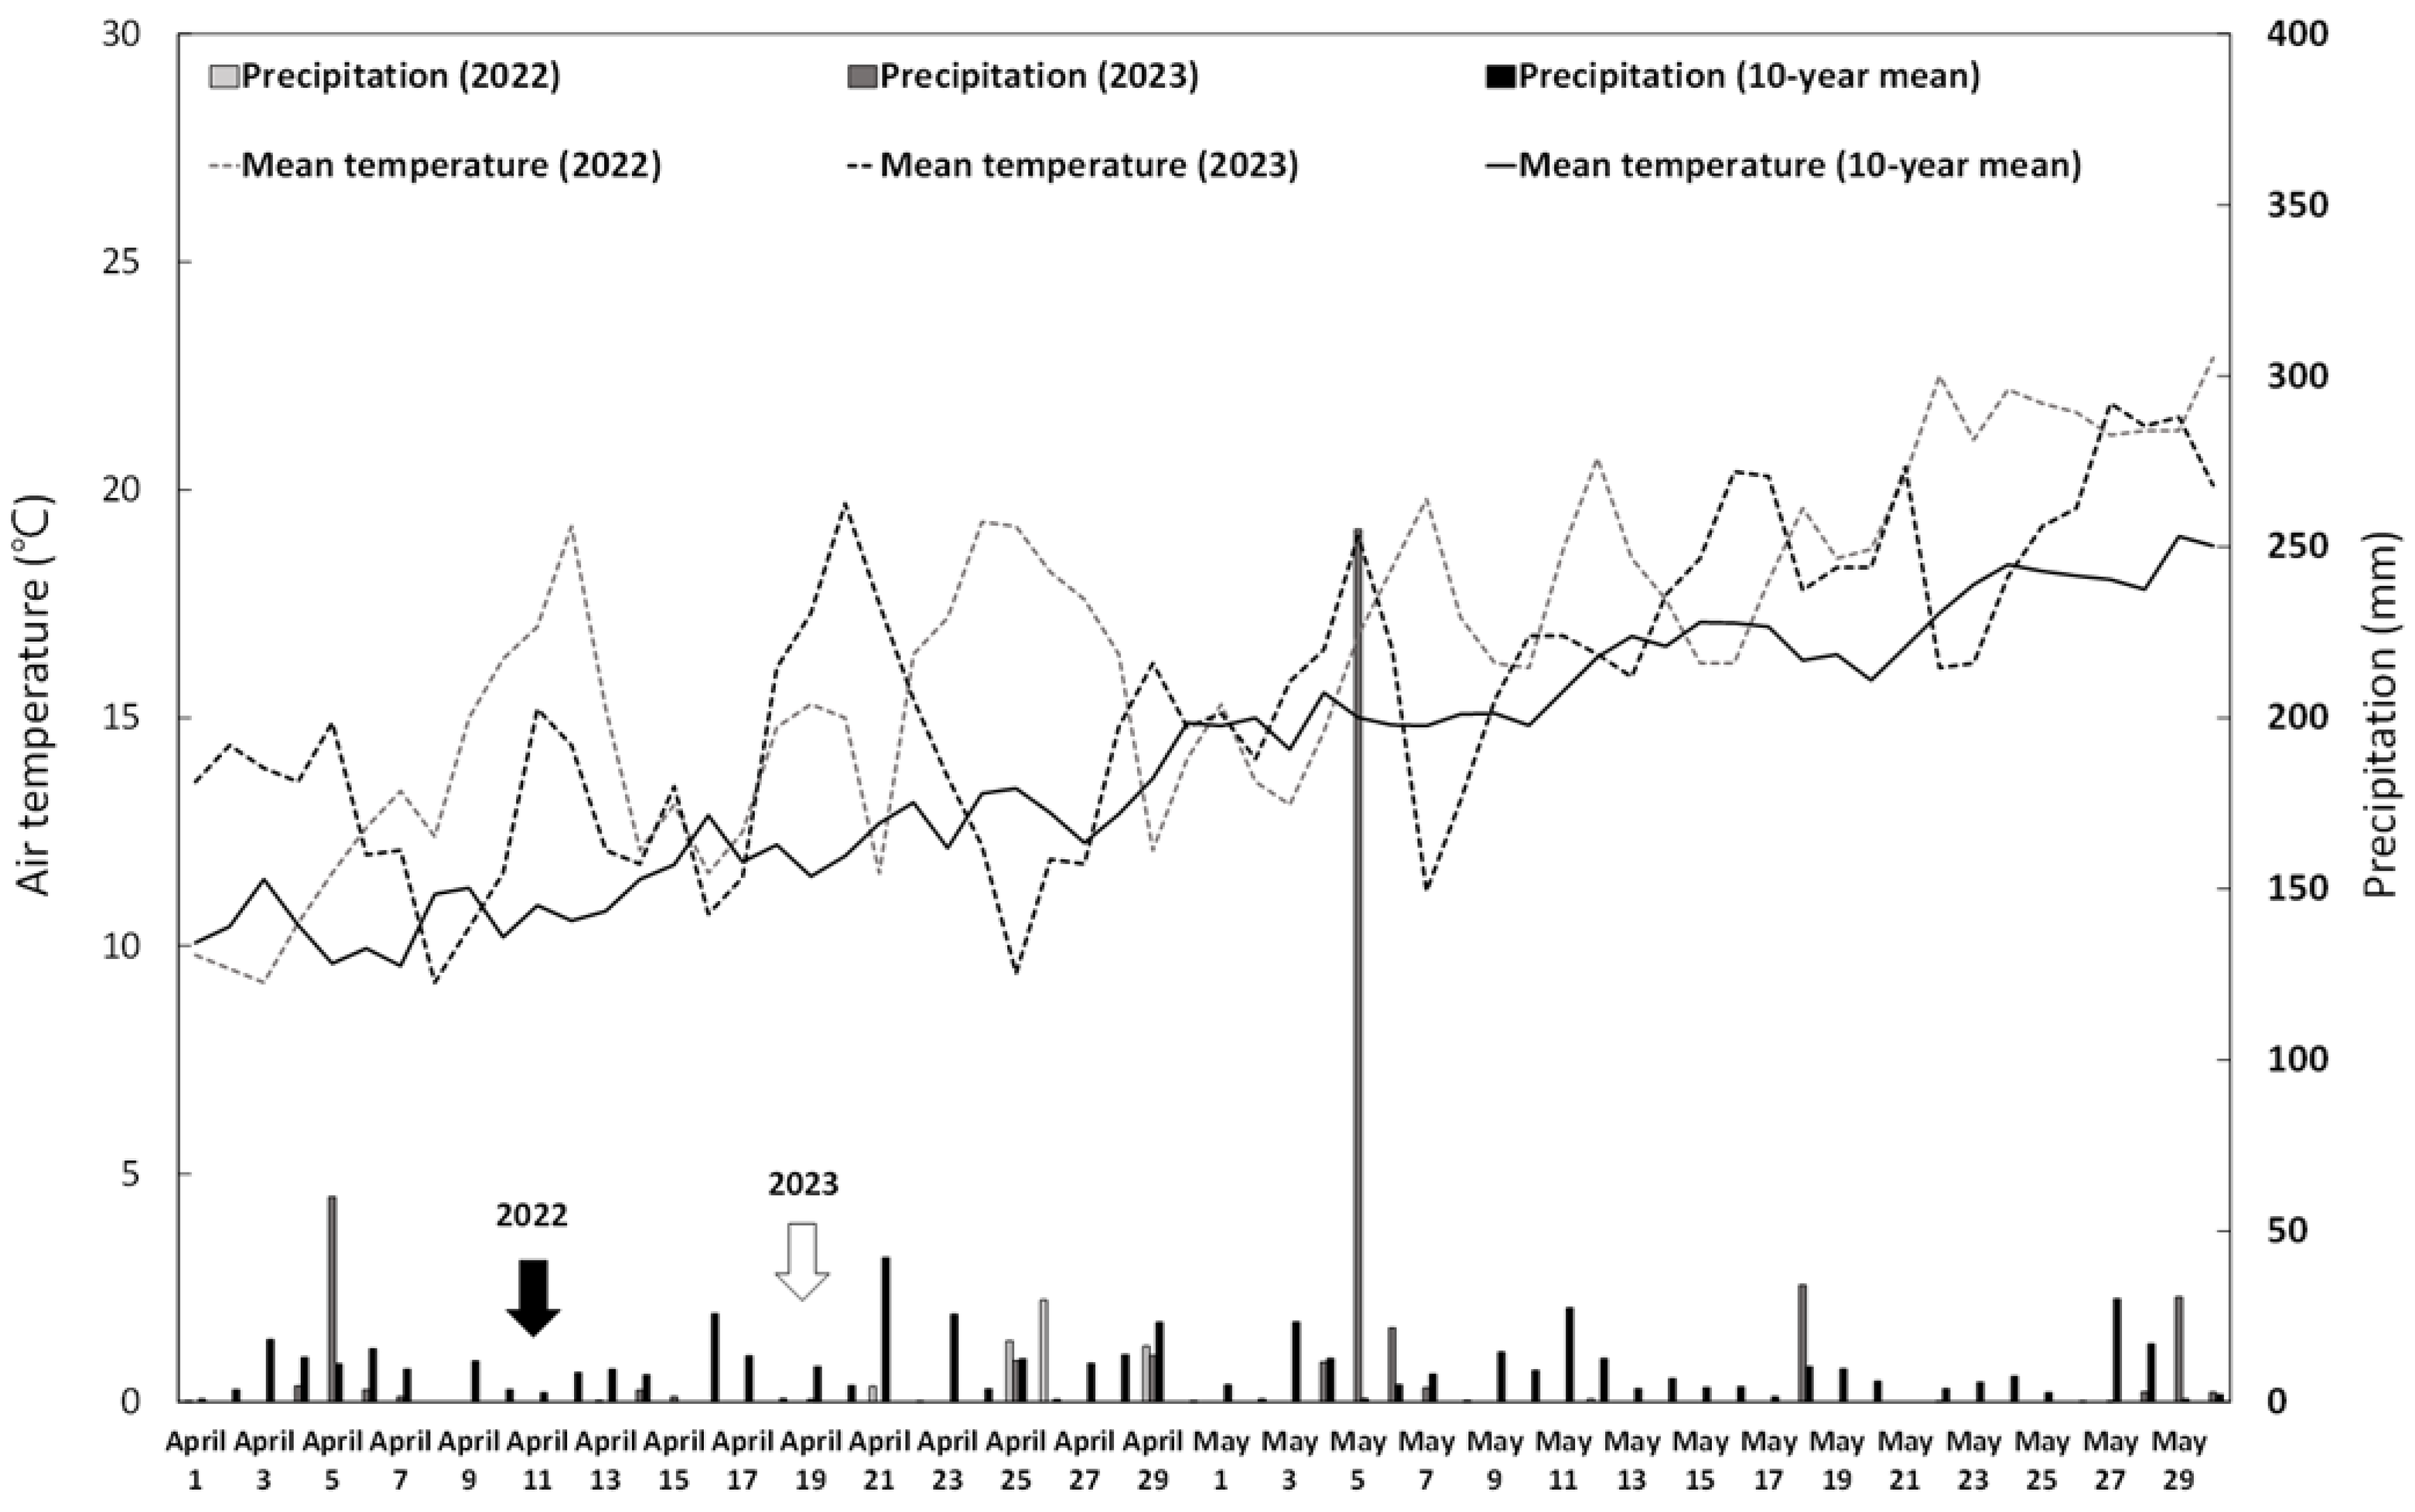
Figure 1. Daily mean temperature and precipitation during the experimental period in 2022 and 2023. Black and white arrows indicate the beginning day of shading.
Agronomy 15 02577 g001
Figure 2. Changes of leaf greenness based on SPAD value in the flag leaf and the uppermost leaf of wheat treated by shading on different organs in 2022 (left) and 2023 (right). The values are means of three replications, and each replication was the average of five repetitive measurements. ***: significant at p < 0.001.
Agronomy 15 02577 g002
Figure 3. Changes of chlorophyll fluorescence (Fv/Fm) in the flag leaf and the uppermost leaf of wheat treated by shading on different organs in 2022 (left) and 2023 (right). The values are means of three replications, and each replication was the average of ten repetitive measurements. ***: significant at p < 0.001.
Agronomy 15 02577 g003
Figure 4. Changes in photosynthetic rate in the flag leaf and the uppermost leaf of wheat treated by shading on different organs in 2023. The values are means of three replications, and each replication was the average of five repetitive measurements. Photosynthetic rate was measured under natural sunlight between 11:00 and 14:00, at which PPFD was higher than 1000 μmol m2 s–1. ***: significant at p < 0.001.
Agronomy 15 02577 g004
Figure 5. Changes in transpiration rate in the flag leaf and the uppermost leaf of wheat treated by shading on different organs in 2023. The values are means of three replications, and each replication was the average of five repetitive measurements. Transpiration rate was measured at the same time as the photosynthetic rate measurement. ***: significant at p < 0.001.
Agronomy 15 02577 g005
Figure 6. Changes of stomatal conductance in the flag leaf and the uppermost leaf of wheat treated by shading on different organs in 2022 (left) and 2023 (right). The values are means of three replications, and each replication was the average of five repetitive measurements. Transpiration rate was measured at the same time as the photosynthetic rate measurement. ***: significant at p < 0.001.
Agronomy 15 02577 g006
Figure 7. Changes in the stem dry weight of wheat treated by shading in different organs. The values are means of three replications, and each replication was the average of ten plants in a row. Within a date, means with the same letter are not significantly different according to the Tukey HSD test at p < 0.05.
Agronomy 15 02577 g007
Figure 8. Changes in the dry weight of a spike, glume, and grain of wheat treated by shading on different organs in 2022 (left) and 2023 (right). The values are means of three replications, and each replication was the average of ten measurements (spike) and the average of fifty measurements (glume and grain). Within a date, means with the same letter are not significantly different according to the Tukey HSD test at p < 0.05.
Agronomy 15 02577 g008
Figure 9. Changes in relative water content a spike, glume, and grain of wheat treated by shading on different organs in 2022 (left) and 2023 (right). The values are means of three replications, and each replication was the average of ten spikes (spike), and the summed value from ten spikes (glume and grain). ns, *, **, and *** indicate non-siginificant, significant at 0.05, 0.01, and 0.001, respectively.
Agronomy 15 02577 g009
Table 1. Temperature of the spike, flag leaf, and uppermost leaf of wheat with different shading treatments in 2022.
OrgansControlFlag Leaf ShadingSpike ShadingFlag Leaf and Spike Shading
14 DAT 28 DAT 14 DAT 28 DAT14 DAT 28 DAT14 DAT 28 DAT
----------------------------------------------------- °C ----------------------------------------------------------
Spike24.3 ± 0.433.1 ± 0.524.4 ± 0.332.6 ± 0.326.5 ± 1.133.7 ± 0.324.8 ± 0.334.8 ± 0.9
Flag leaf25.4 ± 0.138.4 ± 0.927.8 ± 2.440.7 ± 1.425.8 ± 0.439.4 ± 1.126.9 ± 1.440.1 ± 1.8
Uppermost leafN.M. 39.1 ± 0.6N.M.37.0 ± 1.2N.M.36.8 ± 2.3N.M.39.3 ± 0.5
Air temperature at the measured time was 24.7 and 30.2 °C at 14 DAT and 28 DAT, respectively. The uppermost leaf was not measured at 14 DAT.
Table 2. Spike, glumes, and grain growth rate of wheat with different shading treatments in 2022.
TreatmentSpike Growth Rate
(mg mg−1 d−1)
Glume Growth Rate
(mg mg−1 d−1)
Grain Growth Rate
(mg mg−1 d−1)
Control7.0 ± 0.02 a,†2.0 ± 0.04 a3.8 ± 0.02 a
FS6.9 ± 0.03 b2.0 ± 0.04 a3.8 ± 0.03 a
SS6.4 ± 0.07 c2.1 ± 0.15 a3.3 ± 0.05 b
FSS6.0 ± 0.10 d1.6 ± 0.01 b2.8 ± 0.03 c
p-value<0.001<0.001<0.001
Means in a column with different letters are significantly different at p < 0.05 according to Tukey’s honestly significant difference test.
Disclaimer/Publisher’s Note: The statements, opinions and data contained in all publications are solely those of the individual author(s) and contributor(s) and not of MDPI and/or the editor(s). MDPI and/or the editor(s) disclaim responsibility for any injury to people or property resulting from any ideas, methods, instructions or products referred to in the content.