Article

Biochar and Chlorella Synergistically Enhance Grain Yield in Saline Soil

1
College of Agricultural Science and Engineering, Hohai University, Nanjing 211198, China
2
Jiangsu Hydraulic Research Institute, Nanjing 210098, China
*
Author to whom correspondence should be addressed.
Agronomy 2025, 15(11), 2508; https://doi.org/10.3390/agronomy15112508
Submission received: 30 September 2025 / Revised: 22 October 2025 / Accepted: 27 October 2025 / Published: 28 October 2025

Abstract

Saline soils severely constrain rice growth and reduce grain yield. While biochar and Chlorella have each been extensively investigated for their roles in improving plant growth, few studies have explored their combined application to support rice cultivation in saline soil environments. A controlled pot experiment tested three biochar rates (B0: 0 g/kg, B20: 0.98 g/kg, B40: 1.97 g/kg) and two Chlorella concentrations (C0: 0 cells/mL, C1: 1.3 × 10⁷ cells/mL) to evaluate their combined effects on soil properties, rice root development, and productivity. The study showed that compared with B0C0, B0C1 increased NH4+-N by 50.00–57.16%, NO3-N by 57.61–104.57%, effective panicle number by 55.00%, and grain yield by 46.06%. Meanwhile, B20C1 also significantly improved soil and plant indicators, with NH4+-N increased by 57.21–63.16%, NO3-N by 140.28–151.53%, urease activity by 57.18–178.81%, root traits by 28.58–213.10%, effective panicle number by 40.00%, and grain yield by 30.05%. Mechanistically, biochar promoted rice root growth by improving soil physicochemical properties, while Chlorella enhanced soil NH4+-N and NO3-N contents via the “capacitor effect”, boosted urease activity, and secreted plant hormones to directly stimulate rice tillering. Notably, Chlorella significantly increased yield under no biochar (B0C1) or low biochar (B20C1) conditions, but this effect nearly disappeared under high biochar application (B40C1). This study is the first to reveal the synergistic effect between biochar and Chlorella, as well as their application potential in rice cultivation on saline soils. It thereby provides novel insights for saline soil amendment and aquaculture tailwater reuse.

1. Introduction

Agricultural arable land resources in China are scarce, and saline tidal flat soils along the eastern coast of China serve as important reserve arable land resources. Their scientific development and improvement hold great significance for alleviating arable land scarcity and ensuring national food security [1,2]. Coastal tidal flats in Jiangsu Province span a total area of 6.907 × 10⁵ hectares (ha), representing roughly 25% of the total area of China’s coastal tidal flats [3,4]. Coastal saline soils, affected by seawater-influenced groundwater, often suffer from elevated soil salinity, suboptimal soil structure, and limited soil nutrient availability, all of which impede agricultural productivity improvement [5]. The core mechanism for improving coastal saline soil lies in reducing soil salt content by physicochemical methods, controlling salt resurgence utilizing hydraulic engineering, and enhancing soil fertility leveraging biological measures, ultimately improving soil structure and tilling conditions. Desalination and soil fertility improvement are key measures for achieving the efficient utilization of saline soils [6]. Jiangsu Province is a major province for rice cultivation and pond aquaculture. Rice cultivation, characterized by its high water requirement and long-term flooding, is widely employed for saline soil improvement. Long-term rice cultivation can reduce surface soil salinity through a “desalination-leaching” effect; meanwhile, organic acids secreted by rice roots can effectively alleviate soil alkalization, thereby improving soil nutrient status and enhancing soil fertility [7]. However, sole reliance on rice cultivation is insufficient to address the low fertility of coastal saline soils. Thus, exogenous carbon and nitrogen input is regarded as a critical approach to enhance soil fertility [8]. In recent years, the aquaculture-rice co-cropping system aligns with local agricultural development trends, exhibits prominent economic benefits and environmental friendliness, and serves as a powerful measure to address the low economic efficiency of salinized farmlands [9]. Irrigation with aquaculture tailwater represents an effective strategy that balances resource utilization and ecological restoration, as it not only reduces chemical fertilizer application rates but also ameliorates the saline soil environment [10]. Nutrients (e.g., nitrogen and phosphorus) abundant in tailwater can promote rice growth and simultaneously reduce the risk of nutrient loss, thereby increasing crop yield while achieving synergistic effects between resource recycling and saline soil improvement [11]. However, the adsorption capacity of salinized paddy fields for nutrients in tailwater is limited. Consequently, unutilized nutrients in the tailwater tend to accumulate in the topsoil and are lost through processes such as surface runoff and leaching, which further exacerbates agricultural non-point source pollution [12]. Thus, it is necessary to select appropriate exogenous additives to improve saline soils while mitigating the pollution risks posed by aquaculture tailwater.
In recent years, biochar derived from agricultural waste has shown a remarkable role in the improvement of saline soils [13,14]. Biochar is a product rich in carbon produced via the pyrolysis of biomass under anaerobic conditions or conditions with limited oxygen, and its physicochemical properties and elemental content depend primarily on the type of feedstock used for biochar production and the preparation conditions, which include pyrolysis temperature and pyrolysis time [15]. Moreover, studies have shown that biochar, which is endowed with inherent porous architecture, abundant functional groups, large specific surface area, and robust pollutant adsorption capacity, when applied at an appropriate rate, not only ameliorates saline soils by improving soil porosity, enhancing water and nutrient retention capacities, regulating salt ion distribution and soil pH, and increasing soil nutrient availability, thus promoting crop root growth and yield formation, but also remediates water bodies, thus fulfilling a dual function of saline soil amendment and water remediation [15,16,17]. Among these, corn stover-derived biochar has been widely applied due to its characteristics such as wide availability of raw materials, low cost, and alignment with circular agriculture. Studies have shown that biochar produced using corn stover as raw material can significantly increase soil organic carbon content, improve soil physicochemical properties, and enhance soil fertility [18].
Microalgae are a group of unicellular microorganisms with photosynthetic capacity, and they have gained increasing attention due to their applications in agriculture. In soil, microalgae enhance soil structure and fertility by providing nutrients and improving soil nutrient cycling [19,20]. They also promote plant growth through approaches such as protecting plants from pathogen infection and producing plant hormones. Compared with other microalgae, Chlorella has a stronger oxygen-producing capacity and exhibits distinct advantages in terms of stress tolerance and pollutant removal efficiency [21,22]. Chlorella can promote the biological degradation of soil organic matter, thereby increasing the contents of soil organic carbon and nitrate-N [23]. Furthermore, several studies have indicated that Chlorella exhibits the ability to promote rice growth by synthesizing plant growth-promoting substances, such as auxins, cytokinins, and gibberellins. Concurrently, it can enhance soil fertility and ameliorate the soil microecosystem [24,25]. Hong, C. et al. reported that Lemna (duckweed) functions analogously to a capacitor via the process of “nitrogen storage during growth and nitrogen release upon senescence”—a mechanism that enables it to gradually supply nutrients to rice plants and thereby enhance nitrogen fertilizer use efficiency [26]. Chlorella can not only utilize light energy and organic matter in water for autotrophic growth but also grow and reproduce using organic carbon sources under heterotrophic conditions. Sharing similar functional traits with Lemna (duckweed), Chlorella serves multiple roles that include purifying aquaculture tailwater, enhancing soil fertility, and secreting auxins to promote rice growth. Nevertheless, relevant research findings remain scarce at present. Most existing studies only focus on biochar and Chlorella separately, but rarely address their synergistic interaction. Furthermore, these studies have neither targeted the high levels of salinity and alkalinity of coastal saline soils nor considered tailwater irrigation conditions, nor have they elucidated the coupled effects of these amendments on rice root morphology and soil nitrogen transformation.
The study proposed three hypotheses: (1) The effect of combined application of biochar and Chlorella on improving the physicochemical properties of saline soil may be superior to that of their single applications. (2) The combined application of biochar and Chlorella may synergistically promote rice root growth and enhance root morphology and physiological activity, with an effect superior to that of their single applications. (3) The combined application of biochar and Chlorella may significantly increase the effective tiller number, 1000-grain weight, and grain yield, with effects superior to the separate application of either of the two. Accordingly, a pot experiment was conducted in this study to examine the effects of biochar and Chlorella on the physicochemical properties of coastal saline soils, rice root growth, and grain yield under aquaculture pond tailwater irrigation. Based on the comprehensive test results and cost considerations, the optimal combination of these two amendments was determined. The study’s results are anticipated to offer a theoretical foundation and technical assistance for coastal saline soil effective utilization and the sustainable administration of aquaculture tailwater.

2. Materials and Methods

2.1. Site Descriptions

This pot experiment took place in 2023 at the Water-Saving Garden of Jiangning Campus, Hohai University, Jiangsu Province, China (31°54′ N, 118°45′ E). The subtropical monsoon climate zone where the experimental site is situated is characterized by long-term climatic conditions such as an annual mean temperature of 14.6 °C, a multi-year average of 122 rainy days per year, a multi-year mean annual precipitation of 1050 mm, an annual mean sunshine duration of 2212.8 h, an annual mean frost-free period of 220 days, and an annual mean wind speed of 2.5 m/s. The saline soil used in the experiment was obtained from the Tiaozini coastal reclamation area in Dongtai City, Jiangsu Province (33°23′ N, 121°35′ E). For the tested soil, sand particles accounted for 51.12%, silt particles for 45.87%, and clay particles for 3.01%, so it was classified as sandy loam. Its physical and chemical properties include soil bulk density 1.4 g/cm3; field capacity (mass fraction) 24.72%; saturated moisture content (mass fraction) 38.78%; soil solution electrical conductivity (EC) 1189 μS/cm; pH 9.91; soil organic carbon (SOC) 4.42 g/kg; total organic matter (SOM) 7.51 g/kg; total nitrogen (Nt) 78 mg/kg; ammonium nitrogen (NH4+-N) 0.06 mg/kg; and nitrate nitrogen (NO3-N) 1.69 mg/kg. “Nanjing 46” was the rice cultivar chosen for this experiment. The experiment was conducted by filling each experimental pot with 65 kg of the tested saline soil on 27 June, followed by rice transplanting on 5 July, and final harvesting on 28 October, with a total growth period of 122 days. Corn stover biochar was supplied by Henan Xingnuo Environmental Protection Materials Co., Ltd. (Zhengzhou, China). Its pyrolysis temperature was approximately 600 °C and the duration was about 120 min. This biochar had a carbon-to-nitrogen (C/N) ratio of approximately 60:1, a carbon-to-phosphorus (C/P) ratio of approximately 220:1, and a pH value of approximately 10.5. It contained 10.26% moisture, 510.90 g/kg organic carbon, 8.51 g/kg total nitrogen, 2.34 g/kg total phosphorus, and 15.76 g/kg total potassium. The tested microalgal strain was Chlorella sp. (FACHB-5), purchased from the Freshwater Algae Culture Collection, Institute of Hydrobiology, Chinese Academy of Sciences (IHB, CAS). Under sterile conditions, it was cultured to the exponential growth phase; this cell density ensured microalgal growth without excessive interspecific nutrient competition. Subsequently, only after the end of the rice greening stage (25 July) was the microalgal suspension homogenized in accordance with the experimental design and applied to each experimental pot, with a final density of 1.3 × 10⁷ cells/mL in the standing water of the paddy system. In this experiment, the cost per experimental pot was 0.026 yuan for Chlorella, 0.212 yuan for biochar (application rate: 0.98 g/kg), and 0.424 yuan for biochar (application rate: 1.97 g/kg).
During the growth period of rice, irrigation was carried out with simulated fishpond aquaculture tailwater in accordance with the irrigation schedule outlined in Table 1. First, relevant parameters of local fishpond tailwater were determined; subsequently, the fish bait fermentation method was employed to simulate its water quality, ensuring the stability of irrigation water quality [27]. Specifically, 12.5 g of general purpose fish feed was fermented in 1 L of water for 2 h. After filtration, the filtrate was transferred to a mixing pot and diluted to a total volume of 40 L. Subsequently, 0.35 g of ammonium chloride (NH4Cl) and 0.13 g of urea were added to the mixture, followed by thorough homogenization to ensure uniformity. The main components of fishpond aquaculture tailwater included electrical conductivity (EC) 147.8 μS/cm, pH 7.53, total nitrogen (Nt) 8 mg/L, ammonium nitrogen (NH4+-N) 3.53 mg/L, nitrate nitrogen (NO3-N) 1.83 mg/L, and total phosphorus (TP) 2.03 mg/L.

2.2. Experimental Design

This study was conducted as a pot experiment, adopting a randomized complete block design (RCBD), and carried out under natural light conditions, with no temperature control. The experiment involved two factors: biochar (abbreviated as B) and Chlorella (abbreviated as C). Three biochar application rates were set: no biochar application (B0), biochar application at 0.98 g/kg (B20), and biochar application at 1.97 g/kg (B40). For Chlorella, two application levels were established: no Chlorella (C0) and Chlorella (C1, 1.3 × 10⁷ cells/mL). A total of six treatment combinations were established for the experiment. Each treatment was set up with three replicates (Table 2).
The experimental soil was collected in 5-cm layers, sieved through a 5-mm sieve layer by layer, and then backfilled into the experimental pots in 5-cm-thick layers. Each pot was filled with 65 kg of sieved soil. Experimental pots were placed outdoors, and a plastic film was temporarily covered over the pots during rainfall to avoid the impact of rainfall on irrigation water quality. Each experimental pot had a height of 80 cm and a diameter of 35 cm. First, each pot was filled with a 5-cm-thick gravel layer at the base to serve as a filtration layer. Subsequently, saline soil was added in 5-cm increments, with each layer being compacted to a thickness of 35 cm using the natural bulk density of the saline soil as the compaction standard. After that, biochar and sieved saline soil were thoroughly mixed (according to the experimental design) and poured into the pots, followed by compaction layer by layer at 5-cm intervals; the soil-biochar mixture layer had a thickness of 30 cm. The total thickness of the soil profile in each pot was 65 cm. Additionally, the top of each pot was maintained at a water storage depth of 10 cm. The experiment adopted the seedling transplanting method. On 5 July, healthy seedlings at the three-leaf-one-heart stage with uniform size were selected for transplanting. The planting density was strictly controlled as one hill per pot, with 3 plants per hill.

2.3. Measurement Content and Methods

2.3.1. Measurement of Soil Chemical Indicators

Following harvest, soil samples were collected from the 0–10 cm and 10–20 cm soil depths in the upper layer of each experimental pot. After collection, the following soil properties and biochemical indicators were determined, including soil electrical conductivity (EC), soil pH, ammonium nitrogen (NH4+-N), nitrate nitrogen (NO3-N), soil organic matter (SOM), available phosphorus (Olsen-P), total nitrogen (Nt), urease activity, and catalase activity. Specifically, soil pH and EC were measured using a portable meter (HQ30D, HACH, USA). NH4+-N and NO3-N were determined using fresh soil samples, with the former via the indophenol blue method and the latter via ultraviolet spectrophotometry. SOM was determined using the potassium dichromate oxidation-external heating method, while Olsen-P was determined using the sodium bicarbonate extraction method. Nt was determined using the Kjeldahl distillation method. Furthermore, urease and catalase activities were determined using the phenol-sodium hypochlorite colorimetric method and potassium permanganate titration method, respectively.

2.3.2. Measurement of Root Growth Indicators

After rice harvest, the root systems of each treatment were placed in 70-mesh nylon mesh bags. They were then gently rinsed with a low-velocity water stream until clean, followed by being spread out flat for the determination of root length per plant. After the cleaned root systems were cut into segments, they were placed in a single layer without overlap in a transparent plastic tray. Subsequently, root images were acquired using an Epson Model 10000XL scanner (Seiko Epson Corporation, Tokyo, Japan). Total root length (the sum of all root segments per plant) and average root diameter of the rice roots were among the indicators determined by the WinRHIZO analysis software (Version 2009b, Regent Instruments Inc., Montreal, QC, Canada) in order to quantify root morphological parameters. Following analysis, the root systems were deactivated for 30 min at 105 °C to halt metabolic activity, and then dried at 80 °C until a constant weight was achieved. The total root dry weight was defined as this weight, or below-ground biomass.

2.3.3. Yield and Component Measurement

Rice under each treatment was harvested individually and separately. The effective panicle number, grain number per panicle (with a breakdown into filled grains, empty grains, and abscised grains), and seed setting rate were determined; the oven-drying method was employed to measure parameters including above-ground dry matter and 1000-grain weight; subsequently, grain yield was calculated.

2.3.4. Data Statistics and Analysis

In this study, descriptive statistical analysis and basic data calculations were conducted with Microsoft Office Excel 2021. SPSS 29 (IBM, Inc., Armonk, NY, USA) was used to conduct statistical analyses, including analysis of variance (ANOVA) and correlation analysis. All figures were generated via GraphPad Prism 10 (GraphPad Software, San Diego, CA, USA). Correlation analysis between variables was additionally performed using R software (Version 4.5.0), where the Pearson correlation coefficient was employed to evaluate statistical significance and quantify the strength of linear relationships. The correlation results were visualized in a combined heatmap in which the lower triangular region displays specific correlation coefficient values and the upper triangular region indicates significance levels.

3. Results

3.1. Soil Properties

As illustrated in Figure 1A, biochar applied reduced the pH of saline soil in the topsoil layer (0–10 cm). Compared with the B0C0 treatment, the pH values of the B40C0 and B20C0 treatments decreased by 1.16% and 0.71%, respectively. Compared with the B0C1 treatment, the pH values of the B40C1 and B20C1 treatments decreased by 1.06% and 0.72%, respectively. Furthermore, the extent of this pH decreases increased with increasing biochar rate; notably, the pH reduction observed in B40C0 was statistically meaningful (p ≤ 0.05). Following the application of Chlorella, the pH of saline soil in this topsoil layer exhibited a decreasing trend. Specifically, the pH levels in B0C1 and B40C1 were significantly lower compared to the B0C0 and B40C0, respectively, with statistical significance at p ≤ 0.05. Under the same biochar application regime, the C1 treatment exhibited a pH decrease of 1.01–1.02% compared with the C0 treatment. Conversely, applying biochar together with Chlorella was found to have no significant effect on the pH of saline soil in the shallow soil layer (10–20 cm) (p > 0.05).
As illustrated in Figure 1B, after applying biochar alone, saline soil electrical conductivity (EC) in the top 0–10 cm layer showed an increasing trend across all treatments, although the differences lacked statistical significance (p > 0.05). In contrast, the EC of saline soil in the shallow layer (10–20 cm) showed a decreasing tendency; however, this trend was also not statistically meaningful (p > 0.05). Under the condition of Chlorella application, with the increase in biochar application rate, the EC values of the 0–10 cm surface layer and 10–20 cm layer of saline soil both exhibited a trend of first decreasing and then increasing. However, there were no statistically significant differences among the different treatments (p > 0.05). Under the same biochar application regime, the addition of Chlorella led to an increasing trend in the EC of saline soil in both the topsoil and shallow layers. Nonetheless, these rises lacked statistical significance (p > 0.05).
As illustrated in Figure 2A, the application of biochar alone reduced the NH4+-N content in the surface layer (0–10 cm) of saline soil, but this effect was not significant (p > 0.05). In contrast, except for the B40 treatment, the application of Chlorella significantly elevated the NH4+-N content in the soil layer (p ≤ 0.01), with increments ranging from 29.03% to 82.35%. For the shallow layer (10–20 cm) of saline soil, the application of biochar alone also reduced the NH4+-N content without significant effects (p > 0.05). However, the application of Chlorella enhanced the NH4+-N content in the layer by 36.05% to 105.85%. For NH4+-N content, B0C1 exhibited a significantly higher value than B0C0. Similarly, B20C1 showed a significantly higher NH4+-N content than B20C0. Under the condition of Chlorella application, with the increase in biochar application rate, the NH4+-N contents in both the surface layer (0–10 cm) and shallow layer (10–20 cm) of saline soil showed a trend of first increasing and then decreasing, among which there was a significant difference between the B20C1 and B40C1 treatments (p ≤ 0.05).
Figure 2B shows that biochar at a rate of 0.98 g/kg exerted no significant effect on the NO3-N content in the surface saline soil layer (0–10 cm) (p > 0.05). At a biochar application rate of 1.97 g/kg, the B40C0 exhibited a 73.20% increase in NO3-N content relative to B20C0 (p ≤ 0.05). In contrast, the B40C1 showed a 63.37% reduction in NO3-N content relative to B0C1 and a 70.21% reduction relative to B20C1, with both differences significant at p ≤ 0.05. Furthermore, Chlorella application exerted an extremely significant influence on NO3-N content in the surface soil layer (p ≤ 0.001); specifically, the NO3-N content in B0C1 and B20C1 exceeded that in B0C0 and B20C0 by 104.57% and 195.10%, respectively, whereas the NO3-N content in B40C1 showed a 49.25% reduction relative to that in B40C0. Additionally, the interactive effect of biochar and Chlorella exerted an extremely significant impact on the NO3-N content in the surface soil layer (p ≤ 0.001). For the shallow saline soil layer (10–20 cm), biochar alone use did not cause a significant impact on the NO3-N content (p > 0.05). Specifically, the NO3-N content in B20C1 was significantly increased by 197.31% than that in B20C0 (p ≤ 0.05). Moreover, the combined effect of biochar and Chlorella was highly significant in regulating NO3-N levels in the shallow soil layer (p ≤ 0.01).
Figure 2C–E illustrates that biochar application extremely significantly increased the levels of available phosphorus (Olsen-P), total organic matter (SOM), and total nitrogen (Nt) in the surface saline soil layer (0–10 cm) (p ≤ 0.001), with these contents increasing as the biochar application rate rose. Specifically, compared with the B0 group (including B0C0 and B0C1), the contents of Olsen-P, SOM, and Nt in the B40 (including B40C0 and B40C1) and B20 (including B20C0 and B20C1) groups increased by ranges of 63.52–71.09% and 30.94–31.68%, 75.57–94.07% and 37.04–51.05%, and 72.73–87.50% and 21.21–40.62%, respectively. By comparison, Chlorella exerted no significant influence on the levels of Olsen-P, SOM, or Nt in the surface soil layer (p > 0.05). For the shallow saline soil layer (10–20 cm), levels of Olsen-P, SOM, and Nt increased highly significantly with increasingly higher biochar application rates (p ≤ 0.01). Relative to B0, B40 elevated the levels of these three nutrients by 82.38–90.23%, 51.17–59.77%, and 25.00–87.50%, respectively, while B20 raised them by 41.57–55.47%, 15.99–35.09%, and 25.00–28.57%, respectively. Chlorella exerted no significant influence on the levels of Olsen-P or SOM in the shallow soil layer (p > 0.05), but it highly significantly reduced Nt levels by 22.22% (p ≤ 0.01).
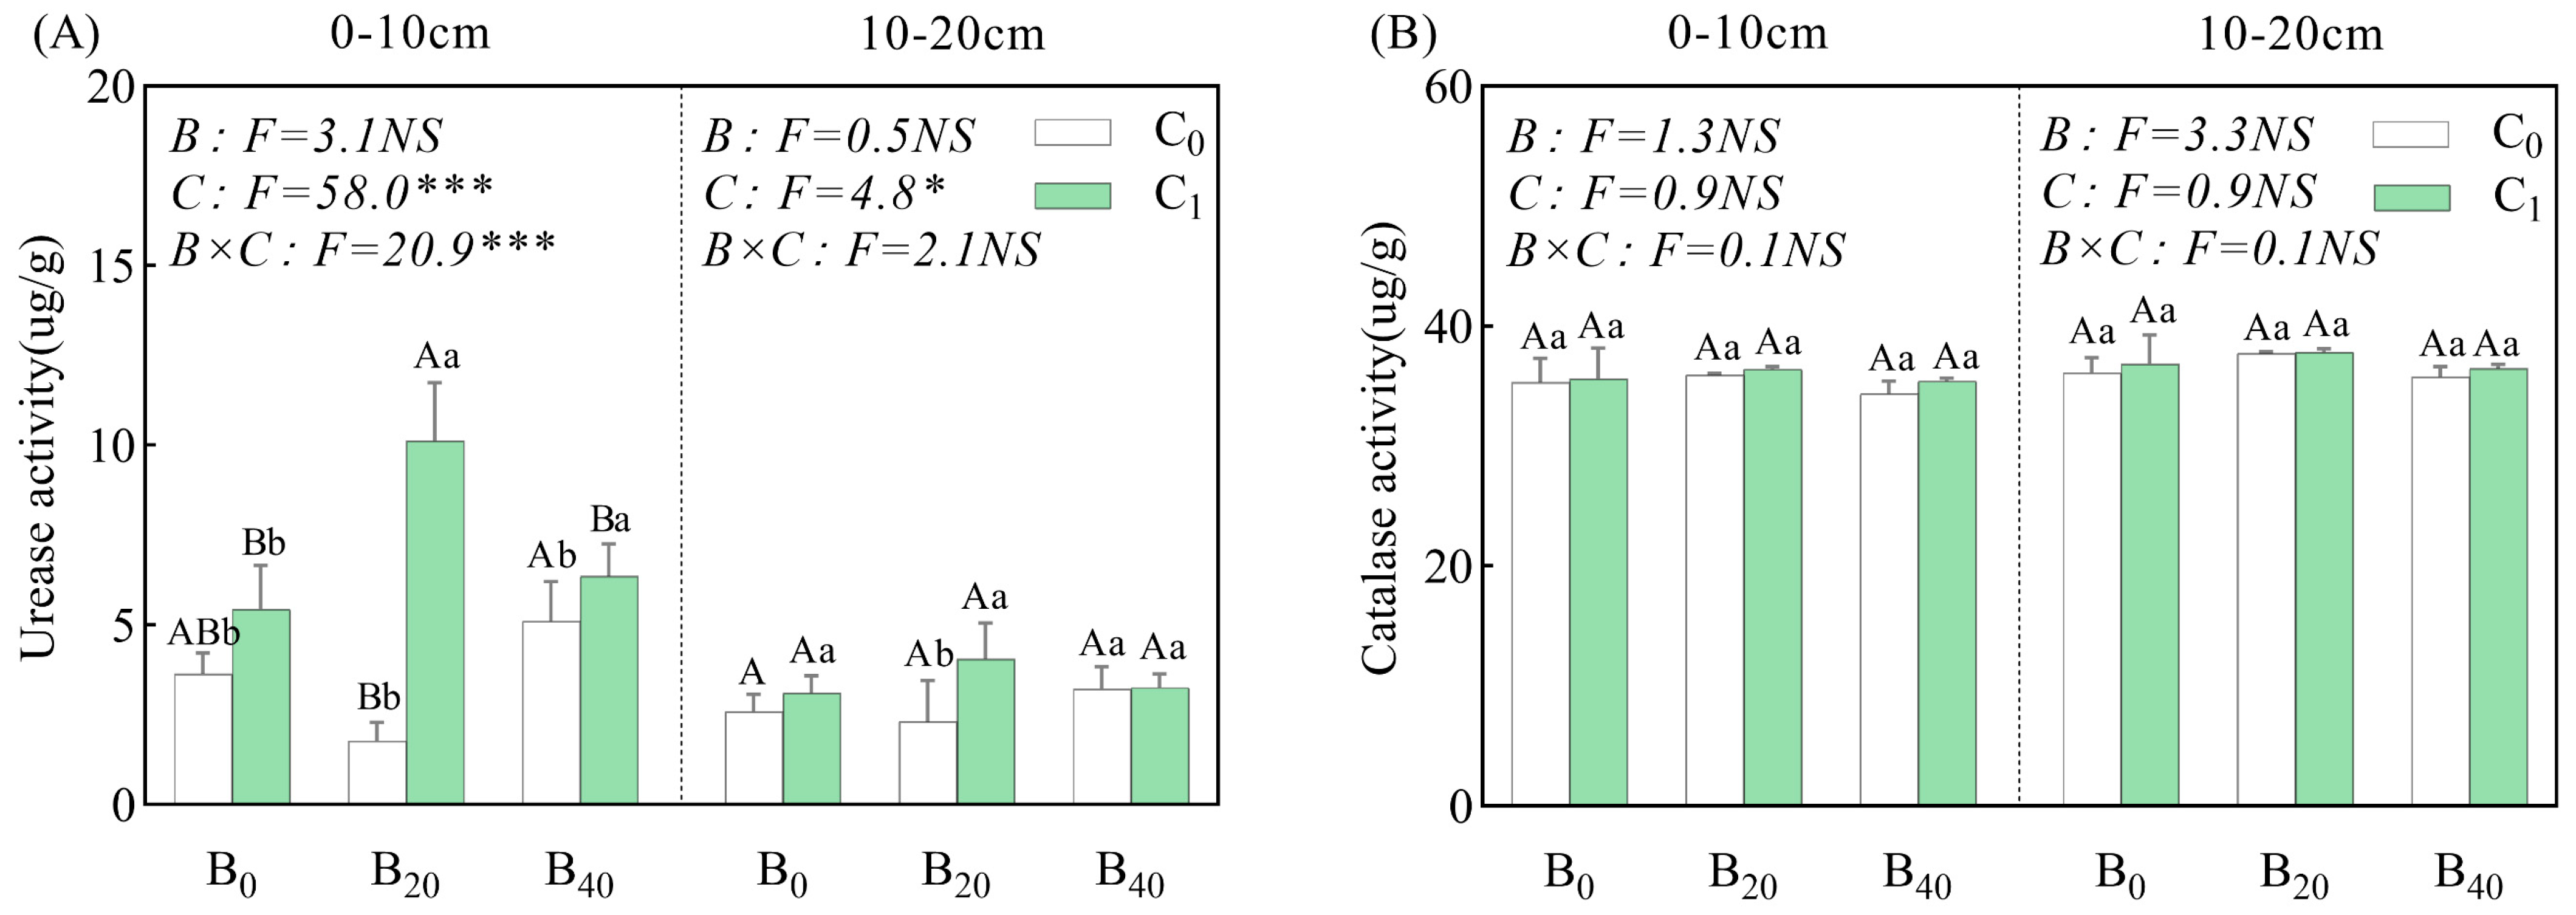
Figure 3A illustrates that biochar applied at 1.97 g/kg exerted no notable influence on urease activity within surface saline soil (0–10 cm layer) (p > 0.05). However, at a biochar application rate of 0.98 g/kg, urease activity in B20C1 exceeded that of B40C1 and B0C1 by 59.36% and 86.44%, respectively, to an extreme degree (p ≤ 0.001). Chlorella application elevated urease activity within the surface soil: urease activity in the C1 group (including B0C1, B20C1, and B40C1) exceeded that of the C0 group (including B0C0, B20C0, and B40C0) by 24.48% to 471.24%, and urease activity differed extremely notably between B20C0 and B20C1 (p ≤ 0.001). Furthermore, the interactive effect of biochar and Chlorella had an extremely significant influence on the urease activity in the surface soil layer (p ≤ 0.001). For the shallow saline soil layer (10–20 cm), biochar applied alone exerted no notable effect on urease activity (p > 0.05). Chlorella enhanced urease activity within the layer, with activity in the C1 group exceeding that in the C0 group by 0.77% to 75.98%. Specifically, urease activity differed notably between B20C0 and B20C1 (p ≤ 0.05).
Figure 3B illustrates that catalase activity of saline soil showed no notable variations after biochar and Chlorella application (p > 0.05). However, with increasingly higher biochar application rates, catalase activity exhibited a trend of initial increase followed by decrease. In both the surface soil layer (0–10 cm) and shallow soil layer (10–20 cm), catalase activity in B40 decreased by 0.56–2.72% and 0.96–1.05%, respectively, relative to B0, while catalase activity in B20 increased by 1.77–2.28% and 2.60–4.43%, respectively, relative to B0. Additionally, Chlorella enhanced catalase activity in saline soil. Specifically, in the surface soil layer (0–10 cm) and shallow soil layer (10–20 cm), the catalase activity in the C1 group was 0.83–3.07% and 0.32–2.10% higher than that in the C0 group, respectively.

3.2. Root System Indices

As presented in Figure 4A,C,D, biochar application led to an extremely significant increase in rice belowground biomass, total root length, and root surface area relative to B0 group (p ≤ 0.001). Specifically, compared with B0 group, the B40 and B20 groups resulted in increases of 33.09–100.97% and 69.71–97.14% in belowground biomass, 31.11–128.55% and 29.07–113.36% in total root length, and 31.78–115.85% and 61.34–127.35% in root surface area, respectively. Furthermore, the application of Chlorella exerted significant effects on rice belowground biomass (p ≤ 0.01), total root length (p ≤ 0.001), and root surface area (p ≤ 0.01), with distinct trends that varied by biochar addition. Specifically, in the B0 group, belowground biomass, total root length, and root surface area in the B0C1 treatment exhibited increases of 6.82%, 14.03%, and 12.50%, respectively, compared with those in the B0C0 treatment. In contrast, in the biochar-amended groups (B20 and B40), the C1 treatment decreased the aforementioned three root indices by 8.04–29.26%, 31.02–34.59%, and 20.16–31.32%, respectively, compared with the C0 treatment. In addition, the interactive effect of biochar and Chlorella had significant impacts on rice belowground biomass (p ≤ 0.01), total root length (p ≤ 0.001), and root surface area (p ≤ 0.05).
Figure 4B illustrates that biochar application extremely significantly increased rice taproot length (p ≤ 0.001). In comparison to B0 group, taproot length in B40 group and B20 group increased by 44.94% to 55.89% and 37.20% to 62.56%, respectively. Furthermore, the application of Chlorella highly significantly reduced the taproot length of rice (p ≤ 0.01), as the taproot length in the C1 group was 6.28% to 26.45% lower than that in the C0 group. Additionally, under the Chlorella-amended treatments, the taproot length exhibited a tendency of a first rise followed by a decline as biochar rate increased. Nevertheless, no notable variation in taproot length was detected for B20C1 and B40C1 (p > 0.05).
Figure 4E,F illustrates that as biochar rate rose, both the average root diameter and root volume of rice exhibited a trend of first increasing and then decreasing. Specifically, relative to the B0 group, the B20 group highly significantly increased the average root diameter and root volume by 2.67–23.26% and 138.17–182.53%, respectively (p ≤ 0.001); the B40 group significantly decreased the average root diameter by 2.42–5.80% compared with the B0 group (p ≤ 0.05) but significantly increased the root volume by 37.12–110.95% relative to the B0 group (p ≤ 0.05). Furthermore, Chlorella exerted no significant effect on either the average root diameter or root volume of rice (p > 0.05).

3.3. Yield Indices

Table 3 shows that in the C0 group, the effective panicle number, seed setting rate, 1000-grain weight, and grain yield of rice exhibited a pattern of an initial decline and then a rise with rising biochar rate; by contrast, the grain number per panicle declined gradually. Specifically, effective panicle number for B40C0 exceeded that for B20C0 and B0C0 by 41.18% and 20.00%, respectively. in the C1 group, effective panicle number and rice grain yield decreased gradually as biochar rate increased, whereas 1000-grain weight increased gradually; seed setting rate and grain number per panicle followed a pattern of first decreasing and then increasing. For specific group comparisons, effective panicle number and grain yield in B40C1 and B20C1 exhibited a reduction of 19.35% and 14.91% in effective panicle number, and 9.68% and 10.96% in grain yield, respectively, relative to B0C1; the 1000-grain weight in B40C1 and B20C1 exceeded that in B0C1 by 5.01% and 1.94%, respectively; the seed setting rate and grain number per panicle in B40C1 exceeded those in B0C1 by 1.28% and 0.65%, respectively, whereas the seed setting rate and grain number per panicle in B20C1 were 0.25% and 3.91% lower than those in B0C1, respectively.
Chlorella extremely significantly increased the effective panicle number (p ≤ 0.001) and grain yield (p ≤ 0.001) of rice, and significantly increased its 1000-grain weight (p ≤ 0.05). Conversely, the application of Chlorella increased the seed setting rate and decreased the grain number per panicle, but these changes lacked significance in statistical terms (p > 0.05). Specifically, relative to the C0 group, the C1 group exhibited increases of 4.17–64.71%, 0.24–0.36%, 0.75–10.35%, and 0.90–66.62% in effective panicle number, seed setting rate, 1000-grain weight, and grain yield, respectively; At the same time, the grain number per panicle in the C1 group was 4.09–8.95% lower than that in the C0 group. Furthermore, the interaction between biochar and Chlorella exerted a highly notable influence on effective panicle number (p ≤ 0.01) and a notable effect on both total grain number and rice grain yield (p ≤ 0.05).
Biochar and Chlorella led to distinct trends in the aboveground biomass of rice. For the C0 group, the aboveground biomass gradually increased as biochar rate increased. Specifically, compared with B0C0, the aboveground biomass in B40C0 and B20C0 exhibited a significant increase of 26.59% and 3.65%, respectively (p ≤ 0.05). In contrast, for the C1 group, the aboveground biomass showed a trend of gradual decrease as the biochar application rate increased. Aboveground biomass for B40C1 and B20C1 registered a notable reduction of 37.18% and 18.48%, respectively, relative to B0C1 (p ≤ 0.05). Furthermore, Chlorella application exerted a notable influence on aboveground biomass (p ≤ 0.05), where aboveground biomass in B0C1 exceeded that in B0C0 by 47.64%, that in B20C1 exceeded that in B20C0 by 16.11%, and that in B40C1 showed a reduction of 26.73% relative to that in B40C0. Additionally, the interactive effect of biochar and Chlorella exerted an extremely important effect on the aboveground biomass of rice (p ≤ 0.001).

3.4. Correlation Analysis

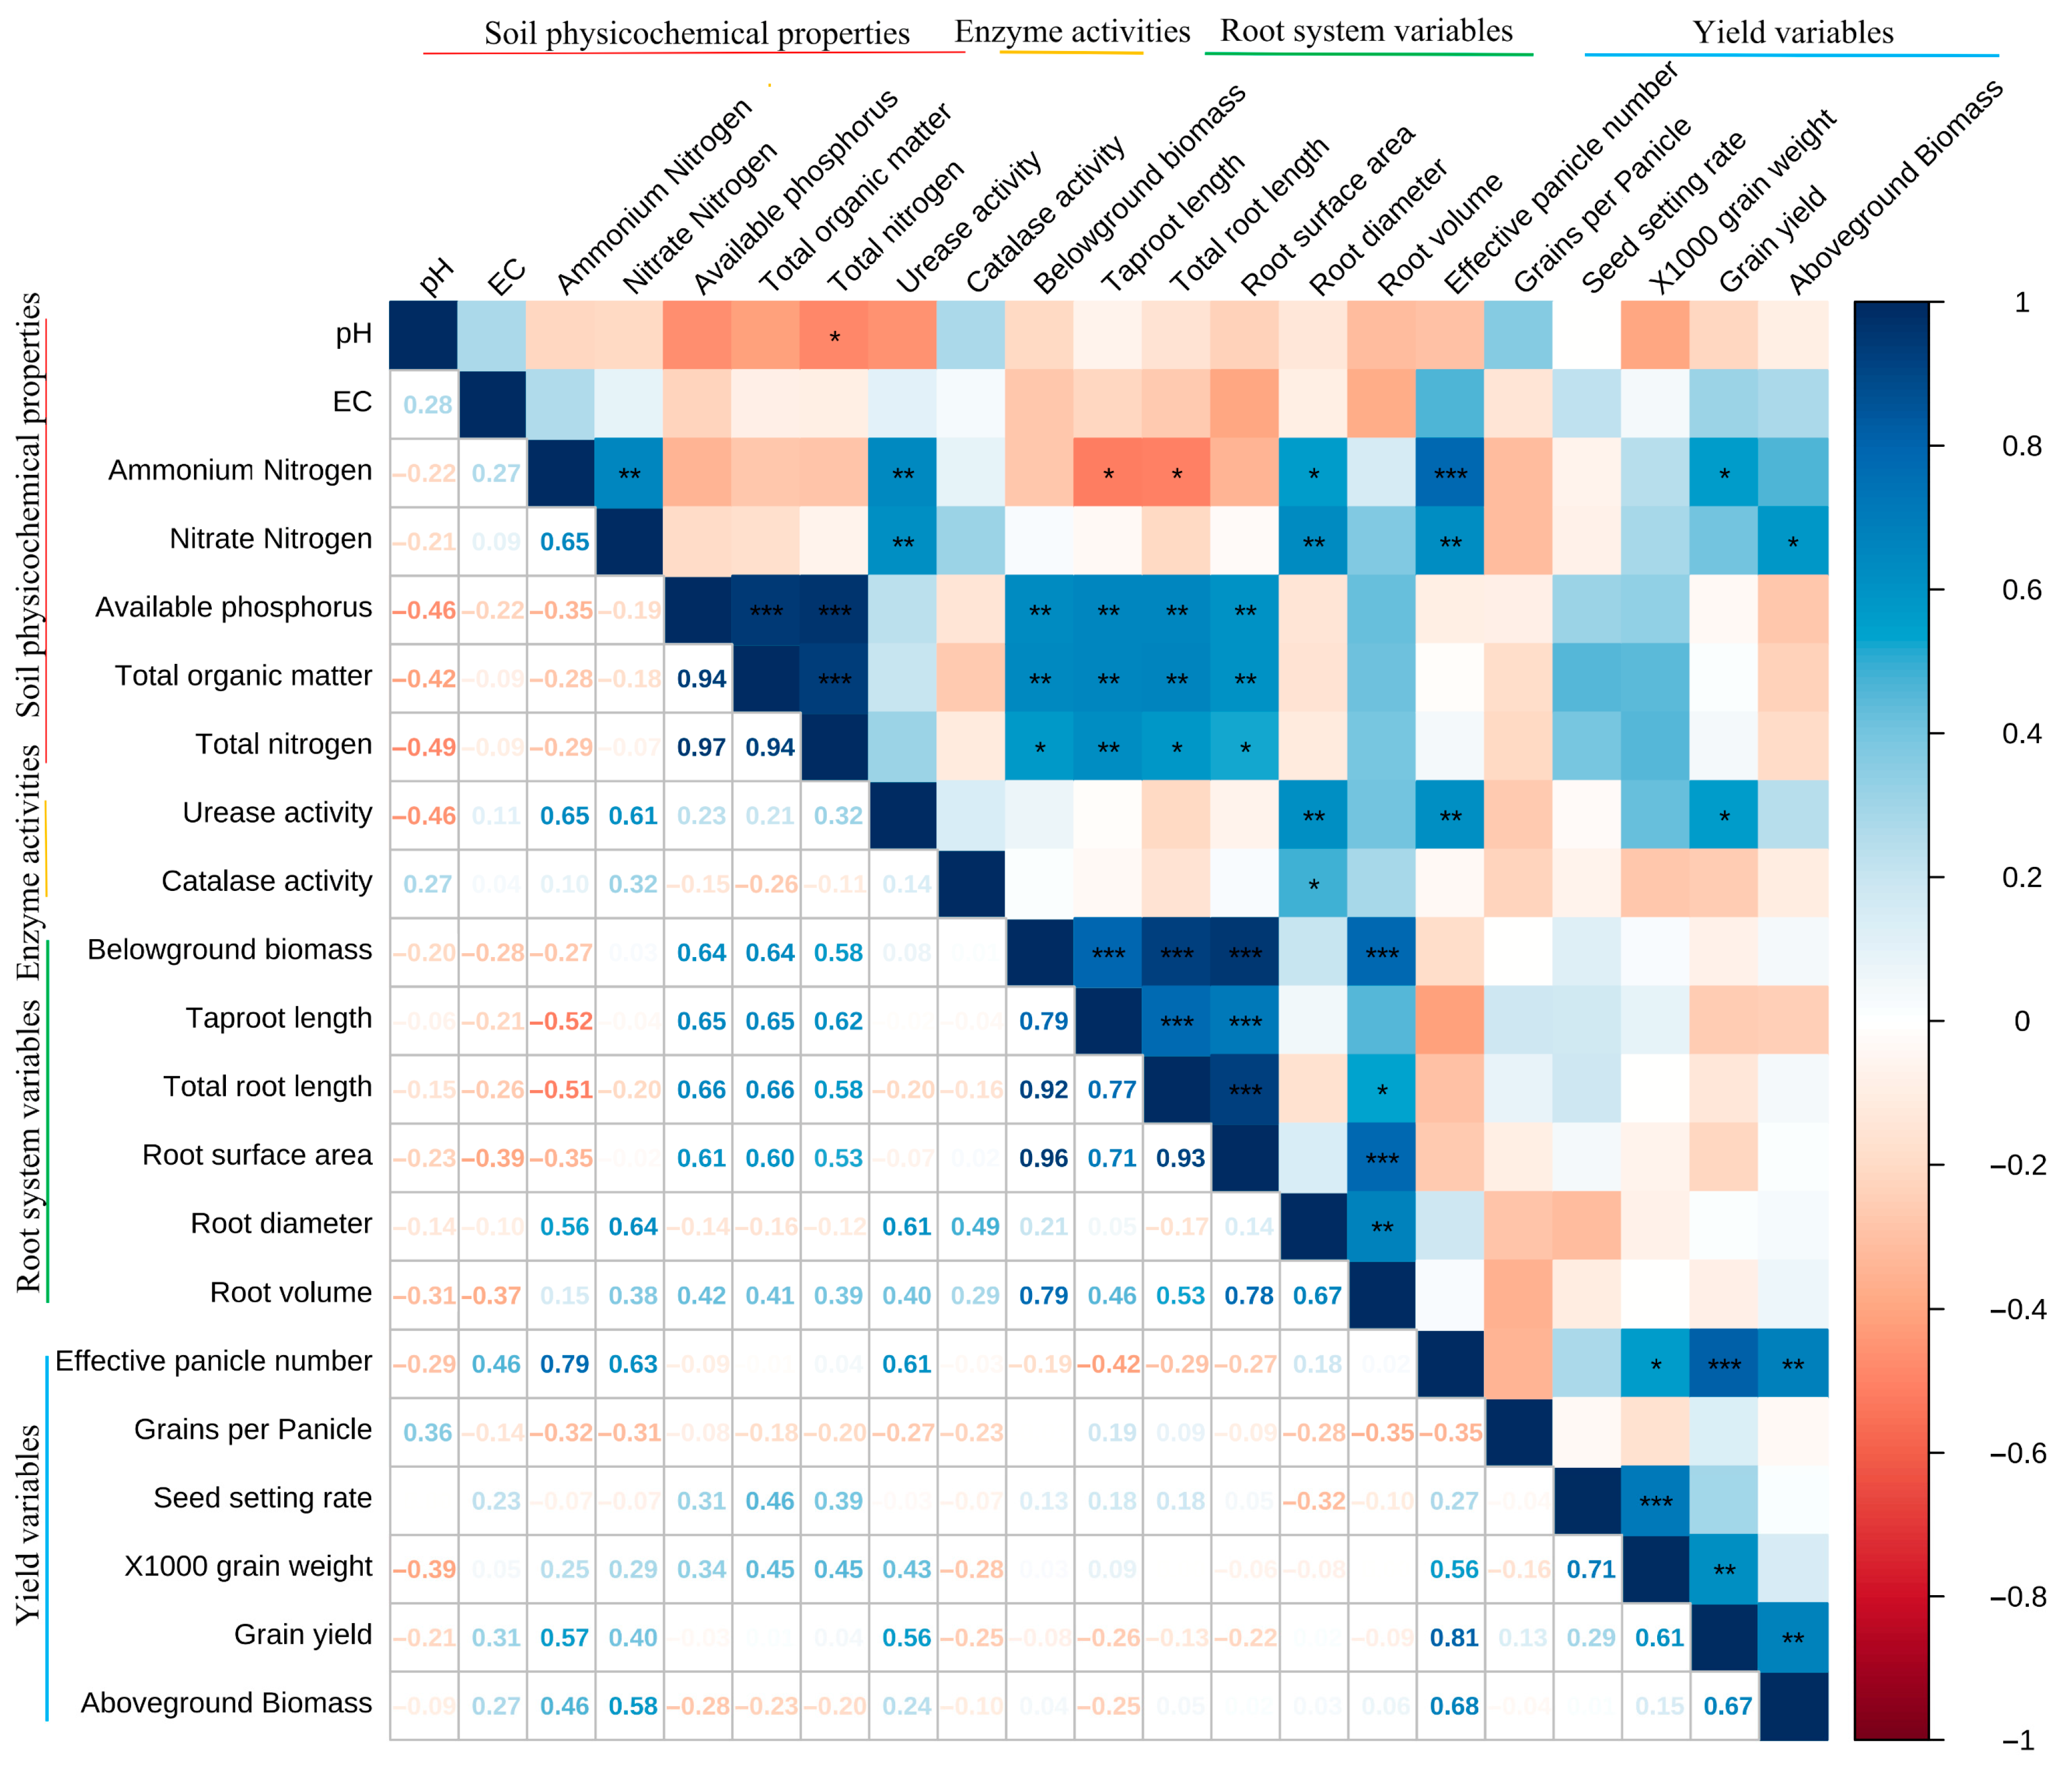
As shown in Figure 5, the soil NH4+-N concentration, urease activity, effective panicle number, 1000-grain weight, and aboveground biomass all exhibited a significant positive correlation with grain yield, with correlation coefficients of 0.57, 0.56, 0.81, 0.61, and 0.67, respectively. Among the yield-related indices, the effective panicle number exerted the most significant influence on grain yield. For soil indices, soil NH4+-N concentration, NO3-N concentration, and urease activity all showed a significant positive association with the effective panicle number, with respective values of 0.79, 0.63, and 0.61 for this association. Additionally, soil NO3-N concentration was significantly and positively associated with aboveground biomass, with an association coefficient of 0.58. Therefore, NH4+-N, NO3-N, and urease activity in soil are the main factors influencing yield variables. Available phosphorus, total organic matter, and total nitrogen in soil are significant factors influencing root system variables, with correlation coefficients ranging from 0.61 to 0.66, 0.60 to 0.66, and 0.53 to 0.62, respectively.

4. Discussion

This study found that the sole application of Chlorella increased soil nitrogen content and urease activity, while the combined application of Chlorella with biochar improved soil nutrient status. However, excessive biochar application rates constrained the promotive effects of Chlorella on soil properties. Biochar contains abundant nitrogen, phosphorus, and organic matter, and its application alleviated the insufficient nutrient status of saline soils [28]. In this experiment, when biochar was applied alone, the contents of total nitrogen (Nt), available phosphorus, and soil organic matter in the soil increased significantly with increasing biochar application rate, which indicates that biochar is an effective amendment for saline soil. Ammonium nitrogen (NH4+-N) and nitrate nitrogen (NO3-N) are the main nitrogen forms absorbed by rice during growth [29]. However, in this experiment, despite applying 0.98 g/kg and 1.97 g/kg of biochar, the contents of soil NH4+-N and NO3-N showed no significant changes compared with the control group. Following the application of biochar, we observed that crop biomass increased with the elevation of biochar application rate, indicating that inorganic nitrogen (Nin) supplied by soil was more effectively assimilated by plants. Furthermore, since urea was added to the aquaculture tailwater, urease in the soil regulates the urea transformation process, and this may explain the increase in nitrate nitrogen content in the B40C0 treatment group [30,31]. Under sole Chlorella use, soil NH4+-N and NO3-N levels, as well as soil urease activity, in B0C1 increased significantly relative to B0C0. This phenomenon was associated with the ability of Chlorella to release amino acids and organic compounds in the course of its growth, which facilitates soil microbial growth and thereby boosts soil urease activity. Chlorella secretes compounds to enhance the activity of mineralizing microorganisms while its death and decomposition in the late stage release additional nitrogen sources. Combined with exogenous nitrogen from aquaculture tailwater and functional microorganisms enriched by biochar, these factors synergistically alleviate nitrogen limitation under high C:N ratio conditions and mitigate the inhibitory effect on soil nitrogen mineralization [9]. Analogously, Hong, C. et al. reported that Lemna (duckweed) functions analogous to a capacitor via “nitrogen storage during growth and nitrogen release upon senescence”, a mechanism enabling it to gradually supply nutrients to rice plants and thereby enhance nitrogen fertilizer use efficiency [26]. However, under Chlorella application, as biochar rate increased, soil NH4+-N and NO3-N levels, along with urease activity, followed a pattern of first increasing and then decreasing. At a biochar rate of 0.98 g/kg, soil NH4+-N and NO3-N exceeded those in B0C1 by 8.77% and 22.96%, respectively, while soil urease activity was significantly elevated by 31.68%. When the biochar rate was further increased to 1.97 g/kg, soil NH4+-N, NO3-N contents, and urease activity decreased significantly, falling below those observed at the 0.98 g/kg rate. This indicates that an excessively high biochar application rate after Chlorella application impaired the functional efficiency of Chlorella, thereby indirectly inhibiting urease activity and further impeding soil nitrogen transformation.
This study revealed that root growth was primarily regulated by biochar, while sole Chlorella use exerted no notable influence on root growth. The root growth status exerts a significant influence on rice growth and yield formation [32,33,34]. Biochar applied alone improved rice root growth, leading to significant increases in belowground dry biomass, taproot length, total root length, root surface area, and root volume. This is because biochar has the characteristics of high specific surface area and high porosity, and these traits can improve the soil structure of coastal saline soils, reduce soil bulk density, and increase soil porosity, thus promoting rice root growth [35,36,37]. With the sole application of Chlorella, belowground dry biomass, total root length, root surface area, and root volume increased, while taproot length decreased, and no significant effects were observed for any of these parameters. Following the combined application of Chlorella with biochar, belowground dry biomass, taproot length, and total root length all decreased to some extent, among which total root length decreased significantly. Combined with the elevated NH4+-N contents in the surface and shallow soil layers, it is inferred that this phenomenon is associated with the “capacitor effect” of Chlorella, which retains nutrients in the surface and shallow soil layers and thereby reduces nitrogen nutrient availability in the deep soil layer [26].
This study found that biochar applied alone at 1.97 g/kg and Chlorella applied alone (respectively) both increased the effective panicle number and grain yield of rice. Correlation analysis revealed that rice yield in saline soils was primarily constrained by the effective panicle number. The sole application of biochar at 0.98 g/kg failed to increase the effective panicle number of rice. This was due to the low initial nutrient content of saline soils [38,39]; meanwhile, biochar has a relatively high C/N ratio, which, after application, led to an imbalanced soil C/N ratio. This imbalance reduced available nitrogen content, resulting in a decrease in nitrogen available to plants before the tillering stage [40]. Furthermore, an increase in the soil C/N ratio can inhibit urease activity and reduce the decomposition of organic matter [41], which further decreases soil nitrogen supply and ultimately leads to a reduction in tiller number. However, when biochar applied alone was increased to a rate of 1.97 g/kg, the effective panicle number under this condition was significantly higher than that in B0 and B20. This is because rice tiller number is shaped by multiple aspects including soil structure and fertility. Although the application of a high rate of biochar elevated the soil C/N ratio and reduced nitrogen supply, it simultaneously improved soil structure, reduced soil bulk density, and decreased soil mechanical strength, thereby creating favorable conditions for rice tillering [42,43,44]. This study also found that the root dry weight, taproot length, and total root length in the B40 treatment showed a certain degree of increase compared with those in the control group and the B20 treatment, which indicates that biochar application in saline soils can promote rice root growth and nutrient uptake, thereby providing more favorable conditions for increasing tiller number [45]. Additionally, under the same biochar application rate, the effective panicle number of rice exhibited an increasing trend after Chlorella application, which was associated with the fact that Chlorella secretes plant hormones that are conducive to promoting rice tillering [46,47]. Under no biochar application, the aforementioned plant hormones (secreted by Chlorella) were released into the water, which greatly promoted rice tillering. Compared with the B0C0 treatment, the B0C1 treatment increased the effective panicle number by 55.00% and grain yield by 46.06%, and this result was the primary reason for maintaining relatively high rice yields in coastal saline soils. With the increase in biochar application rate, the effects of Chlorella on promoting rice tillering and increasing yield gradually decreased. Specifically, the B20C1 treatment increased the effective panicle number by 64.71% relative to B20C0, whereas the B40C1 treatment only elevated effective panicle number by 4.17% relative to B40C0. When biochar rate rose to 1.97 g/kg, the promotive effect of Chlorella was no longer significant.
The above observations indicate that biochar exerts an antagonistic effect on the tiller-promoting effect of Chlorella. This is likely attributed to the fact that biochar adsorbs Chlorella and the plant hormones secreted by the algae, thereby reducing the amount of hormones available to rice plants. Meanwhile, future field trials could extend the application time of biochar.

5. Conclusions

Biochar application significantly elevated the levels of total nitrogen (Nt), available phosphorus, and organic matter in saline soils, but exerted no significant effect on soil ammonium nitrogen (NH4+-N) and nitrate nitrogen (NO3-N) levels. Meanwhile, the combined application of biochar with Chlorella significantly enhanced soil NH4+-N and NO3-N levels, achieved by Chlorella secreting organic substances to enhance soil microbial and urease activities, though this enhancing effect was regulated by the biochar application rate. Notably, 0.98 g/kg was the optimal biochar application rate; excessive biochar (1.97 g/kg) adsorbed Chlorella cells and the hormones they secrete, which antagonized and diminished the promotive effects of Chlorella. Biochar application improved soil nutrient conditions and promoted rice root growth; In contrast, Chlorella directly stimulated rice tillering by secreting plant hormones. When the two were co-applied, first, Chlorella may cause nutrient accumulation in the topsoil, thereby reducing the growth of deep roots. Meanwhile, the effects of related plant hormones still significantly increased the tiller number, but this effect was most pronounced only under low biochar application rates, which led to more inorganic nitrogen being allocated to aboveground growth and yield formation. At high biochar application rates, biochar adsorbs Chlorella and the growth hormones released by it, thereby inhibiting the promoting effect of Chlorella on rice tillering, and Chlorella almost loses its efficacy. Chlorella application in saline paddy fields promoted rice tillering and increased grain yield. Additionally, Chlorella exhibits low cost, representing an effective approach for saline soil improvement. Biochar applied at 1.97 g/kg also promoted rice tillering and increased grain yield; however, it is relatively high in cost. Furthermore, biochar and Chlorella exhibited an antagonistic effect on promoting rice tillering. Considering comprehensively the cost and rice yield, the B0C1 treatment is regarded as a more optimal choice, as it achieved the highest rice yield. From a long-term perspective, however, the B20C1 treatment exhibits greater advantages, as it can ensure relatively high yield while achieving better improvement of saline soil.

Author Contributions

Conceptualization, X.G.; methodology, W.Z. and X.Y.; software, J.Z.; validation, B.L. and S.Z.; formal analysis, B.L.; data curation, B.L.; writing—original draft preparation, B.L. and S.Z.; writing—review and editing, X.G. and J.Z.; visualization, W.Z.; supervision, X.Y.; funding acquisition, X.G. All authors have read and agreed to the published version of the manuscript.

Funding

This study was supported by Special funds for independent scientific research of Jiangsu Hydraulic Research Institute, China (2025z067), and the Water Conservancy Science and Technology Project of Jiangsu Province (2024038).

Data Availability Statement

The datasets generated or analyzed during the current study are available from the corresponding author upon reasonable request.

Conflicts of Interest

The authors declare that they have no known competing financial interests or personal relationships that could have appeared to influence the work reported in this paper.

References

  1. Huang, D.; Chen, S.; Wang, Z.; Chen, Z.; Zhao, H.; Guo, X. Effects of Shallow Buried Straw Interlayer on Water-Salt Transport and Tomato Growth in Coastal Saline Soil. J. Irrig. Drain. 2023, 42, 48–56. [Google Scholar] [CrossRef]
  2. Tarolli, P.; Luo, J.; Park, E.; Barcaccia, G.; Masin, R. Soil Salinization in Agriculture: Mitigation and Adaptation Strategies Combining Nature-Based Solutions and Bioengineering. iScience 2024, 27, 108830. [Google Scholar] [CrossRef]
  3. Mao, Q.; Wang, S. Analysis and Exploration of Saline-Alkali Land Management Trends in China. Hubei Agric. Sci. 2020, 59, 302–306. [Google Scholar] [CrossRef]
  4. Sun, S.; Yan, X.; Yin, F. Current Status and Prospects of Improvement and Comprehensive Utilization of Coastal Tidal Flat Saline-Alkali Soils in China. Chin. J. Grassl. 2024, 46, 1–13. [Google Scholar] [CrossRef]
  5. Huang, D.; Guo, Y.; Chen, S.; Wang, Z.; Sun, B.; Niu, Y.; Dong, S. Different Straw Lengths and Burial Modes Affect the Salt Distribution in Coastal Saline Soil and the Regulation of Salt Stress Resistance in Tomato. Plant Soil 2025, 512, 1175–1201. [Google Scholar] [CrossRef]
  6. Xu, C.; Dong, Y.; Lu, J.; Zhang, Y.; Cheng, M.; Cheng, M.; Ma, J. Research Progress on Soil Improvement and Resource Utilization of Coastal Saline-Alkali Land in China. World For. Res. 2020, 33, 68–73. [Google Scholar] [CrossRef]
  7. Xu, Z.; Shao, T.; Lv, Z.; Yue, Y.; Liu, A.; Long, X.; Zhou, Z.; Gao, X.; Rengel, Z. The Mechanisms of Improving Coastal Saline Soils by Planting Rice. Sci. Total Environ. 2020, 703, 135529. [Google Scholar] [CrossRef]
  8. Mao, T.; Wang, Y.; Ning, S.; Mao, J.; Sheng, J.; Jiang, P. Assessment of the Effects of Biochar on the Physicochemical Properties of Saline–Alkali Soil Based on Meta-Analysis. Agronomy 2024, 14, 2431. [Google Scholar] [CrossRef]
  9. Zhang, S.; Rasool, G.; Wang, S.; Zhang, Y.; Guo, X.; Wei, Z.; Zhang, X.; Yang, X.; Wang, T. Biochar and Chlorella Increase Rice Yield by Improving Saline-Alkali Soil Physicochemical Properties and Regulating Bacteria under Aquaculture Wastewater Irrigation. Chemosphere 2023, 340, 139850. [Google Scholar] [CrossRef] [PubMed]
  10. Niu, X.; Li, M.; Wang, N.; Zhong, H.; Zhang, Y.; Cui, X.; Kang, J.; Chen, G. Advances in Research on Wastewater Treatment Using Microalgae. Shandong Agric. Sci. 2022, 54, 146–152. [Google Scholar] [CrossRef]
  11. Chen, D.; Lu, H.; Fu, Z.; Luo, Z.; Duan, J. A Comprehensive Benefit Evaluation of the Model of Salt-Tolerant Crops Irrigated by Mariculture Wastewater Based on a Field Plot Experiment. Agronomy 2024, 14, 2161. [Google Scholar] [CrossRef]
  12. Wang, M.; Jiang, T.; Mao, Y.; Wang, F.; Yu, J.; Zhu, C. Current Situation of Agricultural Non-Point Source Pollution and Its Control. Water Air Soil Pollut. 2023, 234, 471. [Google Scholar] [CrossRef]
  13. Liu, M.; Wang, Z.; Yang, F.; Li, J.; Liang, Z. Advances in the Application of Biochar for Saline-Alkali Soil Amelioration. J. Soil Water Conserv. 2021, 35, 1–8. [Google Scholar] [CrossRef]
  14. Zhao, W.; Wang, S.; Liu, L.; Xiao, J.; Wang, S.; Tang, L.; Chen, G. Research Progress on the Effects of Biochar in Ameliorating Saline-Alkali Soils and Its Impact on Plant Growth. Chin. J. Soil Sci. 2024, 55, 551–561. [Google Scholar] [CrossRef]
  15. Zimmerman, A.R. Abiotic and Microbial Oxidation of Laboratory-Produced Black Carbon (Biochar). Environ. Sci. Technol. 2010, 44, 1295–1301. [Google Scholar] [CrossRef]
  16. Lehmann, J.; Rillig, M.C.; Thies, J.; Masiello, C.A.; Hockaday, W.C.; Crowley, D. Biochar Effects on Soil Biota—A Review. Soil Biol. Biochem. 2011, 43, 1812–1836. [Google Scholar] [CrossRef]
  17. Hammer, E.C.; Forstreuter, M.; Rillig, M.C.; Kohler, J. Biochar Increases Arbuscular Mycorrhizal Plant Growth Enhancement and Ameliorates Salinity Stress. Appl. Soil Ecol. 2015, 96, 114–121. [Google Scholar] [CrossRef]
  18. Yang, G.; Zhou, W. Effects of Biochar on the Physicochemical Properties, Soil Biomass, and Maize Seedling Growth of Saline-Alkali Soil. Jiangsu J. Agric. Sci. 2017, 45, 68–72. [Google Scholar] [CrossRef]
  19. Alvarez, A.L.; Weyers, S.L.; Goemann, H.M.; Peyton, B.M.; Gardner, R.D. Microalgae, Soil and Plants: A Critical Review of Microalgae as Renewable Resources for Agriculture. Algal Res. 2021, 54, 102200. [Google Scholar] [CrossRef]
  20. Grzesik, M.; Romanowska-Duda, Z.B. Ability of Cyanobacteria and Green Algae to Improve Metabolic Activity and Development of Willow Plants. Pol. J. Environ. Stud. 2015, 24, 1003–1012. [Google Scholar] [CrossRef] [PubMed]
  21. Arbib, Z.; Ruiz, J.; Álvarez-Díaz, P.; Garrido-Pérez, C.; Perales, J.A. Capability of Different Microalgae Species for Phytoremediation Processes: Wastewater Tertiary Treatment, CO2 Bio-Fixation and Low Cost Biofuels Production. Water Res. 2014, 49, 465–474. [Google Scholar] [CrossRef]
  22. Zhang, C.; Li, S.; Ho, S.-H. Converting Nitrogen and Phosphorus Wastewater into Bioenergy Using Microalgae-Bacteria Consortia: A Critical Review. Bioresour. Technol. 2021, 342, 126056. [Google Scholar] [CrossRef] [PubMed]
  23. Zhou, L.; Liu, W.; Duan, H.; Dong, H.; Li, J.; Zhang, S.; Zhang, J.; Ding, S.; Xu, T.; Guo, B. Improved Effects of Combined Application of Nitrogen-Fixing Bacteria Azotobacter Beijerinckii and Microalgae Chlorella Pyrenoidosa on Wheat Growth and Saline-Alkali Soil Quality. Chemosphere 2023, 313, 137409. [Google Scholar] [CrossRef] [PubMed]
  24. Chanda, M.; Merghoub, N.; EL Arroussi, H. Microalgae Polysaccharides: The New Sustainable Bioactive Products for the Development of Plant Bio-Stimulants? World J. Microbiol. Biotechnol. 2019, 35, 177. [Google Scholar] [CrossRef]
  25. Bian, J.; Huang, Y.; Yang, S.; Meng, X.; Luo, G.; Wang, Z. Advances in the Agricultural Application of Microalgae-Based Biofertilizers. Soil Fertil. Sci. China 2020, 5, 1–9. [Google Scholar] [CrossRef]
  26. Hong, C.; Wang, Z.; Wang, Y.; Zong, X.; Qiang, X.; Li, Q.; Shaghaleh, H.; Alhaj Hamoud, Y.; Guo, X. Response of Duckweed to Different Irrigation Modes under Different Fertilizer Types and Rice Varieties: Unlocking the Potential of Duckweed (Lemna Minor L.) in Rice Cultivation as “Fertilizer Capacitors”. Agric. Water Manag. 2024, 292, 108681. [Google Scholar] [CrossRef]
  27. Qi, D.; Yan, J.; Zhu, J. Effect of a Reduced Fertilizer Rate on the Water Quality of Paddy Fields and Rice Yields under Fishpond Effluent Irrigation. Agric. Water Manag. 2020, 231, 105999. [Google Scholar] [CrossRef]
  28. Chen, X.; Liu, L.; Yang, Q.; Xu, H.; Shen, G.; Chen, Q. Optimizing Biochar Application Rates to Improve Soil Properties and Crop Growth in Saline–Alkali Soil. Sustainability 2024, 16, 2523. [Google Scholar] [CrossRef]
  29. Zhao, F.; Xu, C.; Zhang, W.; Zhang, X.; Li, F.; Chen, J.; Wang, D. Effects of Rhizosphere Dissolved Oxygen Content and Nitrogen Form on Root Traits and Nitrogen Accumulation in Rice. Rice Sci. 2011, 18, 304–310. [Google Scholar] [CrossRef]
  30. Hernandez-Soriano, M.C.; Kerré, B.; Kopittke, P.M.; Horemans, B.; Smolders, E. Biochar Affects Carbon Composition and Stability in Soil: A Combined Spectroscopy-Microscopy Study. Sci. Rep. 2016, 6, 25127. [Google Scholar] [CrossRef]
  31. Zhang, T.; Wan, S.; Kang, Y.; Feng, H. Urease Activity and Its Relationships to Soil Physiochemical Properties in a Highly Saline-Sodic Soil. J. Soil Sci. Plant Nutr. 2014, 14, 304–315. [Google Scholar] [CrossRef]
  32. Forde, B.; Lorenzo, H. The Nutritional Control of Root Development. Plant Soil 2001, 232, 51–68. [Google Scholar] [CrossRef]
  33. Kiba, T.; Krapp, A. Plant Nitrogen Acquisition Under Low Availability: Regulation of Uptake and Root Architecture. Plant Cell Physiol. 2016, 57, 707–714. [Google Scholar] [CrossRef]
  34. Backer, R.G.M.; Saeed, W.; Seguin, P.; Smith, D.L. Root Traits and Nitrogen Fertilizer Recovery Efficiency of Corn Grown in Biochar-Amended Soil under Greenhouse Conditions. Plant Soil 2017, 415, 465–477. [Google Scholar] [CrossRef]
  35. Li, J.; Dai, K.; Zhang, L.; Ji, S.; Qiao, Z.; Jiao, Y.; Meng, J.; Lan, Y. Effects of Biochar Application on Aggregate Composition and Organic Carbon Distribution in Red Soils of Yunnan Tobacco-Growing Areas. J. Environ. Sci. 2016, 36, 2114–2120. [Google Scholar] [CrossRef]
  36. Wei, W.; Chen, Z.; Hu, J.; Yang, J.; Jiang, X.; Ge, Y.; Sun, L.; Miu, Y.; Tao, Z. A Review on the Formation of Coastal Saline-Alkali Lands and Ion Adsorption Patterns. Chin. J. Soil Sci. 2017, 48, 1003–1007. [Google Scholar] [CrossRef]
  37. Liang, X.; Yi, K.; Li, M.; Feng, R.; Ma, L.; Song, Y.; Wang, X.; Guo, H. Effects of Biochar on Root Growth and Physiological Characteristics of Quinoa in Saline-Alkali Soil. Shandong Agric. Sci. 2020, 52, 24–29+38. [Google Scholar] [CrossRef]
  38. Liu, L.-P.; Long, X.-H.; Shao, H.-B.; Liu, Z.-P.; Tao, Y.; Zhou, Q.-S.; Zong, J.-Q. Ameliorants Improve Saline–Alkaline Soils on a Large Scale in Northern Jiangsu Province, China. Ecol. Eng. 2015, 81, 328–334. [Google Scholar] [CrossRef]
  39. Shang, H.; Yan, A.; Han, R.; Yao, Y.; Chang, Y.; Yang, H.; Chen, L.; Meng, T. Preliminary Study on the Improvement of Newly Reclaimed Tidal Flat Saline Soil Using Microbial Amelioration Substrates. Trans. Chin. Soc. Agric. Eng. 2020, 36, 120–126. [Google Scholar] [CrossRef]
  40. Yang, Y.; Ahmed, W.; Ye, C.; Yang, L.; Wu, L.; Dai, Z.; Khan, K.A.; Hu, X.; Zhu, X.; Zhao, Z. Exploring the Effect of Different Application Rates of Biochar on the Accumulation of Nutrients and Growth of Flue-Cured Tobacco (Nicotiana Tabacum). Front. Plant Sci. 2024, 15, 1225031. [Google Scholar] [CrossRef]
  41. Cui, Y.; Meng, J.; Wang, Q.; Zhang, W.; Cheng, X.; Chen, W. Effects of Straw and Biochar Addition on Soil Nitrogen, Carbon, and Super Rice Yield in Cold Waterlogged Paddy Soils of North China. J. Integr. Agric. 2017, 16, 1064–1074. [Google Scholar] [CrossRef]
  42. Partey, S.T.; Preziosi, R.F.; Robson, G.D. Short-Term Interactive Effects of Biochar, Green Manure, and Inorganic Fertilizer on Soil Properties and Agronomic Characteristics of Maize. Agric. Res. 2014, 3, 128–136. [Google Scholar] [CrossRef]
  43. Blanco-Canqui, H. Biochar and Soil Physical Properties. Soil Sci. Soc. Am. J. 2017, 81, 687–711. [Google Scholar] [CrossRef]
  44. Kätterer, T.; Roobroeck, D.; Andrén, O.; Kimutai, G.; Karltun, E.; Kirchmann, H.; Nyberg, G.; Vanlauwe, B.; Röing de Nowina, K. Biochar Addition Persistently Increased Soil Fertility and Yields in Maize-Soybean Rotations over 10 Years in Sub-Humid Regions of Kenya. Field Crops Res. 2019, 235, 18–26. [Google Scholar] [CrossRef]
  45. Xiang, Y.; Deng, Q.; Duan, H.; Guo, Y. Effects of Biochar Application on Root Traits: A Meta-Analysis. GCB Bioenergy 2017, 9, 1563–1572. [Google Scholar] [CrossRef]
  46. Chen, J.; Wang, Y.; Benemann, J.R.; Zhang, X.; Hu, H.; Qin, S. Microalgal Industry in China: Challenges and Prospects. J. Appl. Phycol. 2016, 28, 715–725. [Google Scholar] [CrossRef]
  47. Parmar, P.; Kumar, R.; Neha, Y.; Srivatsan, V. Microalgae as next Generation Plant Growth Additives: Functions, Applications, Challenges and Circular Bioeconomy Based Solutions. Front. Plant Sci. 2023, 14, 1073546. [Google Scholar] [CrossRef]
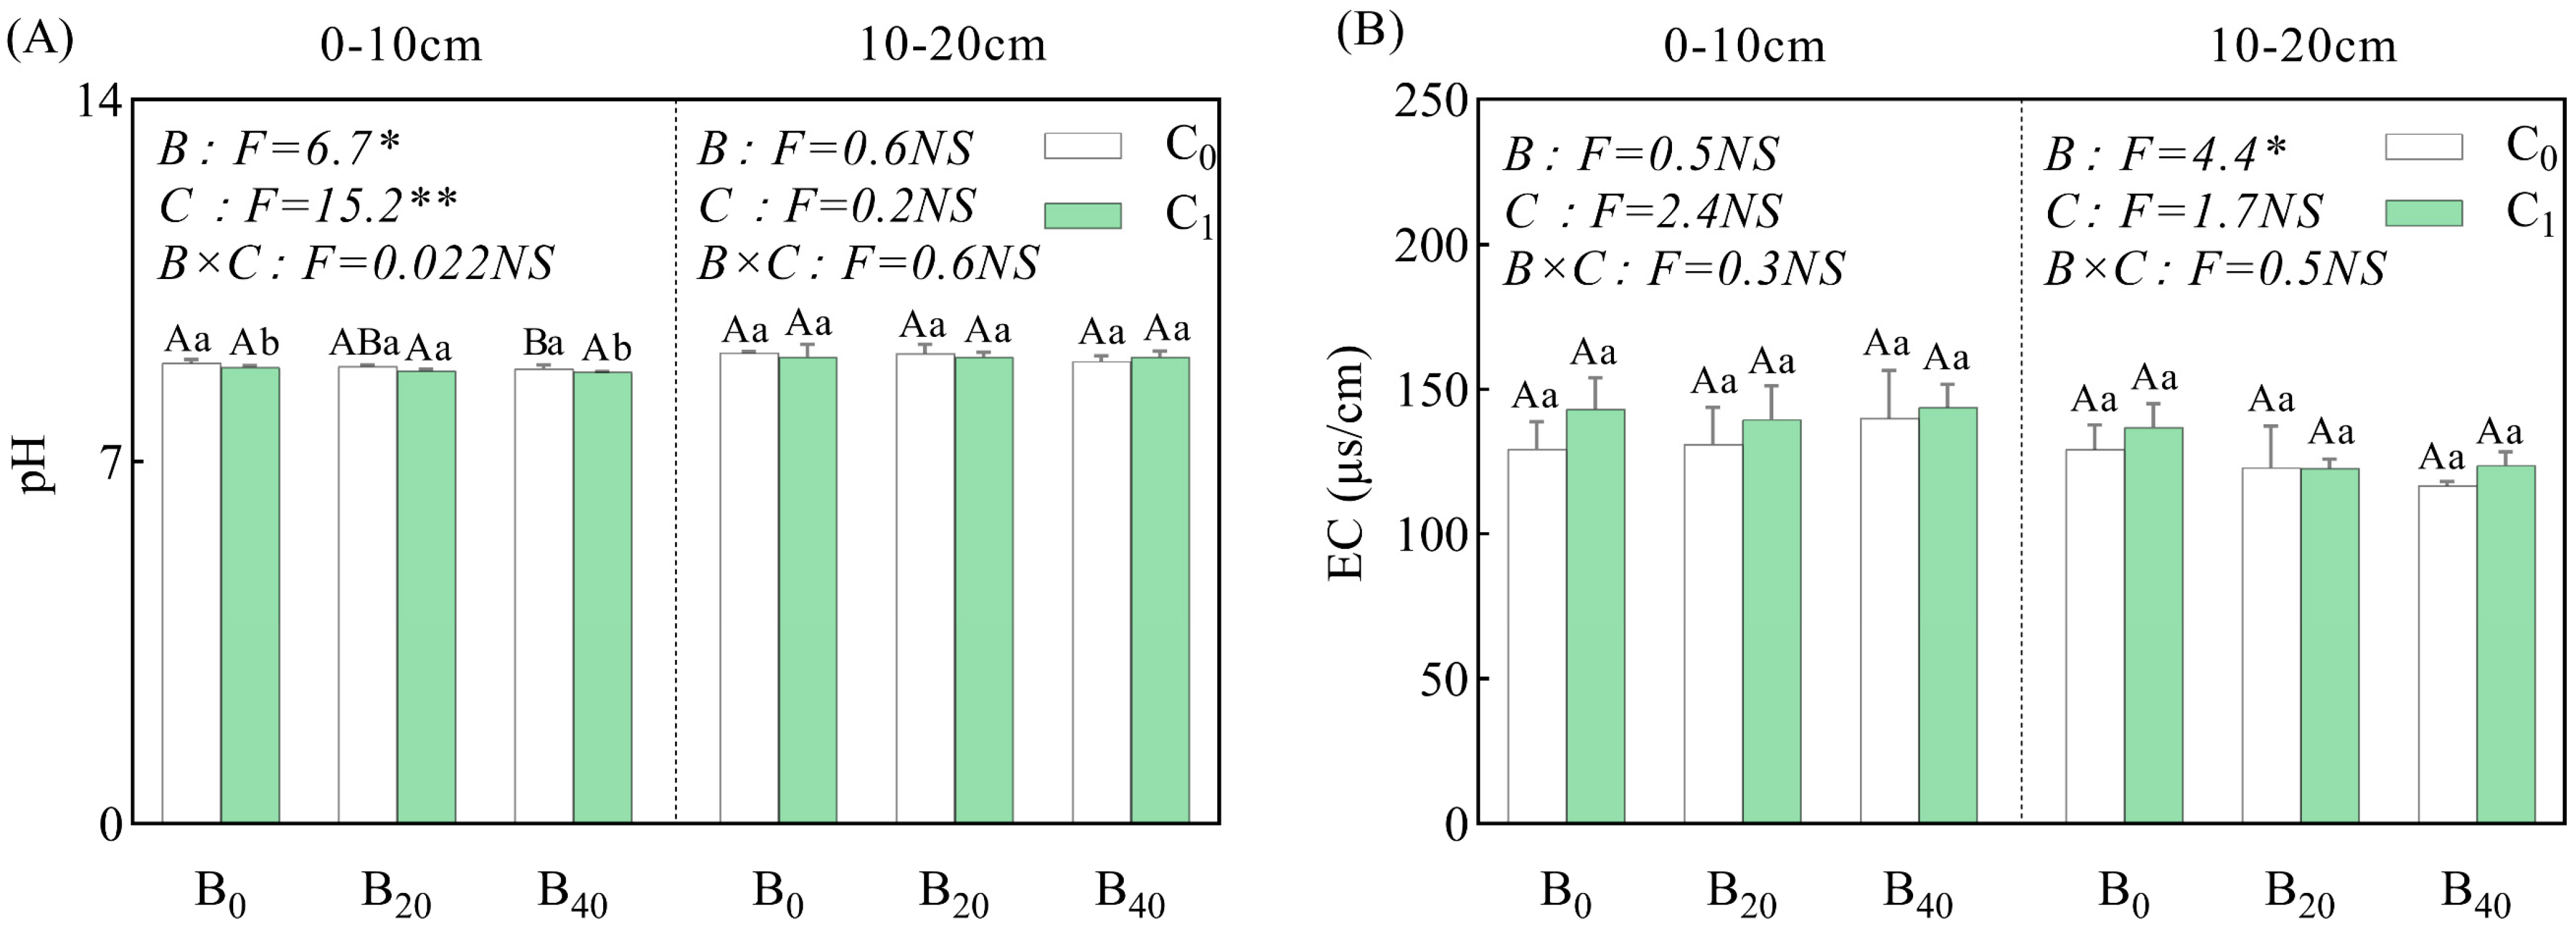
Figure 1. Effects of biochar and Chlorella on soil pH (A) and electrical conductivity (B) in 0–10 cm and 10–20 cm soil layers. Different uppercase letters (A, B) indicate significant differences among different biochar application rates under the same Chlorella treatment at the p ≤ 0.05 level, while different lowercase letters (a, b) denote significant differences between Chlorella addition and non-addition treatments under the same biochar application rate at the p ≤ 0.05 level. Error bars denote the standard error of the mean, with three replicates. Treatment abbreviations are as follows: C0: no Chlorella added; C1: Chlorella added; B0: no biochar added; B20: 0.98 g/kg biochar applied; B40: 1.97 g/kg biochar applied. Significance indicators: * denotes a significant difference at p ≤ 0.05; ** at p ≤ 0.01; NS indicates no significant difference (p > 0.05).
Agronomy 15 02508 g001
Figure 2. Effects of biochar and Chlorella on soil ammonium nitrogen (A), nitrate nitrogen (B), available phosphorus (C), total organic matter (D), and total nitrogen (E) in 0–10 cm and 10–20 cm soil layers. Different uppercase letters (A, B, C) indicate significant differences among different biochar application rates under the same Chlorella treatment at the p ≤ 0.05 level, while different lowercase letters (a, b) denote significant differences between Chlorella addition and non-addition treatments under the same biochar application rate at the p ≤ 0.05 level. Error bars denote the standard error of the mean, with three replicates. Treatment abbreviations are as follows: C0: no Chlorella added; C1: Chlorella added; B0: no biochar added; B20: 0.98 g/kg biochar applied; B40: 1.97 g/kg biochar applied. Significance indicators: * denotes a significant difference at p ≤ 0.05; ** at p ≤ 0.01; *** at p ≤ 0.001; NS indicates no significant difference (p > 0.05).
Agronomy 15 02508 g002
Figure 3. Effects of biochar and Chlorella on soil urease activity (A) and catalase activity (B) in 0–10 cm and 10–20 cm soil layers. Different uppercase letters (A, B) indicate significant differences among different biochar application rates under the same Chlorella treatment at the p ≤ 0.05 level, while different lowercase letters (a, b) denote significant differences between Chlorella addition and non-addition treatments under the same biochar application rate at the p ≤ 0.05 level. Error bars denote the standard error of the mean, with three replicates. Treatment abbreviations are as follows: C0: no Chlorella added; C1: Chlorella added; B0: no biochar added; B20: 0.98 g/kg biochar applied; B40: 1.97 g/kg biochar applied. Significance indicators: * denotes a significant difference at p ≤ 0.05; *** at p ≤ 0.001; NS indicates no significant difference (p > 0.05).
Agronomy 15 02508 g003
Figure 4. Effects of biochar and Chlorella on belowground biomass (A), taproot length (B), total root length (C), root surface area (D), root diameter (E), and root volume (F) of plants. Different uppercase letters (A, B, C) indicate significant differences among different biochar application rates under the same Chlorella treatment at the p ≤ 0.05 level, while different lowercase letters (a, b) denote significant differences between Chlorella addition and non-addition treatments under the same biochar application rate at the p ≤ 0.05 level. Error bars denote the standard error of the mean, with three replicates. Treatment abbreviations are as follows: C0: no Chlorella added; C1: Chlorella added; B0: no biochar added; B20: 0.98 g/kg biochar applied; B40: 1.97 g/kg biochar applied. Significance indicators: * denotes a significant difference at p ≤ 0.05; ** at p ≤ 0.01; *** at p ≤ 0.001; NS indicates no significant difference (p > 0.05).
Agronomy 15 02508 g004
Figure 5. Soil-Growth-Yield Correlation Analysis. The numbers in the top-right corner of the scale on the right denote the correlation coefficients. Significance symbols: * indicates a significant correlation at p ≤ 0.05; ** indicates a significant correlation at p ≤ 0.01; *** indicates a significant correlation at p ≤ 0.001. Herein, orange represents a negative correlation, while blue represents a positive correlation.
Agronomy 15 02508 g005
Table 1. Water control during different rice growth stages.
Irrigation ModeControl IndexGreening StageTillering StageJointing-Booting StageHeading-Flowering StageMilk Ripe StageYellow Ripe Stage
Flood IrrigationIrrigation Upper Limit/mm25505050500
Irrigation Lower Limit/mm203030303070%
Note: The percentage in the table represents the soil water content in the root zone as a percentage of saturated water content.
Table 2. Pot experiment treatments.
TreatmentChlorellaBiochar Application Rate
B0C0No Chlorella0 g/kg
B0C1Apply Chlorella0 g/kg
B20C0No Chlorella0.98 g/kg
B20C1Apply Chlorella0.98 g/kg
B40C0No Chlorella1.97 g/kg
B40C1Apply Chlorella1.97 g/kg
Table 3. Effects of biochar and Chlorella on yield.
TreatmentEffective Panicles
Number (No./Hill)
Grains per
Panicle (No.)
Seed Setting Rate (%)1000-Grain Weight (g)Grain Yield (g/Hill)Aboveground
Biomass (g)
B0C06.7 ± 0.6 Ab109.3 ± 17.9 Aa91.85 ± 1.52 Aa23.90 ± 0.64 ABa17.51 ± 4.27 ABb31.70 ± 2.89 Bb
B0C110.3 ± 1.2 Aa102.3 ± 11.0 Aa92.18 ± 1.51 Aa24.36 ± 1.09 Aa25.58 ± 2.27 Aa46.80 ± 1.30 Aa
B20C05.7 ± 0.6 Ab108.0 ± 5.6 Aa91.73 ± 1.00 Aa22.51 ± 1.35 Bb13.67 ± 0.84 Bb32.85 ± 2.40 Bb
B20C19.3 ± 0.6 ABa98.3 ± 3.2 Aa91.95 ± 1.37 Aa24.84 ± 0.47 Aa22.78 ± 0.77 Aa38.15 ± 1.82 Ba
B40C08.0 ± 0.0 Ba106.0 ± 15.9 Aa93.06 ± 0.99 Aa25.39 ± 1.14 Aa21.57 ± 3.87 Aa40.12 ± 4.51 Aa
B40C18.3 ± 0.6 Ba101.7 ± 5.7 Aa93.36 ± 0.35 Aa25.58 ± 0.32 Aa21.77 ± 1.80 Aa29.40 ± 3.43 Cb
BiocharNSNSNS*NS*
Chlorella***NSNS*****
Biochar × Chlorella**NSNSNS****
Note: Different uppercase letters (A, B, C) indicate significant differences among different biochar application rates under the same Chlorella treatment at the p ≤ 0.05 level, while different lowercase letters (a, b) denote significant differences between Chlorella addition and non-addition treatments under the same biochar application rate at the p ≤ 0.05 level. Error bars denote the standard error of the mean, with three replicates. Treatment abbreviations are as follows: C0: no Chlorella added; C1: Chlorella added; B0: no biochar added; B20: 0.98 g/kg biochar applied; B40: 1.97 g/kg biochar applied. Significance indicators: * denotes a significant difference at p ≤ 0.05; ** at p ≤ 0.01; *** at p ≤ 0.001; NS indicates no significant difference (p > 0.05).
Disclaimer/Publisher’s Note: The statements, opinions and data contained in all publications are solely those of the individual author(s) and contributor(s) and not of MDPI and/or the editor(s). MDPI and/or the editor(s) disclaim responsibility for any injury to people or property resulting from any ideas, methods, instructions or products referred to in the content.