Abstract
To provide a scientific basis for rational nitrogen application under the rice–wheat rotation (R-W rotation) system, this study examined crop yield, NUE, and changes in soil nitrogen pools in response to different nitrogen application rates for rice (0–420 kg ha−1) and wheat (0–360 kg ha−1) from 2020 to 2022 in Jiangsu Province, China. Rice and wheat yields, along with their yield components, exhibited similar responses to nitrogen fertilization. In both cropping seasons, not only did current-season nitrogen application (CN) significantly affect yields but previous-season nitrogen application (PN) and the interaction between CN and PN also had notable effects. For both crops, the impact of CN on yield was greater than that of the CN × PN interaction, which in turn exceeded the effect of PN alone. These effects diminished with an increasing number of rice–wheat rotation cycles. The yields of rice and wheat initially increased and then declined with rising rates of both CN and PN. The maximum combined yield (14,459.9 kg ha−1) was achieved with nitrogen application rates of 265.7 kg ha−1 in the rice season and 257.1 kg ha−1 in the wheat season. Yield responses to CN were primarily driven by panicle number, spikelets per panicle, and crop-specific traits, grain filling efficiency for rice, and grain weight for wheat. PN effects were mediated through its interaction with CN, with panicle number serving as the main pathway. However, when nitrogen application rates fell below 300 kg ha−1 for rice and 240 kg ha−1 for wheat, a reduction in soil nitrogen content was observed. Therefore, to achieve high yields while maintaining soil nitrogen pool stability, recommended nitrogen application rates are 300 kg ha−1 for the rice season and 257.1 kg ha−1 for the wheat season.
1. Introduction
Rice–wheat rotation (R-W rotation) is a major cropping system in Jiangsu Province. In 2022, the total cultivated area of rice and wheat in the province reached 4.577 million hectares, accounting for 7.47% of the national rice and wheat cultivated area. The total output of rice and wheat was 33.27 million tons, representing 9.51% of the national production [1]. Nitrogen fertilizer plays a crucial role in rice and wheat production [2,3]. Under the R-W rotation system, the average nitrogen use efficiency ranges from 13.7% to 45.7%. Approximately 50% of applied nitrogen is lost through volatilization, runoff, and leaching, while a portion remains in the soil [4]. Long-term continuous cropping combined with high fertilizer inputs not only affects the soil nitrogen pool and the environment but also significantly reduces NUE [5,6,7]. Since NUE and loss rates are directly linked to crop yield and environmental impacts, optimizing nitrogen application under the R-W rotation system has become a critical issue in crop science research.
Most existing studies have focused on either the rice or wheat season as monocrops. Some have explored how reducing nitrogen input can maintain high yields while improving nitrogen efficiency [8]. As a traditional farming practice in China’s Yangtze River basin, excessive nitrogen fertilizer application not only fails to increase crop yields but also leads to nitrogen migration and transformation, resulting in nitrogen loss from the soil nitrogen pool [9]. Simultaneously, crop nitrogen fertilizer use efficiency gradually decreases as nitrogen fertilizer application rates increase [10]. For instance, under varying nitrogen levels, long-term reductions in nitrogen fertilizer were found to significantly affect rice yield, nitrogen uptake, and utilization [11]. Other studies have identified appropriate nitrogen application rates for local rice varieties [12,13] and explored how different nitrogen application levels and methods affect ammonia volatilization, NUE, and yield in paddy fields. One such study reported an optimal rice yield at an application rate of 240 kg ha−1 [14].
Nitrogen application also influences crop NUE. The nitrogen harvest index remained stable at 70.31% when application rates were below 232.64 kg ha−1. Long-term nitrogen reduction improved nitrogen bias productivity and physiological efficiency, though soil nitrogen depletion was observed when application rates fell below 225.95 kg ha−1 [15,16,17]. Nitrogen in soil primarily exists in two forms: inorganic nitrogen and organic nitrogen. Inorganic nitrogen is mainly divided into two forms: nitrate nitrogen and ammonium nitrogen [18,19]. Due to the unique growth characteristics of rice, paddy fields exhibit poor aeration, leading to increased conversion of nitrate nitrogen into ammonium nitrogen through reduction reactions. Rice plants are also more sensitive to NH4+-N uptake [20]. With the application of nitrogen fertilizer, nitrogen undergoes transformation in wheat field soil, with more ammonium nitrogen being converted into nitrate nitrogen through oxidation reactions [21]. Meanwhile, compared to rice, wheat absorbs and utilizes nitrate nitrogen more extensively during its growth and development. Consequently, the concentration of NO3−-N in the soil also influences wheat yield formation [22]. Tracer studies using 15N have also been conducted to track fertilizer nitrogen loss and residual effects after prolonged non-application periods in R-W rotation systems [23]. Additionally, studies focusing on wheat have shown that reducing nitrogen input can lower ammonia volatilization and improve NUE and yield, especially under straw return conditions [24,25]. Overall, optimizing nitrogen application is essential for ensuring both economic and environmental sustainability in the R-W rotation system [26].
Previous research has mostly focused on single-season crops, and relatively few studies have examined R-W rotation as a holistic system. A system-wide approach enables better macro-level management of nitrogen application, leading to more scientifically grounded and reasonable fertilizer use across the entire rotation cycle. Based on a long-term rice–wheat rotation field experiment, this study investigates how varying nitrogen application rates in one season affect yield and nitrogen use efficiency in the subsequent season. The goal is to provide a sound theoretical foundation for future research and practical agricultural decision-making.
2. Materials and Methods
2.1. Experimental Sites
The study was conducted using an annual rotation of summer rice (June to October) and winter wheat (November to May of the following year) at the Innovative Experimental Base of Academician Zhang Hongcheng, located in Shatou Town, Yangzhou City, Jiangsu Province, China (119°56′ E, 32°32′ N). The experiment began during the rice-growing season in June 2019. The site is situated in a transitional zone between a subtropical monsoon humid climate and a temperate monsoon climate. By May 2022, two full R-W rotation cycles had been completed, one from June 2020 to May 2021 and another from June 2021 to May 2022, each consisting of two fertilization seasons. The maximum, minimum, and average temperatures, along with rainfall data during the vegetative, reproductive, and ripening stages of both rice and wheat in the two rotation cycles, are presented in Table 1 and Table 2. The experimental field soil was classified as sandy loam. Initial soil chemical properties measured in 2019 were as follows: organic carbon, 15.33 g kg−1; total nitrogen (TN), 2.28 g kg−1; Olsen phosphorus, 14.85 mg kg−1; available potassium, 121.37 mg kg−1 (dry weight basis); and a soil pH of 8.3.

Table 1.
Temperature and rainfall of the study area in different growth stages of rice in two rotations.

Table 2.
Temperature and rainfall of the study area in different growth stages of wheat in two rotations.
2.2. Experimental Design and Crop Management
The experiment was established with different nitrogen application levels: 0, 180, 240, 300, 360, and 420 kg ha−1 in the rice season, and 0, 180, 240, 300, and 360 kg ha−1 in the wheat season. The 0 kg ha−1 treatment served as the control group, 180 kg ha−1 represented the low nitrogen application rate, 240–300 kg ha−1 corresponded to commonly applied nitrogen levels in rice–wheat rotation systems in Jiangsu Province, while 360–420 kg ha−1 constituted the high nitrogen application rate treatment combination. These treatments were combined in a full-factorial design, resulting in 30 treatment combinations. We employed RCBD design with two blocks. Each plot measured 47.5 m2 (9.5 m × 5 m), and every treatment was replicated twice. Rice (Nanjing 5718) seedlings were manually transplanted annually between 10 and 15 June at a hill spacing of 12 cm × 30 cm, with four seedlings per hill. Wheat (Yangmai 25) was sown at a seeding rate of 150 kg ha−1 between 10 and 15 November each year. Urea was used as the nitrogen source, applied in four stages following a ratio of 4:2:2:2 (basal–tillering–spikelet-promoting–flowering). Phosphorus and potassium fertilizers were applied as basal fertilizers. Calcium superphosphate and potassium chloride were used as the phosphorus and potassium sources, respectively. Application rates were 394.5 kg ha−1 and 262.5 kg ha−1 in the rice season, and 750 kg ha−1 and 240 kg ha−1 in the wheat season. During the experiment, crop residues were crushed and returned to the field using agricultural machinery. Irrigation conditions were consistent across treatments, utilizing conventional pumped irrigation. Pest control and field management practices were uniformly implemented in accordance with high-yield cultivation standards.
2.3. Sampling and Measurements
2.3.1. Grain Yield and Yield Components
At the maturity stage of both rice and wheat, three representative hills of plants were randomly selected from each plot, excluding border plants, to measure grain number per spike, grain weight, and seed setting rate (for rice only). The above-ground parts of the sampled rice and wheat plants were oven-dried at 70 °C for 48 h to a constant weight and then weighed to determine shoot biomass. Panicle density for rice and wheat was assessed using three randomly placed 1 m2 quadrats per plot. Rice yield was measured by harvesting and weighing grains (adjusted to 14.5% moisture content) from 100 hills collected at three randomly selected locations within each plot. Wheat yield was determined by weighing grains (adjusted to 13% moisture content) harvested from three randomly selected 1 m2 quadrats per plot.
The yield responses to previous and current nitrogen applications followed a quadratic relationship, described by the following equation:
where Y is the yield; y0 is the yield without nitrogen application; X1 and X2 represent the nitrogen application rates in the previous and current seasons, respectively; and a, b, c, d, and e are model parameters.
Y = y0 + a X1 + b X2 − c X12 − d X22 + e X1 X2,
2.3.2. Determination of the Plant Nitrogen Concentration
At the jointing, heading, and maturity stages, three representative hills of plants were collected from each plot. The samples were first oven-dried at 105 °C for 30 min, then further dried at 80 °C for 72 h to a constant weight, after which shoot biomass was measured. The nitrogen content in each plant organ was determined using a Kjeldahl nitrogen analyzer (Foss, Rehhamn, Denmark). The TN content per plant was calculated by summing the nitrogen content of all organs. The following indicators were calculated to evaluate NUE, partial factor productivity of applied nitrogen (PFPN), physiological efficiency of applied nitrogen (PEN), recovery efficiency of applied nitrogen (REN), and agronomic efficiency of applied nitrogen (AEN), using the formulas below:
where YN denotes the grain yield with applied nitrogen and TN represents the TN uptake of plants. The unit is kg kg−1.
where YN denotes the grain yield with applied N; Y0 represents the grain yield in nitrogen omission plots; UN indicates the nitrogen uptake in nitrogen application plots; and U0 presents the nitrogen uptake in nitrogen omission plots. The unit is kg kg−1.
where UN represents the nitrogen uptake in nitrogen application plots; U0 indicates the nitrogen uptake in nitrogen omission plots; and TN denotes the TN uptake of plants. The unit is %.
where YN denotes the grain yield with applied N; Y0 indicates the grain yield in nitrogen omission plots; and TN represents the TN uptake of plants. The unit is kg kg−1.
2.3.3. Determination of the Soil
On 5 June 2020 and 20 May 2022, five soil samples were collected from a depth of 0–20 cm and combined for analysis. Soil physicochemical properties were determined following the methods described by [27].
2.4. Data Analysis
The responses of rice and wheat yields to nitrogen application were analyzed and visualized using Origin 2022 software (OriginLab, Northampton, MA, USA). After confirming the normality of the data (Shapiro–Wilk test, p > 0.05) and homogeneity of variance (Levene’s test, p > 0.05), parametric tests were performed. Two-way ANOVA was conducted to evaluate the effects of previous seasons and current seasons (as independent variables), as well as their interaction with shoot biomass, yield, yield components of rice and wheat, and variations in soil nitrogen content (as dependent variables), with a significance threshold of 5%. The effect sizes of the independent variables on the dependent variables were further assessed using the eta-squared (η2) method. All statistical analyses were conducted using SPSS 20 software (IBM, Armonk, NY, USA).
The clustering analysis parameters are as follows. Cluster method: group average; Distance type: Euclidean; Number of clusters: 1; Radial scale factor: 1.
3. Results
3.1. Effect of Nitrogen Application on Grain Yield
The effect sizes of different levels of nitrogen fertilizer application on rice and wheat yields are presented in Table 3. Rice yields were significantly influenced by current-season nitrogen application (CN) and the interaction between current and previous nitrogen applications in both rotations. However, the significant effect of previous-season nitrogen application (PN) on rice yield was observed only in the first rotation. Compared to the first rotation, the effect sizes of PN, CN, and their interaction on rice yield all decreased in the second rotation. The greater effect size of CN compared to that of PN indicates that rice yield is more strongly influenced by nitrogen applied in the current season.

Table 3.
Effect size (η2) (%) of previous and current nitrogen application on rice and wheat yield.
Similarly, wheat yields were significantly affected by both previous-season application and CN in both rotations. In each case, the effect size of CN exceeded that of the previous-season application. The interaction between previous-season application and CN also had a significant effect on wheat yield, with effect sizes of 56.30% in the first rotation and 37.80% in the second rotation. When comparing the two rotations, the effect sizes of PN, CN, and their interaction on rice yield decreased by 44.71%, 0.91%, and 32.86%, respectively, in the second rotation.
The responses of rice and wheat yields to nitrogen application in two R-W rotations (2020–2021) are shown in Figure 1 and Figure 2. The coefficient of determination (R2) values exceeded 0.8 for rice and 0.9 for wheat, indicating strong model fits. Although model parameters varied between the two rotations, the general trend of yield response was consistent: as nitrogen application increased in both rice and wheat seasons, yield first increased to a peak and then declined.
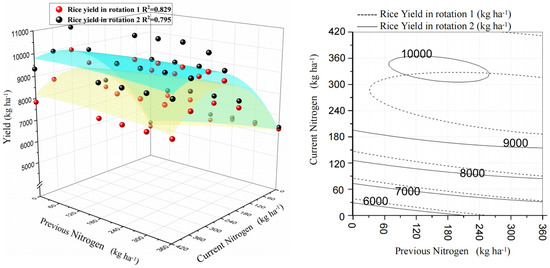
Figure 1.
Response surface (right) and its projection (left) diagram of rice yield to nitrogen application in rice–wheat rotation. Rotation 1: the first rice–wheat rotation from June 2020 to May 2021. Rotation 2: the second rice–wheat rotation from June 2021 to May 2022.
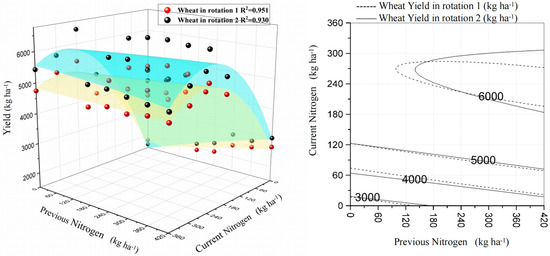
Figure 2.
Response surface (right) and its projection (left) diagram of wheat yield to nitrogen application in rice–wheat rotation. Rotation 1: the first rice–wheat rotation from June 2020 to May 2021. Rotation 2: the second rice–wheat rotation from June 2021 to May 2022.
Under the baseline fertility conditions of the experimental plots, rice yield in the 0N treatments remained around 5000 kg ha−1 across both rotations. At all levels of PN, rice yield increased and then decreased with rising CN. When less than 300 kg ha−1 of nitrogen was applied in the current season, rice yield increased steadily with greater nitrogen input in the previous season. However, when CN exceeded 300 kg ha−1, rice yield initially rose and then declined with increasing nitrogen input in the previous crop.
Regression analysis revealed that the highest rice yield (10,028.4 kg ha−1) was achieved with 334.3 kg ha−1 of nitrogen in the current season and 161.6 kg ha−1 in the previous crop. A rice yield of 10,000.0 kg ha−1 was attained when nitrogen application ranged from 73.5 to 257.1 kg ha−1 in the previous season and from 308.6 to 360.0 kg ha−1 in the current season. The minimum nitrogen input combination needed to reach this yield was 161.6 kg ha−1 in the previous season and 308.6 kg ha−1 in the current season.
The trend of wheat yield response to targeted nitrogen fertilizer application was similar to that observed in the rice season (Figure 2). During the trial, wheat yield without nitrogen fertilizer was maintained at around 1700 kg ha−1. Wheat yield exhibited an initial increase followed by a decrease as nitrogen application in the current season increased across all levels of PN. When nitrogen applied in the current season was below 240 kg ha−1, wheat yield increased progressively with higher nitrogen input in the previous crop. However, with nitrogen application above 240 kg ha−1 in the current season, wheat yield declined as nitrogen application in the previous crop increased.
Regression analysis indicated that the highest wheat yield (6031.8 kg ha−1) was achieved with 235.1 kg ha−1 of nitrogen in the current season and 420.0 kg ha−1 in the previous crop. A wheat yield of 6000.0 kg ha−1 was obtained when nitrogen application ranged from 248.8 to 420.0 kg ha−1 in the previous crop and 213.1 to 257.1 kg ha−1 in the current season. The minimum nitrogen input combination to reach this yield was 282.9 kg ha−1 in the previous crop and 235.1 kg ha−1 in the current season.
The regression equation also revealed that continuous nitrogen fertilizer application influenced subsequent crop yields at the study location. This is illustrated by the shift between the dashed and solid lines in the mapping plot, indicating that nitrogen applied in the previous crop affects the yield of the current crop. The combined maximum yield of rice and wheat (14,459.9 kg ha−1) was achieved when nitrogen application was 265.7 kg ha−1 in the rice season and 257.1 kg ha−1 in the wheat season.
3.2. Effect of Nitrogen Application on Crop Yield Components
The effect size of different nitrogen fertilizer application levels on rice yield components is summarized in Table 4. Nitrogen application had the greatest impact on rice panicles, followed by grain number per spike, with the least effect on grain weight. The maximum effect of current-season nitrogen fertilization on panicles was 96.70% and 96.50% in the two R-W rotations, respectively. The effect size of nitrogen applied to the previous crop on panicles was 19.60% and 14.40%, while the interaction effect between previous- and current-season nitrogen application on panicles was 59.70% and 37.40%. Among these, only the effect of nitrogen applied to the previous crop during the second rotation on panicles was not statistically significant. For grain number per spike, the effect size of nitrogen application in the current season was 87.10% and 81.40% in the two rotations, both reaching significance. The interaction effect was 21.00% and 17.10%, significant only in the first rotation, whereas the effect of nitrogen applied to the previous crop on grain number per spike was low at 7.00% and 5.20%, respectively. The effect size of current-season nitrogen on seed setting rate was 68.50% and 30.90% in the two years, both significant. However, the effect size of nitrogen applied to the previous crop on seed setting rate was minimal, at 2.30% and 2.00%, with interaction effects at 5.20% and 5.10%. Nitrogen fertilizer had the least influence on grain weight, with current-season application effects of 18.30% and 9.20%, previous-crop effects of 0.5% and 0.3%, and interaction effects of 2.90% and 1.30%, none of which were significant. CN significantly influenced the number of panicles, grain number per spike, and seed setting rate across both R-W rotations, though the effect sizes decreased in the second rotation. Specifically, the effect sizes for panicles, grain number per spike, and seed setting rate decreased by 0.21%, 6.54%, and 54.89%, respectively, in the second rotation compared to the first. The effect sizes of previous-crop nitrogen application and the interaction between current and previous nitrogen applications on these components followed the same decreasing trend. Regarding nitrogen applied in the previous crop, the effect sizes on the four yield components, panicles, grain number per spike, seed setting rate, and grain weight, decreased by 26.53%, 25.71%, 40.00%, and 13.04%, respectively. Nitrogen applied to the previous crop significantly affected panicles only in the first rotation. The interaction between current and PN reached significance for panicles in both rotations and for grain number per spike in the first rotation.

Table 4.
Effect size (η2) (%) of previous and current nitrogen application on rice yield components.
The distribution of colors in the heatmaps of Figure 3 shows the greatest variation in panicles and the least variation in grain weight, further confirming that nitrogen fertilizer has the strongest effect on grain number per spike and the weakest on grain weight in rice. Cluster analysis grouped treatments with no nitrogen application in the current season (i.e., CN0PN0, CN0PN180, CN0PN240, CN0PN300, and CN0PN360) together. This group exhibited lower yields, attributed to reduced panicles and grain number per spike. Under the treatment of 300 kg ha−1 nitrogen in the current season, treatments CN300PN0, CN300PN180, CN300PN240, CN300PN300, and CN300PN360 clustered together. These treatments had higher panicles and grain number per spike, resulting in increased yields. Notably, the CN300PN240 treatment had the highest panicles, grain number per spike, and seed setting rate, which corresponded with the maximum rice yield. In contrast, panicles and grain number per spike gradually declined with increasing nitrogen application in the previous crop, indicating that excessive nitrogen in the previous season reduces the yield components in the current season. For high nitrogen treatments, CN360PN0 through CN360PN360 formed one cluster, while CN420PN0 through CN420PN360 formed another. In both groups, panicles and grain number per spike continued to decrease as nitrogen application increased, leading to a gradual decline in yield. This demonstrates that excessive nitrogen fertilizer adversely affects rice yield components, ultimately reducing final yield.
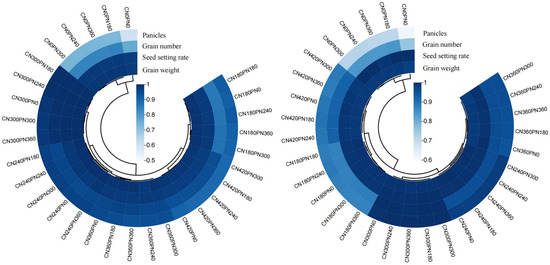
Figure 3.
Cluster heatmap analysis of rice on yield components in two rice–wheat rotations. The first rotation is on the (left) and the second rotation is on the (right). Rotation 1: the first rice–wheat rotation from June 2020 to May 2021. Rotation 2: the second rice–wheat rotation from June 2021 to May 2022.
During the wheat season (Table 5), the response of wheat yield components to nitrogen application followed a similar pattern to that of rice. Nitrogen application in the current season significantly affected wheat panicles, grain number per spike, and grain weight, with effect sizes of 98.40%, 67.80%, and 43.00%, respectively. In contrast, the influence of nitrogen applied to the previous crop on these components was lower, with effect sizes of 47.20% for panicles, 4.10% for grain number per spike, and 3.80% for grain weight, indicating that current-season nitrogen application had a greater impact on wheat yield components than previous-crop nitrogen application. Across the two R-W rotations, the effect of current-season nitrogen application on wheat yield components gradually declined, with decreases of 3.46%, 17.99%, and 41.63% for panicles, grain number per spike, and grain weight, respectively. The effect sizes of previous-crop nitrogen application and the interaction between CN and PN followed similar trends across rotations. Nitrogen applied to the previous crop significantly affected panicles only during the first rotation, while the interaction between current and previous nitrogen applications had a significant effect on panicles in both rotations, though this interaction effect decreased by 47.10% in the second rotation compared to the first.

Table 5.
Effect size (η2) (%) of previous and current nitrogen application on wheat yield components.
The heatmap in Figure 4 illustrates significant color variations among treatments in wheat yield components, indicating that nitrogen fertilizer application influenced panicles, grain number per spike, and grain weight. Cluster analysis identified a group of treatments with no nitrogen applied during the wheat season, including PN0CN0, PN180CN0, PN240CN0, PN300CN0, PN360CN0, and PN420CN0. In this group, both panicles and grain number per spike were significantly lower, resulting in reduced yield. Conversely, under appropriate nitrogen application in the current season (PN240CN240, PN300CN240, PN360CN240, and PN420CN240), panicles and grain number per spike increased substantially, with yield peaking under the PN300CN240 treatment. However, at 240 kg ha−1 nitrogen application in the current season, panicles and grain number per spike declined as nitrogen application to the previous crop increased. Under high nitrogen application treatments (PN0CN360, PN180CN360, PN240CN360, PN300CN360, PN360CN360, and PN420CN360), panicles and grain number per spike continued to decrease compared to the moderate nitrogen group.
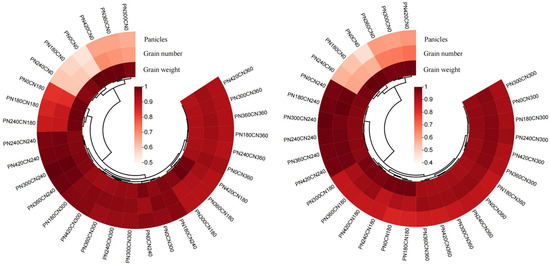
Figure 4.
Cluster heatmap analysis of wheat on yield components in two rice–wheat rotations. The first rotation is on the (left) and the second rotation is on the (right). Rotation 1: the first rice–wheat rotation from June 2020 to May 2021. Rotation 2: the second rice–wheat rotation from June 2021 to May 2022.
3.3. Effect of Nitrogen Application on Crop Nitrogen Utilization
Nitrogen application in the current season had the largest effect on rice NUE, followed by the interaction between CN and PN, with the smallest effect from nitrogen applied in the previous crop (Table 6). Notably, current-season nitrogen application significantly influenced rice NUE. Overall, the effect sizes of both previous- and current-season nitrogen applications on rice NUE declined with increasing rotation cycles.

Table 6.
Effect size (η2) (%) of previous and current nitrogen application on rice nitrogen utilization.
The effect of current season and previous-crop nitrogen application on wheat NUE followed a similar trend to rice (Table 7). Current-season nitrogen application had the greatest impact on wheat NUE, while previous-crop application had the least. The effect of current-season nitrogen application on wheat NUE was also significant. Unlike rice, wheat REN was significantly influenced by previous-crop nitrogen application and its interaction with current-season application. The effects of both current- and previous-crop nitrogen applications on wheat NUE declined gradually with increasing rotation cycles.

Table 7.
Effect size (η2) (%) of previous and current nitrogen application on wheat nitrogen utilization.
Figure 5 and Figure 6 show that nitrogen fertilizer application in both the current season and the previous crop affected crop nitrogen utilization. For the rice season, PFPN, AEN, REN, and PEN remained high when nitrogen application in the current season did not exceed 300 kg ha−1. However, when the nitrogen fertilizer application rate exceeded 300 kg ha−1 during the growing season, the nitrogen use efficiency of rice showed a decreasing trend with increasing fertilizer application rates. At current-season applications below 300 kg ha−1, PFPN and AEN showed no differences among treatments but tended to increase with higher nitrogen application in the previous crop. When current-season nitrogen surpassed 300 kg ha−1, both PFPN and AEN gradually decreased as nitrogen applied to the previous crop increased. Specifically, at 240 kg ha−1 nitrogen applied in the current season, REN and PEN increased by 0.78% and 1.10%, respectively, with higher nitrogen in the previous crop. PEN also rose by an average of 0.99% with increased nitrogen applied to the previous crop when current-season nitrogen was 300 kg ha−1. At 360 kg ha−1 in the current season, both AEN and PEN were influenced by nitrogen applied to the previous crop. For the wheat season, PFPN, AEN, REN, and PEN were lowest when nitrogen application reached 360 kg ha−1 in the current season. Among these, AEN and REN peaked at 240 kg ha−1 of nitrogen applied in the current season. When current-season nitrogen was 180 kg ha−1, PFPN tended to increase with greater nitrogen application in the previous crop, while AEN and REN were affected by the previous crop’s nitrogen level. At 240 kg ha−1 or 300 kg ha−1 nitrogen application in the current season, PFPN and AEN showed a tendency to decrease gradually with increasing previous-crop nitrogen, though these changes were not statistically significant. When nitrogen application in the current season reached 360 kg ha−1, PFPN and AEN were no longer influenced by nitrogen application in the previous crop.
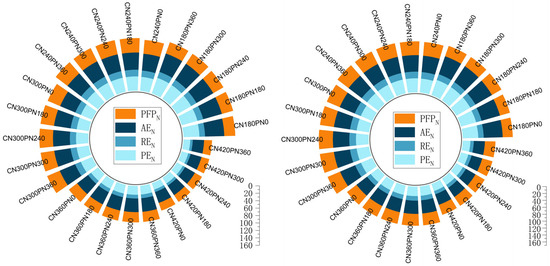
Figure 5.
Partial factor productivity of applied N (PFPN), physiological efficiency of applied N (PEN), recovery efficiency of applied N (REN), agronomic efficiency of applied N (AEN) of the rice as influenced by nitrogen application in two rice–wheat rotations. The first rotation is on the (left) and the second rotation is on the (right). Rotation 1: the first rice–wheat rotation from June 2020 to May 2021. Rotation 2: the second rice–wheat rotation from June 2021 to May 2022.
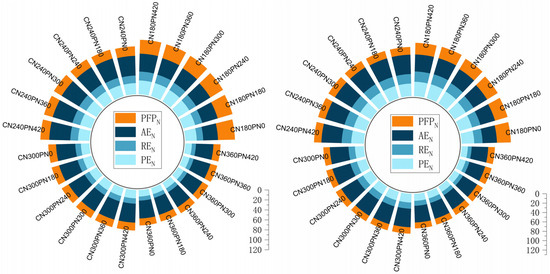
Figure 6.
Partial factor productivity of applied N (PFPN), physiological efficiency of applied N (PEN), recovery efficiency of applied N (REN), agronomic efficiency of applied N (AEN) of the wheat as influenced by nitrogen application in two rice–wheat rotations. The first rotation is on the (left) and the second rotation is on the (right). Rotation 1: the first rice–wheat rotation from June 2020 to May 2021. Rotation 2: the second rice–wheat rotation from June 2021 to May 2022.
3.4. Effects of Different Nitrogen Fertilizer Treatments on Nitrogen Pools in Rice–Wheat Rotation Soils
Changes in soil TN, ammonium (NH4+), and nitrate (NO3−) content during the rice season were significantly affected by nitrogen fertilizer applied in both the current season and the previous crop (Table 8). Nitrogen applied to the previous crop significantly influenced NH4+ and NO3− contents, but not TN content, with its effect decreasing as the rotation period increased. The current season’s nitrogen application had significant effects on changes in TN, NH4+, and NO3−, with effect sizes larger than those of the previous-crop nitrogen application. TN and NO3− contents decreased over successive rotations under the influence of current-season nitrogen application. Similarly, during the wheat season (Table 9), both current- and previous-crop nitrogen applications significantly affected changes in soil nitrogen content. Nitrogen applied to the previous crop had a significant impact on NH4+ and NO3− but not on TN, with the effect on NO3− diminishing as the rotation progressed. The current season’s nitrogen application significantly affected changes in TN, NH4+, and NO3− contents, with reductions in these changes observed as the rotation period increased. Overall, the effects of nitrogen application on soil TN, NH4+, and NO3− contents decreased with increasing rotation cycles, mirroring the trend seen in crop yield responses.

Table 8.
Effect size (η2) (%) of soil nitrogen content changes at the end of the different rice seasons.

Table 9.
Effect size (η2) (%) of soil nitrogen content changes at the end of the different wheat seasons.
Post-harvest soil nitrogen changes after two R-W rotations are shown in Figure 7 for rice. Soil nitrogen content increased with higher nitrogen application rates. After two rotations, total soil nitrogen showed no significant change compared to the initial level. However, when current-season nitrogen application was below 300 kg ha−1, total soil nitrogen exhibited a declining trend. Soil NH4+ and NO3− contents were lower than initial levels under nitrogen applications below 300 kg ha−1 but exceeded initial values when nitrogen exceeded 360 kg ha−1. This suggests that applying more than 300 kg ha−1 of nitrogen in the current rice season helps maintain soil nitrogen pool stability. Nitrogen application above 420 kg ha−1 significantly increased the soil nitrogen pool, posing a higher risk of nitrogen loss.
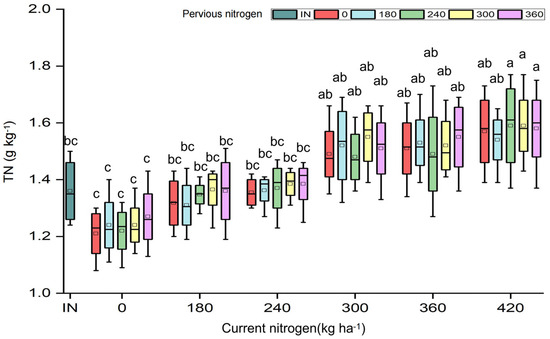

Figure 7.
Post-harvest soil nitrogen changes in rice after two rice–wheat rotations. “a, b, c, d, e, f, g” is the ANOVA with the different treatment combinations. CN: nitrogen applied in the current season, PN: nitrogen application of the previous crop, IN: initial soil nitrogen content. The upper and lower boundaries of each box represent the 75th and 25th percentile, respectively. The horizontal line in the box represents the median, and the box represents the 2 mean.
Similarly, Figure 8 shows that soil nitrogen content in wheat fields increased with rising nitrogen application rates. After two rotations, total soil nitrogen remained stable compared to the initial level. Yet, a declining trend was observed when nitrogen application fell below 240 kg ha−1. Significant decreases in NH4+ and NO3− contents occurred under these lower nitrogen applications.
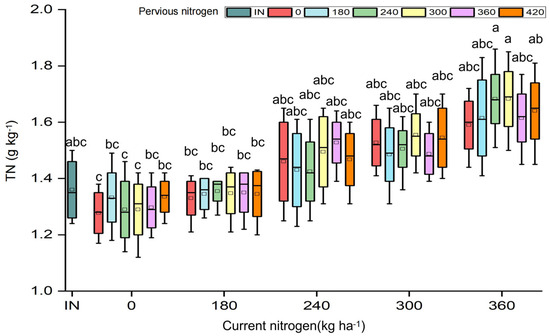
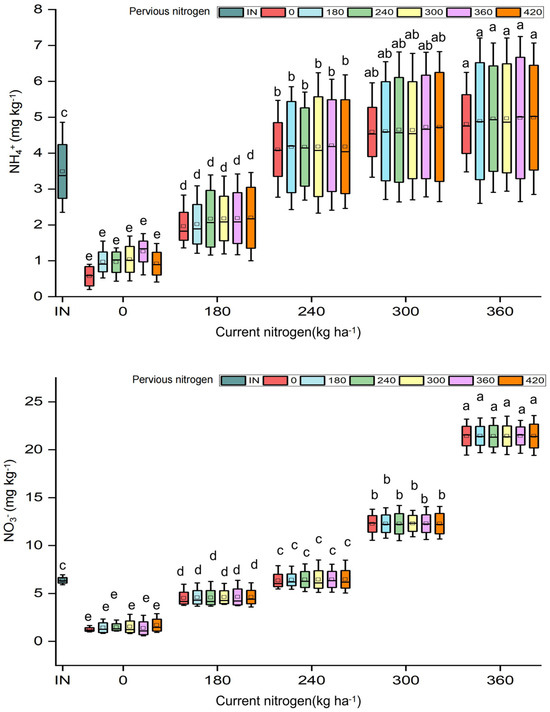
Figure 8.
Post-harvest soil nitrogen changes in wheat after two rice–wheat rotations. “a, b, c, d, e” is the ANOVA with the different treatment combinations. CN: nitrogen applied in the current season, PN: nitrogen application of the previous crop, IN: initial soil nitrogen content. The upper and lower boundaries of each box represent the 75th and 25th percentile, respectively. The horizontal line in the box represents the median, and the box represents the mean.
Considering crop yield and NUE comprehensively, nitrogen application rates of at least 300 kg ha−1 for rice and 257.1 kg ha−1 for wheat are recommended. These rates ensure high crop yield, improve nitrogen utilization efficiency, and maintain the stability of the soil nitrogen pool, supporting sustainable soil use in agricultural production.
4. Discussion
4.1. Effect of Nitrogen Application on Crop Yield and Yield Components
Nitrogen is a vital mineral element essential for crop growth and development, and nitrogen fertilizer application directly influences crop yield levels [28,29,30]. For sustainable modern agriculture, the scientific and rational use of nitrogen fertilizer is crucial [31]. This study investigated the appropriate nitrogen application rates under a R-W rotation system through a field positioning experiment. Results showed that crop yield is strongly affected by the nitrogen applied in the current season, consistent with previous findings [32,33]. Additionally, nitrogen applied to the previous crop influenced the yield of the subsequent crop. For rice, yields increased with higher previous-crop nitrogen when current-season application did not exceed 300 kg ha−1. For wheat, yields improved with previous-crop nitrogen application when current-season nitrogen was below 240 kg ha−1. Previous studies also support that appropriate long-term nitrogen fertilization maintains subsequent crop yields [34]. As nitrogen application in the current season increases, the effect of previous-crop nitrogen diminishes, while excessive nitrogen fertilization in the previous crop may contribute to yield declines in the current season [35].
Crop yield components directly reflect yield magnitude. Studies have shown that nitrogen application significantly affects effective spike number and grains per spike, with these components generally increasing and then decreasing as nitrogen rates rise [36,37]. Our study confirmed that effective spike number and grains per spike increased with rising current-season nitrogen but began to decline when nitrogen exceeded 300 kg ha−1 in rice or 240 kg ha−1 in wheat. Related research reported a significant decrease in rice yield components when nitrogen exceeded 225 kg ha−1 [38], likely due to regional and management differences [39]. Furthermore, at low nitrogen levels, the previous crop’s nitrogen significantly affected the effective spike number, which in turn influenced final yield. This indicates that nitrogen applied to the previous crop directly impacts spike number and ultimately crop yield. Through regression analysis, we have identified the specific combination of nitrogen fertilizer application rates in the current and previous quarters that maximize crop yields under the rice–wheat rotation system. Through cluster analysis, we also confirmed that the fertilization regimen CN300–PN240 in the rice–wheat rotation is closely associated with higher yield components. This further confirms the conclusion that higher nitrogen fertilizer application rates do not necessarily translate into higher yields.
4.2. Effect of Nitrogen Application on Nitrogen Utilization Efficiency of Crops
Previous studies have identified nitrogen as a key factor influencing rice growth and development [40]. Increased nitrogen fertilizer application leads to significant differences in NUE among treatments [41,42]. Our results showed that crop NUE gradually decreased as nitrogen application in the current season increased, consistent with earlier findings [43]. Specifically, rice NUE declined significantly when seasonal nitrogen application exceeded 300 kg ha−1, while wheat NUE decreased notably above 240 kg ha−1. These results confirm that optimal nitrogen rates enhance fertilizer use efficiency. Previous research also reported that NUE initially increases and then decreases with rising nitrogen application, peaking at 150 kg ha−1, likely due to crop variety and regional differences [44]. Additionally, our study found that nitrogen applied to the previous crop similarly affects the current crop’s NUE, though this influence diminishes as current-season nitrogen application increases.
4.3. Effect of Nitrogen Application on Changes in Nitrogen Content in the Tillage Layer of Rice–Wheat Rotation Soils
Nitrogen fertilizer application directly influences soil nitrogen content, with total soil nitrogen primarily affected by the current season’s nitrogen input, though previous-crop applications also have some impact. Excessive nitrogen application does not significantly increase total soil nitrogen but contributes to nitrogen loss and reduces crop nitrogen utilization under high fertilizer rates. Proper nitrogen management is crucial to minimizing nitrogen pollution and improving fertilizer use efficiency [45]. This study found that annual nitrogen application levels directly affect TN in the soil’s tillage layer. Low-nitrogen treatments led to reduced soil nitrogen due to crop uptake, nitrogen loss, and insufficient fertilization. Conversely, high-nitrogen treatments caused nitrogen accumulation in the soil but increased environmental nitrogen losses. Appropriate nitrogen application supports healthy crop growth, ensures yield, stabilizes the soil nitrogen pool, and reduces nitrogen loss. This study preliminarily examined the effects of varying nitrogen application rates on soil nitrogen pool dynamics in rice fields and wheat fields under a rice–wheat rotation system under controlled conditions. However, it did not incorporate comprehensive evaluation metrics such as soil pH, aggregate structure, moisture fluctuations, and microbial activity. Furthermore, due to the limited duration of the study, it has not yet fully revealed the response of annual soil nitrogen pools in rice–wheat systems to nitrogen application rates in the preceding crop under long-term field conditions. Therefore, future research requires multi-year continuous field trials to more precisely elucidate the changes in annual soil nitrogen pools under different nitrogen application rates in rice–wheat systems while also strengthening the measurement of other relevant indicators.
5. Conclusions
Overall, nitrogen fertilizer application not only supports the growth and development of current-season crops but also affects subsequent crops. The current season’s nitrogen application has the greatest impact on crop growth, followed by the interaction between CN and PN, while the effect of PN alone is the smallest. These effects gradually weaken with increasing rotation cycles. Under the R-W rotation system, both rice and wheat yields tend to first increase and then decrease as nitrogen application rates in the previous crop and current season rise. The previous crop’s nitrogen primarily influences final yield by affecting the effective number of panicles. Different nitrogen levels also alter soil nitrogen content; changes in NH4+ and NO3− driven by CN and PN affect soil nitrogen availability, thereby impacting crop growth and yield. When nitrogen is applied at 265.7 kg ha−1 in rice and 257.1 kg ha−1 in wheat, total annual yield can reach 14,459.9 kg ha−1. This rate meets production yield goals while reducing nitrogen use and loss, supporting sustainable agricultural development.
Author Contributions
Y.Y.: data curation, investigation, writing—original draft preparation. X.L.: investigation, data curation, review and editing. Y.C.: investigation, data curation, review and editing. P.G.: investigation, data curation, review and editing. H.W.: investigation, data curation, review and editing. H.Z.: investigation, data curation, review and editing. Q.D.: supervision, review and editing. All authors have read and agreed to the published version of the manuscript.
Funding
This work was funded by the National Key Research and Development Program (2021YFD1700800), the Key Research and Development Program of Jiangsu Province (D21YFD17008), the Key Research and Development Program of Jiangsu Province (BE2019343), the Natural Science Foundation of the Jiangsu Higher Education Institutions (24KJA210002), and the Priority Academic Program Development of Jiangsu Higher Education Institutions (PAPD).
Data Availability Statement
The original contributions presented in this study are included in the article. Further inquiries can be directed to the corresponding author.
Conflicts of Interest
The authors declare no conflicts of interest.
References
- NBS (National Bureau of Statistics of China). Online Statistical Database: Sown Areas of Major Farm Crops. 2022. Available online: http://www.stats.gov.cn/ (accessed on 30 December 2022). (In Chinese)
- Li, Y.; Tang, L.L.; Chen, Y.; Wu, C.Y.; Tang, X.; Ji, X.J. The effects of nitrogen application rates on uptake, utilization and losses of nitrogen for rice. Chin. J. Soil Sci. 2015, 46, 392–397. [Google Scholar]
- Zhou, W.; Yang, Z.; Wang, T. Environmental Compensation Effect and Synergistic Mechanism of Optimized Nitrogen Management Increasing Nitrogen Use Efficiency in Indica Hybrid Rice. Front. Plant Sci. 2019, 10, 245. [Google Scholar] [CrossRef]
- Li, S.; Shen, C.B. Research progress on regulation nitrate nitrogen metabolism and utilization in crops. J. Nanjing Agric. Univ. 2022, 45, 848–855. [Google Scholar]
- Gao, Y.; Sun, C.; Ramos, T.B. Modeling nitrogen dynamics and biomass production in rice paddy fields of cold regions with the ORYZA-N model. Ecol. Model. 2023, 475, 110184. [Google Scholar] [CrossRef]
- Zhang, X.; Sun, H.; Wang, C.; Zhang, J.; Zhou, S. Optimizing fertilizer management mitigated net greenhouse gas emissions in a paddy rice-upland wheat rotation system: A ten-year in situ observation of the Yangtze River Delta, China. Agric. Ecosyst. Environ. 2023, 356, 108640. [Google Scholar] [CrossRef]
- Sharma, S.; Singh, P.; Choudhary, O.P. Nitrogen and rice straw incorporation impact nitrogen use efficiency, soil nitrogen pools and enzyme activity in rice-wheat system in north-western India. Field Crops Res. 2021, 266, 108131. [Google Scholar] [CrossRef]
- Xue, L.H.; Li, G.H.; Hou, P.F. Research on Nitrogen Reduction Technology System for Sustained High Yield in Paddy Field in Taihu Lake Region. J. Agro Environ. Sci. 2016, 35, 729–736. [Google Scholar]
- Nebiyou, L.; Wu, S.; Wang, Y.; Gan, M.Q.; Liu, P.S.; Huang, Y.; Xu, H.J.; Hu, H.X.; Ma, Y.H. Optimal fertilizer rates towards the improvement of nitrogen use efficiency and reduction of nitrogen export in paddy rice-wheat intensive farming. Front. Environ. Sci. 2023, 11, 1239785. [Google Scholar] [CrossRef]
- Wang, L.M.; Huang, D.F.; Zhang, B.Y.; Pan, Z.C. Differences in uptake, utilization and loss of nitrogen and phosphorus in a Chinese double rice cropping system under different irrigation and fertilization managements. J. Appl. Ecol. 2022, 33, 1037–1044. [Google Scholar]
- Peng, S.; Wang, H.; Zhang, W.K.; Hou, J.; Chen, A.; Wen, W.; Wan, Y.; Yuan, H. Effects of long-term nitrogen fertilizer reduction and deep application on yield and soil fertility of double-crop rice. J. Plant Nutr. Fertil. 2020, 26, 999–1007. [Google Scholar]
- Gong, L.; Jin, D.D.; Niu, S.W.; Wang, N.; Xu, J.Y.; Sui, S.J. Effects of long-term positioning of nitrogen fertilizer reduction on rice yield and nitrogen uptake and utilization. Chin. Rice 2022, 28, 42–46. [Google Scholar]
- Sun, Y.J.; Lin, D.; Sun, Y.Y.; Yan, F.J.; Ma, P.; Guo, C.C.; Li, F.J.; Yang, Z.Y.; Xu, F.X.; Ma, J. Improving yield and nitrogen use efficiency of hybrid indica rice through optimizing nitrogen application strategies in the rice season under different rotation patterns. Paddy Water Environ. 2022, 21, 99–113. [Google Scholar] [CrossRef]
- Wang, J.B.; Wu, G.; Yuan, M.M. Effects of different nitrogen application rates and methods on ammonia volatilization and nitrogen fertilizer utilization in rice fields. Soil Fertil. China 2022, 301, 10–17. [Google Scholar]
- Fu, Z.P.; Zhang, K.; Zhang, J.Y.; Zhang, Y.; Cao, Q.; Tian, Y.C.; Zhu, Y.; Gao, W.X.; Liu, X.J. Optimizing nitrogen application and sowing date can improve environmental sustainability and economic benefit in wheat-rice rotation. Agric. Syst. 2023, 204, 103536. [Google Scholar] [CrossRef]
- Liang, H.; Li, S.; Zhang, L.; Xu, C.; Lv, Y.; Gao, S.; Cao, W. Long-term green manuring enhances crop N uptake and reduces N losses in rice production system. Soil Tillage Res. 2022, 220, 105369. [Google Scholar] [CrossRef]
- Bhandari, A.L.; Ladha, J.K.; Pathak, H.; Padre, A.T.; Dawe, D.; Gupta, R.K. Yield and Soil Nutrient Changes in a Long-Term Rice-Wheat Rotation in India. Soil Sci. Soc. Am. J. 2002, 66, 162–170. [Google Scholar]
- Ding, W.C.; Xu, X.P.; Zhang, J.J.; Huang, S.H.; He, P.; Zhou, W. Nitrogen balance acts an indicator for estimating thresholds of nitrogen input in rice paddies of China. Environ. Pollut. 2021, 290, 118091. [Google Scholar] [CrossRef]
- Li, J.P.; Ma, H.B.; Xie, Y.Z.; Wang, K.B.; Qiu, K.Y. Deep soil C and N pools in long-term fenced and overgrazed temperate grasslands in northwest China. Sci. Rep. 2019, 9, 16088. [Google Scholar] [CrossRef]
- Shen, Y.Y.; Xu, L.; Guo, H.; Ismail, H.; Ran, X.; Zhang, C.; Peng, Y.X.; Zhao, Y.F.; Liu, W.Z.; Ding, Y.F.; et al. Mitigating the adverse effect of warming on rice canopy and rhizosphere microbial community by nitrogen application: An approach to counteract future climate change for rice. Sci. Total Environ. 2023, 905, 167151. [Google Scholar] [CrossRef]
- Manuel, F.; Vittorio, B.; Pranay, K.B.; Francesco, V.; Anna, P.; Gianluigi, G.; Giovanna, V.; Teofilo, V. Application of the full nitrogen dose at decreasing rates by foliar spraying versus conventional soil fertilization in common wheat. J. Agric. Food Res. 2025, 19, 101602. [Google Scholar]
- Dong, X.S.; Lin, H.; Wang, F.; Shi, S.M.; Ma, J.M.; He, X.H. Effects of increasing CO2 concentration on crop growth and soil ammonia-oxidizing microorganisms in a fababean (Vicia faba L.) and wheat (Triticum aestivum Yunmai) intercropping system. Plants 2025, 14, 516. [Google Scholar] [CrossRef]
- Wang, Y.Y.; Xia, L.L.; Cai, S.Y. After-effects and fate of residual fertilizer nitrogen in rice-wheat rotation farmland under long-term no nitrogen fertilization. Soil J. 2022, 59, 1626–1639. [Google Scholar]
- Gu, B.J.; Ju, X.T.; Chang, S.X.; Ge, Y.; Chang, J. Nitrogen use efficiencies in Chinese agricultural systems and implications for food security and environmental protection. Reg. Environ. Change 2017, 17, 1217–1227. [Google Scholar] [CrossRef]
- Gui, S.; Zhu, X.; Cao, G. Effects of tillage on soil nitrogen and its components from rice-wheat fields in subtropical regions of China. Int. J. Agric. Biol. Eng. 2022, 15, 146–152. [Google Scholar] [CrossRef]
- Liu, C.; Ren, D.; Liu, H.; Zhang, Y.; Wang, L.; Li, Z.; Zhang, M. Optimizing nitrogen management diminished reactive nitrogen loss and acquired optimal net ecosystem economic benefit in a wheat-maize rotation system. J. Clean. Prod. 2022, 331, 129964. [Google Scholar] [CrossRef]
- Bao, S.D. Soil and Agricultural Chemistry Analysis, 3rd ed.; China Agriculture Press: Beijing, China, 2000. [Google Scholar]
- Kumar, A.; Kumar, R.; Lavakush; Kumar, S.; Maurya, S.K.; Kumar, A. Effect of inorganic and organic sources of nutrient on NPK content, NPK uptake, apparent nitrogen recovery, nitrogen use efficiency and Protein content in rice under rice wheat cropping system. J. Pharmacogn. Phytochem. 2021, 10, 2610–2613. [Google Scholar]
- Zhou, Y.; Xu, L.; Zhang, J.; Li, W.; Jiang, Y.; Wang, S.; Ding, Y.; Liu, Z.; Li, G. Low N apparent surplus with higher rice yield under long-term fertilizer postponing in the rice-wheat cropping system. Crop J. 2022, 10, 9. [Google Scholar] [CrossRef]
- Xu, X.; Ma, F.; Zhou, J.; Du, C. Control-released urea improved agricultural production efficiency and reduced the ecological and environmental impact in rice-wheat rotation system: A life-cycle perspective. Field Crops Res. 2022, 278, 108445. [Google Scholar] [CrossRef]
- Chen, Z.D.; Chun-Chun, X.U.; Long, J.I.; Fang, F.P. Comprehensive evaluation for carbon and nitrogen footprints of rice–wheat rotation system in Middle Yangtze River Basin. J. Plant Nutr. Fertil. 2019, 25, 1125–1133. [Google Scholar]
- Zhang, J.; Li, W.; Zhou, Y.; Ding, Y.; Xu, L.; Jiang, Y.; Li, G. Long-term straw incorporation increases rice yield stability under high fertilization level conditions in the rice–wheat system. Crop J. 2021, 9, 1191–1197. [Google Scholar] [CrossRef]
- Wu, J.; Li, X.F.; Xu, X.J. Effects of long-term soil testing and positioning of fertilizers on rice and wheat yields and soil nutrients. Zhejiang Agric. Sci. 2023, 64, 525–529. [Google Scholar]
- Hou, P.F.; Yu, Y.L.; Xue, L.X.; Petropoulos, E.; He, S.Y.; Zhang, Y.S.; Pandey, A.; Xue, L.H.; Yang, L.Z.; Chen, D.L. Effect of long term fertilization management strategies on methane emissions and rice yield. Sci. Total Environ. 2020, 725, 138261. [Google Scholar] [CrossRef]
- Mukhi, S.K.; Rout, K.K.; Patra, R.K.; Dash, A.; Parida, A.K.; Shivhare, S. Sub-soil properties as influenced by long-term manuring and their relationship with yield and sustainability of a rice-rice production system in eastern India. Int. J. Plant Soil Sci. 2022, 34, 795–808. [Google Scholar] [CrossRef]
- Kaveh, S.F.; Alireza, V.A.S.; Masood, K.; Zakerin, H.; Mohammadreza, Y. The effect of periodic irrigation and different amounts of nitrogen fertilizer on yield and yield components of rice. Commun. Soil Sci. Plant Anal. 2021, 52, 22–31. [Google Scholar]
- Koppensteiner, L.J.; Kaul, H.P.; Piepho, H.P.; Barta, N.; Euteneuer, P.; Bernas, J.; Kopyra, A.K.; Gronauer, A.; Neugschwandtner, R.W. Yield and yield components of facultative wheat are affected by sowing time, nitrogen fertilization and environment. Eur. J. Agron. 2022, 140, 126591. [Google Scholar] [CrossRef]
- Zhou, W.; Lv, T.F.; Yang, Z.P.; Wang, T.; Fu, Y.; Chen, Y.; Hu, B.H.; Ren, W.J. Morphophysiological mechanism of rice yield increase in response to optimized nitrogen management. Sci. Rep. 2017, 7, 17226. [Google Scholar] [CrossRef]
- He, B.; Li, C.; Yao, L.; Cui, H.Y.; Tian, Y.J.; Sun, X.; Yu, T.H.; He, J.Q.; Wang, S. Effects of dynamic nitrogen application on rice yield and quality under straw returning conditions. Environ. Res. 2024, 243, 117857. [Google Scholar] [CrossRef]
- Liu, S.; Wang, M.; Yin, M.; Chu, G.; Xu, C.; Zhang, X.; Abliz, B.; Tang, C.; Wang, D.; Chen, S. Fifteen years of crop rotation combined with straw management alters the nitrogen supply capacity of upland-paddy soil. Soil Tillage Res. 2022, 215, 105219. [Google Scholar] [CrossRef]
- Isaac, N.A.; Michael, V.D.L.; John, G.A.; Joachim, M.S. Water and nitrogen (n) use efficiency of upland rice (oryza sativa L.×oryza glaberrima steud) under varying n application rates. Nitrogen 2020, 1, 151–166. [Google Scholar]
- Liu, X.; Xu, S.S.; Zhang, J.W.; Ding, Y.F.; Li, G.H.; Wang, S.H.; Liu, Z.H.; Tang, S.; Ding, C.Q.; Chen, L. Effect of continuous reduction of nitrogen application to a rice-wheat rotation system in the middle-lower Yangtze River region (2013–2015). Field Crops Res. 2016, 196, 348–356. [Google Scholar] [CrossRef]
- Zhang, J.H.; Liu, J.L.; Zhang, J.B.; Zhao, F.T.; Cheng, Y.N.; Wang, W.P. Effects of Nitrogen Application Rates on Translocation of Dry Matter and Nitrogen Utilization in Rice and Wheat. Acta Agron. Sin. 2010, 36, 1736–1742. [Google Scholar] [CrossRef]
- Hu, B.J.; Zhang, J.; Xiao, J.X.; Yang, S.Y.; Dong, K.; Dong, Y. Long-term intercropping with nitrogen management to improve soil quality and control crop diseases. Plant Cell Environ. 2025, 1–16. [Google Scholar] [CrossRef] [PubMed]
- Wang, D.; Ye, C.; Xu, C.M.; Wang, Z.M.; Chen, S.; Chu, G.; Zhang, X.F. Soil Nitrogen Distribution and Plant Nitrogen Utilization in Direct-Seeded Rice in Response to Deep Placement of Basal Fertilizer-Nitrogen. Rice Sci. 2019, 26, 404–415. [Google Scholar] [CrossRef]
Disclaimer/Publisher’s Note: The statements, opinions and data contained in all publications are solely those of the individual author(s) and contributor(s) and not of MDPI and/or the editor(s). MDPI and/or the editor(s) disclaim responsibility for any injury to people or property resulting from any ideas, methods, instructions or products referred to in the content. |
© 2025 by the authors. Licensee MDPI, Basel, Switzerland. This article is an open access article distributed under the terms and conditions of the Creative Commons Attribution (CC BY) license (https://creativecommons.org/licenses/by/4.0/).