Article

Spatial Distribution and Temporal Evolution of Soil Salinization in the Oasis Irrigated Area

1
College of Water Conservancy & Architectural Engineering, Shihezi University, Shihezi 832000, China
2
Key Laboratory of Modern Water-Saving Irrigation of Xinjiang Production & Construction Group, Shihezi 832000, China
3
Zhiyang Innovation Technology Co., Ltd., Zibo 255086, China
*
Author to whom correspondence should be addressed.
Agronomy 2025, 15(10), 2413; https://doi.org/10.3390/agronomy15102413
Submission received: 17 September 2025 / Revised: 13 October 2025 / Accepted: 15 October 2025 / Published: 17 October 2025
(This article belongs to the Section Water Use and Irrigation)

Abstract

Salinization of irrigation areas is a key environmental challenge faced by arid and semi-arid regions worldwide, and the complexity of natural environment and human activities increases the uncertainty of salinization distribution. This study takes the Xiaohaizi Irrigation Area in Kashgar, Xinjiang as the research location. Soil samples were collected before sowing and after harvesting in 2023 and analyzed. Using geostatistics and digital soil mapping techniques, the spatial distribution and temporal evolution of soil salinization in the region were finely characterized. The results showed that the soil salinization in Xiaohaizi Irrigation District was moderate to high, with mean salt contents of 8.29 g/kg in the 0–30 cm layer, 6.16 g/kg at 30–60 cm, and 4.80 g/kg at 60–100 cm before sowing, all indicating moderate to high salinity levels. The salt content showed a surface aggregation distribution with significant differences between different depths. The main ions that affect salinization are SO42−, Ca2+, Mg2+, Cl, K+, and Na+. The 0–30 cm soil layer is mainly composed of mildly saline soil, and the degree of soil salinization decreases with the depth of the soil layer. After harvesting, the overall degree of salinization in the irrigation area intensified, and the spatial distribution of salinization was uneven. The degree of salinization was higher in the northwest and lower in the south. The impact of human activities on surface soil salinization is greater than that on deep soil. The areas where the degree of salinization in the 0–30, 30–60, and 60–100 cm soil layers undergoes transformation account for 57.18%, 33.15%, and 26.9%, respectively. This study reveals the complex dynamics of soil salinization in the Xiaohaizi irrigation area, providing scientific support for soil management and irrigation strategies in the region, and is of great significance for achieving sustainable development of oasis agriculture.

1. Introduction

The normal growth and development of crops are affected by the damage inflicted on soil structure and fertility by the accumulation of salts in the soil, which has become a global issue. The Global Map of Saline Soil Distribution released by the Food and Agriculture Organization of the United Nations shows that the area of saline soils exceeds 833 million hectares worldwide, accounting for 8.7% of the Earth’s total land area. Most saline soils occur in arid or semi-arid regions of Asia, Africa, and Latin America [1,2]. Soil salinity has spatial variations and temporal dynamics, and therefore, dynamic monitoring enables the proper and effective management of salt-affected soils to ensure the prevention of land degradation and land reclamation [3].
The problem of soil salinization has received attention from some scholars in recent years. A comprehensive model that allows the evaluation of the long-term effects of climate change on soil salinization, which emphasizes how the time series analysis contributes to understanding the process of soil salinization, was proposed by Jung [4]. The satellite remote-sensing data were used in another research conducted by Corwin [5] to analyze and compare the soil salinization trends in different irrigated areas across the world in the past thirty years, and the temporal variation characteristics of salt accumulated in the soil of some regions were identified. Yang performed [6] the multi-year time series data analysis to investigate the dynamic changes in soil salinization in irrigated areas of northern China, and revealed the complex patterns of the migration and accumulation of salts in different soil types under various irrigation systems. In another study, for more accurate monitoring and predicting the changes in soil salinization, Kumar [7] focused on improving spatiotemporal resolution. Recent studies on soil salinity in Xinjiang oasis irrigation districts have either examined single cropping seasons or used remote-sensing proxies with limited vertical resolution. For the Xiaohaizi Irrigation District, continuous multi-depth monitoring that captures intra-annual variability and disentangles the contributions of natural evaporation and irrigation at the field scale remains lacking. This study addresses that gap by providing high-resolution, geostatistically analyzed salinity data for three soil layers during two key management periods, enabling a process-based understanding of salt redistribution in comparable arid oasis systems. Singh [8] pointed out the paramount importance of the comprehensive exploration and prediction of the long-term trend of soil salinization in the oasis irrigated areas for the development of effective management strategies by underlining the need for studying this topic in the review articles.
As a typical desert-oasis irrigated agricultural area in the arid region of northwest China, the Xiaohaizi Irrigation District is an important location for regional production, life, and development. It is an oasis in arid regions whose irrigated agriculture is mainly dependent on limited water resources. However, the distribution and redistribution of salt can be influenced by a multitude of factors including unreasonable irrigation strategies, poor retention and discharge of surface runoff and groundwater, and abnormal fluctuations of groundwater levels [9]. Pre-sowing and post-harvest are the two important irrigation schedules in irrigated areas. The identification of the areas with high salinity and adopting corresponding improvement measures to minimize the adverse effects of salinity on crop growth can be facilitated by accurately mapping the spatial distribution of soil salinity before sowing. Similarly, to evaluate the effectiveness of the irrigation and soil management strategies during the growing season, it is of great importance to analyze the spatial distribution characteristics of soil salinity after harvesting, as they provide a scientific basis for the proper planting of crops in the next season, which further guides how to optimize the irrigation and soil management practices for the reduction in salt accumulation and improvement of soil quality and crop yield. Understanding the spatial distribution patterns of soil salinity at these two stages of crop production is essential [10], and therefore, it is a matter of urgency that the dynamic distribution of the salinity of soil at its different depths would be investigated before sowing and after harvesting of crops in irrigated areas.
Despite growing attention to soil salinization in irrigated areas, systematic studies on its spatial-temporal dynamics in oasis regions under specific geographical and climatic conditions remain limited. To address this gap, this study focuses on the Xiaohaizi Irrigation Area in southern Xinjiang, a typical arid oasis agricultural zone. The specific objectives of this study are: (1) to analyze the spatial distribution characteristics of soil salinity at different depths before sowing and after harvesting; (2) to examine the temporal evolution of soil salinization and its influencing factors; (3) to identify the dominant ions driving salinization and their vertical distribution patterns; and (4) to assess the impact of human activities on salinity changes across soil layers. The findings aim to provide scientific support for sustainable soil and water management in similar arid oasis irrigation regions.

2. Materials and Methods

2.1. Overview of the Study Area

The Xiaohaizi Irrigation District in Kashgar, Xinjiang, typifies arid oasis agriculture in Northwest China and is highly prone to soil salinization. The geographical coordinates of this area are 78°56′ E to 79°35′ E and 39°39′ N to 40°43′ N. It includes the units such as the 44th, 49th, 50th, 51st, and 53rd Regiments and the Xiaohaizi Reservoir Management Office. This area has a temperate hyper-arid desert climate, with prolonged exposure to sunlight and significant diurnal air temperature variations. The region has an average annual temperature of approximately 11.6 °C. The warmest month, July, experiences average temperatures ranging from 25 °C to 26.7 °C, while the coldest month, January, sees averages between −7.3 °C and −6.6 °C. Annual precipitation amounts to 38.3 mm, and the average frost-free period lasts about 225 days [11]. Soil salinization occurs in varying degrees and there are different soil textures in cultivated lands of this region. Water diversion is mainly conducive to the development of oasis agriculture in this irrigation district. However, the serious problem of salinization is due to the flatness of the arable land and inadequate drainage. The key factors limiting the utilization of soil resources are the scarcity of water resources, high soil salinity, and salinity returns throughout the seasons [12]. The focus in the irrigation district lies predominantly on cotton and food crops as the main agricultural products, as well as the forestry industry, fruit production, and other economic crops, which collectively make it a quintessential oasis irrigated agricultural area in southern Xinjiang.

2.2. Data Collection

Using a random sampling method, a sampling grid of 5 × 5 km with sampling points, which can ensure the spatial uniformity of distribution and sampling accuracy, was created according to the topographic, water system, land-use type, and satellite remote sensing maps of the research area. The global positioning system (GPS) was used for the collection of soil samples in mid-March 2023 (before sowing) and late October 2023 (after harvesting), and a total of 87 actual sampling points were defined (Figure 1). The actual sampling process involved the collection from the profile perpendicular to the direction of planting, and 3 sampling points were set up at 60 cm intervals. Soil samples were collected from the 0–30 cm, 30–60 cm, and 60–100 cm layers at each sampling point. The collected soil samples from 3 sampling points were mixed to form the composite sample, making a total of 522 soil samples, which were placed in sealed bags and labeled and then transferred to the laboratory. Thereafter, they were subjected to natural air drying, grinding, and sieving to determine their electrical conductivity (EC) and the contents of salt content, moisture, and 8 major ions, including calcium (Ca2+), magnesium (Mg2+), sodium (Na+), potassium (K+), chloride (Cl), sulfate (SO42−), bicarbonate (HCO3), and carbonate (CO32−). The residue drying method was used to determine the total salt content in 200 selected soil samples with different EC ranges. A functional relationship between the soil conductivity (X, μS cm−1) and total salt contents (Y, g·kg−1), Y = 0.0041X − 0.112, R2 = 0.9601, with the conductivity range of 50–9000 μS·cm−1, was established. The conductivity values measured in the residue of the samples were included in this function to calculate the total salt content in each soil sample.
Based on previous studies [13] and local soil conditions, the degree of soil salinization in the Xiaohaizi Irrigation Area was classified into five categories as shown in Table 1: non-saline (0–3 g/kg), slightly saline (3–6 g/kg), moderately saline (6–10 g/kg), strongly saline (10–20 g/kg), and extremely saline (>20 g/kg). These thresholds were used for kriging interpolation and spatial analysis.

2.3. Research Methods

2.3.1. Descriptive Statistics

The distribution characteristics of soil salinity were described using basic statistical parameters such as mean, median, minimum, maximum, variance, skewness, and kurtosis. The coefficient of variation (CV) reflects the overall degree of soil salinity variation. CV < 10% indicates a weak variation in the dataset, and CV = 10~100% signifies a moderate variation, whereas a strong variation is marked by CV > 100% [15].

2.3.2. Semi-Variance Function

The semi-variance function is a fundamental geostatistical tool that allows the description of the structural and random changes in regionalized variables and covers basic geostatistics. Based on the assumption that the regionalized variable Z (x) satisfies the hypothesis of second-order stationarity, the variance of the increments in the regionalized variables can define the semi-variance function, which is expressed as follows: Z (x) and Z (x + h). Equation (1) describes the variogram function [16].
γ h = 1 2 N ( h ) i = 1 N ( h ) [ Z x i Z ( x i + h ) ] 2
where N (h) is the logarithm of points with the distance of h; Z (xi) is the actual measured value at the xi position; and Z (xi + h) is the actual measured value at the xi + h position [17].

2.3.3. Spatial Interpolation Methods

Kriging interpolation, also called spatial local estimation, is a method in which the linear unbiased optimal estimation of the values of regionalized variables in a finite area is performed based on the semi-variance function theory and structural analysis [18]. Different kriging interpolation methods have been developed because of different research objectives and conditions. Ordinary Kriging is a spatial interpolation method commonly used in geostatistics to predict certain values at unknown locations based on a discrete set of data points. This method examines the correlation between points in space to estimate unknown values within a range of data points based on a semi-variance function.
The ordinary kriging interpolation method introduces the semi-variance function model and determines the appropriate kriging parameters, such as mean, semi-variance, and range. A semi-variance function is further used to perform spatial interpolation based on the spatial coordinates and corresponding values at the known points to estimate the value at the unknown position. Finally, a continuous surface is generated to represent the distribution of the dataset in the entire region.

2.3.4. Methods for Accuracy Evaluation

In the present study, the effectiveness and optimality of interpolation methods were evaluated using cross-validation, and the predictive performance of the model was comprehensively assessed. Cross-validation involves the division of the original dataset into K subsets, and the training and testing phases are repeated k times to obtain the performance evaluation results of the model with K-independent variables. Then, for an accurate evaluation of the model performance and reduction in random errors, these results were summarized. The indicators for the evaluation of prediction accuracy used in the study included the mean error (ME), mean squared error (MSE), absolute standard error (ASE), root mean square error (RMSE), and root-mean-square standardized error (RMSSE) [19].

2.4. Data Processing

The descriptive statistical analysis and normality test of soil salinity and other data for non-normal distribution were performed using SPSS 22.0 software. The geostatistical GS+9.0 software was used to fit the semi-variance function model was fitted. Moreover, for trend analysis, ordinary kriging interpolation, extraction of relevant information, graphic editing, and creating output, QGIS 3.40.2 software was employed.

3. Results and Analysis

3.1. Descriptive Statistics of Soil Salinity

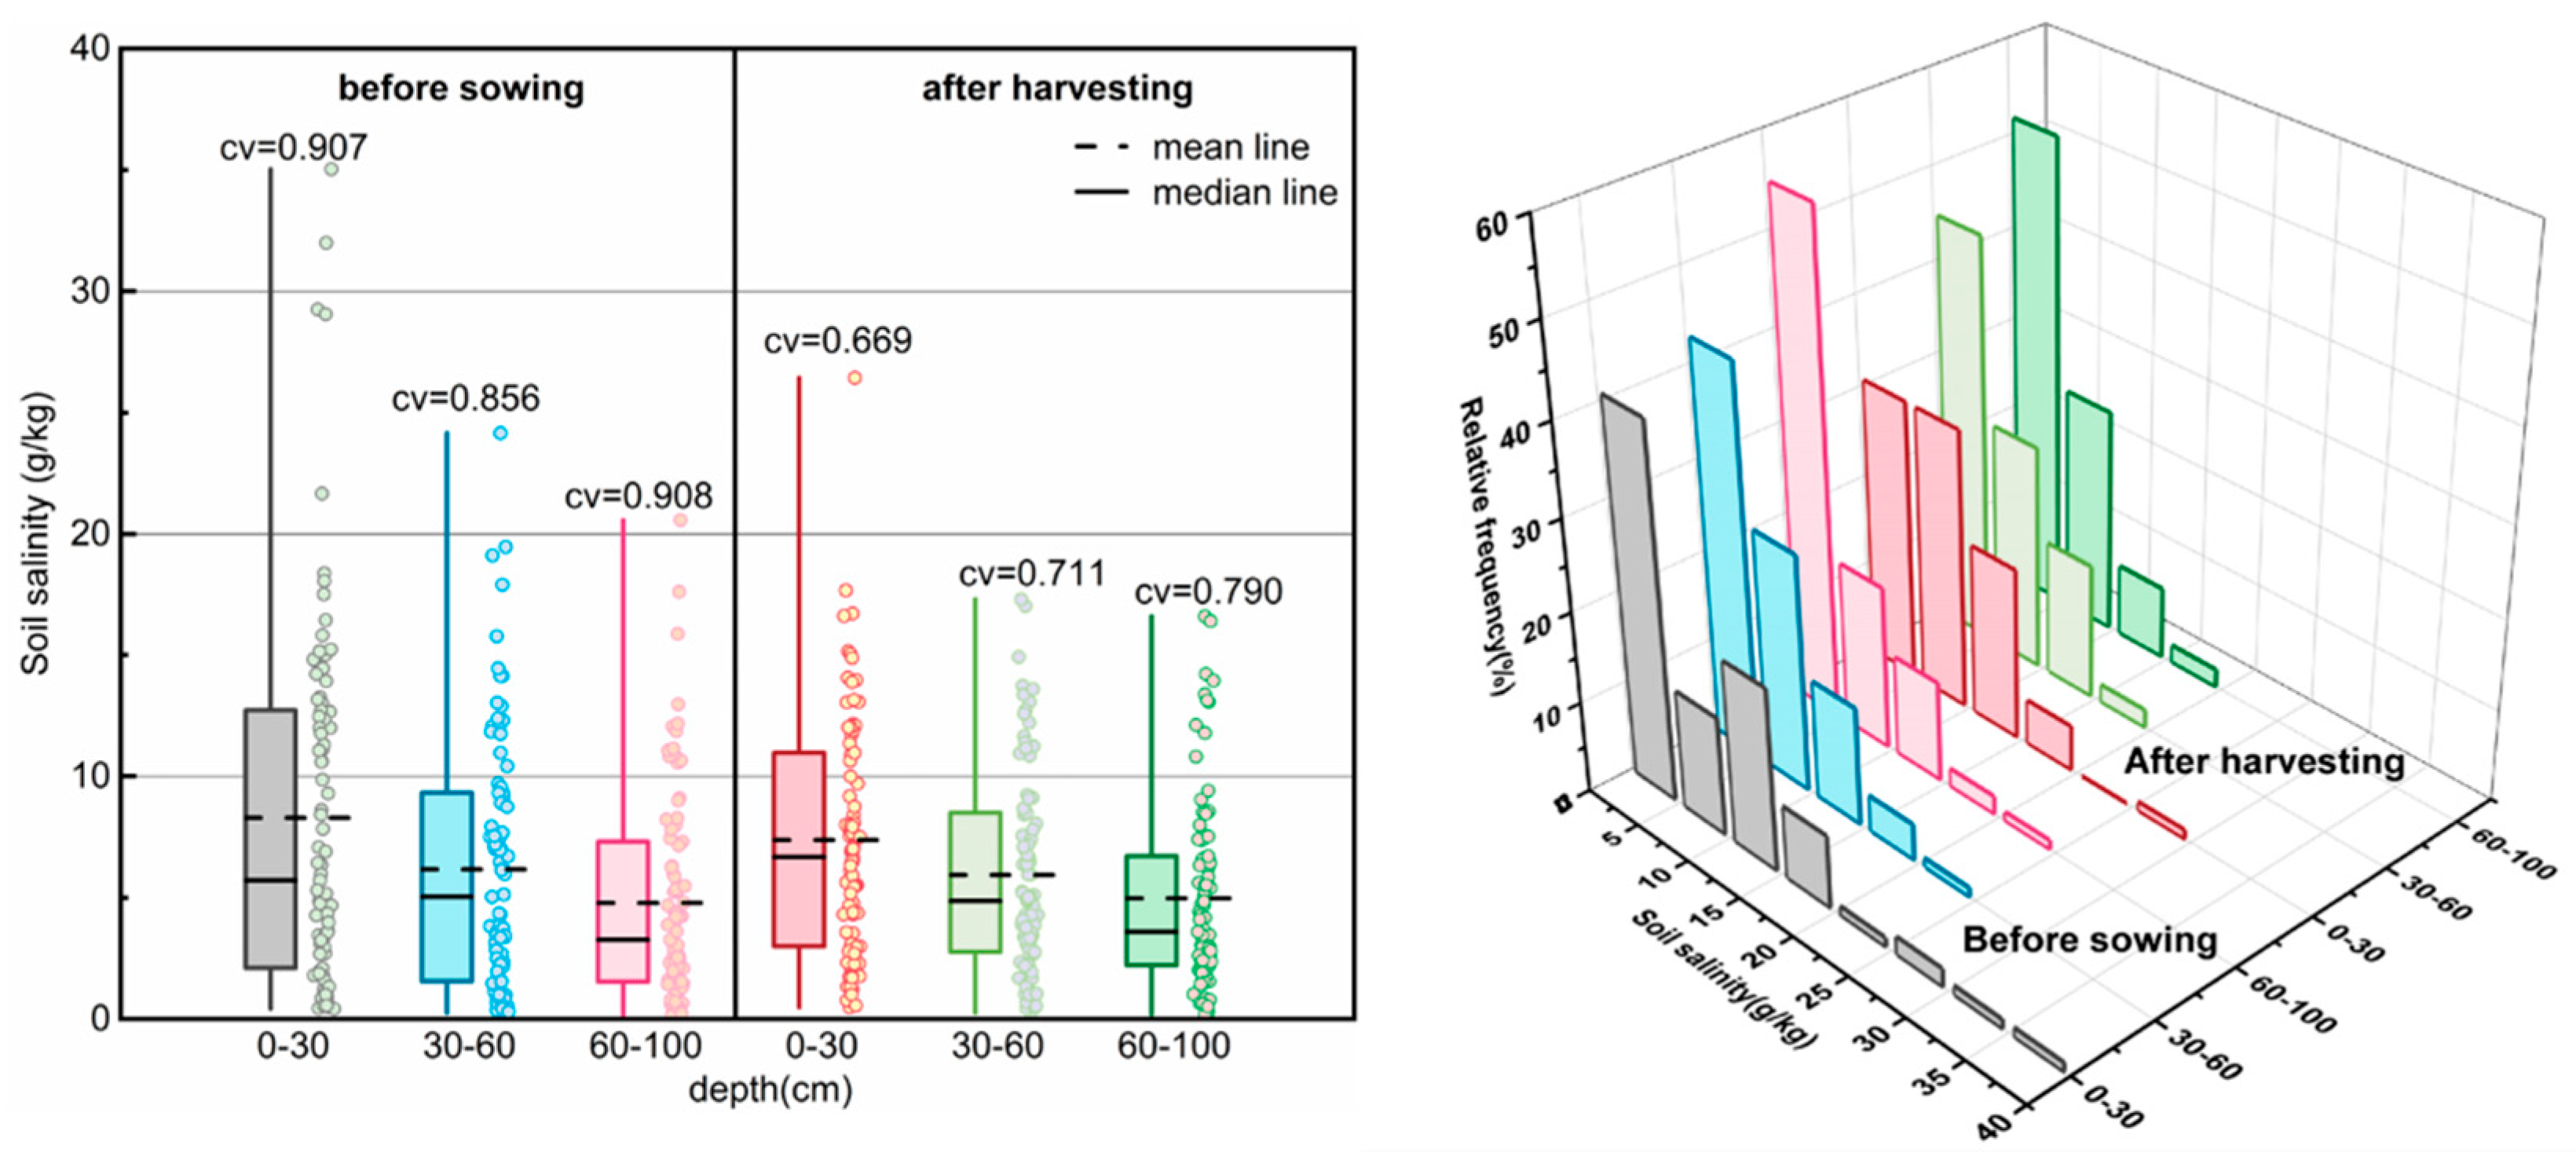
The accumulation of soluble salts in the soil in the Xiaohaizi Irrigation District, which is situated in an extremely arid temperate desert climate zone, is promoted by droughts, frequent winds, scarce rainfall, and strong evaporation, the climate events typical of this region. The statistical analysis of the soil salt content at different layers in this region before the sowing and after the harvesting of crops was conducted to investigate the variation characteristics of soil salt content. As revealed by the analysis results, the soil salinization in the Xiaohaizi Irrigation District was found to have a relatively severe degree. Before sowing, the average salt contents in the 0–30 cm, 30–60 cm, and 60–100 cm soil layers were 8.288, 6.164, and 4.796 g/kg, respectively, while the values of 7.373, 5.944, and 4.984 g/kg were obtained when salinity was assessed after harvesting, all indicating a mild to moderate salinization. At the same time, surface soil generally exhibited higher average salt contents than deep soil, revealing the surface aggregate distribution of soil salt, which is because of the occurrence of strong evaporation in this region [20]. Due to the insufficient precipitation and drip irrigation systems, the effective control of the accumulation of salt caused by evaporation is difficult [21]. The spatial distribution of soil salinity was highly uneven. Before sowing, the salt content reached its maximum value (35.089 g/kg), whereas the minimum value was found to be only 0.423 g/kg in the 0–30 cm soil layer. This significant difference indicates that it is necessary to thoroughly study the spatial distribution of soil salinity in irrigated areas. In addition, the coefficients of variation for soil layers before sowing and after harvesting were calculated and found to be between 0.1 and 1, which demonstrated the moderate variability of soil salt content. The coefficients of variation obtained before sowing (0.907, 0.856, and 0.908) were higher than those after harvesting (0.669, 0.711, and 0.790) in the 0–30 cm, 30–60 cm, and 60–100 cm soil layers, respectively. The pronounced decrease in salt content with depth can be attributed to the dominant upward flux of soil water driven by intense evaporation and sparse precipitation. Under the drip-film mulching system commonly used in the study area, irrigation water rapidly redistributes salts to the evaporation front at the soil surface. Subsequently, the high atmospheric demand creates a strong and continuous capillary rise, which transports dissolved salts from the deeper layers toward the surface. As water evaporates at the mulch holes or exposed soil spots, salts precipitate in the 0–30 cm horizon, while the deeper layers are progressively depleted. This upward advection-diffusion process, coupled with insufficient leaching due to limited irrigation volumes, maintains the steep vertical salinity gradient observed in Figure 2.

3.2. Analysis of Ion Characteristics

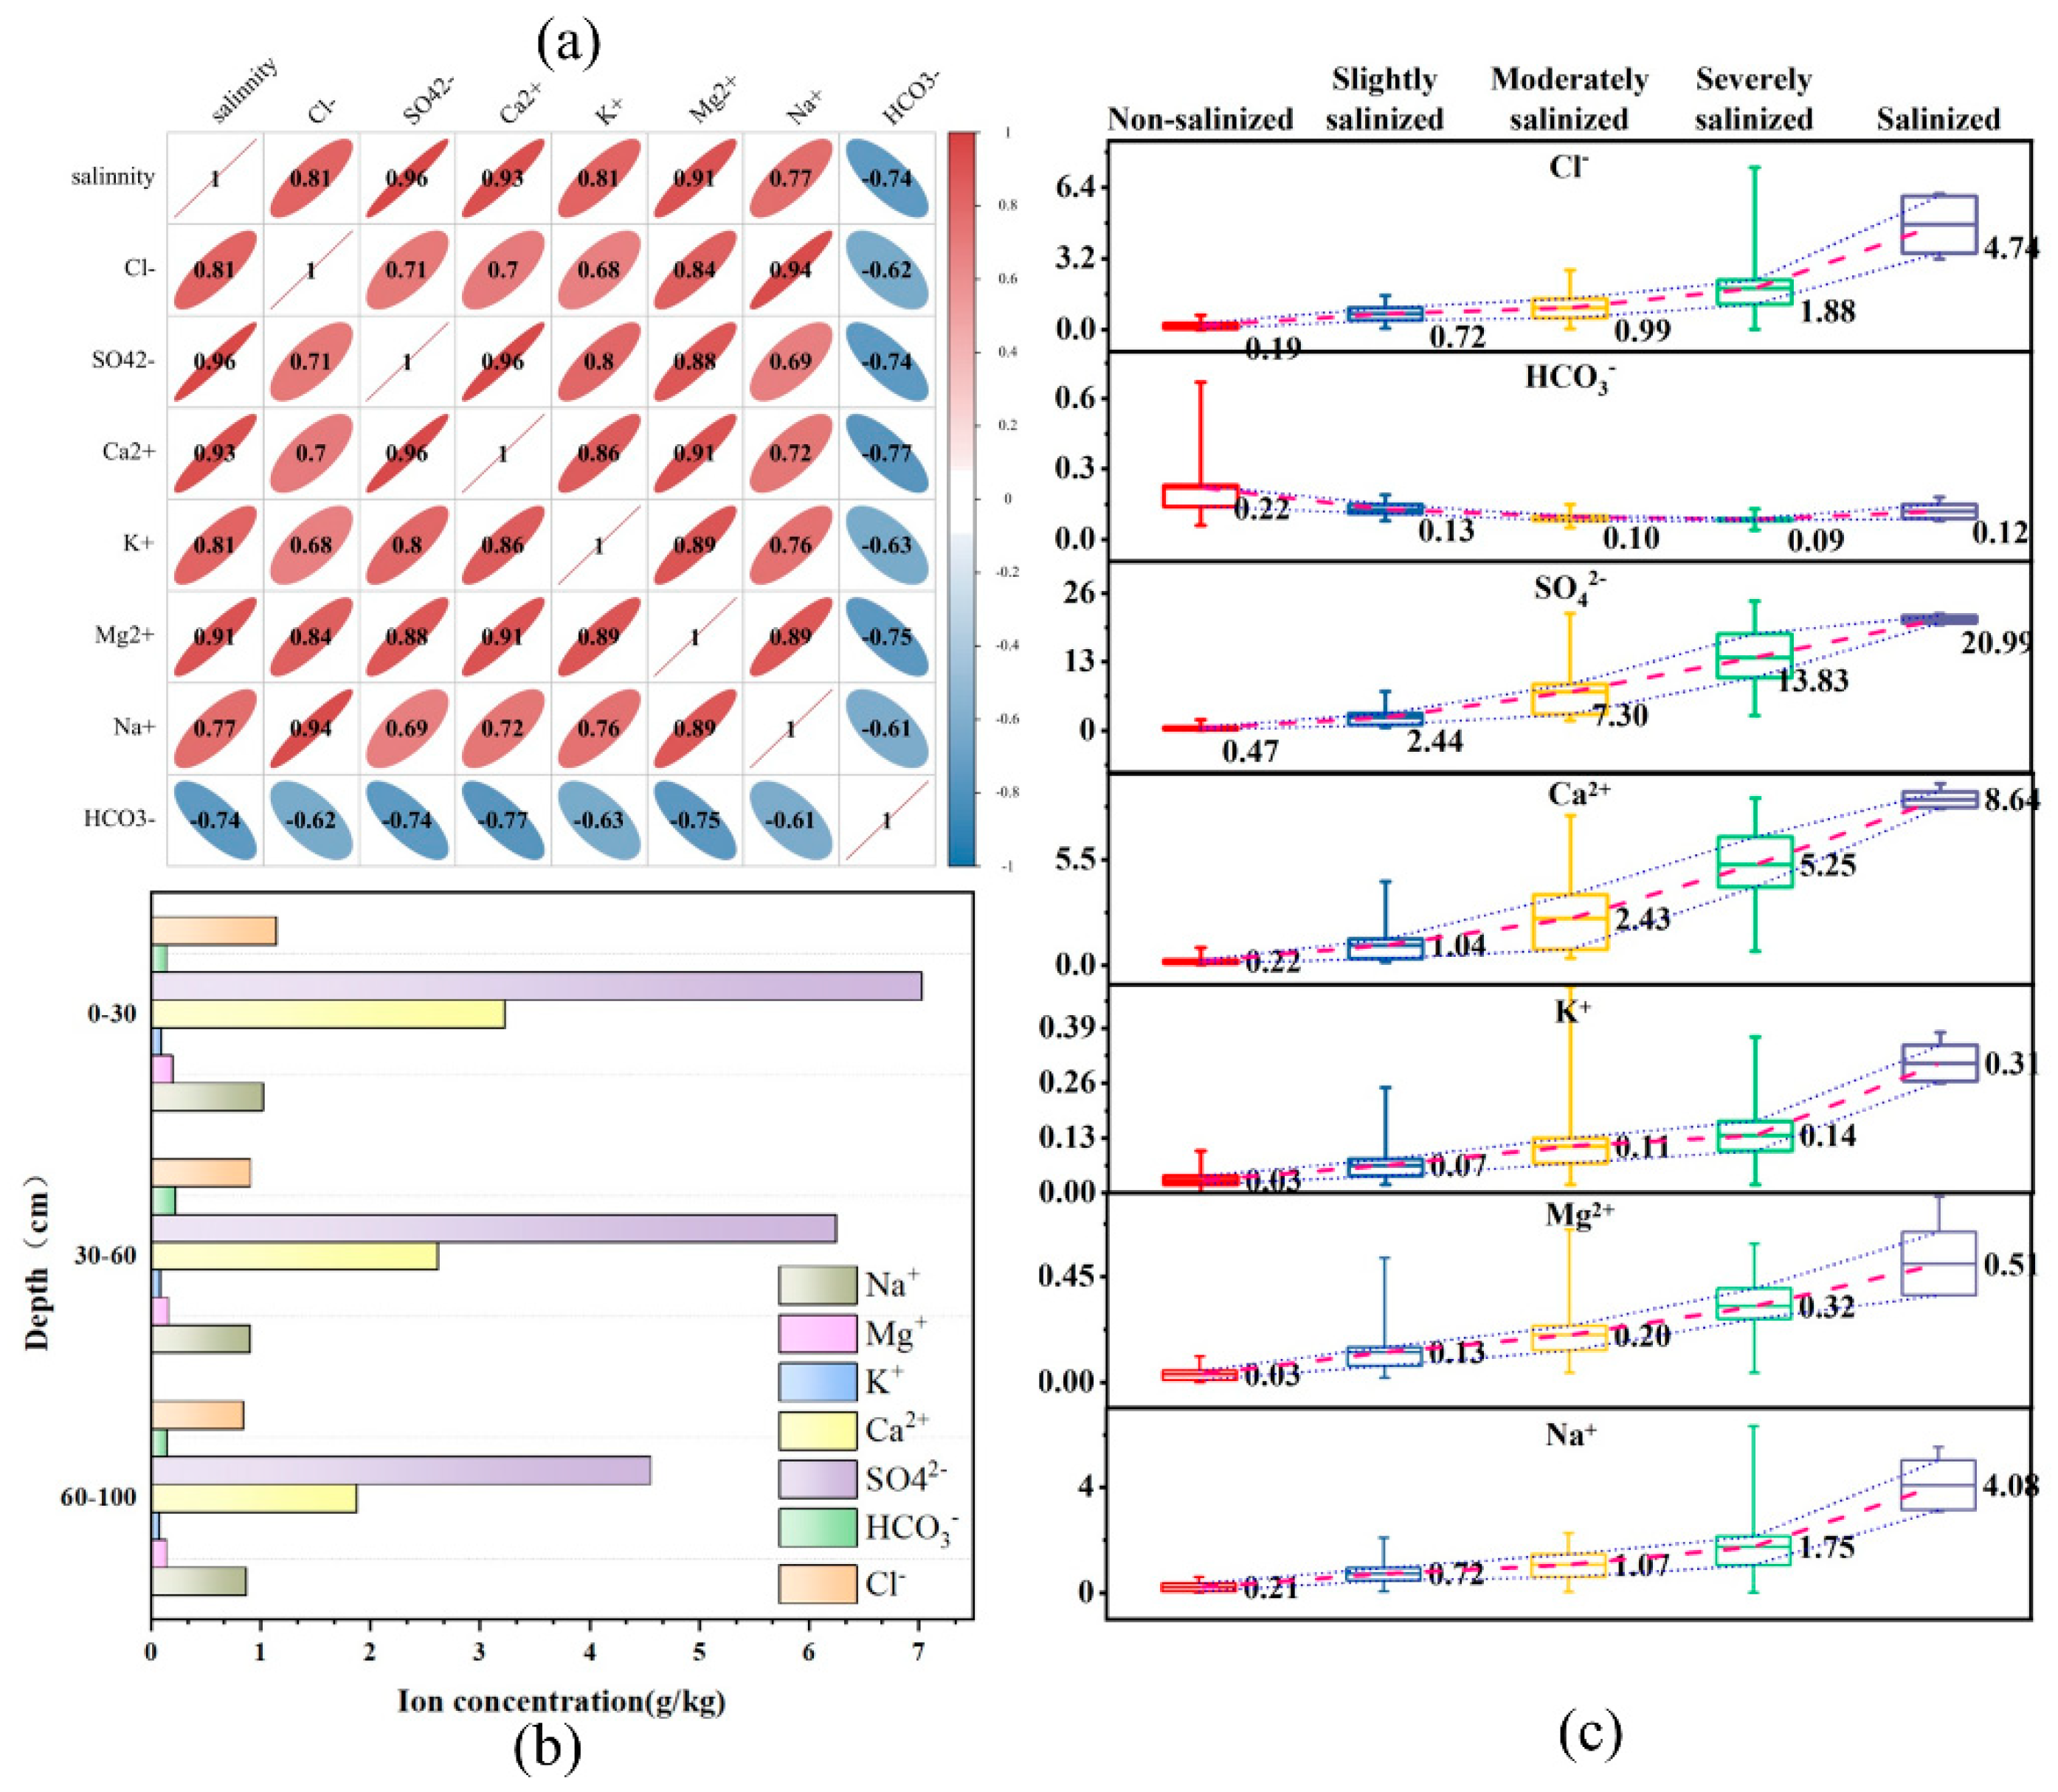
The permeability, structure, and fertility of the soil are directly influenced by the ion composition in the soil, which is a key indicator of the degree of soil salinization [22]. CO32− was not present in the soil of the Xiaohaizi irrigation area both before sowing and after harvesting, which is mainly due to its combination with Ca2+ and Mg2+ facilitated by the high evaporation rate in arid areas to form insoluble carbonate precipitates. Nevertheless, the dissolution and retention of CO32− are not induced by the high pH value and a limited amount of water in the soil [23]. A significant correlation existed between soil salinization in the Xiaohaizi irrigation area and the concentrations of conventional ions (SO42−, Ca2+, Cl, Na+, Mg2+, K+, and HCO3) in the soil (Figure 3a). Soil salinity and SO42−, Ca2+, and Mg2+ shared highly significant positive correlations, with correlation coefficients of 0.96, 0.93, and 0.91, respectively, while salinity had a negative correlation with HCO3, with a correlation coefficient of −0.74. Furthermore, Cl, K+, and Na+ were significantly correlated with salinity, demonstrating the correlation coefficients of 0.81, 0.81, and 0.77, respectively. The coefficients of the correlation between SO42− and Ca2+ and between Mg2+, K+, and Na+ were found to be 0.96, 0.88, 0.8, and 0.69, respectively. Those between Cl and Ca2+ and between Mg2+, K+, and Na+, however, were 0.7, 0.84, 0.68, and 0.94, respectively. These results indicated that the main ions driving soil salinization in the Xiaohaizi irrigation area were SO42−, Ca2+, Mg2+, Cl, K+, and Na+, and thus can be considered as the characteristic ions in this region.
Figure 3b shows the significantly higher concentrations of SO42−, Ca2+, Na+, and Cl in the soil at different depths than those of other ions, but with no significant differences in concentrations of Mg2+, K+, and HCO3 between various soil depths. The results of the determination of cation composition revealed the highest concentration for Ca2+, significantly higher than that of other cations, which accounted for more than 60% of the total cation concentration at different soil depths. Na+ had a higher concentration than Mg2+ and K+ in all soil layers. Concerning the anion composition, SO42− was observed to have the highest concentration, followed by Cl and HCO3, whereas in all soil layers, CO32− was not detectable. The ion content in different soil layers of the Xiaohaizi Irrigation Area exhibited the order of SO42− > Ca2+ > Cl > Na+ > Mg2+ > HCO3 > K+. Based on the criteria for the determination of the type of salinized soil, the soil was identified as a sulfate-saline soil at the molar ratio of Cl to SO42− in the soil of less than 0.2. This indicates that the soils at the 0–100 cm layer in the Xiaohaizi Irrigation Area are all sulfate-saline soils [24].
Table 2 Ca2+, Cl, Na+, Mg2+, and K+ with increasing the soil depth, demonstrating surface enrichment, which is consistent with previous reports. At the same time, there was an increase in the concentration of ions except for HCO3 in the soil when the soil salinization increased. SO42− in the non-saline soil had a concentration of 0.47 g/kg, while its concentration was 20.99 g/kg in the saline soil. The non-saline soil exhibited a concentration of K+ of 0.03 g/kg, which in the saline soil, conversely, was observed to be 0.31 g/kg. The ranking of soil ions based on their changing rate with increasing soil salinization was as follows: SO42− > Ca2+ > Cl > Na+ > Mg2+ > K+ > HCO3.

3.3. The Cross-Validation Analysis of Spatial Interpolation Methods

The GS+9.0 software was used for fitting the functions of soil salinity variation in the study area. The selection of semi-variance function models was carried out based on the coefficient of determination (R2). Before sowing, the Gaussian, exponential, and exponential models were found to be the optimal semi-variance function models for the 0–30 cm, 30–60 cm, and 60–100 cm soil layers, respectively. After the harvest, however, the best-fitting semi-variance function models for these soil layers were the exponential, Gaussian, and Gaussian models, respectively. The nugget value represents the randomness in the regionalized variable, while the sill value is equivalent to the degree of variation in the regionalized variable in the study area. The ratio of the nugget value to the sill value called the nugget coefficient, is used as the basis to determine the strength of spatial variability. The nugget effect, which reflects the proportion of spatial variation, is induced by the random factors in the total variation [25]. Table 2 demonstrates that the nugget coefficients of soil salinity of less than 25% obtained for the 0–30 cm, 30–60 cm, and 60–100 cm soil layers before sowing indicated a strong spatial variation in soil salinity, which is primarily caused by structural factors such as climate, parent material, topography, and soil type. These coefficients for these soil layers in the post-harvest period, however, were within the range of 25% to 75%, implying that there was a moderate spatial autocorrelation and variability was caused by both the structural and random factors, e.g., the anthropogenic activities including irrigation techniques, cultivation practices, and soil amendments. The variogram for soil salinity both before sowing and after harvesting had the range from 5.0 to 17.67 km, and all the sampling intervals were more than 5 km, indicating the validation of the effectiveness of spatial interpolation techniques [26].
To validate the predictive accuracy of geostatistical interpolation methods, the estimation of both optimality and effectiveness is necessary. The closer the mean error (ME) and mean squared error (MSE) to 0, the more optimal the model, while its effectiveness can be confirmed when the root mean squared standardized error (RMSSE) shows the value closer to 1 and the root mean square error (RMSE) and absolute standardized error (ASE) have a negligible difference. The cross-validation errors of the optimal estimation of soil salinity using the semi-variogram function are presented in Table 3). The ranges of −0.0903 to 0.0329 and −0.0131 to 0.0069 of the ME and MSE, respectively, for soil salinity at different layers assessed in pre-sowing and post-harvest periods, which are both close to 0, indicated a high predictive accuracy of the model. RMSE and ASE exhibited a difference ranging from −0.1194 to 0.2451, while RMSSE had a range of 0.9433 to 1.0183, which satisfied the numerical requirements, and thus could prove the effectiveness of the selected semi-variogram model [27]. In summary, the accuracy and the effectiveness of the interpolation technique were found to be high for soil salinity of all soil layers when the optimal semi-variogram function was selected, demonstrating that the digital map requirements were met.
Overall, the cross-validation statistics indicate that the fitted semi-variogram models produce unbiased and accurate predictions of soil salinity for all layers and both sampling periods (Table 3). Mean Error (ME) values are all close to zero (range −0.0903–0.0329 g kg−1), implying negligible systematic bias. The small Mean Squared Error (MSE, −0.0131–0.0069 g2 kg−2) further confirms the absence of over- or under-estimation. Root-Mean-Square Error (RMSE) ranges from 3.63 to 7.03 g kg−1, reflecting the average prediction uncertainty; these magnitudes are acceptable given the large observed salinity range (0.42–35.1 g kg−1). The proximity of RMSE to the Average Standard Error (ASE, Δ ≤ 0.25 g kg−1) demonstrates that the model correctly assesses its own precision. Finally, Root-Mean-Square Standardized Error (RMSSE) values cluster near 1 (0.943–1.018), signifying consistent estimation of the prediction variance. Taken together, the diagnostic metrics satisfy the criteria for robust geostatistical prediction and underpin the reliability of the subsequent salinity maps.

3.4. The Spatial Distribution and Temporal Evolution Characteristics of Soil Salinization

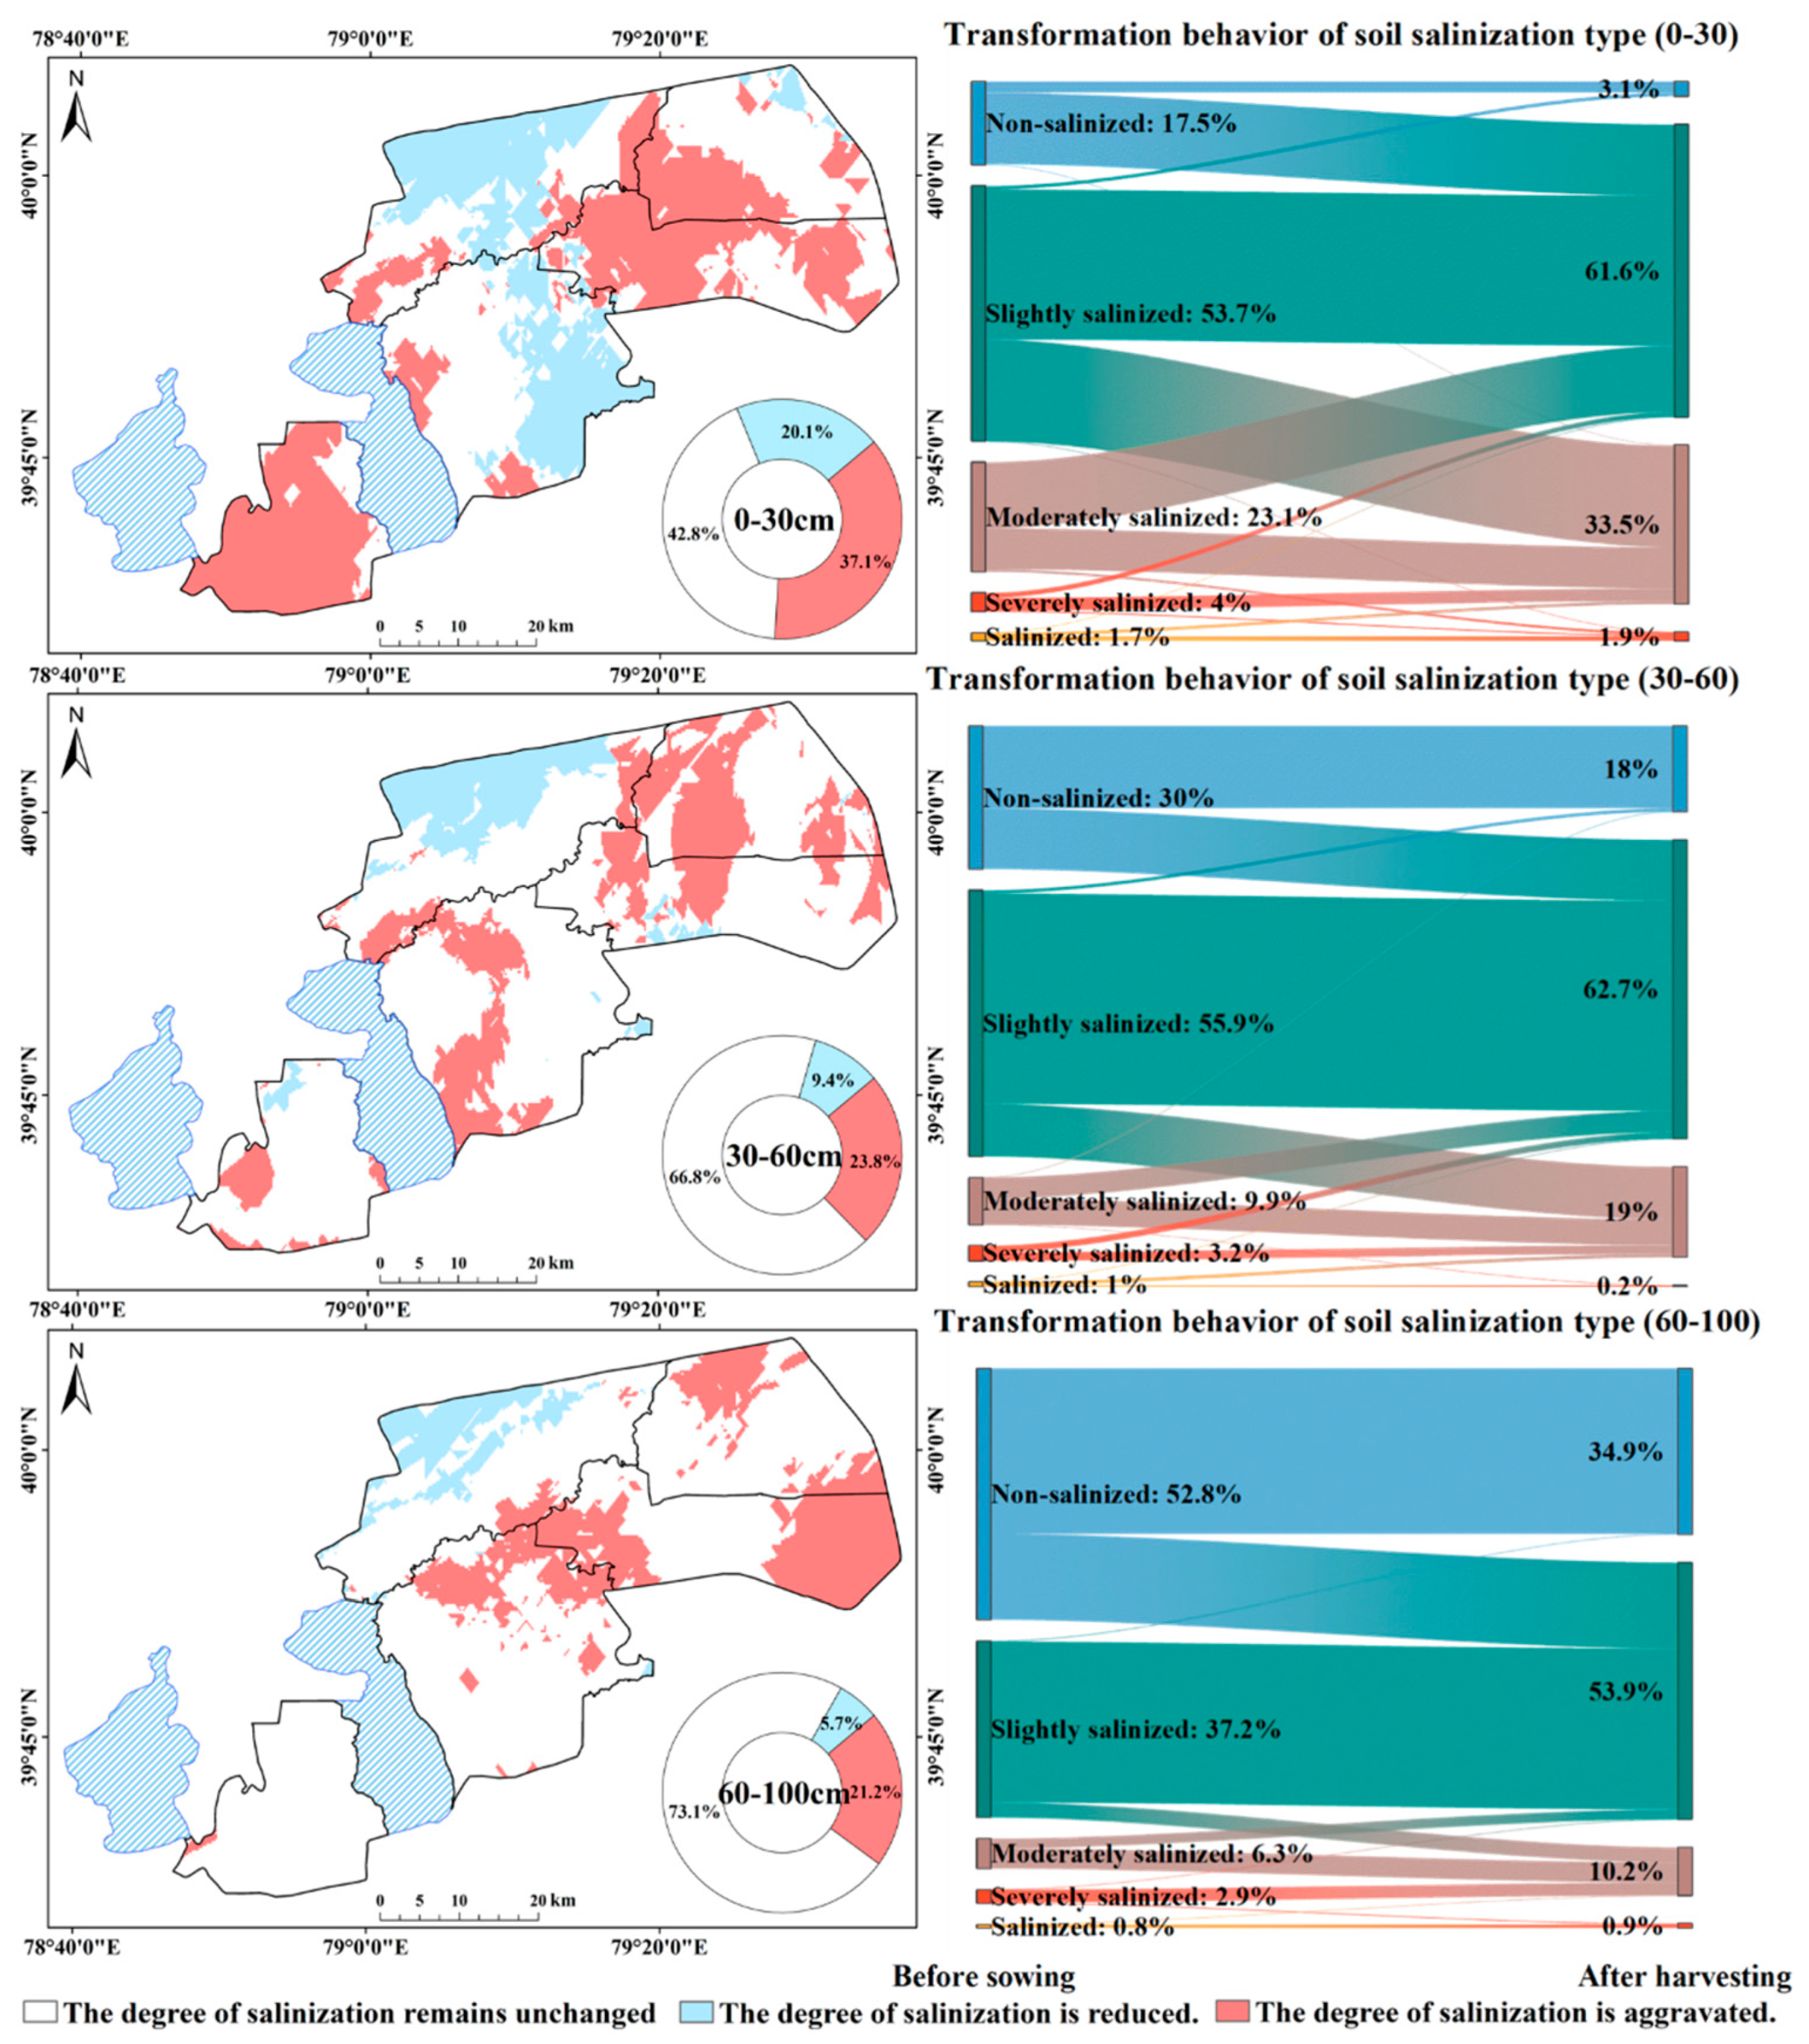
Figure 4 illustrates that the area with the evolution of soil salinization in the Xiaohaizi Irrigation District decreased with an increase in soil depth, indicating the lower impact of the natural factors and manual irrigation activities on deep soil than on surface soil. The soil surface layer (0–30 cm) in this region had the largest converted area, with an increase in salinization degree in 37.1% of the area but 20.1% of an area showing reduced salinity. The increase in salinization was mainly manifested by the conversion of areas with non-saline soil to slightly saline soil and then to moderately saline soil, mostly widespread in the 49th, 50th, and 53rd regiments. The improvement of saline soils was mainly indicated by converting the areas with moderately saline soil to slightly saline soil, which predominantly occurred in the northern part of the 51st regiment and the eastern part of the 44th regiment.
In the 30–60 cm soil layer, a significant reduction in the area experiencing the conversion was observed, with an increase in salinization degree in only 23.8% of the land, while 9.4% of the area underwent a decrease. The main types of this increase included the conversion of the land from non-saline soil to saline soil and from slightly saline soil to moderately saline soil, mainly identified in the 44th regiment and the western parts of the 50th and 53rd regiments. However, the northern side of the 51st regiment was the location in which the main type of decrease occurred.
In the 60–100 cm soil layer, the converted areas further decreased, of which 21.2% experienced an increase in salinity but with a decrease in only 5.7% of the area. The main type of decrease was noted in the northwestern part of the 51st regiment, while the eastern and western ends of the 50th regiment and the northern part of both the 44th and 53rd regiments witnessed the main types of increase.
Overall, the area going through the conversion in the Xiaohaizi Irrigation District decreased with increasing soil depth, with the highest land conversion rate found in the 0–30 cm layer. The increase in salinization degree in all three soil layers took place mainly by the conversion of areas from the non-saline soil to the slightly saline soil and then to the moderately saline soil, whereas the opposite was shown in the case of a decrease (the area with the moderately saline soil was converted to the slightly saline soil).

4. Discussion

The Xiaohaizi Irrigation District is situated in the southwestern foothills of the Tianshan Mountains, close to the northwestern fringe of the Tarim Basin. It is dominated by aridity, scarce precipitation, and intense evaporation, and surface water is its main irrigation resource. Moreover, it is known as a typical oasis agricultural irrigation zone found in arid regions of southern Xinjiang. The findings of this study may provide valuable insights into the prevention and management of soil salinization in other similar irrigated districts in the southern part of Xinjiang.

4.1. Soil Salt Content in the Irrigated Area

The spatial distribution of soil salinity within irrigation districts is significantly influenced by natural conditions. Located in a temperate hyper-arid desert region. The Xiaohaizi Irrigation District experiences aridity, frequent winds, scarce rainfall, and intense evaporation. These climate events are the key to the accumulation of soluble salts in the soil. The soil salinity levels in the irrigation district in both the pre-sowing and post-harvest periods were relatively high, with average values of 6.416 g/kg and 6.1 g/kg, respectively. The meteorological data from weather stations near the Xiaohaizi Irrigation District indicate that the multi-year average temperature is around 11.4 °C, with an average annual evaporation of up to 2423.1 mm and an average annual precipitation of only 52.4 mm, showing that evaporation exceeds precipitation by 46 times. The evaporation-to-precipitation ratios of 10.74, 16.9, and 48.49 were obtained for the Yinchuan Plain Irrigation District in Ningxia, the Manas River Basin in the north of Xinjiang, and the Kashgar River Basin in the southern part of Xinjiang, respectively. At the same time, a similar pattern was observed for the soil salinity, with average values of 2.3 g/kg, 2.58 g/kg, and 6.69 g/kg in these irrigation districts, respectively, demonstrating the positive correlation between the evaporation-to-precipitation ratios and average salinity levels. In terms of soil texture, the Xiaohaizi Irrigation District was found to be dominated by sandy loam soil, which is characterized by larger particle size and higher porosity, both being conducive to the easy penetration and evaporation of water, upon which the dissolved salts accumulate in the topsoil layer. This is one cause of the surface aggregated distribution obtained in the irrigation district both before sowing and after harvesting [28,29] (Table 4).
The range of 10% to 100%, achieved for the coefficients of variation for all soil layers before sowing and after harvesting, indicates moderate variability. Due to the natural distribution of soil salinity at the current sampling time (before sowing) resulting from the past practices since the last harvesting, except for the specific areas that receive winter and spring irrigation, soil salinity is influenced by spatially heterogeneous factors associated with spatial heterogeneity such as soil conditions, evaporation intensity, and leaching followed by the melting process of ice and snow, which contribute to a high degree of dispersion in saline soils. However, the irrigation activities carried out throughout the entire growing period induce the accumulation of salts in the soil at the wetting front, resulting in more consistency in changes. In summary, the variation coefficients of soil salinity in all soil layers were higher before sowing than those obtained after harvesting [30]. The prevailing sandy-loam texture, with an average particle size ranging from 50 to 200 µm and a bulk density between 1.35 and 1.45 g cm−3, creates a well-connected network of coarse pores. Under the observed evaporation demand of approximately 7 mm day−1, these pores exhibit equivalent capillary rise velocities of 12–18 cm day−1. Such large pores enhance the upward flux of soil solution by reducing viscous resistance, while their low specific surface area, less than 15 m2 g−1, minimizes adsorptive retention of ions. Consequently, salts dissolved in the soil water are rapidly translocated to the evaporation front at a depth of 0–10 cm, where water vapor escapes through mulch holes or cracks and solutes precipitate. In contrast, finer-textured soils such as clay or silty-loam would exhibit smaller hydraulic conductivities at low suction and stronger anion exclusion effects, thereby dampening vertical salt accumulation. Thus, the coarse matrix of the Xiaohaizi fields acts as an efficient “wick” that sustains the observed surface-aggregated salinity pattern despite the use of drip irrigation.

4.2. Spatial Distribution Characteristics of Soil Salinization

Soil salinization occurred in varying degrees in different soil layers of the Xiaohaizi Irrigation District before sowing and after harvesting, demonstrating a general pattern of higher salinization levels in the northwest but lower salinization levels on both sides of the Yong’anba Reservoir. The higher degree of salinization in the 49th regiment in the southwestern part of the Xiaohaizi Irrigation District can explain this pattern, and thus, to facilitate salt leaching before sowing every year, large amounts of water are required for the application of flood irrigation. The collected data revealed the greater use of agricultural irrigation water in the 49th regiment in March and April than in other regiments, which have zero water usage during the same period, indicating that the winter and spring irrigation could be implemented only in the 49th regiment. Indeed, the location of the 49th regiment (between the two reservoirs), which makes its access to freshwater resources from reservoirs required for irrigation easier, is a reason for this observation. The consistently high levels of soil salinization in all soil layers result from the conditions dominating the northwestern part of this irrigation district, e.g., a higher elevation and a large wasteland area, along with strong evaporation and special geological conditions. In the eastern part of the irrigation district, where the 50th and 53rd regiments are located, the post-harvest period exhibited slightly higher salt contents than the pre-sowing period. This is mainly due to a longer distance from these regiments to the reservoirs, which thus makes them reliant on the use of groundwater with a higher salt content for irrigation during the growing season. The study of the water quality of 65 groups in Tumxuk City carried out by Yang Peng [31] concluded that in the Xiaohaizi Reservoir and the Yong’anba Reservoir, the mineralization degree of surface water was within the range of 0.56 to 0.74 g·L−1, and therefore, in both reservoirs, it was considered as fresh water. The groundwater quality in the 50th and 53rd regiments was found to be poor, with saline water proportions of 71.4% and 63.6%, respectively. The worst groundwater quality was recorded in the 51st regiment, with the proportion of saline water reaching 91.7%. The secondary soil salinization is caused by the remaining of some amounts of salt from saline irrigation water in the soil after a growing season. Both before sowing and after harvesting, soil salinity exhibited a vertical downward trend with increasing soil depth. The smaller amount of salt leached by drip irrigation application than that accumulated by water evaporation may be the reason for this phenomenon.

4.3. Prevention Measures for Soil Salinization

In the Xiaohaizi Irrigation District, where salt accumulation occurs by the intense evaporation from the soil surface, to reduce the salt content in the upper soil layers, measures such as the application of winter and spring irrigation can be adopted, so that lower salt concentrations are maintained in the plow layer and the salinity stress during seed germination in crops in spring is alleviated. In areas with mildly and moderately saline soils, the use of freshwater from these two major reservoirs for irrigation is recommended; during periods of peak agricultural water demand, brackish water can be mixed with the freshwater from reservoirs for irrigation while avoiding the use of saline water whenever possible [32]. For the implementation of prevention measures such as the use of salt water pressure washers, to prevent the leaching of saline water into groundwater, which can raise the water table and cause secondary salinization, performing the anti-seepage treatment using drainage systems, including open ditches, subsurface drains, and vertical wells, is essential. Additionally, the negative effects of salinization on agricultural production can be mitigated by the adoption of agricultural practices such as land leveling and deep tillage. In 2023, soil samples were collected only before sowing (mid-March) and after harvest (late October), representing the “initial” and “final” states of the annual salinity balance. Pre-sowing values reflect the combined effects of winter leaching and early spring evaporation, while post-harvest values integrate the net outcome of the irrigation season, making them suitable for agronomic endpoint assessment and annual salinity budget calibration. However, the absence of mid-season (June–August) monitoring prevents detection of transient salinity peaks during periods of high evapotranspiration or deficit irrigation. Lysimeter studies in the Tarim Basin have shown that surface salinity can increase by 1–3 g·kg−1 within 30–40 days under high evaporative demand, suggesting that annual net changes may underestimate peak salinity stress during flowering. Future work should incorporate biweekly or monthly sampling during the growing season, combined with soil moisture and matric potential sensors, to capture salinity dynamics and validate solute transport models. Mixing reservoir freshwater with slightly brackish groundwater can ease shortages during peak irrigation periods, but long-term reliance on aquifers carries significant sustainability risks. Since 2018, water levels in local observation wells have fallen by 0.8–1.2 m. Continued pumping lowers the potentiometric surface, allowing deeper, high-salinity water (3–8 g L−1) to intrude into screened intervals at depths of 20–50 m [33]. Thinning of the freshwater lens will raise irrigation water salinity, aggravating secondary soil salinization and forcing farmers to increase leaching volumes—further depleting stored water. Pressure decline in fine-grained interbeds may also trigger irreversible compaction, reducing the aquifer’s effective storage capacity and weakening its drought-season buffering function. As a result, salts gradually accumulate through the “soil-return flow-groundwater-irrigation-soil” cycle, threatening the sustainability of both water and soil resources. It is recommended to harness winter floodwater for managed aquifer recharge, rotate salt-tolerant cover crops with fallow periods, and strictly enforce quota-based pumping using smart metering. Future modeling studies should couple variable-density groundwater flow, solute transport, and crop response functions to quantify safe extraction thresholds, and optimize integrated surface-groundwater use strategies under climate change scenarios [34,35].

5. Conclusions

This study systematically reveals the spatial heterogeneity and temporal dynamics of soil salinization in the Xiaohaizi Irrigation District of Xinjiang, addressing four specific research objectives:
1.
Spatial distribution of soil salinity at different depths before sowing and after harvest.
The surface layer (0–30 cm) exhibited the highest salinity, showing a pronounced surface accumulation phenomenon. Overall, salinity displayed a spatial pattern of “higher in the northwest, lower in the south.”
2.
Temporal evolution of salinization, after harvest, the overall degree of salinization in the irrigation district intensified, particularly in the 0–30 cm layer, where 37.1% of the area experienced increased salinity. This highlights the significant influence of irrigation activities on the redistribution of surface salts.
3.
Key ions driving salinization and their vertical distribution, SO42−, Ca2+, Mg2+, Cl, Na+, and K+ were identified as the dominant ions contributing to salinization in the area. Among them, SO42− and Ca2+ showed a highly significant positive correlation with total salinity. Ion concentrations generally decreased with increasing soil depth.
4.
Differential impacts of human activities across soil layers:
Agricultural practices such as irrigation exerted a much stronger influence on surface soil salinity than on deeper layers. In the central and eastern regions, the transformation from non-saline soils to mildly or moderately saline soils was particularly pronounced.
Through high-resolution, multi-depth field monitoring combined with geostatistical analysis, this research provides a refined depiction of the spatiotemporal migration of salts in an arid oasis irrigation district. It offers empirical evidence for understanding the irrigation-evaporation-salt redistribution balance, and provides a scientific basis for developing differentiated irrigation schedules, optimizing drainage infrastructure, and promoting winter-spring salt suppression measures. These insights are of significant value for sustaining oasis agriculture.
However, the dataset was limited to two sampling events within a single crop year (2023), failing to capture mid-season salinity peaks, and did not incorporate multi-scale verification using remote sensing or hydrological modeling. Future work should involve long-term continuous monitoring, integrate remote sensing inversion with soil water-salt transport models, and investigate salinity responses under different irrigation regimes and crop configurations. Additionally, the long-term ecological risks of mixed water-source irrigation should be assessed to support efficient and safe water resource utilization in arid regions.

Author Contributions

Funding acquisition, Manuscript writing, T.L.; Data collection, Data management, Y.L.; Supervision, Data analysis, M.B.; Investigation, Study design, X.Z.; Validation, Visualization, C.C.; Literature search, Software Formal analysis, M.W. All authors have read and agreed to the published version of the manuscript.

Funding

Support Plan for Innovation and Development of Key Industries in Southern Xinjiang of the Xinjiang Production and Construction Corps (2022DB024).

Data Availability Statement

The original contributions presented in this study are included in the article. Further inquiries can be directed to the corresponding author.

Acknowledgments

During the preparation of this manuscript, the author(s) used Deepseek, R1 for the purposes of grammar-based spelling check. The authors have reviewed and edited the output and take full responsibility for the content of this publication.

Conflicts of Interest

Author Yifan Liu was employed by the company Zhiyang Innovation Technology Co., Ltd. The remaining authors declare that the research was conducted in the absence of any commercial or financial relationships that could be construed as a potential conflict of interest.

References

  1. Kopittke, P.M.; Minasny, B.; Pendall, E.; Rumpel, C.; McKenna, B.A. Healthy soil for healthy humans and a healthy planet. Crit. Rev. Environ. Sci. Technol. 2024, 54, 210–221. [Google Scholar] [CrossRef]
  2. Jiang, Q.; Peng, J.; Biswas, A.; Hu, J.; Zhao, R.; He, K.; Shi, Z. Characterizing dryland salinity in three dimensions. Sci. Total Environ. 2019, 682, 190–199. [Google Scholar] [CrossRef]
  3. Corwin, D.L. Climate change impacts on soil salinity in agricultural areas. Eur. J. Soil Sci. 2021, 72, 842–862. [Google Scholar] [CrossRef]
  4. Jung, E.; Park, N.; Park, J. Composite modeling for evaluation of groundwater and soil salinization on the multiple reclaimed land due to sea-level rise. Transp. Porous Media 2021, 136, 271–293. [Google Scholar] [CrossRef]
  5. Srivastava, R.; Yetgin, A.; Srivastava, S. The role of legume roots in carbon sequestration, soil health enhancement, and salinity mitigation under climate change: A comprehensive review. Soil Tillage Res. 2025, 253, 106656. [Google Scholar] [CrossRef]
  6. Yang, S.; Miao, Q.; Shi, H.; Zhao, Y.; Liu, X.; Nie, X.; Feng, W.; Gonçalves, J.M.; Zhang, T.; Li, Y.; et al. Spatial and temporal heterogeneity of soil salinity and ionic coupling relationship under the water-saving renovation of a typical irrigation district in arid and semi-arid areas. Sci. Total Environ. 2024, 951, 175776. [Google Scholar] [CrossRef]
  7. Kumar, P.; Tiwari, P.; Biswas, A.; Srivastava, P.K. Spatio-temporal assessment of soil salinization utilizing remote sensing derivatives, and prediction modeling: Implications for sustainable development. Geosci. Front. 2024, 15, 101881. [Google Scholar] [CrossRef]
  8. Singh, A. Soil salinization management for sustainable development: A review. J. Environ. Manag. 2021, 277, 111383. [Google Scholar] [CrossRef] [PubMed]
  9. Tao, W.; Deng, M.; Wang, Q.; Su, L.; Ma, C.; Ning, S. Ecological agriculture connotation and pathway of high-quality agricultural development system in northwest arid region. Trans. CSAE 2023, 39, 221–232. (In Chinese) [Google Scholar]
  10. Hou, X.; Xiang, Y.; Fan, J.; Zhang, F.; Hu, W.; Yan, F.; Xiao, C.; Li, Y.; Cheng, H.; Li, Z. Spatial distribution and variability of soil salinity in film-mulched cotton fields under various drip irrigation regimes in southern Xinjiang of China. Soil Tillage Res. 2022, 223, 105470. [Google Scholar] [CrossRef]
  11. Liu, H.-Y.; Zhou, B.-H.; Yang, H.-L.; Liu, X.; Hou, Z. Dynamic characteristics of soil water and salt in cotton field of “dry sowing and wet seedling” in Xiaohaizi irrigation district. J. Shihezi Univ. (Nat. Sci.) 2024, 42, 560–568. [Google Scholar]
  12. Yang, J.; Zhao, J.; Zhu, G.; Wang, Y.; Ma, X.; Wang, J.; Guo, H.; Zhang, Y. Soil salinization in the oasis areas of downstream inland rivers—Case Study: Minqin oasis. Quat. Int. 2020, 537, 69–78. [Google Scholar] [CrossRef]
  13. Delbari, M.; Afrasiab, P.; Gharabaghi, B.; Amiri, M.; Salehian, A. Spatial variability analysis and mapping of soil physical and chemical attributes in a salt-affected soil. Arab. J. Geosci. 2019, 12, 68. [Google Scholar] [CrossRef]
  14. Jiang, P. Soil Improvement and Fertilization; Xinjiang People’s Publishing House: Urumqi, China, 2012; pp. 121–148. [Google Scholar]
  15. Terefe, R.; Yu, K.; Deng, Y.; Yao, X.; Wang, F.; Liu, J. Spatial variability of soil chemical properties of Moso bamboo forests of China. J. For. Res. 2021, 32, 2599–2608. [Google Scholar] [CrossRef]
  16. Kubát, J.-F.; Neumann, M.; Kavka, P. Semi-variograms provide superior spatial and temporal insights into artificial rainfall compared to Christiansen uniformity. J. Hydrol. 2025, 653, 132740. [Google Scholar] [CrossRef]
  17. Gao, M.; Huang, A.; Li, D.; Zhang, Z.; Wang, L.; Zhao, M. Soil Quality Evaluation in a Typical County of Jianghuai Hilly Region Based on GIS. Chin. J. Soil Sci. 2021, 52, 16–24. (In Chinese) [Google Scholar]
  18. Liu, Y.; Lv, T.; Song, R.; Zhang, X.; Chen, F.; Fu, X.; Li, G. Spatial Distribution of Surface Soil Moisture Content Before Spring Sowing in Typical Irrigation Areas in Southern Xinjiang. Agric. Res. Arid. Aras 2024, 42, 264–271+292. (In Chinese) [Google Scholar]
  19. Liao, Y.; Li, D.; Zhang, N. Comparison of interpolation models for estimating heavy metals in soils under various spatial characteristics and sampling methods. Trans. GIS 2018, 22, 409–434. [Google Scholar] [CrossRef]
  20. Shi, C.; Chen, L.; Zhang, Y.; He, S.; Xie, H. Study on Soil Salinization Characteristics of Cultivated Land in Xiaohaizi Irrigation Area of Xinjiang. Arid. Land Geogr. 2023, 46, 1314–1323. (In Chinese) [Google Scholar]
  21. Zhang, Y.; Hou, K.; Qian, H.; Gao, Y.; Fang, Y.; Xiao, S.; Tang, S.; Zhang, Q.; Qu, W.; Ren, W. Characterization of soil salinization and its driving factors in a typical irrigation area of Northwest China. Sci. Total Environ. 2022, 837, 155808. [Google Scholar] [CrossRef]
  22. Chi, C.; Wang, Z. Characterizing salt-affected soils of Songnen Plain using saturated paste and 1:5 soil-to-water extraction methods. Arid Land Res. Manag. 2010, 24, 1–11. [Google Scholar] [CrossRef]
  23. Li, W.; Wang, Z.; Zhang, J.; Zong, R. Soil salinity variations and cotton growth under long-term mulched drip irrigation in saline-alkali land of arid oasis. Irrig. Sci. 2021, 40, 103–113. [Google Scholar] [CrossRef]
  24. Abuduwaili, J.; Yang, T.; Abulimiti, M.; Liu, D.; Ma, L. Spatial distribution of soil moisture, salinity and organic matter in Manas River watershed, Xinjiang, China. J. Arid. Land 2012, 4, 441–449. [Google Scholar] [CrossRef]
  25. Li, B.; Rodell, M. Spatial variability and its scale dependency of observed and modeled soil moisture over different climate regions. Hydrol. Earth Syst. Sci. 2013, 17, 1177–1188. [Google Scholar] [CrossRef]
  26. Li, Y.; Zhong, B.; Xu, X.; Liang, Z. Application of a semi variogram based on a deep neural network to Ordinary Kriging interpolation of elevation data. PLoS ONE 2022, 17, e0266942. [Google Scholar]
  27. Tunçay, T. Comparison quality of interpolation methods to estimate spatial distribution of soil moisture content. Commun. Soil Sci. Plant Anal. 2021, 52, 353–374. [Google Scholar] [CrossRef]
  28. Xin, M.; Lv, T.; He, X.; Cao, Y.B.; Wang, M.M. Spatial variation of surface soil salinity in under-film drip irrigating of cotton field in irrigated areas of Manas River Basin. Agric. Res. Arid. Areas 2017, 35, 74–79. (In Chinese) [Google Scholar]
  29. Li, Y.; Wang, G.; Liu, Y.; Lv, N.; Liang, F.; Fan, J.; Yin, F. Distribution Characteristics of Soil Physicochemical Properties and Salt Ions in Typical Oasis Irrigation Areas of Xinjiang. Trans. Chin. Soc. Agric. Mach. 2024, 55, 357–364+414. (In Chinese) [Google Scholar]
  30. Li, Y.; Men, Q.; Luo, Y. Effect of fruit on water use efficiency of apple trees under soil drought. Agric. Res. Arid. Areas 2000, 80–85+90. (In Chinese) [Google Scholar]
  31. Yang, P.; Ding, G. Distribution characteristics and genesis analysis of groundwater salinity in Tumushuke City, Xinjiang. Ground Water 2017, 39, 252–254. (In Chinese) [Google Scholar]
  32. Wang, Z.; Fan, B.; Guo, L. Soil salinization after long-term mulched drip irrigation poses a potential risk to agricultural sustainability. Eur. J. Soil Sci. 2019, 70, 20–24. [Google Scholar] [CrossRef]
  33. Devkota, K.P.; Devkota, M.; Rezaei, M.; Oosterbaan, R. Managing salinity for sustainable agricultural production in salt-affected soils of irrigated drylands. Agric. Syst. 2022, 198, 103390. [Google Scholar] [CrossRef]
  34. Kramer, I.; Mau, Y. Review: Modeling the Effects of Salinity and Sodicity in Agricultural Systems. Water Resour. Res. 2023, 59, e2023WR034750. [Google Scholar] [CrossRef]
  35. Du, Y.; Liu, X.; Zhang, L.; Zhou, W. Drip irrigation in agricultural saline-alkali land controls soil salinity and improves crop yield: Evidence from a global meta-analysis. Sci. Total Environ. 2023, 880, 163226. [Google Scholar] [CrossRef] [PubMed]
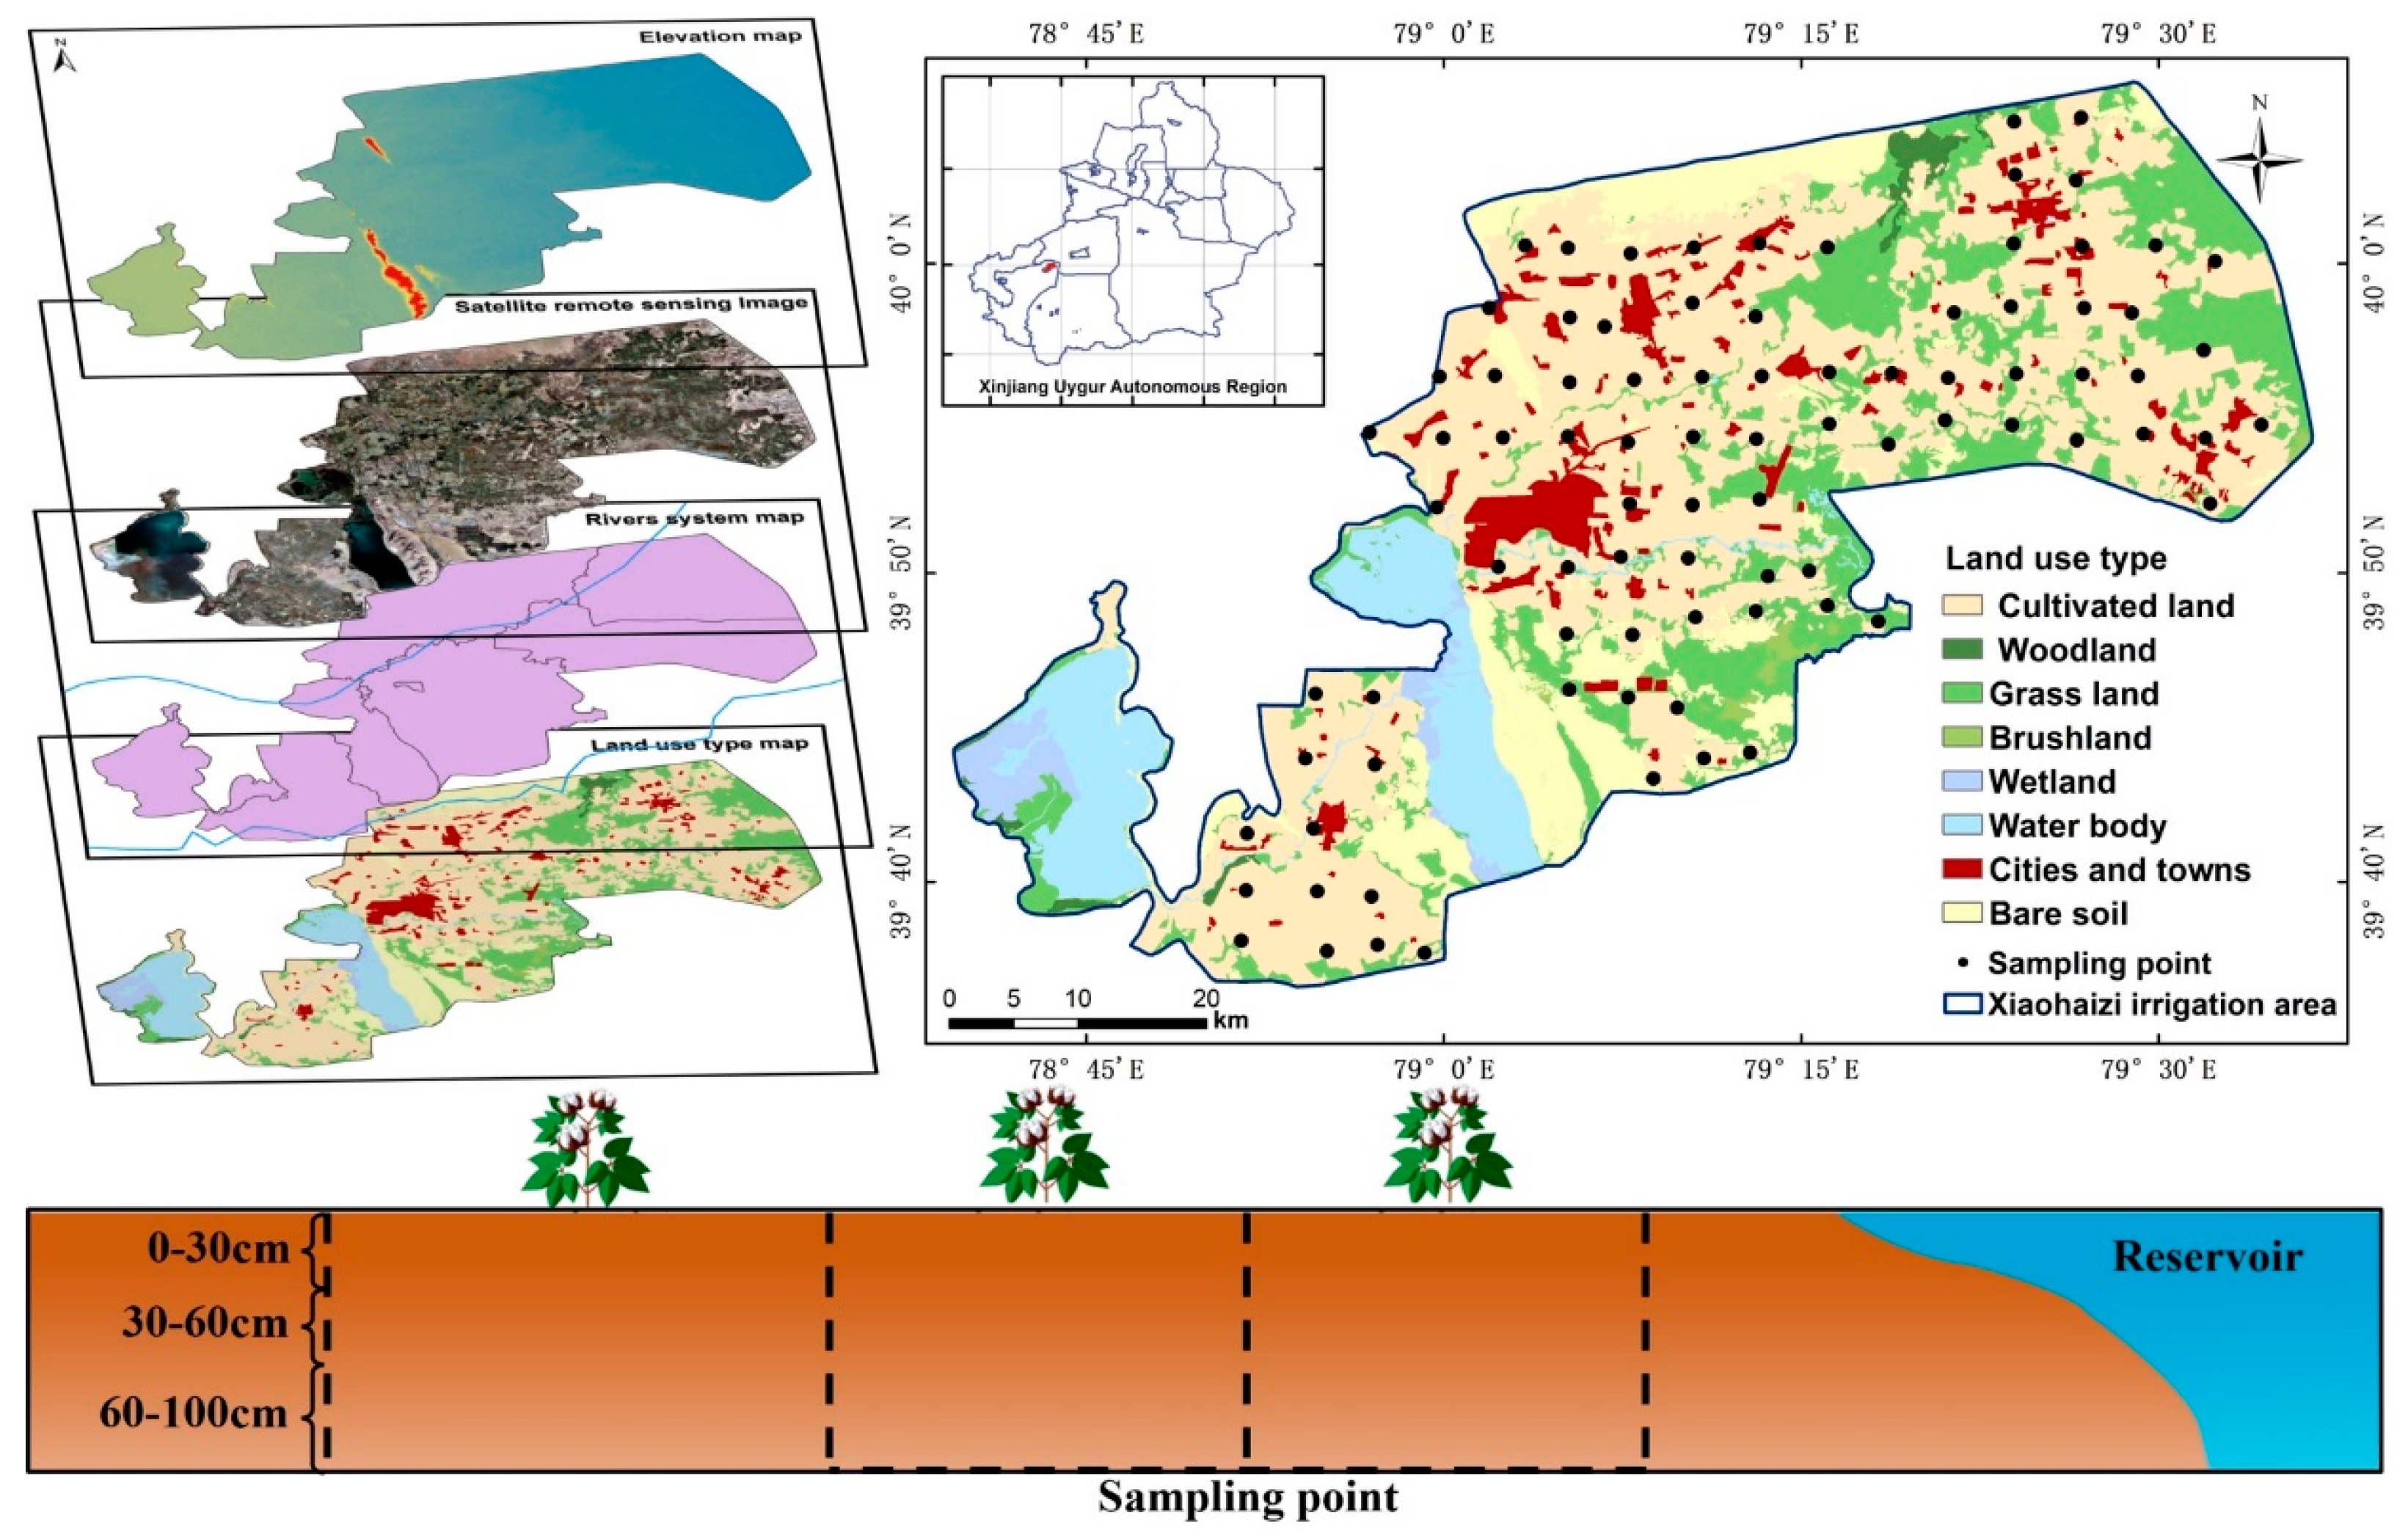
Figure 1. Spatial distribution of soil sampling points in the Xiaohaizi Irrigation Area, Xinjiang. A total of 87 sampling sites were selected using a 5 × 5 km grid, covering major land-use types and soil conditions across the irrigation district. Samples were collected at three depths (0–30 cm, 30–60 cm, and 60–100 cm) during two key periods: before sowing (March) and after harvest (October) in 2023.
Agronomy 15 02413 g001
Figure 2. Descriptive statistics of soil salt content across different soil layers and sampling periods. The boxplots show the median, quartiles, and outliers of soil salinity (g/kg) for 0–30 cm, 30–60 cm, and 60–100 cm layers before sowing and after harvest, highlighting the surface enrichment of salts and temporal variation.
Agronomy 15 02413 g002
Figure 3. (a) Correlation heatmap between total soil salinity and major ions (SO42−, Ca2+, Mg2+, Cl, Na+, K+, HCO3). (b) Ion concentrations across soil depths. (c) Ion concentrations by salinization level (non-saline to saline). These figures illustrate the dominant role of sulfate and calcium ions in driving salinity and their vertical distribution patterns.
Agronomy 15 02413 g003
Figure 4. Spatio-temporal Evolution of Soil Salinization in the Xiaohaizi Irrigation District. The figures illustrate shifts between salinity classes across different soil layers, highlighting areas of salinization intensification or mitigation.
Agronomy 15 02413 g004
Table 1. Classification of soil salinization types [14].
Salinization TypeNon
Salinized
Slightly
Salinized
Moderately
Salinized
Severely
Salinized
Salinized
saltness (g/kg)<33~66~1010~20>20
Table 2. Semi-variance function model and related parameters of soil salt content.
Sample TimeDepth (cm)Theoretical ModelNugget
C0
Total Sill C0 + CC0/(C0 + C) (%)Range (m)R2
Before sowing0–30Gaussian0.8329.582.85200.810.846
30–60Exponential6.8728.632414,8200.715
60–100Exponential2.9919.991517,6700.934
After harvesting0–30Exponential13.6325.265076500.730
30–60Gaussian7.1318.1139.453000.806
60–100Gaussian5.0314.9633.65455.960.829
Table 3. Cross-validation errors of estimating soil salt content using the interpolation method.
Sample TimeDepthPrediction Error
MERMSEASEMSERMSSE
Before sowing0–30−0.09037.02987.0884−0.01270.9901
30–60−0.07034.93835.0338−0.01310.9821
60–100−0.01643.63273.8101−0.00250.9578
After harvesting0–300.03294.88264.76320.00691.0183
30–60−0.06123.98564.2306−0.01150.9433
60–1000.01853.65723.69350.00510.9905
Table 4. Climatic conditions of different irrigated areas.
Irrigated AreaAnnual Average Temperature (℃)Annual Evaporation (mm)Annual Precipitation (mm)Steam Reduction Ratio
Yinchuan Plain Irrigation Area9.012015.63187.7210.74
Manasi River Irrigation Area6.542096.612416.9
Xiaohaizi Irrigation Area11.42423.152.446.24
Kashgar River Irrigation Area12.22459.3650.7248.49
Disclaimer/Publisher’s Note: The statements, opinions and data contained in all publications are solely those of the individual author(s) and contributor(s) and not of MDPI and/or the editor(s). MDPI and/or the editor(s) disclaim responsibility for any injury to people or property resulting from any ideas, methods, instructions or products referred to in the content.