Article

Heat Stress Tolerance and Photosynthetic Responses to Transient Light Intensities of Greek Grapevine Cultivars

1
Department of Wine, Vine and Beverage Sciences, University of West Attica, 28, Ag. Spyridonos Str., 12243 Athens, Greece
2
Laboratory of Viticulture, Department of Crop Science, Agricultural University of Athens, 75 Iear Odos Str., 11855 Athens, Greece
*
Authors to whom correspondence should be addressed.
Agronomy 2025, 15(10), 2344; https://doi.org/10.3390/agronomy15102344
Submission received: 29 August 2025 / Revised: 28 September 2025 / Accepted: 4 October 2025 / Published: 5 October 2025

Abstract

This study investigates the effects of rising temperatures on photosynthetic efficiency and stress tolerance in major Greek grapevine cultivars by using Sauvignon Blanc and Merlot as references. Muscat and Assyrtiko displayed the most heat-tolerant photosynthetic apparatus among the white cultivars, while Mavrodafni was the most heat-tolerant among the red ones, by effectively managing excess light energy. Sauvignon Blanc, although exhibiting heat susceptibility, maintained high photosystem II (PSII) functionality under heat stress by activating photoprotective mechanisms. Savvatiano and Agiorgitiko were more vulnerable to photo-oxidative stress above 35 °C, while Agiorgitiko maintained a functional photosynthetic apparatus, even at 40 °C, by shifting to a more photoprotective strategy. In contrast, Merlot, despite its resistance to photo-oxidative stress, lacked photoprotective investment, resulting in suppressed PSII under heat stress. Moschofilero was the most susceptible cultivar to photo-oxidative stress. Leaf morphological traits also contributed to heat stress tolerance, with smaller, thicker leaves facilitating thermoregulation. The present results provide important insights into specific responses to heat stress of major Greek grapevine cultivars. This knowledge may aid in selecting heat-tolerant genotypes and optimizing vineyard site selection, thereby enhancing the sustainability and climate resilience of viticulture.

1. Introduction

Climate change has led to more frequent, intense, and prolonged heat events, with Mediterranean regions being at the center of this challenge by experiencing temperatures above the global average [1,2]. Except for quality degradation by producing wines with higher alcohol content, lower acidity, and altered aromatic profiles, high temperatures also threaten the sustainability of several vineyard sites, by potentially making them unsuitable for viticulture [3]. Therefore, implementing sustainable management strategies for the adaptation of viticulture to emerging stress conditions is essential for preserving its long-term sustainability [4]. Some of these strategies include the relocation of vineyards to cooler areas, the application of viticultural shading techniques, and the selection of genotypes with advanced heat tolerance [5,6].
One of the most reliable indicators of heat tolerance is photosynthesis, as it is considered the most heat-sensitive physiological process that can be inhibited before other heat stress symptoms are detected [7,8]. The heat tolerance of the photosynthetic apparatus is thought to be mainly dependent on the thermostability of PSII, one of the most heat-sensitive components of the electron transport chain [9,10,11,12]. This PSII vulnerability is primarily attributed to the increased fluidity of thylakoid membranes at temperatures above 35 °C, leading to the detachment of the major light-harvesting complex (LHCII) from the PSII reaction center (PSII-RC), which becomes more susceptible to damage due tο excess light energy [13]. Disruptions in thylakoid membrane integrity may inhibit membrane-associated electron carriers and enzymes, thereby impairing electron flow and leading to reduced PSII function [14]. Such damages in the electron transport system are manifested by increases in the initial chlorophyll fluorescence emission, which is a reliable indicator of PSII efficiency and photosynthetic apparatus stress tolerance [15,16].
However, high temperatures are often accompanied by elevated vapor pressure deficit (VPD), which increase transpiration demands [17]. This, in turn, triggers stomatal closure as a protective mechanism to reduce water loss and prevent embolism in the vascular system [18]. Such reductions in stomatal conductance decrease transpiration rates, thereby limiting the leaf cooling capacity under high temperatures and prolonged solar exposures [19]. This mechanism is vital for grapevines to withstand heat waves, maintain low leaf temperatures (Tleaf), and avoid leaf-burning symptoms [20]. Cultivar-specific stomatal responses have led to the classification of grapevines as isohydric and anisohydric, according to their stomatal sensitivity to high VPD, which contributes to differences in heat stress tolerance [21]. Anisohydric behavior contributes to adequate leaf cooling, whereas a reduction in stomatal conductance in isohydric cultivars may enhance the damaging heating effects [3].
Additionally, high temperatures usually coexist in nature with high light intensities, which synergistically intensify plant stress, making their evaluation essential [22,23]. Additionally, climate change, with the upcoming scenarios of even higher temperatures, will potentially place in danger low-latitude areas, by making them unsuitable for viticulture [24,25]. Therefore, the necessity for a sustainable viticulture will probably change the current geographical distribution of vineyards by pushing them to higher latitudes or altitudes [26]. Regarding this, we should consider that high-altitude regions are characterized by higher light intensities and, therefore, such locations are more suitable for cultivars with better responses under such conditions [27,28,29,30,31]. In contrast, high-latitude regions are characterized by lower light intensities, making them more suitable for cultivars with better performance under limited light conditions [32,33]. This evidence strongly indicates that light intensity is a decisive factor in determining suitable cultivation areas, highlighting the importance of evaluating their performance under fluctuating light conditions.
The main goal of this study was to assess, compare, and draw conclusions regarding the resistance of different grapevine cultivars under heat stress conditions. We also evaluated the cultivars’ short-term photosynthetic responses under transient light fluctuations to obtain a more comprehensive view of their physiological behavior. Such knowledge will be crucial for identifying heat-tolerant genotypes and optimal cultivation sites for each variety, thereby supporting the wine sector to adapt to climate change implications.

2. Materials and Methods

2.1. Plant Material and Growth Conditions

Four white wine varieties (Savvatiano, Assyrtiko, Muscat, and Sauvignon Blanc) and four red wine varieties (Moschofilero, Agiorgitiko, Mavrodafni, and Merlot) were used. Six out of them were Greek indigenous Vitis vinifera varieties (Muscat refers to white Muscat of Samos). The international varieties Sauvignon Blanc and Merlot were included as benchmarks because they are representative examples of white and red wine grape cultivars that are widely cultivated in Greece and also across a broad climatic range worldwide. They are also among the most extensively studied Vitis vinifera varieties. All plants were heterografted onto Richter 110 rootstock 3 years prior to the conduction of the experiments. Thereafter, they were transplanted into 8 L pots filled with a soil substrate mixture consisting of peat (60%), clay (30%), and zeolite (10%). After budbreak, one shoot per plant was maintained, and all of them were placed outdoors. All the pots were irrigated until runoff, and no symptoms of water stress were detected, while balanced fertilization was performed at regular intervals to prevent nutrient deficiencies. Once the plants acquired 10–11 fully expanded leaves, they were transferred into a plant growth chamber (CMP-6050, Conviron, Winnipeg, MB, Canada) for acclimatization. The chamber was equipped with T5 fluorescent and halogen lamps providing a balanced light spectrum for plant growth and a heat exchange system for temperature control. During the experiments, the lamps were operated at a constant 1000 µmol m−2 s−1 light intensity, the day/night photoperiod cycle was set at 13/11 h, and the relative humidity was maintained at 50–60%. All plants were exposed to three distinct temperature regimes: a control temperature regime with day/night temperatures of 23 °C/15 °C (CT), a moderate heat stress regime at 35 °C/27 °C (MHS), and a severe heat stress regime at 40 °C/32 °C (SHS). Each group of cultivars (white or red) consisted of a total of 16 plants, corresponding to four plants per variety (n = 4), arranged in a completely randomized design. Plants were initially exposed to CT, then to MHS, and finally to SHS. The justification for selecting these temperatures is that 23 °C represents a non-stressful condition supporting normal vegetative growth, 35 °C is close to the upper functional limit, where physiological processes shift from optimal performance to the first signs of stress, and 40 °C corresponds to the temperatures commonly experienced during summer heatwaves in Mediterranean regions. All measurements were performed on mature, fully developed leaves, 4 leaves per plant. Prior to the beginning of measurements, plants were acclimatized for 4–5 days and remained in each condition for 12 days. These transitions from CT to MHS, and from MHS to SHS, were performed gradually, rather than abruptly, to avoid thermal shock and allow the plants to acclimate properly.

2.2. Photosynthetic Light Response Curves (LRCs)

Photosynthetic light response curves (LRCs) were undertaken with the steady-state method using the autoprogram function of Li-COR 6400XT (LI-COR Environmental, Lincoln, NE, USA) under all the temperature regimes (23 °C, 35 °C, and 40 °C).
The measurements were performed with decreasing light intensity from 2000 to 0 µmol m−2 s−1 in ten steps (2000, 1500, 1000, 500, 250, 120, 60, 30, 15, and 0 µmol m−2 s−1) with an average waiting time of 120–200 s at each step. The An/I data collected from the LRCs were then modeled by fitting them to a Michaelis–Menten-based model [34], using non-linear regression techniques in SPSS 29 to determine the parameters of light-saturated photosynthesis (Asat), dark respiration rate (Rdark), light saturation point (LSP), and light compensation point (LCP). The particular model was based on a rectangular hyperbola function, which is described as follows:
A n = ɸ I 0 ×   I × A g max ɸ I 0 ×   I + A g max R D a r k
where An is the net photosynthetic rate [µmol(CO2) m−2 s−1], ɸ(I0) is the quantum yield at I = 0 [µmol(CO2) µmol (photon)−1], I is the photosynthetic photon flux density [µmol (photon) m−2 s−1], Agmax is the estimate of the maximum gross photosynthetic rate [µmol(CO2) m−2 s−1], and Rdark is the dark respiration rate.

2.3. Temperature Dependence Model

Temperature responses of light-saturated photosynthesis (Asat) were modeled by fitting the measured values into a modified Gaussian growth function model [35], which provides bell-shaped curves with great flexibility and accurate fit to the measured data, and it is described as follows:
A ( T ) = A o p t × exp ( T T   o p t ) 2 σ 2
where Aopt is the maximum photosynthetic rate, Topt is the temperature where Aopt occurs, and σ represents the spread of the Gaussian curve, defining how broadly or narrowly the curve is distributed around Topt.

2.4. Chlorophyll Content Measurements

Leaf chlorophyll content (LCC) was estimated by a non-destructive method, which is based on measuring the leaf absorbances in the red and near-infrared regions with the Minolta SPAD-502 chlorophyll meter (Konica Minolta Inc., Osaka, Japan). Using these two absorbances, the meter calculates a numerical SPAD value, which is proportional to the amount of chlorophyll present in the leaf. In order to convert the SPAD data (unitless) to absolute values of chlorophyll content (µg/cm2), we adopted the empirical statistical model of [36]:
LCC = 1.034 + 0.308 × SV + 0.11 × SV 2
where LCC is leaf chlorophyll content and SV is the Spad Value

2.5. Chlorophyll Fluorescence Quenching Analysis

Chlorophyll a fluorescence measurements were performed using the LI-600 Fluorometer (LI-COR Biosciences, Inc., Lincoln, NE, USA). Light-adapted state measurements were first performed with the light intensity inside the growth chamber set at 1000 µmol m−2 s−1. The steady-state fluorescence (Fs) was first determined, and thereafter an 800 ms saturating light of 7500 µmol photons m−2 s−1 was applied to measure the maximum fluorescence in the light-adapted state (Fm′), which was then used for the estimation of the actual quantum efficiency of PSII (ΦPSII):
Φ PSII = Fm Fs Fm
Subsequently, the lights of the chamber were closed and all the desired leaves were dark-acclimated for 30 min before the start of the measurements in the dark-adapted state. The parameters of maximum fluorescence (Fm) and minimum fluorescence (Fo) were then determined, providing an 800 ms saturating pulse of continuous red light at 6000 µmol m−2 s−1, which were then used for the calculation of the maximum quantum efficiency of PSII using the following equation:
Fv Fm = Fm Fo Fm
The parameters of non-photochemical quenching (NPQ) and photochemical quenching (qP) were also determined following Shin et al. [37] with the following equations:
NPQ = Fm Fm Fm
qP = Fm Fs Fm Fo
where Fo’ is the minimum chlorophyll a fluorescence in the light-adapted leaf, calculated using the formula of Oxborough and Baker [38]:
Fo = F o Fv Fm + F o Fm

2.6. Leaf Transpirational Cooling and Thermoregulation

Leaf temperature (Tleaf) measurements were conducted using a non-contact infrared thermometer (IRT) integrated into the LI-600 Porometer (LI-COR Biosciences, Inc., Lincoln, NE, USA). Transpiration rate was also computed from the difference in H20 in an air-stream flowing through a leaf cuvette:
E = M r × ( Ws Wr ) S × 1 Ws
where E is apparent transpiration (mol m−2 s−1), S is leaf area (m2), Mr (mol s−1) is the molar flow rate into the leaf cuvette, and Wr with Ws are water vapor mole fractions into and out of the leaf cuvette, respectively (mol H2O mol air−1).

2.7. Leaf Morphology

For the estimation of leaf size, we used a destruction method following the instructions of Martin et al. [39]. After collecting the plants, the leaves were removed and placed on a sheet of A4 paper bearing a completely black rectangle of 3 × 15 cm (45 cm2) used for software calibration. All the leaves were then photographed using a digital camera, and the photos were uploaded to the ImageJ v.1.53 software for the estimation of leaf area. The average distance between the camera and the leaf was 50 cm (Supplementary Figure S1). For estimation of mesophyll thickness, we followed the instructions of Luo et al. [40] by performing semi-thin leaf cross-sections, which were then photographed at 400× magnification using the digital microscope camera Leica DFC450 (Leica Microsystems, Milton Keynes, UK). All the images were then uploaded to the ImageJ v.1.53 software for the estimation of mesophyll thickness.

2.8. Statistical Data Analysis

Analysis of variance (ANOVA) was conducted to assess the effects of variety and temperature on all the dependent variables, followed by Tukey’s HSD post hoc test at p ≤ 0.05. Prior to performing ANOVA, the assumptions of normality and homogeneity of variances were tested using the Shapiro–Wilk and Levene’s tests, respectively, at a significance level of p ≤ 0.05. Linear and non-linear regression analyses were also performed for curve normalization, fitting data to 3rd- and 4th-degree polynomial growth functions. All statistical analyses were conducted using SPSS Statistics v.29.

3. Results

3.1. Temperature Dependence of Light Response Curves (LRCs) Parameters

LRCs revealed different photosynthetic responses under fluctuating light intensities, with the data being well fitted to the rectangular hyperbola model (R2 > 0.992) (Supplementary Figure S2). Light-saturated photosynthesis (Asat) showed significant differences between treatments and genotypes for the white cultivars (p < 0.001). Asat increased by 36.2–56.2% up to 35 °C, whereas different responses were recorded at 40 °C, with either decreases, minimal changes, or increases. Sauvignon Blanc exhibited the highest Asat, whereas Muscat had significantly the lowest across treatments (p < 0.01) (Figure 1A). Light saturation point (LSP) was also non-linearly correlated with temperature, with increases of 55.4–78.8% up to 35 °C and fluctuating responses at 40 °C depending on cultivar. We did not observe significant differences between genotypes at 23 °C (p = 0.458), in contrast to 40 °C, where Sauvignon Blanc and Muscat recorded the highest LSP and Savvatiano significantly the lowest (p = 0.003) (Figure 1C).
Asat and LSP also significantly differed among red cultivars and treatments (p < 0.001). Asat increased by 15.3–32.7% up to 35 °C and declined by 33.5–43.5% at 40 °C. Mavrodafni exhibited the highest rates across treatments (p < 0.001), whereas no significant differences were observed among the other red varieties (p = 0.340) (Figure 1B). LSP increased by 21.5% up to 35 °C and declined by 10–23.9% at 40 °C, where Mavrodafni presented the highest and Agiorgitiko the lowest values (Figure 1D).
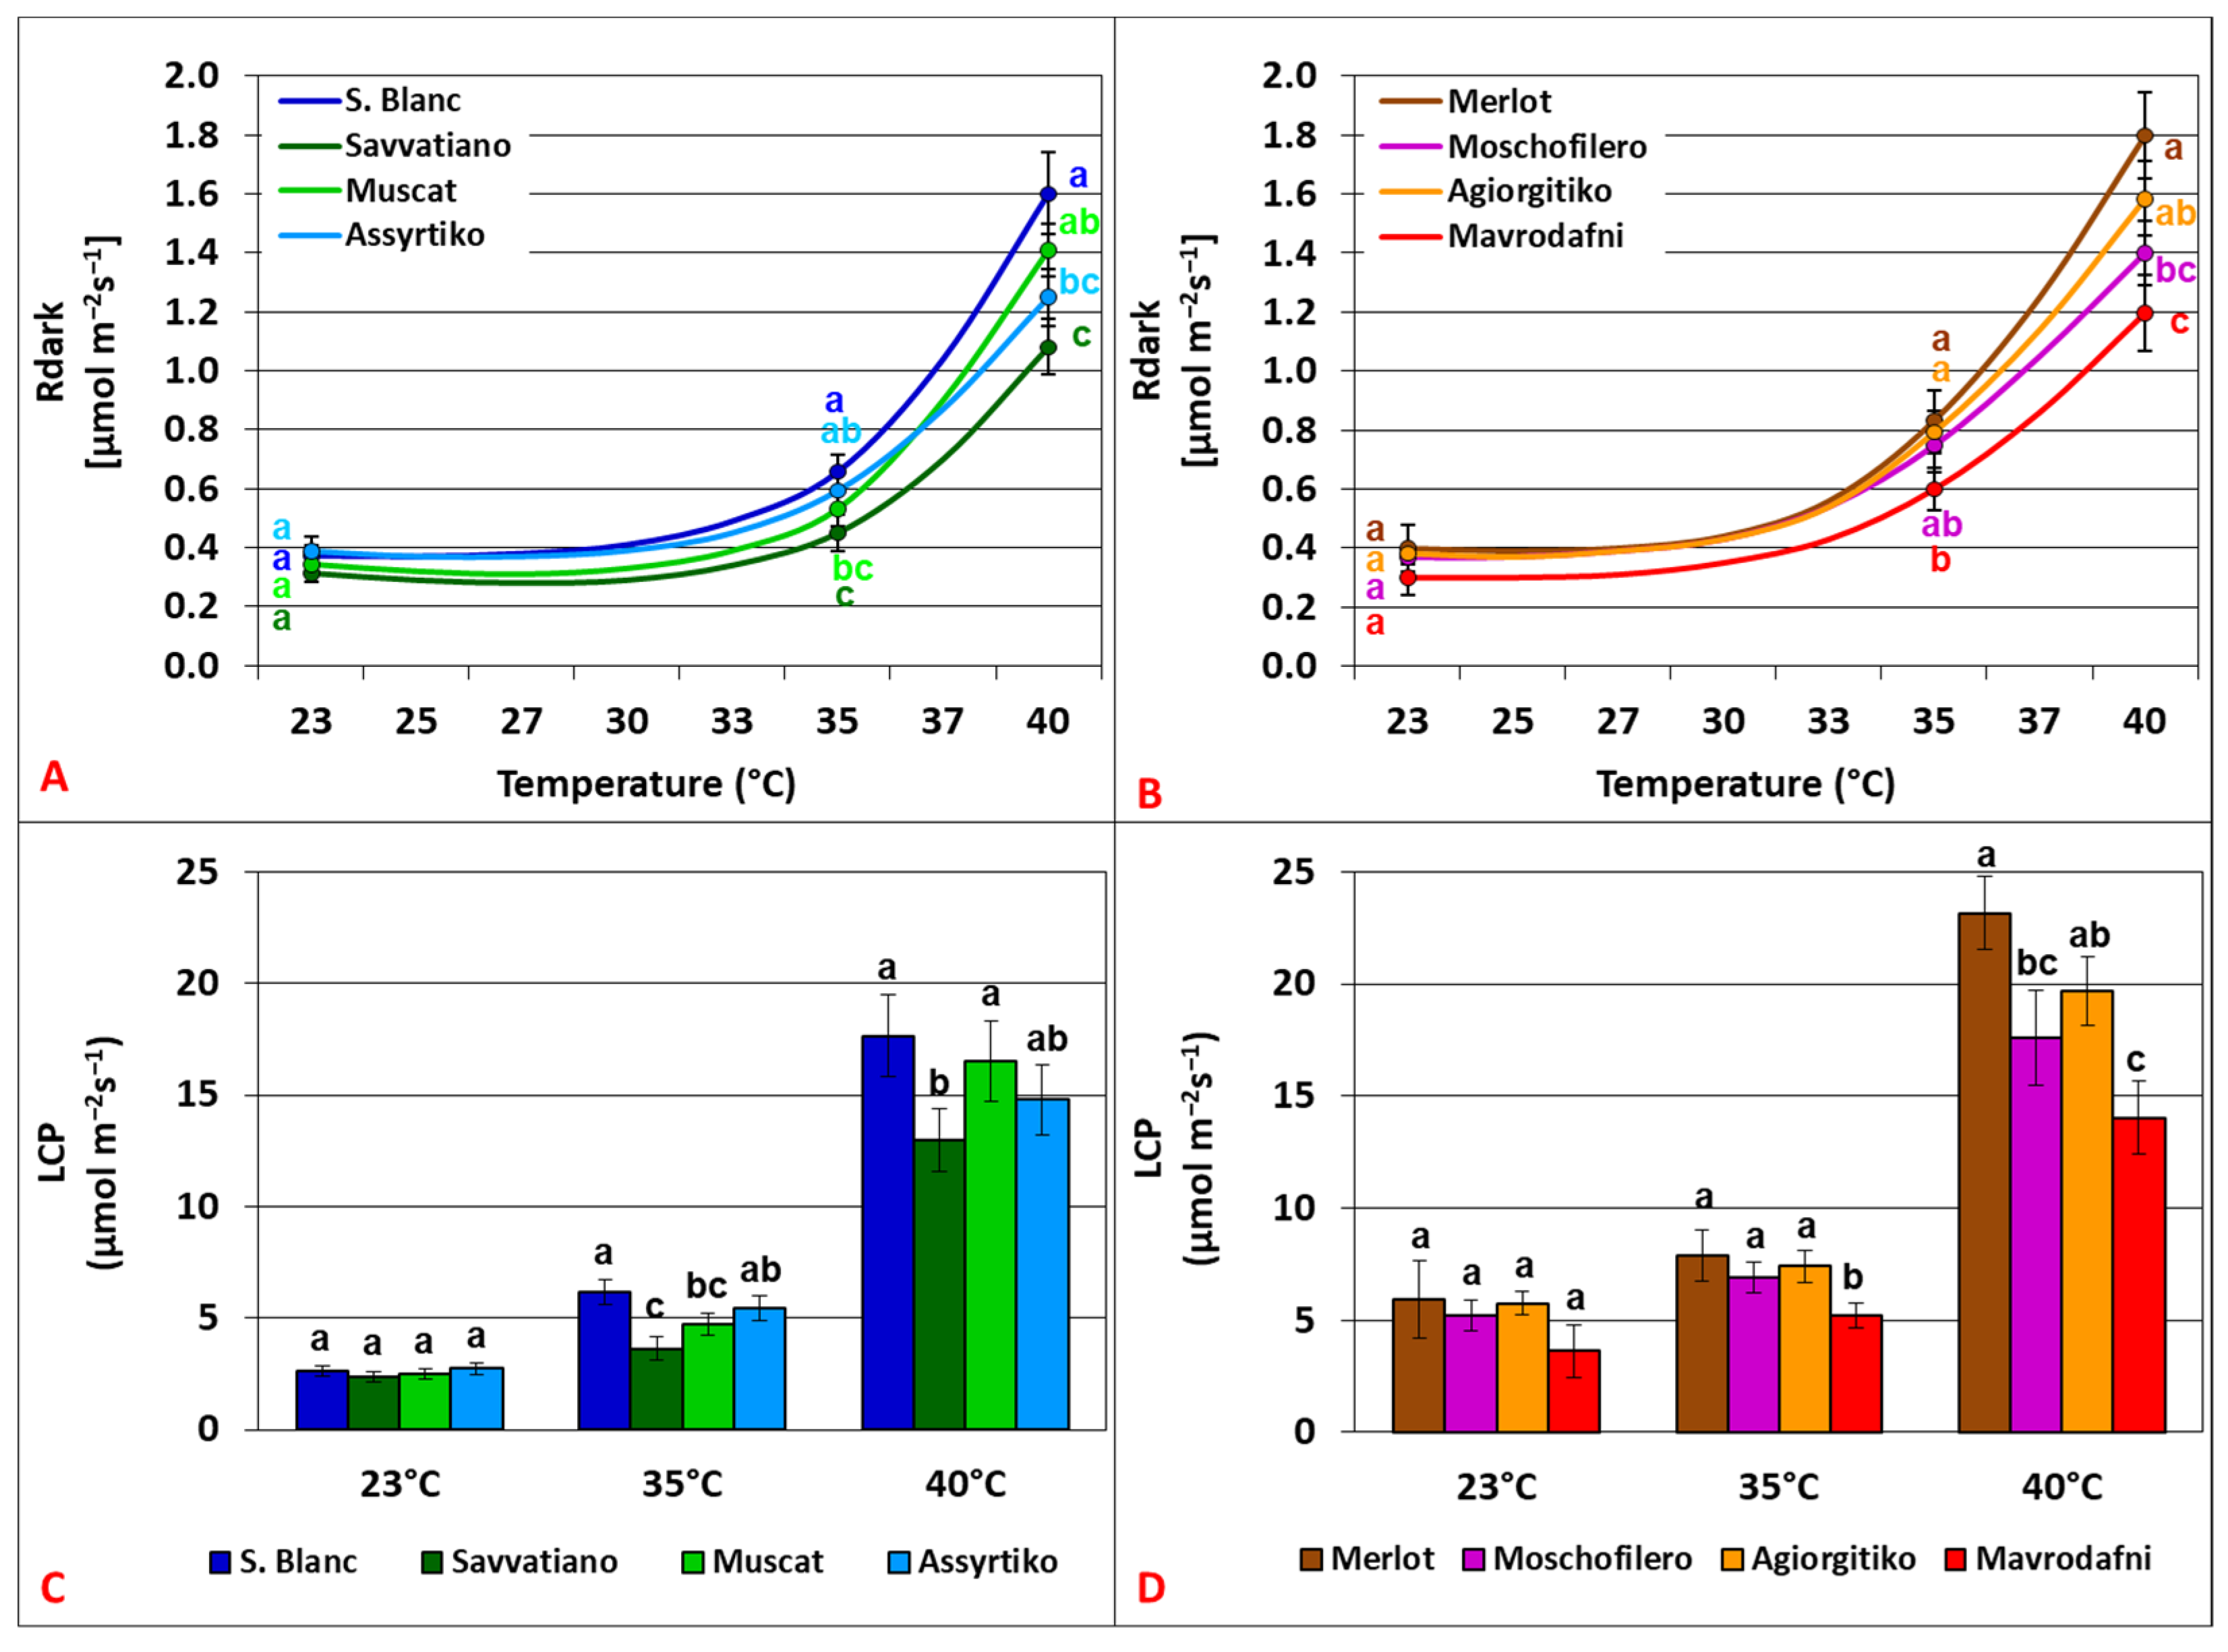
Dark respiration rates (Rdark) and light compensation point (LCP) increased with rising temperature, more exponentially above 35 °C, fitting well to quadratic functions (R2 = 0.982–0.994). No significant differences were observed in Rdark or LCP between genotypes at 23 °C (p > 0.062), in contrast to 35 °C (p < 0.003) and 40 °C (p < 0.001) in both varietal groups. Sauvignon Blanc exhibited the highest Rdark and LCP values, whereas Savvatiano the lowest at 40 °C (Figure 2A,C). Among the red cultivars, Merlot demonstrated the highest Rdark and LCP values while Mavrodafni demonstrated the lowest at 40 °C (Figure 2B,D).

3.2. Temperature Dependence of Chlorophyll Fluorescence Parameters

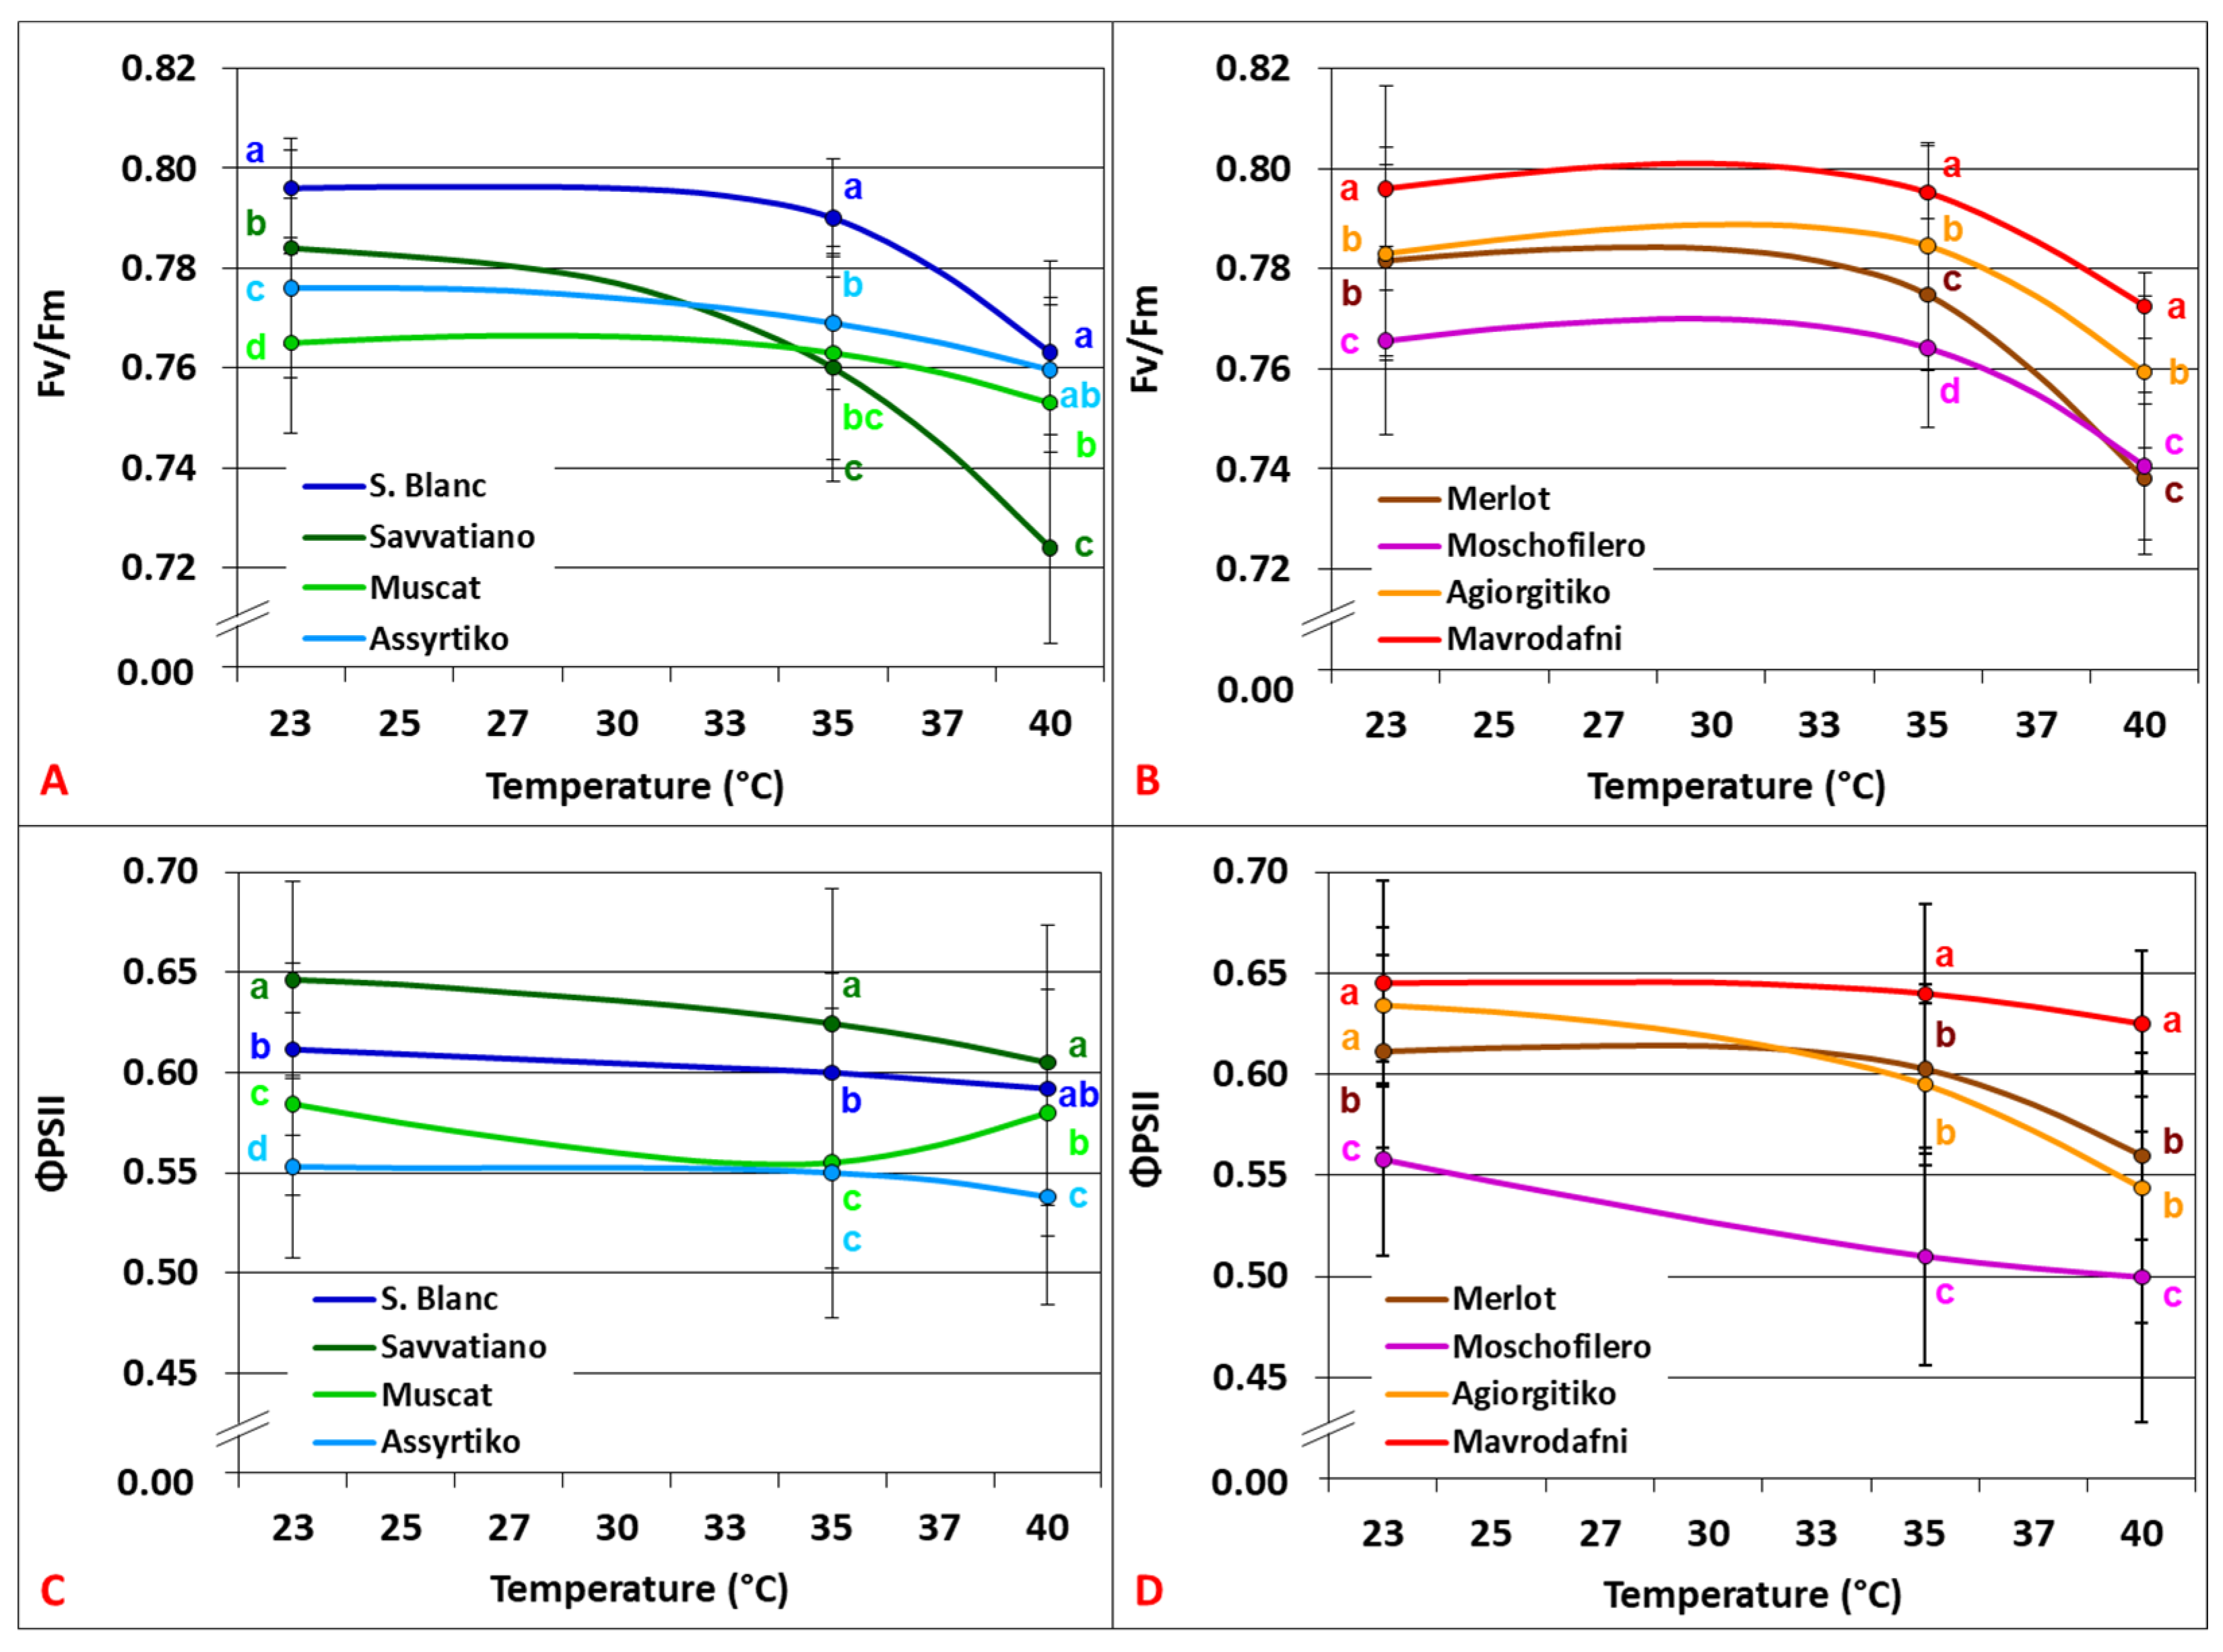
The Fv/Fm parameter remained almost stable with rising temperature up to 35 °C in most cases, in contrast to 40 °C, where most genotypes recorded significant reductions. We observed significant variations among genotypes across all treatments in both varietal groups (p < 0.001). Sauvignon Blanc, Assyrtiko, and Muscat remained Fv/Fm above 0.75 at 40 °C, whereas Savvatiano displayed 3.9–5.1% lower values (p < 0.001) (Figure 3A). ΦPSII demonstrated a stable or slightly decreasing trend up to 40 °C with significant differences among genotypes across all treatments in both varietal groups (p < 0.001). Sauvignon Blanc, Savvatiano, and Muscat exhibited the highest performance, whereas Assyrtiko consistently exhibited the lowest with reduced ΦPSII by 7.2–11.1% at 40 °C (p < 0.001) (Figure 3C).
Among the red genotypes, Mavrodafni exhibited the highest Fv/Fm across treatments, Agiorgitiko 1.71% lower (p < 0.001), and Moschofilero with Merlot 4.1–4.4% lower at 40 °C (p < 0.001). Mavrodafni also exhibited the highest ΦPSII, Agiorgitiko with Merlot significantly lower at 35 °C and 40 °C (5.8–7% and 10.4–13%, respectively), whereas Moschofilero consistently had the lowest across treatments (p < 0.001) (Figure 3D).
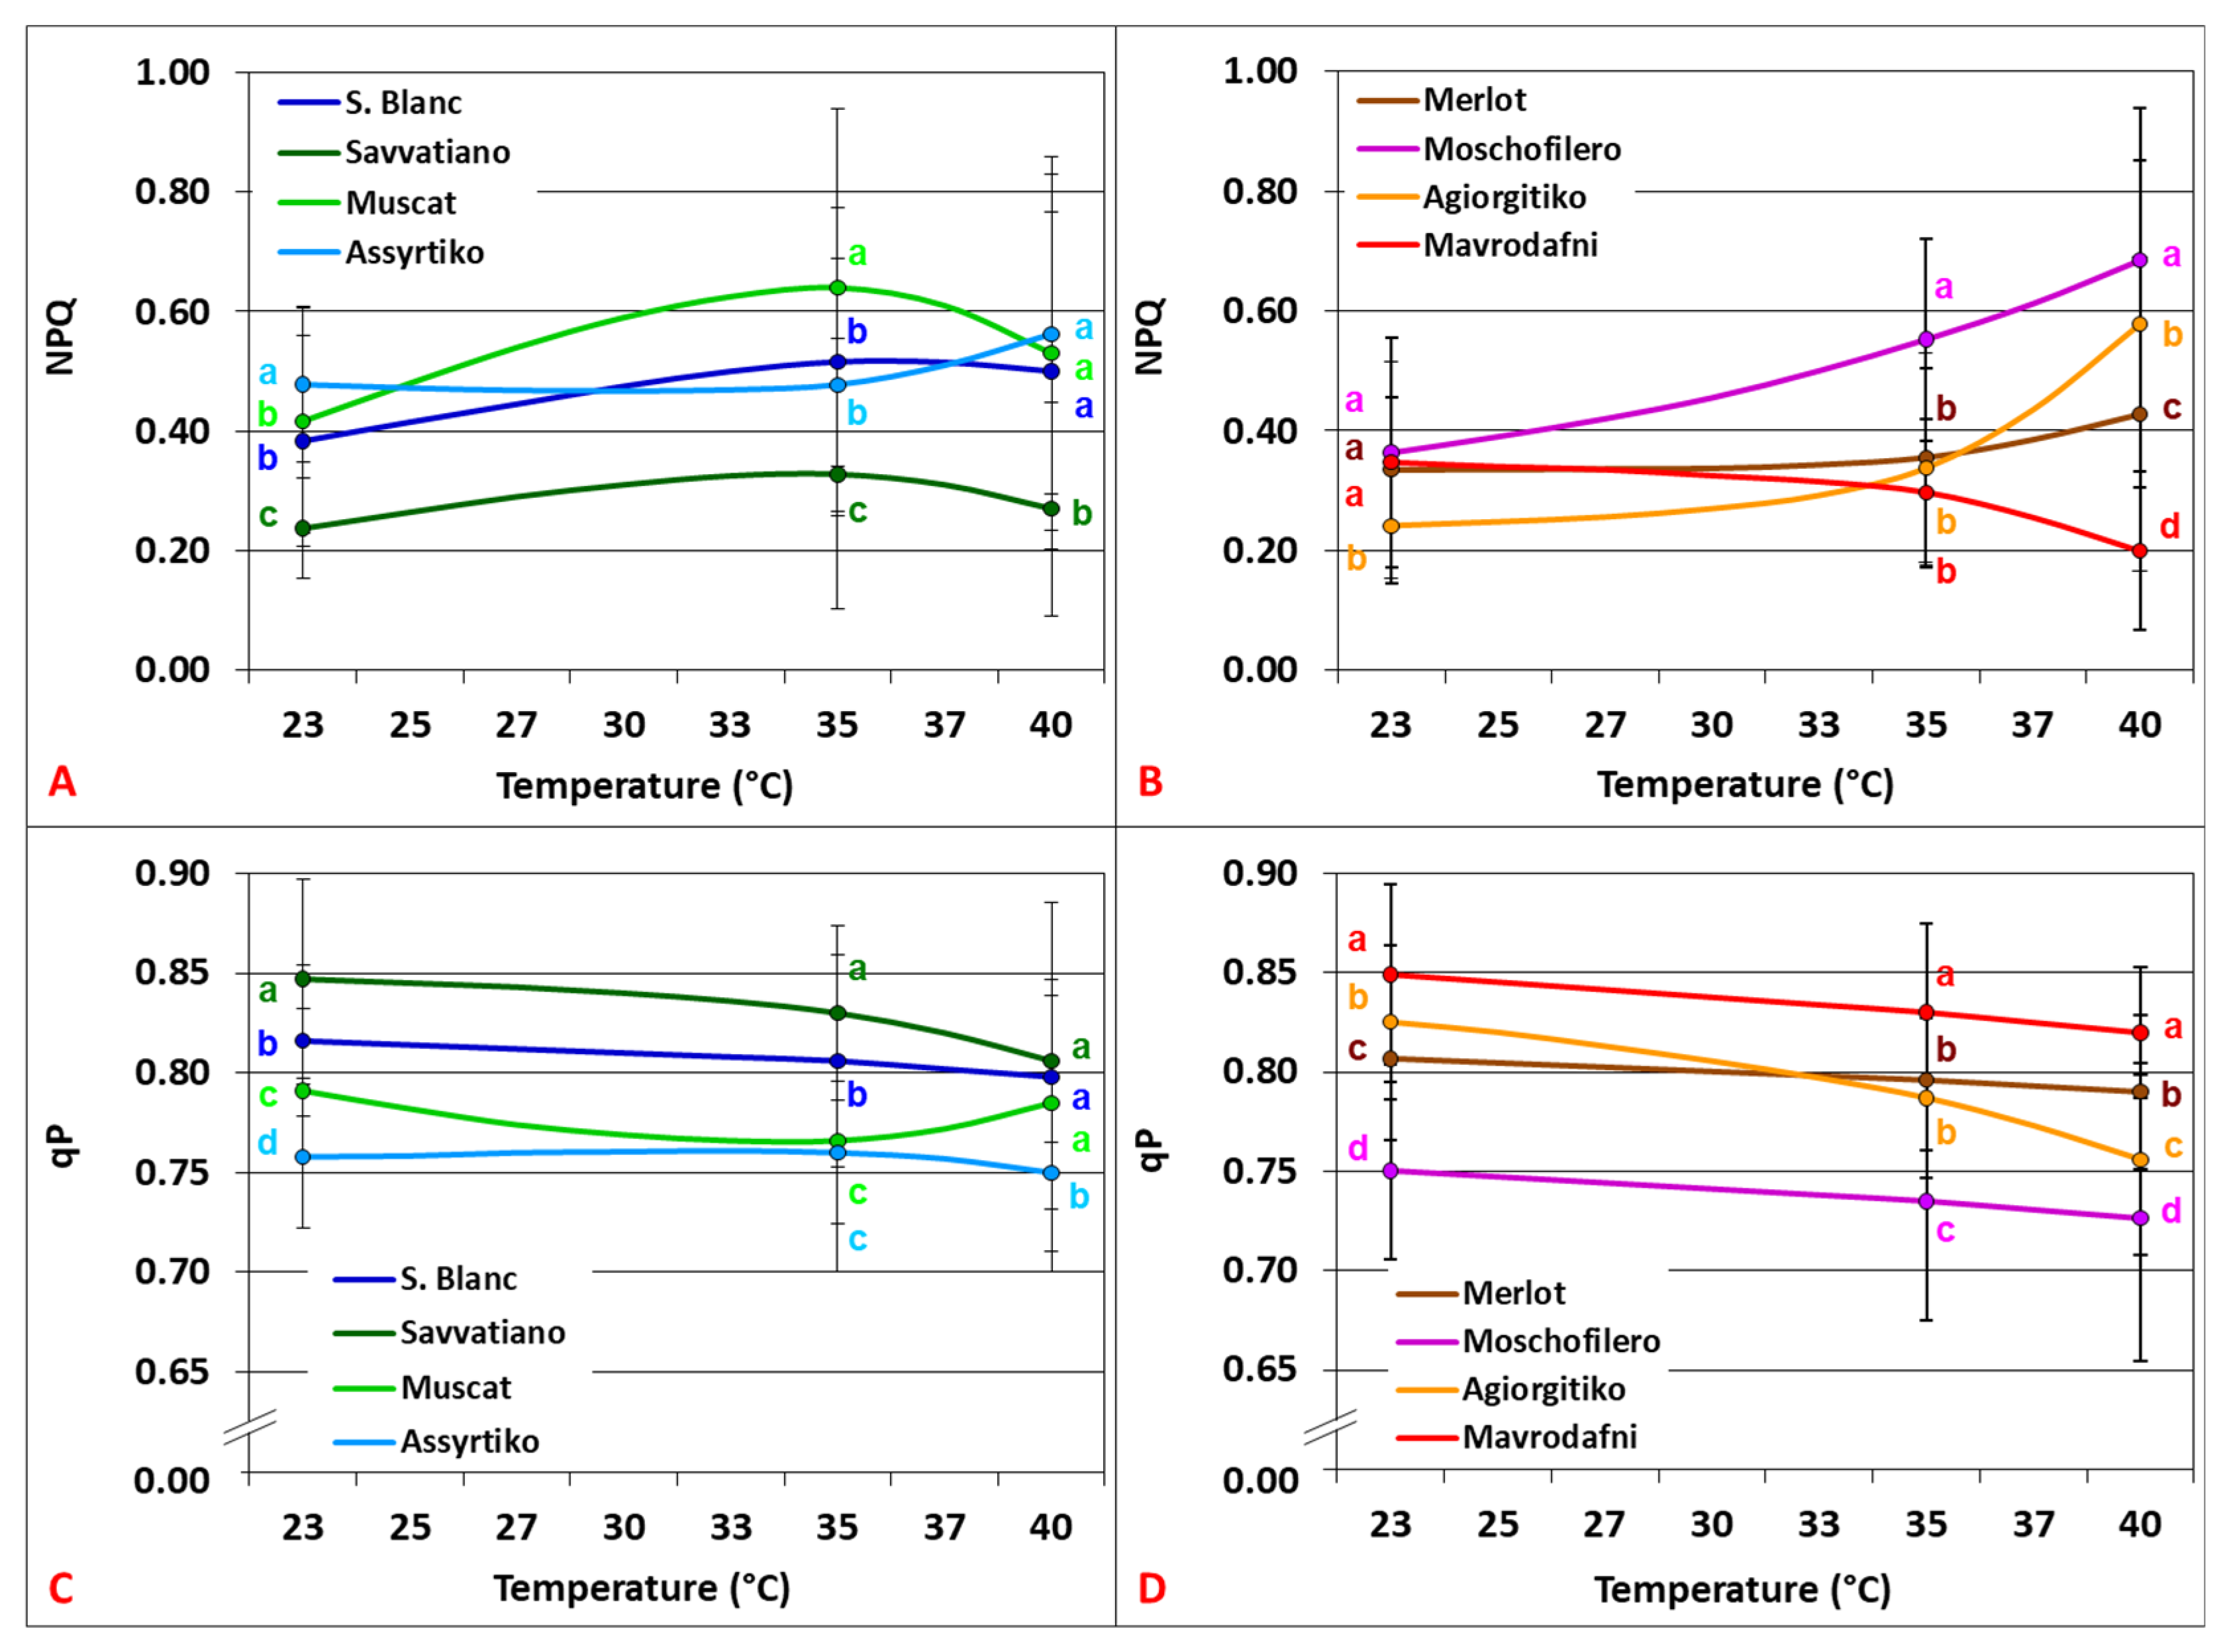
NPQ varied greatly among cultivars across all treatments in both varietal groups (p < 0.001). Sauvignon Blanc, Muscat, and Assyrtiko exhibited high NPQ across treatments, whereas Savvatiano consistently exhibited the lowest with reduced NPQ by 46–52% at 40 °C (p < 0.001) (Figure 4A). qP demonstrated a constant or slightly decreasing trend with rising temperature up to 40 °C in most cases. Significant variations among cultivars across all treatments were observed in both varietal groups (p < 0.001). Sauvignon Blanc, Savvatiano, and Muscat demonstrated the highest performance, whereas Assyrtiko consistently had the lowest with reduced qP by 4.5–6.95% at 40 °C (p < 0.001) (Figure 4C).
Among the red genotypes, Moschofilero presented the highest NPQ, Agiorgitiko 15.5% lower, Merlot 26% even lower, and Mavrodafni at the lowest at 40 °C (p < 0.01) (Figure 4B). Mavrodafni displayed the highest qP, Merlot and Agiorgitiko 3.6% and 7.8% lower, respectively, at 40 °C, and Moschofilero consistently had the lowest across treatments (p < 0.001) (Figure 4D).

3.3. Temperature-Induced Changes in Chlorophyll Content

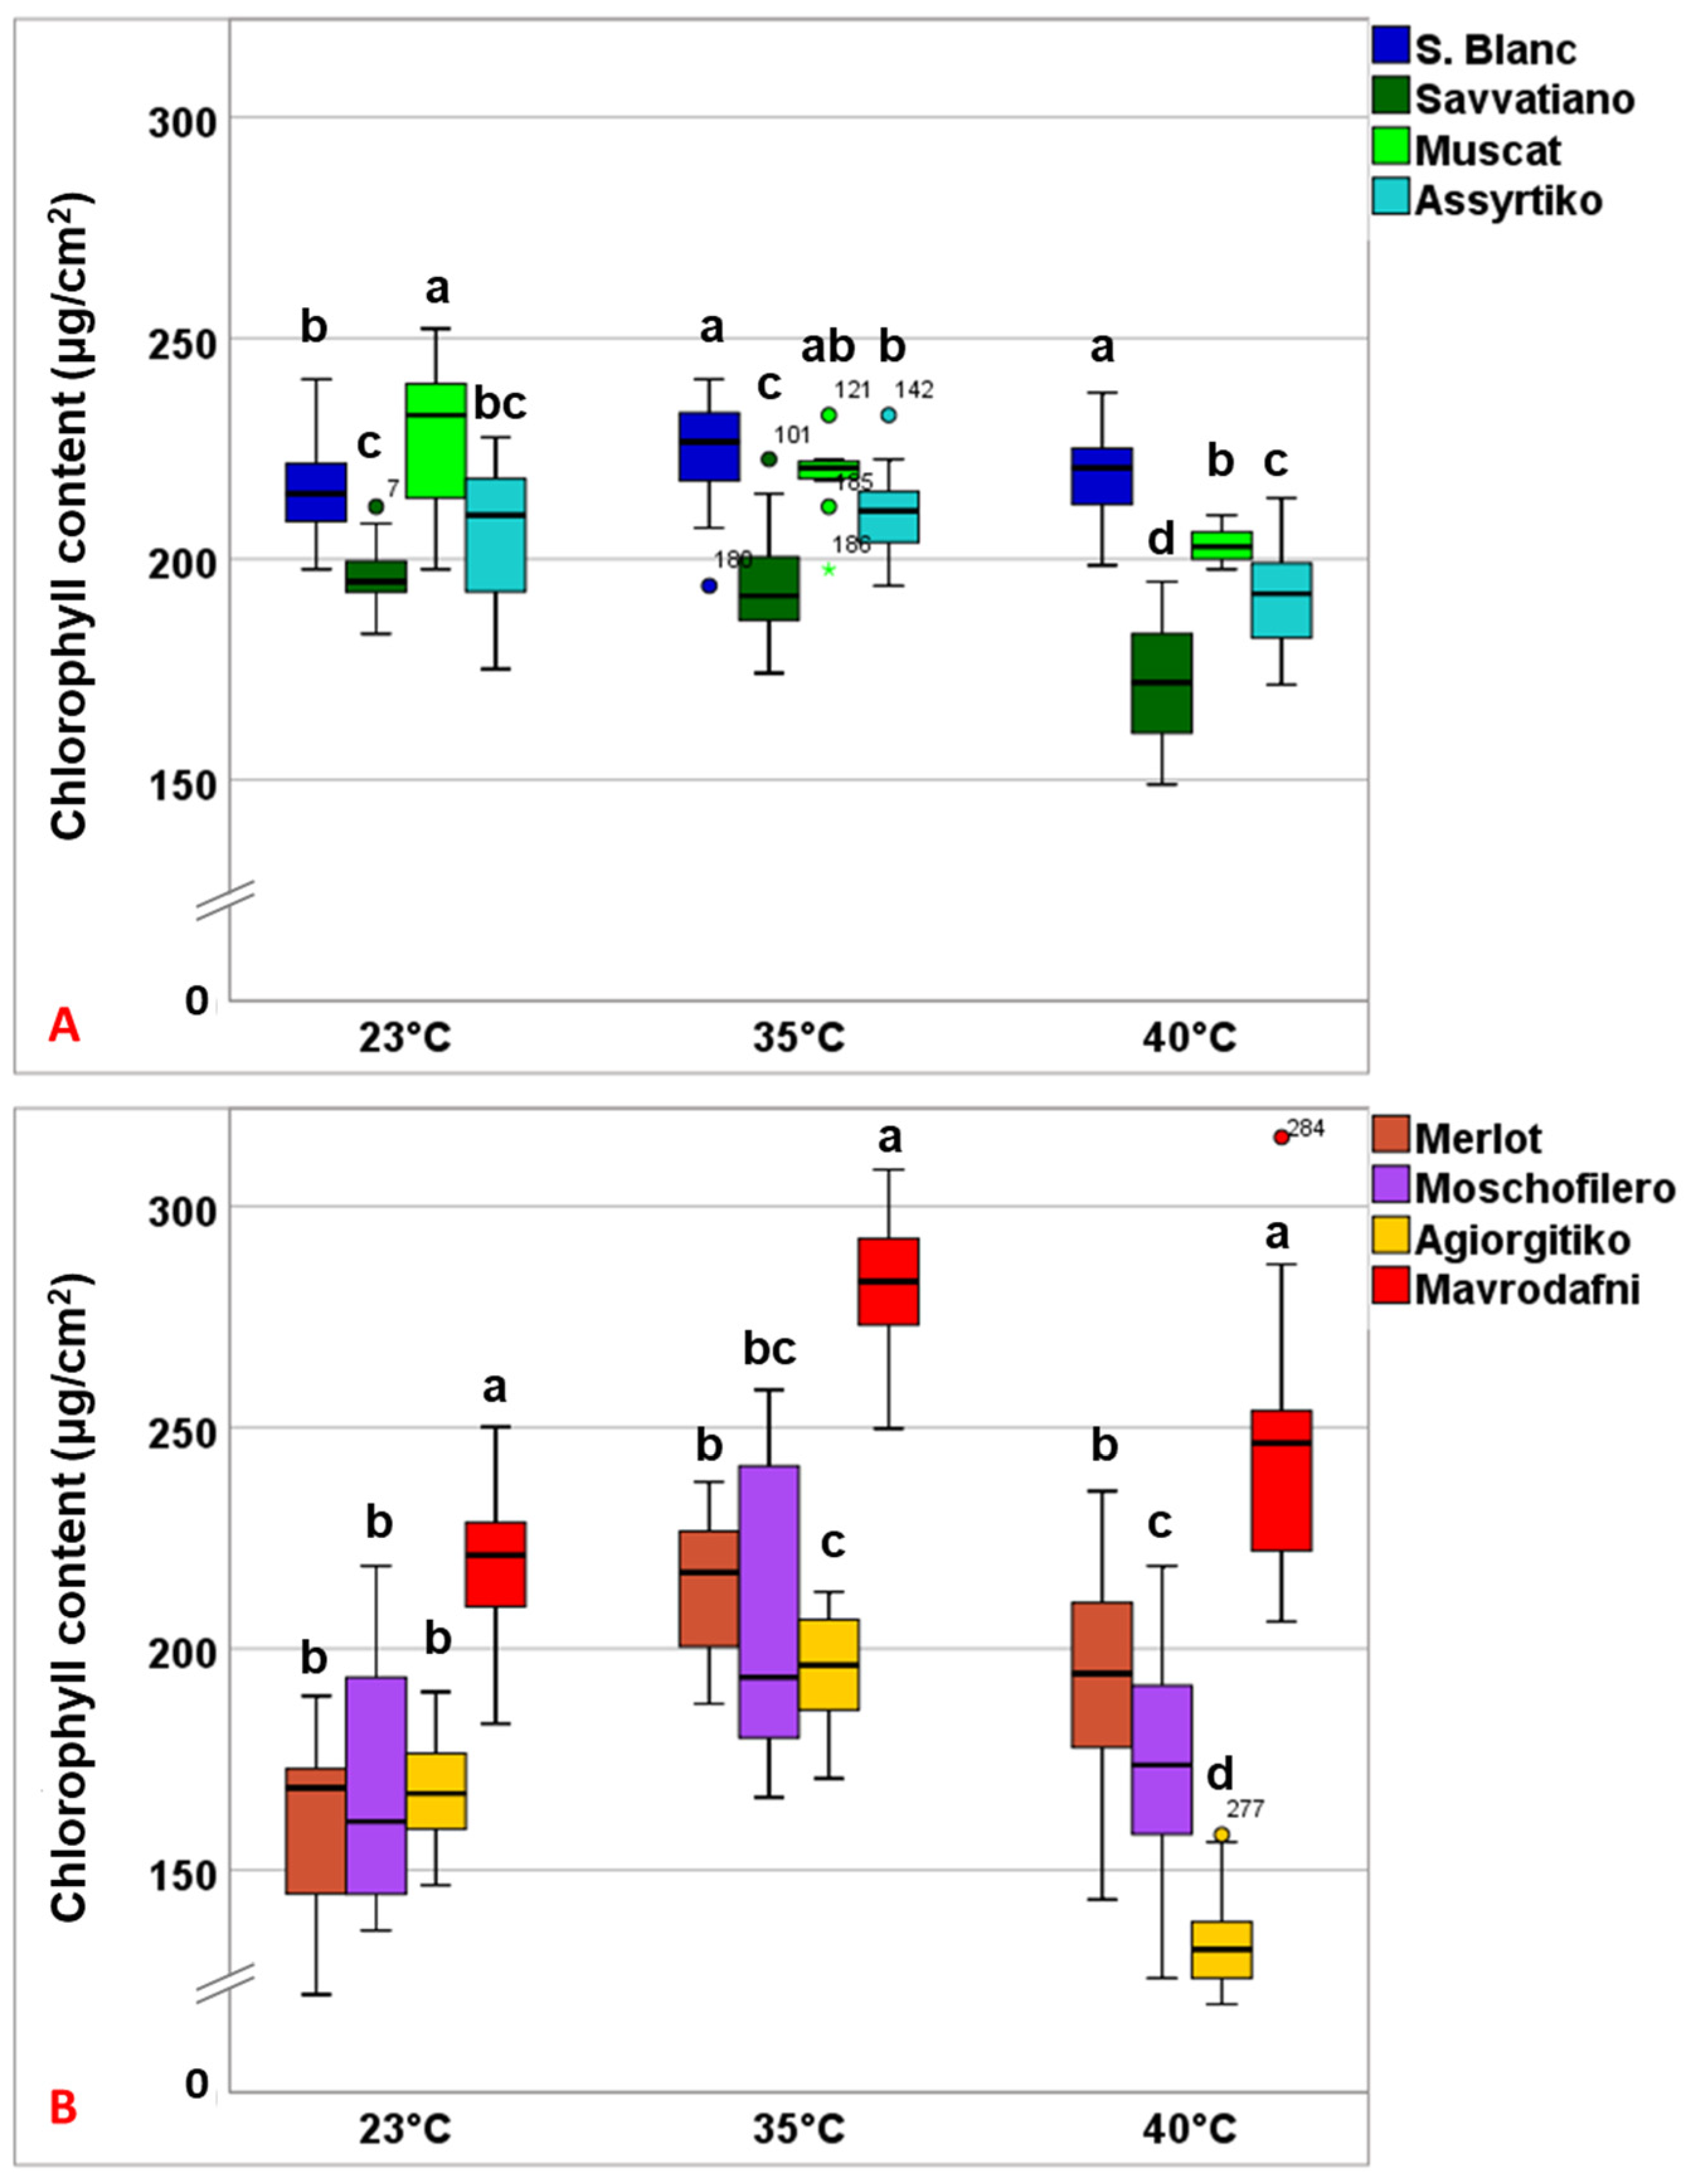
Chlorophyll content varied greatly among cultivars across all treatments in both varietal groups (p < 0.001). White cultivars did not change their chlorophyll concentration from 23 °C to 35 °C (p = 0.981), while reductions of 2.7–11.6% were recorded at 40 °C (p < 0.001). Sauvignon Blanc presented the highest chlorophyll content at 40 °C, Muscat and Assyrtiko reduced concentrations by 7.1 and 12.5%, respectively, whereas Savvatiano significantly the lowest (p < 0.001) (Figure 5A).
Red cultivars increased their chlorophyll content by 16.5–33.1% from 23 °C to 35 °C, but decreased it by 10.1–31.5% at 40 °C. Mavrodafni exhibited the highest chlorophyll content across treatments, Merlot and Moschofilero reduced concentrations by 20.8–28.5% whereas Agiorgitiko presented significantly the lowest at 40 °C (p < 0.001) (Figure 5B).

3.4. Leaf Transpirational Cooling and Thermoregulation

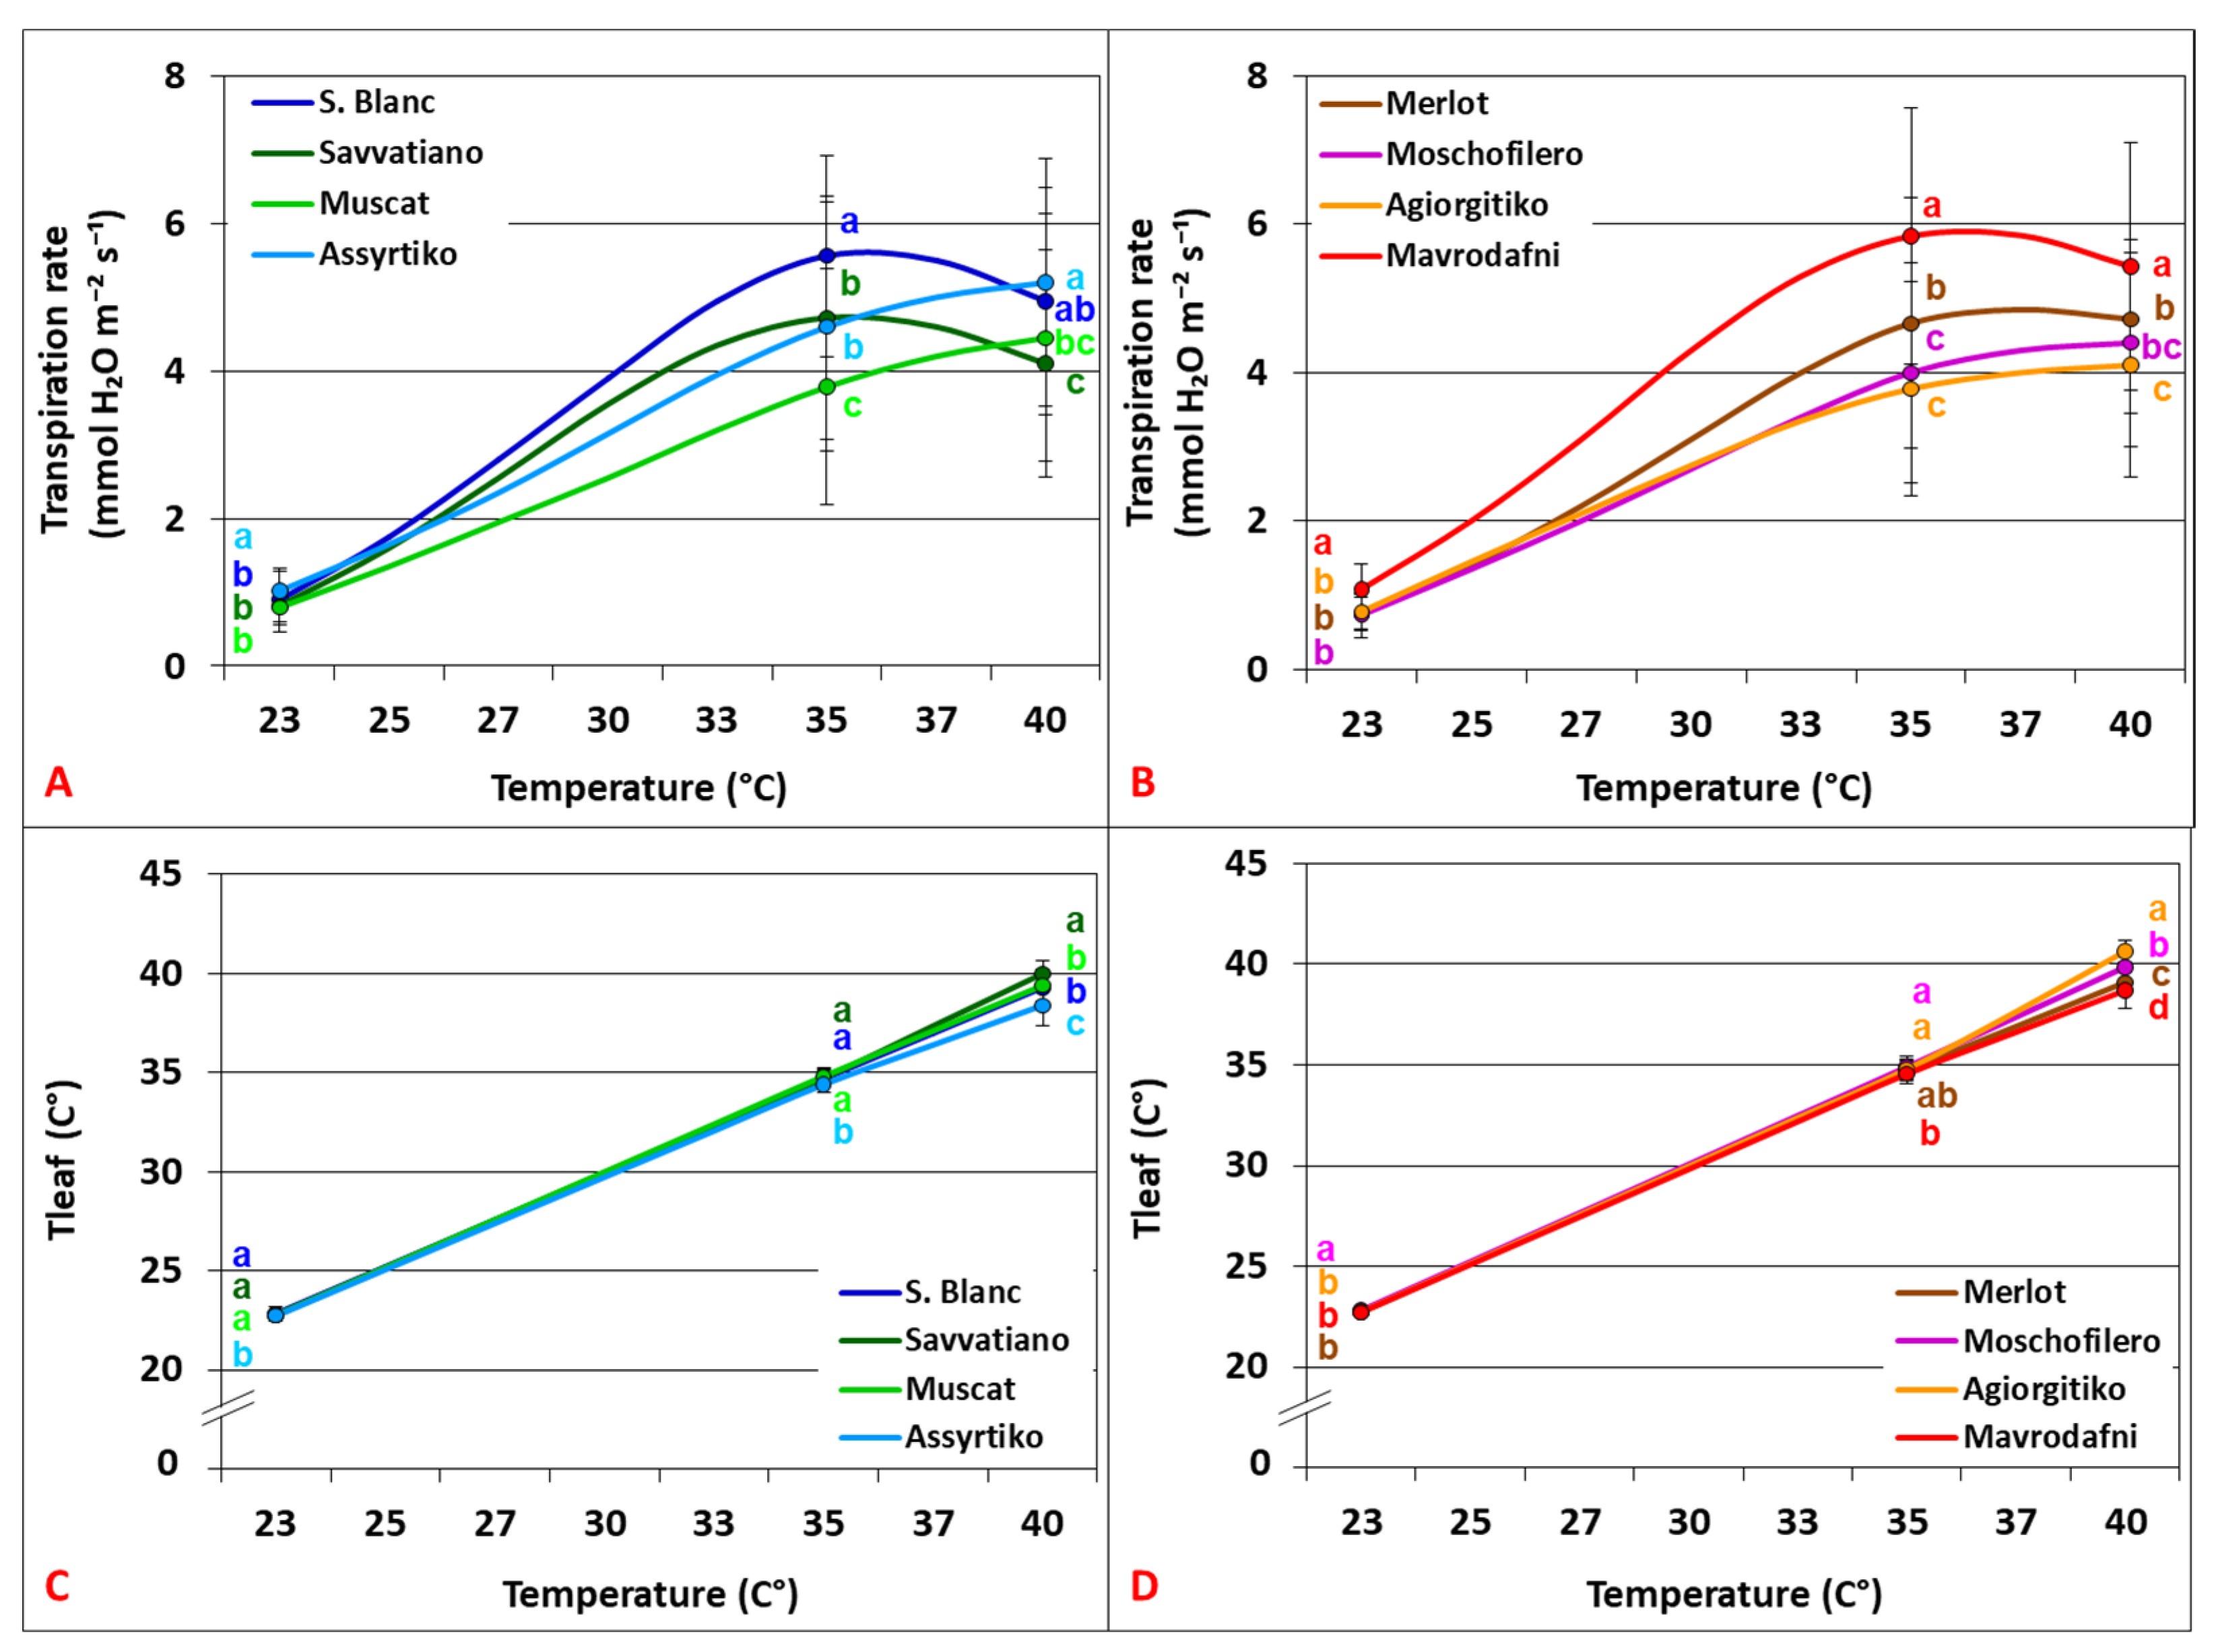
Transpiration (Tr) exponential increased with rising temperature up to 35 °C, followed by a slowdown or stabilization of rates at 40 °C in most cases. Significant variations among treatments and genotypes were recorded in both varietal groups (p < 0.001). Assyrtiko exhibited the highest rates, whereas Savvatiano the lowest at 40 °C. We observed a better Tr retention in Assyrtiko and Muscat above 35 °C, suggesting a higher Topt, whereas Savvatiano exhibited the sharpest decrease from 35 °C to 40 °C (−13.2%) (Figure 6A). Leaf temperature (Tleaf) showed small deviations from growth temperature (Tgrowth) at 23 °C, which gradually increased as the temperature rose to 40 °C. Significant variations among treatments and genotypes were recorded in both varietal groups (p < 0.001). Savvatiano exhibited the highest Tleaf at 40 °C, whereas Assyrtiko significantly the lowest (p < 0.001) (Figure 6C).
Among the red cultivars, Mavrodafni exhibited the highest Tr and Agiorgitiko significantly the lowest at 40 °C (p < 0.001) (Figure 6B). Contrastingly, Agiorgitiko recorded the highest Tleaf and Mavrodafni significantly the lowest at 40 °C (p < 0.001) (Figure 6D).

3.5. Leaf Traits Contributing to Thermotolerance

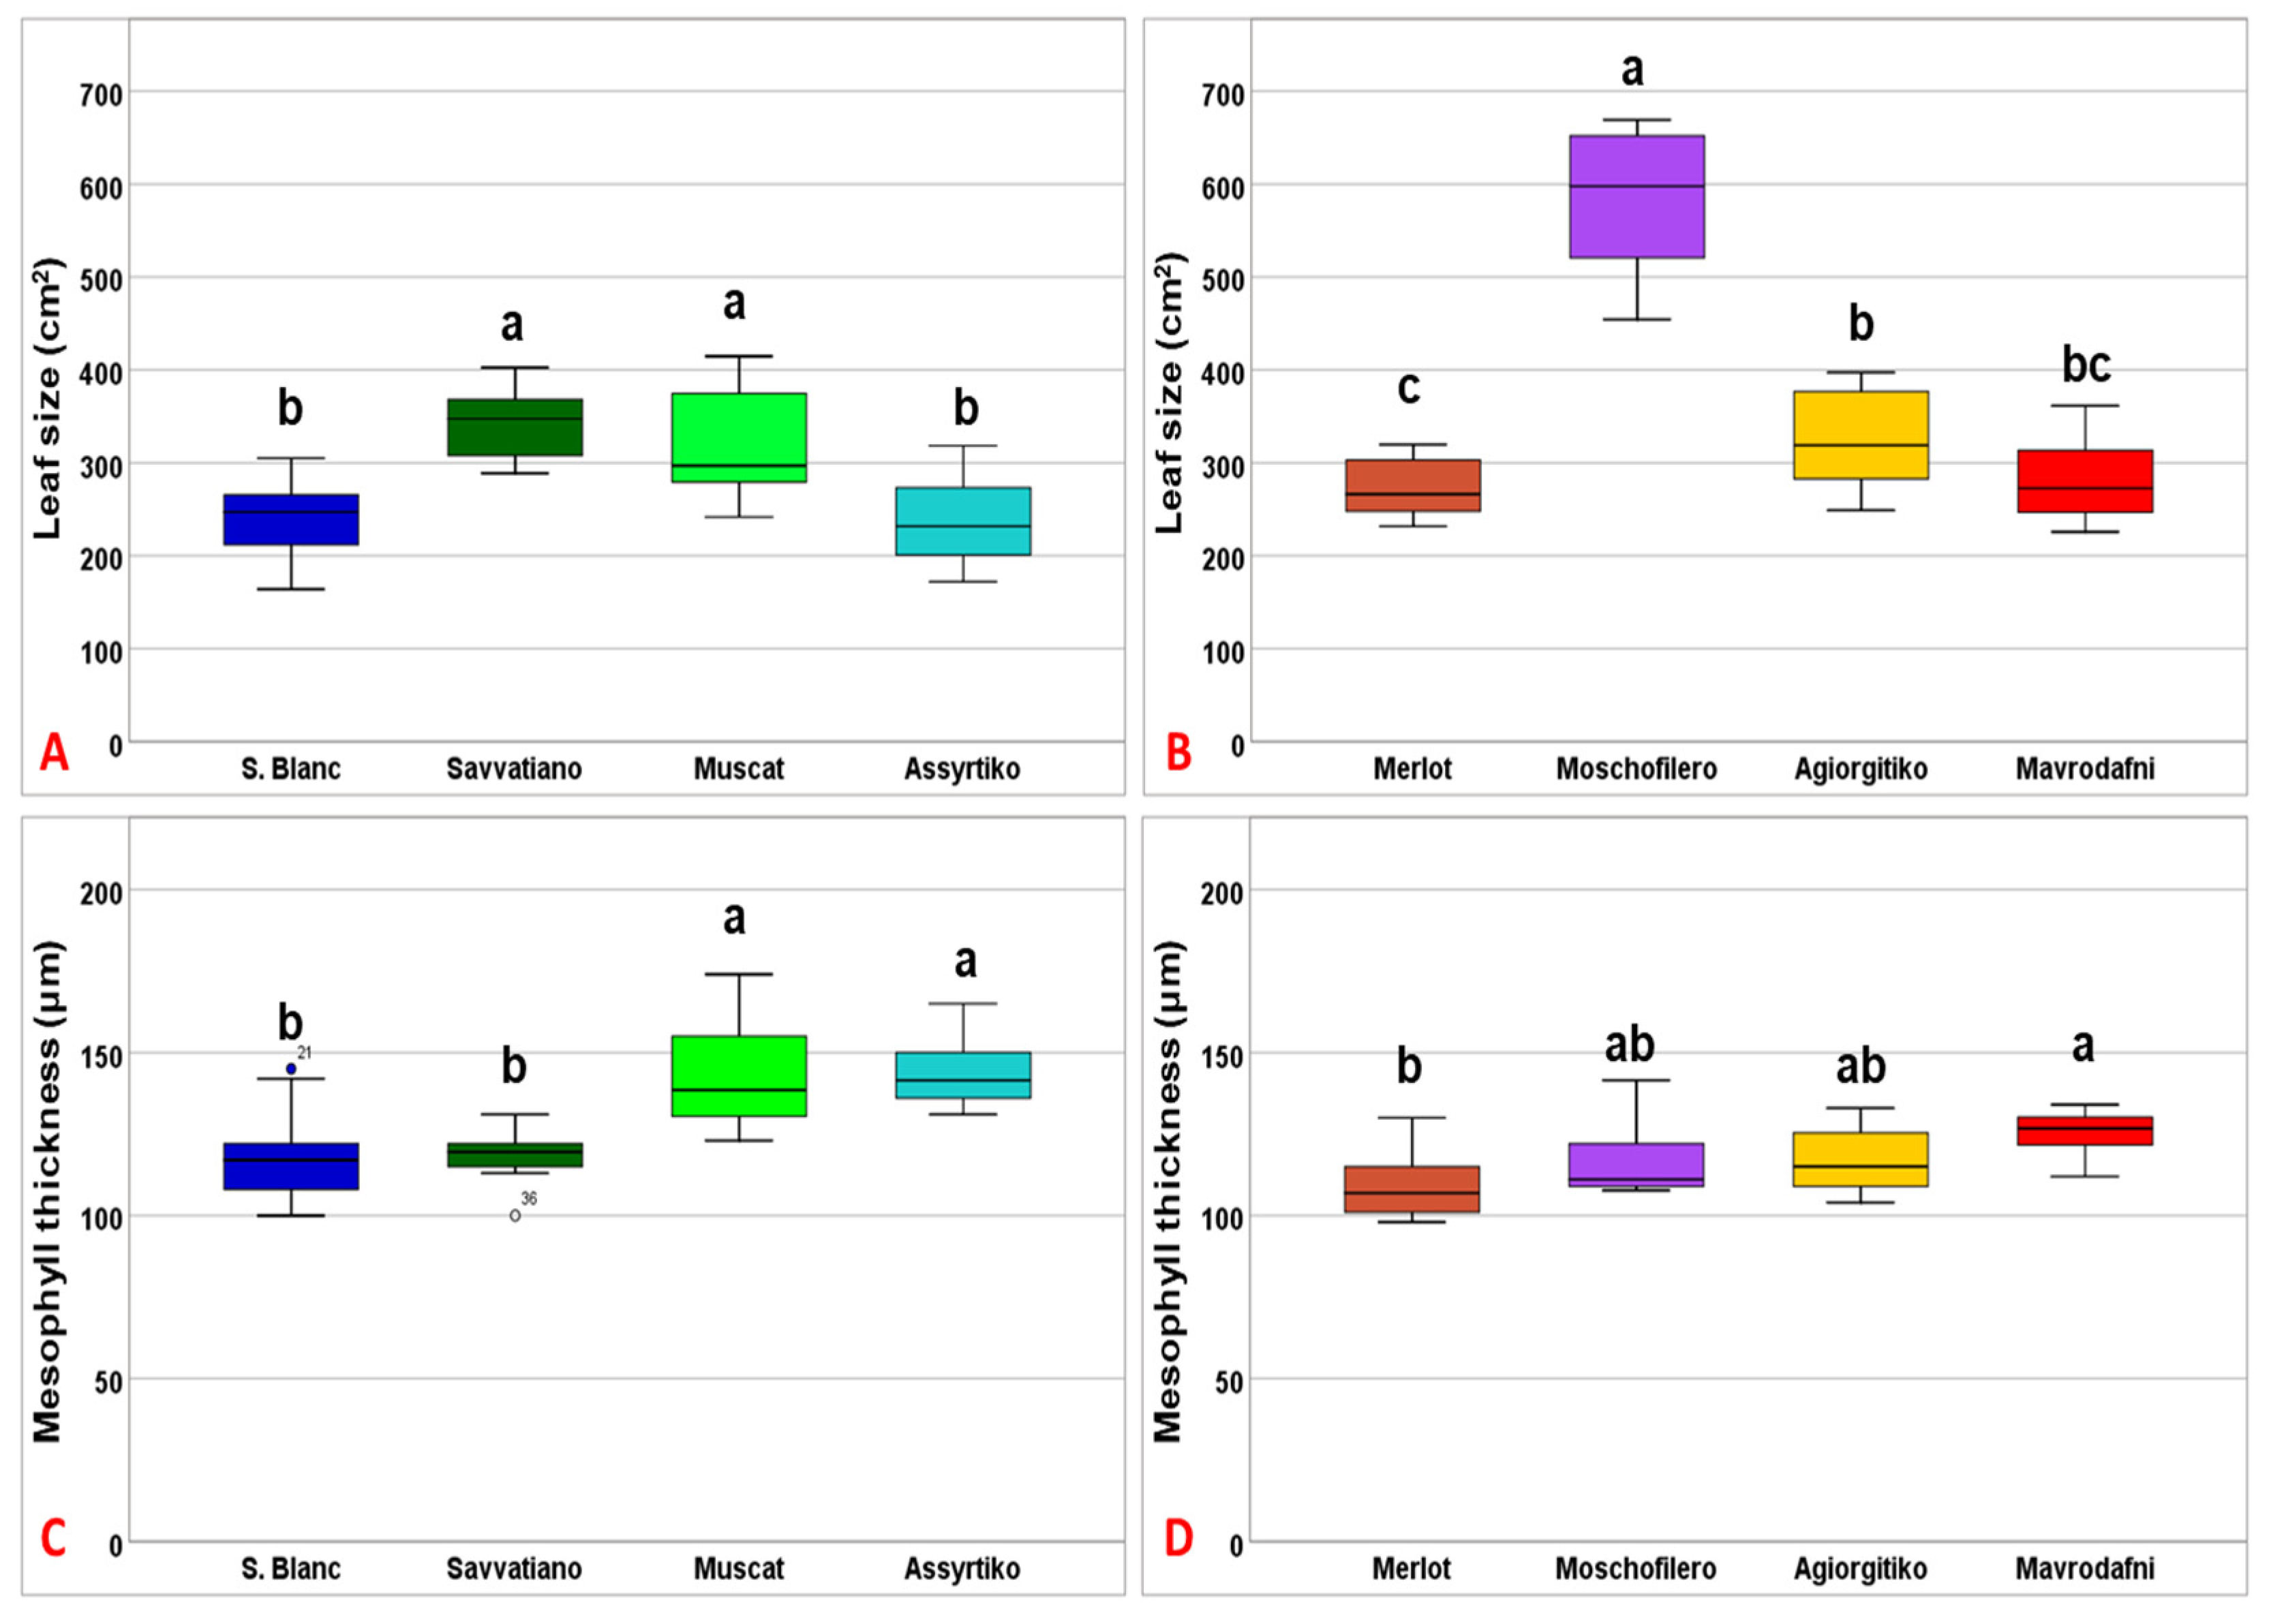
Leaf morphological analysis revealed significant differences in leaf size (p < 0.001) and mesophyll thickness (p < 0.02) among genotypes in both varietal groups. Savvatiano and Muscat displayed the largest leaves among white cultivars, whereas Sauvignon Blanc and Assyrtiko were 23.6–30.4% smaller (p < 0.001) (Figure 7A). Similarly, Assyrtiko with Muscat displayed the thickest mesophylls, whereas Sauvignon Blanc and Savvatiano had thinner mesophylls by 16.8–18.2% (p < 0.001) (Figure 7C).
In the case of red cultivars, Moschofilero displayed the largest leaf, Agiorgitiko 45% smaller, and Mavrodafni with Merlot 51.5% and 53.6% smaller, respectively (p < 0.001) (Figure 7B). Mavrodafni displayed the thickest mesophyll, Moschofilero with Agiorgitiko thinner by 6.6–7.1% and Merlot the thinnest mesophyll (Figure 7D).

4. Discussion

4.1. Photosynthetic Dynamics Under Light-Saturated Conditions and Heat Stress

Rising light leads to increased photosynthetic rates up to a threshold, known as the light saturation point (LSP), above which additional light does not lead to further increase but to a decrease in photosynthesis due to excessive light energy [41]. Light levels above LSP can induce photoinhibition by reducing the photosynthetic efficiency and damaging PSII proteins faster than they can be repaired [42]. Therefore, plants with higher LSP and light-saturated photosynthetic capacity (Asat) exhibit a greater tolerance and a better ability to sustain photosynthesis under strong light without experiencing photoinhibition [43]. Our results demonstrated a significant temperature effect on LSP, as photosynthetic saturation occurred with less light energy at 23 °C (LSP < 1200 µmol m−2 s−1), whereas at 35 °C, 19–79% higher light intensities were required to achieve Asat. Asat also increased with rising temperature up to 35 °C, suggesting a positive effect on photosynthetic efficiency. However, at 40 °C, the significant LSP and Asat reductions indicated that heat stress can enhance grapevine susceptibility to intense light and photoinhibition. Synergistic stress effects were also reported in tomato leaves [44], seagrass species [45,46], and grapevine cultivars [47], where high irradiance intensified heat stress, causing severe photoinhibition. Conversely, low light exposure mitigated heat stress impacts on grape leaves by protecting PSII from photo-oxidative damage [48,49]. Cultivars’ comparison revealed that Sauvignon Blanc exhibited high photosynthetic efficiency and strong tolerance to high light intensities. Assyrtiko demonstrated good tolerance and enhanced photosynthetic efficiency under light-heat stress, while Muscat also displayed improved light tolerance under high temperatures. Contrastingly, Savvatiano demonstrated increased light susceptibility and reduced photosynthetic efficiency above 35 °C. Mavrodafni also exhibited high photosynthetic efficiency and strong light tolerance under heat stress. Moschofilero consistently presented increased light susceptibility, whereas Agiorgitiko only above 35 °C. Merlot, finally, although more tolerant to high light intensities than Moschofilero and Agiorgitiko, was more susceptible than Mavrodafni under heat stress. Contradictory performances were also reported in other grape cultivars such as ‘Jing Hongbao’ and’ Ruidu Cuixia’, which showed better tolerance under combined light and heat stress, compared to ‘Ruidu Zaohong’, ‘Ruidu Xiangyu’, and ‘Ruidu Wuheyi’ [50].

4.2. PSII Functionality and Photoprotective Responses Under Heat Stress

The effects of heat stress and high light energy absorption on cultivars’ photosynthetic machinery were reflected in chlorophyll fluorescence parameters, which serve as sensitive indicators of heat tolerance and photoinhibition [51,52]. The Fv/Fm ratio, an indicator of photosynthetic apparatus health [53,54], decreased in most cases above 35 °C, suggesting suppression of PSII activity under heat stress [55]. Sauvignon Blanc, despite a sharper decline in Fv/Fm above 35 °C, maintained satisfactory values at 40 °C, suggesting a functional PSII under heat stress. This was associated with the effective activation of photoprotective mechanisms, such as NPQ, which enables the dissipation of excess energy as heat, thereby protecting PSII from photo-oxidative damage [56,57,58]. Assyrtiko showed minimal reductions in Fv/Fm without signs of photoinhibition even at 40 °C, suggesting a heat-tolerant PSII. This response was mainly attributed to the sufficient activation of NPQ and the consistently low values of ΦPSII and qP. QP represents the proportion of open PSII reaction centers (PSII-RCs) capable of photochemistry, while ΦPSII is the fraction of light energy converted into chemical [59]. Therefore, it was concluded that Assyrtiko adopted a photoprotective strategy involving a partial closure of PSII-RCs (low qP) to reduce the light energy supplied for photochemistry and alleviate further pressure on PSII [60]. Although this strategy sacrifices PSII photochemical efficiency (ΦPSII), it enhances excess energy dissipation (NPQ) and prevents photoinhibition. Muscat also maintained relatively stable Fv/Fm without signs of photoinhibition even at 40 °C. This PSII thermotolerance was highly attributed to the strong activation of photoprotective mechanisms at 35 °C, including high NPQ and partial closure of PSII-RCs. The same photoprotective strategy has also been reported in Vitis labrusca L. cv. Concord under light-heat stress exposure [61]. Contrastingly, Savvatiano showed significant reductions in Fv/Fm above 35 °C, indicating severe PSII photoinhibition. This heat susceptibility was associated with the inability to manage excessive energy due to insufficient activation of photoprotective mechanisms. However, the results showed no irreversible damage to PSII as Fv/Fm was maintained at 0.72, which is above the risk threshold in grapevine [62]. Mavrodafni maintained the highest Fv/Fm among the red cultivars even at 40 °C, suggesting a heat-tolerant PSII. It also exhibited high ΦPSII and low NPQ, indicating efficient management of the absorbed energy without the need for extra heat dissipation. Moschofilero, as the most susceptible to photo-oxidative stress, adopted a preventive photoprotective strategy characterized by high NPQ and low ΦPSII to avoid PSII overload. The pronounced increase in NPQ and the sharp decline in Fv/Fm above 35 °C indicated a high demand for energy dissipation and serious photoinhibition under heat stress. These results are consistent with findings in Panax notoginseng, where low-light-adapted plants prioritized the protection of photosynthetic apparatus by downregulating ΦPSII and enhancing NPQ under strong light exposure [63]. Despite its susceptibility to photo-oxidative stress, Agiorgitiko maintained PSII integrity at 40 °C through strong NPQ activation and partial closure of PSII-RCs above 35 °C. This reflects a strategy that prioritizes photoprotection over photochemical efficiency to prevent PSII overload. In contrast, Merlot, although more resistant to photo-oxidative stress, exhibited a sharp decline in Fv/Fm above 35 °C, indicative of severe PSII photoinhibition. This heat-induced suppression was attributed to its limited NPQ capacity and the higher proportion of open PSII-RCs, reflecting a strategy that prioritizes maximum ΦPSII over photoprotection. Interestingly, this observation partly contrasts with Qiu et al. [58], who reported enhanced photoprotective mechanisms in Merlot.

4.3. Chlorophyll Reduction as an Adaptive Response to Light and Heat Stress

Cultivars’ distinct energy management strategies are highly reflected in chlorophyll content (Chl), which is responsible for light absorption during photosynthesis [64,65,66]. Several studies on grapevine cultivars such as Cabernet Sauvignon, Vitis davidii cv. Junzi [67], Assyrtiko [68], Trebbiano [69], Hongti [70], Merlot, and Muscat Hamburg [58] have reported chlorophyll reduction under heat stress, the degree of which depends on the cultivar’s heat tolerance [71]. Light intensity is also correlated with chlorophyll content as strong light can damage chlorophyll, leading to reduced photosynthetic efficiency [72,73]. Our results indicate that cultivars with increased light susceptibility, such as Savvatiano, tend to maintain lower chlorophyll content under heat stress, which is associated with damage to the thylakoid membranes and PSII photoinhibition [74,75]. However, chlorophyll reduction is not necessarily associated with photo-oxidative damage. Still, it may also be part of an adaptive response for heat acclimatization, which helps manage reactive oxygen species (ROS) and maintain PSII stability [76,77]. For example, in a Syrian barley landrace, chlorophyll reduction led to reduced light absorbance, which in turn minimized the harmful heating effects of intense light. This response is considered a key mechanism contributing to heat tolerance [78]. Additionally, in perennial ryegrass, chlorophyll catabolism was proven to be critical for maintaining PSII stability during heat stress [79]. Considering the photoprotective strategy adopted by Agiorgitiko, we can assume that its chlorophyll reduction above 35 °C may also be part of a broader photoprotective response to reduce light absorption and maintain PSII stability under heat stress. In contrast, Moschofilero and Merlot, which maintained higher chlorophyll content at 40 °C, were unable to prevent excess light absorption, PSII overload, and consequent photoinhibition.

4.4. The Thermodynamic Role of Leaf Structure and Transpirational Cooling to Light and Heat Stress Management

Leaf morphological traits have also been reported to affect grapevine’s abiotic stress tolerance by regulating leaf energy balance through variations in light absorption, thermal insulation, and heat dissipation [80]. Mesophyll thickness plays an important role in heat tolerance by regulating thermal insulation. Thicker leaves are characterized by higher thermal mass, greater water storage, and reduced water loss during heat stress, contributing to increased thermal stability [81,82,83,84]. In grapevine, the Razegui and Muscat Italia cultivars exhibited thicker leaf blades and, therefore, thicker mesophyll as an adaptive response to prolonged heat stress exposure [85]. Leaf size also plays a crucial thermodynamic role via the thickness of the boundary layer, which serves as an insulator, regulating heat transfer to the environment [86]. Large leaves are characterized by a thicker boundary layer, which limits heat convection, leading to higher leaf temperatures (Tleaf) and therefore reduced stress tolerance [82,87,88]. An illustrative example is that Grenache noir leaves exhibit a smaller total surface area than Syrah, which is regarded as a cultivar-specific adaptation correlated with abiotic stress tolerance [89]. Similar findings were also reported in Fagus sylvatica [90], Pinus koraiensis [86], and 74 representative species of the eastern Australian flora [91], where small-leaved plants demonstrated an advantage under hot, highlight conditions. In contrast, large-leaved plants thrived under cool, low-light environments. Indeed, our results showed that cultivars with small, thick leaves (e.g., Assyrtiko and Mavrodafni) tend to exhibit better light-heat stress tolerance compared to those with larger, thinner leaves (e.g., Savvatiano and Moschofilero). This may explain why, at higher altitudes with more intense sunlight, plants with smaller leaves are more commonly found, as they have developed greater tolerance to high light conditions. [92,93,94]. Therefore, cultivars such as Merlot, Mavrodafni, Sauvignon Blanc, and Assyrtiko are highly recommended for cultivation at higher altitudes where solar radiation is more intense. The degree of this tolerance is highly reflected in Tleaf, which indicates the heat load experienced by the leaf, where light and heat-tolerant genotypes exhibit better thermoregulation and a lower Tleaf [95,96]. However, Tleaf depends not only on the exposed leaf area and its thermal insulation properties but also on the rate of transpiration [97,98,99,100]. Higher transpiration rates lead to more effective leaf cooling, lower Tleaf, and thereby improved heat and light stress tolerance [101,102]. All these data suggest that the increased susceptibility of Savvatiano and Agiorgitiko above 35 °C is partly attributed to their lower transpiration cooling capacity, indicating that these two cultivars follow a more conservative, water-saving strategy under heat stress. This aligns with previous findings on Savvatiano, which demonstrated an isohydric stomatal closure response at temperatures above 35 °C [103].

4.5. The Cultivar-Specific Performances Under Limited Light Conditions

Several studies have highlighted the important role of dark respiration (Rdark) and light compensation point (LCP) in determining the carbon balance at low-light conditions [104]. Shade-tolerant species typically exhibit lower Rdark and LCP values [105], enabling them to photosynthesize more than shade-susceptible species under low-light intensities [106]. Among the white cultivars, Sauvignon Blanc exhibited the most shade-susceptible performance, Assyrtiko and Muscat showed intermediate responses, whereas Savvatiano was the most shade-tolerant. Interestingly, Mavrodafni performed equally well under high and low-light conditions, showing characteristics of a versatile cultivar, capable of thriving in a wide range of environmental conditions. These cultivar-specific responses might be explained by considering that Savvatiano has been pruned and trained for centuries with a short-trunk and a cup-shaped canopy system, which could enhance the self-shading microclimatic effect. Mavrodafni, on the other hand, has historically been cultivated under a wider diversity of pruning and training systems, including both low bush forms and high-trained systems. In addition, Western Greece (the main cultivation region of Mavrodafni) is characterized by high variability in elevation and climatic heterogeneity, with frequent alternations between cloudy and sunny periods. These factors might explain the cultivar-specific responses, which might reflect an adaptation to different environmental conditions. On the contrary, Merlot did not respond well under limited light conditions, whereas Moschofilero and Agiorgitiko exhibited a more shade-tolerant behavior. These findings suggest that light-susceptible cultivars under heat stress may reduce light exposure by forming canopies that intercept a greater fraction of the total incoming radiation [107]. For example, in Syrah, differences in shoot architecture accounted for up to 25% of the variations in light interception among cultivars or trellis systems [108], whereas in Cabernet Franc, maintaining dense canopies under light-heat stress regimes improved photosynthesis [109]. Moreover, artificial shading is highly recommended for light and heat-susceptible cultivars, given reports of reduced canopy temperatures up to 7 °C, and lower incident radiation by 26–46% [110]. Shading applications in Nero d’Avola [107], Thompson Seedless [111], Sangiovese [112], Cabernet Sauvignon [5], Nebbiolo [113], and Shiraz [114] confirmed that lower light exposure leads to significant reductions in microclimate temperature, mitigating heat stress impacts. Finally, cultivars such as Moschofilero, Savvatiano, and Agiorgitiko may also be more recommended for cultivation at cooler high-latitude regions where lower light intensities prevail.

5. Conclusions

The present study revealed cultivar-specific tolerance under heat stress and different photosynthetic responses under transient light intensity changes. Muscat and Assyrtiko displayed the most heat-tolerant photosynthetic apparatus among the white cultivars, whereas Savvatiano was the most heat-susceptible cultivar due to limited photoprotection. Sauvignon Blanc exhibited heat susceptibility but maintained high PSII functionality under heat stress by sufficiently activating photoprotective mechanisms. Among the red cultivars, Mavrodafni exhibited the most heat-tolerant, and Moschofilero had the most heat-susceptible photosynthetic machinery. Agiorgitiko coped with heat stress by favoring photoprotection over photochemical efficiency, which was in contrast to Merlot, which showed severe PSII suppression under heat stress due to limited photoprotection. We also found that temperatures above 35 °C may increase the grapevine’s susceptibility to strong light, thereby intensifying photo-oxidative stress. Leaf morphological traits also contributed to heat stress tolerance, with smaller, thicker leaves supporting more effective thermoregulation. These cultivar-specific responses observed in potted plants exposed under controlled conditions and transient light intensity changes provided an initial insight into their physiological behavior. Future field experiments involving long-term exposure to different light intensities using shade nets of various densities are needed to derive conclusions for practical use. Such experiments may allow a direct assessment of the interaction between heat stress and light intensity on grapevine physiology, growth, yield, and fruit quality, thereby strengthening the practical relevance of the present results. Future objectives should also include the assessment of cultivars’ responses to water deficits, enabling a more comprehensive evaluation of stress tolerance.

Supplementary Materials

The following supporting information can be downloaded at: https://www.mdpi.com/article/10.3390/agronomy15102344/s1, Figure S1: Summarized presentation of key physiological features for two grapevine varietal groups grown under heat stress. Data were normalized using the min–max method (A,B). Comparative presentation of leaf sizes for two grapevine varietal groups. Images were calibrated using ImageJ software (C,D). A and C refer to white cultivars, while B and D to red ones (n = 4); Figure S2: Photosynthetic light response curves (LRCs) for two grapevine varietal groups exposed to 23 °C (A,B), 35 °C (C,D) and 40 °C (E,F). Data points with error bars represent mean ± standard deviation (SD). A, C and E refer to white cultivars, while B, D and F to red ones (n = 4).

Author Contributions

Conceptualization, X.V., E.B., G.B., K.B., and E.K.; methodology, X.V., G.B., and E.B.; software, X.V. and E.B.; validation, G.B. and E.K.; formal analysis, X.V. and E.B.; investigation, X.V., E.B., and G.B.; resources, K.B. and E.K.; data curation, X.V., E.B., and G.B.; writing—original draft preparation, X.V., G.B., and E.B.; writing—review and editing, X.V., E.B., and G.B.; visualization, X.V. and E.B.; supervision, E.K., K.B., and G.B.; project administration, E.K. and K.B.; funding acquisition, X.V., G.B., and E.K. All authors have read and agreed to the published version of the manuscript.

Funding

This research received no external funding.

Data Availability Statement

The original contributions presented in this study are included in the article. Further inquiries can be directed to the corresponding authors.

Acknowledgments

X.V. gratefully acknowledges ELKE, the University of West Attica, for a PhD scholarship. Many thanks to Panagiotis Skandamis for their valuable advice on the photosynthetic models used in this study.

Conflicts of Interest

The authors declare no conflicts of interest.

Abbreviations

The following abbreviations are used in this manuscript:
PSIIPhotosystem II
GsStomatal conductance
VPDVapour pressure deficit
LHCIILight-harvesting complex
PSII-RCsPSII reaction centers
LRCsLight response curves
AsatLight-saturated photosynthesis
RdarkDark respiration rate
LSPLight saturation point
LCPLight compensation point
AnNet photosynthetic rate
ɸ (I0)Quantum yield at I = 0 [μmol(CO2) μmol (photon)–1]
IPhotosynthetic photon flux density [μmol (photon) m–2 s–1]
AgmaxEstimate of the maximum gross photosynthetic rate
ToptOptimal temperature for photosynthesis
LCCLeaf chlorophyll content
SVSpad value
FsSteady-state fluorescence
Fm′Fluorescence in the light-adapted state
ΦPSIIActual quantum efficiency of PSII
FmMaximum fluorescence
FoMinimum fluorescence
Fv/FmMaximum quantum efficiency of PSII
NPQNon-photochemical quenching
qPPhotochemical quenching
Fo’Minimum chlorophyll fluorescence in light-adapted leaf
TleafLeaf temperature
EApparent transpiration
ROSReactive oxygen species.

References

  1. Todaro, V.; D’Oria, M.; Secci, D.; Zanini, A.; Tanda, M.G. Climate change over the Mediterranean region: Local temperature and precipitation variations at five pilot sites. Water 2022, 14, 2499. [Google Scholar] [CrossRef]
  2. Nastos, P.; Saaroni, H. Living in Mediterranean cities in the context of climate change: A review. Int. J. Climatol. 2024, 44, 3169–3190. [Google Scholar] [CrossRef]
  3. Venios, X.; Korkas, E.; Nisiotou, A.; Banilas, G. Grapevine responses to heat stress and global warming. Plants 2020, 9, 1754. [Google Scholar] [CrossRef] [PubMed]
  4. Dinis, L.T.; Bernardo, S.; Yang, C.; Fraga, H.; Malheiro, A.C.; Moutinho-Pereira, J.; Santos, J.A. Mediterranean viticulture in the context of climate change. Ciênc. Téc. Vitiviníc. 2022, 37, 139–158. [Google Scholar] [CrossRef]
  5. Martínez-Lüscher, J.; Chen, C.C.L.; Brillante, L.; Kurtural, S.K. Mitigating heat wave and exposure damage to “Cabernet Sauvignon” wine grape with partial shading under two irrigation amounts. Front. Plant Sci. 2020, 11, 579192. [Google Scholar] [CrossRef]
  6. Gutiérrez-Gamboa, G.; Zheng, W.; Martínez de Toda, F. Strategies in vineyard establishment to face global warming in viticulture: A mini review. J. Sci. Food Agric. 2021, 101, 1261–1269. [Google Scholar] [CrossRef]
  7. Karim, M.A.; Fracheboud, Y.; Stamp, P. Effect of high temperature on seedling growth and photosynthesis of tropical maize genotypes. J. Agron. Crop Sci. 2000, 184, 217–223. [Google Scholar] [CrossRef]
  8. Camejo, D.; Rodríguez, P.; Morales, M.A.; Dell’Amico, J.M.; Torrecillas, A.; Alarcón, J.J. High temperature effects on photosynthetic activity of two tomato cultivars with different heat susceptibility. J. Plant Physiol. 2005, 162, 281–289. [Google Scholar] [CrossRef]
  9. Berry, J.; Bjorkman, O. Photosynthetic response and adaptation to temperature in higher plants. Annu. Rev. Plant Physiol. 1980, 31, 491–543. [Google Scholar] [CrossRef]
  10. Havaux, M. Stress tolerance of photosystem II in vivo: Antagonistic effects of water, heat, and photoinhibition stresses. Plant Physiol. 1992, 100, 424–432. [Google Scholar] [CrossRef]
  11. Ghouil, H.; Montpied, P.; Epron, D.; Ksontini, M.; Hanchi, B.; Dreyer, E. Thermal optima of photosynthetic functions and thermostability of photochemistry in cork oak seedlings. Tree Physiol. 2003, 23, 1031–1039. [Google Scholar] [CrossRef] [PubMed]
  12. Song, Y.; Chen, Q.; Ci, D.; Shao, X.; Zhang, D. Effects of high temperature on photosynthesis and related gene expression in poplar. BMC Plant Biol. 2014, 14, 111. [Google Scholar] [CrossRef] [PubMed]
  13. Kadir, S. Thermostability of photosynthesis of Vitis aestivalis and V. vinifera. J. Am. Soc. Hortic. Sci. 2006, 131, 476–483. [Google Scholar] [CrossRef]
  14. Muhammad, I.; Shalmani, A.; Ali, M.; Yang, Q.H.; Ahmad, H.; Li, F.B. Mechanisms regulating the dynamics of photosynthesis under abiotic stresses. Front. Plant Sci. 2021, 11, 615942. [Google Scholar] [CrossRef]
  15. Kim, K.; Portis, A.R., Jr. Temperature dependence of photosynthesis in Arabidopsis plants with modifications in Rubisco activase and membrane fluidity. Plant Cell Physiol. 2005, 46, 522–530. [Google Scholar] [CrossRef]
  16. García-Cerdán, J.G.; Sveshnikov, D.; Dewez, D.; Jansson, S.; Funk, C.; Schröder, W.P. Antisense inhibition of the PsbX protein affects PSII integrity in the higher plant Arabidopsis thaliana. Plant Cell Physiol. 2009, 50, 191–202. [Google Scholar] [CrossRef]
  17. Martínez-Lüscher, J.; Matus, J.T.; Gomès, E.; Pascual, I. Toward understanding grapevine responses to climate change: A multi-stress and holistic approach. J. Exp. Bot. 2024, 76, 2949–2969. [Google Scholar] [CrossRef]
  18. Grossiord, C.; Buckley, T.N.; Cernusak, L.A.; Novick, K.A.; Poulter, B.; Siegwolf, R.T.; Sperry, J.S.; McDowell, N.G. Plant responses to rising vapor pressure deficit. New Phytol. 2020, 226, 1550–1566. [Google Scholar] [CrossRef]
  19. Konrad, W.; Katul, G.; Roth-Nebelsick, A. Leaf temperature and its dependence on atmospheric CO2 and leaf size. Geol. J. 2021, 56, 866–885. [Google Scholar] [CrossRef]
  20. Galat Giorgi, E.; Sadras, V.O.; Keller, M.; Perez Peña, J. Interactive effects of high temperature and water deficit on Malbec grapevines. Aust. J. Grape Wine Res. 2019, 25, 345–356. [Google Scholar] [CrossRef]
  21. Soar, C.J.; Collins, M.J.; Sadras, V.O. Irrigated Shiraz vines (Vitis vinifera) upregulate gas exchange and maintain berry growth in response to short spells of high maximum temperature in the field. Funct. Plant Biol. 2009, 36, 801–814. [Google Scholar] [CrossRef]
  22. Gerganova, M.; Popova, A.V.; Stanoeva, D.; Velitchkova, M. Tomato plants acclimate better to elevated temperature and high light than to treatment with each factor separately. Plant Physiol. Biochem. 2016, 104, 234–241. [Google Scholar] [CrossRef] [PubMed]
  23. Zhou, R.; Yu, X.; Li, X.; Dos Santos, T.M.; Rosenqvist, E.; Ottosen, C.O. Combined high light and heat stress induced complex response in tomato with better leaf cooling after heat priming. Plant Physiol. Biochem. 2020, 151, 1–9. [Google Scholar] [CrossRef] [PubMed]
  24. Fraga, H.; García de Cortázar Atauri, I.; Malheiro, A.C.; Santos, J.A. Modelling climate change impacts on viticultural yield, phenology and stress conditions in Europe. Glob. Change Biol. 2016, 22, 3774–3788. [Google Scholar] [CrossRef]
  25. Koufos, G.C.; Mavromatis, T.; Koundouras, S.; Jones, G.V. Adaptive capacity of winegrape varieties cultivated in Greece to climate change: Current trends and future projections. OENO One 2020, 54, 1201–1219. [Google Scholar] [CrossRef]
  26. Mosedale, J.R.; Abernethy, K.E.; Smart, R.E.; Wilson, R.J.; Maclean, I.M. Climate change impacts and adaptive strategies: Lessons from the grapevine. Glob. Change Biol. 2016, 22, 3814–3828. [Google Scholar] [CrossRef]
  27. Orduna, R.M. Climate change associated effects on grape and wine quality and production. Food Res. Int. 2010, 43, 1844–1855. [Google Scholar] [CrossRef]
  28. Jones, G.V.; Alves, F. Impact of climate change on wine production: A global overview and regional assessment in the Douro Valley of Portugal. Int. J. Glob. Warm. 2012, 4, 383–406. [Google Scholar] [CrossRef]
  29. Van Leeuwen, C.; Darriet, P. The impact of climate change on viticulture and wine quality. J. Wine Econ. 2016, 11, 150–167. [Google Scholar] [CrossRef]
  30. Ibañez, V.N.; Berli, F.J.; Masuelli, R.W.; Bottini, R.A.; Marfil, C.F. Influence of altitude and enhanced ultraviolet-B radiation on tuber production, seed viability, leaf pigments and morphology in the wild potato species Solanum kurtzianum Bitter & Wittm collected from an elevational gradient. Plant Sci. 2017, 261, 60–68. [Google Scholar] [CrossRef]
  31. Arias, L.A.; Berli, F.; Fontana, A.; Bottini, R.; Piccoli, P. Climate change effects on grapevine physiology and biochemistry: Benefits and challenges of high altitude as an adaptation strategy. Front. Plant Sci. 2022, 13, 835425. [Google Scholar] [CrossRef]
  32. Campbell, J.W.; Aarup, T. Photosynthetically available radiation at high latitudes. Limnol. Oceanogr. 1989, 34, 1490–1499. [Google Scholar] [CrossRef]
  33. Fu, W.; Li, P.; Wu, Y. Effects of different light intensities on chlorophyll fluorescence characteristics and yield in lettuce. Sci. Hortic. 2012, 135, 45–51. [Google Scholar] [CrossRef]
  34. Lobo, F.D.A.; De Barros, M.P.; Dalmagro, H.J.; Dalmolin, Â.C.; Pereira, W.E.; De Souza, E.C.; Vourlitis, G.L.; Rodríguez Ortíz, C.E. Fitting net photosynthetic light-response curves with Microsoft Excel—A critical look at the models. Photosynthetica 2013, 51, 445–456. [Google Scholar] [CrossRef]
  35. June, T.; Evans, J.R.; Farquhar, G.D. A simple new equation for the reversible temperature dependence of photosynthetic electron transport: A study on soybean leaf. Funct. Plant Biol. 2004, 31, 275–283. [Google Scholar] [CrossRef]
  36. Monje, O.A.; Bugbee, B. Inherent limitations of nondestructive chlorophyll meters: A comparison of two types of meters. HortScience 1992, 27, 69–71. [Google Scholar] [CrossRef]
  37. Shin, Y.K.; Bhandari, S.R.; Jo, J.S.; Song, J.W.; Cho, M.C.; Yang, E.Y.; Lee, J.G. Response to salt stress in lettuce: Changes in chlorophyll fluorescence parameters, phytochemical contents, and antioxidant activities. Agronomy 2020, 10, 1627. [Google Scholar] [CrossRef]
  38. Oxborough, K.; Baker, N.R. Resolving chlorophyll a fluorescence images of photosynthetic efficiency into photochemical and non-photochemical components–calculation of qP and Fv-/Fm-; without measuring Fo. Photosynth. Res. 1997, 54, 135–142. [Google Scholar] [CrossRef]
  39. Martin, T.N.; Fipke, G.M.; Minussi Winck, J.E.; Márchese, J.A. ImageJ software as an alternative method for estimating leaf area in oats. Acta Agron. 2020, 69, 162–169. [Google Scholar] [CrossRef]
  40. Luo, D.; Huang, G.; Zhang, Q.; Zhou, G.; Peng, S.; Li, Y. Plasticity of mesophyll cell density and cell wall thickness and composition play a pivotal role in regulating plant growth and photosynthesis under shading in rapeseed. Ann. Bot. 2023, 132, 963–978. [Google Scholar] [CrossRef]
  41. Vialet-Chabrand, S.; Matthews, J.S.; Simkin, A.J.; Raines, C.A.; Lawson, T. Importance of fluctuations in light on plant photosynthetic acclimation. Plant Physiol. 2017, 173, 2163–2179. [Google Scholar] [CrossRef] [PubMed]
  42. Zhang, J.Y.; Zhang, Q.H.; Shuang, S.P.; Cun, Z.; Wu, H.M.; Chen, J.W. The responses of light reaction of photosynthesis to dynamic sunflecks in a typically shade-tolerant species Panax notoginseng. Front. Plant Sci. 2021, 12, 718981. [Google Scholar] [CrossRef] [PubMed]
  43. Lambers, H.; Chapin, F.S., III; Pons, T.L. Plant Physiological Ecology, 2nd ed.; Springer: Heidelberg, Germany, 2008; p. 27. [Google Scholar]
  44. Wang, X.Q.; Zeng, Z.L.; Li, Y.Y.; Huang, W. Photoinhibition and photosynthetic regulation in fluctuating light under compound stresses of drought and heat. Physiol. Plant. 2024, 176, 14406. [Google Scholar] [CrossRef]
  45. Zhang, M.; Li, H.; Zhang, L.; Liu, J. Heat stress, especially when coupled with high light, accelerates the decline of tropical seagrass (Enhalus acoroides) meadows. Mar. Pollut. Bull. 2023, 192, 115043. [Google Scholar] [CrossRef]
  46. Saewong, C.; Ow, Y.X.; Nualla-Ong, A.; Buapet, P. Comparative effects of heat stress on photosynthesis and oxidative stress in Halophila ovalis and Thalassia hemprichii under different light conditions. Mar. Environ. Res. 2024, 199, 106589. [Google Scholar] [CrossRef]
  47. Sun, Y.; Gao, Y.; Wang, H.; Yang, X.; Zhai, H.; Du, Y. Stimulation of cyclic electron flow around PSI as a response to the combined stress of high light and high temperature in grape leaves. Funct. Plant Biol. 2018, 45, 1038–1045. [Google Scholar] [CrossRef]
  48. Sun, Y.; Hao, G.; Gao, Y.; Du, Y.; Yang, X.; Zhai, H. Increasing cyclic electron flow mediated by NDH is related to heat tolerance under low light in grape leaves. PeerJ 2017, 5, 3147v1. [Google Scholar]
  49. Sun, Y.; Wang, Q.; Xiao, H.; Cheng, J. Low light facilitates cyclic electron flows around PSI to assist PSII against high temperature stress. Plants 2022, 11, 3537. [Google Scholar] [CrossRef]
  50. He, Y.; Yadav, V.; Bai, S.; Wu, J.; Zhou, X.; Zhang, W.; Han, S.; Wang, M.; Zeng, B.; Wu, X.; et al. Performance evaluation of new table grape varieties under high light intensity conditions based on the photosynthetic and chlorophyll fluorescence characteristics. Horticulturae 2023, 9, 1035. [Google Scholar] [CrossRef]
  51. Sharma, D.K.; Andersen, S.B.; Ottosen, C.O.; Rosenqvist, E. Phenotyping of wheat cultivars for heat tolerance using chlorophyll a fluorescence. Funct. Plant Biol. 2012, 39, 936–947. [Google Scholar] [CrossRef]
  52. Van der Westhuizen, M.M.; Oosterhuis, D.M.; Berner, J.M.; Boogaers, N. Chlorophyll a fluorescence as an indicator of heat stress in cotton (Gossypium hirsutum L.). S. Afr. J. Plant Soil 2020, 37, 116–119. [Google Scholar] [CrossRef]
  53. Wu, Q.; Zhang, Y.; Xie, M.; Zhao, Z.; Yang, L.; Liu, J.; Hou, D. Estimation of Fv/Fm in spring wheat using UAV-Based multispectral and RGB imagery with multiple machine learning methods. Agronomy 2023, 13, 1003. [Google Scholar] [CrossRef]
  54. Beris, E.; Venios, X.; Papachristos, D.; Ponchon, M.; Kontodimas, D.; Korkas, E.; Banilas, G.; Reineke, A. Grapevine Responses to the Entomopathogenic Fungi Beauveria bassiana and Isaria fumosorosea and the Effects of Salicylic Acid on Their Virulence Against the European Grapevine Moth, Lobesia botrana. Microorganisms 2025, 13, 1630. [Google Scholar] [CrossRef] [PubMed]
  55. Percival, G.C.; Percival, C.D. Evaluation of Heat Tolerance in Foliar Tissue of Acer Genotypes. Arboric. Urban For. 2024, 50, 157–168. [Google Scholar]
  56. Goss, R.; Lepetit, B. Biodiversity of NPQ. J. Plant Physiol. 2015, 172, 13–32. [Google Scholar] [CrossRef]
  57. Nicol, L.; Nawrocki, W.J.; Croce, R. Disentangling the sites of non-photochemical quenching in vascular plants. Nat. Plants 2019, 5, 1177–1183. [Google Scholar] [CrossRef]
  58. Qiu, Q.; Sun, Y.; Guo, D.; Wang, L.; Pagay, V.; Wang, S. Heat Stress Downregulates Photosystem I Redox State on Leaf Photosynthesis in Grapevine. Agronomy 2025, 15, 948. [Google Scholar] [CrossRef]
  59. Maxwell, K.; Johnson, G.N. Chlorophyll fluorescence—A practical guide. J. Exp. Bot. 2000, 51, 659–668. [Google Scholar] [CrossRef]
  60. Demmig-Adams, B.; Adams, W.W., III; Barker, D.H.; Logan, B.A.; Bowling, D.R.; Verhoeven, A.S. Using chlorophyll fluorescence to assess the fraction of absorbed light allocated to thermal dissipation of excess excitation. Physiol. Plant. 1996, 98, 253–264. [Google Scholar] [CrossRef]
  61. Chen, L.S.; Cheng, L. Both xanthophyll cycle-dependent thermal dissipation and the antioxidant system are up-regulated in grape (Vitis labrusca L. cv. Concord) leaves in response to N limitation. J. Exp. Bot. 2003, 54, 2165–2175. [Google Scholar] [CrossRef]
  62. Aazami, M.A.; Asghari-Aruq, M.; Hassanpouraghdam, M.B.; Ercisli, S.; Baron, M.; Sochor, J. Low temperature stress mediates the antioxidants pool and chlorophyll fluorescence in Vitis vinifera L. cultivars. Plants 2021, 10, 1877. [Google Scholar] [CrossRef]
  63. Chen, J.W.; Kuang, S.B.; Long, G.Q.; Yang, S.C.; Meng, Z.G.; Li, L.G.; Chen, Z.J.; Zhang, G.H. Photosynthesis, light energy partitioning, and photoprotection in the shade-demanding species Panax notoginseng under high and low level of growth irradiance. Funct. Plant Biol. 2016, 43, 479–491. [Google Scholar] [CrossRef]
  64. Singsaas, E.L.; Ort, D.R.; Delucia, E.H. Elevated CO2 effects on mesophyll conductance and its consequences for interpreting photosynthetic physiology. Plant Cell Environ. 2004, 27, 41–50. [Google Scholar] [CrossRef]
  65. Croft, H.; Chen, J.M.; Luo, X.; Bartlett, P.; Chen, B.; Staebler, R.M. Leaf chlorophyll content as a proxy for leaf photosynthetic capacity. Glob. Change Biol. 2017, 23, 3513–3524. [Google Scholar] [CrossRef] [PubMed]
  66. Li, Y.; He, N.; Hou, J.; Xu, L.; Liu, C.; Zhang, J.; Wang, Q.; Zhang, X.; Wu, X. Factors influencing leaf chlorophyll content in natural forests at the biome scale. Front. Ecol. Evol. 2018, 6, 64. [Google Scholar] [CrossRef]
  67. Liu, M.; Fang, Y.L. Effects of heat stress on physiological indexes and ultrastructure of grapevines. Sci. Agric. Sin. 2020, 53, 1444–1458. [Google Scholar]
  68. Kolyva, F.; Rhizopoulou, S.; Meletiou-Christou, M.S.; Stratakis, E. Physiological characteristics of expanding and expanded leaves of Vitis vinifera L. cv. Assyrtiko in climate change conditions. Biol. Life Sci. Forum 2020, 4, 55. [Google Scholar] [CrossRef]
  69. Ferrini, F.; Mattii, G.B.; Nicese, F.P. Effect of temperature on key physiological responses of grapevine leaf. Am. J. Enol. Vitic. 1995, 46, 375–379. [Google Scholar] [CrossRef]
  70. Xiao, F.; Yang, Z.Q.; Lee, K.W. Photosynthetic and physiological responses to high temperature in grapevine (Vitis vinifera L.) leaves during the seedling stage. J. Hortic. Sci. Biotechnol. 2017, 92, 2–10. [Google Scholar] [CrossRef]
  71. Yuan, L.; Yuan, Y.; Liu, S.; Wang, J.; Zhu, S.; Chen, G.; Hou, J.; Wang, C. Influence of high temperature on photosynthesis, antioxidative capacity of chloroplast, and carbon assimilation among heat-tolerant and heat-susceptible genotypes of nonheading Chinese cabbage. HortScience 2017, 52, 1464–1470. [Google Scholar] [CrossRef]
  72. Gonçalves, J.F.D.C.; Barreto, D.C.D.S.; Santos Junior, U.M.D.; Fernandes, A.V.; Sampaio, P.D.T.B.; Buckeridge, M.S. Growth, photosynthesis and stress indicators in young rosewood plants (Aniba rosaeodora Ducke) under different light intensities. Braz. J. Plant Physiol. 2005, 17, 325–334. [Google Scholar] [CrossRef]
  73. Ma, Z.; Li, S.; Zhang, M.; Jiang, S.; Xiao, Y. Light intensity affects growth, photosynthetic capability, and total flavonoid accumulation of Anoectochilus plants. HortScience 2010, 45, 863–867. [Google Scholar] [CrossRef]
  74. Yamamoto, Y.; Shen, J.; Takahashi, Y. Unraveling the molecular dynamics of thylakoids under light stress. Plant Cell Physiol. 2014, 55, 1203–1205. [Google Scholar] [CrossRef]
  75. Kirchhoff, H. Structural changes of the thylakoid membrane network induced by high light stress in plant chloroplasts. Philos. Trans. R. Soc. B 2014, 369, 20130225. [Google Scholar] [CrossRef] [PubMed]
  76. Wang, Q.L.; Chen, J.H.; He, N.Y.; Guo, F.Q. Metabolic reprogramming in chloroplasts under heat stress in plants. Int. J. Mol. Sci. 2018, 19, 849. [Google Scholar] [CrossRef] [PubMed]
  77. Hu, S.; Ding, Y.; Zhu, C. Sensitivity and responses of chloroplasts to heat stress in plants. Front. Plant Sci. 2020, 11, 375. [Google Scholar] [CrossRef] [PubMed]
  78. Havaux, M.; Tardy, F. Loss of chlorophyll with limited reduction of photosynthesis as an adaptive response of Syrian barley landraces to high-light and heat stress. Funct. Plant Biol. 1999, 26, 569–578. [Google Scholar] [CrossRef]
  79. Zhang, J.; Li, H.; Huang, X.; Xing, J.; Yao, J.; Yin, T.; Jiang, J.; Wang, P.; Xu, B. STAYGREEN-mediated chlorophyll a catabolism is critical for photosystem stability during heat-induced leaf senescence in perennial ryegrass. Plant Cell Environ. 2022, 45, 1412–1427. [Google Scholar] [CrossRef]
  80. MacMillan, P.; Teixeira, G.; Lopes, C.M.; Monteiro, A. The role of grapevine leaf morphoanatomical traits in determining capacity for coping with abiotic stresses: A review. Ciênc. Téc. Vitiviníc. 2021, 36, 75–88. [Google Scholar] [CrossRef]
  81. Yuan, L.; Tang, L.; Zhu, S.; Hou, J.; Chen, G.; Liu, F.; Liu, S.; Wang, C. Influence of heat stress on leaf morphology and nitrogen–carbohydrate metabolisms in two wucai (Brassica campestris L.) genotypes. Acta Soc. Bot. Pol. 2017, 86, 3554. [Google Scholar] [CrossRef]
  82. Tserej, O.; Feeley, K.J. Variation in leaf temperatures of tropical and subtropical trees are related to leaf thermoregulatory traits and not geographic distributions. Biotropica 2021, 53, 868–878. [Google Scholar] [CrossRef]
  83. Slot, M.; Cala, D.; Aranda, J.; Virgo, A.; Michaletz, S.T.; Winter, K. Leaf heat tolerance of 147 tropical forest species varies with elevation and leaf functional traits, but not with phylogeny. Plant Cell Environ. 2021, 44, 2414–2427. [Google Scholar] [CrossRef]
  84. Tang, S.; Lin, X.; Li, W.; Guo, C.; Han, J.; Yu, L. Nutrient resorption responses of female and male Populus cathayana to drought and shade stress. Physiol. Plant. 2023, 175, 13980. [Google Scholar] [CrossRef] [PubMed]
  85. Salem-Fnayou, A.B.; Bouamama, B.; Ghorbel, A.; Mliki, A. Investigations on the leaf anatomy and ultrastructure of grapevine (Vitis vinifera) under heat stress. Microsc. Res. Tech. 2011, 74, 756–762. [Google Scholar] [CrossRef] [PubMed]
  86. Wang, C.; He, J.; Zhao, T.H.; Cao, Y.; Wang, G.; Sun, B.; Yan, X.; Guo, W.; Li, M.H. The smaller the leaf is, the faster the leaf water loses in a temperate forest. Front. Plant Sci. 2019, 10, 58. [Google Scholar] [CrossRef]
  87. Leigh, A.; Sevanto, S.; Close, J.D.; Nicotra, A.B. The influence of leaf size and shape on leaf thermal dynamics: Does theory hold up under natural conditions? Plant Cell Environ. 2017, 40, 237–248. [Google Scholar] [CrossRef]
  88. Lusk, C.H.; Grierson, E.R.; Laughlin, D.C. Large leaves in warm, moist environments confer an advantage in seedling light interception efficiency. New Phytol. 2019, 223, 1319–1327. [Google Scholar] [CrossRef]
  89. Gago, P.; Conejero, G.; Martínez, M.C.; This, P.; Verdeil, J.L. Comparative anatomy and morphology of the leaves of grenache noir and syrah grapevine cultivars. S. Afr. J. Enol. Vitic. 2019, 40, 132–140. [Google Scholar] [CrossRef]
  90. Meier, I.C.; Leuschner, C. Leaf size and leaf area index in Fagus sylvatica forests: Competing effects of precipitation, temperature, and nitrogen availability. Ecosystems 2008, 11, 655–669. [Google Scholar] [CrossRef]
  91. Tozer, W.C.; Rice, B.; Westoby, M. Evolutionary divergence of leaf width and its correlates. Am. J. Bot. 2015, 102, 367–378. [Google Scholar] [CrossRef]
  92. Wright, I.J.; Dong, N.; Maire, V.; Prentice, I.C.; Westoby, M.; Díaz, S.; Gallagher, R.V.; Jacobs, B.F.; Kooyman, R.; Law, E.A.; et al. Global climatic drivers of leaf size. Science 2017, 357, 917–921. [Google Scholar] [CrossRef] [PubMed]
  93. Liu, W.; Zheng, L.; Qi, D. Variation in leaf traits at different altitudes reflects the adaptive strategy of plants to environmental changes. Ecol. Evol. 2020, 10, 8166–8175. [Google Scholar] [CrossRef] [PubMed]
  94. Ke, X.; Kang, H.; Tang, Y. Reduction in leaf size at higher altitudes across 39 broad-leaved herbaceous species on the northeastern Qinghai-Tibetan Plateau. J. Plant Ecol. 2022, 15, 1227–1240. [Google Scholar] [CrossRef]
  95. Deva, C.R.; Urban, M.O.; Challinor, A.J.; Falloon, P.; Svitákova, L. Enhanced leaf cooling is a pathway to heat tolerance in common bean. Front. Plant Sci. 2020, 11, 19. [Google Scholar] [CrossRef]
  96. Guo, J.J.; Gong, X.W.; Hao, G.Y. Leaf Transpirational Cooling and Thermal Tolerance Vary Along the Spectrum of Iso-Anisohydric Stomatal Regulation in Sand-Fixing Shrubs. Plant Cell Environ. 2025, 48, 2053–2066. [Google Scholar] [CrossRef]
  97. Michaletz, S.T.; Weiser, M.D.; McDowell, N.G.; Zhou, J.; Kaspari, M.; Helliker, B.R.; Enquist, B.J. The energetic and carbon economic origins of leaf thermoregulation. Nat. Plants 2016, 2, 16129. [Google Scholar] [CrossRef]
  98. Monteiro, M.V.; Blanuša, T.; Verhoef, A.; Hadley, P.; Cameron, R.W. Relative importance of transpiration rate and leaf morphological traits for the regulation of leaf temperature. Aust. J. Bot. 2016, 64, 32–44. [Google Scholar] [CrossRef]
  99. Lin, H.; Chen, Y.; Zhang, H.; Fu, P.; Fan, Z. Stronger cooling effects of transpiration and leaf physical traits of plants from a hot dry habitat than from a hot wet habitat. Funct. Ecol. 2017, 31, 2202–2211. [Google Scholar] [CrossRef]
  100. Millan, M.; Simonneau, T.; Coupe-Ledru, A.; Boulord, R.; Christophe, A.; Pallas, B. Relationships between leaf temperature, stomatal conductance and architecture: Potential impact on leaf burning among a range of genotypes in grapevine. OENO One 2023, 57, 345–359. [Google Scholar] [CrossRef]
  101. Porch, T.G.; Hall, A.E. Heat tolerance. In Genomics and Breeding for Climate-Resilient Crops; Kole, C., Ed.; Springer: Berlin/Heidelberg, Germany, 2013; Volume 2, pp. 167–202. [Google Scholar]
  102. Kibler, C.L.; Trugman, A.T.; Roberts, D.A.; Still, C.J.; Scott, R.L.; Caylor, K.K.; Stella, J.C.; Singer, M.B. Evapotranspiration regulates leaf temperature and respiration in dryland vegetation. Agric. For. Meteorol. 2023, 339, 109560. [Google Scholar] [CrossRef]
  103. Venios, X.; Banilas, G.; Beris, E.; Biniari, K.; Korkas, E. Physiological Efficiency and Adaptability of Greek Indigenous Grapevine Cultivars Under Heat Stress and Elevated CO2: Insights into Photosynthetic Dynamics. Plants 2025, 14, 2518. [Google Scholar] [CrossRef] [PubMed]
  104. Zhou, J.; Li, P.; Wang, J. Effects of light intensity and temperature on the photosynthesis characteristics and yield of lettuce. Horticulturae 2022, 8, 178. [Google Scholar] [CrossRef]
  105. Zhang, J.; Ge, J.; Dayananda, B.; Li, J. Effect of light intensities on the photosynthesis, growth and physiological performances of two maple species. Front. Plant Sci. 2022, 13, 999026. [Google Scholar] [CrossRef] [PubMed]
  106. Craine, J.M.; Reich, P.B. Leaf-level light compensation points in shade-tolerant woody seedlings. New Phytol. 2005, 166, 710–713. [Google Scholar] [CrossRef]
  107. Miccichè, D.; De Rosas, M.I.; Ferro, M.V.; Di Lorenzo, R.; Puccio, S.; Pisciotta, A. Effects of artificial canopy shading on vegetative growth and ripening processes of cv. Nero d’Avola (Vitis vinifera L.). Front. Plant Sci. 2023, 14, 1210574. [Google Scholar] [CrossRef]
  108. Louarn, G.; Dauzat, J.; Lecoeur, J.; Lebon, E. Influence of trellis system and shoot positioning on light interception and distribution in two grapevine cultivars with different architectures: An original approach based on 3D canopy modelling. Aust. J. Grape Wine Res. 2008, 14, 143–152. [Google Scholar] [CrossRef]
  109. Faralli, M.; Zanzotti, R.; Bertamini, M. Maintaining canopy density under summer stress conditions retains PSII efficiency and modulates must quality in Cabernet franc. Horticulturae 2022, 8, 679. [Google Scholar] [CrossRef]
  110. Gutiérrez-Gamboa, G.; Villalobos-Soublett, E.; Garrido-Salinas, M.; Verdugo-Vásquez, N. Monofilament shading nets improved water use efficiency on high-temperature days in grapevines subjected to hyperarid conditions. Horticulturae 2024, 10, 176. [Google Scholar] [CrossRef]
  111. Kliewer, W.M.; Lider, L.A. Influence of cluster exposure to the sun on the composition of Thompson Seedless fruit. Am. J. Enol. Vitic. 1968, 19, 175–184. [Google Scholar] [CrossRef]
  112. Cartechini, A.; Palliotti, A. Effect of shading on vine morphology and productivity and leaf gas exchange characteristics in grapevines in the field. Am. J. Enol. Vitic. 1995, 46, 227–234. [Google Scholar] [CrossRef]
  113. Chorti, E.; Guidoni, S.; Ferrandino, A.; Novello, V. Effect of different cluster sunlight exposure levels on ripening and anthocyanin accumulation in Nebbiolo grapes. Am. J. Enol. Vitic. 2010, 61, 23–30. [Google Scholar] [CrossRef]
  114. Caravia, L.; Collins, C.; Petrie, P.R.; Tyerman, S.D. Application of shade treatments during Shiraz berry ripening to reduce the impact of high temperature. Aust. J. Grape Wine Res. 2016, 22, 422–437. [Google Scholar] [CrossRef]
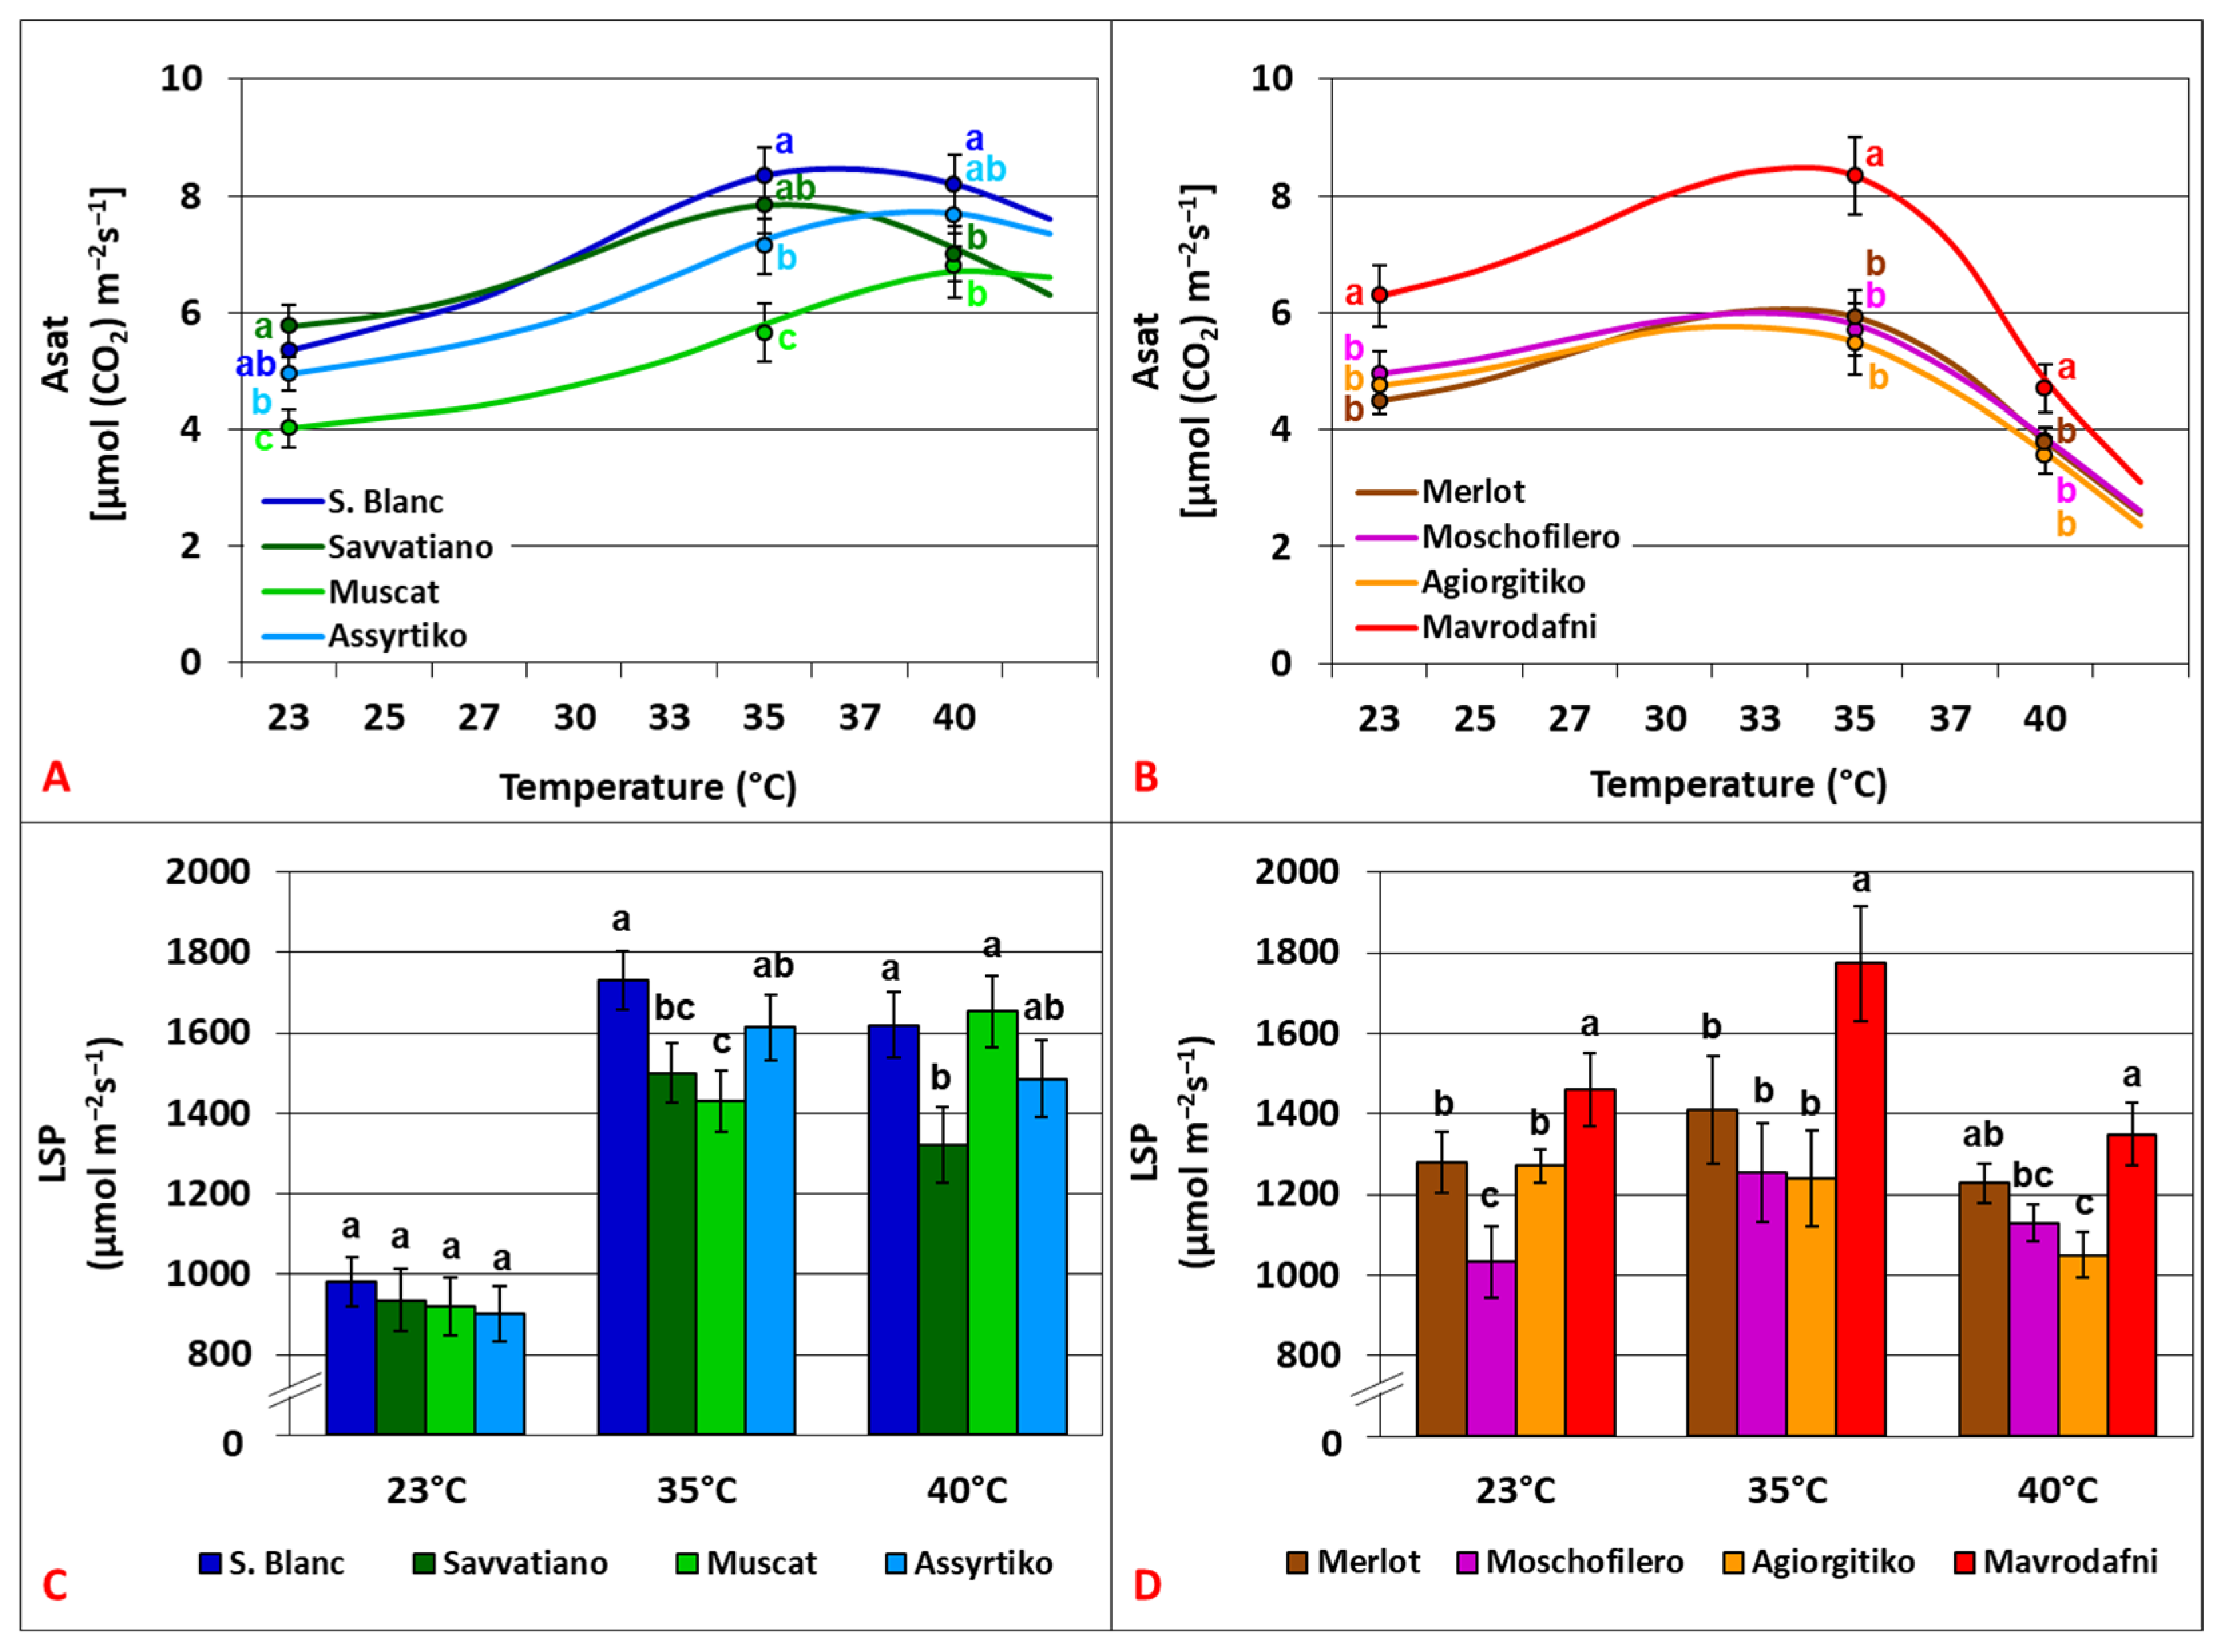
Figure 1. Temperature responses of light-saturated photosynthesis (Asat) (A,B) and light saturation point (LSP) (C,D) in two grapevine varietal groups. Data points with error bars represent mean ± standard deviation (SD). Different lowercase letters denote statistically significant differences between cultivars (p < 0.05). (A,C) refer to white cultivars, while (B,D) to red ones (n = 4).
Agronomy 15 02344 g001
Figure 2. Temperature responses of dark respiration rate (Rdark) (A,B) and light compensation point (LCP) (C,D) in two grapevine varietal groups. Data points with error bars represent mean ± standard deviation (SD). Different lowercase letters denote statistically significant differences between cultivars (p < 0.05). (A,C) refer to white cultivars, while (B,D) to red ones (n = 4).
Agronomy 15 02344 g002
Figure 3. Temperature responses of maximum efficiency of PSII (Fv/Fm) (A,B) and effective efficiency of PSII (ΦPSII) (C,D) in two grapevine varietal groups. Data points with error bars represent mean ± standard deviation (SD). Different lowercase letters denote statistically significant differences between cultivars (p < 0.05). (A,C) refer to white cultivars, while (B,D) to red ones (n = 4).
Agronomy 15 02344 g003
Figure 4. Temperature responses of non-photochemical quenching (NPQ) (A,B) and photochemical quenching (qP) (C,D) in two grapevine varietal groups. Data points with error bars represent mean ± standard deviation (SD). Different lowercase letters denote statistically significant differences between cultivars (p < 0.05). (A,C) and refer to white cultivars, while (B,D) to red ones (n = 4).
Agronomy 15 02344 g004
Figure 5. Box plots presenting the median values of chlorophyll content with upper and lower quartiles. The whiskers represent the range of the variabilities outside the quartiles, and the outliers are plotted as individual points. Different lowercase letters denote statistically significant differences between cultivars (p < 0.05). (A) refers to white cultivars, while (B) refers to red ones (n = 4).
Agronomy 15 02344 g005
Figure 6. Temperature dependence of transpiration rate (A,B) and leaf temperature (Tleaf) (C,D) in two grapevine varietal groups. Data points with error bars represent mean ± standard deviation (SD). Different lowercase letters denote statistically significant differences between cultivars (p < 0.05). (A,C) and refer to white cultivars, while (B,D) to red ones (n = 4).
Agronomy 15 02344 g006
Figure 7. Box plots presenting the median values of leaf size (A,B) and mesophyll thickness (C,D) with upper and lower quartiles. The whiskers represent the range of the variabilities outside the quartiles, and the outliers are plotted as individual points. Different lowercase letters denote statistically significant differences between cultivars (p < 0.05). (A,C) and refer to white cultivars, while (B,D) to red ones (n = 4).
Agronomy 15 02344 g007
Disclaimer/Publisher’s Note: The statements, opinions and data contained in all publications are solely those of the individual author(s) and contributor(s) and not of MDPI and/or the editor(s). MDPI and/or the editor(s) disclaim responsibility for any injury to people or property resulting from any ideas, methods, instructions or products referred to in the content.