Article

Effect of Processing Solid Organic Municipal Wastes on Their Phosphorus Fertilizer Value

1
Section Plant Nutrition and Fertilization, Albrecht Daniel Thaer-Institute for Agricultural and Horticultural Science, Humboldt-Universität zu Berlin, Albrecht-Thaer Weg 4, 14195 Berlin, Germany
2
Department of Agrochemistry and Plant Protection, Institute of Agrobiotechnology and Food Security, Samarkand State University named after Sharof Rashidov, University Boulevard 15, Samarkand 140104, Uzbekistan
3
Julius Kühn Institute (JKI), Institute for Strategies and Technology Assessment, Stahnsdorfer Damm 81, 14532 Kleinmachnow, Germany
*
Authors to whom correspondence should be addressed.
Agronomy 2025, 15(10), 2296; https://doi.org/10.3390/agronomy15102296
Submission received: 13 August 2025 / Revised: 23 September 2025 / Accepted: 26 September 2025 / Published: 28 September 2025

Abstract

In the circular economy framework, municipal wastes are seen as secondary raw materials that can be used to fertilize agricultural soils. This study assessed the effect of different biowaste and green waste treatment schemes on P fertilizer value to learn about the optimal valorization of these feedstocks. The wastes were used either fresh, after composting or anaerobic digestion, or as biochars produced at various pyrolysis conditions. The fertilizer value was determined from the change in soil concentration of plant-available P (PCAL) in incubation experiments with different soils and the temporal dynamics of fertilizer-induced growth and P accumulation of ryegrass in a pot experiment with eight harvests. The mode of waste treatment significantly influenced the P fertilizer value in the incubation and in the pot experiment. In the incubation experiment, the amendment-induced PCAL increase varied between 22% and 33% of applied P on low-P acidic soil and between 55% and 88% of applied P on high-P acidic soil, whereby the amendment effects were mainly determined by their effects on soil pH. In the pot experiment with low-P acidic soil, the apparent P recovery in the plant biomass (APR) varied between 2% of applied P for fresh green waste and 42% for fluid digestate. The amendment effects on APR were not related to soil pH but to the PCAL supply with the amendments and amendment effects on soil P supply. Our data show great potential for increasing the P fertilizer value of organic municipal waste materials through appropriate processing prior to application.

1. Introduction

Phosphorus (P) is a macro-nutrient for plants that is needed in large amounts for agricultural plant production [1]. In the long term, the P withdrawn from agricultural soils through harvested products must be replaced by P fertilizers to sustain crop yields and to avoid a decline in soil fertility. Mineral P fertilizers are derived from phosphate rock [2]. Phosphate rock is a finite resource [3,4] which has been added to the list of critical raw materials of the European Union [5]. By far the most important use of phosphate rock is fertilizer. Therefore, it has been suggested to replace first-generation P fertilizers derived from phosphate rock with second-generation P fertilizers recovered from wastes [6,7,8].
Wastes with high potential for P recycling and recovery include livestock manures, wastes from food processing industries, domestic wastewater, and urban organic wastes [6,8,9]. It is estimated that more than two billion tonnes of municipal waste are generated globally per year, whereby more than 50% of this waste is food and garden waste [10,11]. The P recycling through use of wastes is associated with several problems, including contamination with potentially toxic mineral elements and persistent organic compounds, microplastics, antibiotic resistance genes and pathogens [12,13]. In addition, the P concentration in most waste materials is much lower than in mineral fertilizers, which makes transport, storage, and application more expensive. Another problem is the difference in the stochiometric nutrient ratios between the waste-derived fertilizers and the harvest products [14]. Some of the obstacles to using waste materials to fertilize agricultural land can be overcome by appropriate treatment prior to application.
The organic waste treatment technologies can be grouped into four categories: direct land application, biological treatment, e.g., through composting or anaerobic digestion, thermo-chemical treatment, e.g., through pyrolysis and physico-chemical treatment [15]. Composting and anaerobic digestion have been the most commonly used methods for treating biowaste and green waste [12,14,16]. In recent decades, the pyrolysis of waste materials for the production of biochar has increasingly become the focus of scientific research [17,18,19,20]. The properties of biochar and its effects on soil and plants largely depend on feedstock and pyrolysis conditions [21].
Mineral P fertilizers, such as triple superphosphate, add mainly phosphate to the soil and are used for direct P nutrition of the plants. The organic P fertilizers contain all the mineral nutrients required by the plants and additionally provide the soil with organic carbon. It is well documented that organic amendments can improve physical, chemical and biological soil characteristics that are relevant for soil fertility [22]. This has been shown for composts [23,24,25,26], digestates [27] and biochars [28,29,30]. Furthermore, organic soil amendments can support the remediation of polluted soils [31,32,33]. Biochars can reduce the emission of nitrous oxide from soil and nutrient leaching [34,35].
The acceptance of waste-derived fertilizers for agriculture depends largely on their direct effect on the mineral nutrition of plants and their ability to replace mineral fertilizers. Methods for the quantification of the fertilizer value of P recycling fertilizers can roughly be divided into “extraction methods” and “growth methods” or “bioassays”. In the former, the fertilizer value is assessed by measuring P solubility in different chemical extractants or P accumulation in artificial sinks that mimic plant roots. In the latter, the fertilizer value is assessed by the plant performance, e.g., growth or P uptake [36,37,38]. These methods usually compare the effect of the fertilized and unfertilized variants and indicate the effect, e.g., as the fertilizer-induced change in soil P, which is soluble in a specific extraction agent, or P accumulation in plants. The fertilizing effect of organic fertilizer is often compared to that of mineral fertilizer commonly used in agricultural practice and expressed as relative agronomic efficiency or mineral fertilizer equivalent [39,40]. There are many studies in which the P fertilizer value was determined for composts [37,41,42], digestates [43,44] and biochars [45,46,47]. The availability of P is dependent on soil pH [48] which, in turn, can be influenced by the organic soil amendments [25,33,49]. However, there is a lack of studies that examine how different treatment methods for a specific waste material affect its P fertilizer value.
The overall objective of this study was to contribute to an improved use of municipal organic waste materials for fertilization purposes. This study investigated how different treatments of organic municipal waste before application to the soil affect its P fertilizer value. The waste treatments included composting, anaerobic digestion and pyrolysis at different temperatures. In an incubation experiment with three soils, we addressed the questions: (1) How does the mode of treatment of green waste (GW) influence the soil concentration of plant available P? (2) Is the treatment effect only due to the treatment effect on the amendment-induced modification of the soil pH? In a pot experiment with ryegrass, we addressed the question: (3) How does the mode of treatment of GW and biowaste (BW) influence various indicators of fertilizer efficiency, including growth rate, P uptake rate and mineral fertilizer equivalent? The pot experiment was conducted over 231 days, and the plants were harvested eight times to capture the residual effects of the single fertilizer application at the start of the experiment.

2. Materials and Methods

2.1. Soils

Three soils were used in this study: (i) low-P acidic soil (sandy loam from a meadow at Hanhofen, Germany, provided as Standard soil 2.2 by LUFA Speyer, Speyer, Germany); (ii) high-P acidic soil (sandy loam from an arable field at Dahlem Experimental Station, Berlin, Germany); and (iii) high-P neutral soil (silty clay from an arable field near Samarkand, Uzbekistan 39°43′41.8″ N 67°10′04.0″ E). All soils were collected from the 0–0.2 m layer, mixed thoroughly, air dried and sieved (<2 mm). The P concentrations and pH markedly differed among the three soils (Table 1).

2.2. Organic Soil Amendments Derived from Municipal Waste

The organic soil amendments were derived from biowaste and from green waste (Table 2). The fresh and composted biowaste, as well as the solid and fluid fermentation residues from biogas production from biowaste stemmed from a waste treatment plant in Berlin (BSR, Ruhleben). The biowaste consisted of food waste and garden waste, mainly senescent leaves and twigs. Visible plastic materials were removed from the biowaste. The fresh and composted green waste stemmed from a composting facility near Berlin (GALAFA, Falkensee). The green waste contained green grass clippings and senescent tree leaves (25–30% of fresh mass), twigs (15–20%), and shredded log wood (50–55%). For the production of biochars, the biowaste and green waste were pyrolyzed at 350 °C (P350) or 450 °C (P450) for 0.5 h under 3 L min−1 N2 flow rate in a continuous screw reactor. Aliquots of the biochars produced at 450 °C were transferred to a semi-batch reactor and further pyrolyzed at 700 °C for 2 h under 10 L min−1 flow rate of N2 (P700) or a flow rate of 6 L min−1 of N2 + 2 L min−1 H2O + 2 L min−1 CO2 (P700a). Further details for the treatment of the municipal wastes and the chemical characteristics of the derived amendments are given in [33] and Table S1.

2.3. Experimental Procedure

The P fertilization effect of the organic amendments was tested in an incubation experiment without plants and a pot experiment with ryegrass (Figure S1).

2.3.1. Incubation Experiment

The incubation experiment included all three soils (Table 1). The soils were incubated either without amendment (control) or after mixing with 50 mg Ptotal (kg dry soil)−1 in the form of triple super phosphate (TSP), fresh GW, composted GW, or biochars from GW produced under four different pyrolysis conditions (P350, P450, P700, P700a). On day 0, 120 g of dry soil/amendment mixture was weighed into plastic cups with a volume of 120 cm3. The soil water content was adjusted to 70% of the maximum water-holding capacity of the unamended soil with demineralized water. The plastic cups were placed in a climate chamber at 20 °C. Soil samples (approx. 30 g) were taken after 1, 7, 30 and 100 days of incubation. All treatments were replicated four times, resulting in a total of 96 plastic cups.
In another set of treatments with the two acidic soils (Table 1), which tested the effect of soil pH on the soil PCAL concentration, the soil was amended with different amounts of 0.5 M KOH: KOH/soil mass ratios 0/100, 1/100, 3/100, 5/100 and 10/100 in the low-P acidic soil and 0/100, 1/100, 3/100 and 5/100 in the high-P acidic soil. The incubation conditions and number of repetitions were identical to those described above. Soil samples were taken after 1, 7, 30, and 100 days of incubation in the low-P acidic soil and after 30 days of incubation in the high-P acidic soil.

2.3.2. Pot Experiment

The pot experiment was conducted from 19 January 2021 to 8 September 2021. For the pot experiment, only the low-P acidic soil was used. The pots (19 cm height, 16 and 13 cm diameter at the top and bottom, respectively) were filled with 2.7 kg dry soil/amendment mixture at a density of 1.1 g cm−3. Ryegrass (Lolium perenne cv. Valerio, Deutsche Saatveredelung AG, Lippstadt, Germany) was sown at a density of about 100 seeds (0.3 g seeds) per pot. The soil was irrigated to 70% water-holding capacity of the unamended soil. The soil water content was held between 65 and 75% water-holding capacity throughout the experiment. Plants were cultivated for 231 days in a glasshouse at an average air temperature of 23 ± 2 °C and air humidity of 52 ± 7%. In winter and spring, the day length was extended to 12 h with additional lighting. The aboveground biomass was harvested three cm above the soil surface 36, 57, 77, 97, 126, 160, 196 and 231 days after sowing.
Before filling the soil/amendment mixture into the pots, 16 treatments were applied to the soil. In the control, no P was added. In the other 15 treatments, 25 mg of Ptotal (kg dry soil)−1 was added in the form of TSP, fresh GW or BW, composted GW or BW, biochars from GW or BW produced under four different pyrolysis conditions (P350, P450, P700, P700a), or the solid and fluid fraction of the digestate of biogas production from BW. The experiment was performed with 5 repetitions per treatment, which were arranged in a fully randomized block design.
During set-up, the soil was fertilized with 100 mg of N, 150 mg of K, 90 mg of Mg and 180 mg of S (kg dry soil)−1, supplied as NH4NO3 and mineral N in the organic amendments and as K2SO4 and MgSO4. During the first three weeks of the experiment, soils amended with GW or BW received an additional fertilization with 109 and 190 mg of N (kg dry soil)−1, respectively, supplied as NH4NO3 in three applications to compensate for N immobilization induced by rapid C mineralization and the wide C/N-ratio of the amendments. After each harvest, the soil was fertilized with 100 to 125 (after harvest 6) mg N and 150 to 200 (after harvest 6 and 7) mg of K (kg dry soil)−1, supplied as NH4NO3, Ca(NO3)2 (after harvest 3 and 4) and K2SO4. Nutrients were added within five to seven days after harvest, except after the third harvest, where nutrients were added 15 days after harvest, when plants in all treatments developed symptoms of N deficiency.

2.4. Measurements and Chemical Analyses

The pH of soils and amendments was measured in a 0.0125 M CaCl2 solution with a soil: solution ratio of 1:2.5 (mass) for soils and 1:8 (mass) for amendments [50]. The total P concentration in the soil and the amendments was determined in the aqua regia extract with inductively coupled plasma-optical emission spectrometry (ICP-OES, iCAP 6300 Duo MFC, Thermo, Waltham, MA, USA). As an indicator of plant available P, the concentration of calcium acetate lactate soluble P (PCAL) in soils and amendments was measured according to the studies of [51,52].
Plant dry mass was recorded after drying to a constant weight at 70 °C in a forced-air oven. The dried plant material was ground to particles (<0.5 mm) using a centrifugal mill (ZM1; Retsch, Haan, Germany). The P concentration in the plant dry mass was measured with a spectral photometer (Specord 40, Analytik Jena GmbH, Jena, Germany) after dry ashing and dissolution in 2 N HCl and phosphate staining with the ammonium–vanadomolybdate reagent [53].

2.5. Calculation of Indicators for the P Fertilization Effect

In the pot experiment, the following indicators for the P fertilization effect were calculated. The shoot growth rate (SGR) was calculated by dividing the shoot dry mass (SDM) increment between two consecutive harvests by the number of days between the harvests according to Equation (1):
S G R = ( S D M 2 S D M 1 ) / ( t 2 t 1 )
where SDM1 and SDM2 are the shoot dry mass at time 1 and time 2.
The P uptake of the plants (PU) was calculated by multiplying the shoot dry mass by the shoot P concentration (mg (g DM)−1) according to Equation (2):
P U = S D M   ×   s h o o t   P   c o n c e n t r a t i o n
The P uptake rate (PUR) was calculated by dividing PU between two consecutive harvests by the number of days between the harvests and the soil mass per pot.
P U R = [ ( P U 2 P U 1 ) ] / ( t 2 t 1 ) / s o i l   m a s s   p e r   p o t
The apparent amendment-P recovery in the plants (APR) was calculated from the difference in PU in treatments with (PUamend) and without amendment (PUcontrol) divided by the total amendment P added (Padd) and multiplied by 100.
A P R = ( P U a m e n d P U c o n t r o l ) / P a d d × 100
The mineral fertilizer equivalent (MFE) was calculated from the quotient of APR with organic amendment (APRamend to APR) with triple superphosphate (APRTSP) times 100.
M F E = ( A P R a m e n d / A P R T S P ) × 100
In the incubation study, the amendment-induced increase in the soil PCAL concentration (API) was calculated according to Equation (6):
A P I %   a m e n d e d   P = ( P C A L a m e n d P C A L c o n t r o l ) / P a p p × 100
whereby PCALamend and PCALcontrol are the soil concentrations of CAL-soluble P with and without amendment (mg P (kg soil dry)−1), and Papp is the amount of total P applied to the soil with the amendment (mg P (kg dry soil)−1).
In the incubation experiment, the application of organic soil amendments resulted in an increase in soil pH. Therefore, API can be due to (i) the API that is induced by the change in soil pH (APIpHrel.) and (ii) the API that is not related to the change in soil pH (APIpHadj.):
A P I = A P I p H r e l . + A P I p H a d j .
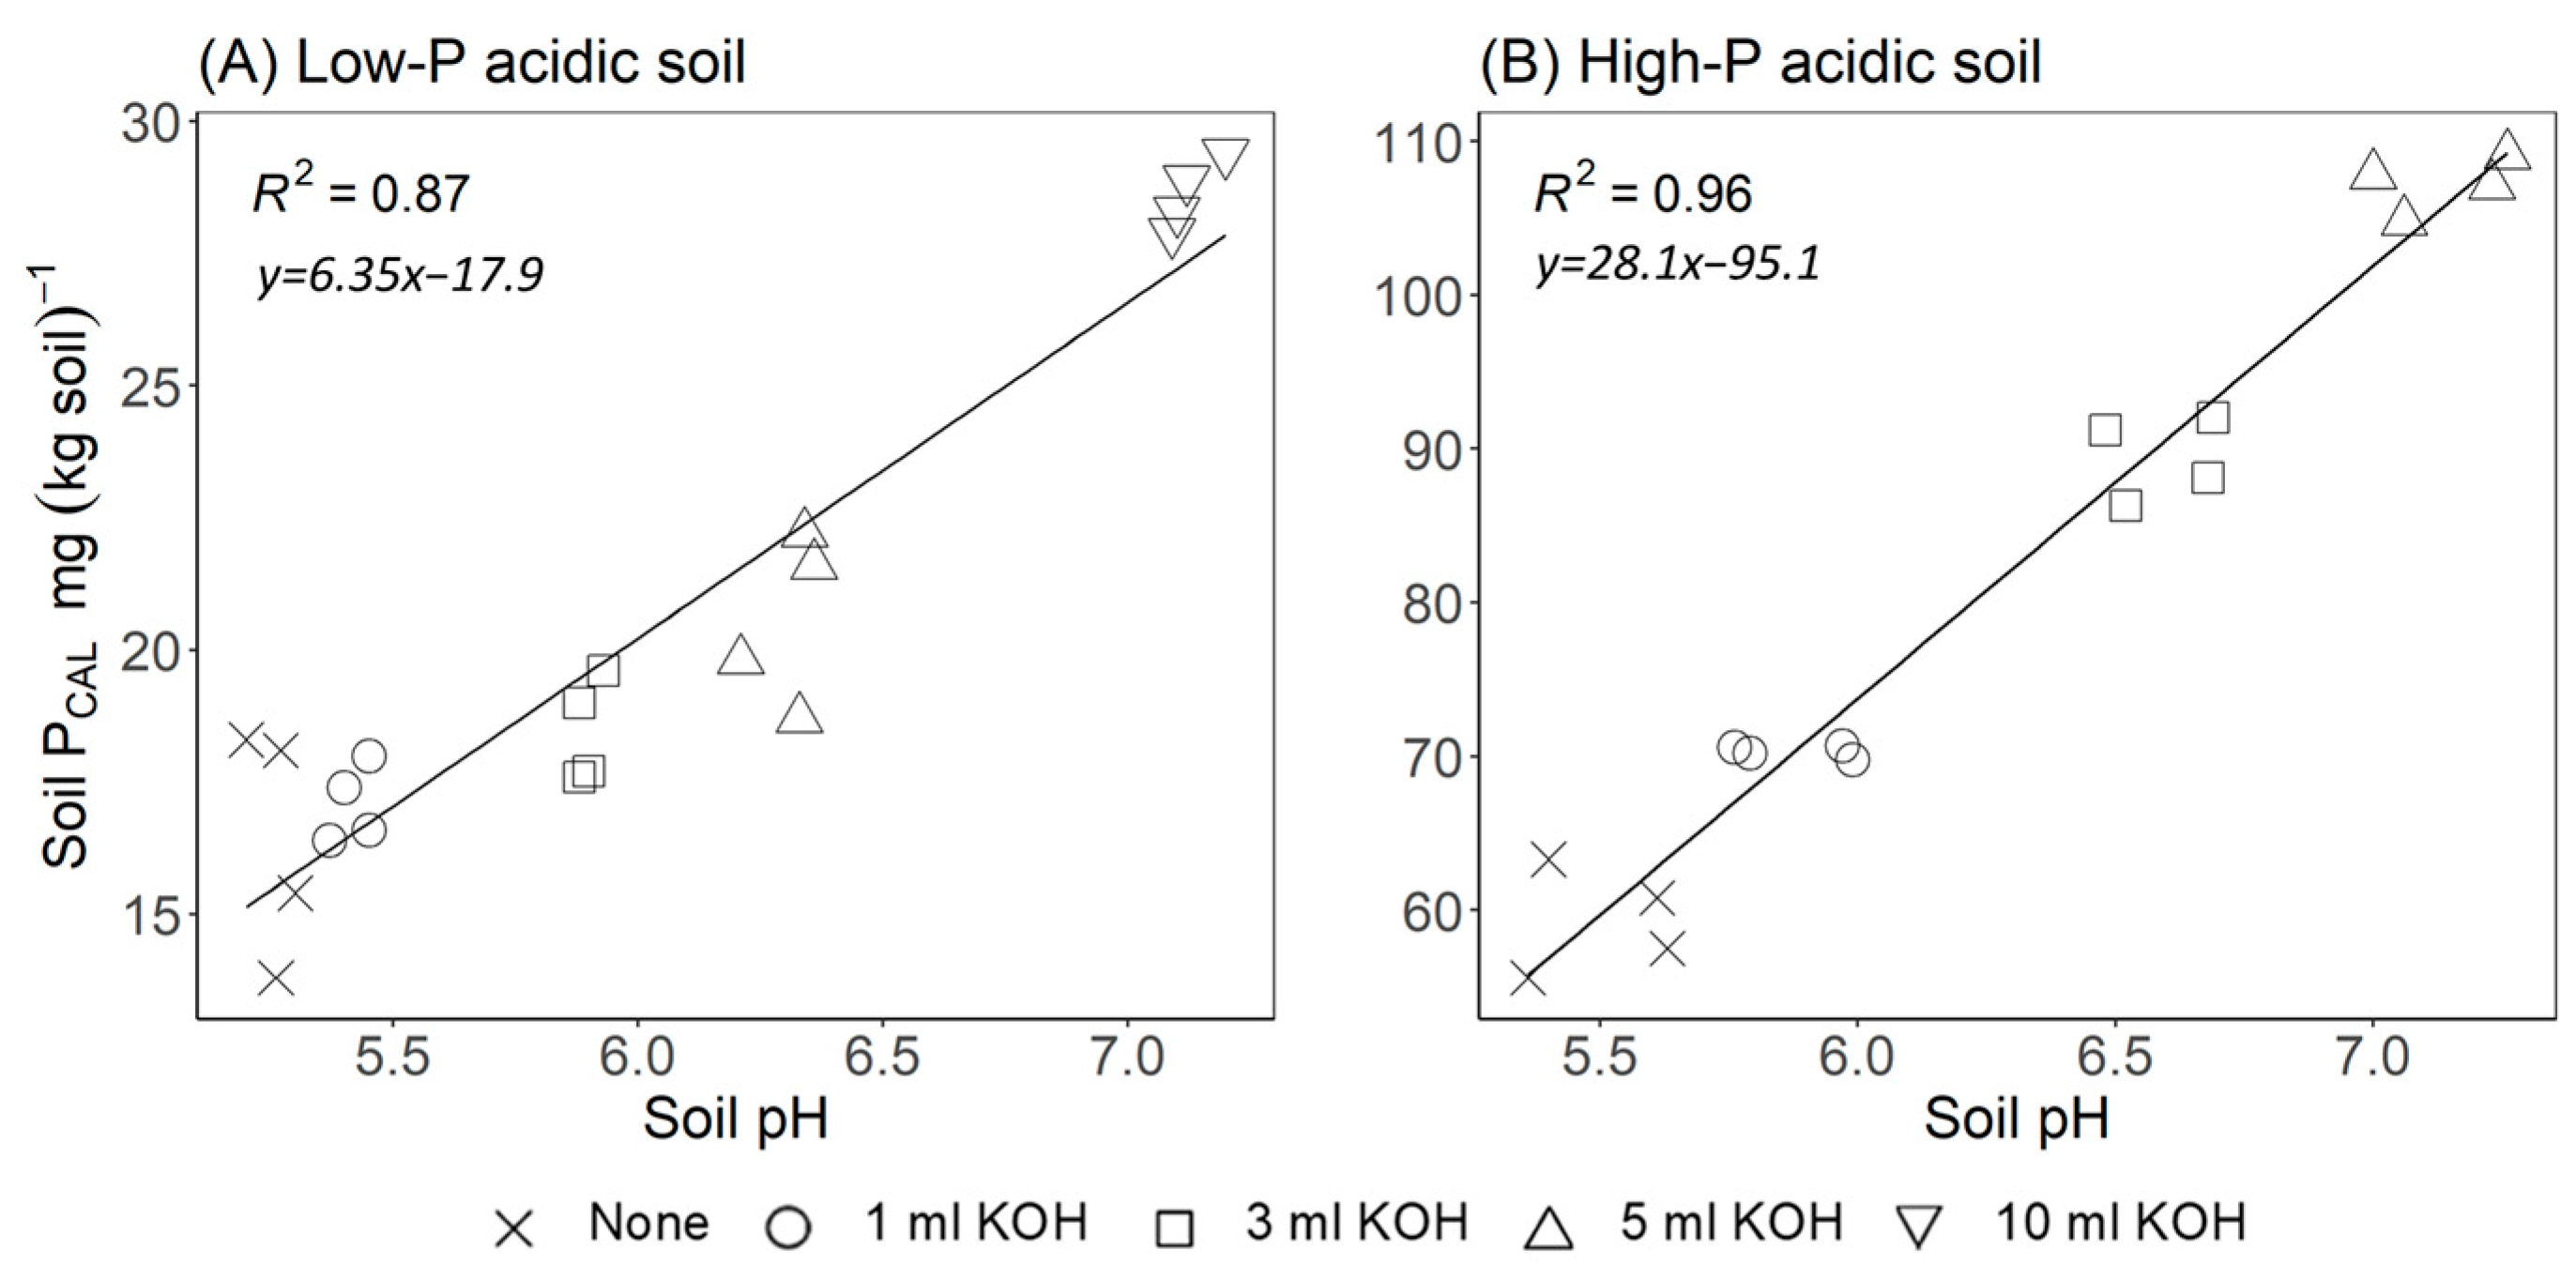
The pH effects on soil PCAL were derived from the treatments, which increased the soil pH by adding KOH (see Section 2.3.1). For both acidic soils, PCAL was closely related to soil pH. The relationships differed between the soils:
low-P acidic soil: PCALpHrel. = 6.35 pH–17.9 (R2 = 0.87)
high-P acidic soil: PCALpHrel. = 28.1 pH–95.1 (R2 = 0.96)
whereby PCALpHrel. is the soil PCAL concentration related to the pH effect of the amendment, that is, the soil PCAL concentration expected if the amendment effect were solely due to pH effects. The amendment effect on PCAL that is not related to the pH effect, i.e., the amendment effect adjusted for the pH effect (PCALpHadj.), was calculated from the difference between PCAL and PCALpHadj. of the amended soil. The APIpHrel. and APIpHadj. were calculated according to eq. 6 with the exception that PCALamend was replaced by PCALpHrel. and PCALpHadj. respectively.

2.6. Statistical Analysis

The data were analyzed with separate one-way ANOVAs for each feedstock to test the effect of processing and with a two-way ANOVA to test the effects of feedstock and processing. For the two-way ANOVA, the fermentation residues were excluded from the analysis because data were available only for biowaste (see Table 2 for factor levels). Model assumptions were checked using quantile-quantile plots (normality of errors) and plots of standardized residuals against fitted values (homoscedasticity of errors) [54]. For pair-wise comparisons, Tukey’s honest significant differences (HSDs) were calculated for p ≤ 0.05. Statistical analyses were calculated in R (Version R 4.5.0, Core Team, 2025).

3. Results

3.1. Effect of Processing on Ptotal, PCAL and pH of the Amendments

The different modes of processing significantly influenced the concentrations of Ptotal and PCAL, the proportion of PCAL in Ptotal and the pH of the amendments derived from green waste (GW) (Table 3A) and biowaste (BW) (Table 3B). The Ptotal concentrations varied between 1.0 (Fresh) and 3.1 g (kg DM)−1 (P700a) for the GW-derived and from 2.2 (Fresh) to 5.0 g (kg DM)−1 (Fluid) for the BW-derived amendments. The PCAL concentrations varied between 0.43 (Fresh) and 0.88 g (kg DM)−1 (P450) for the GW-derived and from 0.32 (P700) to 3.22 (kg DM)−1 (Fluid) for the BW-derived amendments. The effects of processing on PCAL concentrations were different from the processing effects on Ptotal concentrations. Therefore, the proportion of PCAL in Ptotal significantly differed among the treatments. The proportion of PCAL in Ptotal varied from 15 (P700) to 44% (P450) in the GW-derived amendments and from 7 (P700) to 62% (Fluid) in the BW-derived amendments. For biochars from both feedstocks, the proportion of PCAL in Ptotal was much lower for the biochars produced at 700 °C than for the biochars produced at 350 and 450 °C. The pH of the amendments varied from 5.4 (Fresh) to 12.4 (P700) for the GW-derived, and from 4.9 (Fresh) to 12.2 (P700) for the BW-derived amendments. For the biochars from both feedstocks, the pH increased with increasing pyrolysis temperature. For biochars produced at 700 °C, pH was lower for P700a than for P700.

3.2. Effect of Green Waste Processing on the Soil PCAL Concentration

In the incubation experiment, soil samples were taken after 1, 7, 30 and 100 days of incubation. In all three soils, the PCAL concentrations did not change significantly during the incubation period (Figure S2). Therefore, the soil PCAL concentration was calculated as the mean value from all four sampling dates. In the two acidic soils, the PCAL concentration with amendments was significantly higher than without amendments (Figure 1). In the high-P neutral soil, the PCAL concentration with amendments was not consistently higher than without amendments. In the two acid soils, the PCAL concentration was significantly influenced by the fertilizer variant (Table 4). In the amended soils, the PCAL concentration was highest with TSP and lowest with fresh GW for the low-P acidic soil (Figure 1A), whereas, in the high-P acidic soil, the PCAL concentration was highest with P700a and lowest with TSP (Figure 1B).
For the assessment of the amendment effects on soil PCAL, the amendment-induced soil PCAL increase (API) was calculated from the difference in soil PCAL concentrations in the soil with amendment and without amendment. This difference is given as a percentage of the P applied with the amendments. The API was larger in the high-P acidic soil than in the low-P acidic soil and the high-P neutral soil (Figure S3). The API in all three soils was significantly influenced by the fertilizer variant (Table 4; Figure S3). In the low-P acidic soil, the API varied between 22 (Fresh) and 34% (TSP) of the applied P (Figure S3A). The API with TSP, P350 and P450 was significantly higher than with fresh and composted GW (Figure S3A). Among the biochars, the API was significantly higher with P450 than P700. This indicates that, for biochars, the pyrolysis conditions had an effect on the API in the low-P acidic soil. In the high-P acidic soil, the API varied between 41 (TSP) and 88% (P700a) of the applied P (Figure S3B). Thus, in contrast to the low-P acidic soil, in the high-P acidic soil, the API was lowest with TSP. The API was higher with biochars than with fresh and composted GW. The pyrolysis conditions had no significant effect on the API in the high-P acidic soil. In the high-P neutral soil, the API varied between 2 (Fresh) and 36% (TSP) of the applied P (Figure S3C). However, the large HSD value indicates a high degree of uncertainty for the API values in the neutral soil.
After 100 incubation days, soil pH in all three soils was significantly influenced by the fertilizer variant (Table 4). In the low-P acidic soil, the pH ranged from 5.3 (Control, TSP) to 6.9 (BC700a; Table S2). In the high-P acidic soil, the pH ranged from 5.6 (Control, TSP) to 7.0 (BC700). In the high-P neutral soil, the pH was only little influenced by the amendments and ranged from 7.3 (Control, TSP) to 7.5 (BC700). For the low-P and high-P acidic soils, we tested the effect of soil pH on soil PCAL concentration in a set of treatments, in which the soil pH was modified by adding different amounts of KOH. In both soils, the PCAL concentration increased linearly with increasing soil pH (Figure 2).
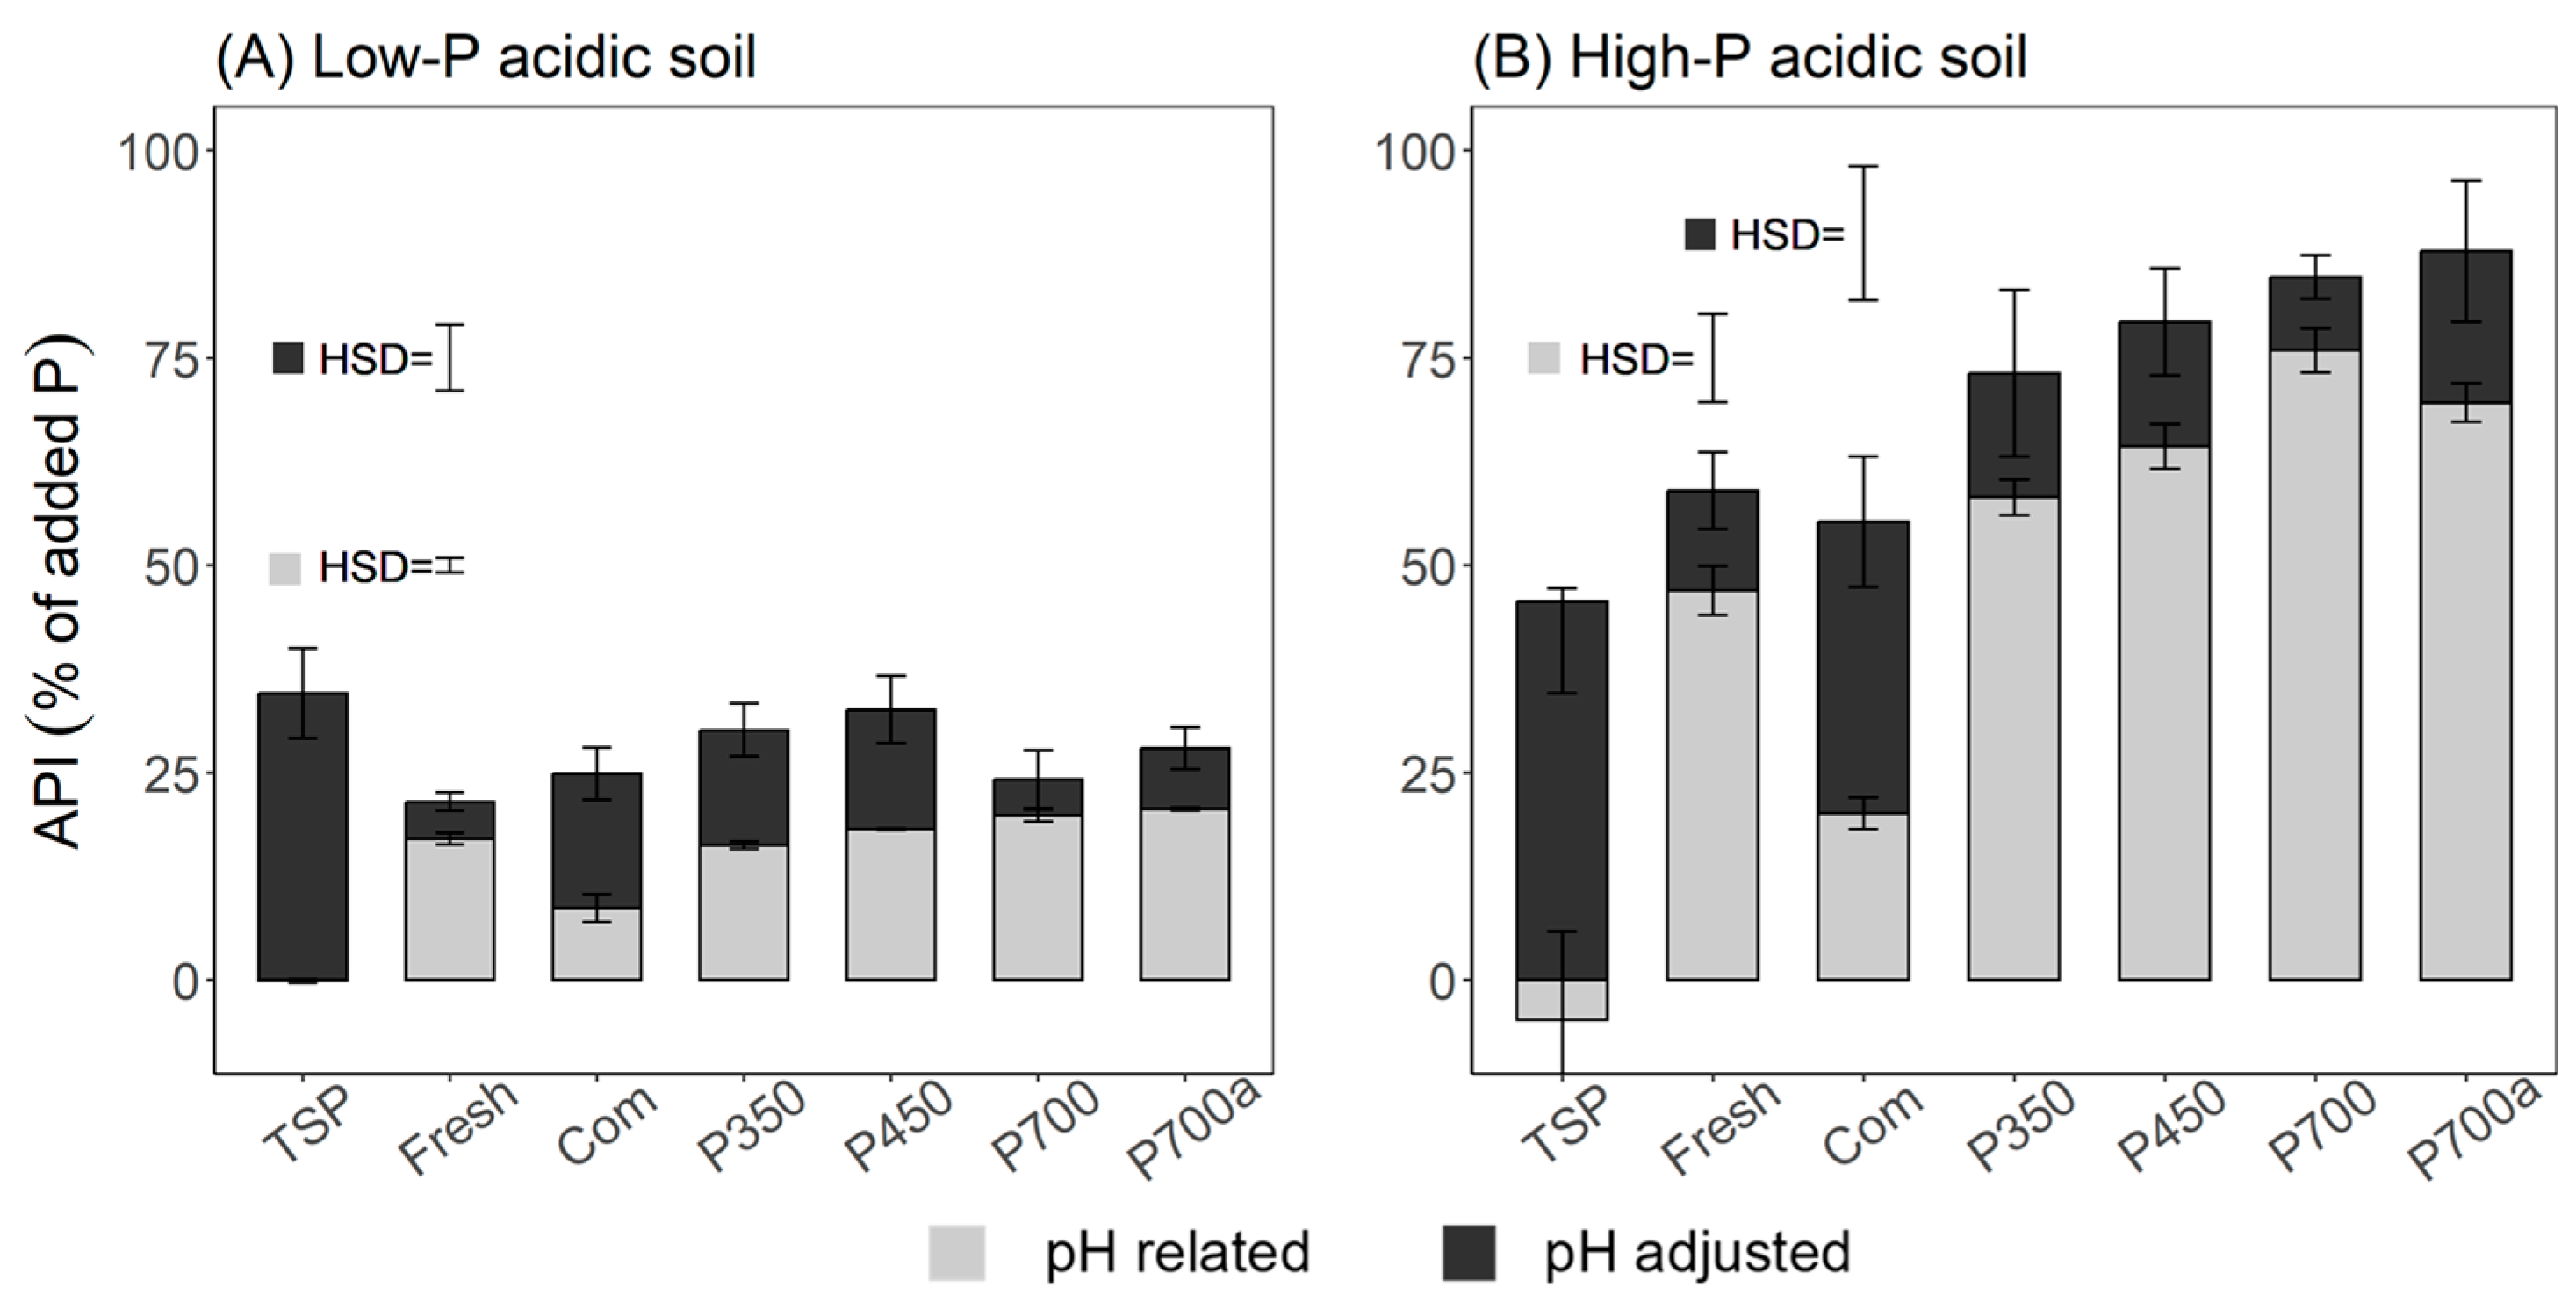
The relationships between soil pH and PCAL concentration were used to calculate the pH-related PCAL concentration (PCALpHrel.), i.e., the PCAL concentration that would be expected if the effect of the amendment was only due to its effect on soil pH (see Section 2.5). In both soils, for all organic amendments, the measured PCAL concentration increase (total column in Figure 3) was larger than the PCALpHrel. increase. This indicates that the organic amendments increased the soil PCAL concentrations not only by increasing soil pH. The difference between the measured PCAL concentration increase and the PCALpHrel. increase is referred to as the “pH-adjusted PCAL concentration increase” (PCALpHadj.). The PCALpHadj. increase due to amending the soil with GW-derived organic fertilizers was larger in high-P acidic than in low-P acidic soil, except for the biochars P350 and P450 (Figure 3). In both soils, PCALpHadj was significantly affected by the fertilizer variant (Table 4; Figure 3). In the low-P acidic soil, the PCALpHadj. increase for the organic amendments varied between 4 (P700) and 16% (compost; Figure 3). The increase was significantly higher for compost than for P700, P700a and Fresh. Furthermore, the increase was higher for P350 and P450 than for P700 and Fresh. In the high-P acidic soil, the PCALpHadj. increase in the organic variants varied between 9 (P700) and 35% (compost; Figure 3). In both soils, the increase was significantly higher for TSP than for the organic amendments, except for compost. Among the organic amendments, the increase was significantly larger for compost than for the other organic amendments.

3.3. Effect of Amendments on Shoot Growth of Ryegrass

The shoot growth rates (SGRs) were generally higher in soils with TSP than without P addition, except for the fourth growth period (Figure 4). In the fourth period, the growth rates of all fertilized variants transiently decreased. This decrease was presumably due to transient N deficiency as a consequence of a delay in fertilizer application. The difference between the non-fertilized and the TSP variant decreased towards the end of the experiment, although the apparent P uptake was only about 50% of the TSP-P applied. In comparison to the non-fertilized control, the SGR were higher for all the variants fertilized with differently treated municipal wastes with the exception of fresh GW (Figure 4). Towards the end of the experiment, the differences between the control and the organic fertilizer variants decreased, especially in the BW variants. In comparison to the variant fertilized with TSP, the SGR of the organic fertilizer variants was lower only in the first three growth periods (Figure 4). The mode of municipal waste treatment had significant effects on the SGR in all growth periods except the 4th growth period for green waste (Table 5; Figure 4A) and in the growth periods 1, 2, 4, 5 and 6 for biowaste (Table 5; Figure 4B).

3.4. Effect of the Amendments on P Uptake

The shoot P concentrations varied between 1.1 and 2.4 mg P (g DM)−1 over the entire experimental period and across all fertilizer variants (Figure S4). The P concentrations were thus below the range required for optimum growth in all fertilizer variants [55]. There were no consistent changes in P concentrations during the experimental period (Figure S4).
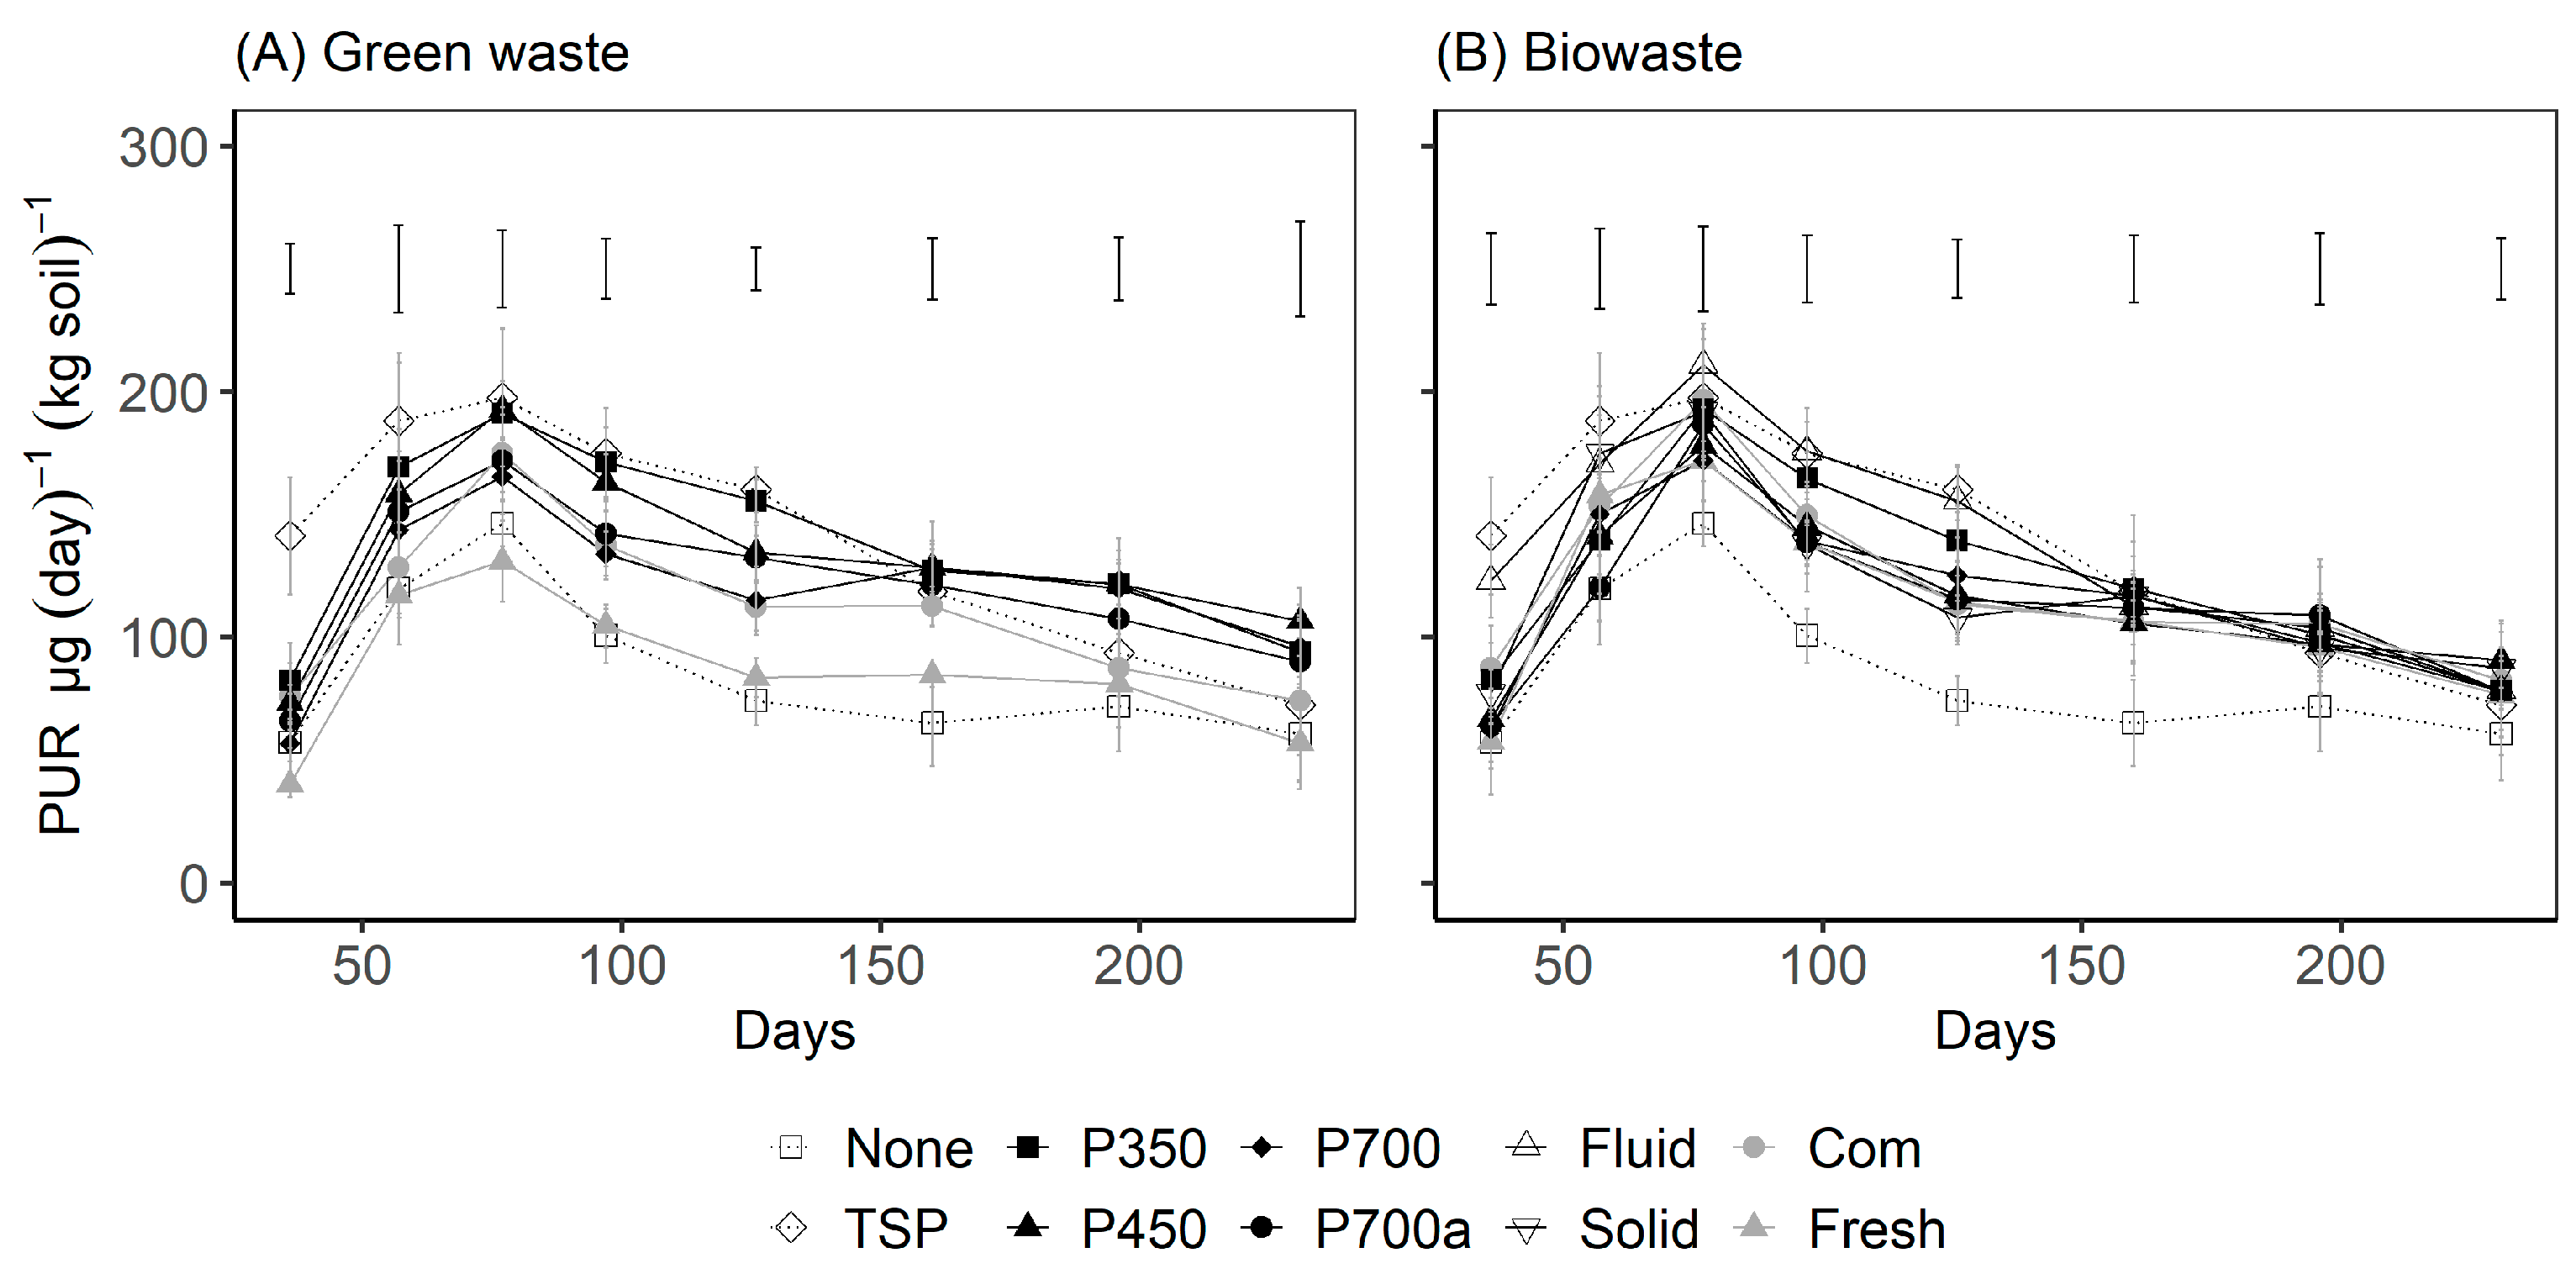
For all fertilization variants, the P uptake rates (PURs) increased continuously in the first three growth periods and then decreased again (Figure 5). The initial increase was probably due to the progressive rooting of the soil and thus the better spatial exploitation of the soil and fertilizer P by the roots. The decrease in later growth periods was presumably related to the decline in chemical P availability of soil and fertilizer P.
The PURs were significantly influenced by the type of amendment and, for organic amendments, by the feedstock and the mode of feedstock treatment (Table 6; Figure 5). The PUR was higher for TSP than for the unfertilized control throughout the entire experiment, although the differences between these two variants were only small and no longer significant in the last two growth periods. The PUR of the organic fertilizer variants depended on the mode of feedstock treatment. For the organic amendments derived from GW, P uptake rates were lowest for fresh GW and highest for biochars produced at 350 °C and 450 °C throughout the experiment.
The PURs for compost and the two biochars produced at 700 °C were in between. For the organic amendments derived from BW, the PURs were influenced by the mode of treatment mainly in the initial growth periods, whereas in the last three growth periods the mode of treatment had no significant effect on the PUR. In the first five growth periods, the PURs were highest for FRfluid.
The apparent P recovery (APR) increased with increasing experimental duration for all fertilizer variants except fresh GW (Figure S5). For TSP, the APR increased from 12% at the first to 50% of the applied P at the 8th harvest. The APR of the organic amendments derived from GW and BW was significantly affected by the mode of treatment (Table S3). For GW, the APR at the first harvest ranged from −2 (Fresh) to 4% of the applied P (P350) and from 1 (Fresh) to 47% of the applied P (P350) at the 8th harvest. The APR of the organic amendments derived from BW at the first harvest ranged from 0 (Fresh) to 11% of the applied P (FRfluid) and at the eighth harvest from 23 (Com) to 42% of the applied P (FRfluid).
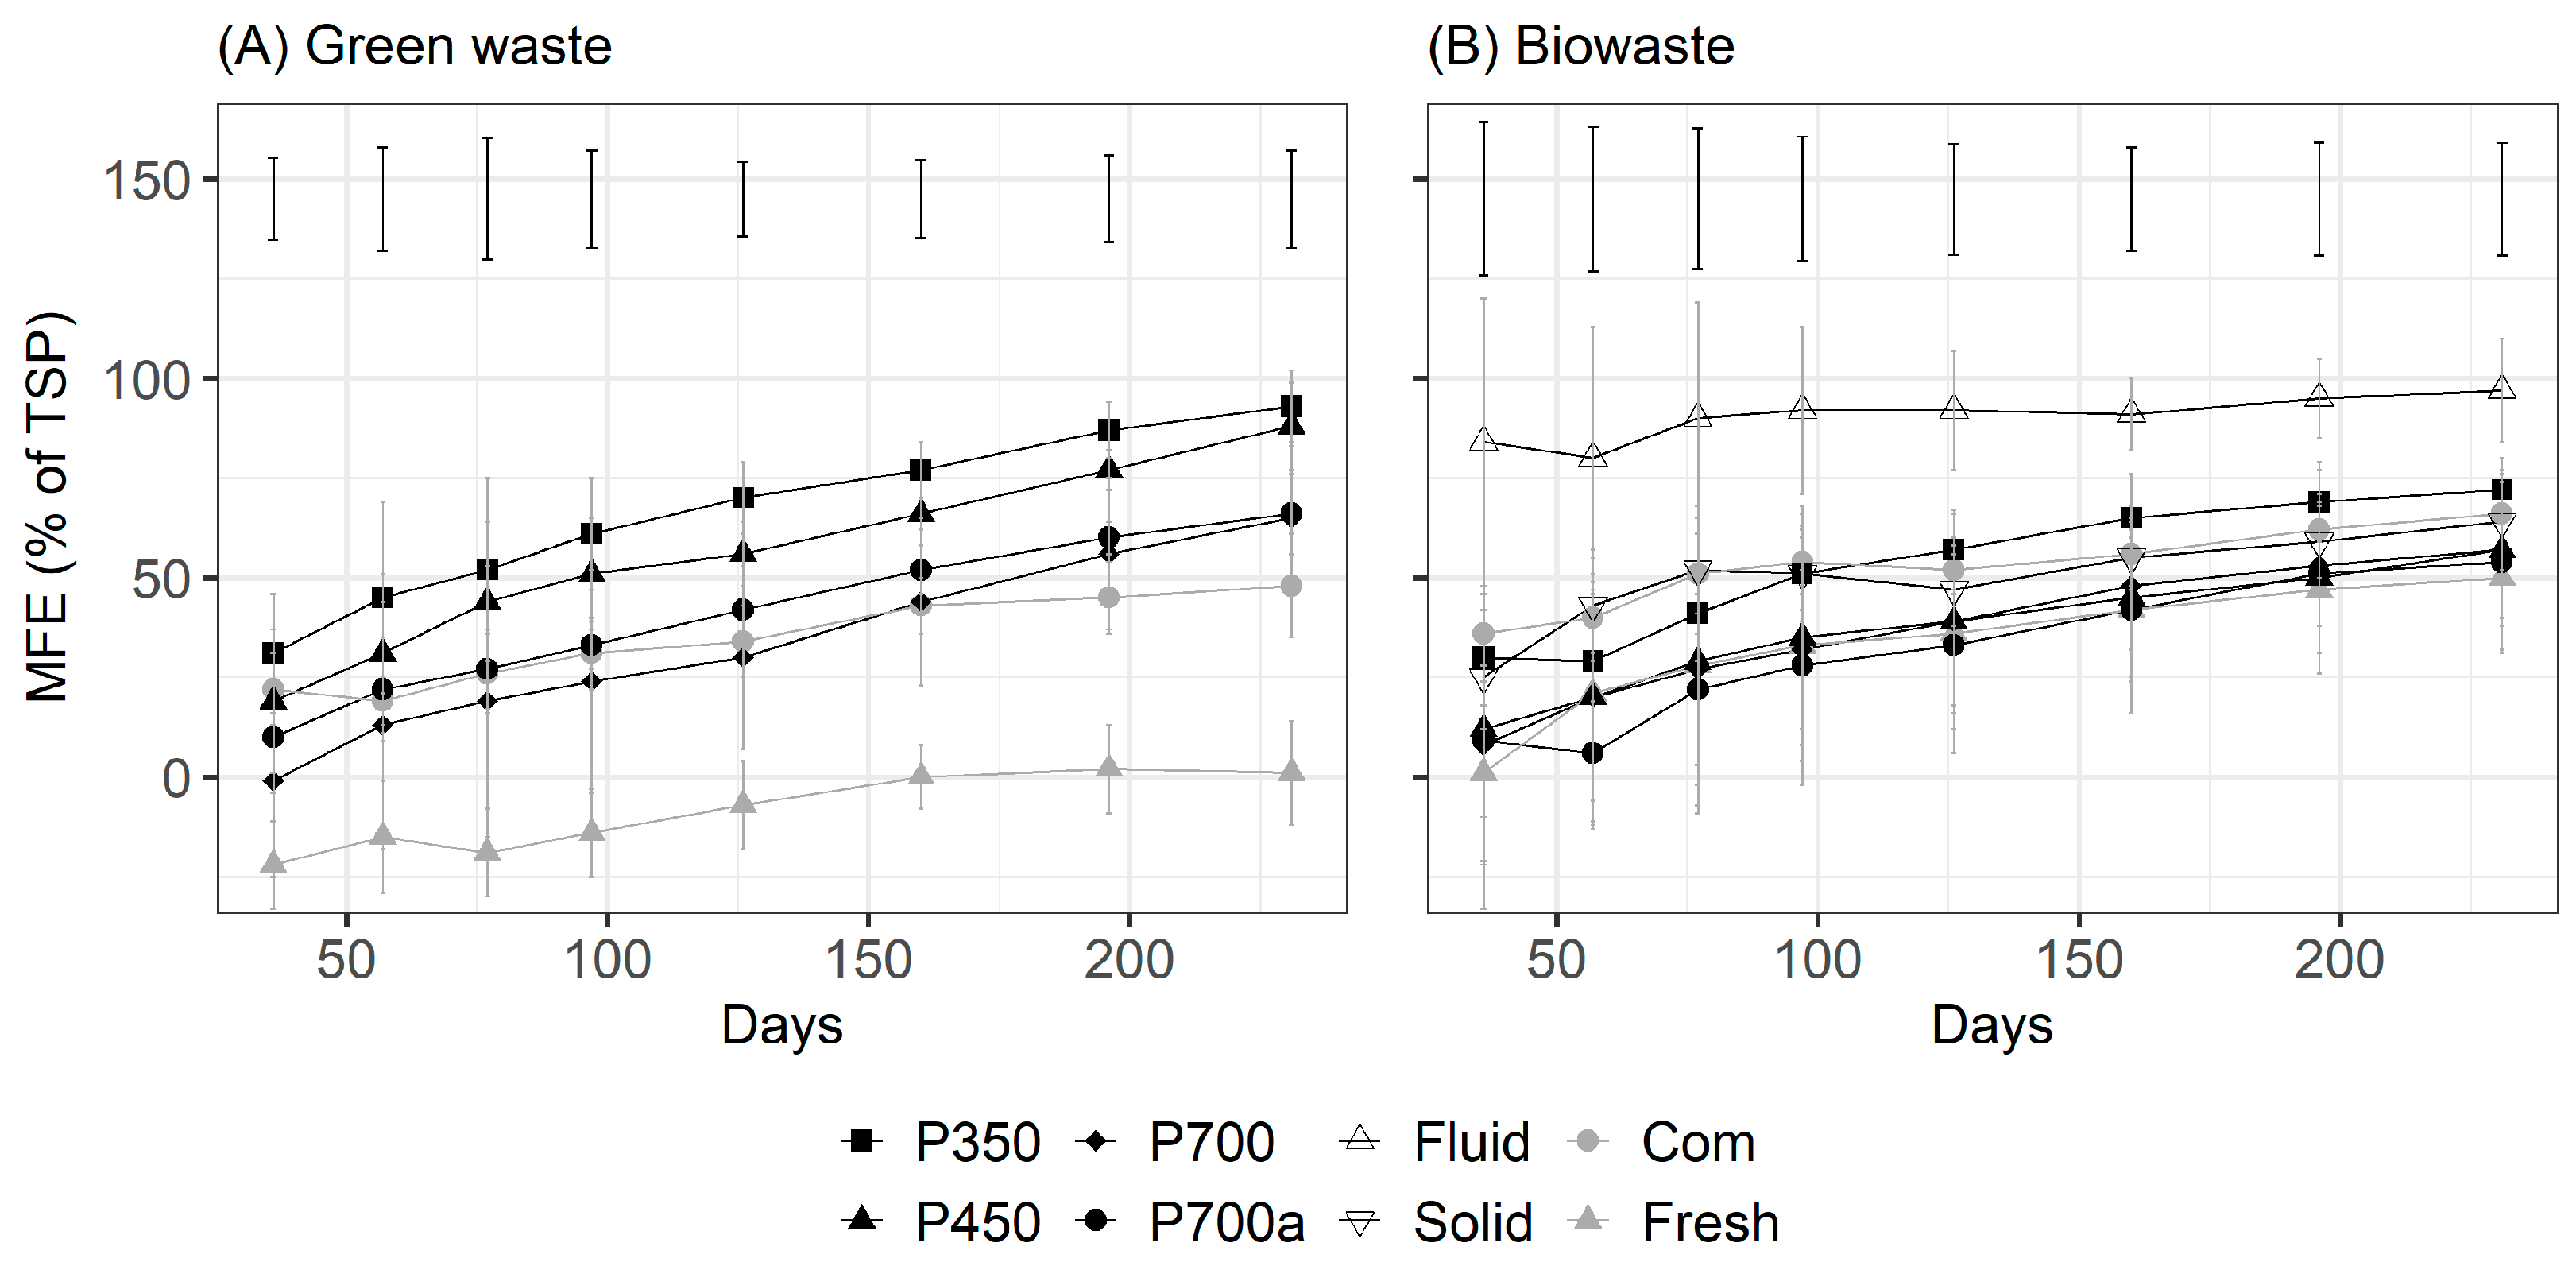
The mineral fertilizer equivalent (MFE) at the first harvest ranged from −22% (Fresh) to 31% (P350) for the GW-derived amendments (Figure 6A) and from 1% (Fresh) to 84% (Fluid) for the BW-derived amendments (Figure 6B). With increasing experimental duration, the MFE continuously increased for all amendments with the exception of fresh GW and fluid fermentation residue from BW. At the end of the experiment, the MFE varied between 1% (Fresh) and 93% (P350) for the GW-derived amendments (Figure 6A) and between 50% (Fresh) and 97% (Fluid) for the BW amendments (Figure 6B).

4. Discussion

In this study the P fertilizer value of organic fertilizers derived from organic municipal wastes after different treatments was assessed in an incubation study with three different soils and a pot experiment with ryegrass. With both experimental approaches, the P fertilizer value was significantly affected by the mode of waste treatment.

4.1. Effects of the Mode of Treatment on the P Concentrations in the Amendments

In comparison to non-treated fresh green waste and biowaste, the Ptotal concentrations in composts, biochars and fermentation residues were significantly higher (Table 3). This is in agreement with findings from the literature for composts [56], biochars [57] and fermentation residues [43]. Composting, pyrolysis and anaerobic fermentation decrease the organic mass, while most P is retained. The Ptotal was higher for biochars produced at 700 °C than at 350 °C (Table 3). An increase in Ptotal with increasing pyrolysis temperature up to 700 °C is in agreement with findings from other studies [57,58,59]. This is presumably due to increasing losses of organic mass with increasing temperatures, whereas P is retained up to the threshold temperature for P volatilization of 700 °C [60].
Treatment of organic material by composting [56,61,62], pyrolysis [63,64] and fermentation [43] leads to transformation of the different P species contained in the material and may lead to modification of the P availability. In our study the treatment effects on PCAL differed from effects on Ptotal (Table 3). Therefore, the proportion of available PCAL in Ptotal significantly differed among the treatments (Table 3). The proportion of PCAL was significantly lower in compost and biochars produced at 700 °C than in the fresh material and the biochars produced at 350 and 450 °C (Table 3). Pyrolysis can convert plant-available organic P into inorganic P that is less available [65]. The opposite has also been observed, with pyrolysis increasing plant-available P [66]. Lower concentrations of available P in biochars produced at high temperatures in comparison to the feedstock used for biochar production have also been found in other studies [57,59,67,68,69]. However, the effect of pyrolysis temperature on the concentration of available P in biochar is not consistent. In some studies, higher concentrations of available P were found with increasing temperatures, and, in other studies, lower concentrations were found [58,64]. Biochar P availability can be increased by selecting low Ca feedstocks or doping the feedstock with K, which leads to preferential binding of P with K instead of Ca, Mg or Fe and, thus, the formation of highly soluble salts [65]. In the fermentation residues, the proportion of PCAL was higher in the fluid than in the solid fraction (Table 3). Higher proportions of available P in the fluid than in the solid fraction of fermentation residues have also been reported in other studies [70,71,72].
The pH in compost and biochars was significantly higher than in the non-treated fresh green waste, and, for biochars, the pH increased with increasing pyrolysis temperature (Table 3). This is in accordance with findings from the literature for composts [73,74] and biochars [58].

4.2. Effects of the Mode of Treatment on the Soil P Concentration After Application of the Amendments

In the two acidic soils, the concentrations of plant available PCAL were significantly increased by the amendments (Figure 1). Higher P availability is in agreement with findings for soils amended with biochars [21,46,47,60,75], compost [42] and fermentation residues [43]. The amendment-induced increase in the soil PCAL concentration (API) was significantly influenced by the soil and the treatment method for green waste (Figure S3 and Figure 3). The API was much larger in the high-P acidic soil than in the low-P acidic soil and the high-P neutral soil. This was possibly due to lower saturation of soil sites, which strongly bind PCAL in the low-P acidic soil, and lower capacity for P sorption in the high-P neutral soil [76,77]. The API may be due to the direct supply of PCAL with the amendments and/or amendment effects on soil P dynamics. In the high-P acidic soil, the amount of amendment-induced PCAL increase (in mg PCAL/100 g soil) for all amendments was substantially higher than the amount of PCAL supply with the amendments, whereas, in the low-P acidic soil and the high-P neutral soil, the amendment-induced PCAL increase was similar to or lower than the PCAL supply (Table S4). This indicates that, in the high-P acidic soil, the amendments led to a transfer of soil P into the plant available PCAL pool. A transfer of soil P into the PCAL pool can be mediated by pH-related mechanisms [48] and mechanisms that act independently of the pH [42,60].
In the two non-fertilized acidic soils, the increase in the soil pH by adding KOH solution increased the PCAL concentration (Figure 2). This shows that an elevation of the soil pH led to a transfer of soil P into the plant available PCAL pool. In acidic soils, P availability is low due to phosphate interactions with Al- and Fe-ions, which lead to highly insoluble Al- and Fe-phosphates. Furthermore, low pH increases phosphate sorption to Fe- and Al-Oxides [48]. Under these conditions, increasing soil pH enhances P availability, with maximum P availability occurring at near neutral pH [48].
In our study, the soil pH without fertilization was 5.3 in the low-P and 5.6 in the high-P acidic soil. The fertilization with organic amendments increased soil pH, whereby the pH increase was significantly influenced by the method of green waste treatment (Table 4 and Table S1). The amendment-induced pH increase was lowest with compost, higher with fresh GW and largest with biochars. For biochar-amended soil, the pH increased with increasing pyrolysis temperature. The amendment-induced increase in soil pH is in agreement with findings for composts [25,78] and biochars [60,75,79]. It was found in many studies that the effect of organic amendments on P availability is dependent on soil pH [70,80]. The pH-related increase in the soil PCAL concentration (APIpHrel.) varied between 36% of API for compost amended soil, about 50% of API in soils amended with P350 or P450 and about 80% of API for the soils amended with fresh green waste, P700 or P700a (Figure 3). Conversely, this means that the compost effect on the PCAL concentration was mainly due to pH-independent mechanisms, while only 20% of the effect of fresh green waste and biochar produced at 700 °C was pH-independent. It is expected that the pH-dependent effects of organic amendments on soil P availability will be most important on acidic soils, while the pH-adjusted effects should also be relevant on neutral soils. This is ddsdsdin agreement with the finding in other studies that biochars increase P availability mainly in acidic soils [81,82].
The pH-adjusted increase in soil PCAL content (mg PCAL-P/100 g soil) in the low-P acidic soil was generally smaller than the PCAL supply with the amendments (Table S4). This indicates that in this soil a portion of the PCAL in the amendments and/or a portion of the soil PCAL pool was transferred into the soil P pool that is not CAL-soluble. In the high-P acidic soil, the pH-adjusted increase in soil PCAL content was smaller than the PCAL supply for fresh green waste and the biochars with the exception of P700a (Table S4). With P700a and, in particular, with compost, the pH-adjusted increase in soil PCAL content was larger than the PCAL supply. This shows that these two amendments led to a transfer of soil P to the plant-available PCAL pool that was independent of the pH effects. The supply of organic carbon to the soil can influence soil P dynamics directly by decreasing P sorption [9,42] and/or indirectly by modifying the activity of soil microorganisms [16,60,75,83,84].

4.3. Effect of the Mode of Treatment on P Uptake

The effect of the fertilization variants on plant growth rate (Figure 4) was broadly similar to the effect on PUR (Figure 5). The P uptake is more sensitive to the P availability than plant growth [36,66,82] because the growth responses to P availability may be buffered through an increase or decrease in plant internal P reserves. The discussion therefore focuses on the effects of the different fertilizer variants on P uptake. We used the P uptake rate (PUR), apparent P recovery (APR) and mineral fertilizer equivalent (MFE) to quantify the P fertilizer efficiency of the organic amendments. All three indicators were significantly influenced by the mode of treatment of the organic amendments, whereby the treatment effect changed with increasing experiment duration (Figure 5, Figure 6 and Figure S5).
There was no consistent effect of the fertilizer variant on the soil pH at the end of the pot experiment (Table S5). This indicates that the effects of the organic amendments on PUR, APR, and MFE were not due to changes in soil pH. This is in contrast to the incubation experiment in which the amendments had strong effects on soil pH (Table S2). The difference in the amendment-induced modification of soil pH between the pot and the incubation experiment was presumably caused by the lower amendment addition in the pot experiment (25 mg P kg−1 soil) than in the incubation experiment (50 mg P kg−1 soil). Furthermore, in the pot experiment, the soil pH was presumably influenced by the roots. It is well documented that nitrogen nutrition and the P nutritional status of plants may strongly influence soil pH in the rhizosphere [1].
Organic amendments can enhance plant P uptake by increasing root growth [85] and soil water content [86,87] and thus the spatial availability of soil P. In our pot experiment, the soil water content was maintained in an optimal range through regular irrigation. Due to the small pot volume, the root density was high at least at the end of the experiment. Therefore, we assume that the positive effects, which organic amendments can have on the spatial availability of soil P under field conditions, were of minor importance in our pot experiment.
All organic amendments delivered plant-available PCAL to the soil (Table 3). For the four biochars produced at 700 °C, APR substantially surpassed the supply of PCAL. This indicates that these biochars increased the uptake of soil P. Organic amendments can increase uptake of soil P by increasing the chemical availability of soil P through various mechanisms, including modification of the activity of soil enzymes associated with P mineralization and of microorganisms associated with P solubilization [60].
Fresh GW was the only organic amendment that had no positive P fertilizer effect throughout the pot experiment. This was possibly due to the very high C/P ratio of fresh GW (C/P = 369), which may have led to immobilization of soil P [88,89]. Immobilization of soil P was also found after application of manure by Brod et al. [90]. The low-P fertilizer effect of fresh GW in the pot experiment is in agreement with the very low pH-adjusted API in the incubation study (Figure 3).
For both feedstocks the P fertilizer effect was higher for composts than for the fresh material. This is in accordance with the data from the incubation study in which the pH-adjusted API was substantially larger for GW-derived compost than for fresh GW (Figure 3). Cumulated over all 8 harvests, the APR was 24% for the GW-derived and 33% for the BW-derived compost, and the MFE was 48% for GW- and 66% for BW-derived compost. The APR values are in the range of a study with four BW-derived composts, which found APR values cumulated over six harvests between 18 and 50% [91]. In a study with three composts, the APR cumulated over four harvests ranged between 3% for a municipal waste compost and 13% for a compost from fermentation residues [92]. The MFE values were slightly higher than those found in a study with two types of compost made from a mixture of household/kitchen/park waste [37].
In our study all biochars had a positive P fertilizer effect with APR values ranging between 25% for BW-derived biochar produced at 700 °C and 47% for GW-derived biochar produced at 350 °C, and MFE values ranging between 54% and 93%. The positive P fertilizer effect of biochars is in line with a meta-study, which found that the biochar amendment increased plant P uptake by 55% on average across all studies [47]. In a study of [83], a P-rich biochar derived from willow woodchips produced at 550 °C increased P uptake of Lotus pedunculatus by about 50%, whereas two P-poor biochars derived from pine wood produced at 450 or 550 °C did not increase P uptake from a low-P acidic soil. The positive effect of the P-rich biochar was attributed to its high liming equivalence and provision of additional plant-available P [83]. In recent studies with ryegrass, the MFE value for biochar from poultry manure produced at 460 °C was 58% [81], and, for biochar from dairy, processing sludge was 31% at the lower rate and 46% at the higher rate of P supply [82].
The APR and MFE values for the GW-derived biochars produced at 350 °C and 450 °C were higher than for the biochars produced at 700 °C (Figure S5 and Figure 6). The lower P fertilizer efficiency for the GW-derived biochars produced at 700 °C is in agreement with the data for the pH-adjusted API from the incubation study (Figure 3). In the meta-study of [47], the pyrolysis temperature had no influence on the biochar-induced increase in P uptake.
In our study the fluid fermentation residue had higher APR (42%) and MFE (97%) values than the solid fermentation residue (APR 27%, MFE 64%). This is in agreement with a study with ryegrass, which found an APR value of 40% for fluid and of 30% for a solid digestate [93], and an MFE value of 75% for fluid and 66% for solid digestate [70]. In two non-separated digestates [94], MFE values of 85% and 80% were found at the first harvest, and 67% and 64% for two harvests. In the study of [44], the effect of fluid–solid separation of digestate on the digestate-induced P was dependent on the digestate and differed depending on the plant species used for the pot experiment.
The temporal course of the P fertilization effect differed substantially between the different fertilizer variants. This is particularly evident in the change in the MFE with increasing experiment duration (Figure 6). The fertilizing effect of the organic amendments, with the exception of FRfluid., was slower than the fertilizing effect of TSP. This is in agreement with other findings that organic fertilizers often act more slowly than mineral fertilizers [49]. For crops with a short vegetation period, the slow action of the organic amendments can prevent sufficient P supply on P-poor soils in which plant P supply is mainly directly derived from the fertilizer.
The P fertilization in the form of TSP occurs by adding highly water-soluble P to the soil, and it immediately enters the plant-accessible and highly plant-accessible soil P [95]. With increasing time after fertilizer application, a portion of the TSP-P can be transferred to a soil pool with low or very low P accessibility for the plants [95]. In accordance with this concept, the PUR of the TSP variant at the end of the trial did not differ from the PUR of the non-fertilized variant (Figure 5), although only about 50% of the TSP-P had been taken up by the plants (Figure S5). The P fertilization in the form of organic amendments is adding P in inorganic and organic forms. It is possible that the slower P effect of the organic amendments compared to TSP was because some of the P contained in the fertilizers first had to be converted into forms that are easily accessible to plants. For example, organic P in the amendments has to be mineralized by soil microorganisms before it can enter the plant accessible soil pool. It is also possible that the organic amendments gradually led to an increase in the plant availability of soil P and uptake of soil P [96]. Amendments containing organic C increase soil microbial activity [96]. Depending on the C/P-ratio in the amendments, increased microbial activity may decrease uptake of soil P due to transient P immobilization into microbial biomass [97] or increase uptake of soil P due to mineralization of organic P and release of P mobilizing compounds by the microorganisms [42,83,84,98].
In the incubation experiment, the PCAL concentration in the soil did not change systematically during the 100-day incubation period. This was not only true for the TSP variant but also for the organic fertilizer variants (Figure S2). This suggests that in the pot experiment the continuous increase in the P fertilizer value of the organic amendments relative to TSP (Figure 6) was at least in part caused by interactions of plant roots and the organic amendments. This suggestion is supported by comparison of the pH-adjusted increase in the soil PCAL concentration (Figure 3) and the cumulative APR (Figure S5). For the GW-derived biochars, the P fertilizer value was markedly lower in the incubation experiment (API 4% to 14%) than in the pot experiment (APR 31% to 47%), where interactions between plant roots and biochars occurred. Plant roots may increase the P uptake, e.g., by the exudation of soluble organic compounds, which enhance the P availability directly or indirectly via stimulation of P-solubilizing microorganisms [99,100]. The ability of plants for acquisition of P from soils and fertilizers is dependent on plant species [101], whereby plant species differ in their P-mining strategies and, thus, in their ability for acquisition of specific P forms [102].

5. Conclusions

Our data show great potential for increasing the P fertilization effect of organic municipal waste materials through appropriate processing prior to application. The effect of the processing method on the P fertilization effect differed between the two waste materials. This indicates that the optimal processing method is dependent on the composition of the waste and presumably also on the soil to which the waste is applied. When choosing the processing method, it should also be taken into account that organic municipal waste materials also contain organic carbon and other nutrients and can be used as soil additives to improve heavy metal-contaminated soils. The choice of processing method for optimal valorization should therefore be based not only on the specific waste material but also on the primary use of the organic residues. From an agronomic perspective, the variability of the short-term P fertilization effect in particular is an obstacle to replacing conventional P commercial fertilizers with processed waste materials. The low short-term P fertilization effect can lead to suboptimal P supply to plants for crops with a short growing season on P-deficient soils.

Supplementary Materials

The following supporting information can be downloaded at https://www.mdpi.com/article/10.3390/agronomy15102296/s1, Table S1: Effect of processing on the contents of organic carbon (Corg), total nitrogen (Ntotal), total sulfur (Stotal), Calcium (Ca), Potassium (K) and Magnesium (Mg) in the amendments derived from green waste (A) and biowaste (B); means ± standard deviations; Figure S1: Photos showing the vessels used for the incubation experiment (above) and the pot experiment (below); Figure S2: Time course of soil PCAL concentration in three soils; Figure S3: Effect of different amendments on the amendment-induced increase in soil PCAL (API) (mean of 4 measurements after 1, 7, 30 and 100 incubation days) in three different soils; Table S2: Effect of different amendments on soil pH after 100 incubation days; Figure S4. Effect of amendments on shoot P concentration of ryegrass; Table S3. p-values for the effects of processing and feedstock on the cumulative apparent P recovery in the shoot dry mass of ryegrass (APR); Figure S5. Effect of amendments on the cumulative apparent P recovery in the shoot dry mass of ryegrass (APR); Table S4: Effect of the amendment on the supply of PCAL with the amendment and the amendment-induced PCAL content in different soils; and Table S5: Effect of the fertilization treatment on soil pH and PCAL concentration after the last harvest in the pot experiment.

Author Contributions

S.H.: conceptualization, methodology, investigation, data curation, formal analysis, writing—original draft; H.B.: conceptualization, investigation, writing—review and editing; A.A.: investigation; T.R.: investigation; C.E.: supervision, conceptualization, methodology, writing—review and editing. All authors have read and agreed to the published version of the manuscript.

Funding

Fachagentur Nachwachsende Rohstoffe (FNR)—491192747 and the Open Access Publication Fund of Humboldt-Universität zu Berlin funded the article processing charge.

Data Availability Statement

The original contributions presented in this study are included in the article/Supplementary Materials. Further inquiries can be directed to the corresponding authors.

Acknowledgments

The authors are grateful to Hernán Almuina-Villar and Alba Dieguez Alonso (Department for energy process engineering and conversion technologies for renewable energies, Technische Universität Berlin, Germany) for biochar production. We would like to express our special thanks to Carmen Wolfram-Wienberg for her outstanding help in preparing the waste materials.

Conflicts of Interest

The authors declare that they have no known competing financial interests or personal relationships that could have appeared to influence the work reported in this paper.

References

  1. Marschner, H. Mineral Nutrition of Higher Plants, 2nd ed.; Academic Press: London, UK, 1995; pp. 271–283. [Google Scholar]
  2. Mew, M.C.; Steiner, G.; Geissler, B. Phosphorus Supply Chain—Scientific, Technical, and Economic Foundations: A Transdisciplinary. Sustainability 2018, 10, 1087. [Google Scholar] [CrossRef]
  3. Cordell, D.; White, S. Peak Phosphorus: Clarifying the Key Issues of a Vigorous Debate about Long-Term Phosphorus Security. Sustainability 2011, 3, 2027–2049. [Google Scholar] [CrossRef]
  4. Desmidt, E.; Ghyselbrecht, K.; Zhang, Y.; Pinoy, L.; Van der Bruggen, B.; Verstraete, W.; Meesschaert, B. Global Phosphorus Scarcity and Full-Scale P-Recovery Techniques: A Review. Crit. Rev. Environ. Sci. Technol. 2014, 45, 336–384. [Google Scholar] [CrossRef]
  5. European Commission. Communication from the Commission: On the Review of the List of Critical Raw Materials for the EU and the Implementation of the Raw Materials Initiative; European Commission: Brussels, Belgium, 2014; COM no. 297. [Google Scholar]
  6. Schoumans, O.F.; Bouraoui, F.; Kabbe, C.; Oenema, O.; van Dijk, K.C. Phosphorus management in Europe in a changing world. Ambio 2015, 44, 180–192. [Google Scholar] [CrossRef]
  7. Withers, P.J.A.; Doody, D.G.; Sylvester-Bradley, R. Achieving Sustainable Phosphorus Use in Food Systems through Circularisation. Sustainability 2018, 10, 1804. [Google Scholar] [CrossRef]
  8. Hollas, C.E.; Bolsan, A.C.; Venturin, B.; Bonassa, G.; Tápparo, D.C.; Cândido, D.; Antes, F.G.; Vanotti, M.B.; Szögi, A.A.; Kunz, A. Second-Generation Phosphorus: Recovery from Wastes towards the Sustainability of Production Chains. Sustainability 2021, 13, 5919. [Google Scholar] [CrossRef]
  9. Schneider, F.; Haderlein, S.B. Potential effects of biochar on the availability of phosphorus—Mechanistic insights. Geoderma 2016, 277, 83–90. [Google Scholar] [CrossRef]
  10. Kaza, S.; Yao, L.C.; Bhada-Tata, P.; Van Woerden, F. What a Waste 2.0: A Global Snapshot of Solid Waste Management to 2050. World Bank: Washington, DC, USA, 2018. [Google Scholar] [CrossRef]
  11. United Nations Environment Programme. Global Waste Management Outlook 2024: Beyond an Age of Waste—Turning Rubbish into a Resource. Nairobi. 2024. Available online: https://wedocs.unep.org/20.500.11822/44939 (accessed on 26 January 2024).
  12. O’Connor, J.; Hoang, S.A.; Bradney, L.; Dutta, S.; Xiong, X.; Tsang, D.C.W.; Ramadass, K.; Vinu, A.; Kirkham, M.B.; Bolan, N.S. A review on the valorisation of food waste as a nutrient source and soil amendment. Environ. Pollut. 2021, 272, 115985. [Google Scholar] [CrossRef] [PubMed]
  13. Bünemann, E.K.; Reimer, M.; Smolders, E.; Smith, S.; Bigalge, M.; Palmqvist, A.; Brandt, K.K.; Möller, K.; Harder, R.; Hermann, L.; et al. Do contaminants compromise the use of recycled nutrients in organic agriculture? A review and synthesis of current knowledge on contaminant oncentrations, fate in the environment and risk assessment. Sci. Total Environ. 2024, 912, 168901. [Google Scholar] [CrossRef] [PubMed]
  14. Möller, K.; Oberson, A.; Bünemann, E.K.; Cooper, J.; Friedel, J.K.; Glæsnerk, N.; Hörtenhuber, S.; Løes, A.K.; Mäder, P.; Meyer, G.; et al. Improved Phosphorus Recycling in Organic Farming: Navigating Between Constraints. Adv. Agron. 2018, 147, 159–237. [Google Scholar] [CrossRef]
  15. Lohri, C.R.; Diener, S.; Zabaleta, I.; Mertenat, A.; Zurbrügg, C. Treatment technologies for urban solid biowaste to create value products: A review with focus on low- and middle-income settings. Rev. Environ. Sci. Biotechnol. 2017, 16, 81–130. [Google Scholar] [CrossRef]
  16. Cao, X.; Williams, P.N.; Zhan, Y.; Scott, A.; Coughlin, S.A.; McGrath, J.W.; Chin, J.P.; Xu, Y. Municipal solid waste compost: Global trends and biogeochemical cycling. Soil Environ. Health 2023, 1, 100038. [Google Scholar] [CrossRef]
  17. Lehmann, J.; Joseph, S. Biochar for Environmental Management: Science, Technology and Implementation, 2nd ed.; Routledge: London, UK, 2015. [Google Scholar] [CrossRef]
  18. Chen, C.R.; Phillips, I.R.; Condron, L.M.; Goloran, J.; Xu, Z.H.; Chan, K.Y. Impacts of greenwaste biochar on ammonia volatilization from bauxite processing residue sand. Plant Soil 2013, 367, 301–312. [Google Scholar] [CrossRef]
  19. Elkhalifa, S.; Al-Ansari, T.; Mackey, H.R.; McKay, G. Food waste to biochars through pyrolysis: A review. Resour. Conserv. Recycl. 2019, 144, 310–320. [Google Scholar] [CrossRef]
  20. Kumar, V.K.; Panwar, N.L. Pyrolysis technologies for biochar production in waste management: A review. Clean Energy 2024, 4, 61–78. [Google Scholar] [CrossRef]
  21. Joseph, S.; Cowie, A.C.; Van Zwieten, L.; Bolan, N.; Budai, A.; Buss, W.; Cayuela, M.L.; Graber, E.R.; James, A.; Ippolito, J.A.; et al. How biochar works, and when it doesn’t: A review of mechanisms controlling soil and plant responses to biochar. GCB Bioenergy 2021, 13, 1731–1764. [Google Scholar] [CrossRef]
  22. Diacono, M.; Montemurro, F. Long-term effects of organic amendments on soil fertility. A review. Agron. Sustain. Dev. 2010, 30, 401–422. [Google Scholar] [CrossRef]
  23. Reeve, J.R.; Endelman, J.B.; Miller, B.E.; Hole, D.J. Residual Effects of Compost on Soil Quality and Dryland Wheat Yield Sixteen Years after Compost Application. Soil Sci. Soc. Am. 2011, 76, 278–285. [Google Scholar] [CrossRef]
  24. Adugna, G. A review on impact of compost on soil properties, water use and crop productivity. Acad. Res. J. Agric. Sci. Res. 2016, 4, 93–104. [Google Scholar] [CrossRef]
  25. Sayara, T.; Basheer-Salimia, R.; Hawamde, F.; Sánchez, A. Recycling of Organic Wastes through Composting: Process Performance and Compost Application in Agriculture. Agronomy 2020, 10, 1838. [Google Scholar] [CrossRef]
  26. Kranz, C.N.; McLaughlin, R.A.; Johnson, A.; Miller, M.; Heitman, J.H. The effects of compost incorporation on soil physical properties in urban soils—A concise review. J. Environ. Manag. 2020, 261, 110209. [Google Scholar] [CrossRef]
  27. Nkoa, R. Agricultural Benefits and Environmental Risks of Soil Fertilization with Anaerobic Digestates: A Review. Agron. Sustain. Dev. 2014, 34, 473–492. [Google Scholar] [CrossRef]
  28. Lehmann, J.; Rillig, M.C.; Thies, J.; Masiello, C.A.; Hockaday, W.C.; Crowley, D. Biochar effects on soil biota e A review. Soil Biol. Biochem. 2011, 43, 1812–1836. [Google Scholar] [CrossRef]
  29. Agegnehu, G.; Bass, A.M.; Nelson, P.N.; Muirhead, B.; Wright, G.; Bird, M.I. Biochar and biochar-compost as soil amendments: Effects on peanut yield, soil properties and greenhouse gas emissions in tropical North Queensland, Australia. Agric. Ecosyst. Environ. 2015, 213, 72–85. [Google Scholar] [CrossRef]
  30. Schmidt, H.P.; Pandit, B.H.; Cornelissen, G.; Kammann, C.I. Biochar-Based Fertilization with Liquid Nutrient Enrichment: 21 Field Trials Covering 13 Crop Species in Nepal. Land Degrad. Dev. 2017, 28, 2324–2342. [Google Scholar] [CrossRef]
  31. Beesley, L.; Moreno-Jiménez, E.; Gomez-Eyles, J.L. Effects of biochar and green waste compost amendments on mobility, bioavailability and toxicity of inorganic and organic contaminants in a multi-element contaminated soil. Environ. Pollut. 2010, 158, 2282–2287. [Google Scholar] [CrossRef]
  32. Palansooriya, K.N.; Shaheen, S.M.; Chen, S.S.; Tsang, D.C.W.; Hashimoto, Y.; Hou, D.; Bolan, N.S.; Rinklebe, J.; Ok, Y.S. Soil amendments for immobilization of potentially toxic elements in contaminated soils: A critical review. Environ. Int. 2020, 134, 105046. [Google Scholar] [CrossRef]
  33. Hazratqulov, S.; von Ahlefeldt, G.; Liu, R.; Bessler, H.; Almuina-Villar, H.; Dieguez-Alonso, A.; Engels, C. Processing Municipal Waste for Phytostabilization of Heavy Metal Contaminated Soils. Soil Syst. 2024, 8, 109. [Google Scholar] [CrossRef]
  34. Laird, D.A.; Fleming, F.; Davis, D.D.; Horton, R.; Wang, B.; Karlen, D.L. Impact of biochar amendments on the quality of a typical Midwestern agricultural soil. Geoderma 2010, 158, 443–449. [Google Scholar] [CrossRef]
  35. Nguyen, T.T.N.; Xu, C.Y.; Tahmasbian, I.; Che, R.; Xu, Z.; Zhou, X.; Wallace, H.M.; Bai, S.H. Effects of biochar onsoil available inorganic nitrogen: A review and meta-analysis. Geoderma 2017, 288, 79–96. [Google Scholar] [CrossRef]
  36. Kratz, S.; Vogel, C.; Adam, C. Agronomic performance of P recycling fertilizers and methods to predict it: A review. Nutr. Cycl. Agroecosyst. 2019, 115, 1–39. [Google Scholar] [CrossRef]
  37. Christiansen, N.H.; Sørensen, P.; Labouriau, R.; Christensen, B.T.; Rubæk, G.H. Characterizing phosphorus availability in waste products by chemical extractions and plant uptake. J. Plant Nutr. Soil Sci. 2020, 183, 416–428. [Google Scholar] [CrossRef]
  38. Duboc, O.; Hernandez-Mora, A.; Wenzel, W.W.; Santner, J. Improving the prediction of fertilizer phosphorus availability to plants with simple, but non-standardized extraction techniques. Sci. Total Environ. 2022, 806, 150486. [Google Scholar] [CrossRef] [PubMed]
  39. Cabeza, R.; Steingrobe, B.; Römer, W.; Claassen, N. Effectiveness of recycled P products as P fertilizers, as evaluated in pot experiments. Nutr. Cycl. Agroecosyst. 2011, 91, 173–184. [Google Scholar] [CrossRef]
  40. Hamilton, H.A.; Brod, E.; Hanserud, O.; Müller, D.B.; Brattebø, H.; Haraldsen, T.K. Recycling potential of secondary phosphorus resources as assessed by integrating substance flow analysis and plant-availability. Sci. Total Environ. 2016, 575, 1546–1555. [Google Scholar] [CrossRef]
  41. Sinaj, S.; Traore, O.; Frossard, E. Effect of compost and soil properties on the availability of compost phosphate for white clover (Trifolium repens L.). Nutr. Cycl. Agroecosyst. 2002, 62, 89–102. [Google Scholar] [CrossRef]
  42. Debicka, M.; Jamroz, E.; Bekier, J.; Cwielag-Piasecka, I.; Kocowicz, A. The Influence of Municipal Solid Waste Compost on the Tranformations of Phosphorus Forms in Soil. Agronomy 2023, 13, 1234. [Google Scholar] [CrossRef]
  43. Möller, K.; Müller, T. Effects of anaerobic digestion on digestate nutrient availability and crop growth: A review. Eng. Life Sci. 2012, 3, 242–257. [Google Scholar] [CrossRef]
  44. Bachmann, S.; Uptmoor, R.; Eichler-Löbermann, B. Phosphorus distribution and availability in untreated and mechanically separated biogas digestates. Sci. Agric. 2016, 73, 9–17. [Google Scholar] [CrossRef]
  45. Biederman, L.; Harpole, S. Biochar and its effects on plant productivity and nutrient cycling: A meta-analysis. GCB Bioenergy 2013, 5, 202–214. [Google Scholar] [CrossRef]
  46. Glaser, B.; Lehr, V.I. Biochar effects on phosphorus availability in agricultural soils: A meta-analysis. Sci. Rep. 2019, 9, 9338. [Google Scholar] [CrossRef]
  47. Tesfaye, F.; Liu, X.; Zheng, J.; Cheng, K.; Bian, R.; Zhang, X.; Li, L.; Drosos, M.; Joseph, S.; Pan, G. Could biochar amendment be a tool to improve soil availability and plant uptake of phosphorus? A meta-analysis of published experiments. Environ. Sci. Pollut. Res. Int. 2021, 28, 34108–34120. [Google Scholar] [CrossRef]
  48. Penn, C.J.; Camberato, J.J. A Critical Review on Soil Chemical Processes that Control How Soil pH Affects Phosphorus Availability to Plants. Agriculture 2019, 9, 120. [Google Scholar] [CrossRef]
  49. Barrow, N.J.; Campbell, N.A. Methods of measuring residual value of fertilizers. Aust. J. Exp. Agric. 1972, 12, 502–510. [Google Scholar] [CrossRef]
  50. VDLUFA (Ed.) Methode A 5.1.1. Bestimmung des pH-Wertes. In Handbuch der Landwirtschaftlichen Versuchs- und Untersuchungsmethodik (VDLUFA-Methodenbuch), Bd. I Die Untersuchung von Böden; VDLUFA: Paderborn, Germany, 2016. [Google Scholar]
  51. Schüller, H. Die CAL-Methode, eine neue Methode zur Bestimmung des pflanzenverfügbaren Phosphates in Böden. Z. Pflanzenernähr. Bodenkd. 1969, 123, 48–63. [Google Scholar] [CrossRef]
  52. VDLUFA (Ed.) Methode A 6.2.1.1 Bestimmung von Phosphor und Kalium im Calcium-Acetat-Lactat-Auszug. In Handbuch der Landwirtschaftlichen Versuchs- und Untersuchungsmethodik (VDLUFA-Methodenbuch), Bd. I Die Untersuchung von Böden; VDLUFA: Paderborn, Germany, 2012. [Google Scholar]
  53. Hanson, W.C. The photometric determination of phosphorus in fertilizers using the phosphovanado–molybdate complex. J. Sci. Food. Agric. 1950, 1, 172–173. [Google Scholar] [CrossRef]
  54. Jones, E.; Harden, S.; Crawley, M.J. The R Book; John Wiley & Sons: Hoboken, NJ, USA, 2022. [Google Scholar]
  55. Smith, G.S.; Cornforth, I.C.; Henderson, H.V. Critical Leaf Concentrations for Deficiencies of Nitrogen, Potassium, Phosphorus, Sulphur, and Magnesium in Perennial Ryegrass. New Phytol. 1985, 101, 393–409. [Google Scholar] [CrossRef]
  56. Wei, Y.; Zhao, Y.; Xi, B.; Wei, Z.; Li, X.; Cao, Z. Changes in phosphorus fractions during organic wastes composting from different sources. Bioresour. Technol. 2015, 189, 349–356. [Google Scholar] [CrossRef]
  57. Zornoza, R.; Moreno-Barriga, F.; Acosta, J.A.; Muñoz, M.A.; Faz, A. Stability, nutrient availability and hydrophobicity of biochars derived from manure, crop residues, and municipal solid waste for their use as soil amendments. Chemosphere 2016, 144, 122–130. [Google Scholar] [CrossRef]
  58. Ippolito, J.A.; Cui, L.; Kammann, C.; Wrage-Mönnig, N.; Estavillo, J.M.; Fuertes-Mendizabal, T.; Cayuela, M.L.; Sigua, G.; Novak, J.; Spokas, K.; et al. Feedstock choice, pyrolysis temperature and type influence biochar characteristics: A comprehensive meta-data analysis review. Biochar 2020, 2, 421–438. [Google Scholar] [CrossRef]
  59. Yang, C.; Lu, S. Pyrolysis temperature affects phosphorus availability of rice straw and canola stalk biochars and biochar-amended soils. J. Soils Sediments 2021, 21, 2817–2830. [Google Scholar] [CrossRef]
  60. DeLuca, T.H.; Gundale, M.J.; MacKenzie, M.D.; Gao, S.; Jones, D.L. Biochar effects on soil nutrient transformations. In Biochar for Environmental Management: Science, Technology and Implementation, 3rd ed.; Earthscan Publication: London, UK; New York, NY, USA, 2024; pp. 401–440. [Google Scholar]
  61. Xie, S.; Tran, H.T.; Pu, M.; Zhang, T. Transformation characteristics of organic matter and phosphorus in composting processes of agricultural organic waste: Research trends. Mater. Sci. Energy Technol. 2023, 6, 331–342. [Google Scholar] [CrossRef]
  62. Guo, T.; Zhang, S.; Song, C.; Zhao, R.; Jia, L.; Wei, Z. Response of phosphorus fractions transformation and microbial community to carbon-to-phosphorus ratios during sludge composting. J. Environ. Manag. 2024, 360, 121145. [Google Scholar] [CrossRef] [PubMed]
  63. Bruun, S.; Harmer, S.L.; Bekiaris, G.; Christel, W.; Zuin, L.; Hu, Y.; Jensen, L.S.; Lombi, E. The effect of different pyrolysis temperatures on the speciation and availability in soil of P in biochar produced from the solid fraction of manure. Chemosphere 2017, 169, 377–386. [Google Scholar] [CrossRef]
  64. Knijnenburg, J.T.N.; Suwanree, S.; Macquarrie, D.; Kasemsiri, P.; Jetsrisuparb, K. Phosphorus recovery from animal manures through pyrolysis: Phosphorus transformations, release mechanisms, and applications of manure biochars in agriculture. RSC Sustain. 2024, 3, 1084–1101. [Google Scholar] [CrossRef]
  65. Buss, W.; Bogush, A.; Ignatyev, K.; Mašek, O. Unlocking the Fertilizer Potential of Waste-Derived Biochar ACS Sustain. Chem. Eng. 2020, 8, 12295–12303. [Google Scholar] [CrossRef]
  66. Wang, T.; Camps-Arbestain, M.; Hedley, M.; Bishop, P. Predicting phosphorus bioavailability from high-ash Biochars. Plant Soil 2012, 357, 173–187. [Google Scholar] [CrossRef]
  67. Xu, G.; Zhang, Y.; Shao, H.; Sun, J. Pyrolysis temperature affects phosphorus transformation in biochar: Chemical fractionation and 31P NMR analysis. Sci. Total Environ. 2016, 569–570, 65–72. [Google Scholar] [CrossRef]
  68. Buss, W.; Wurzer, C.; Manning, D.A.C.; Rohling, E.J.; Borevitz, J.; Mašek, O. Mineral-enriched biochar delivers enhanced nutrient recovery and carbon dioxide removal. Commun. Earth Environ. 2022, 3, 67. [Google Scholar] [CrossRef]
  69. Liu, T.; Shao, T.; Jiang, J.; Ma, W.; Feng, R.; Dong, D.; Wang, Y.; Bai, T.; Xu, Y. Influence of potassium addition on phosphorus availability and heavy metals immobility of biochar derived from swine manure. Sci. Rep. 2024, 14, 21069. [Google Scholar] [CrossRef]
  70. Brod, E.; Øgaard, A.F.; Hansen, E.; Wragg, D.; Haraldsen, T.K.; Krogstad, T. Waste products as alternative phosphorus fertilisers Part I: Inorganic P species affect fertilisation effects depending on soil pH. Nutr. Cycl. Agroecosyst. 2015, 103, 167–185. [Google Scholar] [CrossRef]
  71. Tuszynska, A.; Czerwionka, K.; Obarska-Pempkowiak, H. Phosphorus concentration and availability in raw organic waste and post fermentation products. J. Environ. Manag. 2021, 278, 111468. [Google Scholar] [CrossRef] [PubMed]
  72. Mazzini, S.; Borgonova, G.; Scaglioni, L.; Bedussi, F.; D’Imparzano, G.; Tambone, F.; Adani, F. Phosphorus speciation during anaerobic digestion and subsequent solid/liquid separation. Sci. Total Environ. 2020, 734, 139784. [Google Scholar] [CrossRef] [PubMed]
  73. Sundberg, C.; Jönsson, H. Higher pH and faster decomposition in biowaste composting by increased aeration. Waste Manag. 2008, 28, 518–526. [Google Scholar] [CrossRef]
  74. Azim, K.; Soudi, B.; Boukhari, S.; Perissol, C.; Roussos, S.; Thami Alami, I. Composting parameters and compost quality: A literature review. Org. Agric. 2018, 8, 141–158. [Google Scholar] [CrossRef]
  75. Gao, S.; DeLuca, T.H.; Cleveland, C.C. Biochar additions alter phosphorus and nitrogen availability in agricultural ecosystems: A meta-analysis. Sci. Total Environ. 2019, 654, 463–472. [Google Scholar] [CrossRef]
  76. He, Z.L.; Yang, X.; Yuan, K.N.; Zhu, Z.X. Desorption and plant-availability of phosphate sorbed by some important minerals. Plant Soil 1994, 162, 89–97. [Google Scholar] [CrossRef]
  77. Menezes-Blackburn, D.; Zhang, H.; Stutter, M.; Giles, C.D.; Darch, T.; George, T.S.; Shand, C.; Lumsdon, D.; Blackwell, M.; Wearing, C.; et al. A holistic approach to understanding the desorption of phosphorus in soils. Environ. Sci. Technol. 2016, 50, 3371–3381. [Google Scholar] [CrossRef]
  78. Shiralipour, A.; McConnell, D.B.; Smith, W.H. Physical and chemical properties of soils as affected by municipal solid waste compost application. Biomass Bioenergy 1992, 3, 261–266. [Google Scholar] [CrossRef]
  79. Gul, S.; Whalen, J.K.; Thomas, B.W.; Sachdeva, V.; Deng, H. Physico-chemical properties and microbial responses in biochar-amended soils: Mechanisms and future directions. Agric. Ecosyst. Environ. 2015, 206, 46–59. [Google Scholar] [CrossRef]
  80. Vaneeckhaute, C.; Janda, J.; Vanrolleghem, P.A.; Tack, F.M.G.; Meers, E. Phosphorus Use Efficiency of Bio-Based Fertilizers: Bioavailability and Fractionation. Pedosphere 2016, 26, 310–325. [Google Scholar] [CrossRef]
  81. Sarvi, M.; Hagner, M.; Velmala, S.; Soinne, H.; Uusitalo, R.; Keskinen, R.; Ylivainio, K.; Kaseva, J.; Rasa, K. Bioavailability of phosphorus in granulated and pyrolyzed broiler manure. Environ. Technol. Innov. 2021, 23, 101584. [Google Scholar] [CrossRef]
  82. Shi, W.; Healy, M.G.; Ashekuzzaman, S.M.; Daly, K.; Fenton, O. Mineral fertiliser equivalent value of dairy processing sludge and derived biochar using ryegrass (Lolium perenne L.) and spring wheat (Triticum aestivum). J. Environ. Manag. 2022, 321, 116012. [Google Scholar] [CrossRef] [PubMed]
  83. Shen, P.; Murphy, D.V.; George, S.J.; Lapis-Gaza, H.; Xu, M.; Gleeson, D.B. Increasing the Size of the Microbial Biomass Altered Bacterial Community Structure which Enhances Plant Phosphorus Uptake. PLoS ONE 2016, 11, e0166062. [Google Scholar] [CrossRef]
  84. Alori, E.T.; Glick, B.R.; Babalola, O.O. Microbial Phosphorus Solubilization and Its Potential for Use in Sustainable Agriculture. Front. Microbiol. 2017, 8, 971. [Google Scholar] [CrossRef]
  85. Xiang, Y.; Deng, Q.; Duan, H.; Guo, Y. Effects of biochar application on root traits: A meta-analysis. GCB Bioenergy 2017, 9, 1563–1572. [Google Scholar] [CrossRef]
  86. Omondi, M.O.; Xia, X.; Nahayo, A.; Liu, X.; Korai, P.K.; Pan, G. Quantification of biochar effects on soil hydrological properties using meta-analysis of literature data. Geoderma 2016, 274, 28–34. [Google Scholar] [CrossRef]
  87. Razzaghi, F.; Obour, P.B.; Arthur, E. Does biochar improve soil water retention? A systematic review and meta-analysis. Geoderma 2020, 361, 114055. [Google Scholar] [CrossRef]
  88. Gagnon, B.; Isabelle, D.; Noura, Z.; Martin, H.C.; Léon-Étienne, P.; Tom, A.F.; Francis, J.F.; Katherine, E.B. Forms of phosphorus in composts and in compost-amended soils following incubation. Can. J. Soil Sci. 2012, 92, 711–721. [Google Scholar] [CrossRef]
  89. Honvault, N.; Faucon, M.P.; McLaren, T.; Houben, D.; Frossard, E.; Oberson, A. Influence of cover crop residue traits on phosphorus availability and subsequent uptake by plants. Nutr. Cycl. Agroecosyst. 2024, 128, 131–148. [Google Scholar] [CrossRef]
  90. Brod, E.; Øgaard, A.F.; Krogstad, T.; Haraldsen, T.K.; Frossard, E.; Oberson, A. Drivers of Phosphorus Uptake by Barley Following Secondary Resource Application. Front. Nutr. 2016, 3, 12. [Google Scholar] [CrossRef] [PubMed]
  91. Grigatti, M.; Boanini, E.; Mancarella, S.; Simoni, A.; Centemero, M.; Veeken, A.H.M. Phosphorous extractability and ryegrass availability from bio-waste composts in a calcareous soil. Chemosphere 2017, 174, 722–731. [Google Scholar] [CrossRef] [PubMed]
  92. Grigatti, M.; Boanini, E.; Cavani, L.; Ciavatta, C.; Marzadori, C. Phosphorus in Digestate-Based Compost: Chemical Speciation and Plant-Availability. Waste Biomass Valorization 2015, 6, 481–493. [Google Scholar] [CrossRef]
  93. Brod, E.; Øgaard, A.F.; Haraldsen, T.K.; Krogstad, T. Waste products as alternative phosphorus fertilisers part II: Predicting P fertilisation effects by chemical extraction. Nutr. Cycl. Agroecosyst. 2015, 103, 187–199. [Google Scholar] [CrossRef]
  94. Delin, S. Fertilizer value of phosphorus in different residues. Soil Use Manag. 2016, 32, 17–26. [Google Scholar] [CrossRef]
  95. Johnston, A.E.; Poulton, P.R.; Fixen, P.E.; Curtin, D. Phosphorus: Its efficient use in agriculture. Adv. Agron. 2014, 123, 177–228. [Google Scholar] [CrossRef]
  96. Achat, D.L.; Sperandio, M.; Daumer, M.L.; Santellani, A.C.; Prud’Homme, L.; Akhtar, M.; Morel, M. Plant-availability of phosphorus recycled from pig manures and dairy effluents as assessed by isotopic labeling techniques. Geoderma 2014, 232–234, 24–33. [Google Scholar] [CrossRef]
  97. Oberson, A.; Tagmann, H.U.; Langmeier, M.; Dubois, D.; Mäder, P.; Frossard, E. Fresh and residual phosphorus uptake by ryegrass from soils with different fertilization histories. Plant Soil 2010, 334, 391–407. [Google Scholar] [CrossRef]
  98. Marschner, P.; Crowley, D.; Rengel, Z. Rhizosphere interactions between microorganisms and plants govern iron and phosphorus acquisition along the root axis—Model and research methods. Soil Biol. Biochem. 2011, 43, 883–894. [Google Scholar] [CrossRef]
  99. Hinsinger, P. Bioavailability of soil inorganic P in the rhizosphere as affected by root-induced chemical changes: A review. Plant Soil 2001, 237, 173–195. [Google Scholar] [CrossRef]
  100. Shen, J.; Yuan, L.; Zhang, J.; Li, H.; Bai, Z.; Chen, X.; Zhang, W.; Zhang, F. Phosphorus dynamics: From soil to plant. Plant Physiol. 2011, 156, 997–1005. [Google Scholar] [CrossRef]
  101. Richardson, A.E.; Lynch, J.P.; Ryan, P.R.; Delhaize, E.; Smith, F.A.; Smith, S.E.; Harvey, P.R.; Ryan, M.H.; Veneklaas, E.J.; Lambers, H.; et al. Plant and microbial strategies to improve the phosphorus efficiency of agriculture. Plant Soil 2011, 349, 121–156. [Google Scholar] [CrossRef]
  102. Lambers, H. Phosphorus acquisition and utilization in plants. Annu. Rev. Plant Biol. 2022, 73, 17–42. [Google Scholar] [CrossRef]
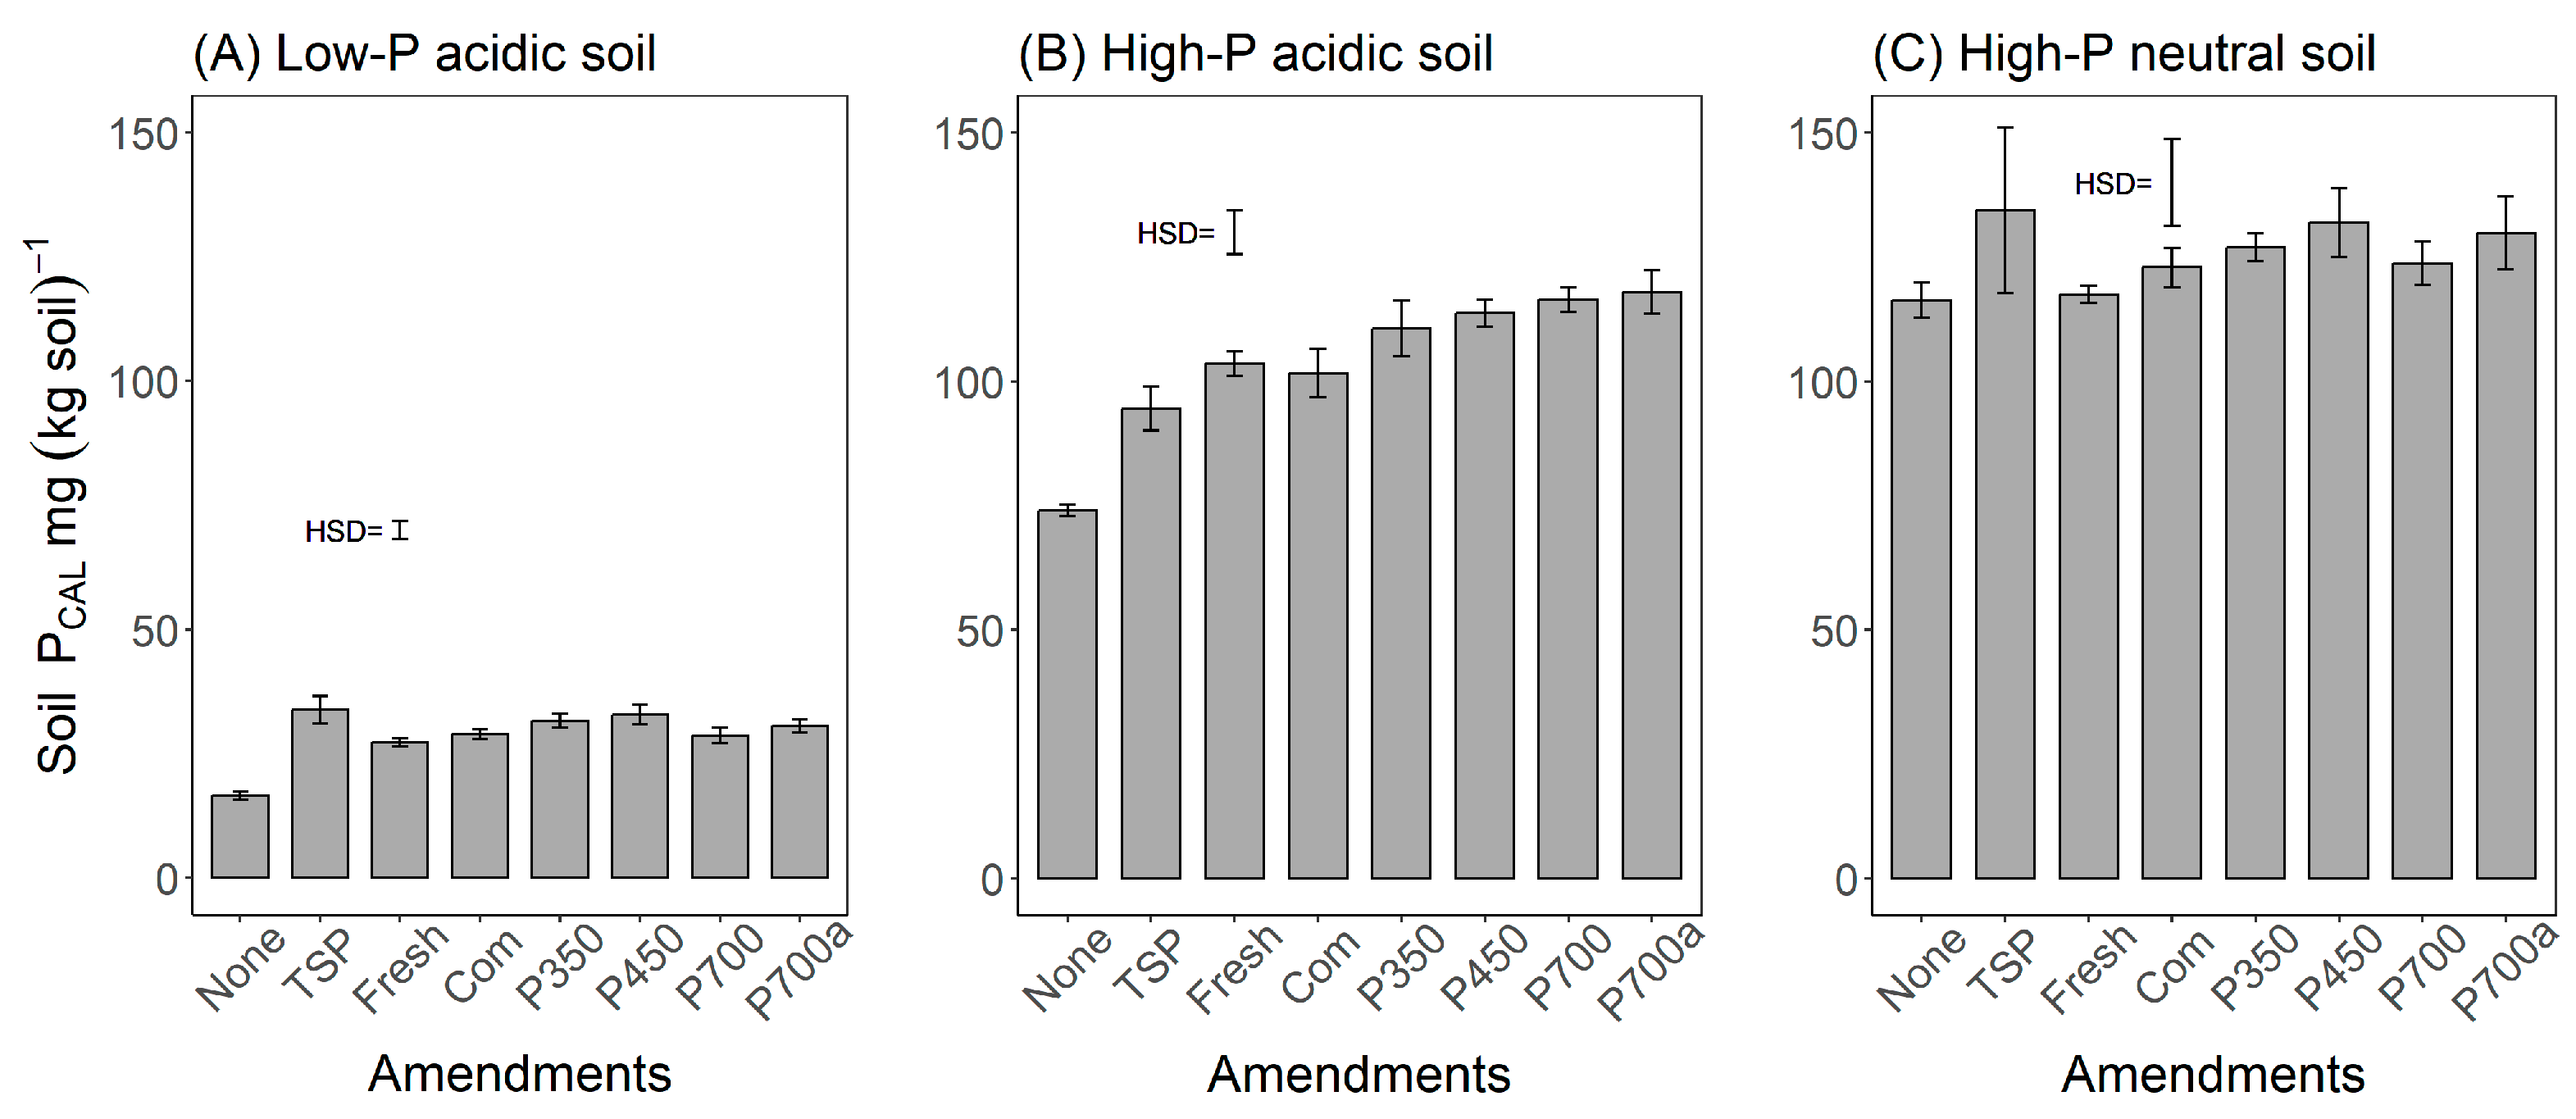
Figure 1. Effect of the amendments on soil PCAL concentration in three different soils; none—soil without amendment; means ± standard deviation, n = 16 from the measurements after 1, 7, 30 and 100 incubation days; HSD values for p ≤ 0.05.
Agronomy 15 02296 g001
Figure 2. Relationships between soil pH and soil PCAL concentration in low-P acidic soil (A) and high-P acidic soil (B); soil pH is varied by adding different amounts of KOH (1 to 10 mL 0.5 M KOH (100 g soil)−1).
Agronomy 15 02296 g002
Figure 3. Effect of the fertilizer variants on the amendment-induced pH-related (APIpHrel.) and pH-adjusted (APIpHadj.) soil PCAL concentration increase in the low-P acidic soil (A) and the high-P acidic soil (B); means ± standard deviation, of 4 measurements after 1, 7, 30, 100 incubation days; HSD values for p ≤ 0.05.
Agronomy 15 02296 g003
Figure 4. Effect of the fertilizer variant on shoot growth rate of ryegrass: (A) organic amendments derived from green waste, (B) organic amendments derived from biowaste; means ± standard deviation, n = 5. Vertical lines show HSD values for p ≤ 0.05.
Agronomy 15 02296 g004
Figure 5. Time course of P uptake rates with different fertilizer variants; means ± standard deviation, n = 5. Vertical lines show HSD values for p ≤ 0.05.
Agronomy 15 02296 g005
Figure 6. Time course of the mineral fertilizer equivalents (MFEs) for fertilizer variants: (A) organic amendments derived from green waste; (B) organic amendments derived from biowaste; means ± standard deviation, n = 5. Vertical lines show HSD values for p ≤ 0.05.
Agronomy 15 02296 g006
Table 1. Properties of the soils used in the incubation experiment and the pot experiment (only low-P acidic soil is used in the pot experiment); means ± standard deviation, n = 3. Ptotal—total phosphorus, PCAL—calcium acetate lactate soluble phosphorus.
SoilsPtotal, g (kg Soil)−1PCAL, g (kg Soil)−1pH
Low-P acidic soil 0.56 ± 0.0020.018 ± 0.0015.26 ± 0.04
High-P acidic soil 0.91 ± 0.0040.079 ± 0.0045.64 ± 0.07
High-P neutral soil 1.90 ± 0.0160.113 ± 0.0107.32 ± 0.09
Table 2. Overview of the biowaste (BW) and green waste (GW) treatments and abbreviations used in this study.
Treatment of Municipal WasteAbbreviation
No further treatmentFresh_BWFresh_GW
CompostingCom_BWCom_GW
Pyrolysis at 350 °CP350_BWP350_GW
Pyrolysis at 450 °CP450_BWP450_GW
Pyrolysis at 700 °CP700_BWP700_GW
Pyrolysis at 700 °C, modified atmospheric conditionsP700a_BWP700a_GW
Anaerobic digestion for biogas production, solid residueFRsolid_BW
Anaerobic digestion for biogas production, fluid residueFRfluid_BW
Table 3. Effect of processing on total P (Ptotal) and calcium acetate lactate soluble P (PCAL) and pH of the amendments derived from green waste (A) and biowaste (B); means ± standard deviation, n = 3. Different lowercase letters indicate significant differences (p < 0.05) between amendments derived from one feedstock.
ProcessingPtotal PCALPCALpH
g (kg DM)−1g (kg DM)−1% of Total P
(A) Green waste-derived amendments
Fresh1.0 ± 0.1 c0.43 ± 0.01 c41 ± 3 a5.4 ± 0.02 f
Com2.1 ± 0.3 b0.57 ± 0.02 b27 ± 3 b7.1 ± 0.01 e
P3502.1 ± 0.1 b0.86 ± 0.02 a42 ± 3 a7.7 ± 0.04 d
P4502.0 ± 0.1 b0.88 ± 0.01 a44 ± 2 a8.8 ± 0.06 c
P7002.7 ± 0.1 a0.46 ± 0.03 c17 ± 1 c12.4 ± 0.01 a
P700a3.1 ± 0.2 a0.45 ± 0.02 c15 ± 1 c11.4 ± 0.01 b
(B) Biowaste-derived amendments
Fresh2.2 ± 0.1 c1.02 ± 0.04 c46 ± 3 ab4.9 ± 0.01 h
Com3.3 ± 0.3 bc0. 98 ± 0.06 c30 ± 5 bc7.5 ± 0.06 e
P3504.0 ± 0.3 abc1.07 ± 0.03 bc27 ± 2 cd8.6 ± 0.02 d
P4504.9 ± 0.2 ab1.27 ± 0.02 b26 ± 2 cd9.1 ± 0.02 c
P7004.5 ± 0.4 ab0.32 ± 0.01 d7 ± 1 e12.2 ± 0.02 a
P700a4.9 ± 0.1 ab0.53 ± 0.04 d11 ± 1 de11.2 ± 0.07 b
Fluid5.0 ± 0.8 a3.22 ± 0.17 a62 ± 3 a7.2 ± 0.11 f
Solid3.1 ± 1.4 bc1.17 ± 0.02 bc40 ± 1 bc7.0 ± 0.06 g
Table 4. p-values for the effects of the fertilizer variant on soil PCAL concentration (g kg−1 soil), amendment-induced PCAL increase (% applied P), soil pH after 100 incubation days and pH-adjusted PCAL increase (% applied P) in three soils.
Source of VariancePCAL ConcentrationAmendment-Ind. PCAL Increase (API)Soil pHpH-Adjusted PCAL Increase (APIpHadj.)
    Low-P acidic soil
Fertilizer variant<0.001<0.001<0.001<0.001
    High-P acidic soil
Fertilizer variant<0.001<0.001<0.001<0.001
    High-P neutral soil
Fertilizer variant0.0790.046<0.001
Table 5. p-values for the effects of processing and feedstock on shoot growth rate (mg day−1). For the two-way ANOVA, fermentation residues are excluded because data are available for biowaste only.
SourceGrowth Periods
12345678
  • (a) Green waste (one-way ANOVA)
Processing<0.0010.0180.0190.259<0.001<0.001<0.0010.016
  • (b) Biowaste (one-way ANOVA)
Processing<0.0010.0420.0750.0130.0060.0300.7340.778
  • (c) Green waste and biowaste (two-way ANOVA)
Feedstock (FS)0.1560.8380.6420.5200.0720.0090.0090.265
Processing<0.0010.0760.0130.020<0.001<0.001<0.0010.007
FS × Processing0.9390.0680.3260.360<0.0010.01490.0020.085
Table 6. p-values for the effects of processing and feedstock on the P uptake rate in different growth periods and the mean P uptake rate for the 8 growth periods. For the two-way ANOVA, fermentation residues are excluded because data are available for biowaste only.
SourceGrowth Period
12345678Mean
  •  (a) Green waste (one-way ANOVA)
Processing<0.0010.001<0.001<0.001<0.001<0.001<0.0010.013<0.001
  •  (b) Biowaste (one-way ANOVA)
Processing<0.001<0.0010.005<0.001<0.0010.5890.7770.513<0.001
  •  (c) Green waste and biowaste (two-way ANOVA)
Feedstock 0.1010.8420.0060.2270.5740.0930.1240.1880.647
Processing<0.0010.112<0.001<0.001<0.001<0.0010.0020.004<0.001
FS × Processing0.121<0.0010.008<0.001<0.0010.0180.0010.066<0.001
Disclaimer/Publisher’s Note: The statements, opinions and data contained in all publications are solely those of the individual author(s) and contributor(s) and not of MDPI and/or the editor(s). MDPI and/or the editor(s) disclaim responsibility for any injury to people or property resulting from any ideas, methods, instructions or products referred to in the content.