Article

Effects of Fish Pond Sediment on Quality of Saline–Alkali Soil and Some Vegetables: Water Spinach, Lettuce, and Chili

1
College of Resources and Environmental Sciences, Nanjing Agricultural University, Nanjing 210095, China
2
Jiangsu Rainfine Environmental Science and Technology Company Limited, Nanjing 210009, China
3
College of Agricultural Science and Engineering, Hohai University, Nanjing 211100, China
4
Department of Biological Systems Engineering, University of Nebraska-Lincoln, Lincoln, NE 68583, USA
*
Author to whom correspondence should be addressed.
Agronomy 2025, 15(7), 1670; https://doi.org/10.3390/agronomy15071670
Submission received: 15 June 2025 / Revised: 6 July 2025 / Accepted: 8 July 2025 / Published: 10 July 2025

Abstract

With the rapid expansion of the aquaculture scale, the environmental pollution caused by the accumulation of fish pond sediment (FPS) has become increasingly prominent, making it urgent to establish sustainable resource utilization solutions. This study investigates the potential of using FPS as a soil amendment to improve saline–alkali soil (SAS) quality and enhance vegetable growth, while also quantifying ecological benefits through Gross Ecosystem Product (GEP) accounting. A pot experiment was conducted to evaluate the effects of different FPS mass percentages (0%, 20%, 40%, 80%, and 100%) on the growth of three vegetables (water spinach, lettuce, and chili) and soil quality. The results demonstrated that FPS addition at ≥40% significantly improves SAS quality, reducing the pH and salinity (p < 0.05), while enhancing organic matter, nutrient availability, and microbial activity. Among the treatments, 80% FPS maximized vegetable yields, with water spinach achieving the highest edible biomass (37.32 g). Compared to the control, nutritional quality under ≥80% FPS treatment showed substantial increases: vitamin C (133.33–307.03%), soluble sugars (49.97–73.53%), and protein (26.14–48.08%). An economic analysis revealed that 80% FPS with water spinach cultivation generated peak ecological benefits (274,951 CNY·ha−1; 185% above control). These findings provide a scientific basis and effective model for the resource utilization of FPS and the improvement of saline–alkali soil, offering significant implications for the sustainable development of agriculture and environmental protection.

1. Introduction

Saline–alkali soils (SASs) represent a major contributor to global land degradation, characterized by excessive salinity, strong alkalinity, and a deteriorating soil structure, which collectively impair nutrient availability and water-holding capacity, thereby severely limiting agricultural productivity [1,2]. According to recent UN estimates, the worldwide extent of saline–alkali soils has reached approximately 1.13 billion hectares, with an annual expansion rate of 1–1.5 million hectares [3,4]. Coastal SASs are particularly problematic due to their extreme salinity levels and heightened ecological sensitivity, resulting in pronounced phytotoxic effects on crops and vegetables [2]. This degradation not only causes direct yield losses but also jeopardizes the long-term sustainability of arable land resources [1]. Consequently, developing effective strategies to ameliorate the physicochemical properties of saline–alkali soils and restore their agricultural potential is imperative for ensuring global food security and sustainable land management [5].
Parallel to the challenges of SAS, the global aquaculture industry has expanded rapidly in recent decades, primarily driven by declining wild fishery stocks and an increasing demand for animal protein [6]. Within this context, as the world’s largest aquaculture producer, China accounts for 38% of global aquatic production and 62% of farmed output during its 12th Five-Year Plan period (2011–2015) [7]. However, this growth has generated substantial sediment-management challenges, with an estimated annual production of 8.8 × 10⁷ tons of aquaculture sediment nationwide [7,8]. The direct discharge of untreated aquaculture effluents and pond sludge into aquatic systems may cause localized eutrophication, potentially triggering cascading ecological impacts [9]. Regarding current management practices, FPS is handled through in situ treatment (e.g., biochemical remediation) and ex situ approaches, such as dredging followed by landfill, incineration, or construction material production [10,11]. Among these, agricultural recycling has attracted particular attention due to its dual ecological and economic advantages.
Due to the large amount of feed fed to fish during aquaculture, a large amount of sediment rich in nitrogen, phosphorus, and organic carbon has accumulated at the bottom of the ponds [12]. These sediments, due to their rich organic matter, nutrients, and trace element components [13], complement the low nutrient content of saline–alkali soil, showing great potential as soil amendments. Empirical evidence confirms that FPS application enhances soil fertility by improving the nutrient supply, accelerating organic matter mineralization, and increasing microbial activity [12,14,15]. Especially, in the integrated aquaculture–agriculture system, FPS not only significantly enhances vegetable productivity but also realizes resource recycling [16,17], demonstrating its unique ecological and economic value.
In recent years, significant progress has been made in research on the resource utilization of FPS as a potential organic amendment, providing new solutions for sustainable agricultural development. Numerous studies have demonstrated the remarkable multiple benefits of FPS in improving soil quality and enhancing crop yields. For instance, Shyam et al. effectively addressed the issue of declining agricultural soil fertility by utilizing FPS through composting methods [15]. Brigham et al. found that the addition of 10–20% lake-dredged sediment significantly reduced the soil bulk density by 8–12%, increased the soil organic carbon content by 15–25%, and promoted soybean yields by 8–15% [17]. In integrated farming systems, Thi et al. observed that the application of striped catfish pond sediment significantly improved the cucumber yield [18]. Furthermore, Cheng et al. confirmed that the rational application of sediment in saline soils could improve rice nitrogen use efficiency by 40–45% [19]. Particularly noteworthy is the successful practice by Zhao et al. in northeastern China [12], where adjacent irrigation area sediment is used to ameliorate saline–alkali soils, achieving dual environmental benefits of “treating waste with waste” [12]. This is used to ameliorate saline–alkali soils, achieving the dual environmental benefits of “treating waste with waste”. These studies collectively demonstrate the tremendous potential of FPS as a high-quality soil amendment, particularly in significantly enhancing crop yields. Despite significant advancements in the utilization of FPS as an agricultural resource, particularly in staple crops such as rice [19] and soybean [17], substantial research gaps remain regarding its application in vegetable systems and the comprehensive quantification of its ecological benefits. While the agricultural value of FPS has been validated for major food crops, existing studies predominantly focus on the effects of soil amendments [17,20], often neglecting the broader ecosystem services, contrasting with the well-established assessment frameworks for analogous waste materials [21,22,23], such as river-dredged sediments and municipal sludge, which have comprehensive evaluation frameworks in place.
To address these gaps, three economical vegetables—water spinach (Ipomoea aquatica Forsk.), lettuce (Lactuca sativa L.), and chili (Capsicum annuum L.)—were selected in this study to systematically evaluate the effects of FPS on their growth, yield, and quality. A standardized benefit assessment framework was developed to quantify ecological benefits, thereby providing a theoretical foundation for establishing integrated aquaculture–agriculture systems in coastal saline–alkali lands. By establishing a systematic methodology for measuring ecosystem services, contributions are made to the broader goal of balancing environmental conservation with agricultural productivity, with actionable insights provided for coastal ecosystem management.
In this study, FPSs were innovatively incorporated into coastal saline–alkali soils at various ratios, with their impact on soil physicochemical properties and the growth of three representative vegetable species meticulously assessed. Ecological benefits associated with different FPS-application strategies were quantitatively analyzed using an ecosystem service assessment approach. It is hypothesized that FPS could effectively improve soil properties, enhance the vegetable yield and quality, and provide additional ecological benefits when combined with specific cropping and amendment strategies.

2. Materials and Methods

2.1. Site Description

The pot experiment was conducted from 5 July to 30 December 2021, in a greenhouse at the Water-Saving Park of Hohai University, Jiangning District, Nanjing, Jiangsu Province (32°03′ N, 118°46′ E). The region experiences a subtropical monsoon climate, characterized by an average annual temperature of 13–22 °C, which means annual precipitation of 1106.5 mm and relative humidity of 76%.

2.2. Experimental Materials

2.2.1. Test Plants

The test vegetables included the following: water spinach (Ipomoea aquatica cv. ‘Liuye Kongxincai’), lettuce (Lactuca sativa cv. ‘Dasu’), chili (Capsicum annuum cv. ‘DH-88’, provided by Nanjing Vegetable and Flower Research Institute, Nanjing, China).

2.2.2. Test Soil and Its Chemical and Physical Characteristics

The saline–alkali soil was collected from coastal tidal flats in Dafeng District, Yancheng City, Jiangsu Province (33.2481° N, 120.7702° E). FPS was obtained from aquaculture ponds in the Nanjing Modern Agricultural Industrial Park.
The chemical and physical characteristics of the experimental SAS and FPS are presented in Table 1. FPS exhibited higher total nutrient contents compared to the saline soil, suggesting its potential to improve soil fertility by supplying organic matter and essential nutrients.

2.2.3. Heavy Metal Concentrations of Test Soil

Heavy metal concentrations in both soil types were evaluated in accordance with China’s Risk Screening Values for Soil Contamination of Agricultural Land [24]. Two standard methods were employed:
(1)
Single Factor Index (Pi):
P i = C i S i
where
Pi = environmental quality index for pollutant i;
Ci = measured concentration of pollutant i (mg·kg−1);
Si = risk screening value for pollutant i (mg·kg−1).
(2)
Nemerow Integrated Pollution Index (Pₙ):
P n = P imax 2 + ( 1 / n P i ) 2 2
where
Pn = comprehensive pollution index;
Pi = single factor index for pollutant i;
Pimax = maximum Pi value among all pollutants;
Heavy metal concentrations and the nemerow integrated pollution index are presented in Table 2. All Pi values were <1, and Pn values were 0.45 (saline soil) and 0.41 (FPS), below the 0.7 threshold for a “clean” status (Table 2). Thus, the FPS met the safety standards for agricultural use.

2.3. Experimental Design

Five treatments were established based on different proportions of FPS mixed with SAS: CK (control), 100% SAS (mFPS/mSAS = 10:0); T1, 20% FPS + 80% SAS (mFPS/mSAS = 2:8); T2, 40% FPS + 60% SAS (mFPS/mSAS = 4:6); T3, 80% FPS + 20% SAS (mFPS/mSAS = 8:2); T4, 100% FPS (mFPS/mSAS = 0:10). Each treatment was replicated three times in a completely randomized design. Planting densities were as follows: water spinach, 6 plants per pot; lettuce, 4 plants per pot; chili, 1 plant per pot.
The pot experiment was conducted using polyethylene pots (30 cm diameter × 31 cm height) filled with 10 kg of air-dried, sieved SAS (0.30% salinity). Each pot received a basal fertilizer application of 12 g of compound fertilizer. The experiment was conducted in a greenhouse with controlled environmental conditions: temperature maintained at 25–30 °C, relative humidity at 50–60%, and complete rain protection with proper ventilation and wet curtain systems.
Growth parameters were monitored at 10-day intervals for water spinach and lettuce and approximately 15-day intervals for chili. At maturity, edible portions were harvested to determine the total yield, biomass, and quality parameters.

2.4. Vegetable Parameter Measurements

The plant height was determined from the base to the growth apex using a graduated ruler, while the stem diameter was measured 1–2 cm below the cotyledon node using digital calipers. Without causing damage to leaves, representative outer leaves were chosen based on their healthy growth and marked for regular measurements. The length and width of these leaves were subsequently measured to calculate the leaf area index (LAI). The LAI was calculated using the following formula:
L A I = K i = 1 n L i × B i A
where
LAI = the leaf area index (cm2/cm2);
K = the crop-specific fitting coefficient, which is taken as 0.5 for lettuce [25];
Li = the length of the i-th leaf (cm);
Bi = the width of the i-th leaf (cm);
A = the area occupied by the plant (cm2).
For water spinach and chili, the plant height and stem diameter were used as growth indicators, while for lettuce, the plant height and LAI were used. The water spinach plant height and stem diameter were measured every 10 days, the chili plant height and stem diameter were measured every 15 days, and the lettuce plant height and leaf length and width were monitored every 10 days. At harvest, plants were thoroughly washed to remove soil residues before determining the total fresh weight. To quantify the edible biomass, samples were first fixed at 105 °C for 30 min and then dried to a constant weight at 75 °C. The dried samples were ground to pass through a 0.25 mm sieve for subsequent biochemical analyses: vitamin C (VC) content was determined via 2,6-dichlorophenolindophenol titration [26], soluble sugars were measured using the anthrone colorimetric method [27], and soluble protein content was assessed via the Bradford method with Coomassie Brilliant Blue [28].

2.5. Soil Sampling and Property Analysis

Soil samples were collected from each pot using a five-point sampling method (10–20 cm depth) and divided into two subsamples: (1) fresh soil was carefully cleaned of plant residues and stones, homogenized through a 2 mm sieve, and stored at 4 °C for biological analysis; (2) air-dried soil was ground after removing roots and stones, passed through a 1 mm sieve, and used for physicochemical determinations. Before the pot experiment, the chemical and physical characteristics of the experimental SAS and FPS were measured. Throughout the cultivation period, soil samples were collected from each treatment involving the sediment–saline–alkali mixture for dynamic monitoring.
Soil pH was measured using a Multiparameter meter (SevenCompact, Mettler Toledo, Zurich, Switzerland) with a 1:2.5 soil-to-water ratio. EC was measured with a Conductivity meter (FiveEasy Plus, Mettler Toledo, Zurich, Switzerland). Organic matter (OM) was measured based on potassium dichromate oxidation. The total nitrogen (TN) content was measured with an Automated Kjeldahl nitrogen analyzer (K9840, Hanon, Jinan, China), while the total phosphorus (TP) content was determined via digestion with H2SO4 and HClO4, using phosphomolybdic blue colorimetry on a UV-Vis spectrophotometer (UVmini-1240, Shimadzu, Kyoto, Japan). Total potassium (TK) was measured via NaOH fusion followed by flame photometry using a spectrophotometer (AP1302, AOPU, Shanghai, China). Available phosphorus (AP) was measured via molybdenum blue colorimetry. Available potassium (AK) was extracted with HNO3 and quantified using a spectrophotometer (AP1302, AOPU, Shanghai, China). Ammonium ( N H 4 + -N) and nitrate nitrogen ( N O 3 -N) were analyzed via dual-wavelength UV spectrophotometry using a UV-Vis spectrophotometer (UVmini-1240, Shimadzu, Kyoto, Japan). Soil microbial biomass carbon (MBC) and nitrogen (MBN) were determined in a Total organic carbon analyzer (TOC-LCPH, Shimadzu, Kyoto, Japan) using the chloroform fumigation–extraction method. Soil basal respiration was measured using the alkali absorption method in sealed incubation bottles with a Gas chromatograph (6850A, Agilent, Santa Clara, CA, USA). For the methods for determining soil-related physicochemical properties, refer to LU 2020 [29].

2.6. Contents and Indicators of Ecological Benefit Accounting

The ecological benefits were quantified using the Gross Ecosystem Product (GEP) accounting framework, focusing on eight key regulating ecosystem services: (1) soil organic matter accumulation [30], (2) nutrient cycling [31], (3) water conservation [32], (4) CO2 fixed [30], (5) oxygen-providing [33], (6) air purification [34], (7) sediment utilization [30], and (8) biodiversity maintenance [35]. The specific calculation formula for each service are detailed below and summarized in Table 3.

2.7. Statistical Analysis Methods

The experimental data were initially processed using Microsoft Excel 2019. Statistical analyses were performed using SPSS 26.0 (SPSS Inc., Chicago, IL, USA), including one-way analysis of variance (ANOVA) followed by Least Significant Difference (LSD) post-hoc tests for significance determination (p < 0.05). All graphical representations were generated using Origin 2024 software.

3. Results

3.1. Changes in Soil Physicochemical Properties and Microbial Activity During Vegetable Cultivation

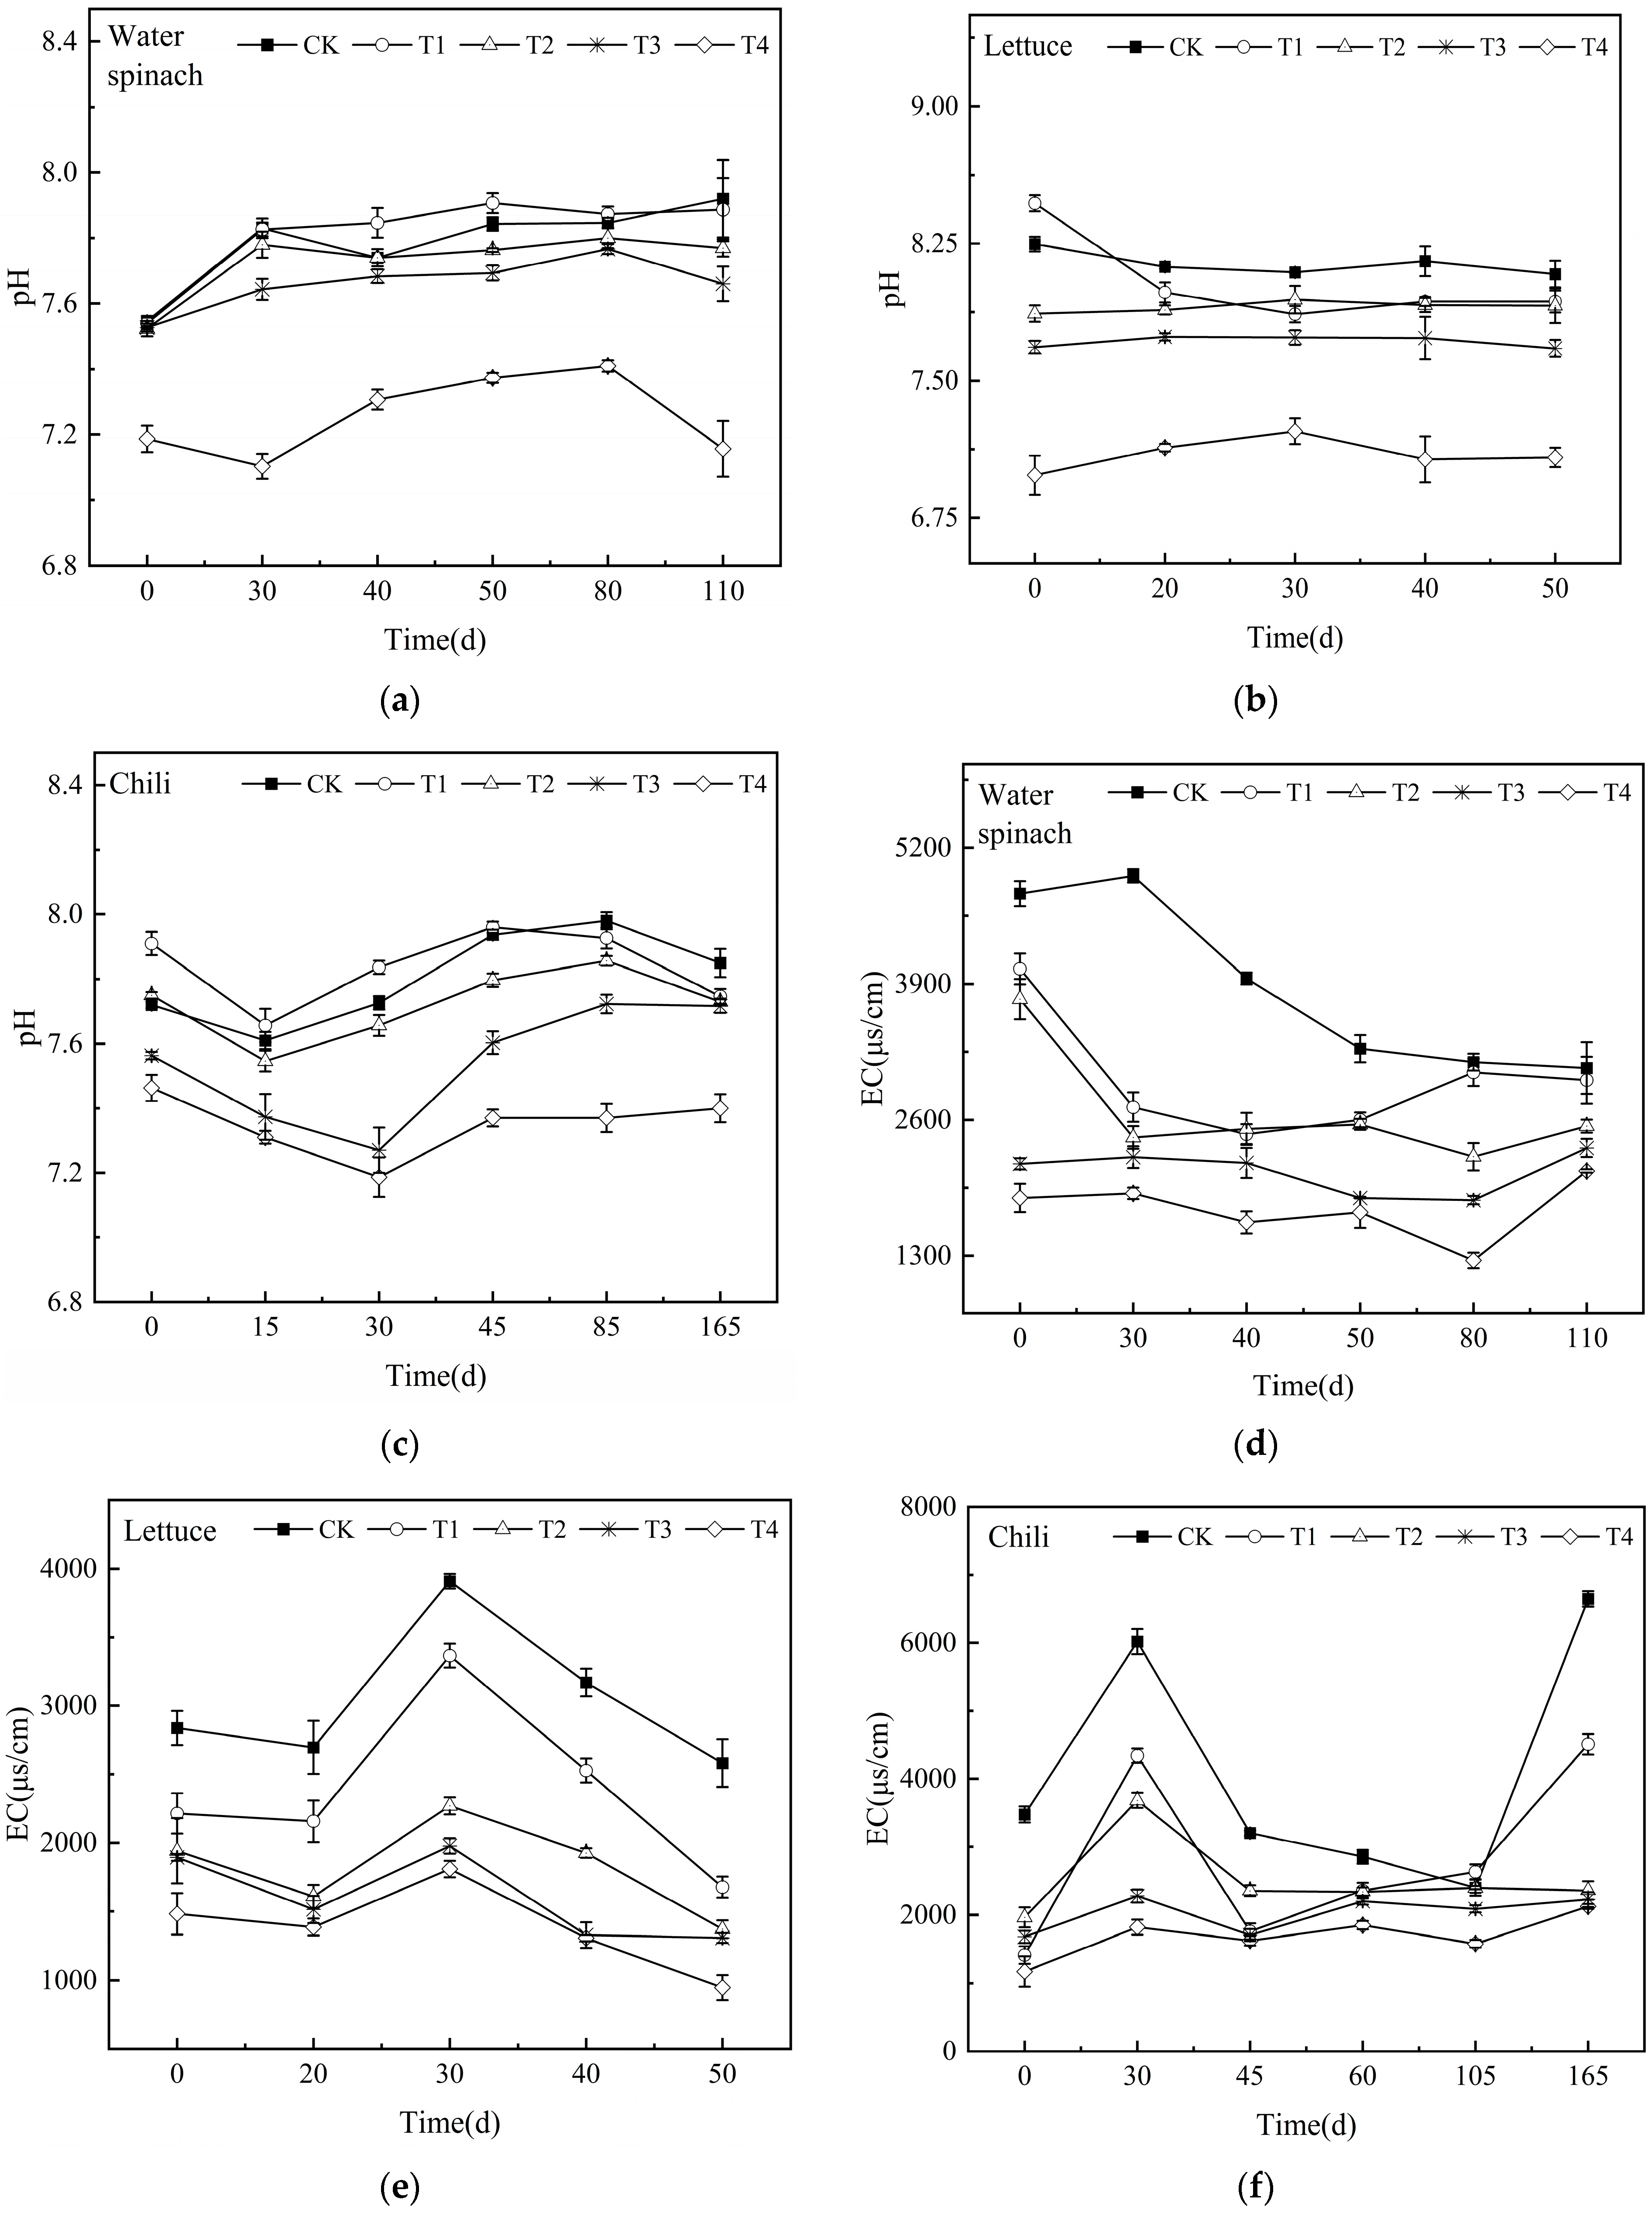
3.1.1. Dynamics of Soil pH and Salinity

The treatment and vegetable-specific variations in soil pH and EC are illustrated in Figure 1a–f.
During water spinach cultivation, the pH of the unamended SAS and FPS exhibited large fluctuations, whereas the pH of FPS-amended soil was reduced and maintained stability throughout the cultivation period with smaller variations (Figure 1a). For lettuce, FPS-amended soils exhibited relatively stable pH values, except for T1 (20% FPS addition), which showed a transient decline during the early growth phase (0–20 days). Across all FPS treatments (T1–T4), pH values remained consistently lower than CK and decreased proportionally with an increasing FPS content (Figure 1b). During chili cultivation, while T1 initially maintained a higher pH than CK, all other FPS treatments (T2–T4) consistently exhibited lower pH levels, particularly during the reproductive growth stages (Figure 1c).
FPS amendment universally reduced soil salinity, as evidenced by significantly lower EC values across all treatments than CK (Figure 1d–f). Compared to SAS, FPS exhibited more stable EC stability. Adding different proportions of FPS helped maintain stable EC levels in the soil throughout the cultivation period. Particularly, water spinach (T1–T2) and lettuce (T1–T4) systems showed notable post-harvest EC reductions, with lettuce T3 demonstrating the most substantial decrease (Figure 1e). Despite minor EC increases in chili T3–T4 treatments, these values remained 27–34% lower than CK (Figure 1f). Overall, FPS amendment effectively reduced soil salinity to 2.83–6.56 g·kg−1, with a strong positive correlation between the FPS proportion and pH reduction magnitude. Notably, the 80% FPS amendment (T3) in lettuce cultivation emerged as the most effective treatment, achieving optimal pH stabilization and salinity mitigation. These findings suggest that higher FPS ratios are most effective for ameliorating SAS in vegetable cultivation.

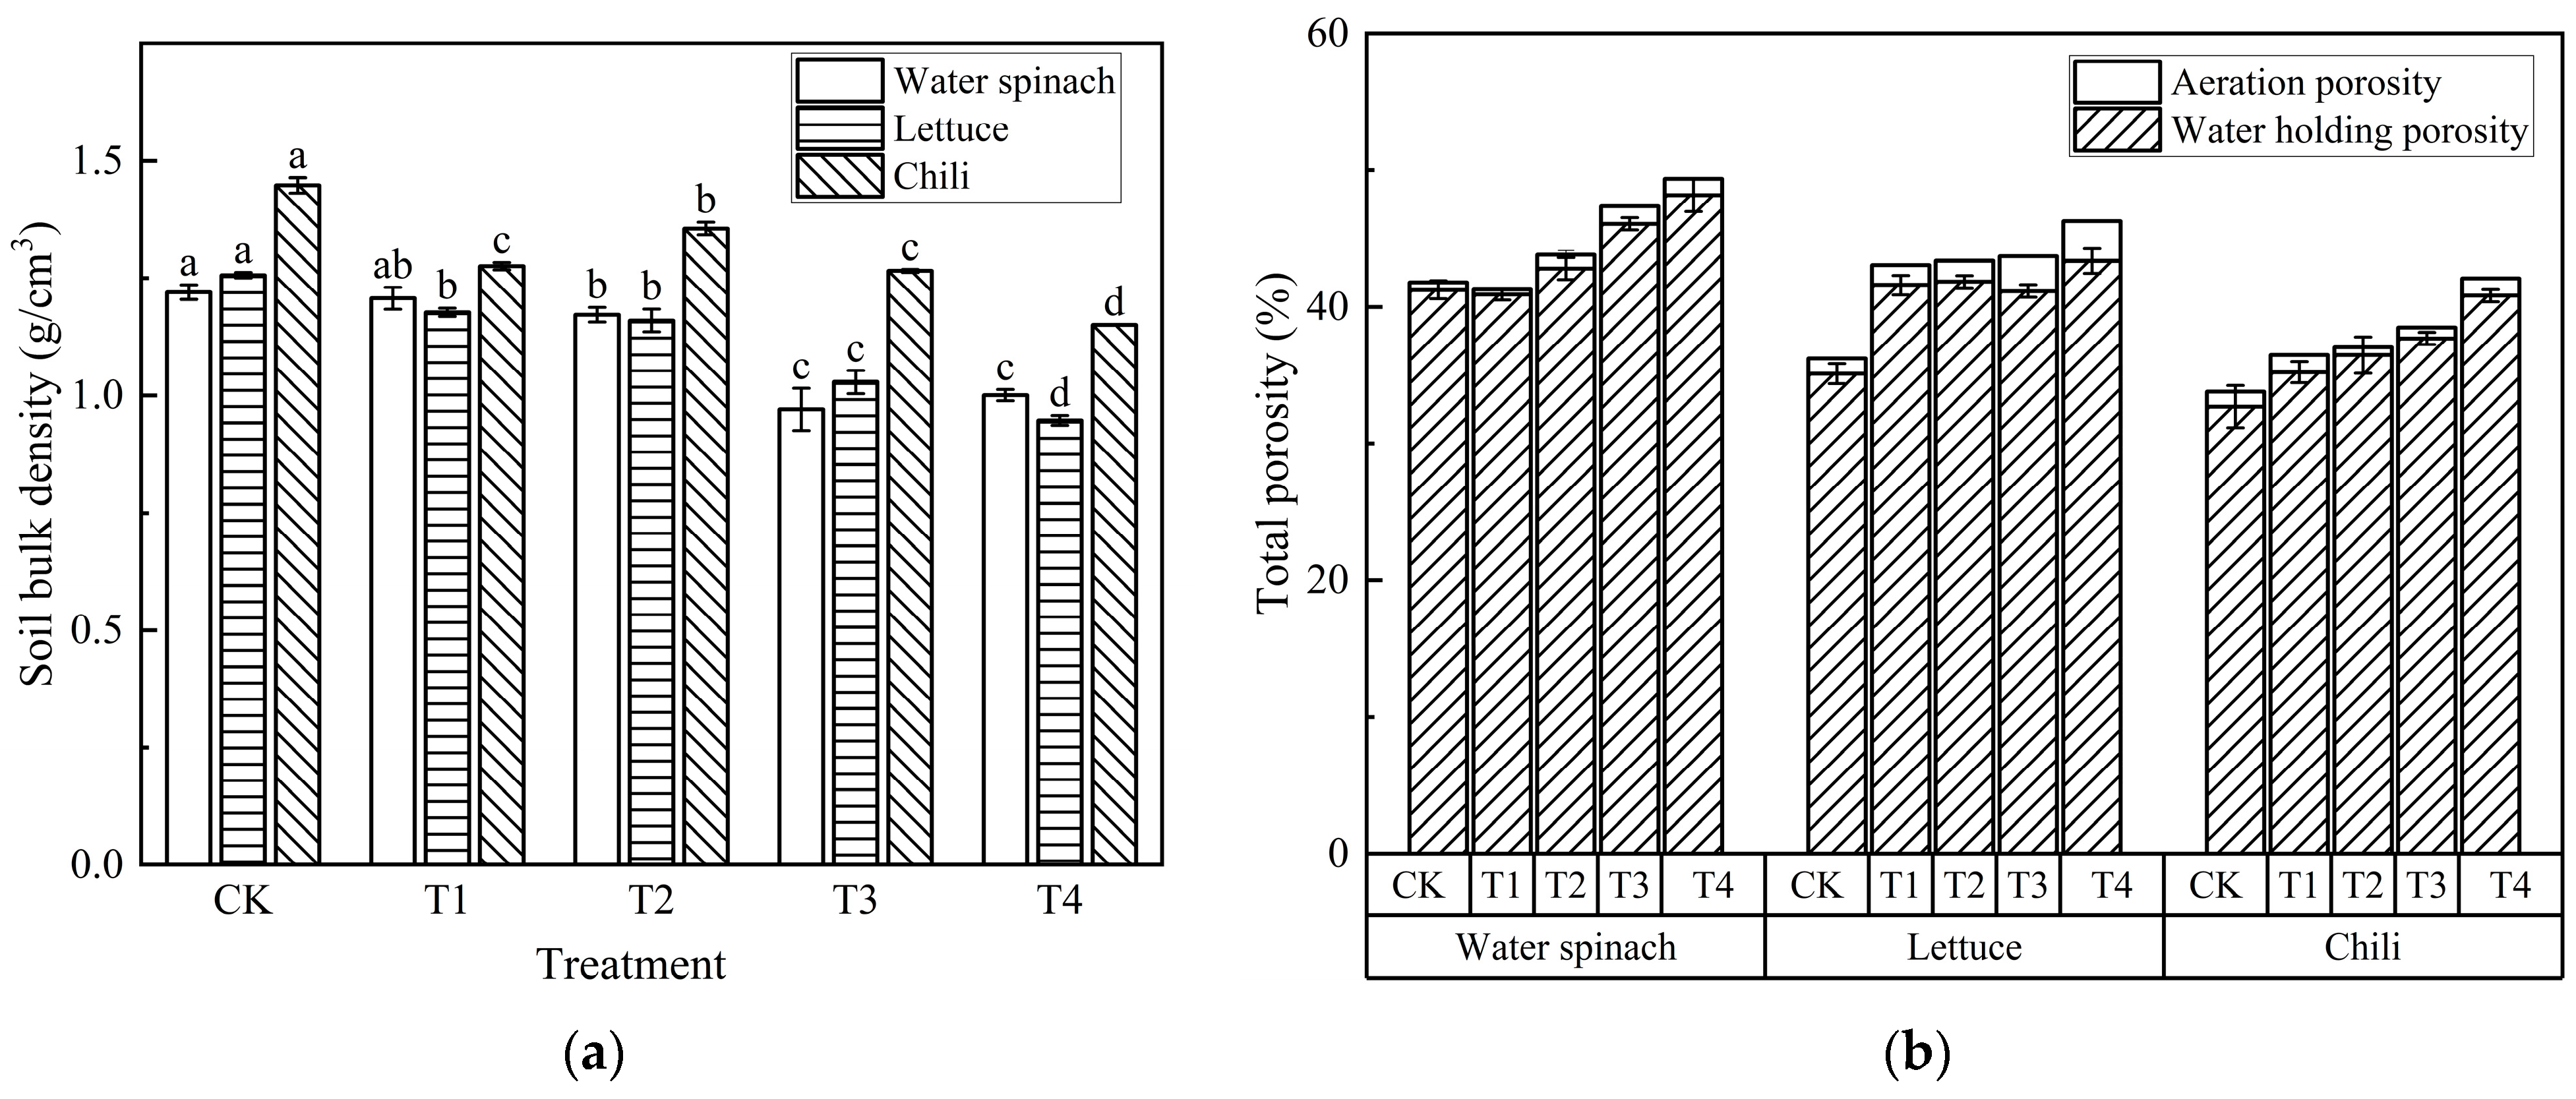
3.1.2. Changes in Soil Physical Structure During Vegetable Cultivation

The soil bulk density exhibited significant treatment-dependent variations across all vegetable systems (Figure 2a). After harvest, the bulk density of soil in water spinach systems followed the order of CK > T1 > T2 > T4 > T3 (Figure 2a). T2, T3, and T4 significantly reduced the bulk density compared with CK (p < 0.05), with reduction rates of 1.05%, 3.93%, 20.45%, and 17.97% for T1–T4 (Table 4), respectively. In lettuce cultivation, the bulk density order was CK > T1 > T2 > T3 > T4, with all FPS treatments (T1–T4) showing significant reductions (6.31–24.64%) compared with CK. For chili cultivation, where only T2–T4 could be evaluated due to the chili of CK and T1 dying during the experiment, T3–T4 treatments demonstrated significant bulk density reductions (6.62–15.15%) relative to T2. These results suggest that FPS amendment consistently decreased bulk density, with effects proportional to the application rates.
The post-harvest analysis revealed significant treatment effects on soil porosity (Figure 2b and Table 5). In water spinach systems, total porosity increased from 41.77% (CK) to 49.36% (T4), with FPS-amended treatments T2–T4 showing 13.38–18.17% improvements (p < 0.05) that were consistent across both the aeration porosity and water-holding porosity measurements. For lettuce cultivation, total porosity values ranged from 36.21% to 46.26%, demonstrating a strong positive correlation with the FPS ratio. Compared with CK, T1–T4 increased the total porosity by 18.89%, 19.77%, 20.66%, and 27.75%, respectively, with significant differences in both aeration and water-holding porosity (p < 0.05). For chili cultivation, soil porosity exhibited comparable but more variable trends (total porosity range: 33.78–42.06%), where all FPS treatments (T1–T4) enhanced porosity by 7.93–24.51% compared with CK. The aeration porosity initially increased and then decreased before rising again with higher FPS ratios, where the sharp decline between T1 and T2 may relate to plant survival rates. The water-holding porosity increased significantly with the FPS ratio, mirroring total porosity trends.
Comprehensively, all FPS–saline soil mixtures reduced the bulk density, with the 80% FPS (T3) and 100% FPS (T4) treatments emerging as particularly effective for lettuce cultivation. Among all treatments, T4 most effectively enhanced the total porosity (peaking at +49.36%), water-holding porosity (maximum 48.18% in water spinach), and aeration porosity (maximum +2.91% in lettuce). These improvements created superior physical conditions for vegetable growth, particularly in water spinach and lettuce systems.

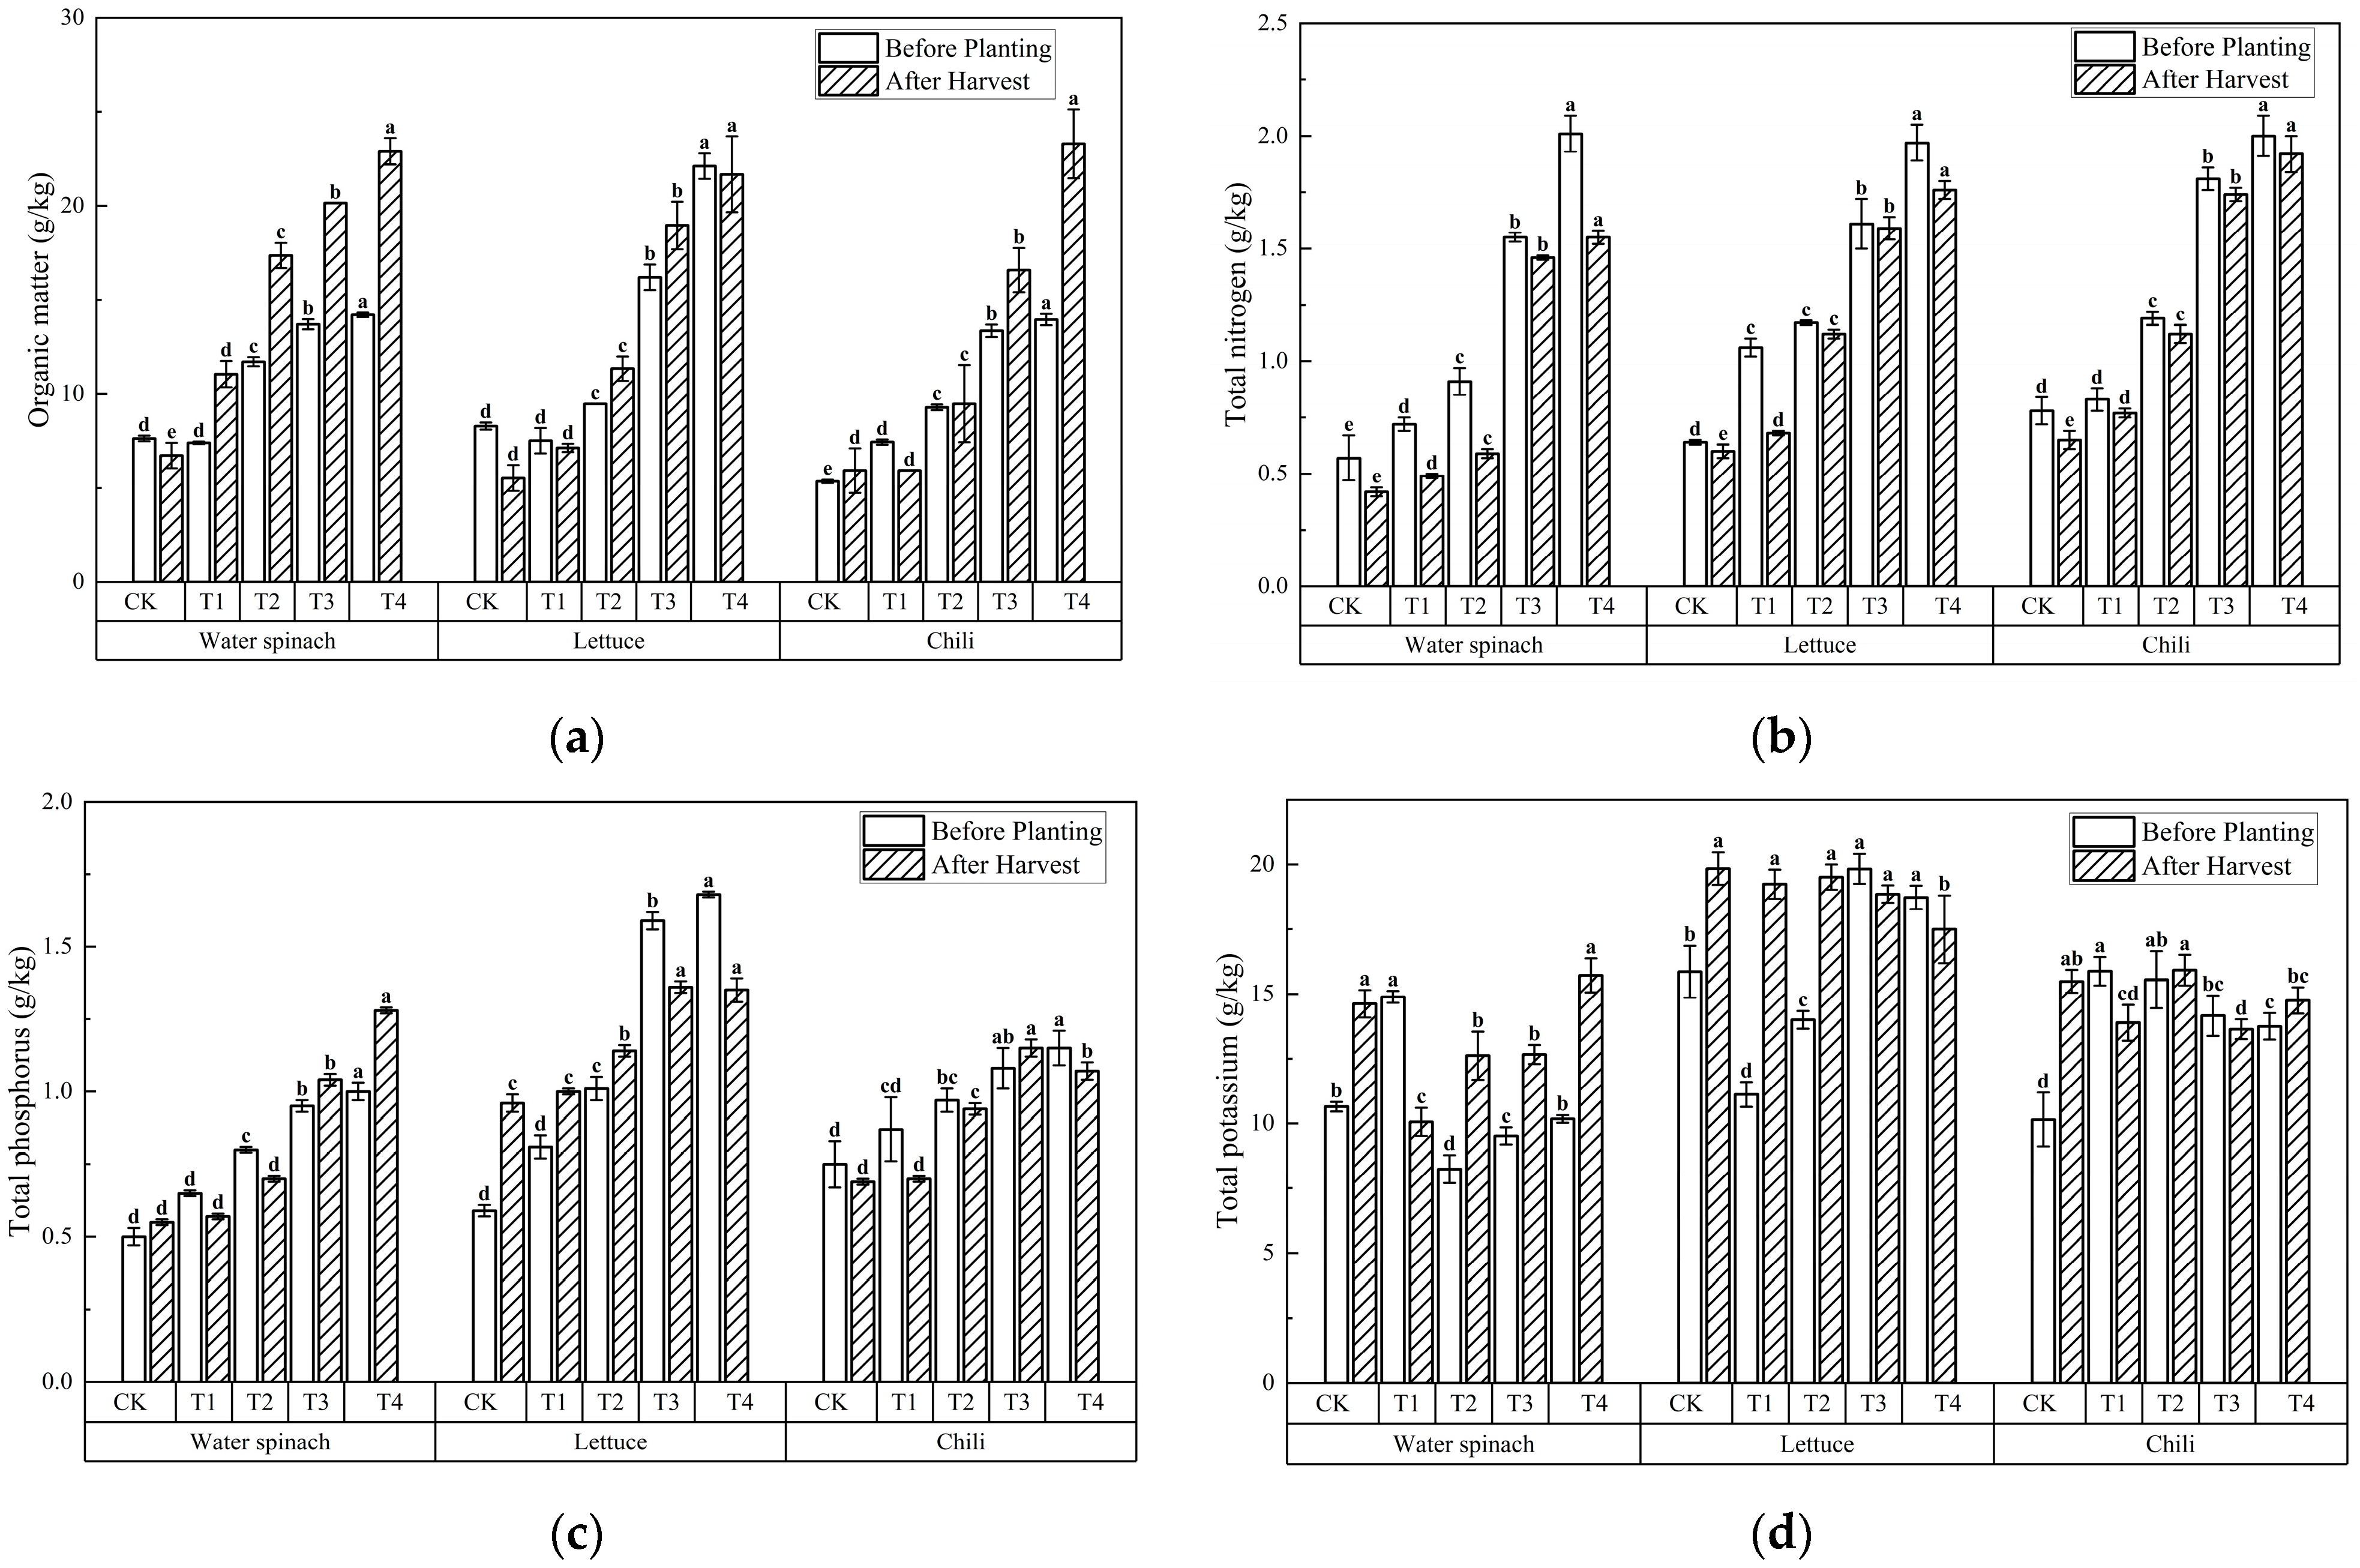
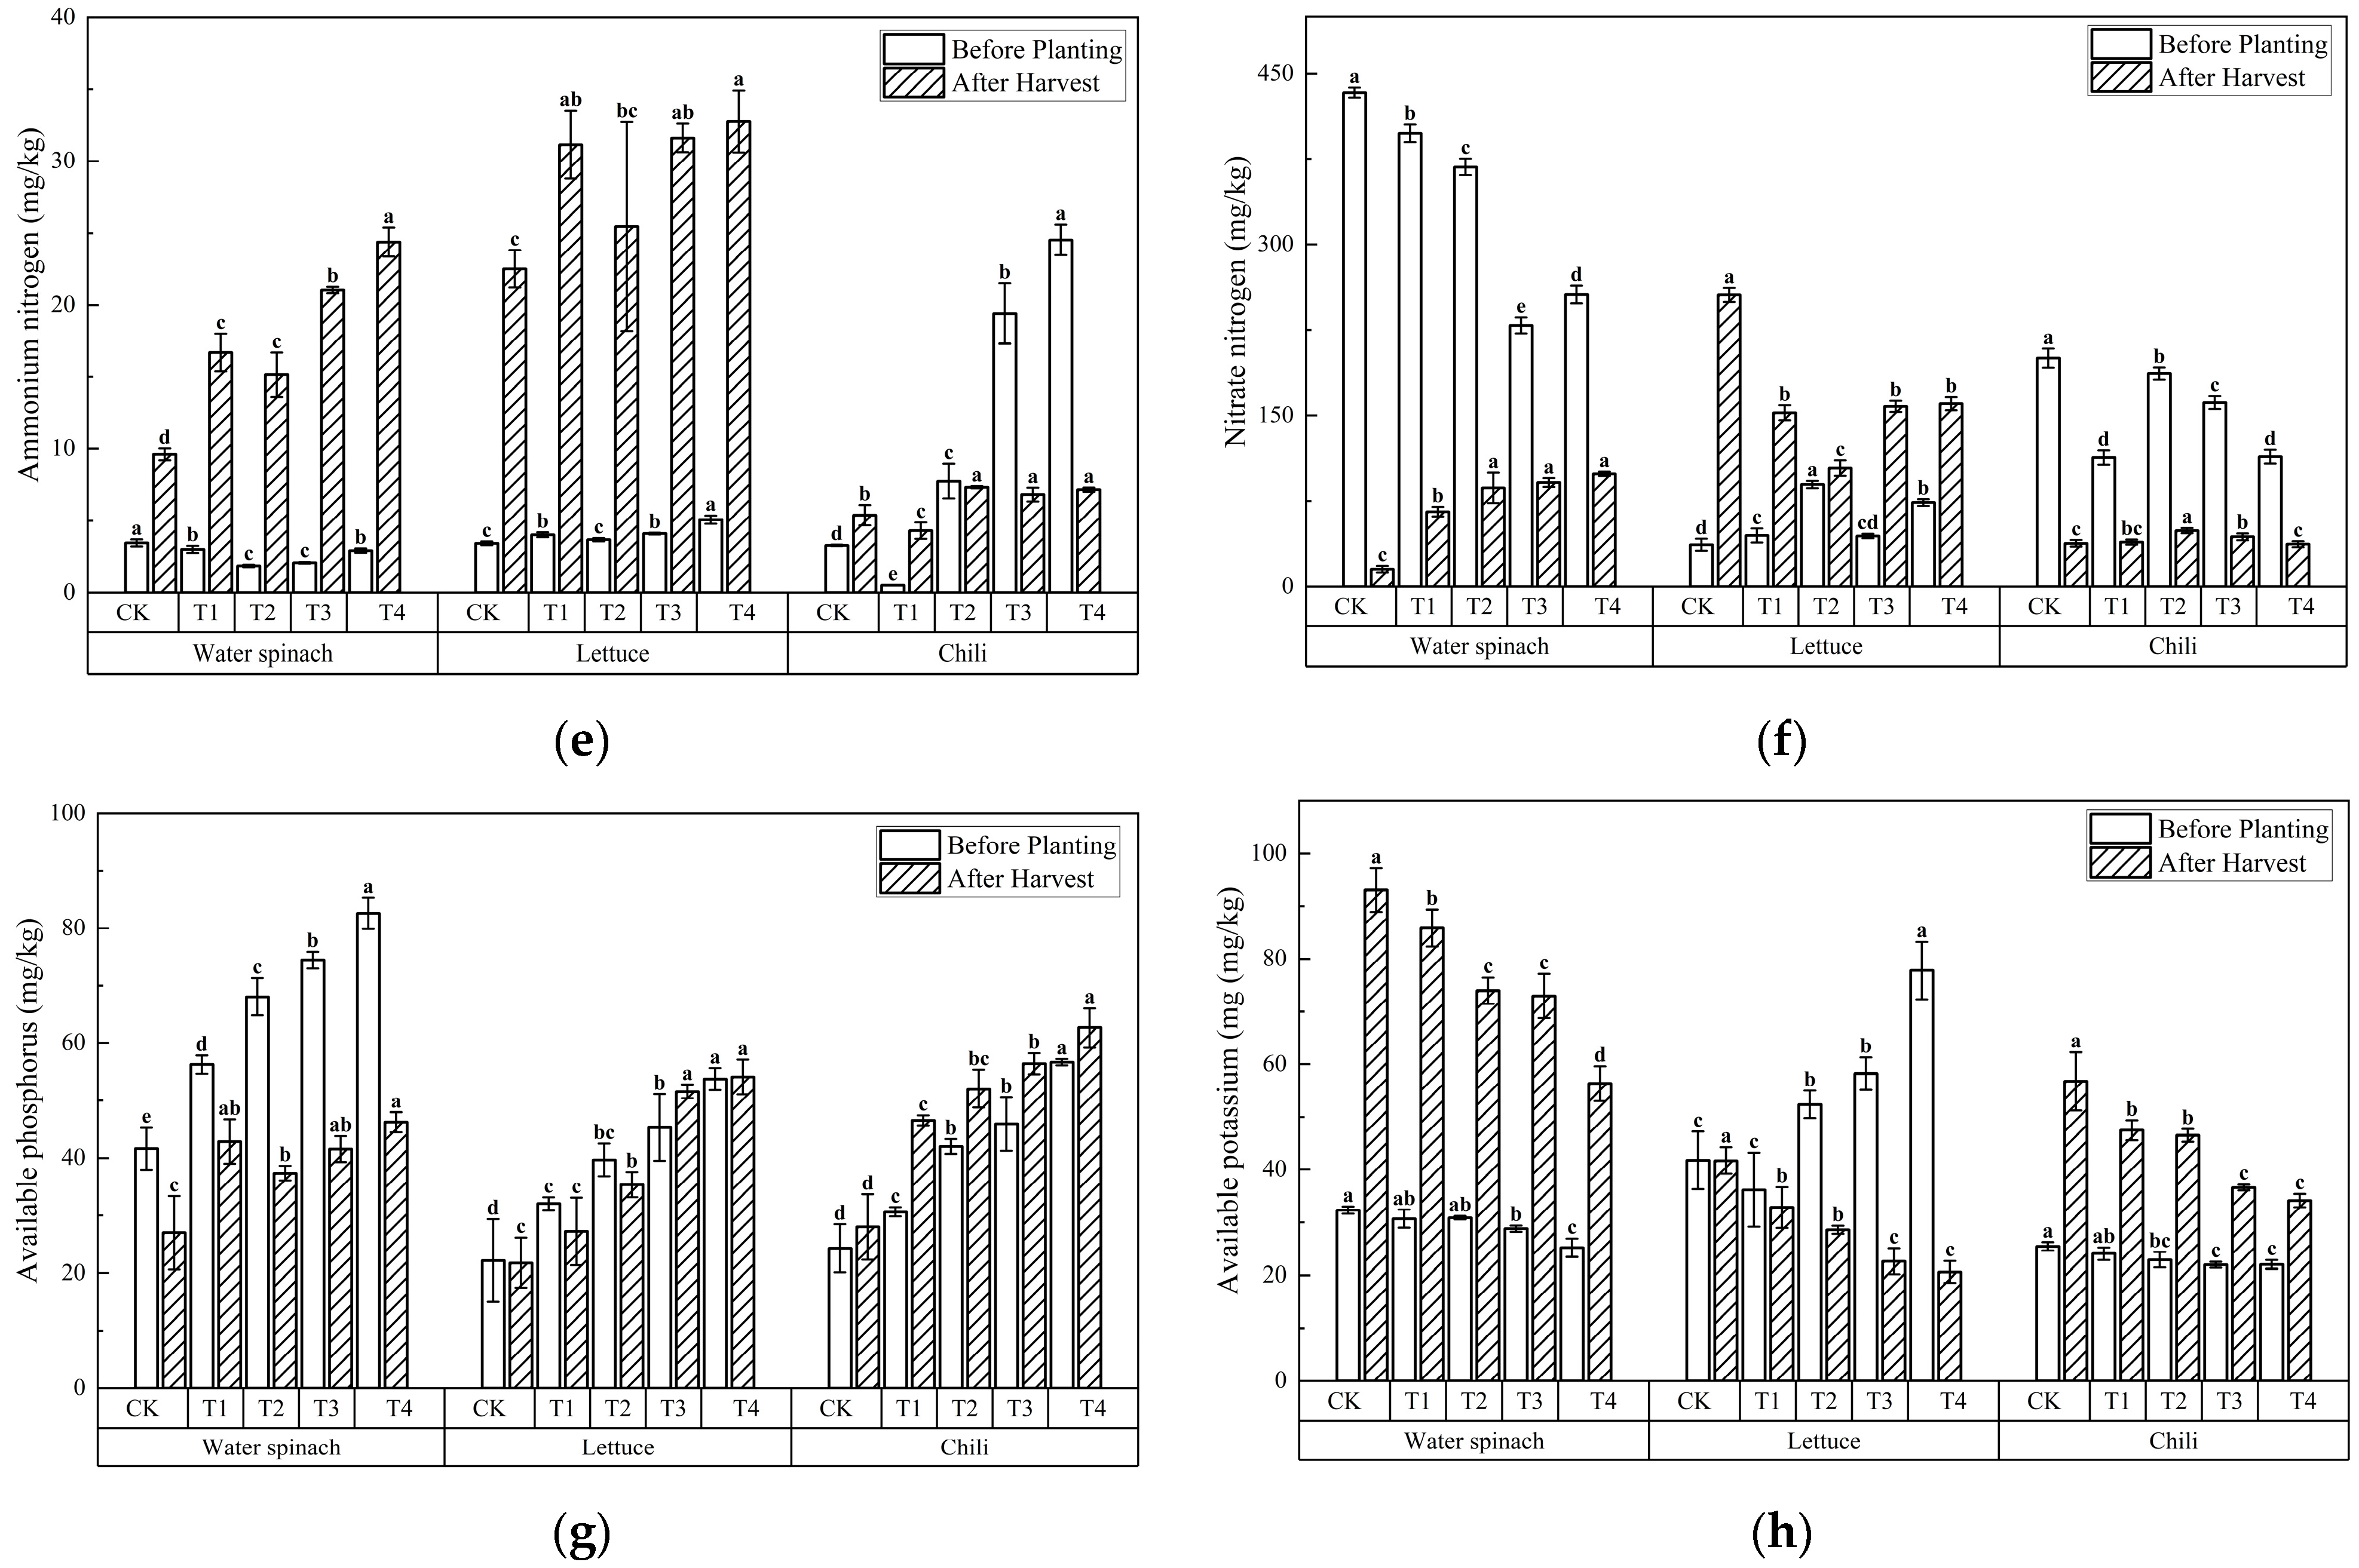
3.1.3. Changes in Soil Nutrients During Vegetable Cultivation

An analysis of soil nutrient dynamics suggested significant improvements in soil chemical fertility across FPS-amended treatments (Figure 3). Notably, the organic matter content showed marked increases in all treatment groups for water spinach, while lettuce (T2–T3: +1.86 to +2.76 g·kg−1) and chili (T2–T4: +0.19 to +9.34 g·kg−1) exhibited dose-dependent responses (Figure 3a). Contrasting trends were observed for total nitrogen (TN, Figure 3b), where CK plots experienced reductions (water spinach: −0.15 g·kg−1; lettuce: −0.04 g·kg−1; chili: −0.13 g·kg−1), while total phosphorus (TP, Figure 3c) responses varied by the vegetable (water spinach: 0.05 g·kg−1; lettuce: +0.37 g·kg−1; chili: −0.06 g·kg−1). Notably, all systems increased total potassium (TK) levels, with water spinach demonstrating superior TK uptake capacity compared with other vegetables (Figure 3d).
An analysis of available nutrients (Figure 3e,f) showed that ammonium nitrogen ( N H 4 + -N) increases were pronounced for all treatments of water spinach (most pronounced in T4 peaking at +21.48 mg·kg−1) and lettuce, whereas nitrate nitrogen ( N O 3 -N-N) increases were only significant in lettuce soils (most pronounced in T3, peaking at +113.7 mg·kg−1). All FPS treatments maintained significantly higher N H 4 + -N and N O 3 -N levels than CK (p < 0.05), with these differences persisting throughout both the pre-planting and post-harvest sampling periods. Phosphorus availability displayed vegetable-specific patterns, with water spinach showing decreased available P (Figure 3g) but increased available K (Figure 3h), while chili exhibited increases in both parameters. Particularly, the available P in water spinach soils remained consistently higher in FPS treatments compared with CK (p < 0.05), with lettuce demonstrating a clear FPS dose-dependent response. These results collectively suggest that FPS amendments exceeding 40% (T2–T4) most effectively enhanced multiple soil fertility indicators (organic matter, TN and NH4+-N), with higher proportions providing a more durable nutrient supply. The superior performance of lettuce cultivation in full FPS treatments suggests that this system may be optimal for the resource utilization of FPS, particularly when targeting simultaneous improvements in organic matter and phosphorus availability.

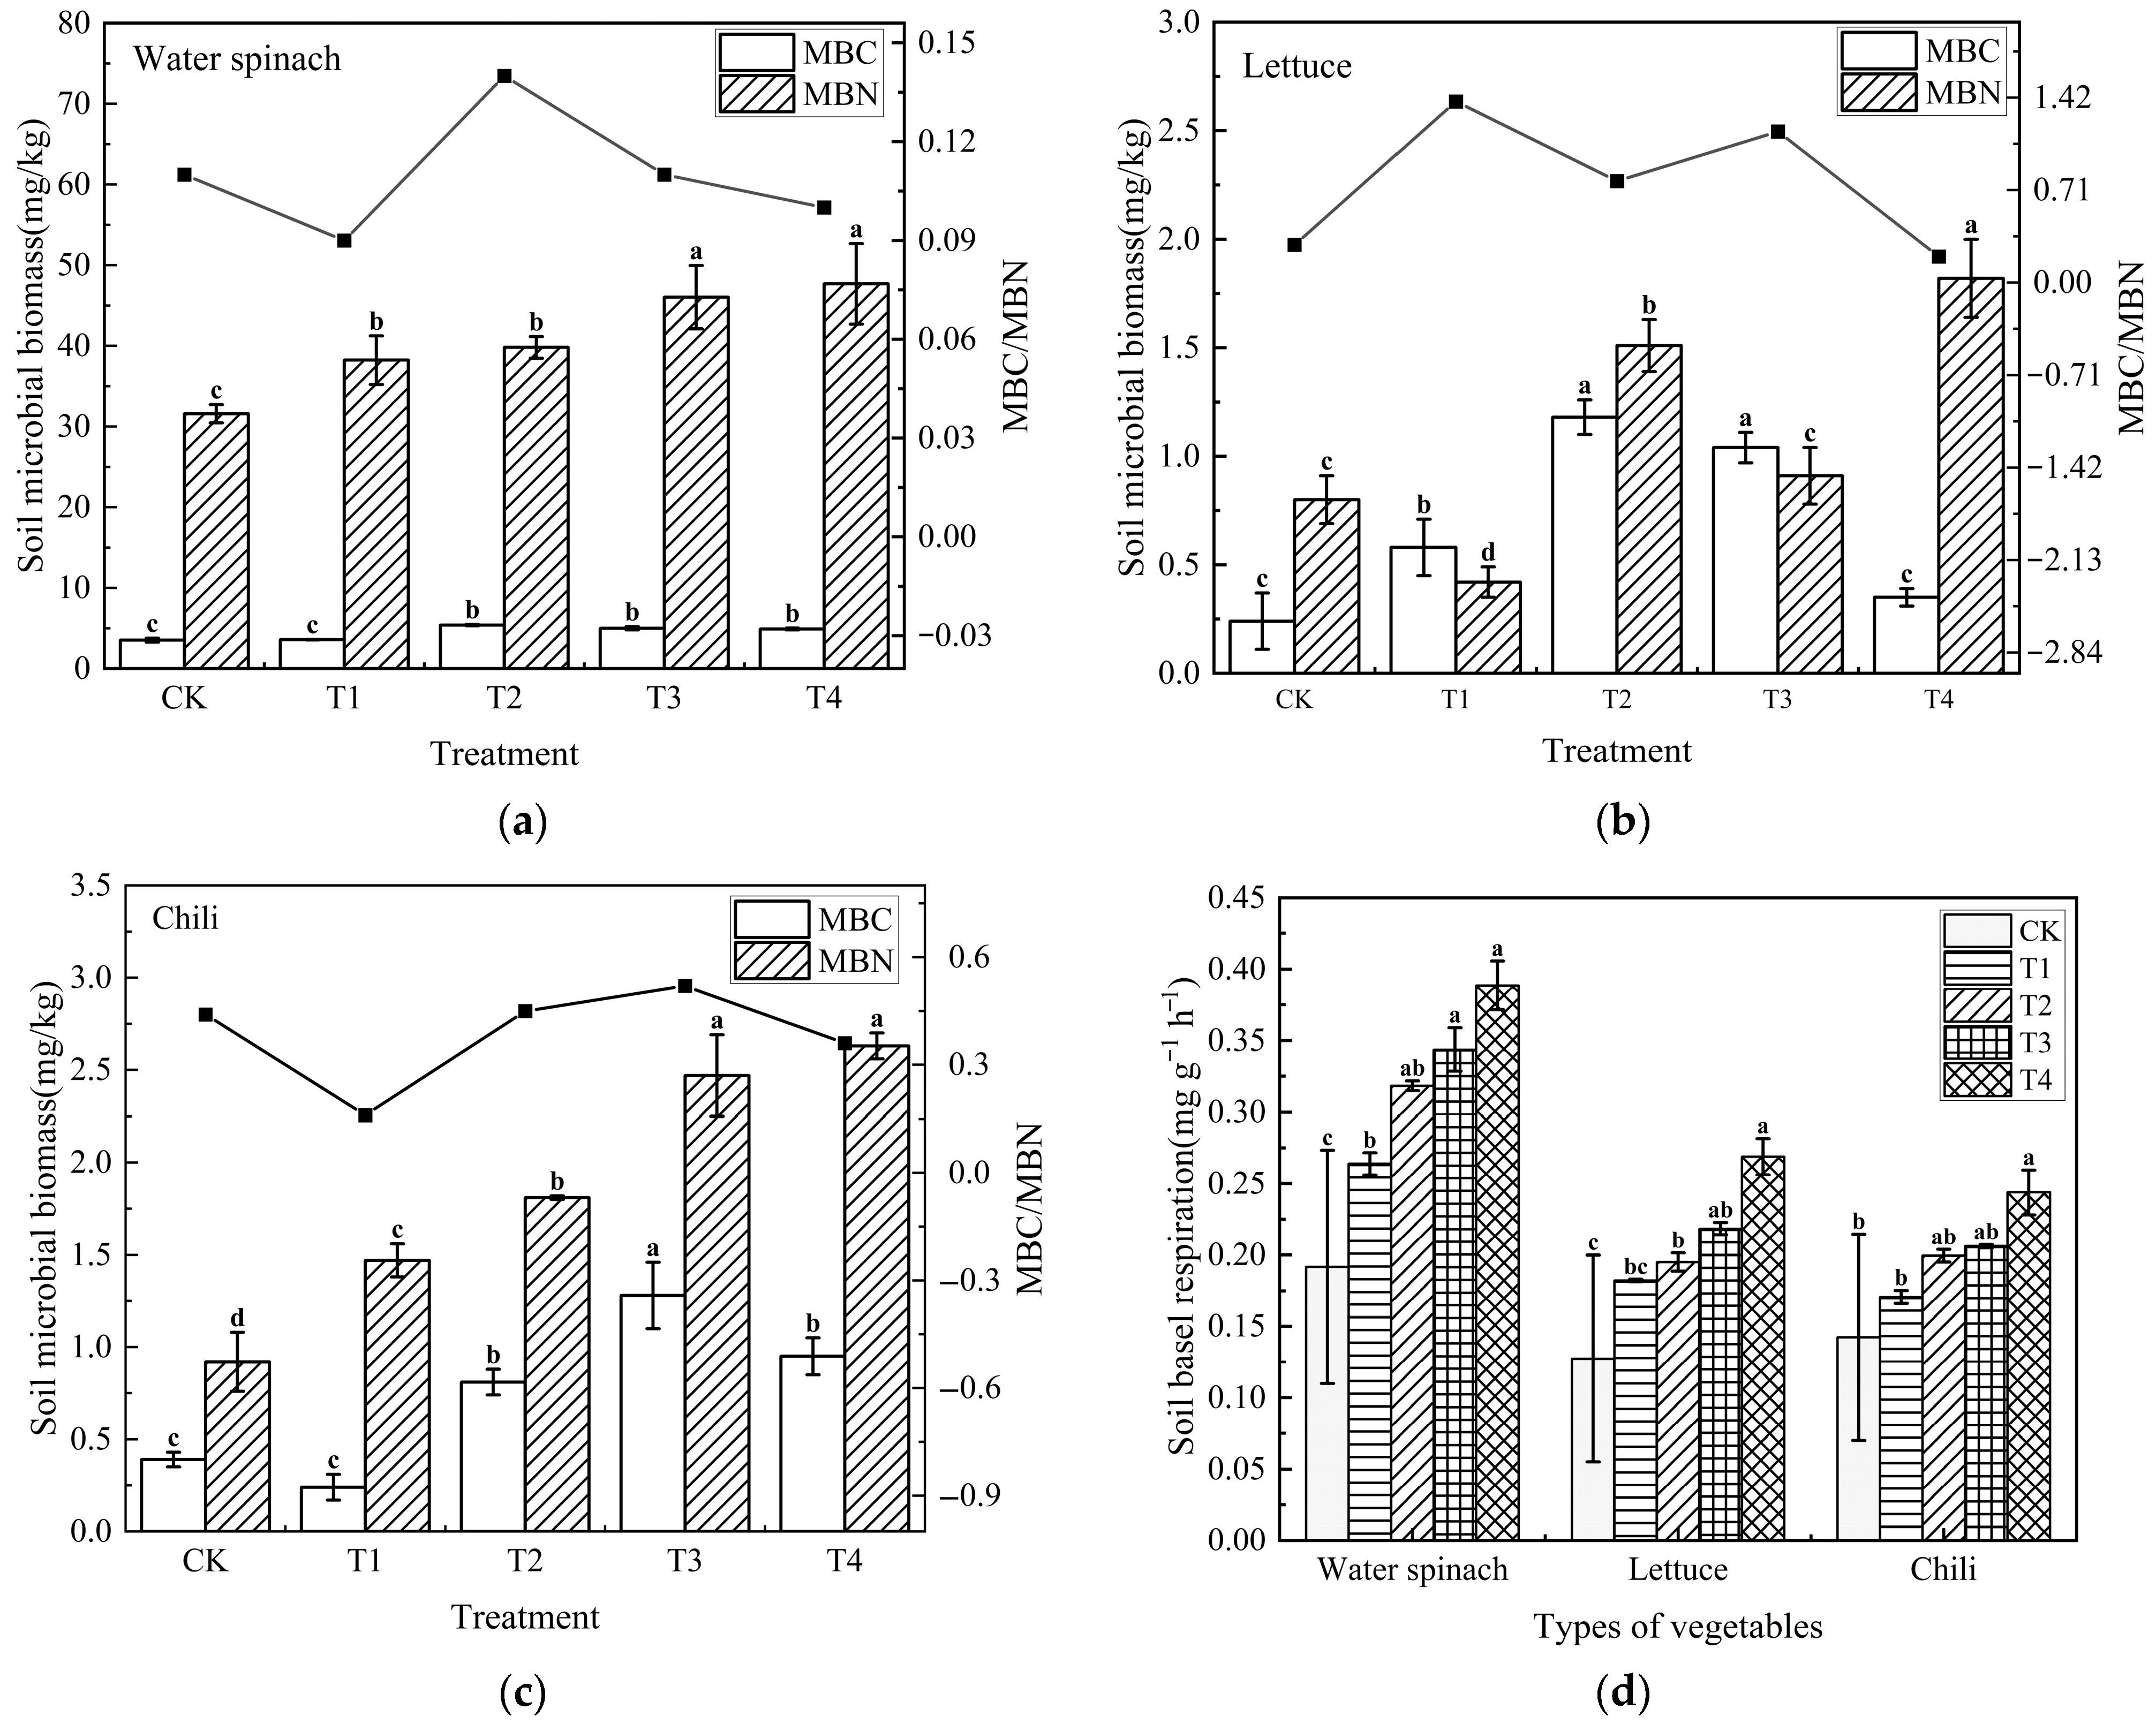
3.1.4. Changes in Soil Microbial Activity During Vegetable Cultivation

The analysis of soil microbial activity revealed significant treatment effects across all vegetable systems (Figure 4 and Table 6).
In water spinach cultivation, MBC showed an increase in T2–T4 treatments compared to CK (p < 0.05), peaking at 5.39 mg·kg−1 in T2, and MBN demonstrated consistent enhancement (21.02–50.97%) across all FPS amendments (T1–T4). The MBC/MBN ratio exhibited a characteristic wave-like pattern, initially decreasing and increasing with higher FPS proportions. Similar trends emerged in lettuce systems, where T2 achieved a maximum MBC (1.18 mg·kg−1), with particularly notable effects in T3 (80% FPS). Chili cultivation displayed the most pronounced responses, with T2–T4 treatments elevating the MBC by 107.69–228.21% and MBN by 96.74–185.87% relative to CK (p < 0.05).
Soil respiration measurements showed universal stimulation across vegetables, with water spinach T4 (100% FPS) reaching peak CO2 evolution (0.39 mg·g−1·h−1, 105.23% above CK), lettuce T3 showing a 71.51% increase, and chili T4 exhibiting respiration rates 1.44–4.33 times higher than CK (0.26 vs. 0.06–0.18 mg·g−1·h−1). These results collectively demonstrate that FPS amendments at >40% (T2–T4) consistently enhance microbial biomass and activity, with optimal effects typically occurring at 80–100% FPS incorporation (T3–T4). The vegetable-specific response patterns suggest that microbial communities adapt differently to FPS amendments depending on the plant species, with chili systems showing high biomass accumulation and water spinach displaying the highest absolute respiration rates. The observed enhancements in microbial parameters suggest that FPS amendment contributes to improved soil chemical fertility and stimulated biological activity, which plays a pivotal role in nutrient cycling during saline soil reclamation.

3.2. Effects of Sediment–Saline Soil Mixtures on Vegetable Growth and Quality

3.2.1. Impacts on Vegetable Growth Parameters

An analysis of vegetable growth parameters revealed significant improvements in sediment-amended treatments compared to CK (Figure 5). All FPS treatments (T1–T4) enhanced the plant height across species, with mixtures containing >40% FPS showing particularly pronounced effects on both the height and leaf area index (LAI) (p < 0.05). In water spinach, the plant height stabilized by day 60 of cultivation, while the stem diameter exhibited robust growth, significantly outperforming CK plants. Lettuce development displayed consistent growth patterns, with day 10 height rankings (T4 > T3 > T1 > T2 > CK) persisting throughout the growth cycle, and T2–T4 treatments significantly boosting the LAI (p < 0.05). Chili plants showed similar responses, though CK and T1 plants succumbed to soil resalinization by day 75. Growth rates in the remaining treatments began declining by day 135, though T2–T4 mixtures maintained significant height advantages (p < 0.05).
Notably, higher FPS proportions (>80%, T3–T4) demonstrated extended fertilizer efficacy, simultaneously improving soil nutrient retention and overall plant vigor. These findings suggest that FPS amendments, particularly at higher incorporation rates, can effectively counteract saline soil limitations while providing sustained nutritional support for vegetables.

3.2.2. Impacts on Vegetable Yield

The impacts of FPS amendment on vegetable total fresh yields and edible dry weight biomass are shown in Table 7 and Table 8.
In water spinach cultivation, all FPS treatments (T1–T4) significantly increased total yields compared with CK (p < 0.05), with total fresh yields ranked as T3 > T4 > T2 > T1 > CK. The highest yield was in T3 (96.39 g), representing a 1.66-fold increase over CK. The edible dry weight biomass followed the order T3 (37.32 g) > T2 (30.97 g) > T4 (30.05 g) > CK (23.38 g) > T1 (21.91 g), with T2–T4 showing 28.53–59.62% significant increases over CK (p < 0.05). Lettuce exhibited similar trends, with T3 producing the maximum yield (157.08 g). While values of T1 were slightly lower than CK, T2–T4 treatments significantly enhanced both the total fresh weight yield (35.22–116.51% increase) and edible dry weight biomass (84.99–320.86% increase) relative to CK (p < 0.05). Chili production peaked in T3, with higher yields than T2 and T4, respectively, and the edible dry weight biomass showed parallel trends (T3 exceeding T2 and T4 by 181.60% and 146.41%).
The statistical analysis suggested that the T3 treatment (80% FPS) consistently optimized production across all three vegetables, with lettuce achieving the highest absolute yield (157.08 g, surpassing water spinach and chili), while water spinach showed the greatest edible biomass accumulation (37.32 g).

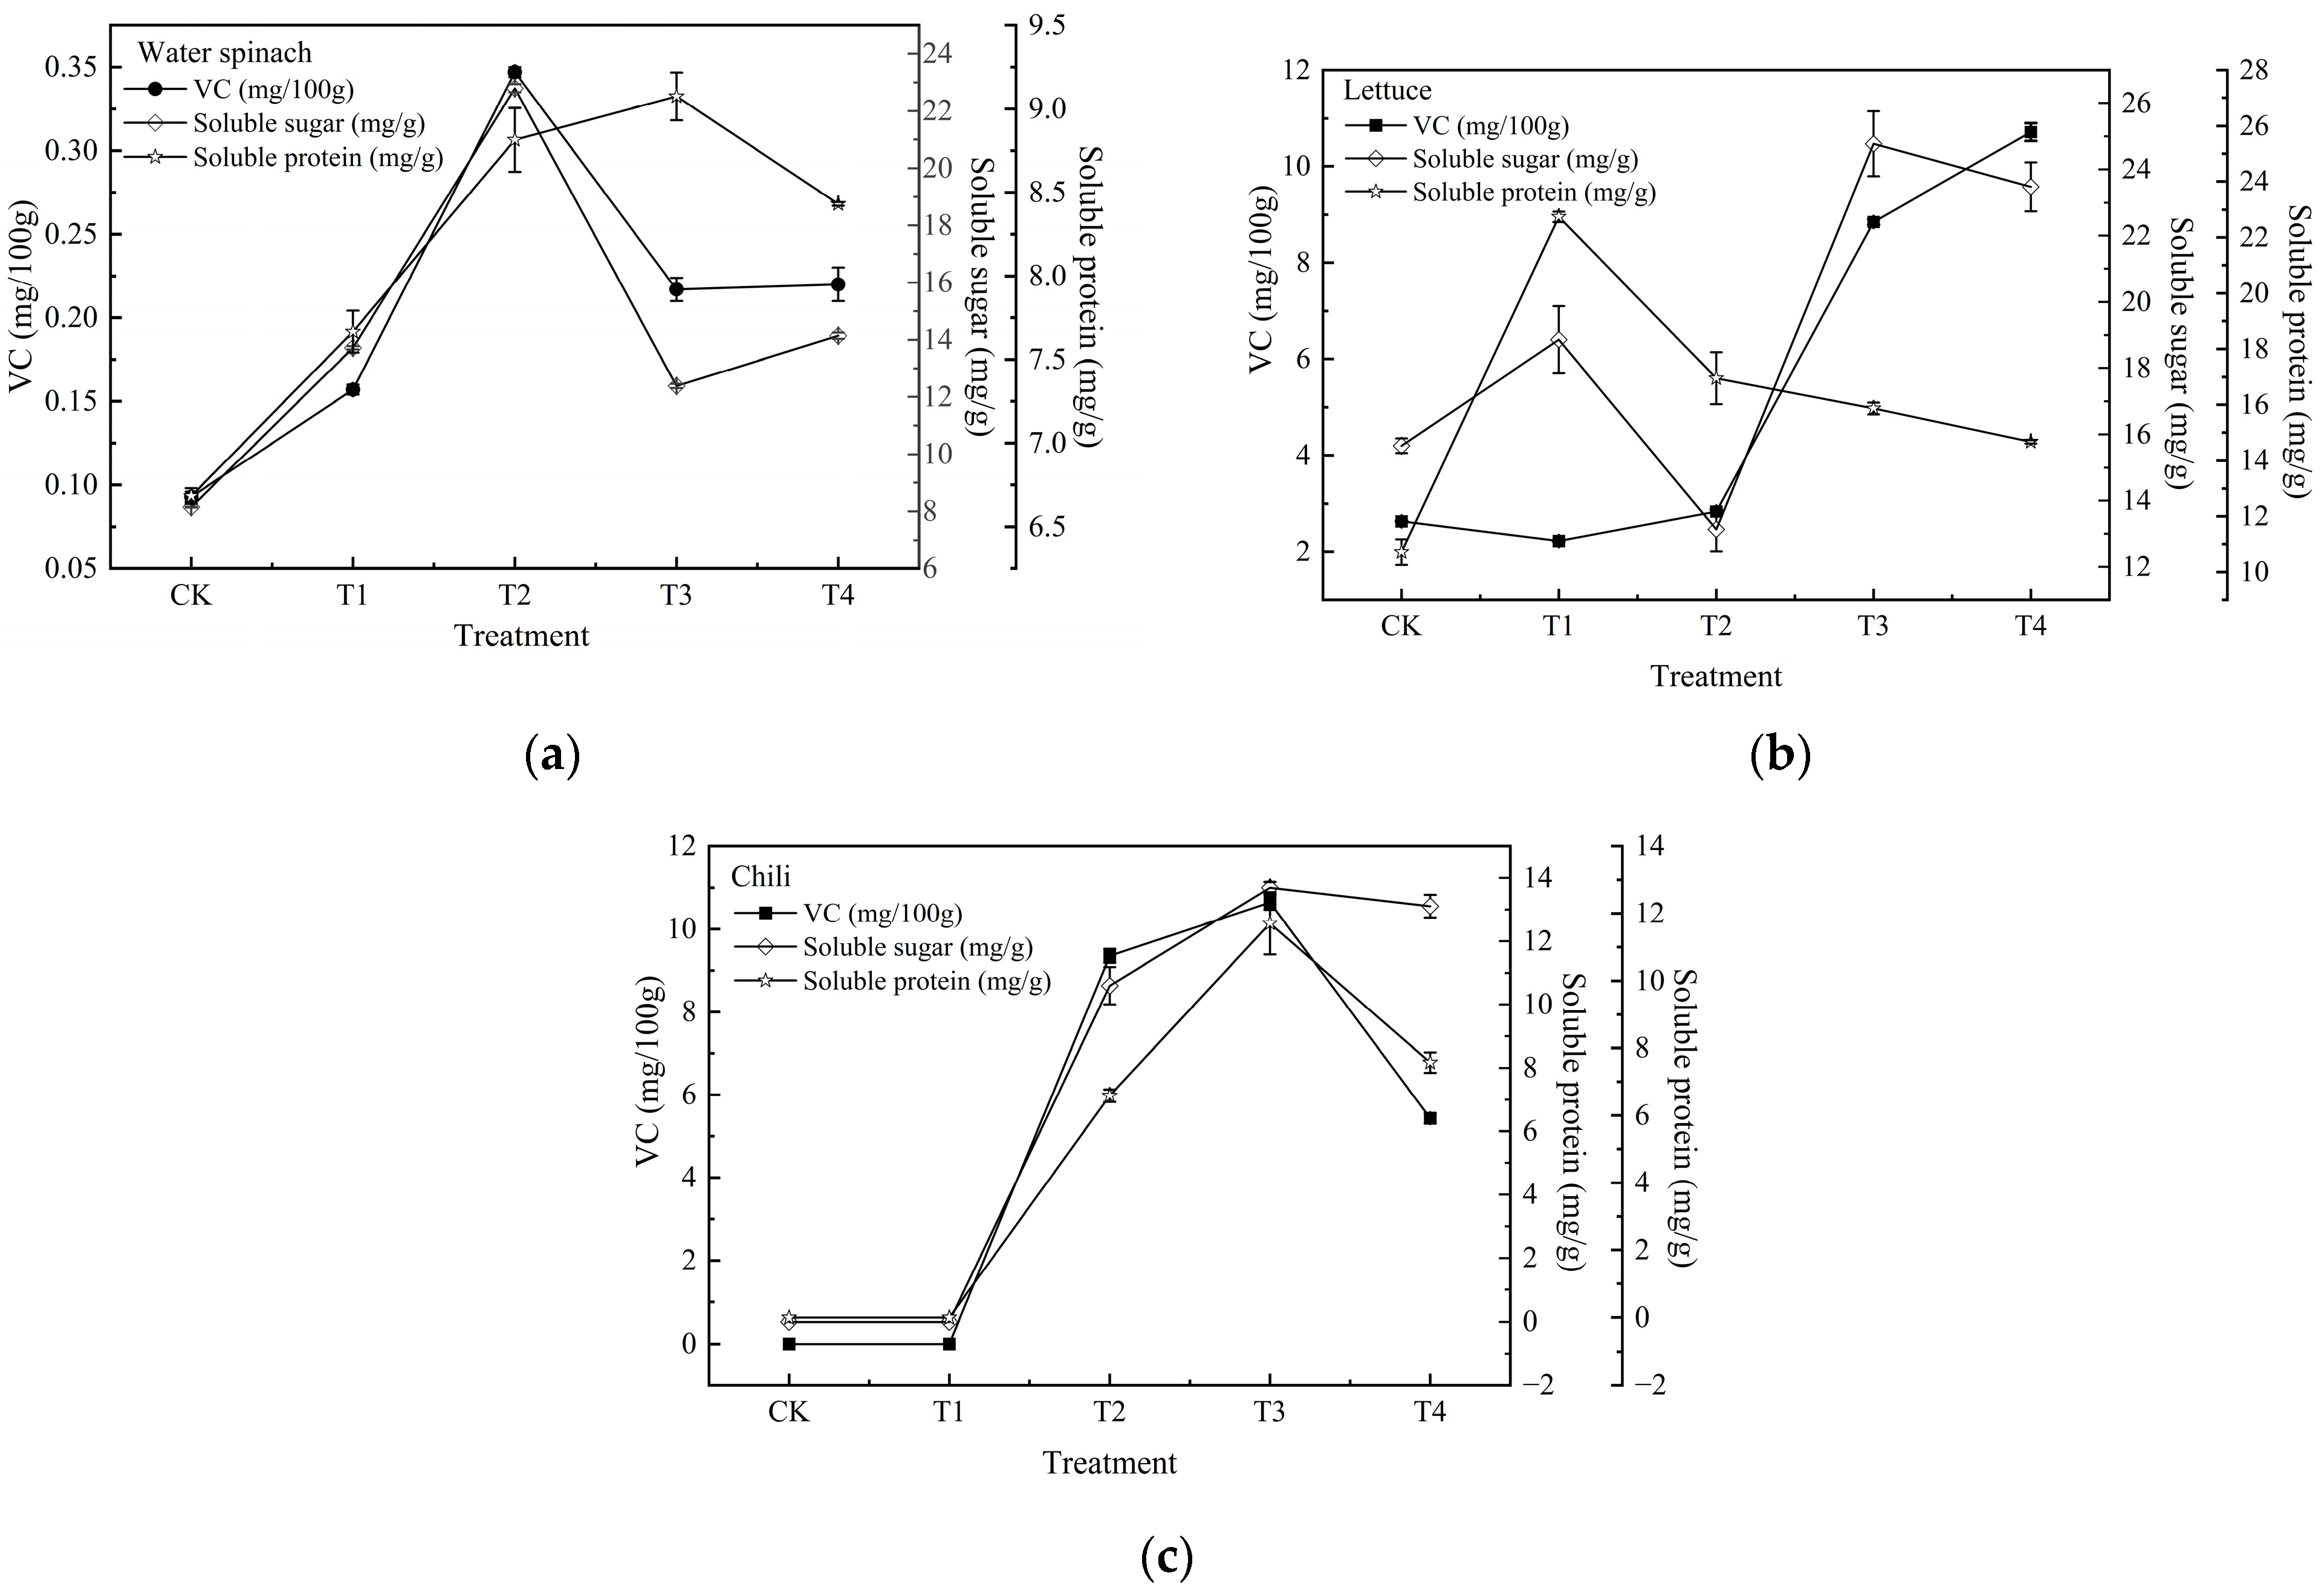
3.2.3. Impacts on Vegetable Quality

An analysis of nutritional quality parameters revealed significant improvements in vitamin C (VC), soluble sugar, and soluble protein content across all FPS treatments (Figure 6).
The incorporation of FPS significantly enhanced the nutritional quality of water spinach, with notable increases in key biochemical parameters. Specifically, the vitamin C (VC) content increased by 68.82–273.12%, the soluble sugar content by 51.94–179.72%, and the soluble protein content by 14.71–35.76% compared to CK. The most pronounced improvements were observed at FPS mixing ratios exceeding 40% (T2). Under T2, the VC content peaked at 0.35 mg/100 g, while soluble sugar levels followed the order T2 > T4 > T1 > T3 > CK, reaching a maximum of 22.80 mg·g−1. The soluble protein content was highest in the T3 treatment (9.07 mg·g−1), representing a 135.76% increase over CK. Similarly, chili demonstrated marked improvements, with T3 showing optimal performance in VC accumulation, soluble sugar (13.69 mg·g−1), and soluble protein (11.71 mg·g−1).
Collectively, these findings demonstrate that FPS amendment, particularly at incorporation rates ≥80% (T3–T4), substantially enhances the nutritional value of vegetables cultivated in saline–alkali soils. Among the tested crops, lettuce displayed the most comprehensive improvements in VC, soluble sugars, and protein content, highlighting its strong adaptability to sediment-enhanced growth conditions.

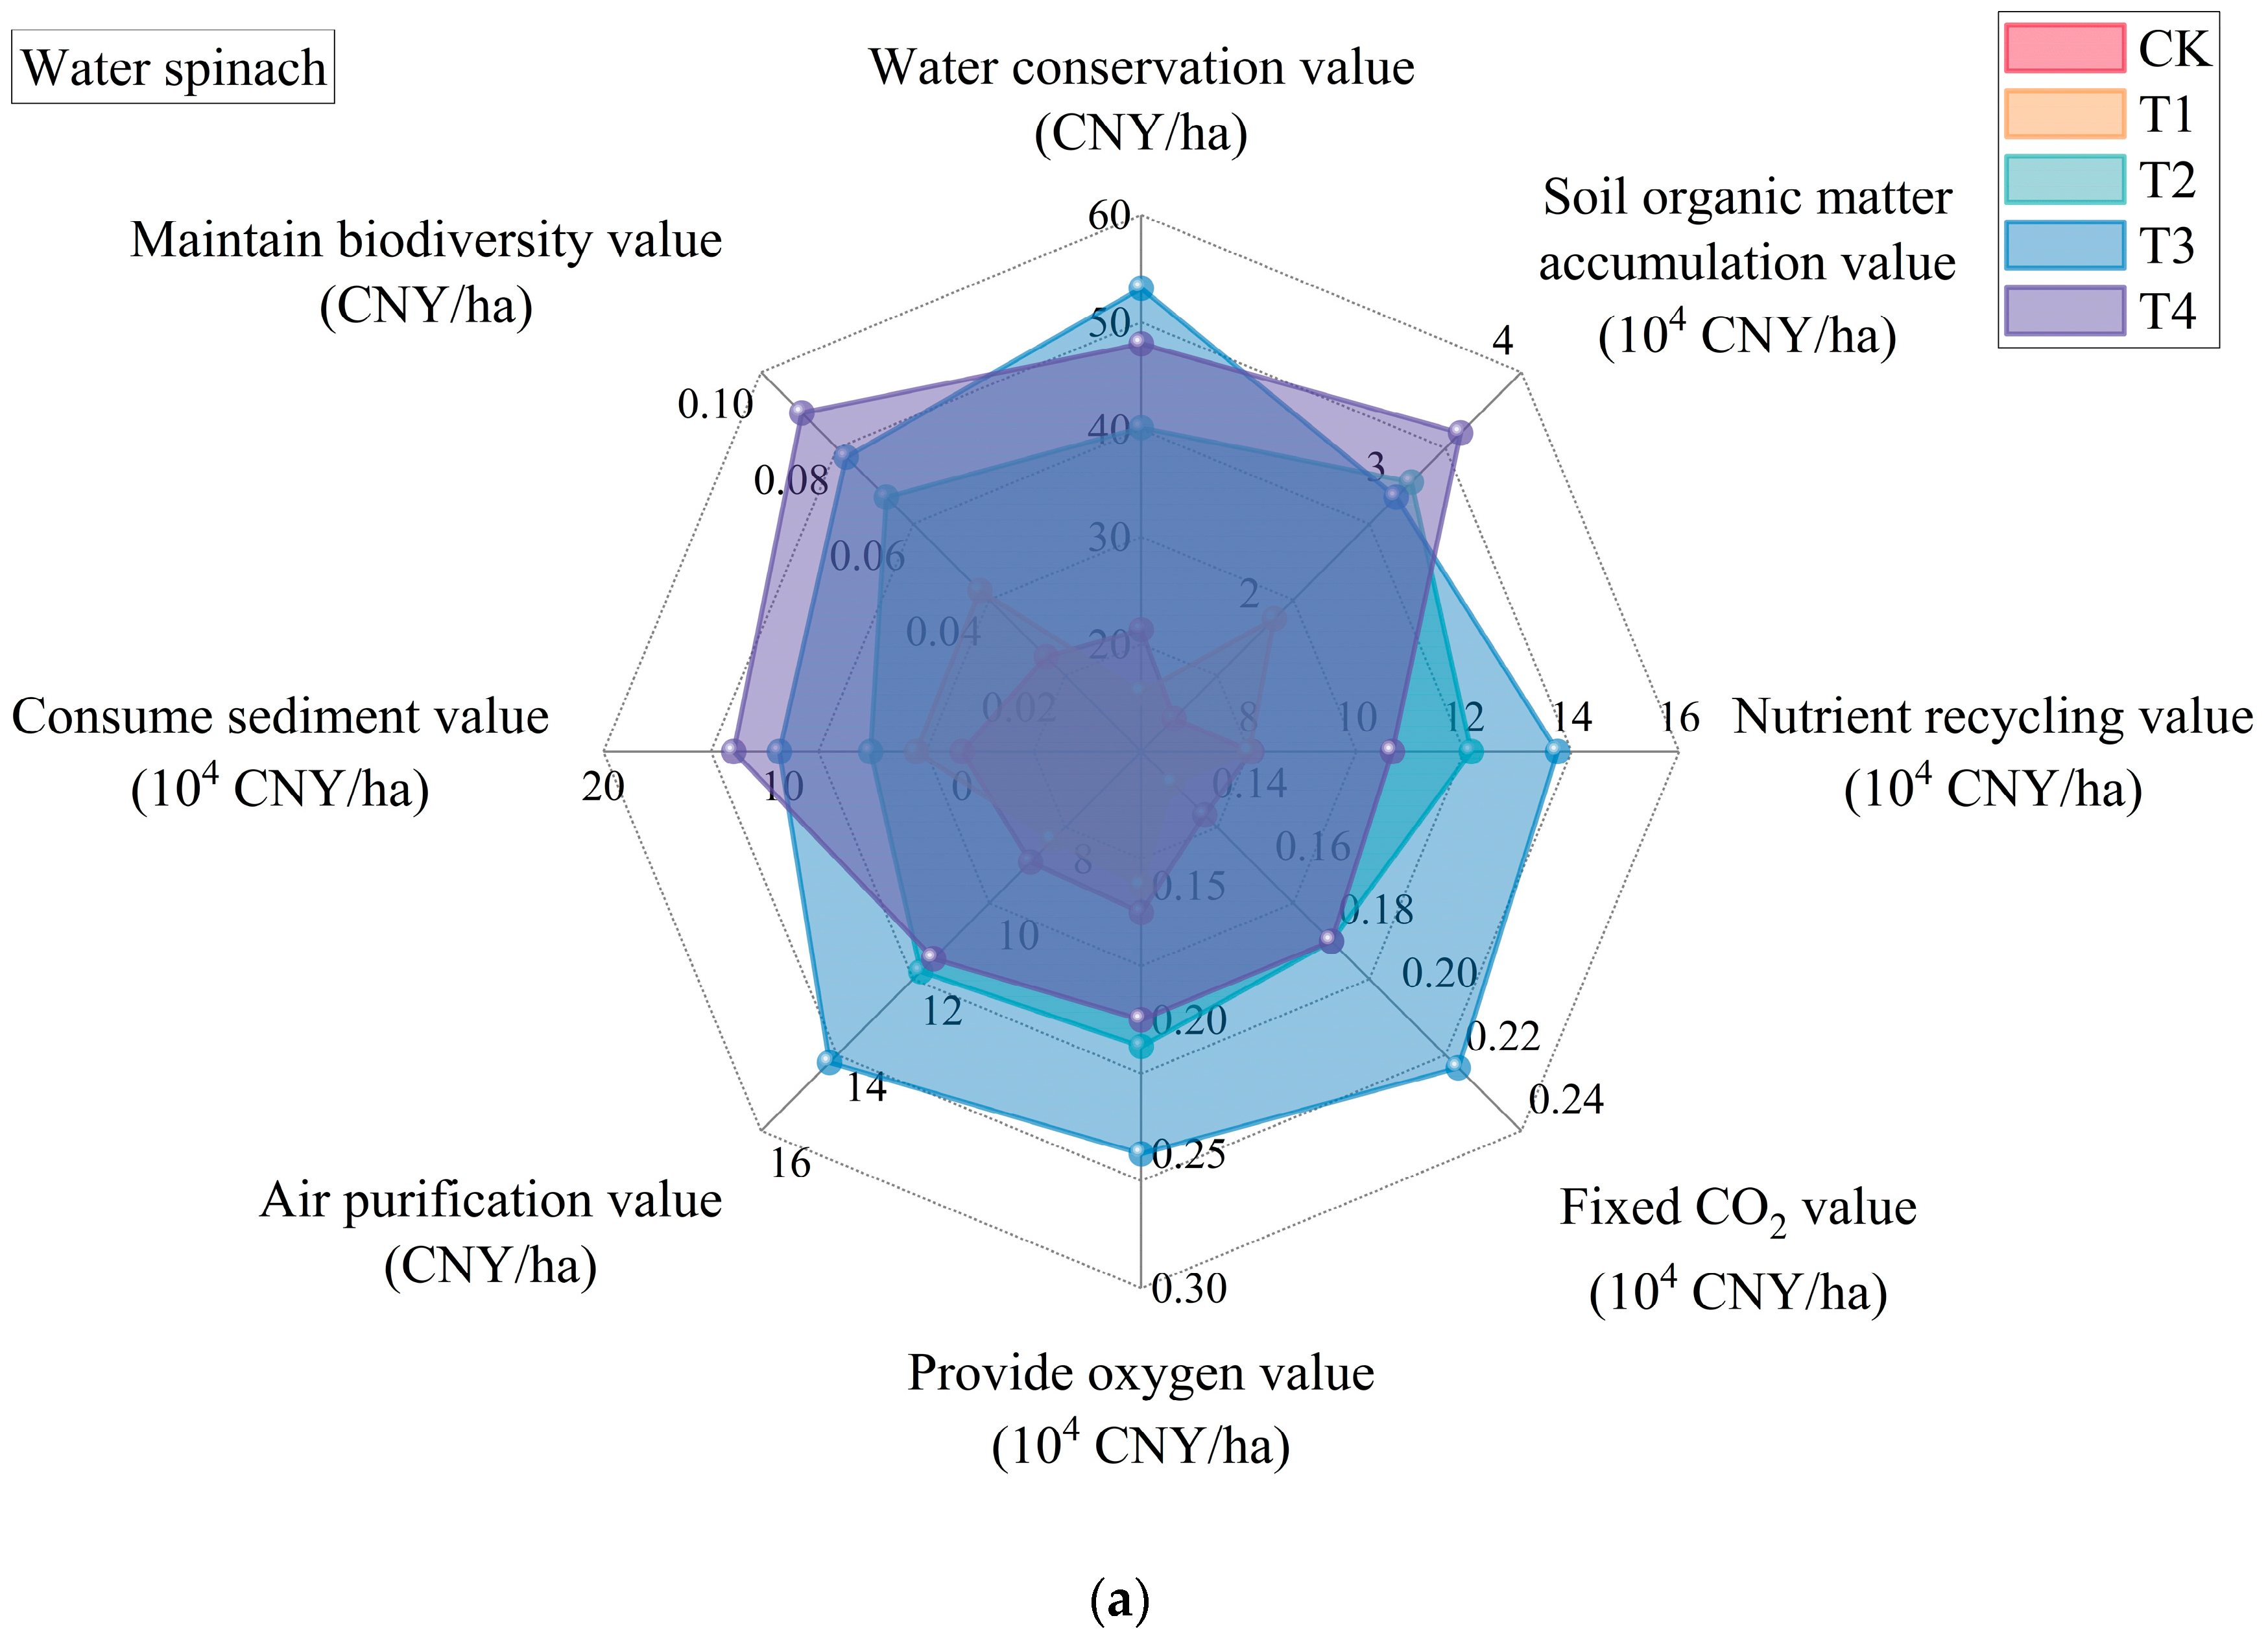
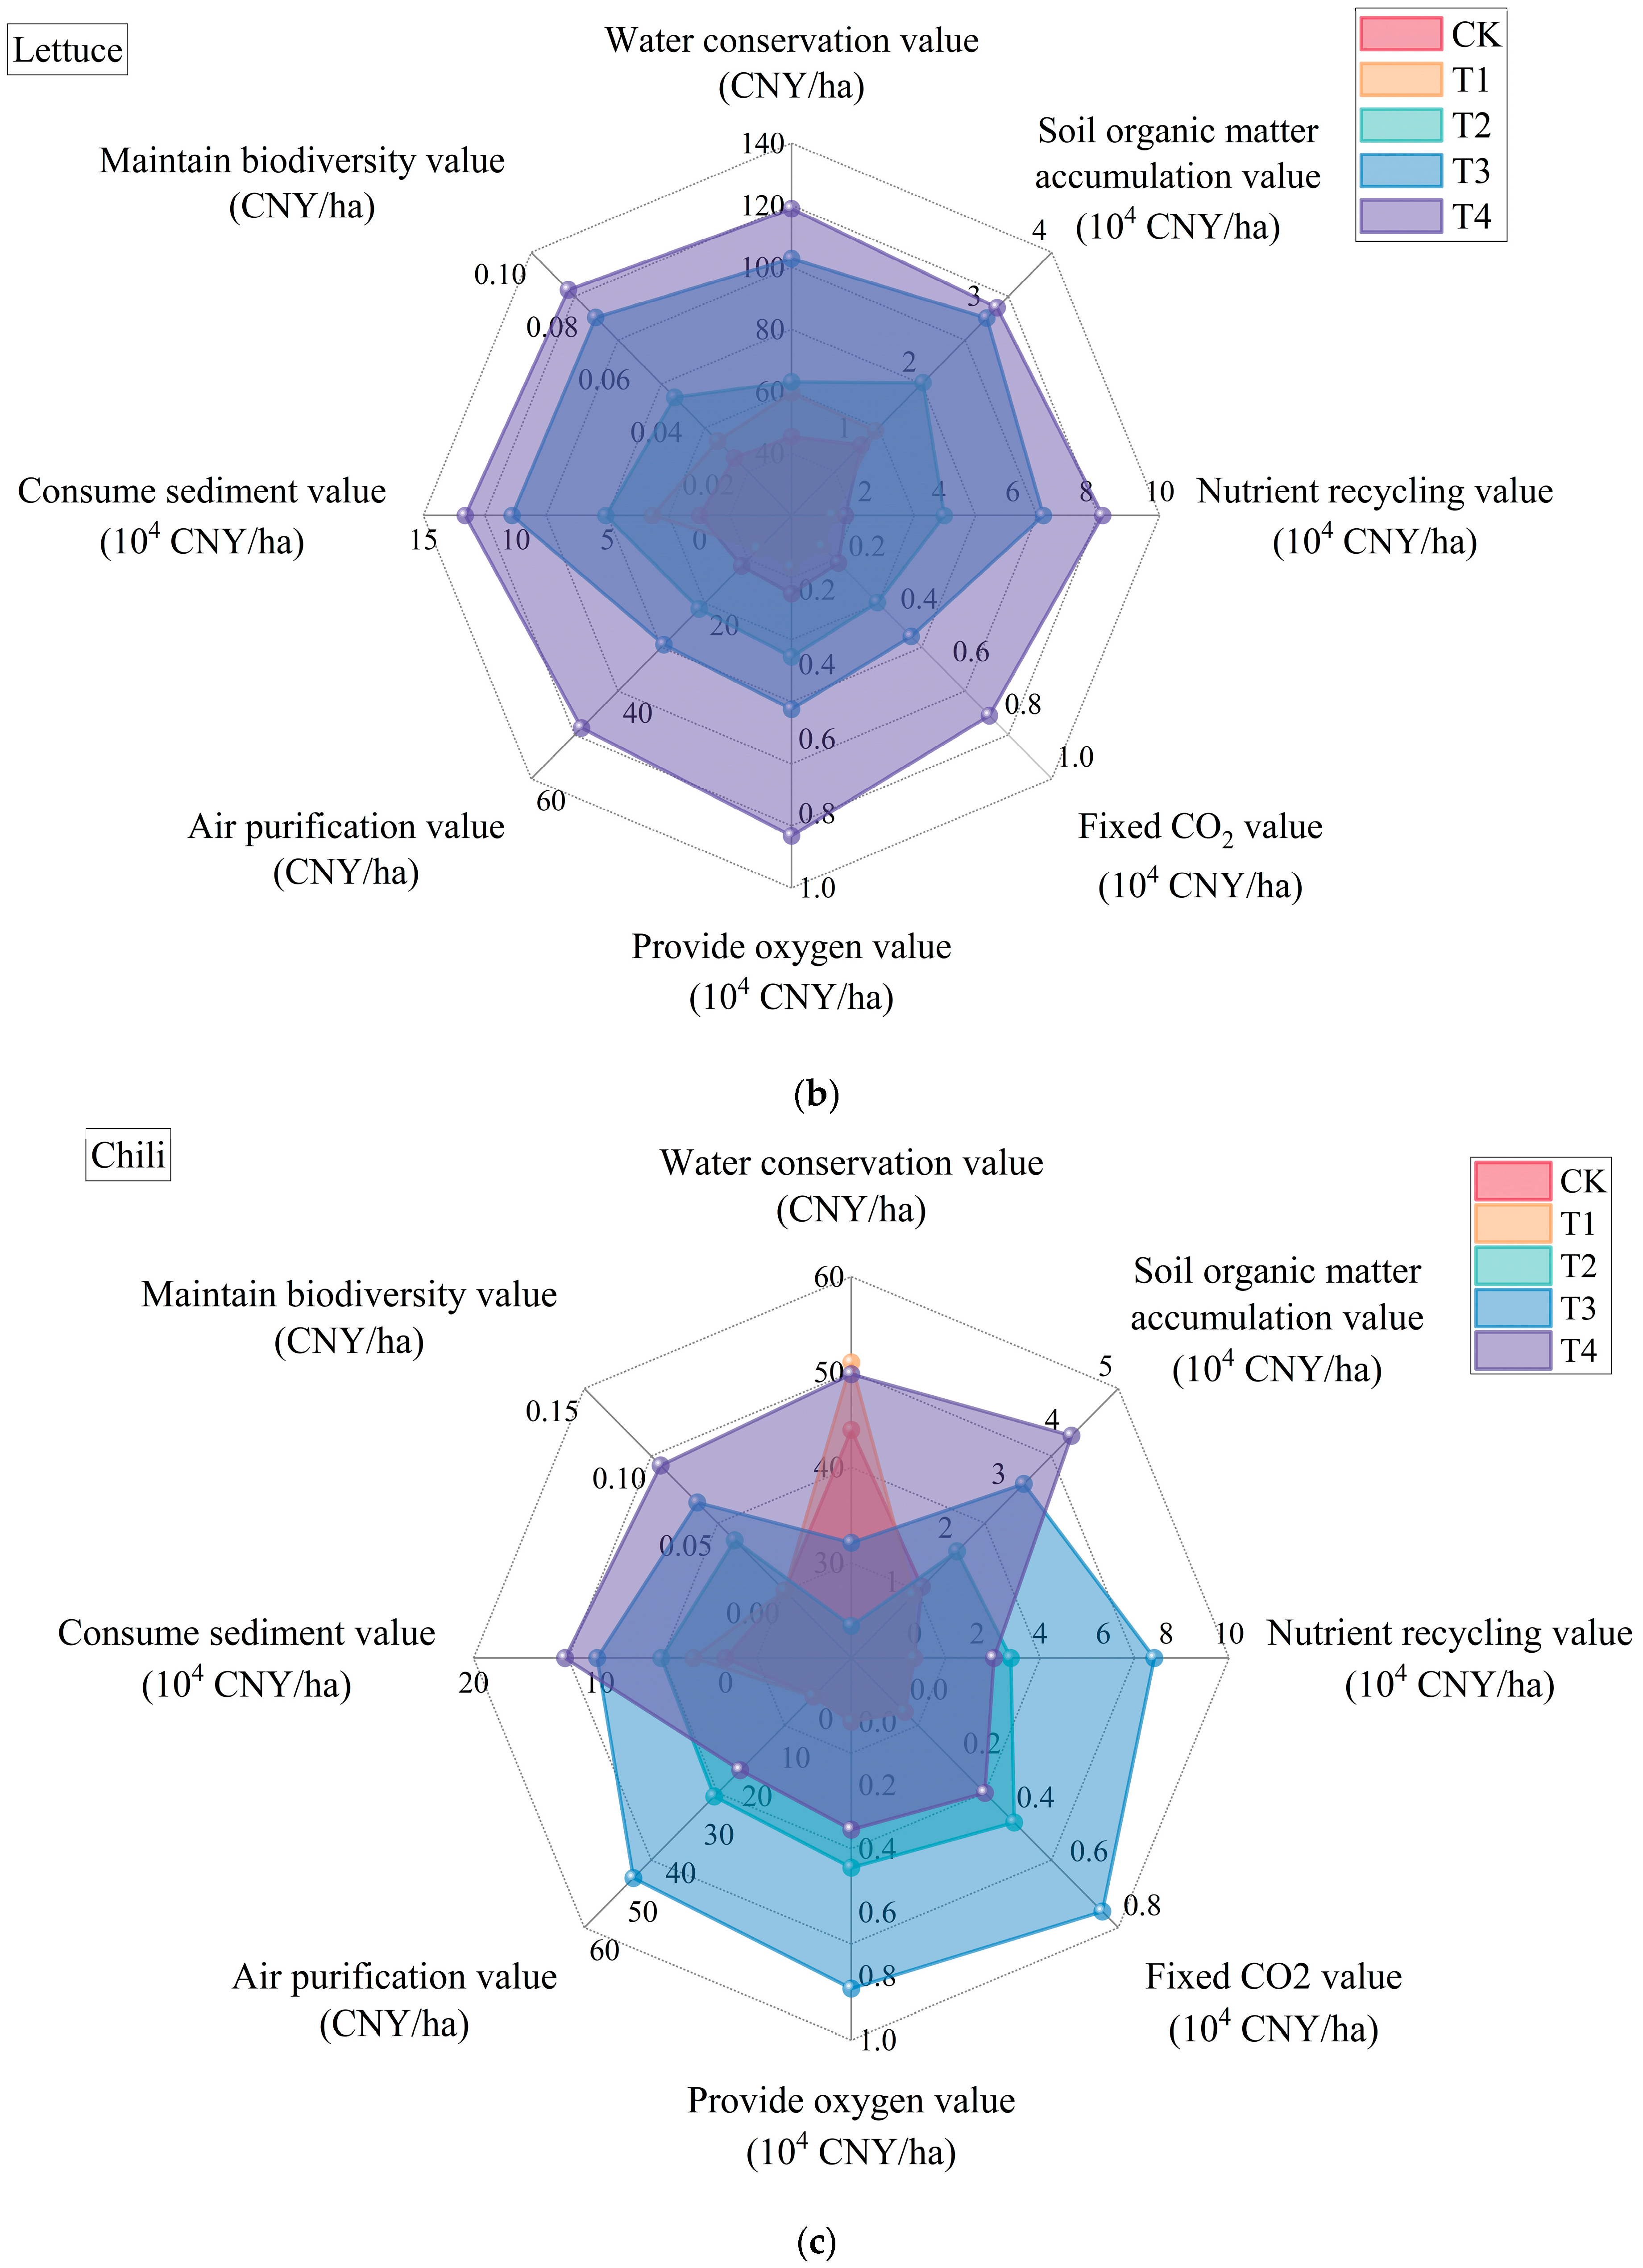
3.3. Ecological Benefit Evaluation of FPS Amendment

The evaluation using the Gross Ecosystem Product (GEP) accounting methodology (Figure 7 and Table 9) suggested the significant effects of FPS amendments on ecological benefits across the three vegetable cultivation systems. The detailed ecological benefits are shown in Table A2, Table A3, Table A4, Table A5, Table A6, Table A7, Table A8 and Table A9 (Appendix A).
The total ecological benefit values (Table 4) for water spinach followed the following order: T3 (274,951 CNY/ha) > T4 (274,060 CNY/ha) > T2 (208,317 CNY/ha) > T1 (129,302 CNY/ha) > CK (96,423 CNY/ha), with the 80% FPS amendment (T3) showing optimal performance. Lettuce systems exhibited a clear positive correlation between the FPS application rate and ecological benefits, demonstrating a gradient increase from CK (29,491 CNY/ha) to the T4 treatment (260,623 CNY/ha). Due to its relatively poor salt tolerance, chili showed significantly lower ecological benefits in CK and T1 treatments (13,245 CNY/ha and 37,127 CNY/ha respectively), though substantial improvements were still achieved in T2–T4 treatments (110,494–226,971 CNY/ha). Notably, the T3 treatment consistently generated the highest agricultural product value per unit area across all three vegetables, with water spinach (274,951 CNY/ha) outperforming lettuce (210,993 CNY/ha) and chili (226,971 CNY/ha).
The comprehensive analysis demonstrates that FPS amendments can significantly enhance the ecological benefits of SAS. Among the three vegetable systems examined, water spinach consistently exhibited superior ecological benefit values across all treatments (CK to T4), suggesting higher values than lettuce and chili. Water spinach exhibits exceptional potential for enhancing ecological benefits in sediment-amended saline soils.

4. Discussion

The reclamation of salt-affected soils requires systematic measures, with salinity reduction representing the fundamental prerequisite. Soil salinization is primarily caused by the excessive accumulation of soluble salts, such as sodium chloride (NaCl) [36,37], which induces a cascade of soil structural deterioration. Specifically, excessive exchangeable sodium can cause soil aggregate dispersion and compaction, ultimately compromising soil structural stability [38]. Characteristically, saline–alkali soils typically have a pH greater than 9, contain abundant quartz, and lack nutrients such as organic matter and inorganic carbonates. Previous studies have demonstrated that using Yellow River sediments as amendments can significantly improve the physical properties of saline–alkali soils.
When the application rate reaches 20 kg/m2, soil saturated hydraulic conductivity, macroporosity, and water transport capacity are markedly enhanced [39]. FPS is rich in nutrients and organic matter, which can compensate for the deficiencies of saline–alkali soils by supplementing nutrients such as N and P, regulating salinity, and maintaining the stability of trace elements like Cu and Zn [12,40]. The use of adjacent irrigation area sediments for saline soil remediation is effective, cost-efficient, and environmentally friendly [12,41], providing a viable approach for saline–alkali soil improvement.
This study innovatively employed FPS as an organic amendment by cultivating three vegetables to explore its multifaceted remediation effects. Using FPS as an organic amendment can provide saline–alkali soils with sufficient fertility to support vegetable growth and development, while the low salinity and neutral pH of FPS help neutralize the high salinity and weak alkalinity of coastal saline soils. In this study, the mixed treatment of FPS and saline–alkali soil resulted in reduced soil pH, EC, and bulk density, while total porosity and basal soil respiration increased, contributing to the alleviation of soil salinization. Additionally, indicators such as organic matter, total nitrogen, total phosphorus, and available phosphorus were improved, demonstrating that sediment addition promotes soil structure enhancement. These improvements are consistent with the findings of Cheng et al. [19], confirming that FPS can significantly enhance vegetable productivity in saline soils by reducing salt toxicity, increasing the organic matter content, and optimizing the nitrogen supply.
From a mechanistic perspective, the FPS amendment effects are manifested in three aspects: (1) physical improvement, fine sediment particles effectively fill soil pores, reducing bulk density [41]; (2) chemical improvement, adjusting the soil pH and EC while significantly increasing organic matter, total nitrogen, and available phosphorus, creating a suitable environment for microbial activity [41]; (3) biological improvement, enhancing the rhizosphere microenvironment, with a notable increase in basal soil respiration [42,43]. As the proportion of FPS increases, microbial biomass carbon (MBC) and nitrogen (MBN) are significantly enhanced, indicating improved microbial activity [44]. Notably, existing studies have demonstrated that soil organic carbon (SOC) accumulation shows a significant negative correlation with pH (β = −0.36), while labile organic carbon (ROC) has a significant positive effect on SOC (β = 0.66) [5,45], explaining the mechanism by which FPS amendments promote carbon sequestration. Although this study found limited improvements in potassium levels, the comprehensive benefits still make FPS an ideal material for saline–alkali soil remediation. Future research could explore combining FPS with potassium fertilizers to develop a more robust saline soil improvement system.
Existing studies demonstrate that systematic ecosystem service valuation methods provide a methodological framework for assessing the ecological benefits of using FPS to remediate saline–alkali soils, highlighting its value in enhancing regulating services (e.g., carbon sequestration, nutrient cycling) and provisioning services (e.g., vegetable yield increase) [46]. In practical applications, this study found that the T3 treatment group (80% FPS mixed with 20% saline–alkali soil) exhibited the best remediation effects. Compared with the findings of Zhu and Zhu [47], this study revealed that water spinach outperformed other vegetables (e.g., tomato, eggplant, cauliflower, cabbage, and potato) in terms of economic benefits in remediated saline–alkali soils. Cultivating water spinach generated higher returns, with the total edible yield increasing by 166–217% and economic benefits rising by 65–116%.
Although sludge has been commonly used as a soil amendment, it is essential to manage the risk of heavy metal contamination when applying FPS. Leafy vegetables, in particular, tend to accumulate lead [40]. However, it is important to note that the heavy metal pollution index (Table A10) for water spinach and chili in all treatments meets food safety standards (GB2762-2017) [48], indicating that choosing appropriate crops can effectively avoid the risk of heavy metal migration. In practical applications, low-accumulation vegetables (such as water spinach) could be prioritized for planting, and the heavy metal screening of the sludge should be carried out before planting.
This study further employed Gross Ecosystem Product (GEP) accounting techniques, demonstrating that water spinach cultivation exhibited particularly outstanding performance in enhancing ecological benefits. By integrating the remediation effects of FPS on saline–alkali soils, vegetable growth performance, and quality improvement, an ecological benefit assessment of the integrated sediment–saline soil–vegetable co-cultivation model was conducted, systematically exploring the optimal FPS application ratio and the maximum benefits achievable under this ratio. However, this study has certain limitations in the quantification of ecological benefits. The valuation process was primarily based on simulated vegetable cultivation under experimental conditions, meaning the data may be influenced by experimental errors and environmental factors (e.g., weather, temperature, planting density). Additionally, the reference to traditional cultivation data and averaging methods in the comprehensive benefit valuation may introduce uncertainties, affecting the accuracy of the final results. Therefore, the estimates in this study may not fully reflect real-world vegetable cultivation scenarios and should be regarded as preliminary assessments of the comprehensive benefits under FPS amendment practices.

5. Conclusions

This study demonstrates that the application of FPS effectively ameliorates saline–alkali soil by simultaneously reducing soil pH and salinity while enhancing organic matter content, nutrient availability, and microbial activity. Among the tested crops, water spinach cultivation exhibits the most pronounced growth improvements. The results indicate that incorporating more than 40% FPS significantly enhances key vegetable growth parameters, whereas an incorporation rate exceeding 80% leads to a marked increase in edible biomass and contributes to improved vegetable quality. The use of FPS as a soil conditioner presents a viable alternative to conventional saline–alkali land remediation methods, offering additional benefits through increased crop productivity and quality.
The ecological value assessment reveals that the T3 treatment yields the highest economic return when cultivating water spinach. This combination of FPS and vegetables is a cost-effective strategy for saline–alkali land improvement. However, in practical implementation, challenges related to improvement costs remain. Therefore, the optimal application rate of FPS should be further evaluated to achieve efficient and economically sustainable outcomes. In coastal irrigation zones with accessible FPS resources, particularly tidal flat areas, the combined application of FPS amendment and water spinach cultivation demonstrates synergistic potential for optimizing both ecological restoration and agricultural profitability. For field applications, an FPS incorporation ratio of 20% to 40% may represent the optimal balance between cost-effectiveness and soil improvement performance. This study demonstrates that the integrated aquaculture–agriculture systems offer new insights and valuable references for simultaneously addressing agricultural waste resource utilization and saline–alkali land improvement. The ecological value assessment can provide a scientific basis for governments to formulate ecological compensation and subsidy policies and to promote project implementation.

Author Contributions

Conceptualization, Z.L.; methodology, Z.L.; software, Z.L. and Z.Z.; validation, Z.Z. and Y.G.; formal analysis, Z.Z. and Y.G.; investigation, L.L. and Z.L.; writing—original draft preparation, L.L. and Z.Z.; writing—review and editing, J.D. and D.C.; supervision, Z.L. and D.C.; project administration, Z.L.; funding acquisition, Z.L. All authors have read and agreed to the published version of the manuscript.

Funding

This research was funded by the Ministry of Science and Technology of the People’s Republic of China (MOST) through the National Key Research and Development Program of China (Grant No. 2020YFD0900703).

Data Availability Statement

The data that support this study cannot be publicly shared due to ethical or privacy reasons and may be shared upon reasonable request to the corresponding author if appropriate.

Acknowledgments

We are grateful to the reviewers and editors for their insightful reviews and valuable comments that helped to improve the manuscript.

Conflicts of Interest

Author Luhao Lv was employed by the company Jiangsu Rainfine Environmental Science and Technology Company Limited. The remaining authors declare that the research was conducted in the absence of any commercial or financial relationships that could be construed as a potential conflict of interest.

Appendix A

Table A1. Classification of pollution degrees.
ClassPiPnPollution DegreePollution Degree
IPi ≤ 1Pn ≤ 0.7SafeClean
II1 ≤ Pi ≤ 20.7< Pn ≤ 1.0Warning ThresholdRelatively Clean
III2 ≤ Pi ≤ 31< Pn ≤ 2Slight ContaminationLight Pollution
IV3 ≤ Pi ≤52< Pn ≤ 3Moderate ContaminationModerate Pollution
VPi > 5Pn > 3.0Severe ContaminationSevere Pollution
Table A2. Accumulation value of soil organic matter under different mixing ratios of FPS and saline–alkali soil.
Types of VegetablesTreatmentSoil Bulk Density (kg/m3)Soil Organic Matter Content (%)Soil Organic Matter Accumulation Value (CNY)Accumulation Value of Soil Organic Matter per Unit Area (CNY/hm2)
Water spinachCK 112206.728.91 × 10−212,602.97
T1 2121011.051.45 × 10−120,519.90
T2 3117017.372.21 × 10−131,300.69
T3 497020.152.13 × 10−130,073.63
T4 5100022.902.49 × 10−135,249.48
LettuceCK12605.537.56 × 10−210,692.91
T111807.139.13 × 10−212,911.06
T2116011.341.43 × 10−120,232.64
T3103018.962.12 × 10−129,998.73
T495021.682.23 × 10−131,577.95
ChiliCK14505.929.33 × 10−213,201.09
T112805.928.21 × 10−211,616.09
T213509.481.40 × 10−119,782.17
T3127016.592.28 × 10−132,297.68
T4115023.302.91 × 10−141,212.55
1 CK, 2 T1, 3 T2, 4 T3, 5 T4: experimental treatments with FPS mass percentages of 0% (control), 20%, 40%, 80%, and 100%.
Table A3. Nutrient recycling value under different mixing ratios of FPS and SAS.
Types of VegetablesTreatmentNutrient Recycling Value (CNY)Circulating Value of Nutrients per Unit Area (CNY/hm2)
Water spinachCK 15.69 × 10−180,557.02
T1 25.66 × 10−180,080.97
T2 38.58 × 10−1121,422.30
T3 49.71 × 10−1137,440.00
T4 57.54 × 10−1106,723.70
LettuceCK1.04 × 10−114,672.65
T17.99 E-0211,316.07
T22.94 × 10−141,544.76
T34.83 × 10−168,417.53
T45.97 × 10−184,520.05
ChiliCK//
T1//
T22.17 × 10−130,688.47
T35.39 × 10−176,333.84
T41.79 × 10−125,338.65
1 CK, 2 T1, 3 T2, 4 T3, 5 T4: experimental treatments with FPS mass percentages of 0% (control), 20%, 40%, 80%, and 100%.
Table A4. The value of soil water conservation under different mixing ratios of FPS and SAS.
Types of VegetablesTreatmentWater Conservation Value (CNY)Water Conservation Value per Unit Area (CNY/hm2)
Water spinachCK 11.51 × 10−421.35
T1 21.10 × 10−415.50
T2 32.98 × 10−440.16
T3 43.76 × 10−453.18
T4 53.39 × 10−448.01
LettuceCK3.21 × 10−445.42
T14.21 × 10−459.57
T24.46 × 10−463.10
T37.27 × 10−4102.82
T48.40 × 10−4118.86
ChiliCK3.11 × 10−443.93
T13.61 × 10−451.00
T21.65 × 10−423.39
T32.27 × 10−432.10
T43.52 × 10−449.78
1 CK, 2 T1, 3 T2, 4 T3, 5 T4: experimental treatments with FPS mass percentages of 0% (control), 20%, 40%, 80%, and 100%.
Table A5. The fixation value of CO2 under different mixing ratios of FPS and SAS.
Types of VegetablesTreatmentBiomass (kg)Fixed CO2 Value (CNY)Fixed CO2 Value per Unit Area (CNY/hm2)
Water spinachCK 12.34 × 10−29.86 × 10−31394.10
T1 22.19 × 10−29.22 × 10−31305.74
T2 33.10 × 10−21.31 × 10−21847.89
T3 43.73 × 10−21.57 × 10−22222.22
T4 53.01 × 10−21.27 × 10−21793.27
LettuceCK3.02 × 10−31.27 × 10−21799.23
T12.02 × 10−38.51 × 10−31203.46
T25.59 × 10−32.35 × 10−23330.35
T37.73 × 10−33.26 × 10−24605.30
T41.27 × 10−25.35 × 10−27572.23
ChiliCK///
T1///
T26.81 × 10−32.87 × 10−24057.19
T31.24 × 10−25.21 × 10−27369.67
T45.02 × 10−32.11 × 10−22990.76
1 CK, 2 T1, 3 T2, 4 T3, 5 T4: experimental treatments with FPS mass percentages of 0% (control), 20%, 40%, 80%, and 100%.
Table A6. Provided O2 value at different mixing ratios of FPS and saline–alkaline soil.
Types of VegetablesTreatmentBiomass (kg)Provide Oxygen Value (CNY)Provide Oxygen Value per Unit Area (CNY/hm2)
Water spinachCK 12.34 × 10−21.12 × 10−21588.69
T1 22.19 × 10−21.05 × 10−21486.85
T2 33.10 × 10−21.49 × 10−22104.67
T3 43.73 × 10−21.79 × 10−22532.39
T4 53.01 × 10−21.44 × 10−22043.56
LettuceCK3.02 × 10−31.50 × 10−22050.35
T12.02 × 10−39.70 × 10−31371.43
T25.59 × 10−32.68 × 10−23795.19
T37.73 × 10−33.71 × 10−25248.09
T41.27 × 10−26.10 × 10−28629.14
ChiliCK///
T1///
T26.81 × 10−33.27 × 10−24623.48
T31.24 × 10−25.94 × 10−28398.30
T45.02 × 10−32.41 × 10−23408.20
1 CK, 2 T1, 3 T2, 4 T3, 5 T4: experimental treatments with FPS mass percentages of 0% (control), 20%, 40%, 80%, and 100%.
Table A7. The value of air purification under different mixing ratios of FPS and SAS.
Types of VegetablesTreatmentBiomass (kg/hm2)Correction FactorAbsorb SO2 (kg/hm2·a)Absorb NOx (kg/hm2·a)Dust Reduction (t/hm2·a)Air Purification Value (CNY)Air Purification Value per Unit Area (CNY/hm2)
Water spinachCK 13309.760.188.125.960.276.29 × 10−58.91
T1 23097.600.177.605.580.255.89 × 10−58.34
T2 34384.720.2410.767.890.368.34 × 10−511.80
T3 45275.810.2912.959.500.431.00 × 10−414.20
T4 54257.430.2310.457.660.358.10 × 10−511.46
LettuceCK4271.570.2310.497.690.355.43 × 10−511.50
T12857.140.167.015.140.231.50 × 10−47.69
T27906.650.4319.4114.230.652.08 × 10−421.28
T310,933.520.6026.8419.680.893.42 × 10−429.43
T417,977.370.9844.1332.361.471.83 × 10−448.39
ChiliCK///////
T1///////
T29632.250.5323.6417.340.791.83 × 10−425.93
T317,496.460.9542.9531.491.433.33 × 10−447.10
T47100.420.3917.4312.780.581.35 × 10−419.11
1 CK, 2 T1, 3 T2, 4 T3, 5 T4: experimental treatments with FPS mass percentages of 0% (control), 20%, 40%, 80%, and 100%.
Table A8. The value of FPS consumption under different mixing ratios of FPS and SAS.
Types of VegetablesTreatmentAddition of FPS (kg)Consume Sediment Value (CNY)Consumption Value of Sediment per Unit Area (CNY/hm2)
Water spinachCK 10.000.000.00
T1 22.001.80 × 10−125,459.69
T2 34.003.60 × 10−150,919.38
T3 48.007.20 × 10−1101,838.80
T4 510.009.00 × 10−1127,298.40
LettuceCK0.000.000.00
T12.001.80 × 10−125,459.69
T24.003.60 × 10−150,919.38
T38.007.20 × 10−1101,838.80
T410.009.00 × 10−1127,298.40
ChiliCK0.000.000.00
T12.001.80 × 10−125,459.69
T24.003.60 × 10−150,919.38
T38.007.20 × 10−1101,838.80
T410.009.00 × 10−1127,298.40
1 CK, 2 T1, 3 T2, 4 T3, 5 T4: experimental treatments with FPS mass percentages of 0% (control), 20%, 40%, 80%, and 100%.
Table A9. The value of maintaining biodiversity under different mixing ratios of FPS and SAS.
Types of VegetablesTreatmentOrganic Matter Content (g)Total Plant Biomass (g)Extra-Plant Biomass (g)IiMaintain Biodiversity Value (CNY/hm2)
Water spinachCK 167.1623.3834.620.40250.02
T1 2110.4821.9146.700.68424.53
T2 3173.6630.9751.291.07670.08
T3 4201.4937.3259.071.24776.35
T4 5229.0030.0559.991.42892.25
LettuceCK55.313.0269.530.35218.89
T171.312.0267.100.45283.72
T2113.365.5992.510.71449.11
T3189.627.73149.361.20752.54
T4216.8512.71127.101.37857.51
ChiliCK/////
T1/////
T294.756.8129.300.59373.67
T3165.8812.3740.951.04653.83
T4232.955.0228.001.48928.08
Conventional cultivation conditions213.60283.00426.00/628.20
1 CK, 2 T1, 3 T2, 4 T3, 5 T4: experimental treatments with FPS mass percentages of 0% (control), 20%, 40%, 80%, and 100%.
Table A10. Effects of mixture of FPS and saline–alkaline soil on absorption of heavy metals by vegetables.
Types of VegetablesTreatmentPiPnPollution DegreePollution Degree
CdCrPbAsCuZnNi
Water spinachCK 10.470.790.340.120.110.030.260.60SafeClean
T1 20.510.760.210.060.180.040.140.57SafeClean
T2 30.470.610.110.050.180.040.050.46SafeClean
T3 40.410.510.090.040.140.030.020.39SafeClean
T4 50.310.200.070.030.120.040.020.23SafeClean
LettuceCK0.390.100.470.110.120.040.090.36SafeClean
T10.380.130.510.150.100.050.500.40SafeClean
T20.880.661.610.400.170.100.331.22Slight ContaminationLight Pollution
T30.900.100.490.100.160.190.080.67SafeClean
T40.390.050.160.050.160.190.200.30SafeClean
ChiliCK////////
T1////////
T20.160.350.100.010.120.020.120.64SafeClean
T30.070.200.040.010.100.020.050.36SafeClean
T40.050.040.140.020.080.020.160.35SafeClean
1 CK, 2 T1, 3 T2, 4 T3, 5 T4: experimental treatments with FPS mass percentages of 0% (control), 20%, 40%, 80%, and 100%.

References

  1. Zhang, K.; Chang, L.; Li, G.; Li, Y. Advances and future research in ecological stoichiometry under saline-alkali stress. Environ. Sci. Pollut. Res. 2023, 30, 5475–5486. [Google Scholar] [CrossRef] [PubMed]
  2. Lu, Z.G.; Xu, X.L.; Ma, C. Properties and synthesis mechanism of saline-alkali soil biomass brick. Chem. Eng. J. 2025, 511, 162303. [Google Scholar] [CrossRef]
  3. Wang, Z.J.; Zhuang, J.J.; Zhao, A.P.; Li, X.X. Types, harms and improvement of saline soil in songnen plain. In Proceedings of the International Symposium on Application of Materials Science and Energy Materials (SAMSE), Shanghai, China, 28 December 2017. [Google Scholar]
  4. Zhang, P.; Bing, X.; Jiao, L.; Xiao, H.; Li, B.X.; Sun, H.W. Amelioration effects of coastal saline-alkali soil by ball-milled red phosphorus-loaded biochar. Chem. Eng. J. 2022, 431, 133904. [Google Scholar] [CrossRef]
  5. Qiu, S.Y.; Wang, Z.Y.; Xu, J.L.; Cui, E.R.; Yan, L.M. Influence of vegetation dynamics on soil organic carbon and its fractions in a coastal wetland. Ecosyst. Health Sustain. 2023, 9, 0016. [Google Scholar] [CrossRef]
  6. Yu, J.; Wang, Y. Evolution of deep-sea fisheries policies in China: Review, performance and prospects. Fish. Manag. Ecol. 2023, 30, 109–120. [Google Scholar] [CrossRef]
  7. Zhao, W.; Shen, H. A statistical analysis of China’s fisheries in the 12th five-year period. Aquac. Fish. 2016, 1, 41–49. [Google Scholar] [CrossRef]
  8. Wang, R. A brief discussion on the properties and treatment methods of fish pond silt. Jiangxi Fish. Sci. Technol. 2015, 2, 18–19. [Google Scholar] [CrossRef]
  9. Pham, T.A.; Kroeze, C.; Bush, S.R.; Mol, A.P.J. Water pollution by Pangasius production in the Mekong Delta, Vietnam: Causes and options for control. Aquac. Res. 2010, 42, 108–128. [Google Scholar] [CrossRef]
  10. Xi, S.; Hou, Z.; Chen, L.; Wang, Z.; Miao, L. Ex-situ treatment of black-odorous sediment by combining activated sludge and advanced oxidants. J. Water Process. Eng. 2022, 46, 102464. [Google Scholar] [CrossRef]
  11. Roddy, M.E.; Viney, W.E.; Platt, C.T.; Rúa, M.A. The use of dredged sediments as a soil amendment for improving plant responses in prairie restorations. Ecol. Restor. 2023, 41, 70–74. [Google Scholar] [CrossRef]
  12. Zhao, Y.Y.; Zhang, Z.Y.; Li, Z.H.; Yang, B.H.; Li, B.; Tang, X.D.; Lai, Y.W. Comprehensive study on saline-alkali soil amelioration with sediment of irrigation area in northeast China. Arab. J. Chem. 2023, 16, 104608. [Google Scholar] [CrossRef]
  13. Mehmood, S.; Ahmed, W.; Mahmood, M.; Rizwan, M.S.; Asghar, R.M.A.; Alatalo, J.M.; Imtiaz, M.; Akmal, M.; Abdelrahman, H.; Ma, J.; et al. Aquaculture sediments amended with biochar improved soil health and plant growth in a degraded soil. Mar. Pollut. Bull. 2023, 191, 114899. [Google Scholar] [CrossRef]
  14. Fang, Y.; Huang, H.; Wang, X.; Zhao, Y.; Gao, Y.; Cui, X. Effects of composite soil conditioner on soil properties and corn yield in a saline-alkali soil. Soil Use Manag. 2024, 40, e13095. [Google Scholar] [CrossRef]
  15. Shyam, S.; Das, T.; Kumar, G.V.P. Co-composting invasive aquatic macrophytes and pond sediment holds the potential for environmental amelioration: Selecting the right shade of grey. Acta Ecol. Sin. 2022, 42, 17–23. [Google Scholar] [CrossRef]
  16. Scherwietes, E.; Stein, M.; Six, J.; Bawen, T.K.; Schaller, J. Local sediment amendment can potentially increase barley yield and reduce the need for phosphorus fertilizer on acidic soils in Kenya. Front. Environ. Sci. 2024, 12, 1458360. [Google Scholar] [CrossRef]
  17. Brigham, R.D.; Pelini, S.; Xu, Z.H.; Vázquez-Ortega, A. Assessing the effects of lake-dredged sediments on soil health: Agricultural and environmental implications for northwestern Ohio. J. Environ. Qual. 2021, 50, 494–503. [Google Scholar] [CrossRef]
  18. Thi, C.D.; Tu, P.A.; Livsey, J.; Tang, V.T.; Berg, H.; Manzoni, S. Improving productivity in integrated fish-vegetable farming systems with recycled fish pond sediments. Agronomy 2020, 10, 1025. [Google Scholar] [CrossRef]
  19. Cheng, S.; He, A.; Guo, X.; Li, R.; Wang, J.; Qi, Y.; Zhang, P.; Tao, W.; Ji, J.; Zhao, T.; et al. Rational utilization of sediment resources improves rice yield and nitrogen use efficiency under salt stress. Agriculture 2024, 14, 283. [Google Scholar] [CrossRef]
  20. Zhang, G.; Yang, Y.; Zhu, X.; Shen, W.; Zhu, Z.; Ge, T.; Xia, L.; Ma, J.; Lv, S.; Xu, H. Combining water-saving and drought-resistant rice with plastic film mulching mitigates CH4 emissions with higher net economic benefits. Resour. Conserv. Recycl. 2024, 202, 107372. [Google Scholar] [CrossRef]
  21. Bates, M.E.; Fox-Lent, C.; Seymour, L.; Wender, B.A.; Linkov, I. Life cycle assessment for dredged sediment placement strategies. Sci. Total Environ. 2015, 511, 309–318. [Google Scholar] [CrossRef]
  22. Hou, J.; Wang, Y. Study on the assessment of the comprehensive benefits of the utilization of sediment resources in reservoir areas. Int. J. Sediment Res. 2017, 32, 313–323. [Google Scholar] [CrossRef]
  23. Chen, D.; Lu, H.; Fu, Z.; Luo, Z.; Duan, J. A comprehensive benefit evaluation of the model of salt-tolerant crops irrigated by mariculture wastewater based on a field plot experiment. Agronomy 2024, 14, 2161. [Google Scholar] [CrossRef]
  24. GB 4284-2018; Control Standards of Pollutants in Sludge for Agricultural Use. Ministry of Housing and Urban-Rural Development of the People’s Republic of China: Beijing, China, 2018.
  25. Hu, L. Research on adjusted coefficient method for leaf area measurement and its error. Chin. Agric. Sci. Bull. 2015, 31, 228–233. [Google Scholar]
  26. Kuzmin, P.; Bukharina, I.; Kuzmina, A. Biochemical characteristics of urban maple trees. Saudi J. Biol. Sci. 2020, 27, 2912–2916. [Google Scholar] [CrossRef]
  27. Sun, B.; Tian, Y.X.; Jiang, M.; Yuan, Q.; Chen, Q.; Zhang, Y.; Luo, Y.; Zhang, F.; Tang, H.R. Variation in the main health-promoting compounds and antioxidant activity of whole and individual edible parts of baby mustard (Brassica juncea var. gemmifera). RSC Adv. 2018, 8, 33845–33854. [Google Scholar] [CrossRef]
  28. Li, J.Q.; Wei, Z.W.; Min, X.Y.; Zhao, P.Z.; Yang, L.H.; Liu, N.A. Physiological and biochemical changes in the seeds of naturally aged wenling medic (medicago polymorpha) with its recovery of viability. Agronoml 2023, 13, 787. [Google Scholar] [CrossRef]
  29. Lu, R. Soil Chemical Analysis Method for Agriculture; China Agriculture Science and Technique Press: Beijing, China, 2000. [Google Scholar]
  30. Li, F.; Yin, C. Assessment of the functions and ecological services values of green manure inpaddy fields in south China. Chin. J. Eco-Agric. 2019, 27, 327–336. [Google Scholar] [CrossRef]
  31. Wang, S.; Wang, K.; Huang, G. A study on ecosystem service value of paddy fields in multiple cropping systems in southern hilly areas of China—Taking yujiang county as an example. Acta Agric. Univ. Jiangxiensis 2011, 33, 636–642. [Google Scholar] [CrossRef]
  32. Sheng, J.; Chen, L.; Zhu, P. Evaluation of ecological service value of rice-wheat rotation ecosystem. Chin. J. Eco-Agric. 2008, 16, 1541–1545. [Google Scholar] [CrossRef]
  33. Xue, B.; Zhang, L.; Zhang, T.; Sun, W.; Li, Z. Evaluation of paddy field eco-system’s service value: Taking example hunan province for example. Chin. Rural. Water Hydropower 2020, 1, 52–57. [Google Scholar] [CrossRef]
  34. Wei, Y.; Jin, J.; Ding, Q.; Zhou, J.; Zhang, F.; Yang, W. Value accounting of ecological products in an agrophotovoltaic power station:a case study on the Zhengtai Jiangshan 200 MW agrophotovoltaic power station. J. Agric. Resour. Environ. 2024, 41, 197–211. [Google Scholar] [CrossRef]
  35. Hu, X.; Lin, Y.; Gao, X.; Xu, W.; Ouyang, Z. Research progress on the connotation of biodiversity value and assessment methods. Acta Ecol. Sin. 2024, 44, 8957–8967. [Google Scholar] [CrossRef]
  36. Ashraf, M.; Shahzad, S.M.; Imtiaz, M.; Rizwan, M.S. Salinity effects on nitrogen metabolism in plants-focusing on the activities of nitrogen metabolizing enzymes: A review. J. Plant Nutr. 2018, 41, 1065–1081. [Google Scholar] [CrossRef]
  37. Fu, X.M.; Ma, L.; Gui, R.; Ashraf, U.; Li, Y.; Yang, X.; Zhang, J.; Imran, M.; Tang, X.; Tian, H.; et al. Differential response of fragrant rice cultivars to salinity and hydrogen rich water in relation to growth and antioxidative defense mechanisms. Int. J. Phytoremediat. 2021, 23, 1203–1211. [Google Scholar] [CrossRef]
  38. Tang, S.Q.; She, D.L.; Wang, H.D. Effect of salinity on soil structure and soil hydraulic characteristics. Can. J. Soil Sci. 2021, 101, 62–73. [Google Scholar] [CrossRef]
  39. Sun, C.T.; Feng, D.; Yu, C.; Sun, J.; Han, X.; Zhang, M.; Zhang, P.; Han, H.; Mao, W.; Shen, X. The dynamics characteristics of soil water infiltration and capillary rise for saline-sodic soil mixed with sediment. Water 2022, 14, 481. [Google Scholar] [CrossRef]
  40. Zhou, H.; Yang, W.-T.; Zhou, X.; Liu, L.; Gu, J.-F.; Wang, W.-L.; Zou, J.-L.; Tian, T.; Peng, P.-Q.; Liao, B.-H. Accumulation of heavy metals in vegetable species planted in contaminated soils and the health risk assessment. Int. J. Environ. Res. Public Health 2016, 13, 289. [Google Scholar] [CrossRef]
  41. Casado-Vela, J.; Sellés, S.; Navarro, J.; Bustamante, M.A.; Mataix, J.; Guerrero, C.; Gomez, I. Evaluation of composted sewage sludge as nutritional source for horticultural soils. Waste Manag. 2006, 26, 946–952. [Google Scholar] [CrossRef]
  42. Bonanomi, G.; Idbella, M.; Abd-ElGawad, A.M. Microbiota management for effective disease suppression: A systematic comparison between soil and mammals gut. Sustainability 2021, 13, 7608. [Google Scholar] [CrossRef]
  43. Yao, R.J.; Li, H.Q.; Yang, J.S.; Yin, C.Y.; Wang, X.P.; Xie, W.P.; Zhang, X. Interactive effects of amendment materials and soil salinity on net rates of urea hydrolysis and nitrification in salt-affected soil. J. Soil Sci. Plant Nutr. 2021, 21, 3414–3427. [Google Scholar] [CrossRef]
  44. Setia, R.; Marschner, P.; Baldock, J.; Chittleborough, D.; Smith, P.; Smith, J. Salinity effects on carbon mineralization in soils of varying texture. Soil Biol. Biochem. 2011, 43, 1908–1916. [Google Scholar] [CrossRef]
  45. Hao, Z.Z.; Li, P.; Le, Q.L.; He, J.X.; Ma, J.Y. Litter and root removal modulates soil organic carbon and labile carbon dynamics in larch plantation ecosystems. Forests 2024, 15, 1958. [Google Scholar] [CrossRef]
  46. Zandebasiri, M.; Goujani, H.J.; Iranmanesh, Y.; Azadi, H.; Viira, A.H.; Habibi, M. Ecosystem services valuation: A review of concepts, systems, new issues, and considerations about pollution in ecosystem services. Environ. Sci. Pollut. Res. 2023, 30, 83051–83070. [Google Scholar] [CrossRef] [PubMed]
  47. Zhu, B.; Zhu, Y. Compound fertilizer manufactured from sediment of west lake. J. Agro-Environ. Sci. 2001, 3, 175–176. [Google Scholar] [CrossRef]
  48. GB2762-2017; National Food Safety Standard for Maximum Levels of Contaminants in Foods. National Health Commission of the People’s Republic of China and State Administration for Market Regulation: Beijing, China, 2017.
Figure 1. Changes in substrate pH and EC during vegetable cultivation. Panels (ac): pH changes in water spinach, lettuce, and chili. Panels (df): Corresponding EC changes. CK, T1, T2, T3, T4: experimental treatments with FPS mass percentages of 0% (control), 20%, 40%, 80%, and 100%. Error bars represent the standard error of the mean (n = 3).
Agronomy 15 01670 g001
Figure 2. Physical properties of soils after vegetable harvest: (a) bulk density (g·cm−3); (b) soil porosity (%). CK, T1, T2, T3, T4: experimental treatments with FPS mass percentages of 0% (control), 20%, 40%, 80%, and 100%. Error bars represent the standard error of the mean (n = 3). Mean values followed by different superscript letters a > b > c > d indicate significant statistical difference at p < 0.05.
Agronomy 15 01670 g002
Figure 3. Changes in soil nutrient contents before and after cultivation of three vegetable species: (a) soil organic matter (SOM) content; (b) total nitrogen (TN); (c) total phosphorus (TP); (d) total potassium (TK); (e) nitrate nitrogen ( N O 3 -N); (f) ammonium nitrogen ( N H 4 + -N); (g) available phosphorus (AP); (h) available potassium (AK). CK, T1, T2, T3, T4: experimental treatments with FPS mass percentages of 0% (control), 20%, 40%, 80%, and 100%. Error bars represent the standard error of the mean (n = 3). Mean values followed by different superscript letters a > b > c > d > e indicate significant statistical difference at p < 0.05.
Agronomy 15 01670 g003aAgronomy 15 01670 g003b
Figure 4. Post-harvest soil microbial properties: (ac) microbial biomass carbon (MBC) and nitrogen (MBN) contents in (a) water spinach, (b) lettuce, and (c) chili cultivation systems; (d) soil basal respiration rates across all treatments. CK, T1, T2, T3, T4: experimental treatments with FPS mass percentages of 0% (control), 20%, 40%, 80%, and 100%. Error bars represent the standard error of the mean (n = 3). Mean values followed by different superscript letters a > b > c > d indicate significant statistical difference at p < 0.05.
Agronomy 15 01670 g004
Figure 5. Effects of sediment–saline soil mixtures on vegetable growth parameters: (a) plant height of water spinach; (b) plant height of lettuce; (c) plant height of chili (note: CK and T1 chili plants died during cultivation); (d) leaf area index (LAI) of water spinach; (e) stem diameter of lettuce; (f) stem diameter of chili (note: CK and T1 chili plants died during cultivation). CK, T1, T2, T3, T4: experimental treatments with FPS mass percentages of 0% (control), 20%, 40%, 80%, and 100%. Error bars represent the standard error of the mean (n = 3).
Agronomy 15 01670 g005
Figure 6. Impacts on vegetable nutritional quality: (a) water spinach, (b) lettuce, and (c) chili. CK, T1, T2, T3, T4: experimental treatments with FPS mass percentages of 0% (control), 20%, 40%, 80%, and 100%. Error bars represent the standard error of the mean (n = 3).
Agronomy 15 01670 g006
Figure 7. Impact of FPS and SAS mixture on total ecological benefit value under various treatments. CK, T1, T2, T3, T4: experimental treatments with FPS mass percentages of 0% (control), 20%, 40%, 80%, and 100%. Error bars represent the standard error of the mean (n = 3).
Agronomy 15 01670 g007aAgronomy 15 01670 g007b
Table 1. Chemical and physical characteristics of the experimental SAS and FPS.
MaterialpHSalinity
(%)
OM 1
(g·kg−1)
TN 2
(g·kg−1)
TP 3
(g·kg−1)
TK 4
(g·kg−1)
AK 5
(mg·kg−1)
AP 6
(mg·kg−1)
SAS8.170.3011.651.020.7021.2221.4346.51
FPS7.480.0432.762.241.0920.7917.3445.99
1 OM: organic matter; 2 TN: total nitrogen; 3 TP: total phosphorus; 4 TK: total potassium; 5 AK: available potassium; 6 AP: available phosphorus.
Table 2. Concentrations of heavy metals and nemerow integrated pollution in tested soils.
Soil TypeHeavy MetalContent
(Ci)
Pollution Index (Pi)Comprehensive Pollution Index
SASCd0.260.430.45
Cr17.610.09
Pb11.360.07
As4.620.18
Cu6.970.07
Zn27.120.09
Ni10.990.06
FPSCd0.180.360.41
Cr21.090.11
Pb26.410.22
As4.840.16
Cu19.250.19
Zn44.10.18
Ni13.330.13
Table 3. Ecological benefit accounting framework and calculation formula.
Ecosystem ServiceCalculation FormulaSymbol MeaningSource
Soil organic matter accumulation value V EnvB 1 = S × T × ρ × SOM × C S O M (4)VEnvB1: value of SOM accumulation, CNY/ha
S: cultivation area, ha
T: tillage layer thickness, 0.3 m
ρ: soil bulk density (kg/m3); SOM: soil organic matter content, %
CSOM: SOM price, 0.0513 CNY/kg
[30]
Nutrient recycling value V EnvB 2 = L × C N + C P + C k × C F (5)VEnvB2: nutrient recycling value, CNY/ha
L: edible biomass, kg/ha
CN,P,K: nutrient content, %
CF: fertilizer price, 4.155 CNY/kg
[31]
Water conservation value V EnvB 3 = S × h × P × β × C W (6)VEnvB3: value of water conservation, CNY/ha
h: tillage depth, 0.3 m
P: non-capillary porosity, %
β: water density (kg/m3)
CW: reservoir storage cost (1.36 × 10⁻³ CNY/kg).
[32]
Fixed CO2 valueVEnvB4 = 0.4419 × B × CCO2(7)VEnvB4: value of fixed CO2, CNY/ha
B: plant biomass, kg
CCO2: the Swiss carbon tax rate, 953.1 CNY/t C
[30]
Provide oxygen value V EnvB 5 = B × 1.2 × C O 2 (8)VEnvB5: value of providing oxygen, CNY/ha
CO2: industrial oxygen price, 400 CNY/t
[33]
Air purification value V EnvB 6 = Σ Q i × F i × I (9)VEnvB6: value of air purification, CNY/ha
Qi: gas absorption, kg/(hm2·a)
Fi: pollution treatment cost, CNY/kg. Unit treatment costs stood at 0.6 (SO2), 0.6 (NOx), and 0.17 (dust) CNY/kg respectively.
I: adjustment factor, 0.6
[34]
Consume sediment value V EnvB 7 = VOL × P (10)VEnvB7: value of consuming sediment, CNY/ha
VOL: sediment volume, m3
P: treatment cost, 90 CNY/t
[30]
Maintain biodiversity values V EnvB 8 = ε × C × I i (11)VEnvB8: value of maintaining biodiversity, CNY/ha
ε: unit value, 628.2 CNY/ha
Ii: adjustment factor calculated from biomass and SOM differences.
[35]
Biodiversity Adjustment Factor (I) for Farmland I i = M extrai M extra (12)Mextrai and Mextra: the accumulation of metabolites and remains from field microfauna and microorganisms under experimental and conventional farming conditions, respectively, g
Mbioi and Mbio: the total plant biomass throughout the growth period under experimental and conventional farming systems, g
SOMi and SOM: the total soil organic matter content under experimental and traditional cultivation practices, g
a: weighting factors for plant residue contribution, 0.2
b: microorganism-derived matter contribution to soil organic matter formation, respectively, 0.8
M extrai = SOM i M bioi × a b (13)
M extra = SOM M bio × a b (14)
Table 4. Effects of FPS amendments on soil bulk density and relative changes compared to CK across vegetable cultivation systems.
TreatmentWater SpinachChange vs. CK (%)LettuceChange vs. CK (%)ChiliChange vs. T2 (%)
CK 11.22 ± 0.02-1.26 ± 0.01-1.45 ± 0.02-
T1 21.21 ± 0.02−1.051.18 ± 0.01−6.311.28 ± 0.01−11.89
T2 31.17 ± 0.02−3.931.16 ± 0.02−7.711.36 ± 0.01−6.37
T3 40.97 ± 0.04−20.451.03 ± 0.02−18.141.27 ± 0−12.57
T4 51 ± 0.01−17.970.95 ± 0.01−24.641.15 ± 0−20.55
1 CK, 2 T1, 3 T2, 4 T3, 5 T4: experimental treatments with FPS mass percentages of 0% (control), 20%, 40%, 80%, and 100%.
Table 5. Effects of FPS amendments on soil porosity and relative changes compared to CK.
Types of VegetablesTreatmentWater Holding Porosity (%)Aeration Porosity (%)Total Porosity (%)Change vs. CK (%)
Water spinachCK 141.250.5241.77-
T1 240.920.3841.3−1.13
T2 342.791.0343.824.91
T3 446.061.347.3613.38
T4 548.181.1849.3618.17
LettuceCK35.11.1136.21-
T141.591.4643.0518.89
T241.821.5543.3719.77
T341.172.5243.6920.66
T443.352.9146.2627.75
ChiliCK32.71.0833.78-
T135.211.2536.467.93
T236.470.5737.049.65
T337.690.7938.4813.91
T440.841.2242.0624.51
1 CK, 2 T1, 3 T2, 4 T3, 5 T4: experimental treatments with FPS mass percentages of 0% (control), 20%, 40%, 80%, and 100%.
Table 6. Soil microbial biomass carbon–nitrogen and carbon–nitrogen ratios after vegetable harvest.
Types of VegetablesTreatmentMBC
(mg·kg−1)
Change vs. CK
(%)
MBN (mg·kg−1)Change vs. CK (%)MBC/MBN
Water spinachCK 13.53-31.59-0.11
T1 23.591.7038.2321.020.09
T2 35.3952.6939.8126.020.14
T3 45.0041.6446.0345.710.11
T4 54.9139.0947.6950.970.10
LettuceCK0.24-0.80-0.29
T10.58141.670.42−47.501.39
T21.18391.671.5188.750.78
T31.04333.330.9113.751.16
T40.3545.831.82127.500.20
ChiliCK0.39-0.92-0.44
T10.24−38.461.4759.780.16
T20.81107.691.8196.740.45
T31.28228.212.47168.480.52
T40.95143.592.63185.870.36
1 CK, 2 T1, 3 T2, 4 T3, 5 T4: experimental treatments with FPS mass percentages of 0% (control), 20%, 40%, 80%, and 100%.
Table 7. Effects of mixing of FPS and saline–alkaline soil on total fresh yield.
Total Fresh Yield
(g)
Water SpinachChange vs. CK (%)LettuceChange vs. CK (%)ChiliChange vs. CK (%)
CK 158.00-72.55-0.00-
T1 268.6118.2969.12−4.720.00-
T2 382.2641.8398.1035.2236.120.00
T3 496.3966.18157.08116.5353.3247.63
T4 590.0355.23139.8192.7133.03−8.56
1 CK, 2 T1, 3 T2, 4 T3, 5 T4: experimental treatments with FPS mass percentages of 0% (control), 20%, 40%, 80%, and 100%.
Table 8. Effects of mixing of FPS and saline–alkaline soil on biomass of vegetable edible parts.
Edible Dry Weight Biomass (g)Water SpinachChange vs. CK (%)LettuceChange vs. CK (%)ChiliChange vs. CK (%)
CK 123.38-3.02-0.00-
T1 221.91−6.292.02−33.220.00-
T2 330.9732.465.5984.996.810.00
T3 437.3259.617.73155.8512.3781.60
T4 530.0528.5112.71320.865.02−26.27
1 CK, 2 T1, 3 T2, 4 T3, 5 T4: experimental treatments with FPS mass percentages of 0% (control), 20%, 40%, 80%, and 100%.
Table 9. The total value under different mixing ratios of FPS and SAS.
Types of VegetablesTreatmentWater SpinachLettuceChili
Total value per unit area
(CNY/hm2)
CK 196,42329,49113,245
T1 2129,30252,61337,127
T2 3208,317120,356110,494
T3 4274,951210,993226,971
T4 5274,060260,623201,246
1 CK, 2 T1, 3 T2, 4 T3, 5 T4: experimental treatments with FPS mass percentages of 0% (control), 20%, 40%, 80%, and 100%.
Disclaimer/Publisher’s Note: The statements, opinions and data contained in all publications are solely those of the individual author(s) and contributor(s) and not of MDPI and/or the editor(s). MDPI and/or the editor(s) disclaim responsibility for any injury to people or property resulting from any ideas, methods, instructions or products referred to in the content.

