Article

Evaluating Tomato Performance: A Novel Approach of Combining Full and Deficit Irrigation with Saline Water

by
Abdulaziz G. Alghamdi
1,*,
Akram K. Alshami
2,
Ahmed El-Shafei
2,3,*,
Abdulrasoul M. Al-Omran
1,
Arafat Alkhasha
1,
Anwar A. Aly
4 and
Abdulaziz R. Alharbi
5
1
Soil Sciences Department, College of Food and Agricultural Sciences, King Saud University, P.O. Box 2460, Riyadh 11451, Saudi Arabia
2
Agricultural Engineering Department, College of Food and Agriculture Sciences, King Saud University, Riyadh 11451, Saudi Arabia
3
Agricultural and Biosystems Engineering Department, Faculty of Agriculture, Alexandria University, Alexandria 21545, Egypt
4
Soil and Water Science Department, Faculty of Agriculture, Alexandria University, Alexandria 21545, Egypt
5
Plant Production Department, College of Food and Agriculture Sciences, King Saud University, Riyadh 11451, Saudi Arabia
*
Authors to whom correspondence should be addressed.
Agronomy 2024, 14(3), 559; https://doi.org/10.3390/agronomy14030559
Submission received: 19 February 2024 / Revised: 5 March 2024 / Accepted: 8 March 2024 / Published: 10 March 2024

Abstract

:
The tomato is a vital component of agriculture and is the second-most important vegetable globally. Maintaining a high tomato production requires both water quality and quantity. Water-scarce regions like Saudi Arabia still lack an understanding of the impact of deficit irrigation and the use of a blend of saline and freshwater, especially their nuanced impact across growth stages. The purpose of this study was to evaluate the effects of six different irrigation amounts: full irrigation with 100% ETc (FI), regulated deficit irrigation with 60% ETc (DI), and deficit irrigation with 60% ETc, except for the initial (DI-int), development (DI-dev), mid-season (DI-mid), and late-season (DI-lat) stages. This was performed with three different water qualities: fresh (FW), saline (SW), and fresh-saline blend (1:1) (MW) water. FW and MW enhanced the growth, physiology, morphology, yield, and quality, while SW had the lowest values. DI reduced these parameters and lowered yields by 13.7%, significantly improving water use efficiency (WUE) by 44% and fruit quality. DI-mid or DI-lat slightly improved yields while remarkably decreasing WUE and fruit quality. DI outperforms deficit irrigation in all growth stages except one, and countries with limited freshwater resources can benefit from a mix of fresh and saline water with a 60% ETc deficit irrigation, resulting in greater water savings.

1. Introduction

The tomato is the second-most important vegetable globally after the potato. Despite its economic significance, the tomato is among the most water-intensive crops [1,2]. This poses a challenge for achieving high production in a dry country like Saudi Arabia, which lacks permanent water bodies [3,4]. Over the past three decades, there has been a notable increase in the extraction of groundwater in KSA, resulting in an annual volume that exceeds 17 billion cubic meters [5]. At present, approximately 80% of the nation’s water demands are met by groundwater sources [6]. However, the issue of groundwater salinization, particularly in regions like Al-Kharj, where a majority of wells are classified as saline, poses a significant concern [5]. Despite these challenges, the annual replenishment of groundwater remains limited [7,8]. To overcome this, the country utilizes its oil resources to power desalination plants and provide drinking and irrigation water [9]. Surprisingly, Saudi Arabia ranks third globally in per capita freshwater consumption despite being one of the driest nations on Earth [9]. The sensitivity of tomatoes to drought stress varies across different growth stages, and they also exhibit sensitivity to saline water, a significant challenge in regions facing freshwater scarcity [10]. Therefore, understanding the response of tomato plants to deficit irrigation becomes crucial. Identifying the most sensitive growth stages and developing strategies to minimize the use of freshwater are essential steps in ensuring sustainable tomato cultivation in water-scarce environments.
According to FAOSTAT [11], the production of tomatoes exceeds 5 million hectares annually, which makes them a key horticultural crop globally. As reported by MEWA [12], the Riyadh region produced 49,128.7 tons of tomatoes, proving the importance of high-yield tomatoes in Saudi Arabia’s supply of food. Fiber, antioxidants, minerals, and vitamins A and C are abundant in tomatoes [13], giving dishes taste and color. In addition to their numerous nutritional benefits, they are a good source of potassium, phosphorus, and phenolic compounds that are beneficial to human health [14,15,16,17,18]. The tomato stands out as one of the most water-demanding crops [1]. Numerous studies on tomatoes have indicated a yield response factor ranging from 0.99 to 1.05 [10]. In cases where water is insufficient during the growth cycle, the consequences extend to diminished growth, altered physiology, reduced yield, and compromised quality in tomato plants. A meta-analysis conducted by Lu et al. [19] indicated that RDI reduced Y by a mean difference of 18.61 t ha−1. Agbna et al. [20] observed that deficit irrigation at 50% ETc and 75% ETc resulted in lower fresh plant weight, dry plant weight, fresh root weight, and relative leaf water contents in tomato crops compared to 100% ETc. However, deficit irrigation (DI) emerges as a valuable strategy for conserving water in both open fields and controlled environments, especially in arid and semi-arid regions where water is the most constraining factor for tomato cultivation [10]. Deficit irrigation is a widely used water-saving strategy accomplished by applying suboptimal amounts of water, which may or may not lead to some reduction in yield [21,22]. While it does not directly boost growth and yield, it can significantly impact water use efficiency by modifying the physiological processes of plants, resulting in substantial water savings [23,24]. In most studies, the acceptable level of deficit irrigation has consistently improved the water use efficiency of tomato crops, with minimal to marginal reductions in yield [23,25]. However, limited literature is available about the sensitivity of deficit irrigation in tomato production. In Saudi Arabia, the water supply is sourced from various outlets, with groundwater, surface water, desalinated water, and reclaimed water contributing 80%, 10%, 5%, and 5%, respectively. The agricultural sector is the predominant consumer, utilizing 85% of the total water consumption, while the domestic and industrial sectors account for the remaining 15% [26]. This distribution underscores the significance of freshwater resources, which face challenges such as annual increases in consumption and water quality degradation [9]. On the other hand, the sustainability of freshwater resources in Saudi Arabia is jeopardized due to climate change, which causes variations in rainfall and temperature patterns and magnitudes [27]. Therefore, it becomes imperative to embrace strategies that reduce freshwater usage in agricultural production without compromising the yield and quality of tomato crops. One viable approach involves the utilization of saline water in agriculture, with careful management, such as blending saline and freshwater in appropriate proportions and alternating their application. However, there is a scarcity of studies demonstrating the impact of mixed saline and freshwater on tomato production in Saudi Arabia.
Drought stress has a major impact on tomato yield and quality at different stages of growth. Cui et al. [28] divided the growth stages into three stages, the vegetative phase (stage I), the flowering and fruit development phase (stage II), and the fruit ripening phase (stage III), and applied drought by changing the soil water content to 70% of the field capacity at each stage. At stages II and III, the drought stress resulted in a 13% and 26% reduction in yield, respectively. Further, indicators of nutritional quality such as vitamin C, soluble sugar, organic acids, and total soluble solids increased. In addition, drought stress at stage I can be a beneficial management strategy because it conserves water and has fewer negative consequences. However, Nuruddin et al. [29] found that the flowering and fruit setting stages were the most vulnerable to water deficiency, resulting in significantly lower yield, fruit size, and lower-quality fruit. Patanè et al. [30] report that plants receiving full watering during flowering showed higher levels of leaf transpiration and stomatal conductance. Full irrigation resulted in the greatest fruit yield, while a severe water deficit during flowering lowered yields. Alshami et al. [31] investigated the impact of various irrigation and water salinity levels on greenhouse tomato cultivation in Saudi Arabia. The study employed four irrigation levels, 100%, 80%, 60%, and 40% of ETc, and three distinct water concentrations, 0.9, 2.25, and 3.6 dS·m−1. The results indicate that salinity has a significant impact on fruit quality, yield, and crop responses. Under 2.25 dS·m−1 conditions and 60% ETc irrigation, there was a noticeable increase in water productivity. In addition, 80% irrigation was advised for 3.6 dS·m−1, considering the yield was comparable to that of full irrigation. Regarding 0.9 dS·m−1, a 60% deficit irrigation yields the best water savings. These results have prompted further research into designing irrigation strategies that provide full irrigation at the most affected growth stage with a 60% deficit irrigation level to increase yield and water productivity. Al-Omran et al. [32] and De Pascale et al. [33] indicate that the use of saline irrigation water hurts the interactions between soil, water, and plants, which frequently has consequences on physiological processes and potential for agricultural productivity.
The effects of various water qualities (fresh, saline, and mixed saline and fresh) and deficit irrigation at different tomato growth stages have yet to be thoroughly researched in Saudi Arabia’s specific soil and climate circumstances. Our study aims to investigate the hypothesis that a blend of saline and freshwater, in conjunction with deficit irrigation during a specific growth stage, could improve tomato production in Saudi Arabia while also conserving freshwater resources. The main objectives of the study were as follows: (i) a comparison of the effects of fresh, saline, and mixed water on tomato growth, physiology, and yield; (ii) a comparison of full and deficit irrigation on tomato growth, physiology, and yield; (iii) an evaluation of the tomato growth stage in which deficit irrigation is not too harmful to the growth, physiology, and yield of tomato production.

2. Materials and Methods

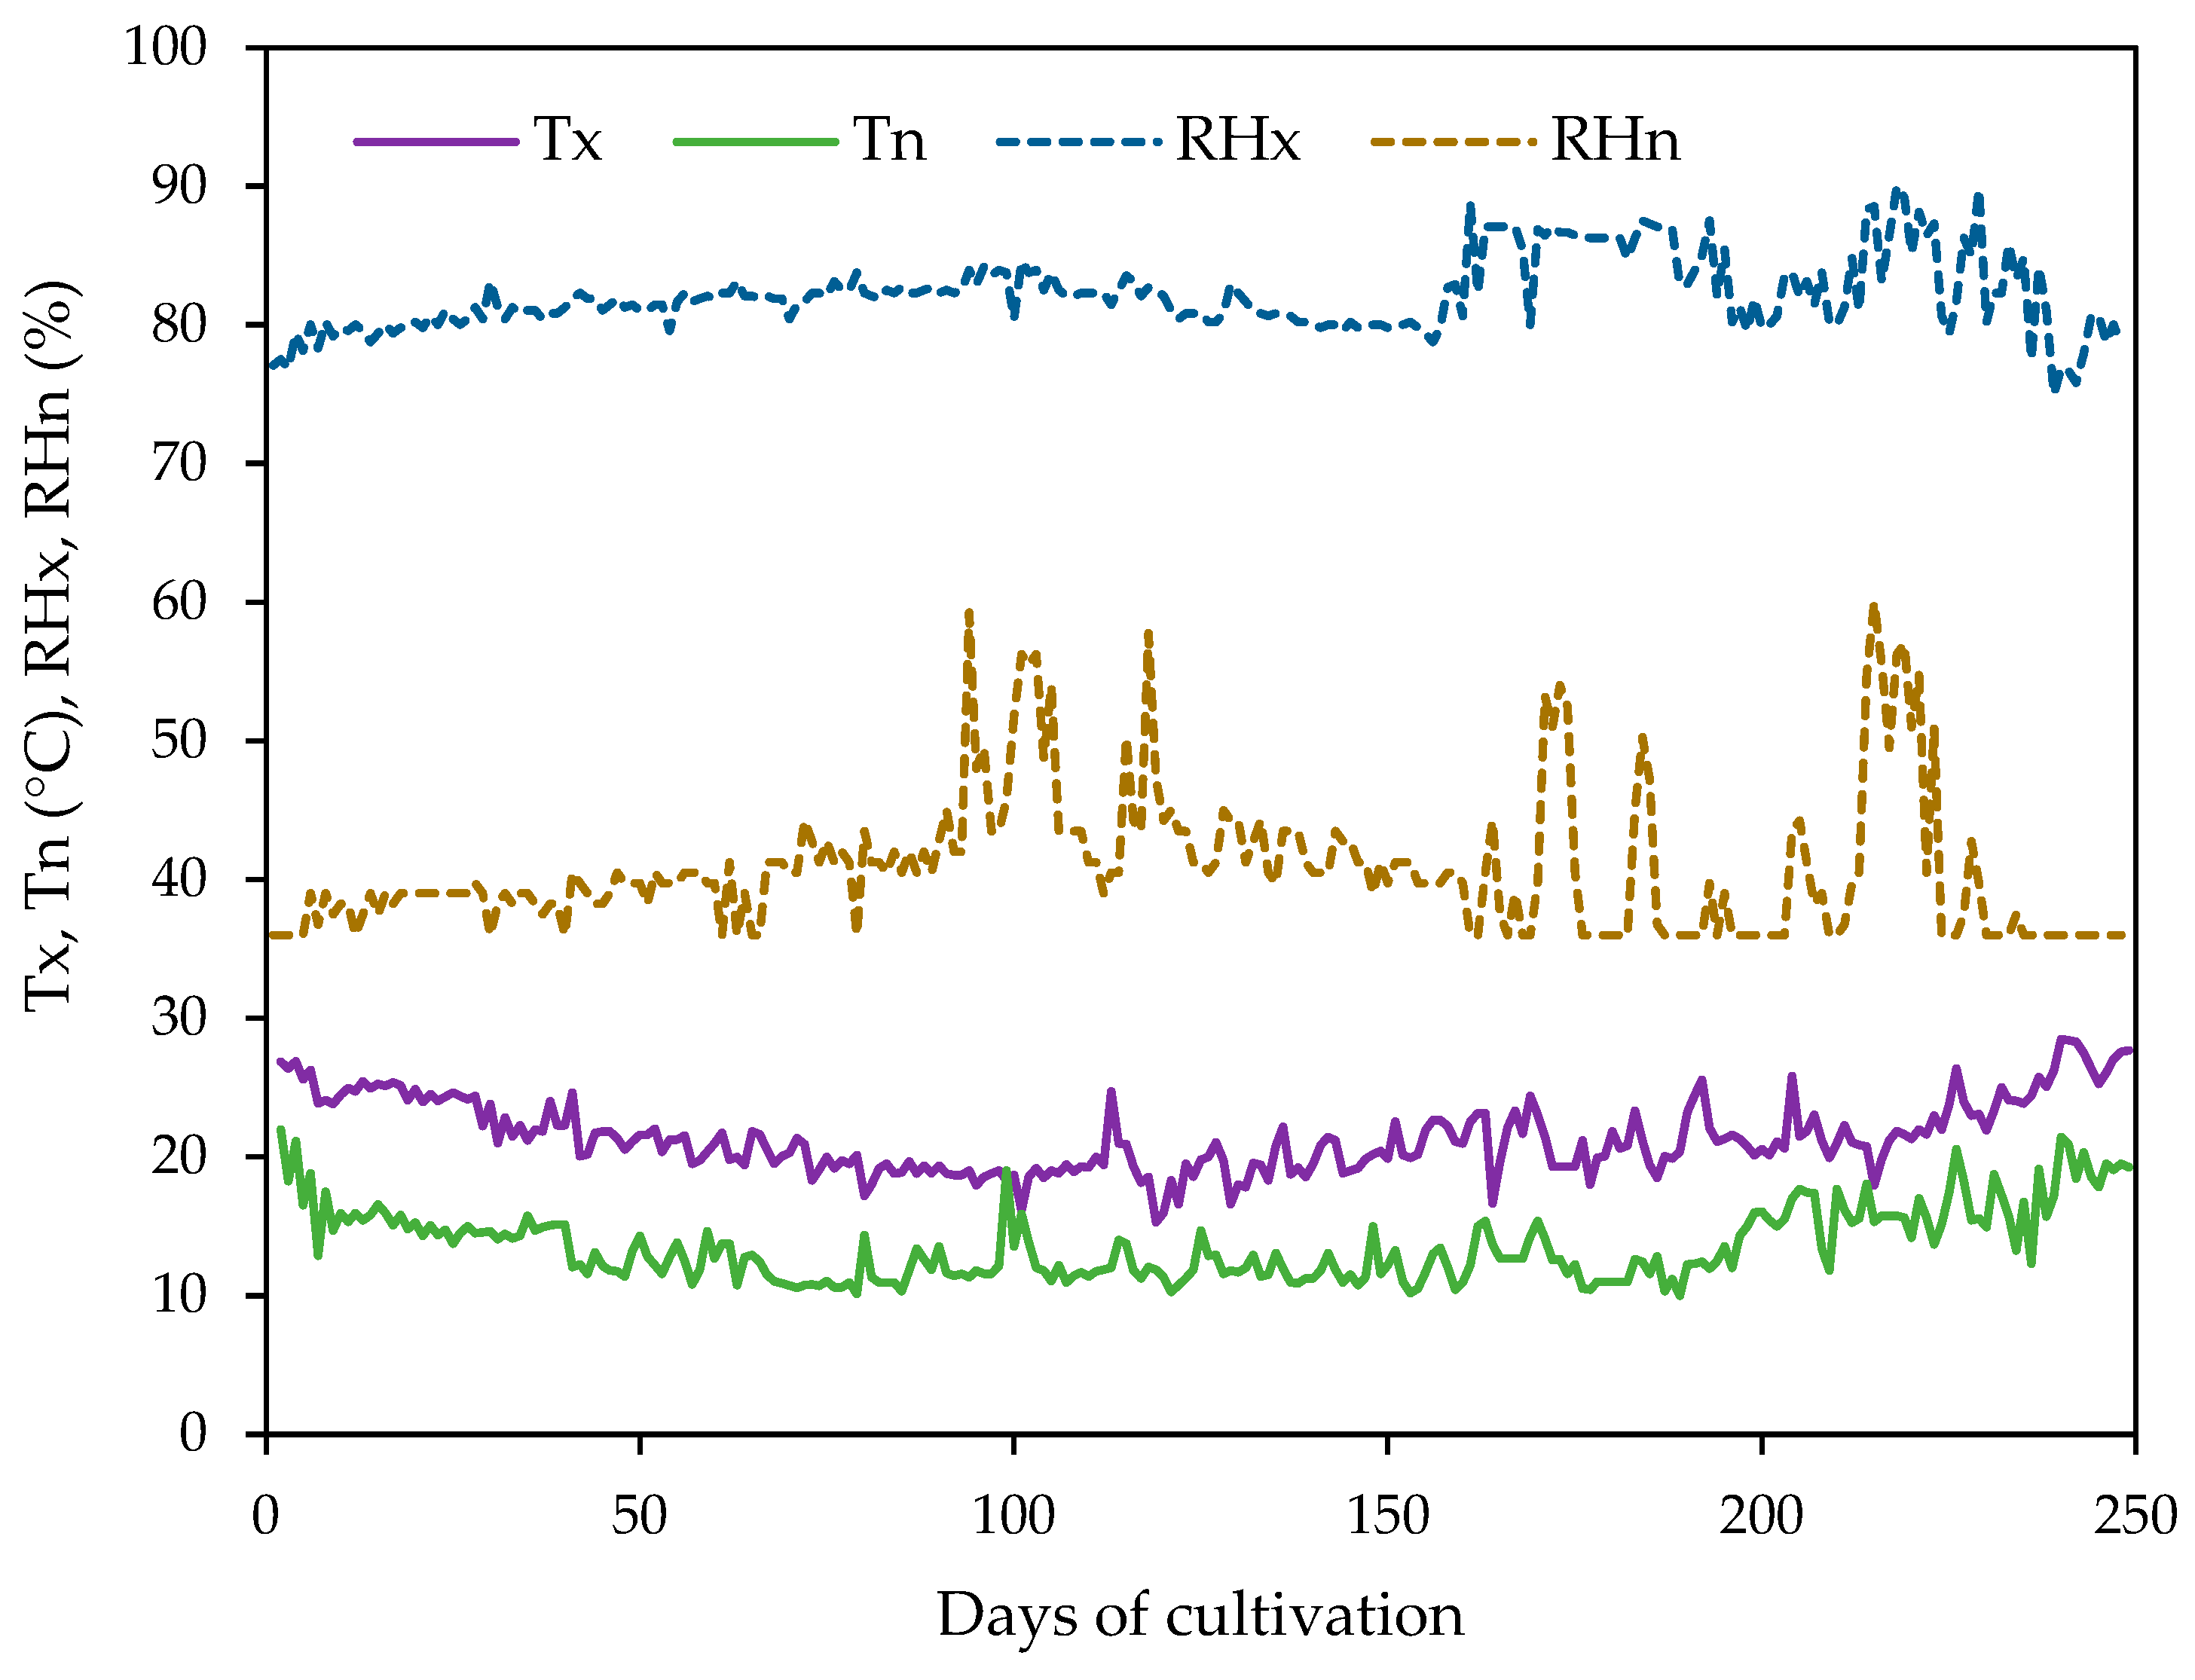
2.1. Experimental Site

The experiments were conducted in a greenhouse environment during the year 2022 at Thadaq district in Riyadh, Saudi Arabia, at an elevation of 722 m above the mean sea level and with a location of latitude 25°17′40″ N and longitude 45°52′55″ E. The soil and irrigation waters used in the experiment were analyzed for their physiochemical characterization (Table 1).

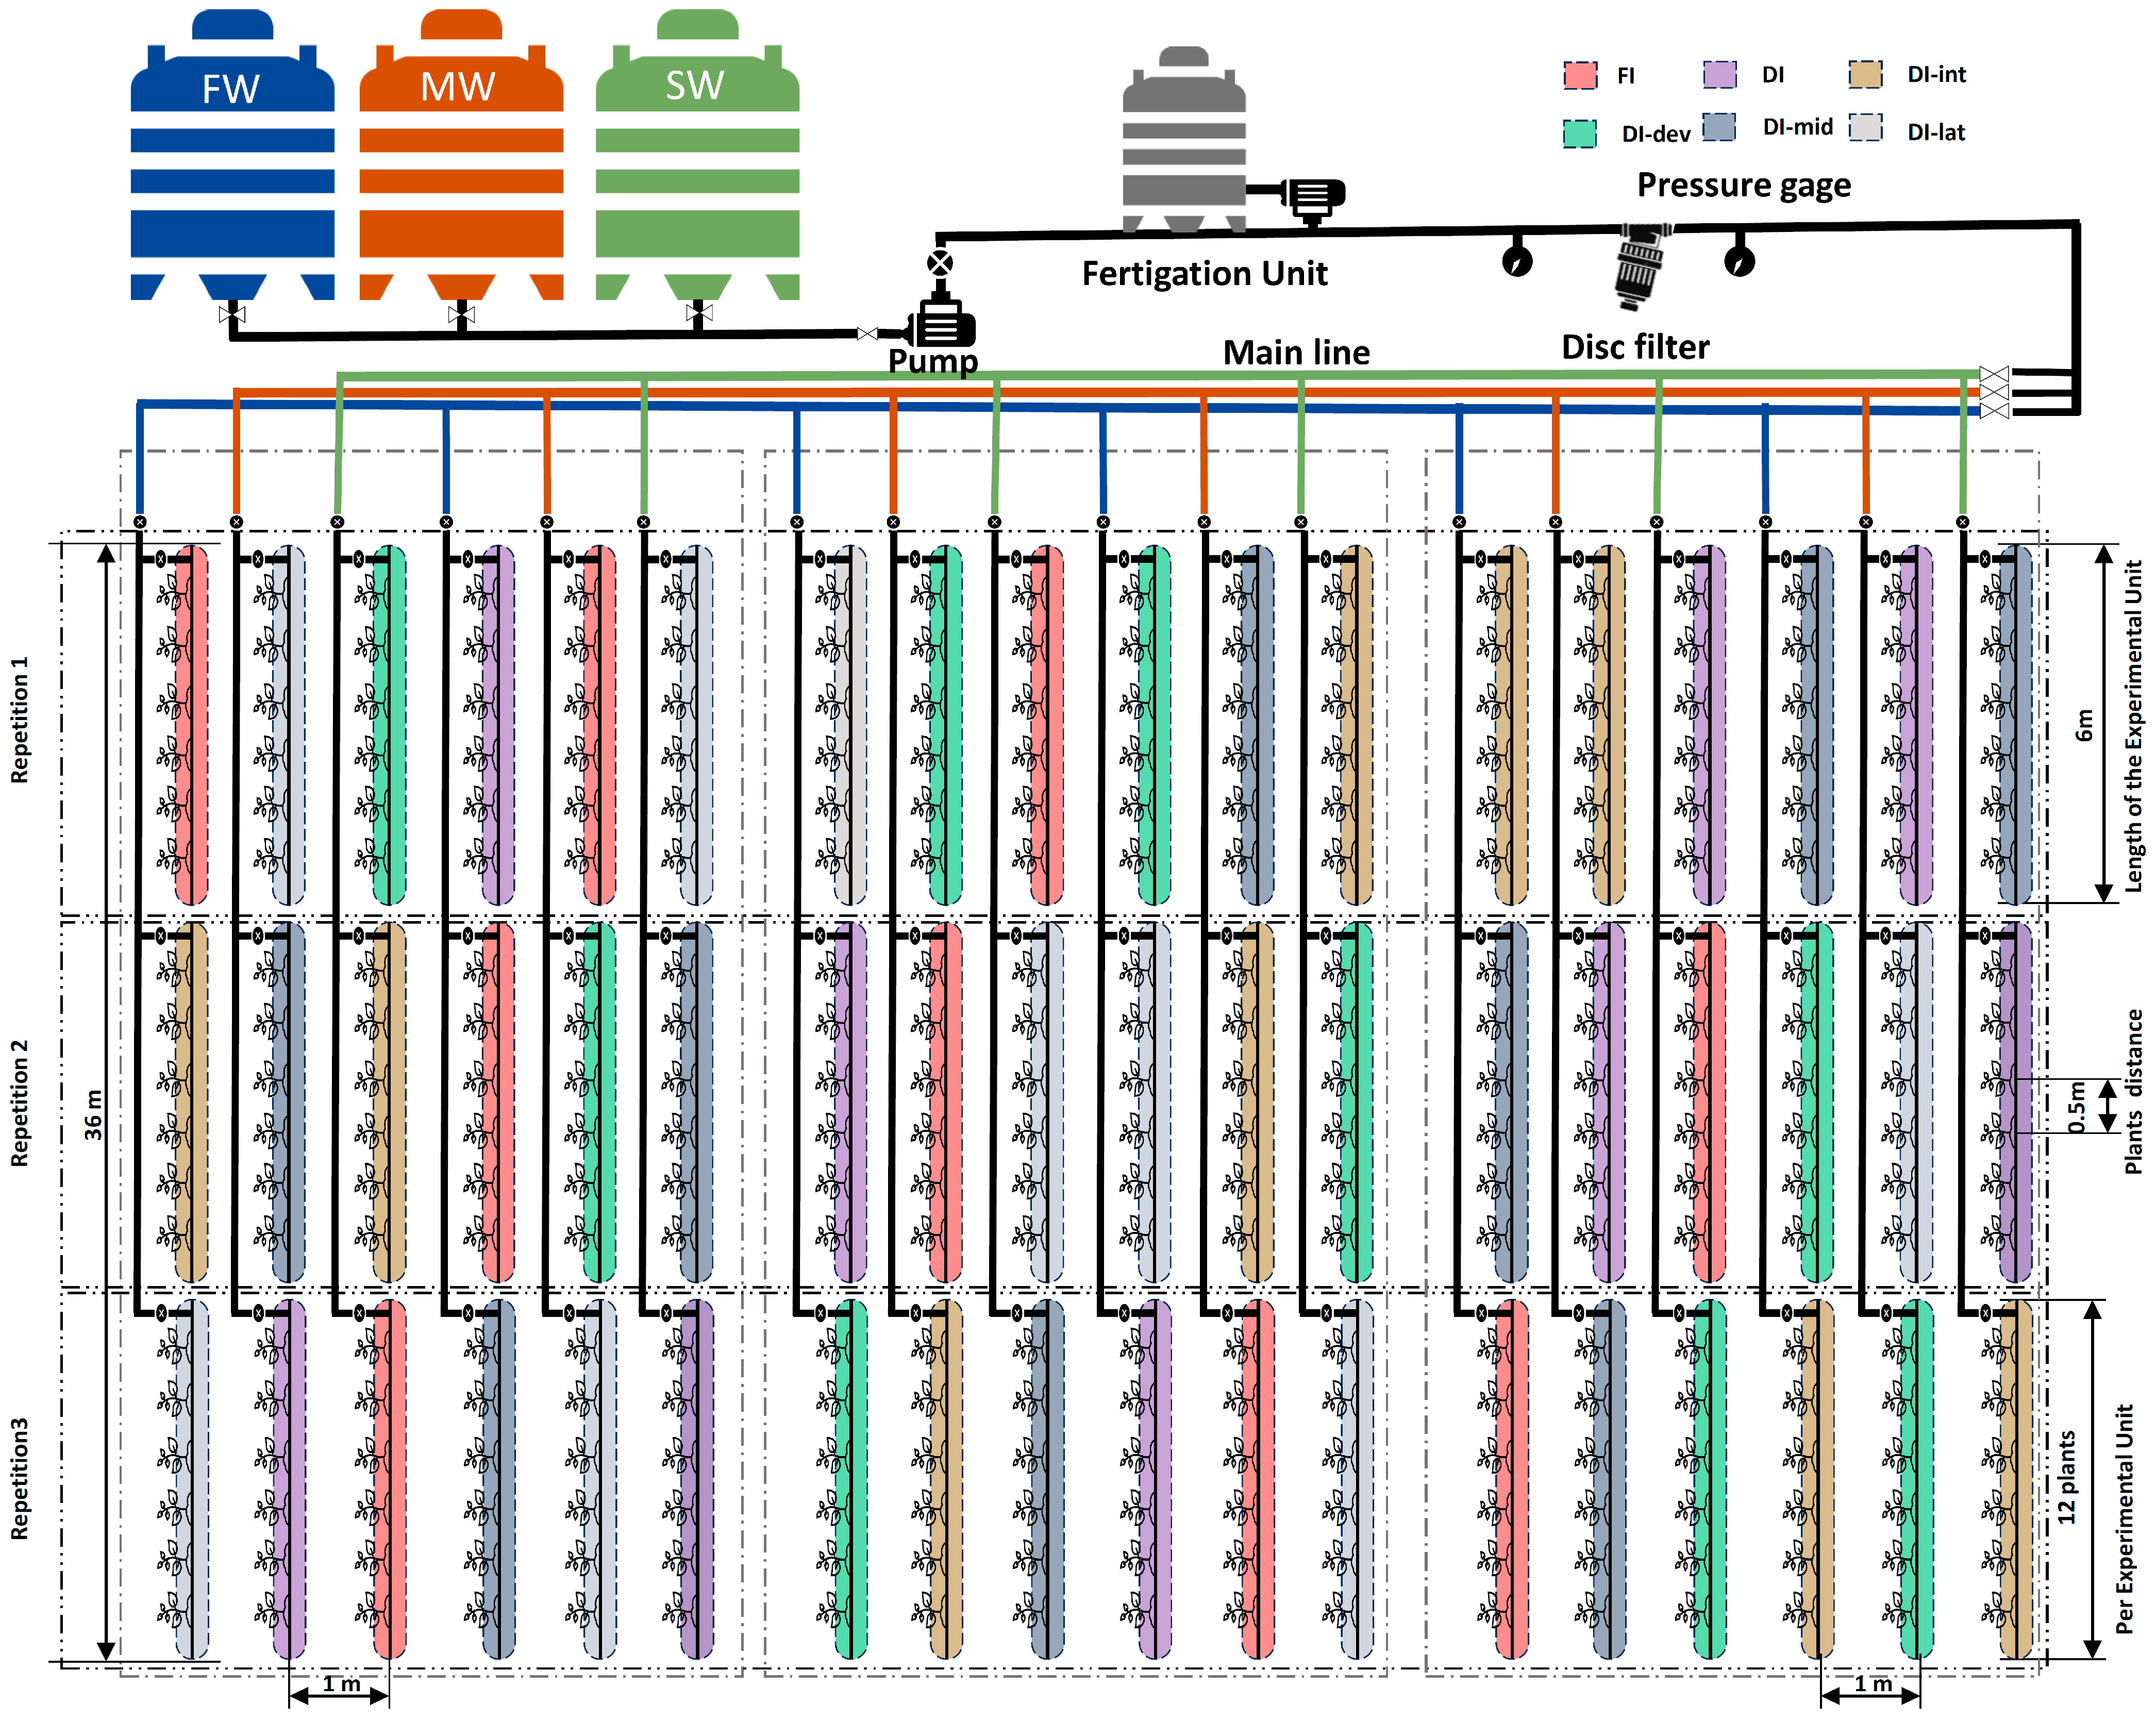
2.2. Experiment and Treatment Setup

The experiments were conducted in a controlled greenhouse environment on 9 September 2022. The multi-span greenhouse was 40 m in length and 54 m in width. It was 10.8 m in width and 4.5 m in height when divided into five spans. By using ventilation and evaporative cooling, traditional cooling was used to remove surplus sensible heat. A pad and air system with an 8 m × 2 m × 15 cm cellulose pad wall and three 1.5 HP fans (EOS50 fans, Termotecnica Pericoli, Albenga, Italy), each with an hourly capacity of 40,000 m3 h−1, were installed on each span.
The greenhouse was kept at 26 °C during the day and 19 °C at night, with a relative humidity of 75%, to ensure sustainable environments. An analog thermo-hygrometer (model 45-2000, Fischer Instruments, Drebach, Germany), which had an accuracy of ±5% for RH and ±1 °C for T, was used to monitor the relative humidity and temperature within the greenhouse (Figure 1). A randomized complete block design with a split-plot arrangement was employed for the treatments. The primary focus was on saltwater treatments, with varying irrigation intensities serving as sub-factors. Tomato plants (Solanum lycopersicum L.), an indeterminate variety from China, sold under the brand name Tamara, were planted directly in the ground inside the greenhouse, with each experimental unit sized 6 × 1 m, planting rows separated by 1 m, and individual plants 50 cm apart. The experiment comprised a total of 18 treatments, resulting from the combination of three distinct saline water treatments: fresh water (FW), saline water (SW), and a 1:1 mixture of fresh and saline water (MW) with six amounts of irrigation distributed on different stages of growth (Table 2 and Figure 2).
Adhering to standard agricultural practices for greenhouse tomato production, procedures such as fertilizer application, insect management, and soil sanitation were implemented. Notably, nitrogen, phosphorus, and potassium fertilization were applied at rates of 285, 142, and 238 kg ha−1, respectively. Plants were maintained at a height of 2 m, with the stem wrapped around the plant on the ground if it grew above the allowed height (2 m) over the 249 day growing season. The irrigation system was designed utilizing a 63-mm diameter UPVC pipe that came from a pump (STA-RITE, Delavan, WI, USA) that was located outside the greenhouse and had the following features: Q = 14.5 m3 h−1, H = 36 m, and a 1.5 HP power rating. The pipeline extended inside the greenhouse and terminated with lateral PE pipes, each 16 mm in diameter. The drip system utilized TURBO PC pressure-compensating emitters, which had a discharge of 4 L h−1. These emitters, which were produced by Jain Irrigation Systems Ltd. In India, were spaced 50 cm apart along the lateral length (Figure 2).

2.3. Crop Water Requirement Calculation

Pan reference evapotranspiration (ETo-pan) within the greenhouse was estimated based on the FAO-56 recommendations [34] for Class A evaporation pans installed on bare soil (Case B). The evaporation pan device was placed at a 1 m distance from the plants as per the recommended protocols. The Eto-pan was computed in a way described below:
E T o p a n = E p a n ( 0.61 + 0.00341 · R H m e a n 0.000162 · u 2 · R H m e a n 0.00000959 · u 2 · E F T + 0.00327 · u 2 · ln E F T 0.00289 · u 2 · ln 86.4 u 2 0.0106 · ln 86.4 u 2 · ln E F T + 0.00063 · ln E F T 2 · ln 86.4 u 2 )
where RHmean is average daily relative humidity (%) = (RHmax + RHmin)/2, u2 is the wind speed at 2 m above the ground (m·s−1), and FET is the fetched or distance of the identified surface type (bare soil for case B upwind of the evaporation pan). The tomato crop evapotranspiration was calculated according to the following equation [34]:
E T c = E T o · K c
where ETc represents the crop water requirement (mm day−1) and Kc denotes the crop coefficient. The crop’s growth cycle is divided into four interval stages: the initial (begins with the planting date and ends with around 10% ground cover), development (extended from 10% ground cover to effective full cover), mid-season (ranging from effective full cover to the initiation of maturity), and late-season stages (the period from the start of maturity to full senescence), each of which lasts for 35, 45, 135, and 30 days, respectively. For each of these stages, specific Kc values were applied. Allen et al. [34] offered specific Kc values, marked as Kc-ini, Kc-mid, and Kc-end, to tomato crops. Furthermore, the Kc values were modified according to a variety of factors, including ETo, RHmean, and u2. The adjusted Kc-ini, referred to as Kc-ini-adj, was calculated as follows:
K c i n i a d j = f w · K c i n i ( F i g )
Where fw is the fraction of surface wetted by irrigation and Kc-ini-(Fig) is the obtained initial crop coefficient from Figure 29 at FAO-56 [34], depending on the time of wetting events, amount of the wetting event, and the level of ETo.
While adjusted, the Kc-mid and Kc-end are referred to as the Kc-mid-adj and Kc-end-adj, utilizing the following formula given by Allen et al. [34]:
K c m i d / e n d a d j = K c m i d / e n d t a b + 0.04 ( u 2 2 ) 0.004 ( R H m i n 45 ) h 3 0.3
where Kc-tab is the value for standard Kc of the mid-season or end as specified in FAO-56 [34], and RHmin, u2, and h are the mean values calculated over the duration of the stage period for the daily minimum air relative humidity, wind speed, and crop height, respectively. The adjusted Kc values were 0.60 for the initial stage, 1.22 during the mid-season, and 0.80 for the end.

2.4. Growth and Physiological Parameters

At the end of the season, three plants from each replication sample were analyzed for their morphological characteristics. Plant height (h) and stem thickness (ST) were measured using a measuring scale. The leaf area (LA) measures were obtained from digital photographs and calculated with ImageJ software [35] using version 1.51j8. Furthermore, the leaves were enhanced for examination by using contrasting colors to make them darker (black). The wet and dry weights of the plants (WSw and WSd), which included both leaves and stems, were measured. The weights were determined using a digital scale, and samples were dried in a forced-air oven at 70 °C until they reached a constant weight.
The stomatal conductance (gs), photosynthetic rate (Pn), and transpiration rate (Tr) were measured from three mature leaves that were situated above the crop canopy, which were chosen for each replication using an LI-6400XT (LiCor Inc., Lincoln, NE, USA) portable photosynthetic equipment. Samples were collected between the hours of 8 and 10 in the local time zone, in the middle of each growth stage. The chlorophyll index, determined using the Soil-Plant Analysis Development (SPAD) value, was evaluated to calculate the leaves’ chlorophyll using the SPAD 502 Plus Chlorophyll Meter, (Konica Minolta Inc., Tokyo, Japan). The measurements were performed in the middle of each growth stage.
Fruit samples were taken at the end of the season from three mature plants for each replication to measure citric acid (CA, %), vitamin C (VC, mg 100 g−1), and total soluble solids (TSS, %). The TSS was measured using a digital refractometer (PR-101 model, ATAGO, Tokyo, Japan). The tomato was blended and filtered to extract the flesh [36]. The CA was calculated by technique of Caruso et al. [37]. Patanè et al. [25] description of the 2,6-dichlorophenol-indophenol dye method was used to evaluate the volatile compounds of VC in the extracted juice.

2.5. Total Yield and Water Use Efficiency

After the fruits from each treatment group were directly harvested and weighed, the total fresh tomato yield (Y), expressed in kg m−2, was calculated. The water use efficiency was calculated by dividing the total fresh fruit yield (Y, kg m−2) by the cumulative amount of water applied (w, m3 m−2) [1].
W U E = Y w
The yield reduction (YR) and the water use efficiency improvement (WUEI) were computed using the following equations [1,38]:
Y R   ( % ) = Y c Y Y c × 100
W U E I   ( % ) = W U E W U E c W U E c × 100
where Yc and WUEc represent the yield and water use efficiency of a control treatment, which refers to full irrigation with freshwater treatment (FW-FI), and Y and WUE represent the yield and water use efficiency of a specific irrigation quality and quantity treatment.

2.6. Statistical Analysis

A randomized complete block design with a split-plot layout was used as the study methodology, and the mean ± standard error (S.E) was used to present the results. An analysis of variance (ANOVA) and the revised least significant difference (LSD) test were used to determine the statistical significance of differences among the main components at a confidence level of 0.05. The Costat software (version 6.311) was used to analyze the data [39].
A principal component analysis (PCA) was utilized in the study to find the parameters that had a significant effect on the study’s variables. In this investigation, a PCA was performed using XLSTAT software (version 2019.1, Excel Add-ins Soft SARL, New York, NY, USA). The study’s variables included yield, physiological characteristics, morphology traits, fruit quality, and water use efficiency.

3. Results

3.1. Photosynthetic Rate, Stomatal Conductance, Transpiration Rate, and Chlorophyll Index

Table 3 shows that, at p < 0.05, the irrigation type, amount, and interactions had significant effects on the photosynthetic rate (Pn), transpiration rate (Tr), stomatal conductance (gs), and chlorophyll index (Chl-I). The use of SW led to the lowest values for these parameters, while the use of FW resulted in higher values. The MW showed an intermediate response, positioned between the SW and FW conditions. The Pn increased by 24.2% and 9.6%, the gs by 25.3% and 4.4%, the Tr by 29.7% and 10.9%, and the Chl-I by 23.9% and 6.7% in the FW and MW treatments, respectively, compared to SW irrigation. In contrast, all deficit irrigations resulted in a lower Pn, gs, Tr, and Chl-I compared to FI. The most significant reduction in the Pn, gs, Tr, and Chl-I was seen where DI was applied. The DI showed a 16.9%, 21.2%, 25.5%, and 16.7% reduction in Pn, gs, Tr, and Chl-I, respectively, compared to the FI.
Figure 3a shows a notable fluctuation in the Pn values across different water quantities and quality treatments. At the FI, FW had the greatest Pn value of 17.13 μmol CO2 m−2 s−1, while MW and SW decreased by percentages of 8.8% and 17.4%, respectively.
In the DI-mid treatment, FW had the second highest Pn at 16.43 μmol CO2 m−2 s−1, with a 4.1% reduction compared to the control treatment (FW-FI), while reductions were 17.3 and 26.2% for MW and SW. For each water quality, the Pn for deficit treatments decreased in the following order: DI-lat, DI-dev, DI-int, and DI. These patterns underscore the intricate interplay between water quality, irrigation amounts, and their combined impact on Pn, especially in deficit irrigation conditions where the negative impacts of salinity are enhanced.
Significant differences in the quality of the water were evident in the Chl-I values in the FI (Figure 3b). The highest value was recorded in FW at 47.6, followed by MW at 40.3 and SW at 37.9. The Chl-I results from the examination of different stages of deficit irrigation revealed recurring Pn tendencies. The DI-mid revealed the greatest Chl-I values for FW (43.1), MW (37.0), and SW (34.7), following a trend toward a decline with the order of DI-lat, Di-dev, DI-int, and DI. At a significance level of 0.05, the results in Table 3 indicated that there was no significant effect on the interaction between irrigation quality and quantity for both the Tr and gs.
The correlation results in Table 4 show the magnitude and trend of the correlations between Pn with gs and Tr under different water quality conditions. In FW conditions, there was a slightly significant positive connection between Pn and gs, indicating that as Pn increased, so did the conductance to water. The connection was significantly stronger in SW and even more so in MW. Similarly, the Pn and Tr had a very significant relationship in FW, which was even stronger in SW and MW conditions. These connection findings show the significance of water availability and management in impacting tomato physiological processes, particularly under salinity conditions.

3.2. Plant Height, Wet Stem Weight, Dry Stem Weight, Stem Thickness, and Leaf Area

Irrigation water quality and quantity significantly affected plant height (h), stem thickness (ST), leaf area (LA), dry stem weight (WSd), and fresh stem weight (WSw) at p < 0.05 (Table 5). Plant characteristics (h, ST, LA, WSw, and WSd) decreased as the salinity of the irrigation water increased. The largest values for h, ST, LA, WSw, and WSd were recorded by FW: 445.71 cm, 8.54 mm, 1208.14 cm2, 419.51 g, and 44.68 g, respectively. The application of MW resulted in a significantly increased h, ST, LA, WSw, and WSd by 14.7, 4.1, 2.7, 8.0, and 20.1%, respectively, in comparison to using SW.
The deficit in irrigation led to reduced values for the h, ST, LA, WSw, and WSd compared to FI. The most pronounced effects were observed at DI at all stages, with decreases of 19, 31.2, 24.9, 28.3, and 17.2% in the h, ST, LA, WSw, and WSd, respectively, when compared with FI.
Table 5 illustrates that no significant results were derived from the interactions of water quantity and quality for LA at a significance level of 0.05. Figure 4 indicates a significant variation in the h, ST, WSw, and WSd values across various water quantity and quality treatments. At FI, FW had the highest h, ST, WSw, and WSd values of 516.7 cm, 11.1 mm, 567.6 g, and 51.6 g, respectively, followed by MW and SW, which decreased by 7.4, 19.2, 15.8, and 8.3%, and 12.4, 21.6, 36, and 12%, respectively. There was very little variation in the deficit irrigation treatments. The h, ST WSw, and WSd showed reductions when compared to the control therapy (FW-FI); the averages for MW were 21.4, 39.3, 37.6, and 20.3, and for SW, they were 32.9, 41.8, 46.8, and 26.8%. This reduction indicates that salinity and deficit irrigation negatively affected the growth and development of the plants, leading to smaller plants with thinner stems and lower biomass accumulation, both in terms of wet and dry weight.
The correlation results shown in Table 4 reveal the strength and direction of the relationships between morphological parameters (ST, h, LA, WSw, and WSd) and ecophysiological parameters (Pn, Chl-I, Tr, and gs). These associations exhibited a strong positive relationship between ecophysiological and morphological parameters, and these relationships were stronger with slightly increasing irrigation salinity. Similarly, there is a significant correlation among the morphological parameters. This remains in both SW and MW conditions.

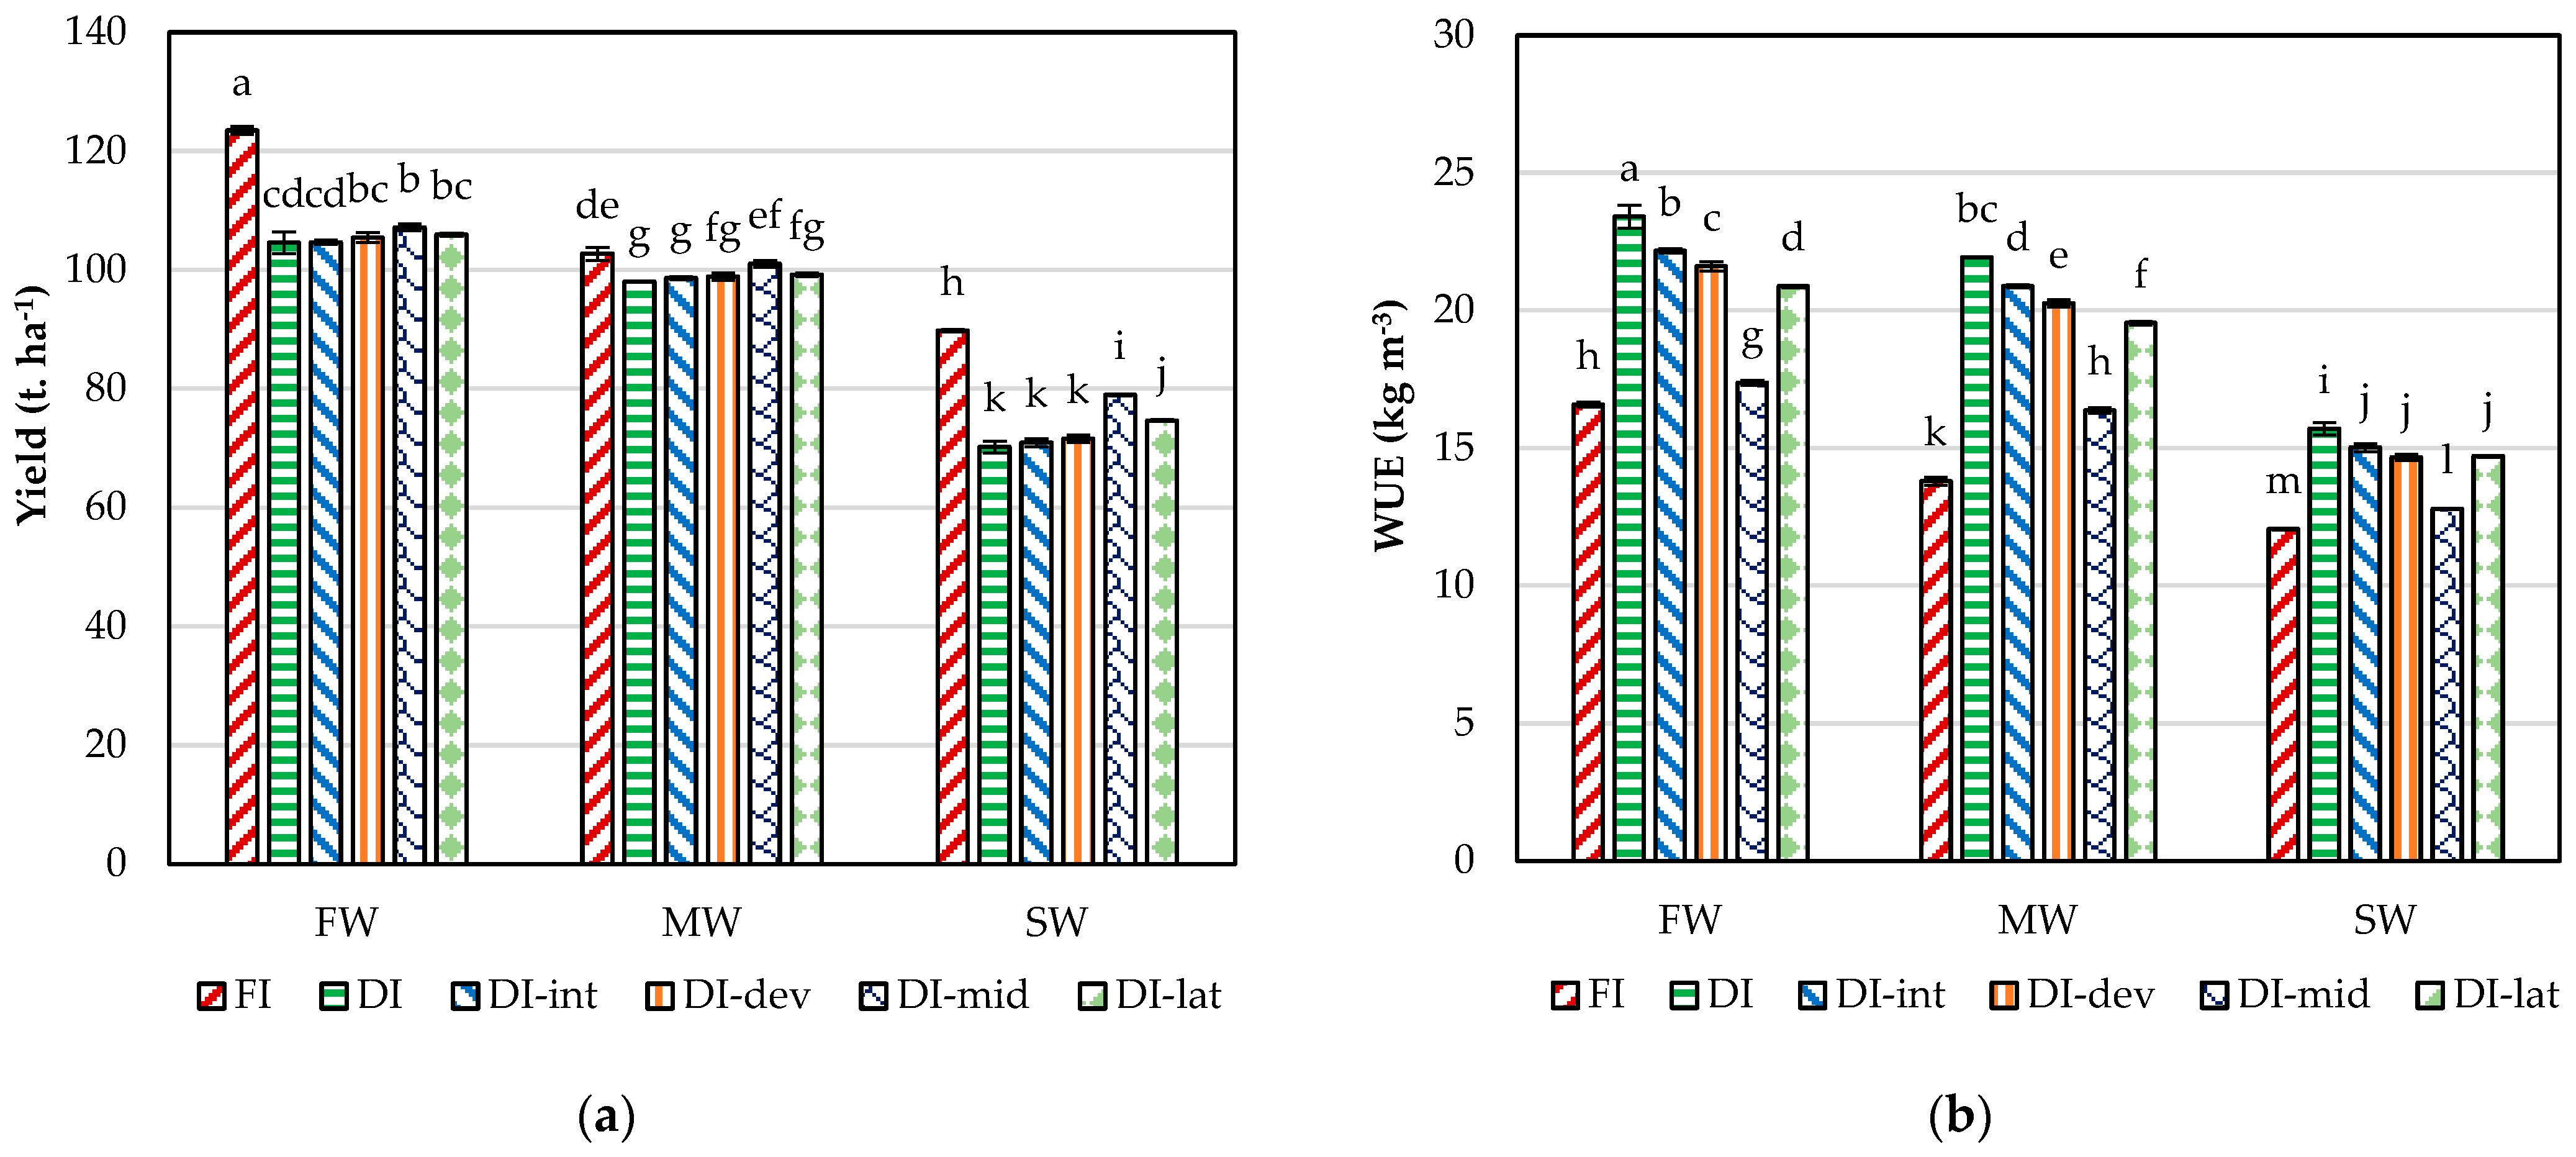
3.3. Crop Yield and Water Management Indicators

The investigation underscored the noteworthy influence of the quality of irrigation on tomato yield (Y). It revealed a yield reduction (YR) of 8.11% and 29.97% when utilizing MW and SW, respectively, in comparison to FW, which had a yield of 108.55 t ha−1. This decline in Y was mirrored by a corresponding reduction in water use efficiency (WUE) of approximately the same percentages (7.35 and 30.35%) when applying MW and SW, respectively, in comparison to FW, which had a WUE of 20.33 kg·m−3, as shown in Table 6. Water stress and full irrigation during a specific growth stage had a significant impact on Y. Significant Y’s were observed in FI, DI-mid, and DI-lat treatments. In contrast, no significant variations in Y were found in other treatments. Under 60% irrigation for all growth stages (DI), Y was reduced by 13.69%, compared to FI, and comparable decreases were observed in DI-int and DI-dev. That is, adding 5.4% and 8.54% more irrigation water to DI during the initial or development stage had no significant impact on Y, independent of the grade of irrigation water used.
Table 6 demonstrates that water quality, quantity, and interactions have a significant impact on WUE (p < 0.05). WUE values ranged from 14.15 to 20.35 kg m−3. WUE values were lower in SW than in FW, whereas MW’s response was in an intermediate. In comparison to FW, the use of MW and SW decreased WUE by 7.53 and 30.35%, respectively. The application of DI resulted in the highest WUE, while the application of FI provided the lowest WUE. That reveals a significant 43.8% increase in WUE compared to the FI condition. The trend toward improvement continues with the other DI treatments (DI-int, DI-dev, DI-mid, and DI-lat). Nevertheless, the DI-mid stage exhibits only a little improvement of 9.6%, indicating a smaller impact on WUE than the other stages.
Figure 5 demonstrates that the interactions between irrigation water amounts and water quality had a significant effect on crop yield (Y). The FW-FI produced the maximum Y (123.48 kg t−1). When compared to FW-FI, the Y at various deficit irrigation treatments showed significant reductions; they were from 13.2 to 15.3%, 18.2 to 20.6%, and 36.1 to 43.2% for FW, MW, and SW treatments, respectively. The SW treatment consistently displayed the biggest reduction percentages with the DI treatment (43.6%), and this decline diminished with the DI-mid treatment (36.1%). These data demonstrate the detrimental impacts of irrigation at 60% ETc in different growth stages, with salinity exacerbating the yield reduction. In the case of FW, the water use efficiency improvements (WUEI) were 41.2 and 4.7% for DI and DI-mid treatments, respectively, whereas other deficit treatments had an average WUEI of 29.9% (Figure 5). Under MW, the WUEI was 32.3 at DI, whereas the remaining deficit irrigation treatments averaged 22%, except DI-mid, which was 1.3%. SW’s average WUEI for deficit irrigation treatments was 14.6%.
The correlations in Table 4 show the strong relationships between Y and the physiological, morphological, and fruit quality parameters in greenhouse tomatoes. Y had a significant negative correlation with WUE for all three water qualities (FW (−0.72), SW (−0.91), and MW (−0.86)), indicating that Y tended to decrease as the WUE increased. The gs, Pn, and Tr all had strong positive correlations with Y in all water qualities, with the correlation being greater in FW at both the gs and Tr, whereas the correlation of Y with Pn increased with SW irrigation. When FW was utilized, the correlation of Y with the h, WSw, and WSd was enhanced, whereas SW increased the correlation of Y with the ST and LA. While the fruit quality factors CA, TSS, and VC all had strong negative correlations with Y, this relationship increased in FW.
Furthermore, the results of the correlation analysis indicate a significant negative correlation between the WUE and the physiological and morphological characteristics of various water qualities. These findings suggest that as the WUE increased, there was an incidence of decreased Pn, gs, Tr, Chl-I, and other morphological characteristics. In contrast, the WUE correlated positively with the CA, TSS, and VC. All the analyzed parameters showed a greater relationship with the WUE, whether the correlation was positive or negative in the case of MW. However, the correlation decreased when SW was used for all attributes, except for the Pn, LA, and CA, which were slightly greater when using FW.

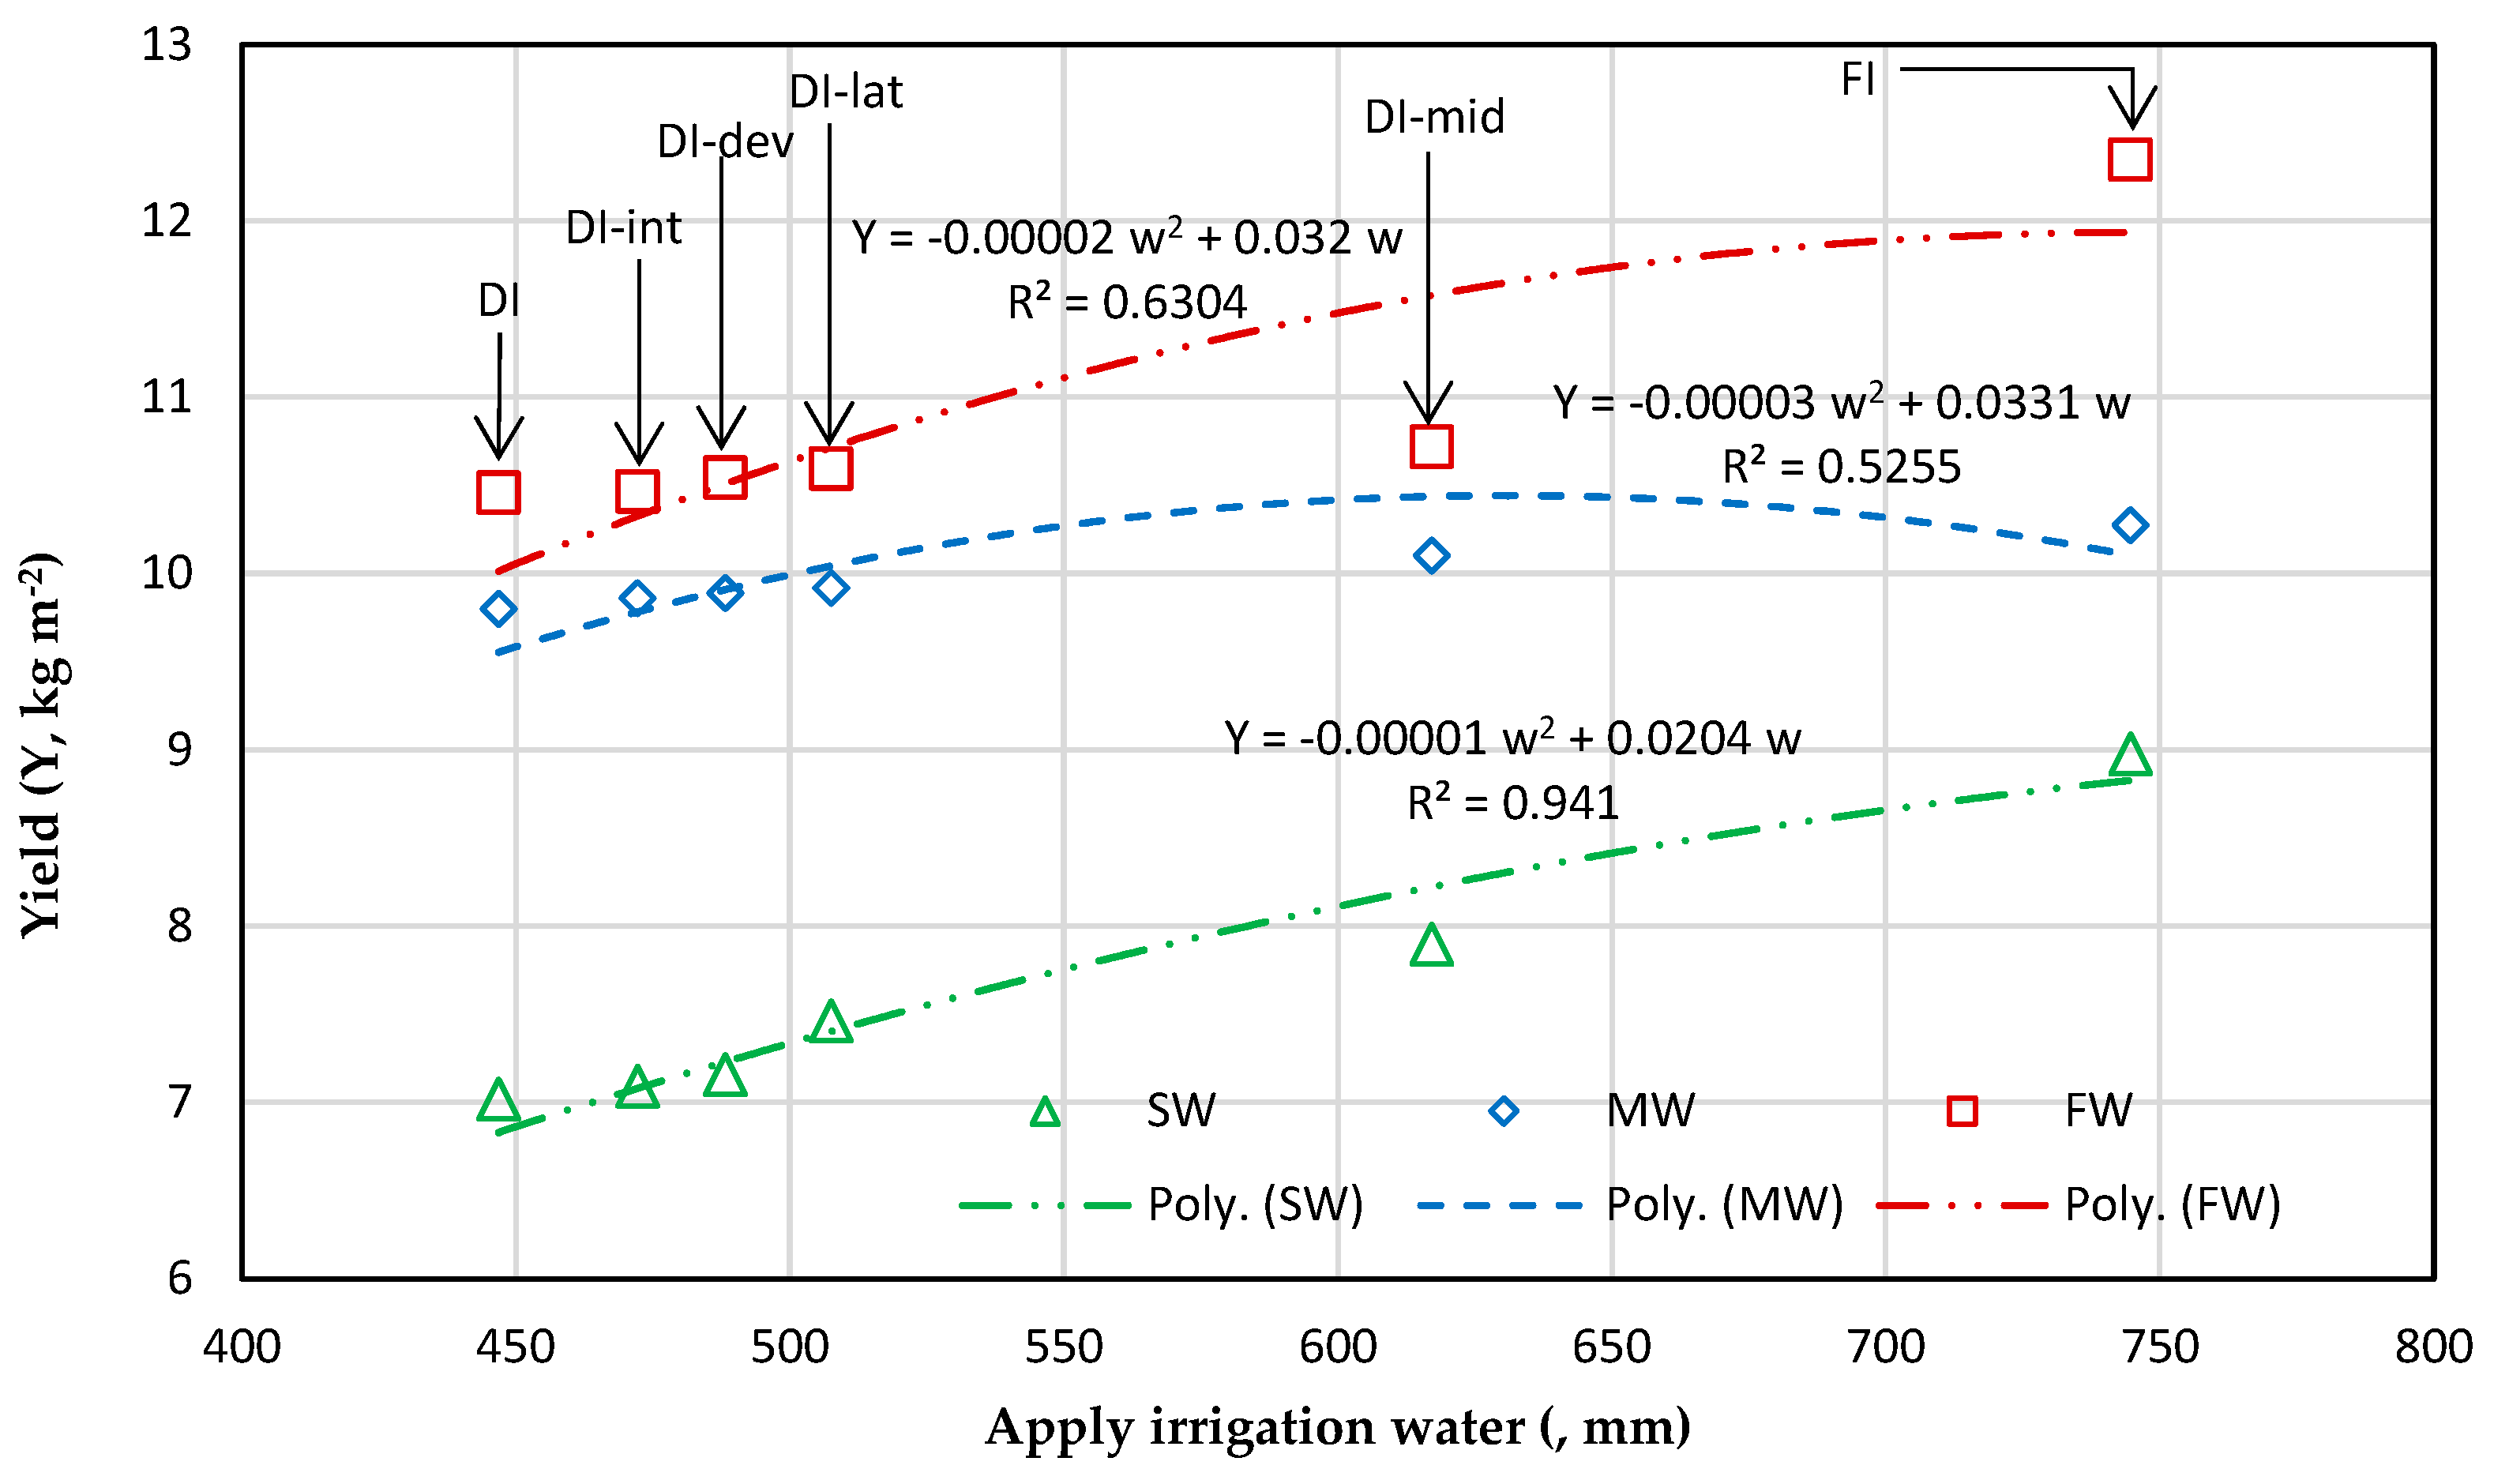
3.4. Yield—Applied Irrigation Water Functions

The relationship between the applied irrigation water (w) and yield (Y) for three distinct water qualities (FW, MW, and SW) is shown in Figure 6. A total of six distinct irrigation amounts were represented by the applied irrigation water: 100% ETc full irrigation (FI), 60% ETc deficit irrigation (DI), and 60% ETc deficit irrigation except for the initial (DI-int), development (DI-dev), mid-season (DI-mid), and late-season (DI-lat) stages. The quadratic polynomial regression function was employed for every water quality. The quadratic polynomial function had a good determination coefficient (R2) of 0.938 for SW treatments. This function, however, was invalid for FW and MW, where w did not affect Y at various deficit irrigation treatments.

3.5. Citric Acid, Vitamin C, and Total Soluble Solids

Irrigation water quality and amount had significant effects on citric acid (CA), vitamin C (VC), and total soluble solids (TSS) in tomato fruits (Table 7). Compared to FW, there were increases in CA, VC, and TSS of 2.6, 8.1, and 3.7% for MW, and by 18, 10.3, and 15.5% for SW. Furthermore, deficit irrigation treatments enhanced the CA, VC, and TSS by an average of 17.5, 15%, and 25%. Figure 7 shows that the amount and quality of water irrigation have a significant interaction with CA and TSS at the 0.05 probability level.
The deficit irrigation treatments enhanced CA values under SW, FW, and MW by 43.5%, 26.1%, and 20.3%, respectively, when comparing the FI-FW treatment. Similar patterns have been seen for TSS when deficit irrigation treatments outperformed FI-FW therapy by 47.7% for SW, 32% for MW, and 28% for FW. These results show that salinity amplifies the effects of deficit irrigation on accumulating CA and TSS.
The correlation analysis results in Table 4 demonstrate significant positive associations between VC, CA, and TSS across all water qualities, with correlation coefficients ranging from 0.91 to 0.98. Applying freshwater improved the link between VC and CA. These findings also demonstrate a consistent link between VC and TSS in greenhouse-grown tomatoes, regardless of irrigation water quality. However, CA, TSS, and VC all demonstrated significant to moderate negative associations with yield, ecophysiological, and morphological parameters, with the strongest relationships shown in FW.

4. Discussion

Overall, the results showed that SW was unsuitable for tomato cultivation; however, MW and FW could produce satisfactory growth, physiology, yield, and fruit quality. Deficit irrigation at all stages significantly reduced tomato growth, physiology, yield, and quality. However, deficit irrigation considerably enhanced the water use efficacy of both FW and MW.
According to the results in Table 3, the Pn, gs, Chl-I, and Tr values consistently dropped as water salinity levels increased, consistent with various studies’ findings [31,40]. This behavior is because irrigation water with higher salinity causes water stress, which lowers the Pn by changing stomatal regulation and limiting carbon dioxide absorption [41].
In research by Ashraf [42], high salt stress restricts photosynthesis by limiting stomatal function, which in turn affects the gs. This causes stomatal closure to conserve water, which reduces the Tr [41]. Several investigations have examined the mechanisms that cause stomatal closure, which include chemical cues, such as pH and abscisic acid (ABA), as well as hydraulic signals involving resistances in the soil, roots, and shoots [43,44,45]. The exact mechanisms regulating stomatal closure remain unclear despite several studies investigating these mechanisms [46]. As explained by Farooq et al. [47], stomatal closure decreases light intake and CO2 availability, which harms photosynthetic efficiency along with decreasing CO2 intake into parenchyma cells. Osmotic stress causes a drop in Chl-I levels, which damages chloroplast layers by increasing the membrane permeability [48]. These results are in line with previous studies, which have demonstrated that environmental stressors, including dryness and salt stress, cause tomato leaves to lose their photosynthetic pigments [31,49].
Although deficit irrigation decreased the Pn, gs, Chl-I, and Tr, the effects varied significantly between deficit treatments. The preferences for Pn, gs, Chl-I, and Tr were as follows: DI-mid, DI-lat, DI-dev, DI-int, and DI. These findings were attributed to the different amounts of water utilized for deficit treatments, which were equivalent to 60%, 63.4%, 65.6%, 82.9%, and 68.2% of ETc for D-I, DI-int, DI-dev, DI-mid, and DI-lat, respectively (Table 2 and Table 3 and Figure 3). Water stress causes a decrease in Pn through the stomatal closure mechanism, which counteracts water loss and thus lowers the uptake of carbon dioxide. Previous research showed a connection between a reduced Pn and water stress [20,31,50,51,52]. Wong et al. [53] and Tuzet et al. [54] showed that the gs has a reciprocal regulatory effect on the Pn and Tr. According to Liu et al. [45], the gs decreases as stomata shut to preserve leaf water status during water stress. However, Hao et al. [55] found a substantial positive linear connection between the Pn and both the Tr and gs. In addition to stomatal closure, water stress also impacts photosynthesis by degrading Chl-I, reducing the photochemical efficiency of PS II, and inhibiting the activity of Rubisco and other enzymes [54]. Chl-I decreases because of the photo-oxidation of Chl-I, the degradation of the chloroplast membrane, the increased function of chlorophyllase, and the inhibition of Chl-I production [56]. Water stress also negatively affects the photosynthetic apparatus, a point covered in the review of possible crop water stress indicators in vegetable crops [46].
Table 5 demonstrates that SW had a detrimental impact on the h, WSw, WSd, LA, and ST, supporting the conclusions of Gabhi et al. [57] that an adverse impact may be caused by SW affecting the osmotic balance in plant cells, which could result in nutritional imbalances. The application of SW tended to have an impact on turgor pressure, cell expansion, and water uptake, which finally affected the overall h. Due to osmotic stress and ion toxicity, excessive salt concentrations may hinder plant growth [58,59]. Variations in ST may be a sign of modifications in cell elongation and division intended to preserve structural integrity or adapt to a salinized environment, according to Romero-Aranda et al. [60]. Our findings are consistent with those of Malash et al. [40], who assessed open-field tomatoes’ WSd, harvest index, h, and leaf area index using drainage water with a salinity of 3.7 dS·m−1. The declines in these parameters with high salinity have been attributed to decreased transpiration and water stress, which impede plant development and nutrient uptake. Malash et al. [40] also reported that these morphological parameters enhanced with a drainage salinity of 2.16 dS·m−1. They suggested that drainage water at 2.16 dS·m−1 enables plants to benefit from its nutrient content. The deficit irrigation considerably reduced the h, WSw, WSd, LA, and ST, indicating the mechanisms intended for conserving water, such as decreased expansion of cells, altered hormonal balance, and resource allocation prioritizing surviving overgrowth [61,62]. This finding was in line with earlier studies by Agbna et al. [20], Chand et al. [22], Colimba-Limaico et al. [63], Wu et al. [64], and Alshami et al. [31], which indicate that salinity and water stress cause a considerable loss of many morphological characteristics. The magnitude of this reduction is influenced by the level and duration of the irrigation stress.
Morphological characteristics revealed a loss in tomato ecophysiological parameters as the salinity in irrigation water rose, resulting in a fall in final productivity (Y). These findings support those of Al-Harbi et al. [65] who found that irrigation with saline water that has an electrical conductivity of 4.7 dS·m−1 significantly reduced the overall fruit production by 24.3%. Furthermore, a recent meta-analysis conducted by Gao et al. [66] revealed a wide range of changes in Y due to saltwater irrigation, ranging from a decrease of 96.8% to 36.2%. Yang et al. [67] observed a decrease in Y as salt stress increased, with significant declines of 32.9% and 89.1% at salinities of 3‰ and 9‰, respectively, under a deficit irrigation of 2/3 of full irrigation compared to treatment with a salinity of 0‰.
Regardless of the influence of salinity, irrigation deficit treatments result in a relative fall in Y (Table 6). The YR was 11.46% at DI-lat (irrigation deficit at 60% ETc for all stages except the late stage), somewhat higher than DI (YR of 13.67%). This could be attributable to the amount of water utilized, which is equal to 68.2% ETc. This suggests that applying FI at the late-season stage helps to maintain Y, which is consistent with the findings of Ghannem et al. [61] who found a 20% loss in Y when providing deficit irrigation in the late-season stage with 50% ETc, which was equivalent to 76.32% ETc. Ghannem et al. [61] also stated that the YR was 7% with a deficit of 50% ETc at the development and mid-season stages, which is equivalent to 76.77% ETc. This demonstrates the various effects of applying deficit irrigation in one of the growth stages on productivity. The YR for treatment DI-mid was 9.12%, equivalent to 82.9% ETc, which was lower than the regulated deficit irrigation (RDI) of 6.12% at 80% ETc reported by Alshami et al. [31]. As a result, RDI outperforms deficit irrigation at all stages except one, as well as full irrigation at all stages, with a deficit at one stage at the same equivalent ETc deficit. Tura and Tolossa [68] suggested that using 50% ETc with good quality water may be sufficient for tomato production, a finding supported by the research reviewed by Chand et al. [69], which suggests that RDI can save up to 50% of water, although Y reduction can range from 9% to 46% depending on the degree and timing of water stress. These results are consistent with the findings reported by Kirda et al. [70] and Wang et al. [71], which indicate that lower water quality and water stress lead to a reduced Y. In contrast, the majority of researchers, including Yang et al. [72], Yang et al. [73], and Chand et al. [22], reported a relationship between crop yield and irrigation quantity according to a quadratic polynomial regression function. With the present irrigation deficit treatments for freshwater or low salinity treatments, this function was invalid; however, with high salinity, the function was good since salinity had a greater impact on Y than irrigation deficit did. The quadratic polynomial regression function may be valid when water quantity changes based on regulated deficit irrigation but invalid when deficit irrigation is applied at all growth stages except one or full irrigation is applied at all stages except one. The regulated deficit irrigation (all growth stages) outperforms deficit irrigation except for one stage. With limited freshwater, the benefit of using a salinity of 2.25 dS·m−1 with 60% ETc deficit irrigation results in an acceptable yield and greater water savings.
SW has been shown to have a significant impact on the quality of tomato crops, as illustrated in Figure 7. The levels of CA, VC, and TSS increased as the salinity of the irrigation water increased. Malash et al. [74] reported a greater increase in the TSS in tomato fruit when irrigated with SW, exhibiting a 14.46% rise with a water salinity of 4.8 dS·m−1 compared to freshwater irrigation. Agius et al. [75] also noted an increase in CA and TSS with higher salinity, particularly at salinity levels of 17 mM. The application of SW to tomatoes may induce osmotic stress, which stimulates the accumulation of sugars as osmoprotectants. This alteration in water and nutrient absorption, coupled with physiological adaptations to salinity, accelerates the ripening process and enhances the TSS in the fruit, resulting in an enhancement in the quality of tomato crops. The CA, VC, and TSS reduced with FI but increased when deficit irrigation was implemented, depending on the stage of FI applied. Agbna et al. [20] found an increase in the TSS, CA, and VC with deficit irrigation. The higher TSS, CA, and VC were found with deficit irrigation of ET 50%, while lower values of these parameters were found at ET 100%. However, a higher decrease in TSS, CA, and VC solids was seen with deficit irrigation at the mid-stage of the tomato crop. The results are consistent with previous studies demonstrating that fruit quality has been increased under water-stressed conditions compared to full irrigation. [19,31,63,69,71,76,77]. Under deficit irrigation, there may be a decrease in water flow from the xylem to the fruit, impeding the translocation of phloem sap to the fruit. This limitation contributes to an increase in solute concentration in the sap, leading to improved fruit quality [78,79,80,81]. However, Alshami et al. [31], Wu et al. [82], and Yang et al. [67] revealed that the combination of water and salinity stress had no significant impact on vitamin C.
The results of the principal component analysis (PCA) showed that water use efficiency had the greatest influence on the parameters evaluated. LA was then identified as the second most important factor, followed by physiological characteristics such as the Pn, gs, Tr, Chl-I, as well as morphological traits such as the h, ST, and WSw and WSd. Finally, fruit quality parameters, including the CA, VC content, and TSS, had the least influence. Furthermore, the PCA analysis confirmed the negative impacts of saltwater on tomato production found in the current study (Figure 8).

5. Conclusions

In conclusion, the application of saline water can lead to diminished growth, physiological and morphological parameters, yield, and fruit quality of greenhouse tomato crops. Salinity and insufficient irrigation harm the photosynthetic rate (Pn), chlorophyll index, stomatal conductance (gs), and transpiration (Tr), resulting in significant reductions in morphological parameters such as plant height (h), wet stem weight (WSw), dry stem weight (WSd), stem thickness (ST), and leaf area (LA). Conversely, employing a mixed irrigation strategy involving both saline and freshwater with a salinity of 2.25 dS·m−1 proves effective in achieving elevated yields and enhanced tomato quality. Fruit quality indices, such as citric acid (CA), vitamin C (VC), and total soluble solids (TSS), improved under salt and water stress, suggesting that better water management techniques can enhance fruit quality.
Deficit irrigation with 60% ETc is associated with reduced ecophysiological and morphological parameters and lower yields of 13.7% in tomato plants, while it significantly improved water use efficiency by 44% and fruit quality. Full irrigation at the mid-season stage or late-season stage with a deficit of 60% ETc for remaining growth stages improved slightly ecophysiological and morphological parameters and yields while remarkably decreasing water use efficiency and fruit quality. Consequently, for the same comparable ETc, the deficit irrigation at all stages (regulated deficit irrigation) outperforms deficit irrigation at all growth stages except one stage, as well as full irrigation at all stages, with one stage exception.
As a result, particular irrigation amounts should be recommended based on the water source’s quality and availability. Thus, in water-scarce regions, a prudent approach could include strategically implementing a mixed water strategy (fresh water + saline water) with regulated deficit irrigation to reduce the use of freshwater without significantly affecting greenhouse tomato crop growth, physiology, yield, or quality. Finally, when freshwater is scarce, using a salinity of 2.25 dS·m−1 with 60% ETc regulated deficit irrigation produces a fair yield and saves more water.

Author Contributions

Conceptualization, A.G.A., A.E.-S. and A.M.A.-O.; methodology, A.R.A., A.A.A. and A.A.; software, A.K.A. and A.A.A.; validation, A.E.-S. and A.G.A.; formal analysis, A.K.A. and A.A.A.; investigation, A.K.A., A.R.A. and A.A.; resources, A.M.A.-O. and A.G.A.; data curation, A.K.A. and A.A.; writing—original draft preparation, A.M.A.-O. and A.G.A.; writing—review and editing, A.E.-S. and A.K.A.; visualization, A.M.A.-O., A.G.A. and A.A.A.; supervision, A.E.-S., A.M.A.-O. and A.G.A.; project administration, A.M.A.-O., A.G.A. and A.R.A.; funding acquisition, A.M.A.-O. and A.G.A. All authors have read and agreed to the published version of the manuscript.

Funding

This project was funded by the National Plan for Science, Technology and Innovation (MAARIFAH), King Abdulaziz City for Science and Technology, Kingdom of Saudi Arabia, Award Number (13-AGR 1104-02).

Data Availability Statement

The data presented in this study are available on request from the corresponding author.

Acknowledgments

This project was funded by the National Plan for Science, Technology and Innovation (MAARIFAH), King Abdulaziz City for Science and Technology, Kingdom of Saudi Arabia, Award Number (13-AGR 1104-02).

Conflicts of Interest

The authors declare that they have no known competing financial interests or personal relationships that could have appeared to influence the work reported in this paper.

References

  1. Obadi, A.; Alharbi, A.; Alomran, A.; Alghamdi, A.G.; Louki, I.; Alkhasha, A. Effect of Biochar Application on Morpho-Physiological Traits, Yield, and Water Use Efficiency of Tomato Crop under Water Quality and Drought Stress. Plants 2023, 12, 2355. [Google Scholar] [CrossRef]
  2. Kolekar, S.; Sankapal, P.; Khare, K.; Chinnasamy, P. Assessment of recycled treated wastewater for sustainable tomato crop production: A comprehensive review. Environ. Chall. 2023, 13, 100791. [Google Scholar] [CrossRef]
  3. Mir, A.M.; Ashraf, W.M. The challenges and potential strategies of Saudi Arabia’s water Resources: A review in analytical way. Environ. Nanotechnol. Monit. Manag. 2023, 20, 100855. [Google Scholar] [CrossRef]
  4. Samad, N.; Bruno, V. The urgency of preserving water resources. Environ. News 2013, 21, 3–6. [Google Scholar]
  5. Al-Omran, A.M.; Aly, A.A.; Al-Wabel, M.I.; Sallam, A.S.; Al-Shayaa, M.S. Hydrochemical characterization of groundwater under agricultural land in arid environment: A case study of Al-Kharj, Saudi Arabia. Arab. J. Geosci. 2016, 9, 68. [Google Scholar] [CrossRef]
  6. Alharbi, T.; El-Sorogy, A.S. Risk Assessment of Potentially Toxic Elements in Agricultural Soils of Al-Ahsa Oasis, Saudi Arabia. Sustainability 2022, 15, 659. [Google Scholar] [CrossRef]
  7. Abderrahman, W.A.; Rasheeduddin, M.; Al-Harazin, I.M.; Esuflebbe, M.; Eqnaibi, B.S. Impacts of management practices on groundwater conditions in the eastern province, Saudi Arabia. Hydrogeol. J. 1995, 3, 32–41. [Google Scholar] [CrossRef]
  8. Mallick, J.; Singh, C.K.; AlMesfer, M.K.; Singh, V.P.; Alsubih, M. Groundwater Quality Studies in the Kingdom of Saudi Arabia: Prevalent Research and Management Dimensions. Water 2021, 13, 1266. [Google Scholar] [CrossRef]
  9. Baig, M.B.; Alotibi, Y.; Straquadine, G.S.; Alataway, A. Water Resources in the Kingdom of Saudi Arabia: Challenges and Strategies for Improvement. In Water Policies in MENA Countries; Zekri, S., Ed.; Springer International Publishing: Cham, Switzerland, 2020; pp. 135–160. [Google Scholar]
  10. Khapte, P.S.; Kumar, P.; Burman, U.; Kumar, P. Deficit irrigation in tomato: Agronomical and physio-biochemical implications. Sci. Hortic. 2019, 248, 256–264. [Google Scholar] [CrossRef]
  11. FAOSTAT. Food and Agriculture Data: Production, Crops and Livestock Products. Available online: https://www.fao.org/faostat/en/#data/QCL (accessed on 10 February 2024).
  12. MEWA. Statistical Yearbook 2021: The Ministry of Environment, Water, and Agriculture’s Achievements; Ministry of Environment, Water and Agriculture: Riyadh, Saudi Arabia, 2021. [Google Scholar]
  13. Abdul-Hammed, M.; Bolarinwa, I.F.; Adebayo, L.O.; Akindele, S.L. Kinetics of the degradation of carotenoid antioxidants in tomato paste. Adv. J. Food Sci. Technol. 2016, 11, 734–741. [Google Scholar] [CrossRef]
  14. Beckles, D.M. Factors affecting the postharvest soluble solids and sugar content of tomato (Solanum lycopersicum L.) fruit. Postharvest. Biol. Tec. 2012, 63, 129–140. [Google Scholar] [CrossRef]
  15. Johnstone, P.R.; Hartz, T.K.; LeStrange, M.; Nunez, J.J.; Miyao, E.M. Managing Fruit Soluble Solids with Late-season Deficit Irrigation in Drip-irrigated Processing Tomato Production. Hortscience 2005, 40, 1857–1861. [Google Scholar] [CrossRef]
  16. Mahajan, G.; Singh, K.G. Response of Greenhouse tomato to irrigation and fertigation. Agric. Water Manag. 2006, 84, 202–206. [Google Scholar] [CrossRef]
  17. Nangare, D.; Singh, Y.; Kumar, P.S.; Minhas, P. Growth, fruit yield and quality of tomato (Lycopersicon esculentum Mill.) as affected by deficit irrigation regulated on phenological basis. Agric. Water Manag. 2016, 171, 73–79. [Google Scholar] [CrossRef]
  18. Ripoll, J.; Urban, L.; Brunel, B.; Bertin, N. Water deficit effects on tomato quality depend on fruit developmental stage and genotype. J. Plant. Physiol. 2016, 190, 26–35. [Google Scholar] [CrossRef]
  19. Lu, J.; Shao, G.C.; Cui, J.T.; Wang, X.J.; Keabetswe, L. Yield, fruit quality and water use efficiency of tomato for processing under regulated deficit irrigation: A meta-analysis. Agric. Water Manag. 2019, 222, 301–312. [Google Scholar] [CrossRef]
  20. Agbna, G.H.D.; Dongli, S.; Zhipeng, L.; Elshaikh, N.A.; Guangcheng, S.; Timm, L.C. Effects of deficit irrigation and biochar addition on the growth, yield, and quality of tomato. Sci. Hortic. 2017, 222, 90–101. [Google Scholar] [CrossRef]
  21. Chai, Q.; Gan, Y.; Zhao, C.; Xu, H.-L.; Waskom, R.M.; Niu, Y.; Siddique, K.H. Regulated deficit irrigation for crop production under drought stress. A review. Agron. Sustain. Dev. 2016, 36, 3. [Google Scholar] [CrossRef]
  22. Chand, J.; Hewa, G.; Hassanli, A.; Myers, B. Evaluation of Deficit Irrigation and Water Quality on Production and Water Productivity of Tomato in Greenhouse. Agriculture 2020, 10, 297. [Google Scholar] [CrossRef]
  23. Chen, J.; Kang, S.; Du, T.; Qiu, R.; Guo, P.; Chen, R. Quantitative response of greenhouse tomato yield and quality to water deficit at different growth stages. Agric. Water Manag. 2013, 129, 152–162. [Google Scholar] [CrossRef]
  24. Kuşçu, H.; Turhan, A.; Demir, A.O. The response of processing tomato to deficit irrigation at various phenological stages in a sub-humid environment. Agric. Water Manag. 2014, 133, 92–103. [Google Scholar] [CrossRef]
  25. Patanè, C.; Tringali, S.; Sortino, O. Effects of deficit irrigation on biomass, yield, water productivity and fruit quality of processing tomato under semi-arid Mediterranean climate conditions. Sci. Hortic. 2011, 129, 590–596. [Google Scholar] [CrossRef]
  26. Ouda, O.K.M. Water demand versus supply in Saudi Arabia: Current and future challenges. Int. J. Water Resour. Dev. 2014, 30, 335–344. [Google Scholar] [CrossRef]
  27. Tarawneh, Q.Y.; Chowdhury, S. Trends of Climate Change in Saudi Arabia: Implications on Water Resources. Climate 2018, 6, 8. [Google Scholar] [CrossRef]
  28. Cui, J.; Shao, G.; Lu, J.; Keabetswe, L.; Hoogenboom, G. Yield, quality and drought sensitivity of tomato to water deficit during different growth stages. Sci. Agric. 2020, 77, e20180390. [Google Scholar] [CrossRef]
  29. Nuruddin, M.M.; Madramootoo, C.A.; Dodds, G.T. Effects of Water Stress at Different Growth Stages on Greenhouse Tomato Yield and Quality. Hortscience 2003, 38, 1389–1393. [Google Scholar] [CrossRef]
  30. Patanè, C.; Corinzia, S.A.; Testa, G.; Scordia, D.; Cosentino, S.L. Physiological and Agronomic Responses of Processing Tomatoes to Deficit Irrigation at Critical Stages in a Semi-Arid Environment. Agronomy 2020, 10, 800. [Google Scholar] [CrossRef]
  31. Alshami, A.K.; El-Shafei, A.; Al-Omran, A.M.; Alghamdi, A.G.; Louki, I.; Alkhasha, A. Responses of Tomato Crop and Water Productivity to Deficit Irrigation Strategies and Salinity Stress in Greenhouse. Agronomy 2023, 13, 3016. [Google Scholar] [CrossRef]
  32. Al-Omran, A.; Al-Harbi, A.; Wahab-Allah, M.; Nadeem, M.; El-Eter, A. Impact of saline water rates under surface and subsurface drip irrigation system on tomato production. Turk. J. Agric. 2010, 33, 1–15. [Google Scholar]
  33. De Pascale, S.; Orsini, F.; Pardossi, A. Irrigation water quality for greenhouse horticulture. In Good Agricultural Practices for Greenhouse Vegetable Crops: Principles for Mediterranean Climate Areas; Wilfried, B., Womdim, R.N., Nebambi, L., Alison, H., Nicolás, C., Cherubino, L., De Pascale, S., Muien, Q., Eds.; Food and Agriculture Organization of the United Nations: Rome, Italy, 2013; Volume 217, pp. 169–204. [Google Scholar]
  34. Allen, R.G.; Pereira, L.S.; Raes, D.; Smith, M. Crop Evapotranspiration—Guidelines for Computing Crop Water Requirements—FAO Irrigation And Drainage Paper 56; FAO: Rome, Italy, 1998. [Google Scholar]
  35. ImageJ. Image Processing and Analysis in Java, v1.51j8; National Institutes of Health and the Laboratory for Optical and Computational Instrumentation LOCI: Madison, WI, USA, 2018.
  36. Helrich, K. Official Methods of Analysis of the Association of Official Analytical Chemists, 15th ed.; Association of Official Analytical Chemists: Arlington, VA, USA, 1990. [Google Scholar]
  37. Caruso, G.; Conti, S.; Villari, G.; Borrelli, C.; Melchionna, G.; Minutolo, M.; Russo, G.; Amalfitano, C. Effects of transplanting time and plant density on yield, quality and antioxidant content of onion (Allium cepa L.) in southern Italy. Sci. Hortic. 2014, 166, 111–120. [Google Scholar] [CrossRef]
  38. Ahmed, A.F.; Yu, H.; Yang, X.; Jiang, W. Deficit Irrigation Affects Growth, Yield, Vitamin C Content, and Irrigation Water Use Efficiency of Hot Pepper Grown in Soilless Culture. HortScience Horts 2014, 49, 722–728. [Google Scholar] [CrossRef]
  39. CoHort Software. Costat Statistical Package, Version 6.45; CoHort Software: Monterey, CA, USA, 2020.
  40. Malash, N.; Flowers, T.J.; Ragab, R. Effect of irrigation systems and water management practices using saline and non-saline water on tomato production. Agric. Water Manag. 2005, 78, 25–38. [Google Scholar] [CrossRef]
  41. Ors, S.; Ekinci, M.; Yildirim, E.; Sahin, U.; Turan, M.; Dursun, A. Interactive effects of salinity and drought stress on photosynthetic characteristics and physiology of tomato (Lycopersicon esculentum L.) seedlings. S. Afr. J. Bot. 2021, 137, 335–339. [Google Scholar] [CrossRef]
  42. Ashraf, M. Some important physiological selection criteria for salt tolerance in plants. Flora Morphol. Distrib. Funct. Ecol. Plants 2004, 199, 361–376. [Google Scholar] [CrossRef]
  43. Raghavendra, A.S.; Gonugunta, V.K.; Christmann, A.; Grill, E. ABA perception and signalling. Trends Plant Sci. 2010, 15, 395–401. [Google Scholar] [CrossRef] [PubMed]
  44. Sperry, J.S.; Alder, N.N.; Eastlack, S.E. The effect of reduced hydraulic conductance on stomatal conductance and xylem cavitation. J. Exp. Bot. 1993, 44, 1075–1082. [Google Scholar] [CrossRef]
  45. Liu, F.; Jensen, C.R.; Andersen, M.N. Hydraulic and chemical signals in the control of leaf expansion and stomatal conductance in soybean exposed to drought stress. Funct. Plant Biol. 2003, 30, 65–73. [Google Scholar] [CrossRef] [PubMed]
  46. Parkash, V.; Singh, S. A Review on Potential Plant-Based Water Stress Indicators for Vegetable Crops. Sustainability 2020, 12, 3945. [Google Scholar] [CrossRef]
  47. Farooq, M.; Wahid, A.; Kobayashi, N.; Fujita, D.; Basra, S. Plant drought stress: Effects, mechanisms and management. Agron. Sustain. Dev. 2009, 29, 185–212. [Google Scholar] [CrossRef]
  48. Tang, X.; Mu, X.; Shao, H.; Wang, H.; Brestic, M. Global plant-responding mechanisms to salt stress: Physiological and molecular levels and implications in biotechnology. Crit. Rev. Biotechnol. 2015, 35, 425–437. [Google Scholar] [CrossRef]
  49. Kazerooni, E.A.; Maharachchikumbura, S.S.N.; Al-Sadi, A.M.; Rashid, U.; Kang, S.M.; Lee, I.J. Actinomucor elegans and Podospora bulbillosa Positively Improves Endurance to Water Deficit and Salinity Stresses in Tomato Plants. J. Fungi 2022, 8, 785. [Google Scholar] [CrossRef] [PubMed]
  50. Alordzinu, K.; Jiuhao, L.; Appiah, S.; Aasmi, A.; Blege, P.; Afful, E. Water stress affects the physio-morphological development of tomato growth. Afr. J. Agric. Res. 2021, 17, 733–742. [Google Scholar] [CrossRef]
  51. Liang, G.; Liu, J.; Zhang, J.; Guo, J. Effects of Drought Stress on Photosynthetic and Physiological Parameters of Tomato. J. Amer. Soc. Hort. Sci. 2020, 145, 12–17. [Google Scholar] [CrossRef]
  52. Liu, J.; Zhang, R.; Zhang, G.; Guo, J.; Dong, Z. Effects of soil drought on photosynthetic traits and antioxidant enzyme activities in Hippophae rhamnoides seedlings. J. For. Res. 2017, 28, 255–263. [Google Scholar] [CrossRef]
  53. Wong, S.; Cowan, I.; Farquhar, G. Stomatal conductance correlates with photosynthetic capacity. Nature 1979, 282, 424–426. [Google Scholar] [CrossRef]
  54. Tuzet, A.; Perrier, A.; Leuning, R. A coupled model of stomatal conductance, photosynthesis and transpiration. Plant Cell Environ. 2003, 26, 1097–1116. [Google Scholar] [CrossRef]
  55. Hao, S.; Cao, H.; Wang, H.; Pan, X. The physiological responses of tomato to water stress and re-water in different growth periods. Sci. Hortic. 2019, 249, 143–154. [Google Scholar] [CrossRef]
  56. Hörtensteiner, S.; Kräutler, B. Chlorophyll breakdown in higher plants. Biochim. Biophys. Acta BBA Bioenerg. 2011, 1807, 977–988. [Google Scholar] [CrossRef] [PubMed]
  57. Gabhi, R.; Basile, L.; Kirk, D.W.; Giorcelli, M.; Tagliaferro, A.; Jia, C.Q. Electrical conductivity of wood biochar monoliths and its dependence on pyrolysis temperature. Biochar 2020, 2, 369–378. [Google Scholar] [CrossRef]
  58. Al-Harbi, A.R.; Al-Omran, A.M.; Alenazi, M.M.; Wahb-Allah, M.A. Salinity and Deficit Irrigation Influence Tomato Growth, Yield and Water Use Efficiency at Different Developmental Stages. Int. J. Agric. Biol. 2015, 17, 241–250. [Google Scholar]
  59. Naeem, M.; Waseem, M.; Zhu, Z.; Zhang, L. Downregulation of SlGRAS15 manipulates plant architecture in tomato (Solanum lycopersicum). Dev. Genes Evol. 2020, 230, 1–12. [Google Scholar] [CrossRef]
  60. Romero-Aranda, R.; Soria, T.; Cuartero, J. Tomato plant-water uptake and plant-water relationships under saline growth conditions. Plant Sci. 2001, 160, 265–272. [Google Scholar] [CrossRef]
  61. Ghannem, A.; Ben Aissa, I.; Majdoub, R. Effects of regulated deficit irrigation applied at different growth stages of greenhouse grown tomato on substrate moisture, yield, fruit quality, and physiological traits. Environ. Sci. Pollut. Res. 2021, 28, 46553–46564. [Google Scholar] [CrossRef]
  62. Naeem, M.; Zhao, W.; Ahmad, N.; Zhao, L. Beyond green and red: Unlocking the genetic orchestration of tomato fruit color and pigmentation. Funct. Integr. Genom. 2023, 23, 243. [Google Scholar] [CrossRef]
  63. Colimba-Limaico, J.E.; Zubelzu-Minguez, S.; Rodríguez-Sinobas, L. Optimal Irrigation Scheduling for Greenhouse Tomato Crop (Solanum lycopersicum L.) in Ecuador. Agronomy 2022, 12, 1020. [Google Scholar] [CrossRef]
  64. Wu, Y.; Yan, S.; Fan, J.; Zhang, F.; Xiang, Y.; Zheng, J.; Guo, J. Responses of growth, fruit yield, quality and water productivity of greenhouse tomato to deficit drip irrigation. Sci. Hortic. 2021, 275, 109710. [Google Scholar] [CrossRef]
  65. Al-Harbi, A.; Wahb-Allah, M.; Al-Omran, A. Effects of salinity and irrigation management on growth and yield of tomato grown under greenhouse conditions. In Proceedings of International Symposium on Strategies Towards Sustainability of Protected Cultivation in Mild Winter Climate 807, Antalya, Turkey, 6–11 April 2008; pp. 201–206. [Google Scholar]
  66. Gao, Y.; Shao, G.; Lu, J.; Wang, Y.; Cui, J. Changes in yield of tomato irrigated with salty water varied by soil properties and irrigation practices: A meta-analysis. Arch. Agron. Soil Sci. 2023, 69, 2300–2313. [Google Scholar] [CrossRef]
  67. Yang, H.; Du, T.; Mao, X.; Ding, R.; Shukla, M.K. A comprehensive method of evaluating the impact of drought and salt stress on tomato growth and fruit quality based on EPIC growth model. Agric. Water Manag. 2019, 213, 116–127. [Google Scholar] [CrossRef]
  68. Tura, L.E.; Tolossa, T.T. Systematic review: Effect of irrigation water quality and deficit irrigation on crop yield and water use efficiency. Turk. J. Agric.-Food Sci. Technol. 2020, 8, 1201–1210. [Google Scholar] [CrossRef]
  69. Chand, J.B.; Hewa, G.; Hassanli, A.; Myers, B. Deficit irrigation on tomato production in a greenhouse environment: A review. J. Irrig. Drain. Eng. 2021, 147, 04020041. [Google Scholar] [CrossRef]
  70. Kirda, C.; Çetin, M.; Dasgan, Y.; Topçu, S.; Kaman, H.; Ekici, B.; Derici, M.R.; Ozguven, A. Yield response of greenhouse grown tomato to partial root drying and conventional deficit irrigation. Agric. Water Manag. 2004, 69, 191–201. [Google Scholar] [CrossRef]
  71. Wang, C.X.; Gu, F.; Chen, J.L.; Yang, H.; Jiang, J.J.; Du, T.S.; Zhang, J.H. Assessing the response of yield and comprehensive fruit quality of tomato grown in greenhouse to deficit irrigation and nitrogen application strategies. Agric. Water Manag. 2015, 161, 9–19. [Google Scholar] [CrossRef]
  72. Yang, H.; Du, T.; Qiu, R.; Chen, J.; Wang, F.; Li, Y.; Wang, C.; Gao, L.; Kang, S. Improved water use efficiency and fruit quality of greenhouse crops under regulated deficit irrigation in northwest China. Agric. Water Manag. 2017, 179, 193–204. [Google Scholar] [CrossRef]
  73. Yang, H.; Du, T.; Mao, X.; Shukla, M.K. Modeling tomato evapotranspiration and yield responses to salinity using different macroscopic reduction functions. Vadose Zone J. 2020, 19, e20074. [Google Scholar] [CrossRef]
  74. Malash, N.; Flowers, T.; Ragab, R. Effect of irrigation methods, management and salinity of irrigation water on tomato yield, soil moisture and salinity distribution. Irrig. Sci. 2008, 26, 313–323. [Google Scholar] [CrossRef]
  75. Agius, C.; von Tucher, S.; Rozhon, W. The Effect of Salinity on Fruit Quality and Yield of Cherry Tomatoes. Horticulturae 2022, 8, 59. [Google Scholar] [CrossRef]
  76. Lipan, L.; Issa-Issa, H.; Moriana, A.; Zurita, N.M.; Galindo, A.; Martín-Palomo, M.J.; Andreu, L.; Carbonell-Barrachina, A.A.; Hernández, F.; Corell, M. Scheduling Regulated Deficit Irrigation with Leaf Water Potential of Cherry Tomato in Greenhouse and its Effect on Fruit Quality. Agriculture 2021, 11, 669. [Google Scholar] [CrossRef]
  77. Liu, H.; Li, H.H.; Ning, H.F.; Zhang, X.X.; Li, S.; Pang, J.; Wang, G.S.; Sun, J.S. Optimizing irrigation frequency and amount to balance yield, fruit quality and water use efficiency of greenhouse tomato. Agric. Water Manag. 2019, 226, 105787. [Google Scholar] [CrossRef]
  78. Mitchell, J.; Shennan, C.; Grattan, S.; May, D. Tomato fruit yields and quality under water deficit and salinity. J. Am. Soc. Hortic. Sci. 1991, 116, 215–221. [Google Scholar] [CrossRef]
  79. Guichard, S.; Bertin, N.; Leonardi, C.; Gary, C. Tomato fruit quality in relation to water and carbon fluxes. Agronomie 2001, 21, 385–392. [Google Scholar] [CrossRef]
  80. Wang, F.; Kang, S.; Du, T.; Li, F.; Qiu, R. Determination of comprehensive quality index for tomato and its response to different irrigation treatments. Agric. Water Manag. 2011, 98, 1228–1238. [Google Scholar] [CrossRef]
  81. Chen, J.L.; Kang, S.Z.; Du, T.S.; Guo, P.; Qiu, R.J.; Chen, R.Q.; Gu, F. Modeling relations of tomato yield and fruit quality with water deficit at different growth stages under greenhouse condition. Agric. Water Manag. 2014, 146, 131–148. [Google Scholar] [CrossRef]
  82. Wu, Z.; Fan, Y.; Qiu, Y.; Hao, X.; Li, S.; Kang, S. Response of yield and quality of greenhouse tomatoes to water and salt stresses and biochar addition in Northwest China. Agric. Water Manag. 2022, 270, 107736. [Google Scholar] [CrossRef]
Figure 1. Minimum (Tn) and maximum (Tx) daily air temperatures, and Minimum (RHn) and maximum (RHx) relative humidity during cultivation days inside the greenhouse.
Agronomy 14 00559 g001
Figure 2. The layout of the experiment and the randomization of treatment conditions.
Agronomy 14 00559 g002
Figure 3. Interaction effects between water quality and irrigation water amounts on (a) photosynthesis (Pn) and (b) chlorophyll index (Chl-I) for FW (fresh water), MW (mixed water), SW (salinity water), full irrigation (FI), deficit irrigation of 60% ETc for all stages (DI), and FI in a single stage (initial, development, mid-season, or late-season) and deficit irrigation of 60% ETc in the remaining stages (DI-int, DI-dev, DI-mid, and DI-lat). The data is the mean value ± standard error, and the LSD test was conducted at the 5% level (p < 0.05), and distinct letters in the figure indicate significant differences between treatments.
Agronomy 14 00559 g003
Figure 4. Interaction effects between water quality and irrigation water amounts (a) plant length(h), (b) stem thickness (ST), (c) wet stem weight (WSw), and (d) dry stem weight (WSw), for FW (fresh water); MW (mixed water); SW (salinity water); full irrigation (FI); deficit irrigation of 60% ETc for all stages (DI); and FI in a single stage (initial, development, mid-season, or late-season) and deficit irrigation of 60% ETc in the remaining stages (DI-int, DI-dev, DI-mid, and DI-lat). The data is the mean value ± standard error, and the LSD test was conducted at the 5% level (p < 0.05), and distinct letters in the figure indicate significant differences between treatments.
Agronomy 14 00559 g004
Figure 5. Interaction effects between water quality and irrigation water amounts on (a) total fruit yield (t ha−1) and (b) water use efficiency (WUE) for FW (fresh water), MW (mixed-water), SW (salinity-water), full irrigation (FI), irrigation set at 60% ETc level for all stages (DI), FI in a single stage, and irrigation at 60% ETc in the remaining stages (DI-int, DI-dev, DI-mid, and DI-lat). The data is the mean value ± standard error, and the LSD test was conducted at the 5% level (p < 0.05), and distinct letters in the figure indicate significant differences between treatments.
Agronomy 14 00559 g005
Figure 6. The relationships between tomato yield and applied irrigation water under different water quality: FW (fresh water), MW (mixed water), and SW (salinity water).
Agronomy 14 00559 g006
Figure 7. Interaction effects between water quality and irrigation water amounts on (a) the citric acid (CA) and (b) total soluble solids (TSS) for FW (fresh water), MW (mixed water), SW (salinity water), full irrigation (FI), irrigation set at 60% ETc level for all stages (DI), FI in a single stage and irrigation at 60% ETc in the remaining stages (DI-int, DI-dev, DI-mid, and DI-lat). The data is the mean value ± standard error, and the LSD test was conducted at the 5% level (p < 0.05), and distinct letters in the figure indicate significant differences between treatments.
Agronomy 14 00559 g007
Figure 8. Principal Component Analysis (PCA) biplot illustrating the impact of fresh water (FW), saline water (SW), and mixed water (MW) on the measured variables. Each point represents a sample, with ellipses indicating the distribution of samples within each category. Arrows indicate the correlation of parameter with the principal components (PC) (PC1: vertical dashed line (Dim1), and PC2: horizontal dashed line (Dim2)).
Agronomy 14 00559 g008
Table 1. Physical and chemical characteristics of soil and irrigated water at the experimental site.
Soil Physical Properties
Soil Depth (cm)Bulk Density
(g cm3)
CaCO3 (%)Organic Matter (%)Mechanical Analysis (%)Saturation %Field Capacity %Wilting Point %
SandSiltClaySoil Texture
0–251.5915.90.5894.56.5Loamy sand25.418.18.5
25–501.5723.21.077.911.510.6Sandy loam26.118.911.2
Chemical analysis
Soil depth (cm)pHEC
(dS·m−1)
Cations (meq L−1)Anions (meq L−1)SAR
Ca2+Mg2+Na+K+SO42−HCO3Cl
0–257.453.918.172.2618.41425.381225.832.03
25–507.393.7714.171.3113.69.911.082411.084.14
Water samplepHEC
(dS·m−1)
Cations (meq L−1)Anions (meq L−1)SAR
Ca2+Mg2+Na+K+CO32−HCO3Cl
Freshwater7.10.94.22.47.30.13027.24.02
Saline water7.523.62.82.232.040.2902.8731.2920.26
Table 2. Description of treatments used in the experiment.
TreatmentDescriptionConductivity (dS·m−1)
Irrigation Quality
FWFresh water (FW)0.9
SWSaline water (SW)3.6
MW1:1 mixture of fresh and saline water (MW)2.25
Irrigation amountAgronomy 14 00559 i001(mm)% ETc
* FIAgronomy 14 00559 i002744.64100
** DIAgronomy 14 00559 i003446.7960.0
DI-intAgronomy 14 00559 i004472.1963.4
DI-devAgronomy 14 00559 i005488.1765.6
DI-midAgronomy 14 00559 i006617.1382.9
DI-latAgronomy 14 00559 i007507.5168.2
* Gray color refers to full irrigation; ** white color refers to 60% ETc deficit irrigation.
Table 3. Impact of water quality and water amount on photosynthetic rate (Pn), stomatal conductance (gs), transpiration rate (Tr), and chlorophyll index (Chl-I).
Irrigation QualityPn
(μmol CO2 m−2 s−1)
Tr
(mmol H2O m−2 s−1)
gs
(mmol H2O m−2 s−1)
Chl-I
(SPAD)
FW15.59 a1.14 a3.58 a42.15 a
MW13.75 b0.95 b3.06 b36.27 b
SW12.55 c0.91 c2.76 c34.01 c
p-value0.0000.0000.0000.000
LSD0.0600.0320.0390.378
Variance0.0040.0010.0020.167
Irrigation amount
FI15.64 a1.18 a3.84 a41.93 a
DI12.99 f0.93 d2.86 d34.94 f
DI-int13.28 e0.94 d2.96 c35.56 e
DI-dev13.43 d0.95 cd2.96 c36.7 d
DI-mid 14.42 b1.02 b3.12 b38.28 b
DI-lat 14.04 c0.98 bc3.08 b37.45 c
p-value0.0000.0000.0000.000
LSD0.0780.0410.0890.395
Variance0.0070.0020.0090.168
Interaction of irrigation quality and amount
p-value0.0000.760.080.000
LSD0.1360.0700.1550.683
Variance0.0070.0020.0090.168
The LSD test: values that share the same letter are not considered significantly different at the 0.05 probability level. The data is an average of the measurements taken in the middle of each growth stage.
Table 4. Pearson’s correlation among the measured variables within fresh, saline, and mixed water.
Fresh Water
YieldWUEgsPnTrChl-ISThLAWSwWSdCATSSVC
yield
WUE−0.72 ***
gs0.90 ****−0.69 **
Pn0.74 ***−0.94 ****0.70 **
Tr0.94 ****−0.81 ****0.86 ****0.85 ****
Chl-I0.88 ****−0.89 ****0.83 ****0.93 ****0.95 ****
ST0.94 ****−0.84 ****0.91 ****0.85 ****0.97 ****0.95 ****
h0.97 ****−0.74 ***0.91 ****0.74 ***0.94 ****0.88 ****0.96 ****
LA0.87 ****−0.92 ****0.80 ****0.88 ****0.90 ****0.92 ****0.93 ****0.91 ****
WSw0.97 ****−0.79 ****0.89 ****0.78 ***0.96 ****0.90 ****0.97 ****0.99 ****0.94 ****
WSd0.97 ****−0.77 ***0.93 ****0.77 ***0.95 ****0.90 ****0.97 ****0.98 ****0.91 ****0.99 ****
CA−0.96 ****0.63 **−0.86 ****−0.63 **−0.89 ****−0.79 ****−0.90 ****−0.97 ****−0.82 ****−0.95 ****−0.95 ****
TSS−0.95 ****0.62 **−0.88 ****−0.62 **−0.90 ****−0.79 ****−0.92 ****−0.96 ****−0.81 ****−0.95 ****−0.96 ****0.96 ****
VC−0.92 ****0.54 *−0.84 ****−0.55 *−0.87 ****−0.73 ***−0.87 ****−0.95 ****−0.77 ***−0.93 ****−0.93 ****0.97 ****0.97 ****
Saline Water
yieldWUEgsPnTrChl-ISThLAWSwWSdCATSSVC
yield
WUE−0.91 ****
gs 0.88 ****−0.85 ****
Pn 0.98 ****−0.88 **** 0.89 ****
Tr 0.92 ****−0.83 **** 0.85 **** 0.95 ****
Chl-I 0.97 ****−0.91 **** 0.91 **** 0.98 **** 0.91 ****
ST 0.97 ****−0.87 **** 0.87 **** 0.99 **** 0.94 **** 0.98 ****
h 0.91 ****−0.76 *** 0.81 **** 0.96 **** 0.95 **** 0.91 **** 0.95 ****
LA 0.97 ****−0.87 **** 0.84 **** 0.96 **** 0.94 **** 0.96 **** 0.97 **** 0.92 ****
WSw 0.96 ****−0.85 **** 0.87 **** 0.99 **** 0.97 **** 0.96 **** 0.98 **** 0.97 **** 0.97 ****
WSd 0.95 ****−0.81 **** 0.85 **** 0.98 **** 0.96 **** 0.95 **** 0.97 **** 0.98 **** 0.97 **** 0.99 ****
CA−0.76 *** 0.58 * −0.61 ** −0.82 ****−0.83 ****−0.77 *** −0.81 ****−0.92 ****−0.79 ****−0.86 ****−0.88 ****
TSS−0.82 **** 0.62 ** −0.71 *** −0.89 ****−0.88 ****−0.81 ****−0.87 ****−0.97 ****−0.83 ****−0.90 ****−0.93 **** 0.94 ****
VC−0.86 **** 0.66 ** −0.73 *** −0.91 ****−0.91 ****−0.85 ****−0.90 ****−0.97 ****−0.89 ****−0.93 ****−0.96 **** 0.93 **** 0.97 ****
Mixed water
yieldWUEgsPnTrChl-ISThLAWSwWSdCATSSVC
yield
WUE−0.86 ****
gs 0.86 ****−0.88 ****
Pn 0.87 ****−0.97 **** 0.92 ****
Tr 0.80 ****−0.89 **** 0.89 **** 0.95 ****
Chl-I 0.84 ****−0.96 **** 0.91 **** 0.98 **** 0.94 ****
ST 0.85 ****−0.93 **** 0.94 **** 0.98 **** 0.95 **** 0.98 ****
h 0.73 *** −0.85 **** 0.89 **** 0.92 **** 0.95 **** 0.92 **** 0.95 ****
LA 0.88 ****−0.93 **** 0.91 **** 0.97 **** 0.96 **** 0.95 **** 0.97 **** 0.93 ****
WSw 0.82 ****−0.90 **** 0.91 **** 0.96 **** 0.97 **** 0.95 **** 0.97 **** 0.98 **** 0.96 ****
WSd 0.73 *** −0.88 **** 0.88 **** 0.94 **** 0.94 **** 0.95 **** 0.96 **** 0.98 **** 0.92 **** 0.96 ****
CA−0.62 ** 0.71 *** −0.77 *** −0.80 ****−0.90 ****−0.79 *** −0.84 ****−0.93 ****−0.83 ****−0.91 ****−0.87 ****
TSS−0.66 ** 0.69 ** −0.81 ****−0.80 ****−0.90 ****−0.78 *** −0.85 ****−0.95 ****−0.84 ****−0.93 ****−0.88 **** 0.95 ****
VC−0.63 ** 0.66 ** −0.78 *** −0.77 *** −0.86 ****−0.77 *** −0.84 ****−0.94 ****−0.80 ****−0.90 ****−0.89 **** 0.91 **** 0.98 ****
WUE: Water use efficiency, gs: Stomatal conductance, Pn: Photosynthetic rate, Tr: Transpiration rate, Chl-I: chlorophyll index, ST: stem thickness, h: Plant height, LA: Leaf area, WSw: wet stem weight, WSd: dry stem weight, CA: Citric acid, TSS: Total soluble solids, VC: Vitamin C. *, **, ***, **** refer to correlations with significance at 0.05, 0.01, 0.001 and 0.0001 levels, respectively.
Table 5. Impact of water quality and water amount on tomato plant height (h), wet stem weight (WSw), dry stem weight (WSd), stem thickness (ST), and leaf area (LA).
Irrigation Qualityh
(cm)
WSw
(g)
WSd
(g)
ST
(mm)
LA
(cm2)
FW445.71 a419.51 a44.68 a8.54 a1208.14 a
MW417.99 b374.87 b42.17 b7.11 b1193.48 a
SW364.52 c312.07 c39.04 c6.83 c1162.12 b
p-value0.000.000.000.000.01
LSD4.3843.7360.4250.15322.333
Variance22.44316.2930.2110.027582.322
Irrigation amount
FI482.61 a469.58 a48.11 a9.59 a1431.01 a
DI390.58 d336.88 e39.83 e6.60 e1074.84 e
DI-int392.18 d341.93 d40.49 d6.71 e1102.74 de
DI-dev394.47 cd346.36 d40.69 cd7.16 d1133.63 cd
DI-mid 399.89 b366.34 b41.52 b7.58 b1223.5 b
DI-lat 396.73 bc351.79 c41.13 bc7.34 c1161.74 c
p-value0.000.000.000.000.00
LSD4.2454.7160.4840.13932.508
Variance19.44323.9970.2530.0211140.154
Interaction of irrigation quality and amount
p-value0.000.000.020.000.65
LSD7.3538.1690.8390.24156.305
Variance:19.44323.9970.2530.0211140.154
The LSD test: values that share the same letter are not considered significantly different at the 0.05 probability level. The data was measured at the end of the season.
Table 6. The analysis of the effects of water quality and irrigation water amounts on total fruit yield (Y), Yield reduction (YR), water use efficiency (WUE), and water use efficiency improvement (WUEI) for tomato plants.
Irrigation QualityY
(t·ha−1)
WUE
(kg·m−3)
YR
(%)
WUEI
(%)
FW108.55 a20.33 a0.000.00
MW99.75 b18.8 b8.11−7.53
SW76.02 c14.16 c29.97−30.35
p-value0.000.00----
LSD0.6440.140----
Variance0.4850.023----
Irrigation amount
FI105.34 a14.15 f0.000.00
DI90.92 d20.35 a13.6943.8
DI-int91.4 d19.36 b13.2336.8
DI-dev91.98 d18.84 c12.6833.1
DI-mid 95.73 b15.51 e9.129.6
DI-lat 93.27 c18.38 d11.4629.9
p-value0.000.00----
LSD1.2700.253----
Variance1.7390.069----
Interaction of irrigation quality and amount
p-value0.000.00----
LSD2.1990.438----
Variance:1.7390.069----
The LSD test: values that share the same letter are not considered significantly different at the 0.05 probability level.
Table 7. The statistical analysis of the effects of irrigation quantity and quality on total soluble solids (TSS), vitamin C (VC), and citric acid (CA) in tomato fruits.
TreatmentsCA (% Citric Acid)VC (mg·100·g−1)TSS (%)
Irrigation quality
FW4.17 c31.07 c4.38 c
MW4.28 b33.59 b4.54 b
SW4.92 a34.26 a5.06 a
p-value0.000.000.00
LSD0.0660.3400.025
Variance0.0050.1350.001
Irrigation amount
FI3.89 b29.31 d3.85 d
DI4.54 a33.43 c4.75 c
DI-int4.55 a33.54 bc4.79 bc
DI-dev4.56 a33.64 bc4.83 ab
DI-mid 4.61 a34.13 a4.89 a
DI-lat 4.59 a33.79 b4.86 a
p-value0.000.000.00
LSD0.0880.3160.059
Variance0.0080.1080.004
Interaction of irrigation quality and amount
p-value0.000.940.01
LSD0.1520.5480.102
Variance0.0080.1080.004
The LSD test: values that share the same letter are not considered significantly different at the 0.05 probability level.
Disclaimer/Publisher’s Note: The statements, opinions and data contained in all publications are solely those of the individual author(s) and contributor(s) and not of MDPI and/or the editor(s). MDPI and/or the editor(s) disclaim responsibility for any injury to people or property resulting from any ideas, methods, instructions or products referred to in the content.

