
Effect of Irrigation and Nitrogen Management on Potato Growth, Yield, and Water and Nitrogen Use Efficiencies

 ,
, 

Abstract
1. Introduction
2. Materials and Methods
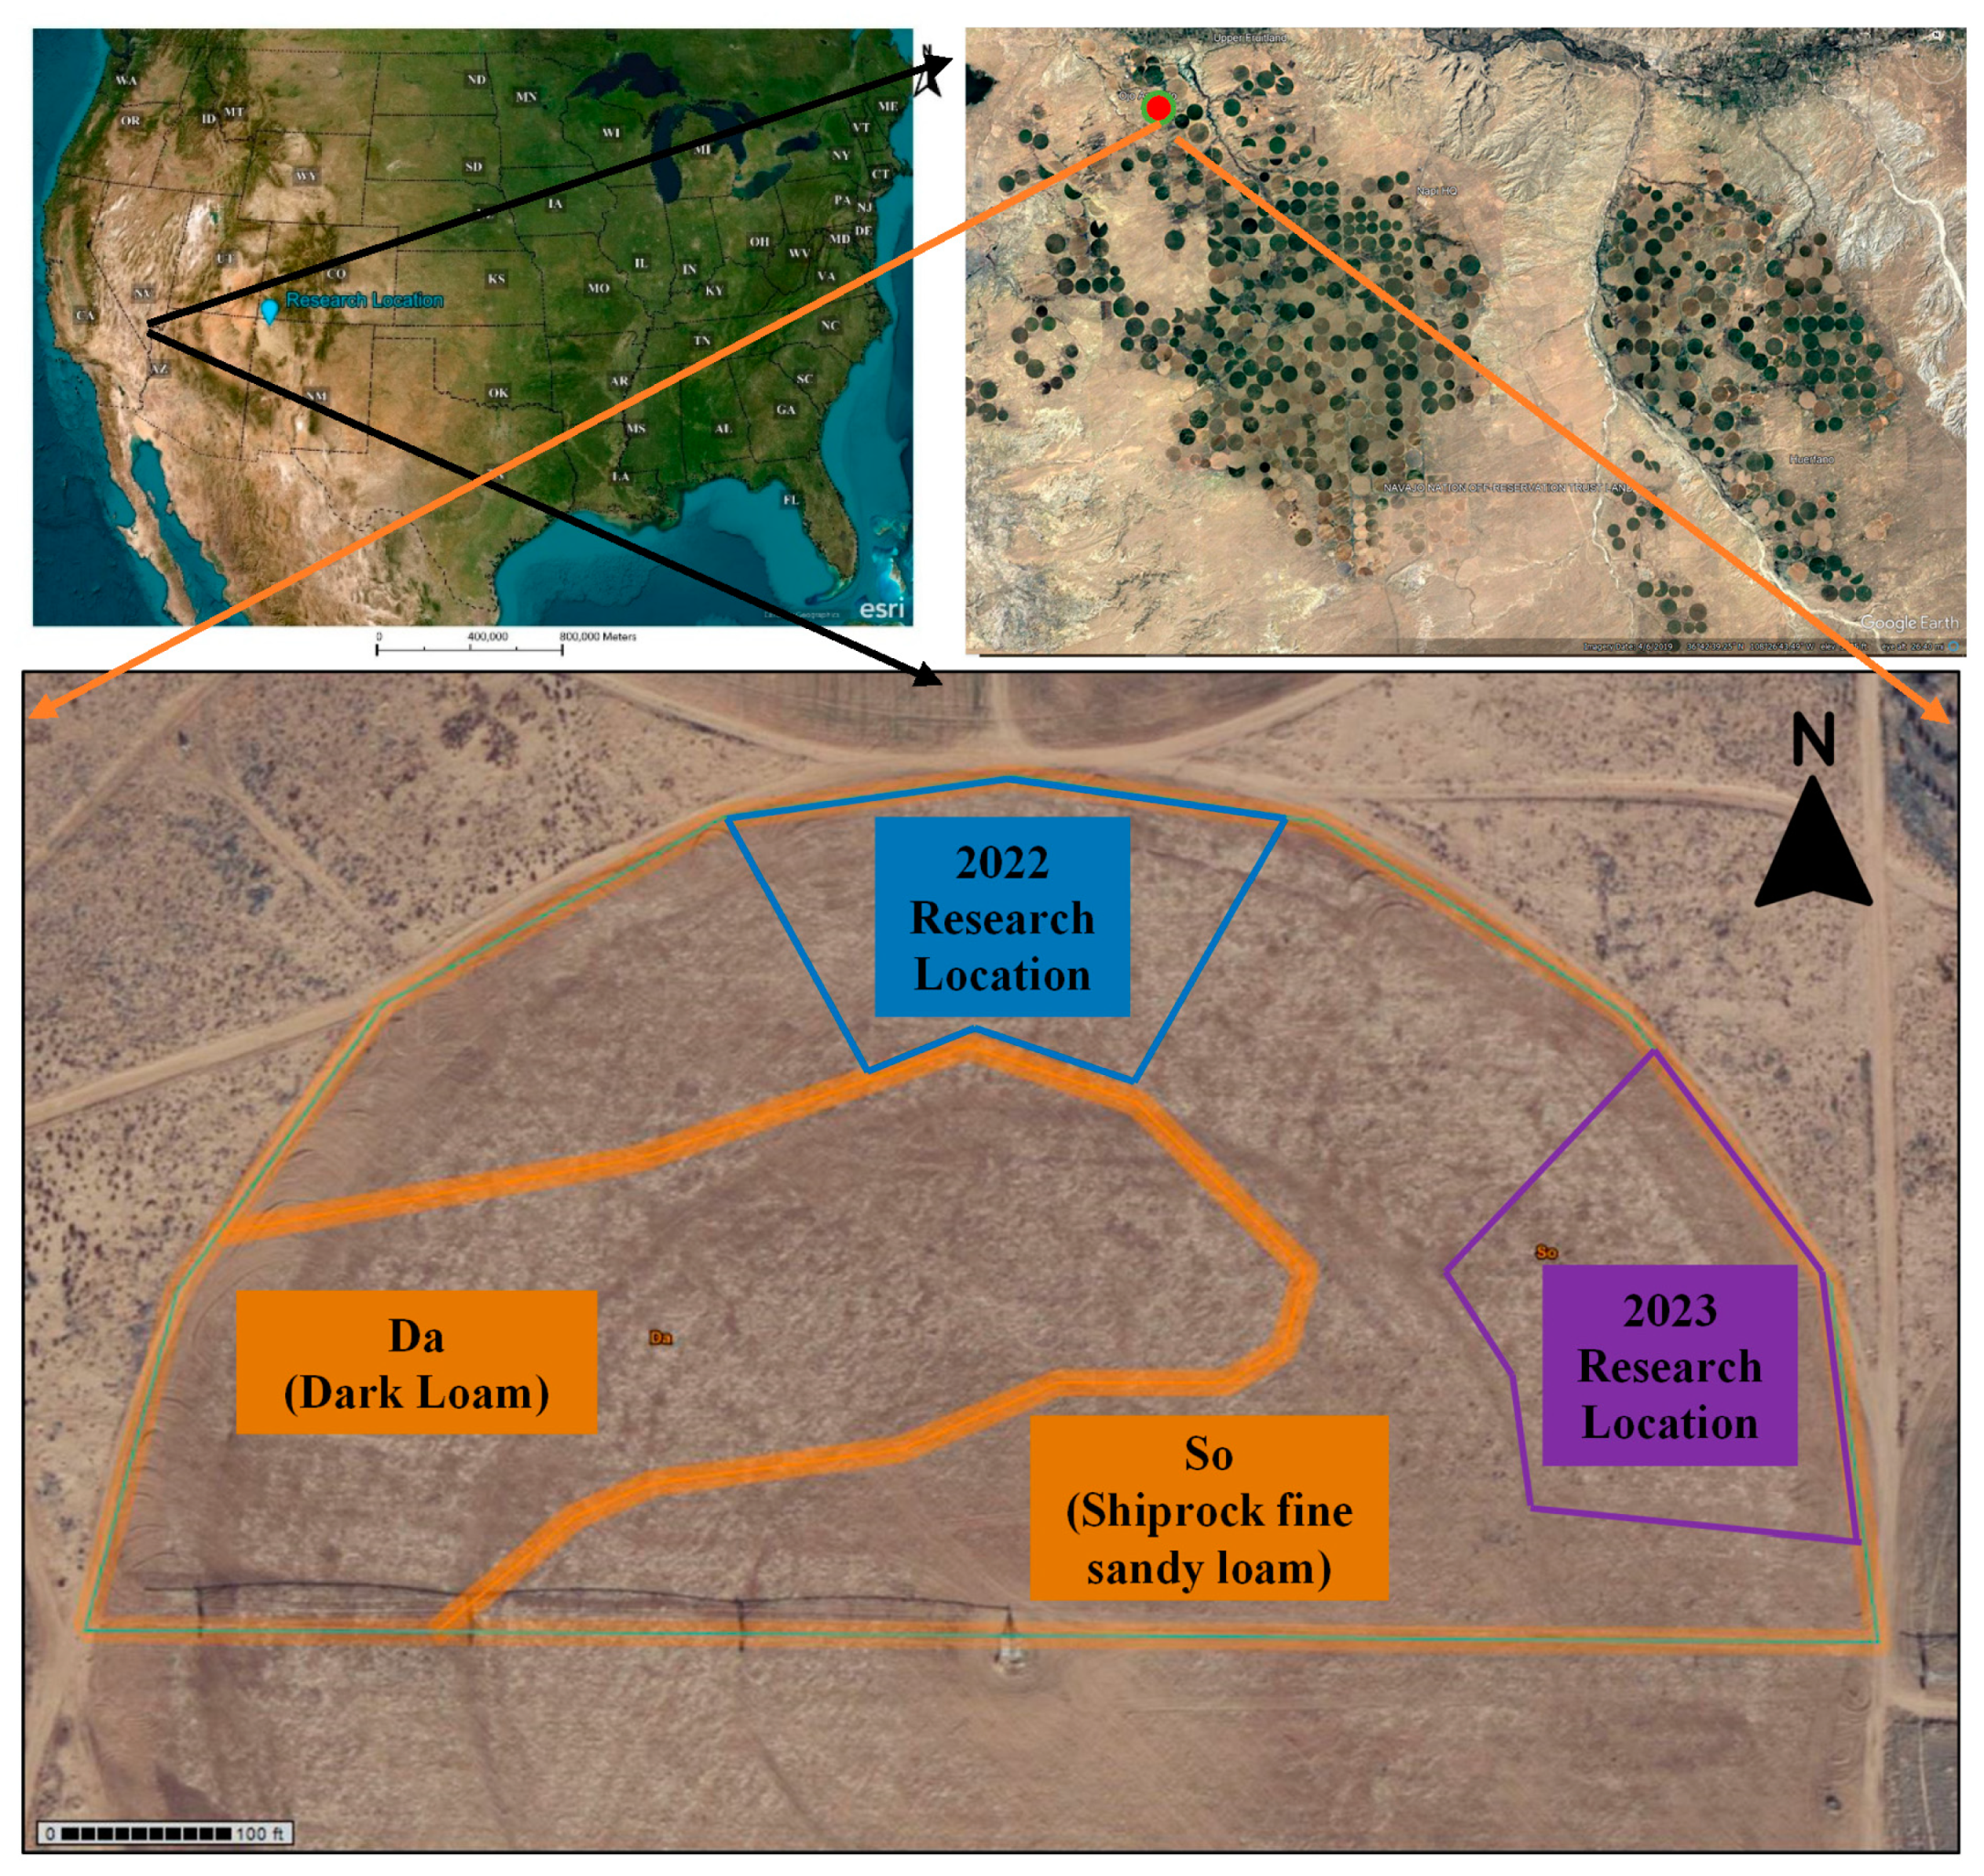
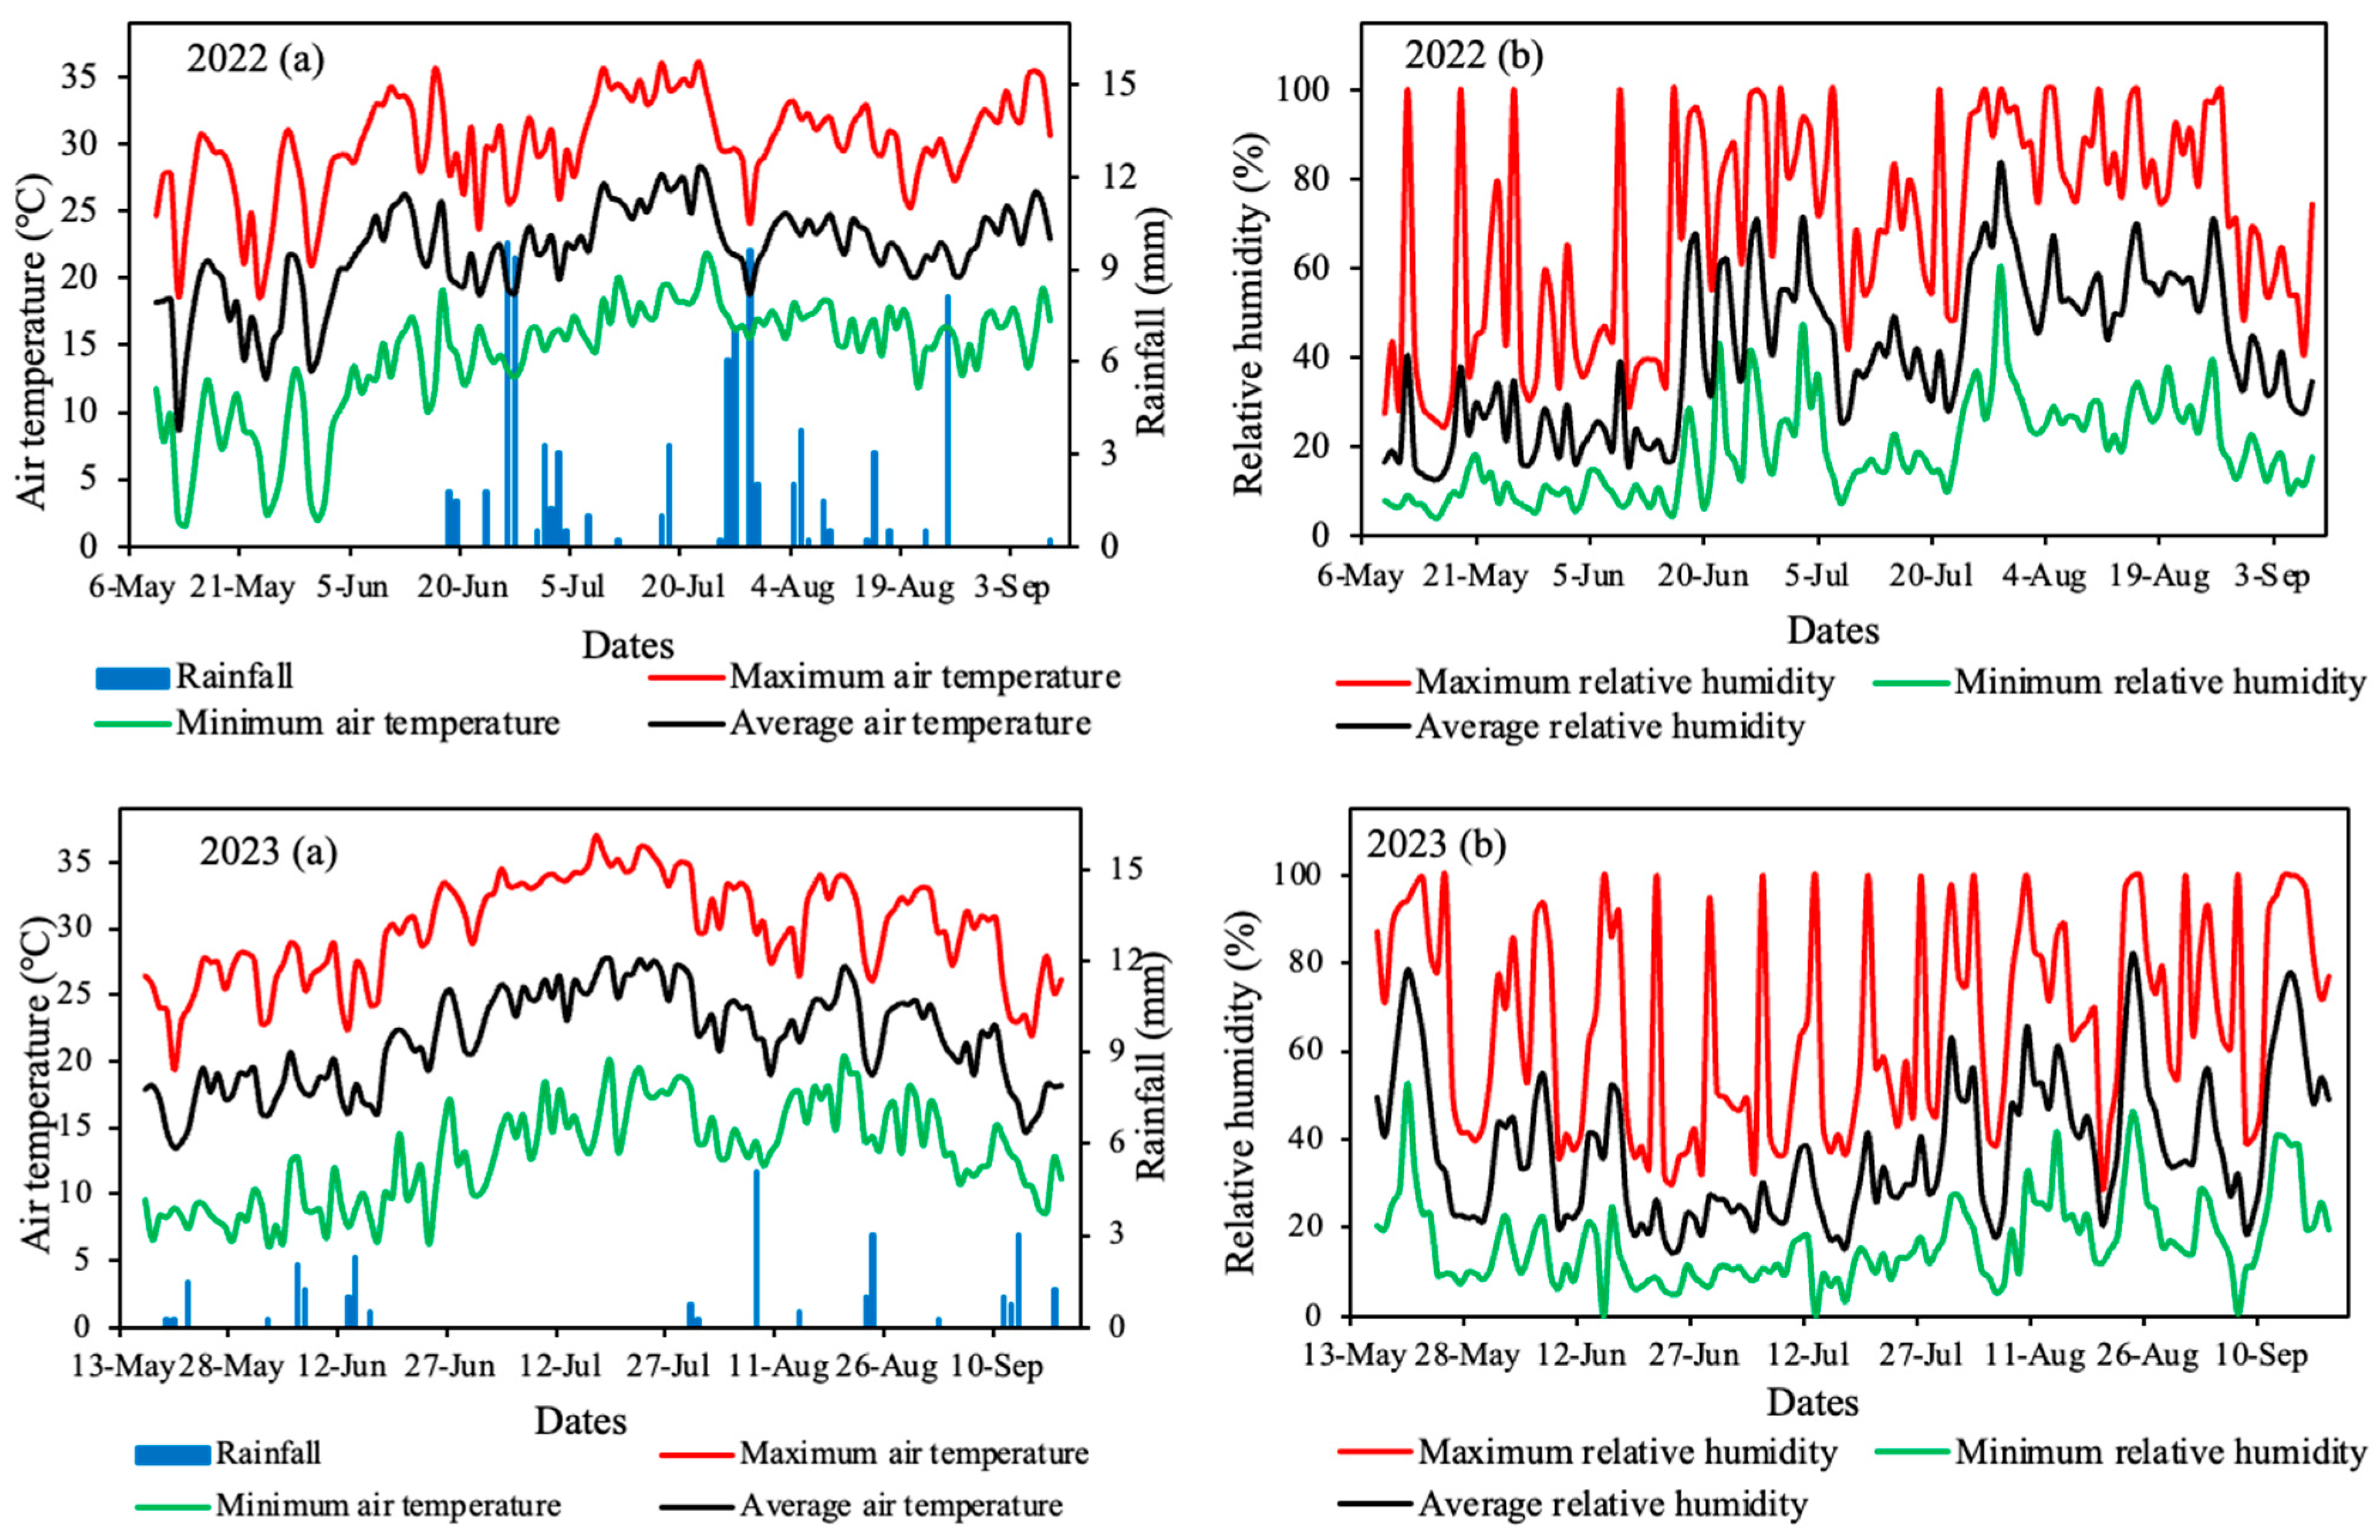
2.1. Experiment Site
2.2. Experimental Design
2.3. Crop Management
2.4. Observations Recorded
2.4.1. Observations Recorded for Plant Growth and Physiological Parameters
2.4.2. Observations Recorded for Yield and Yield Components
2.4.3. Water Use Efficiency (WUE)
2.4.4. Nitrogen Use Efficiency (NUE)
2.5. Statistical Analysis
3. Results
3.1. Plant Growth Parameters
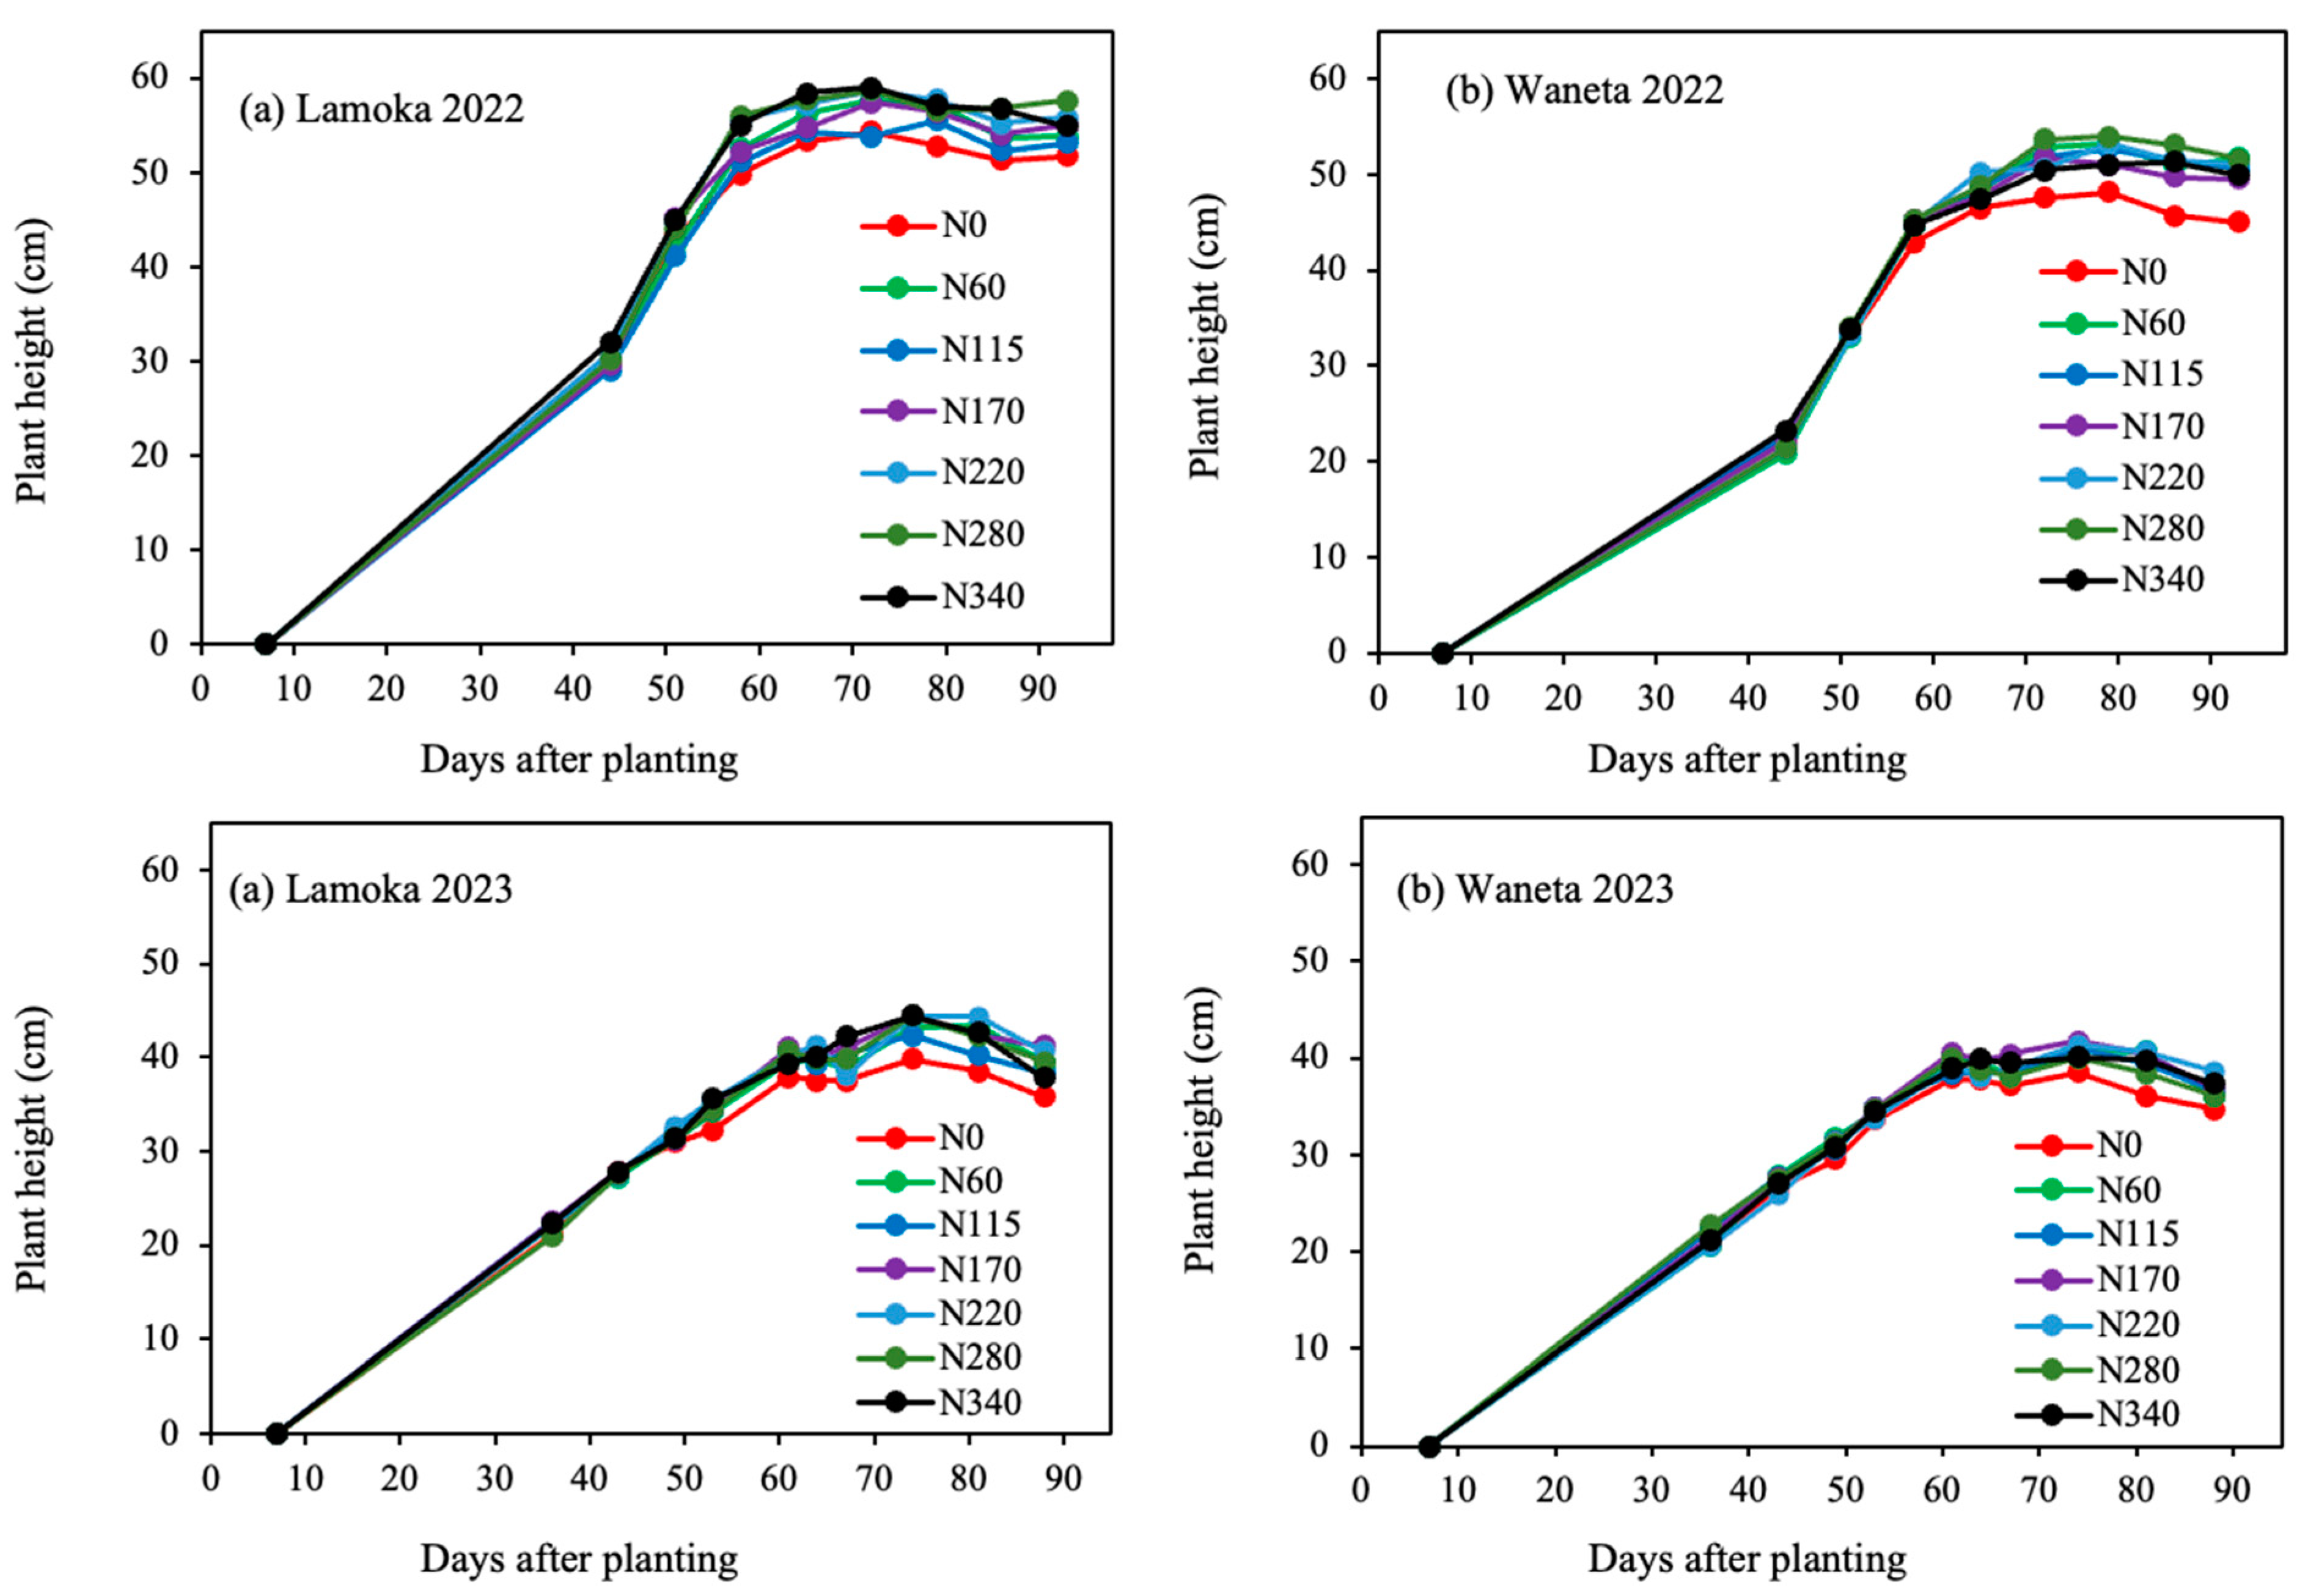
3.1.1. Plant Height
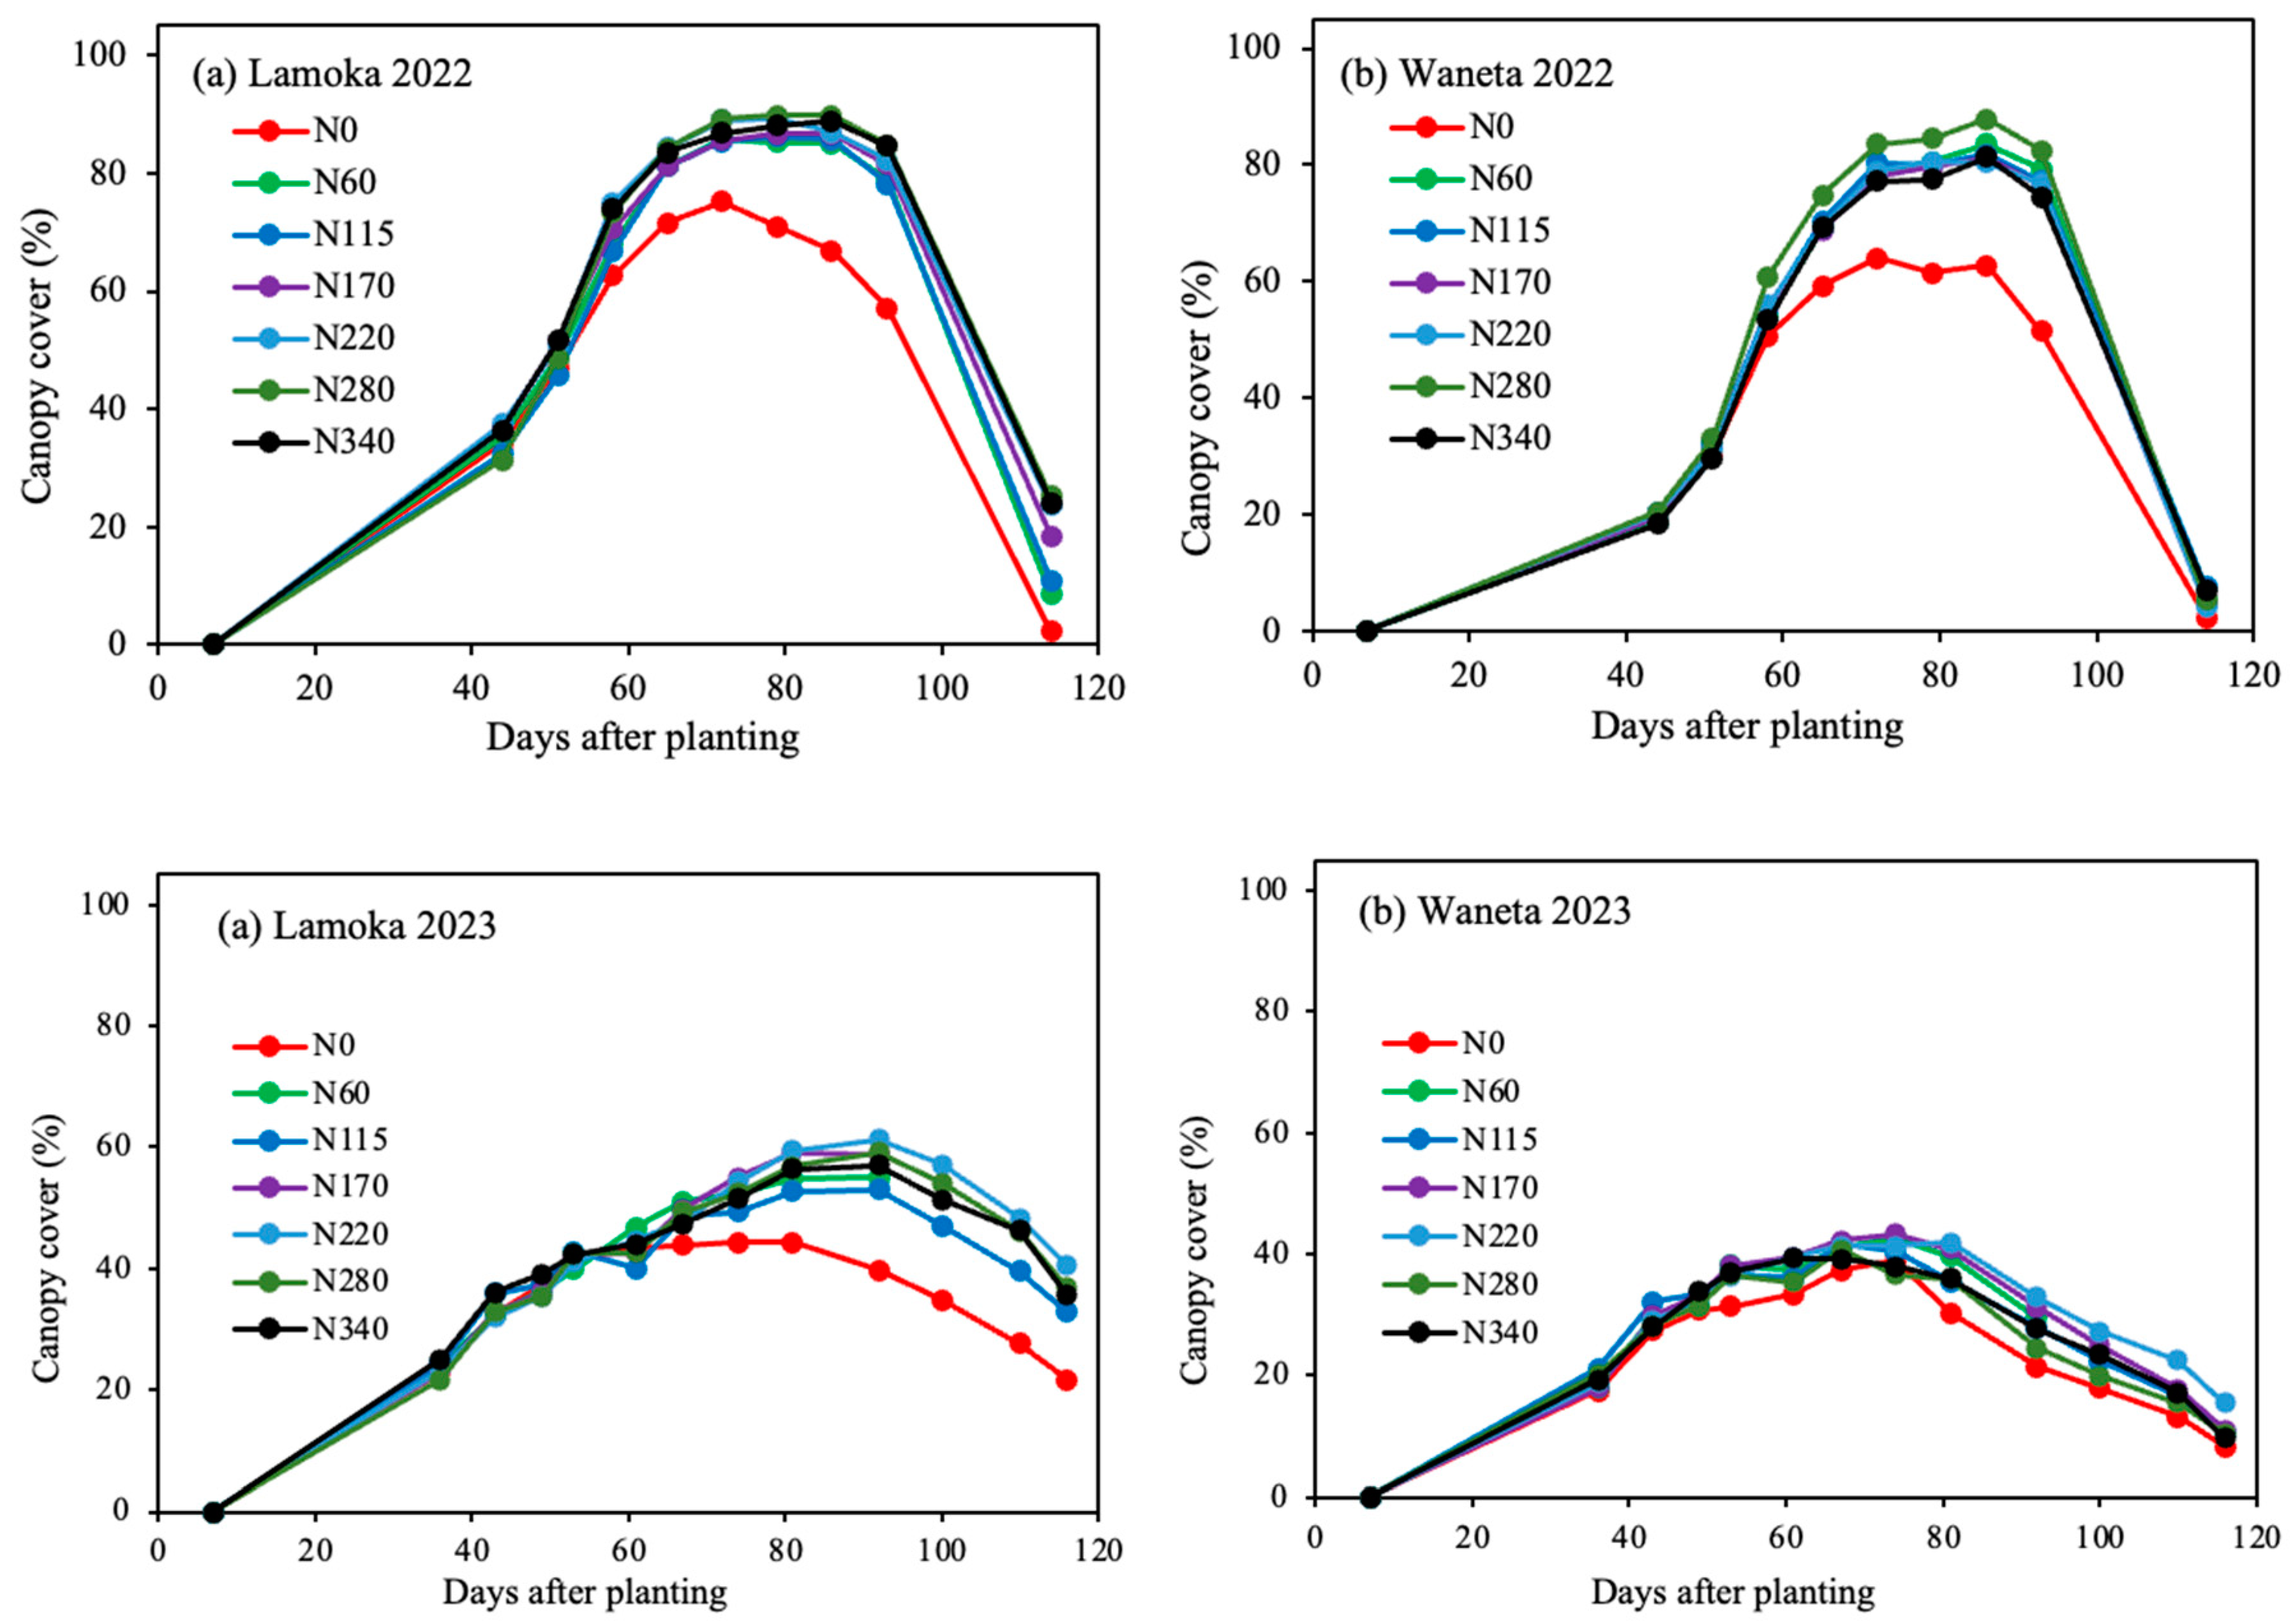
3.1.2. Canopy Cover
3.2. Plant Physiological Parameters
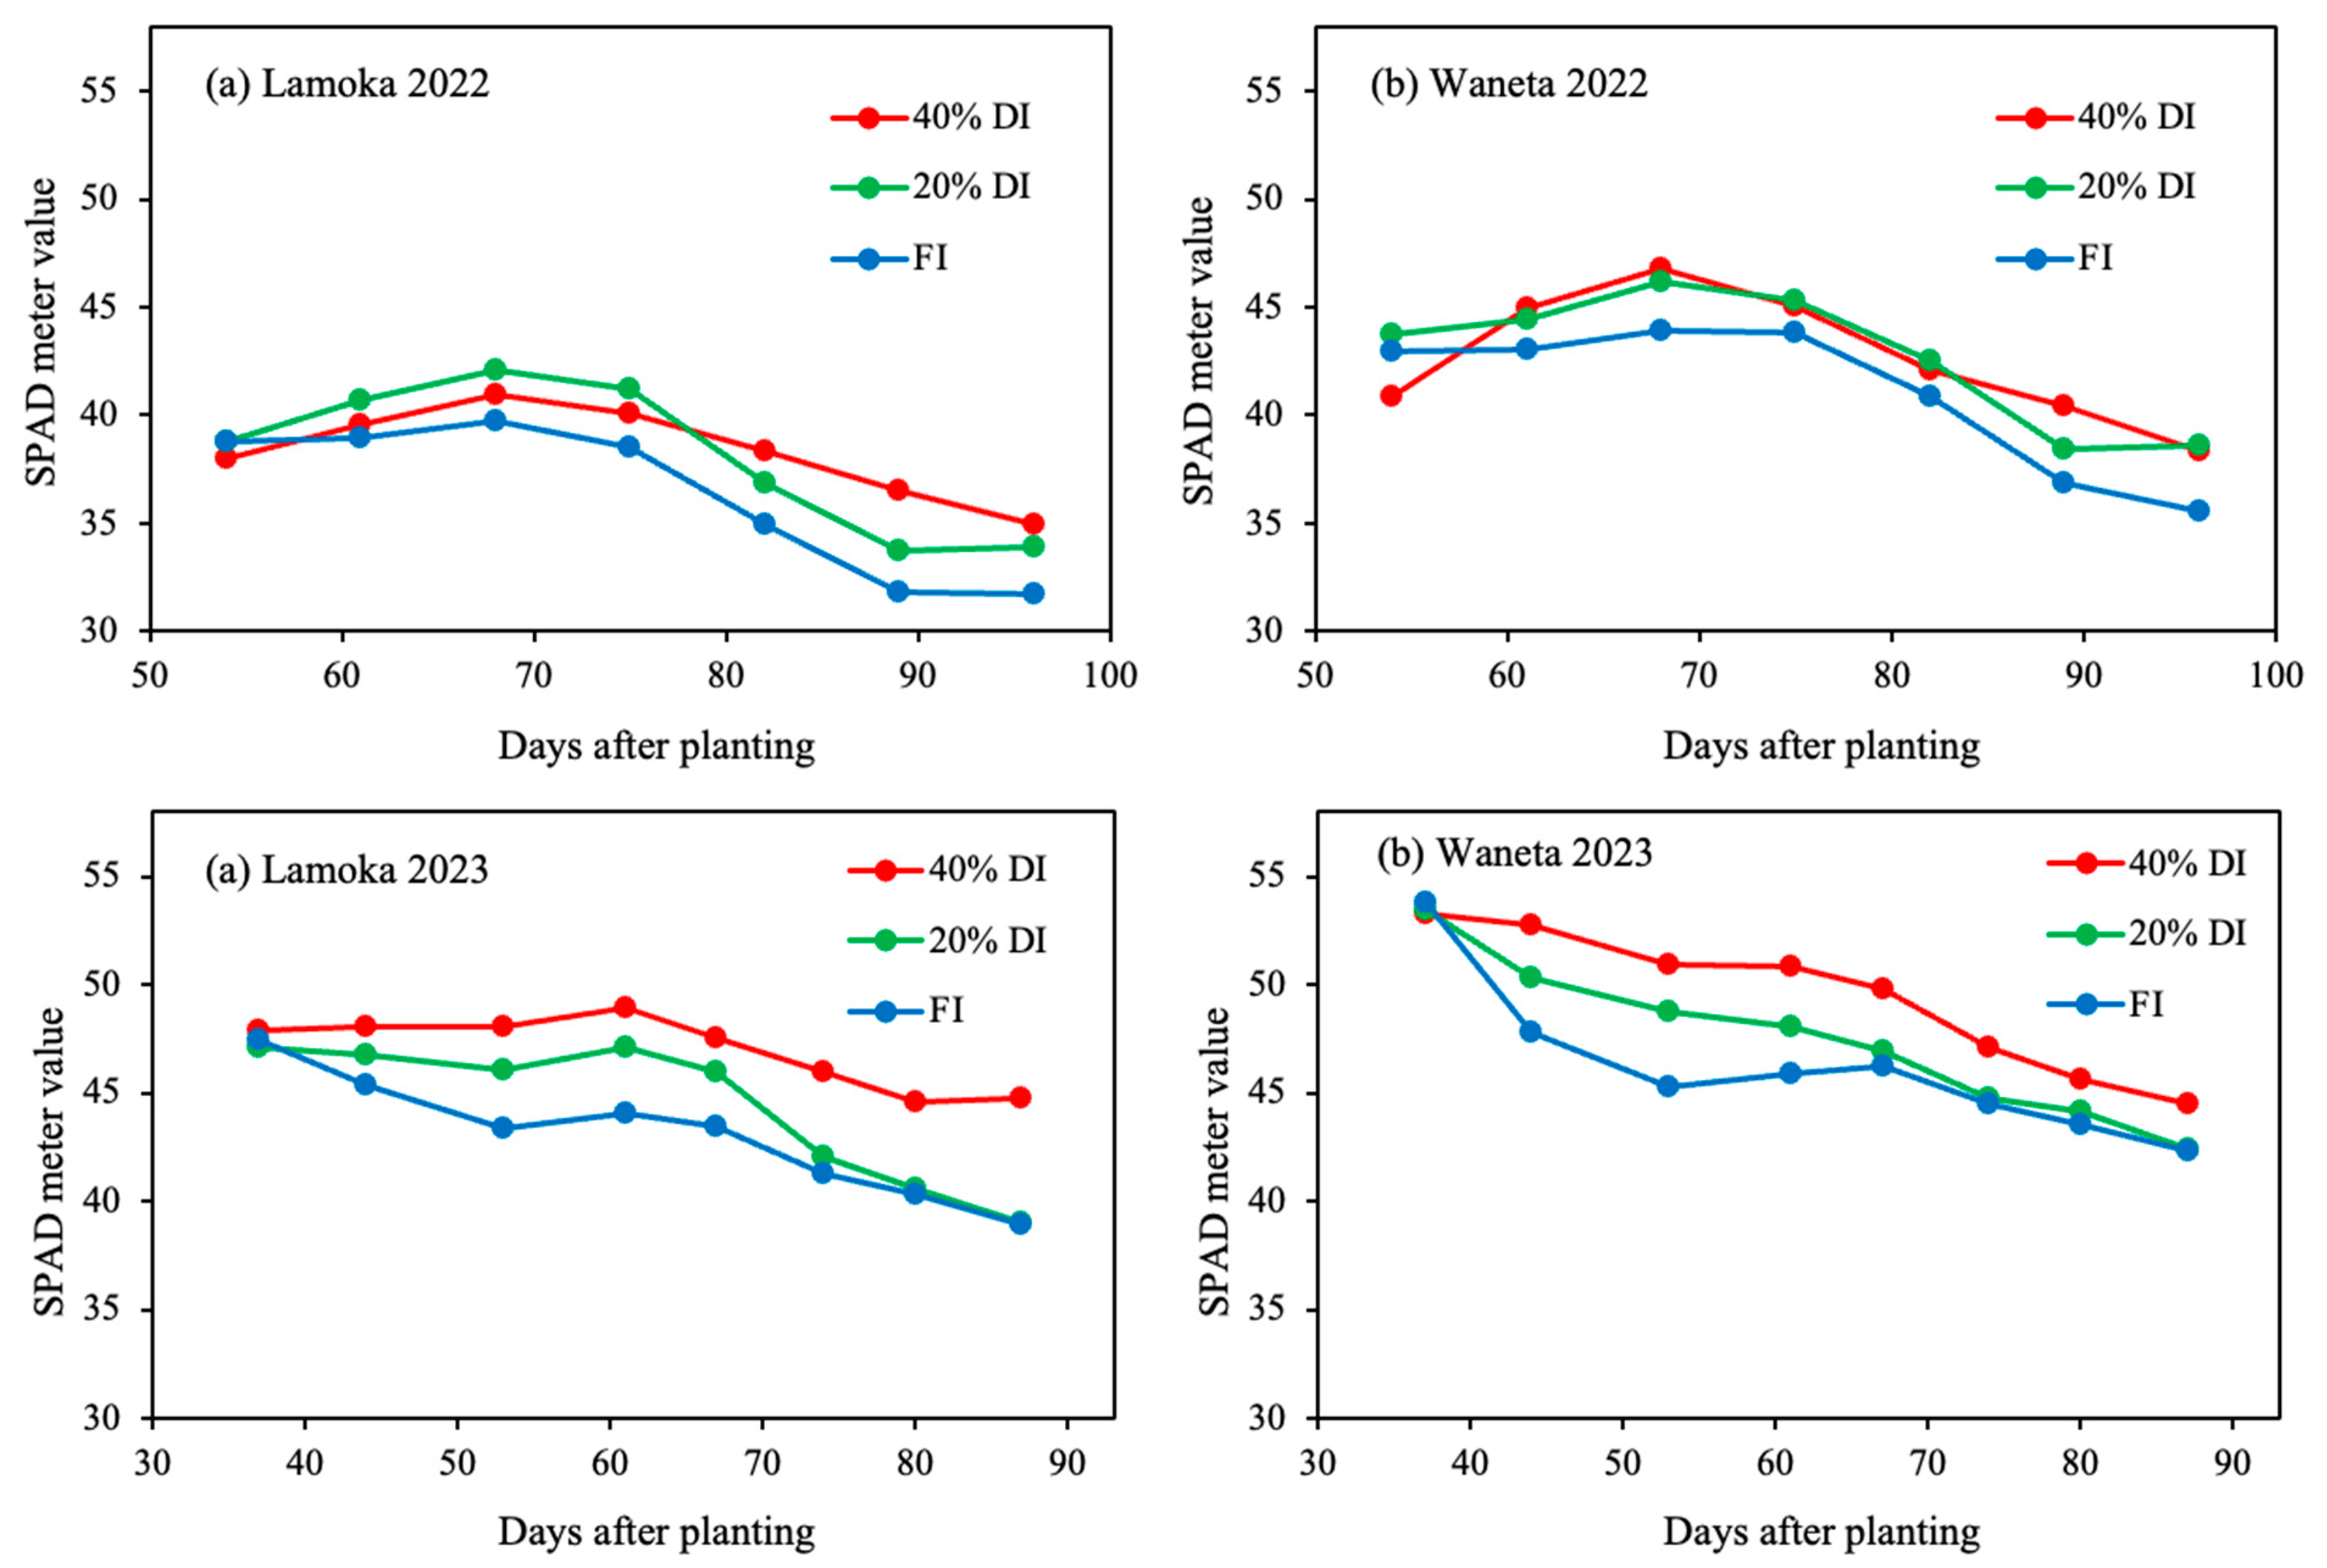
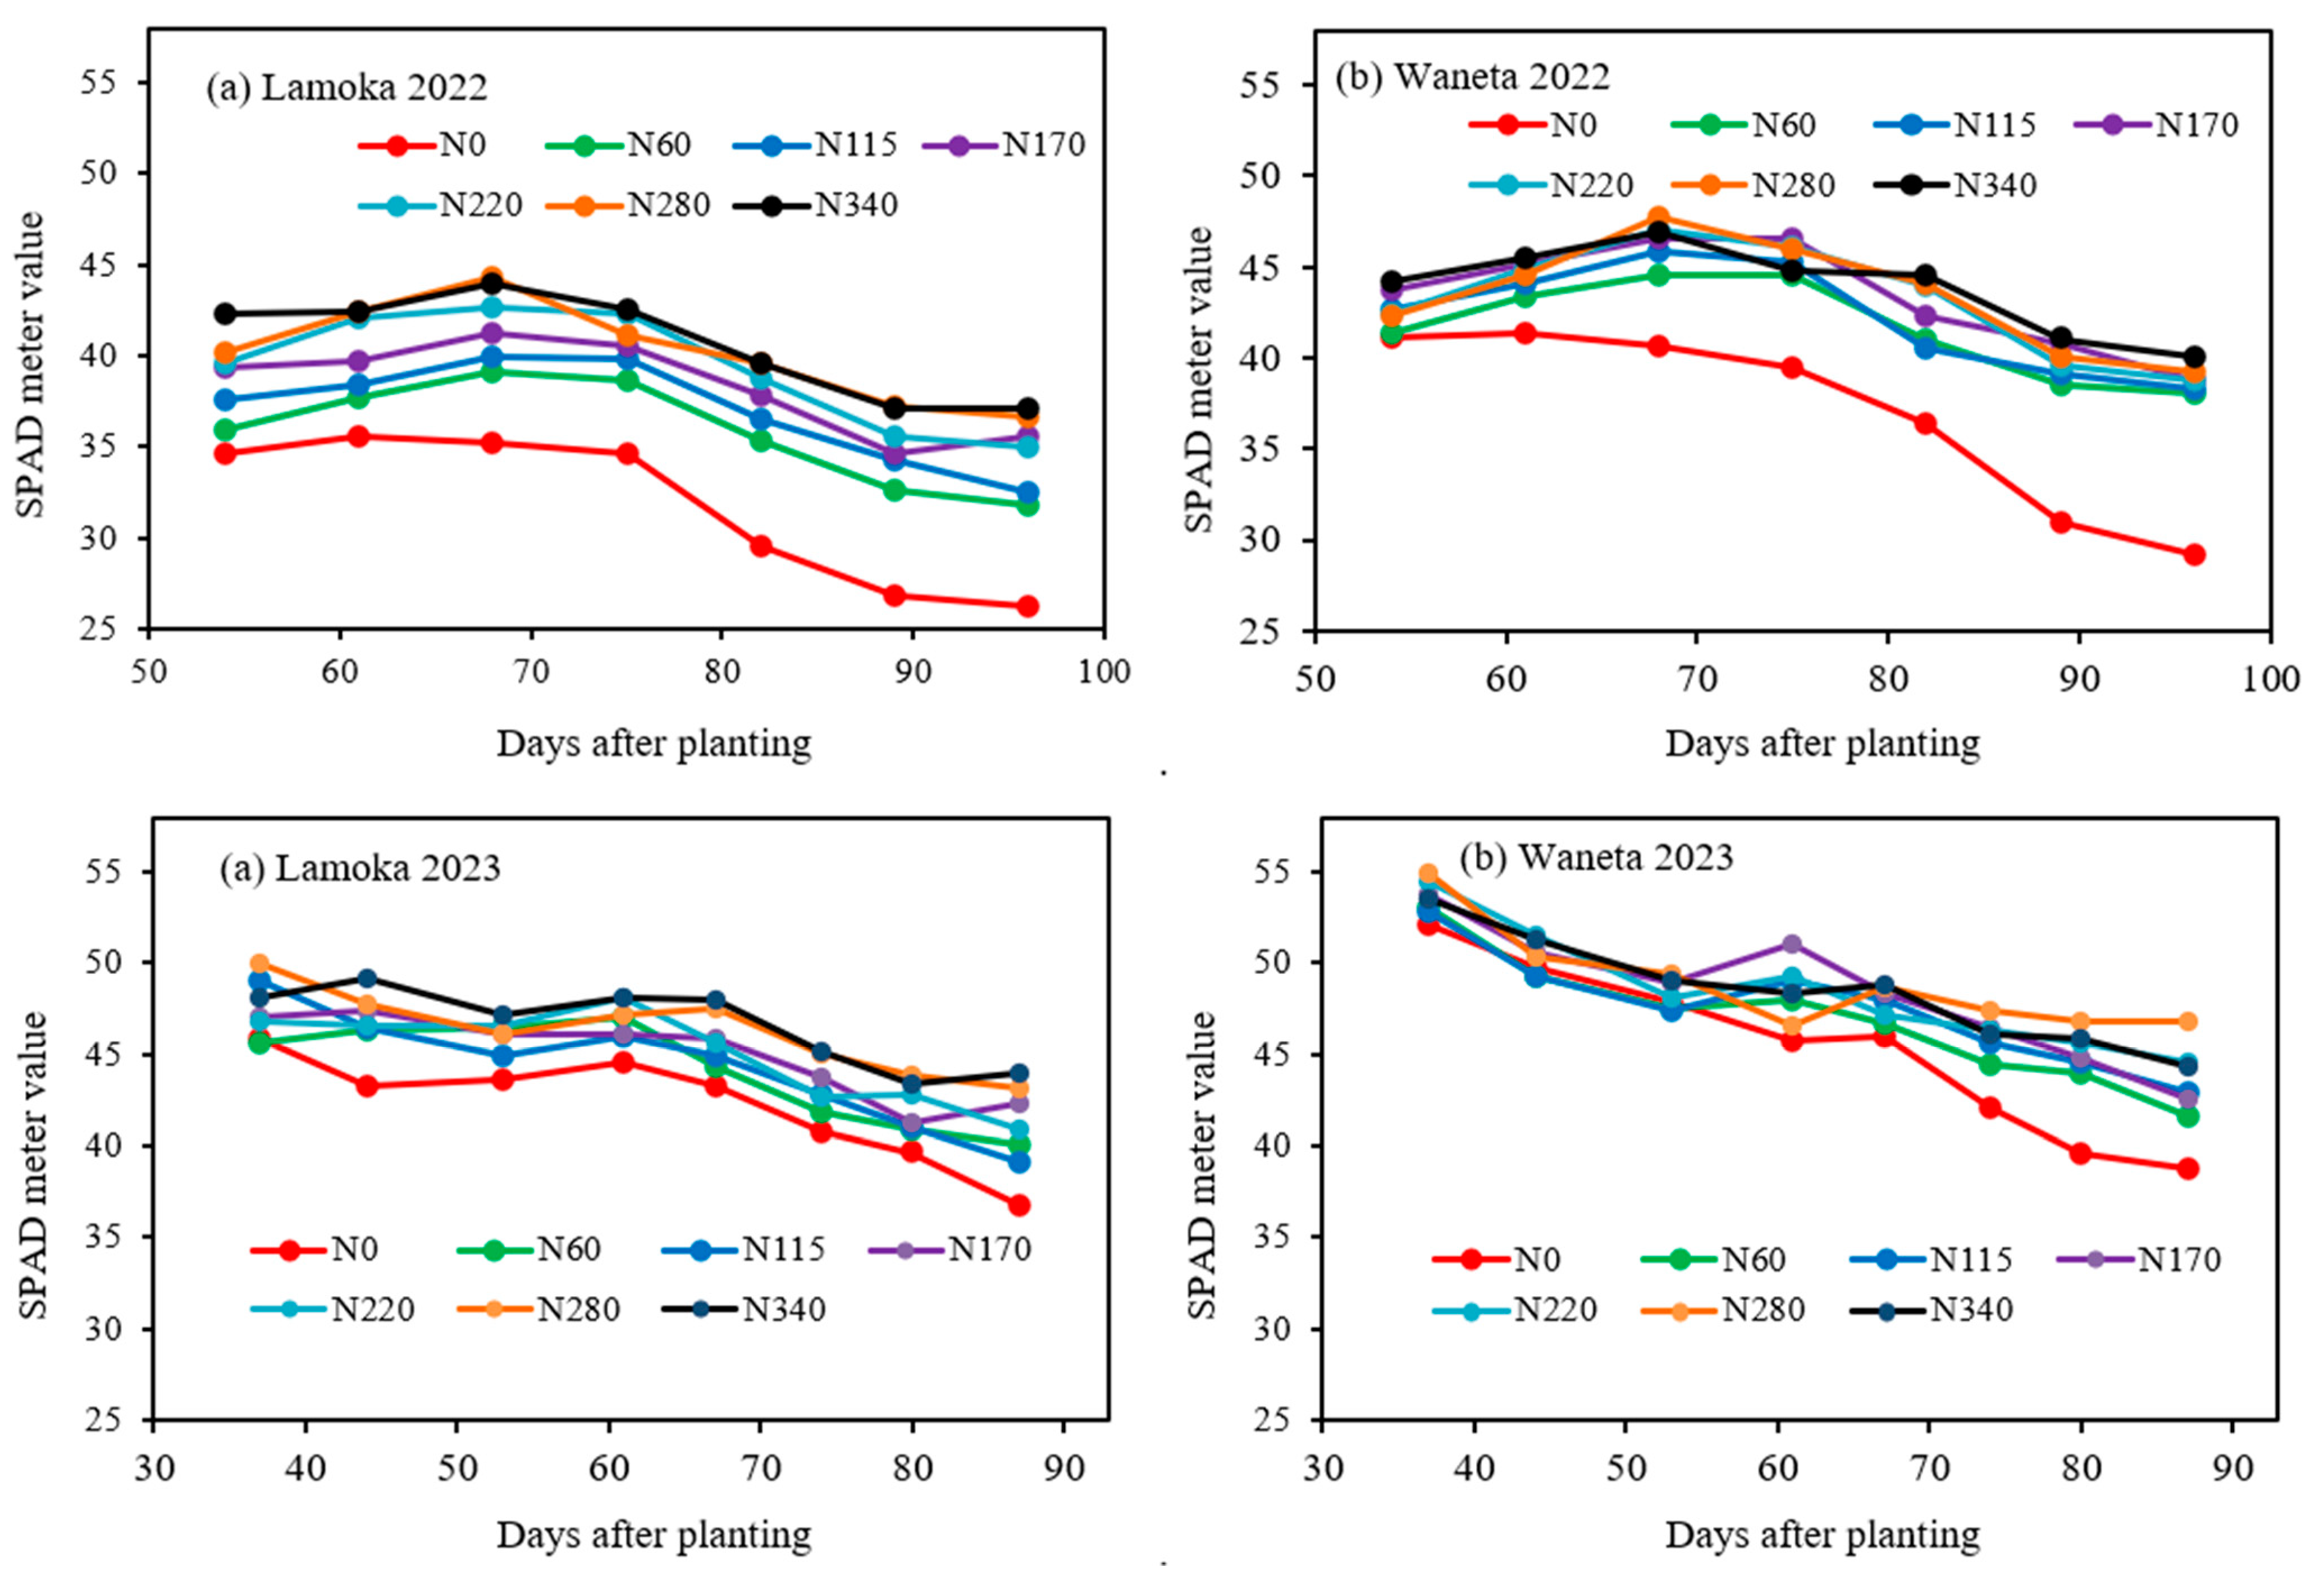
3.2.1. Chlorophyll Meter
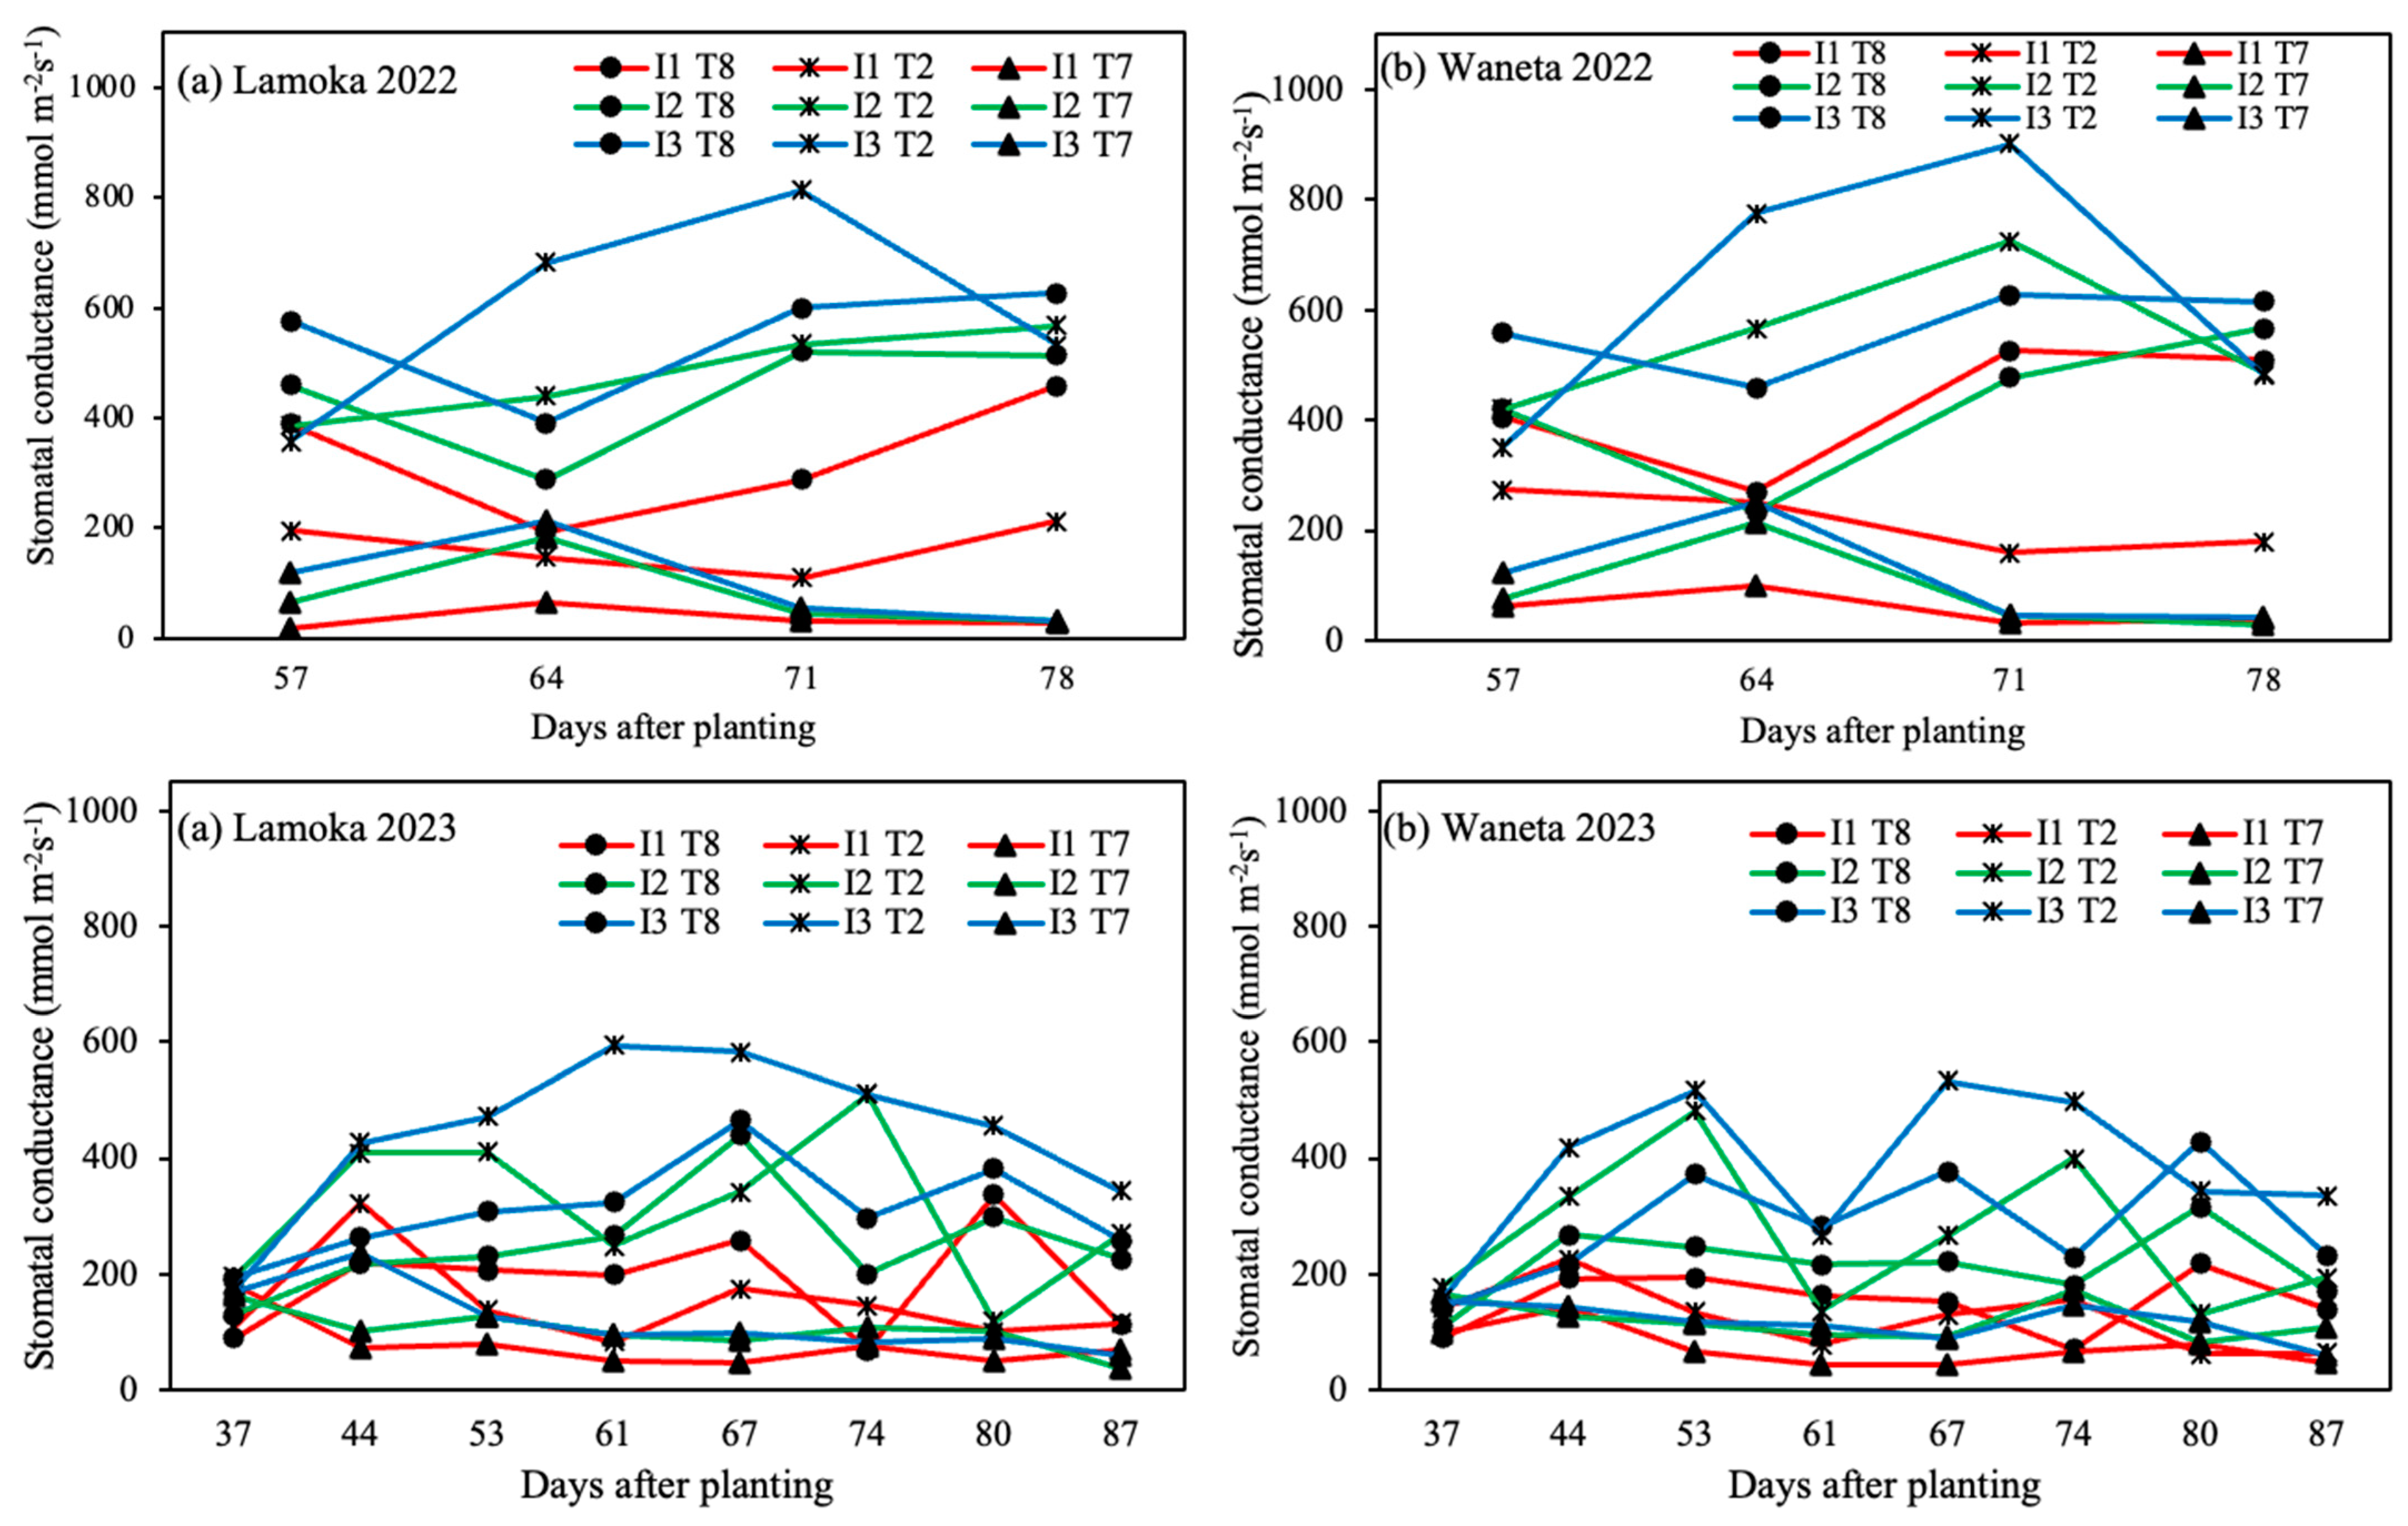
3.2.2. Stomatal Conductance
3.3. Tuber Yield and Yield Components
3.3.1. Tuber Number
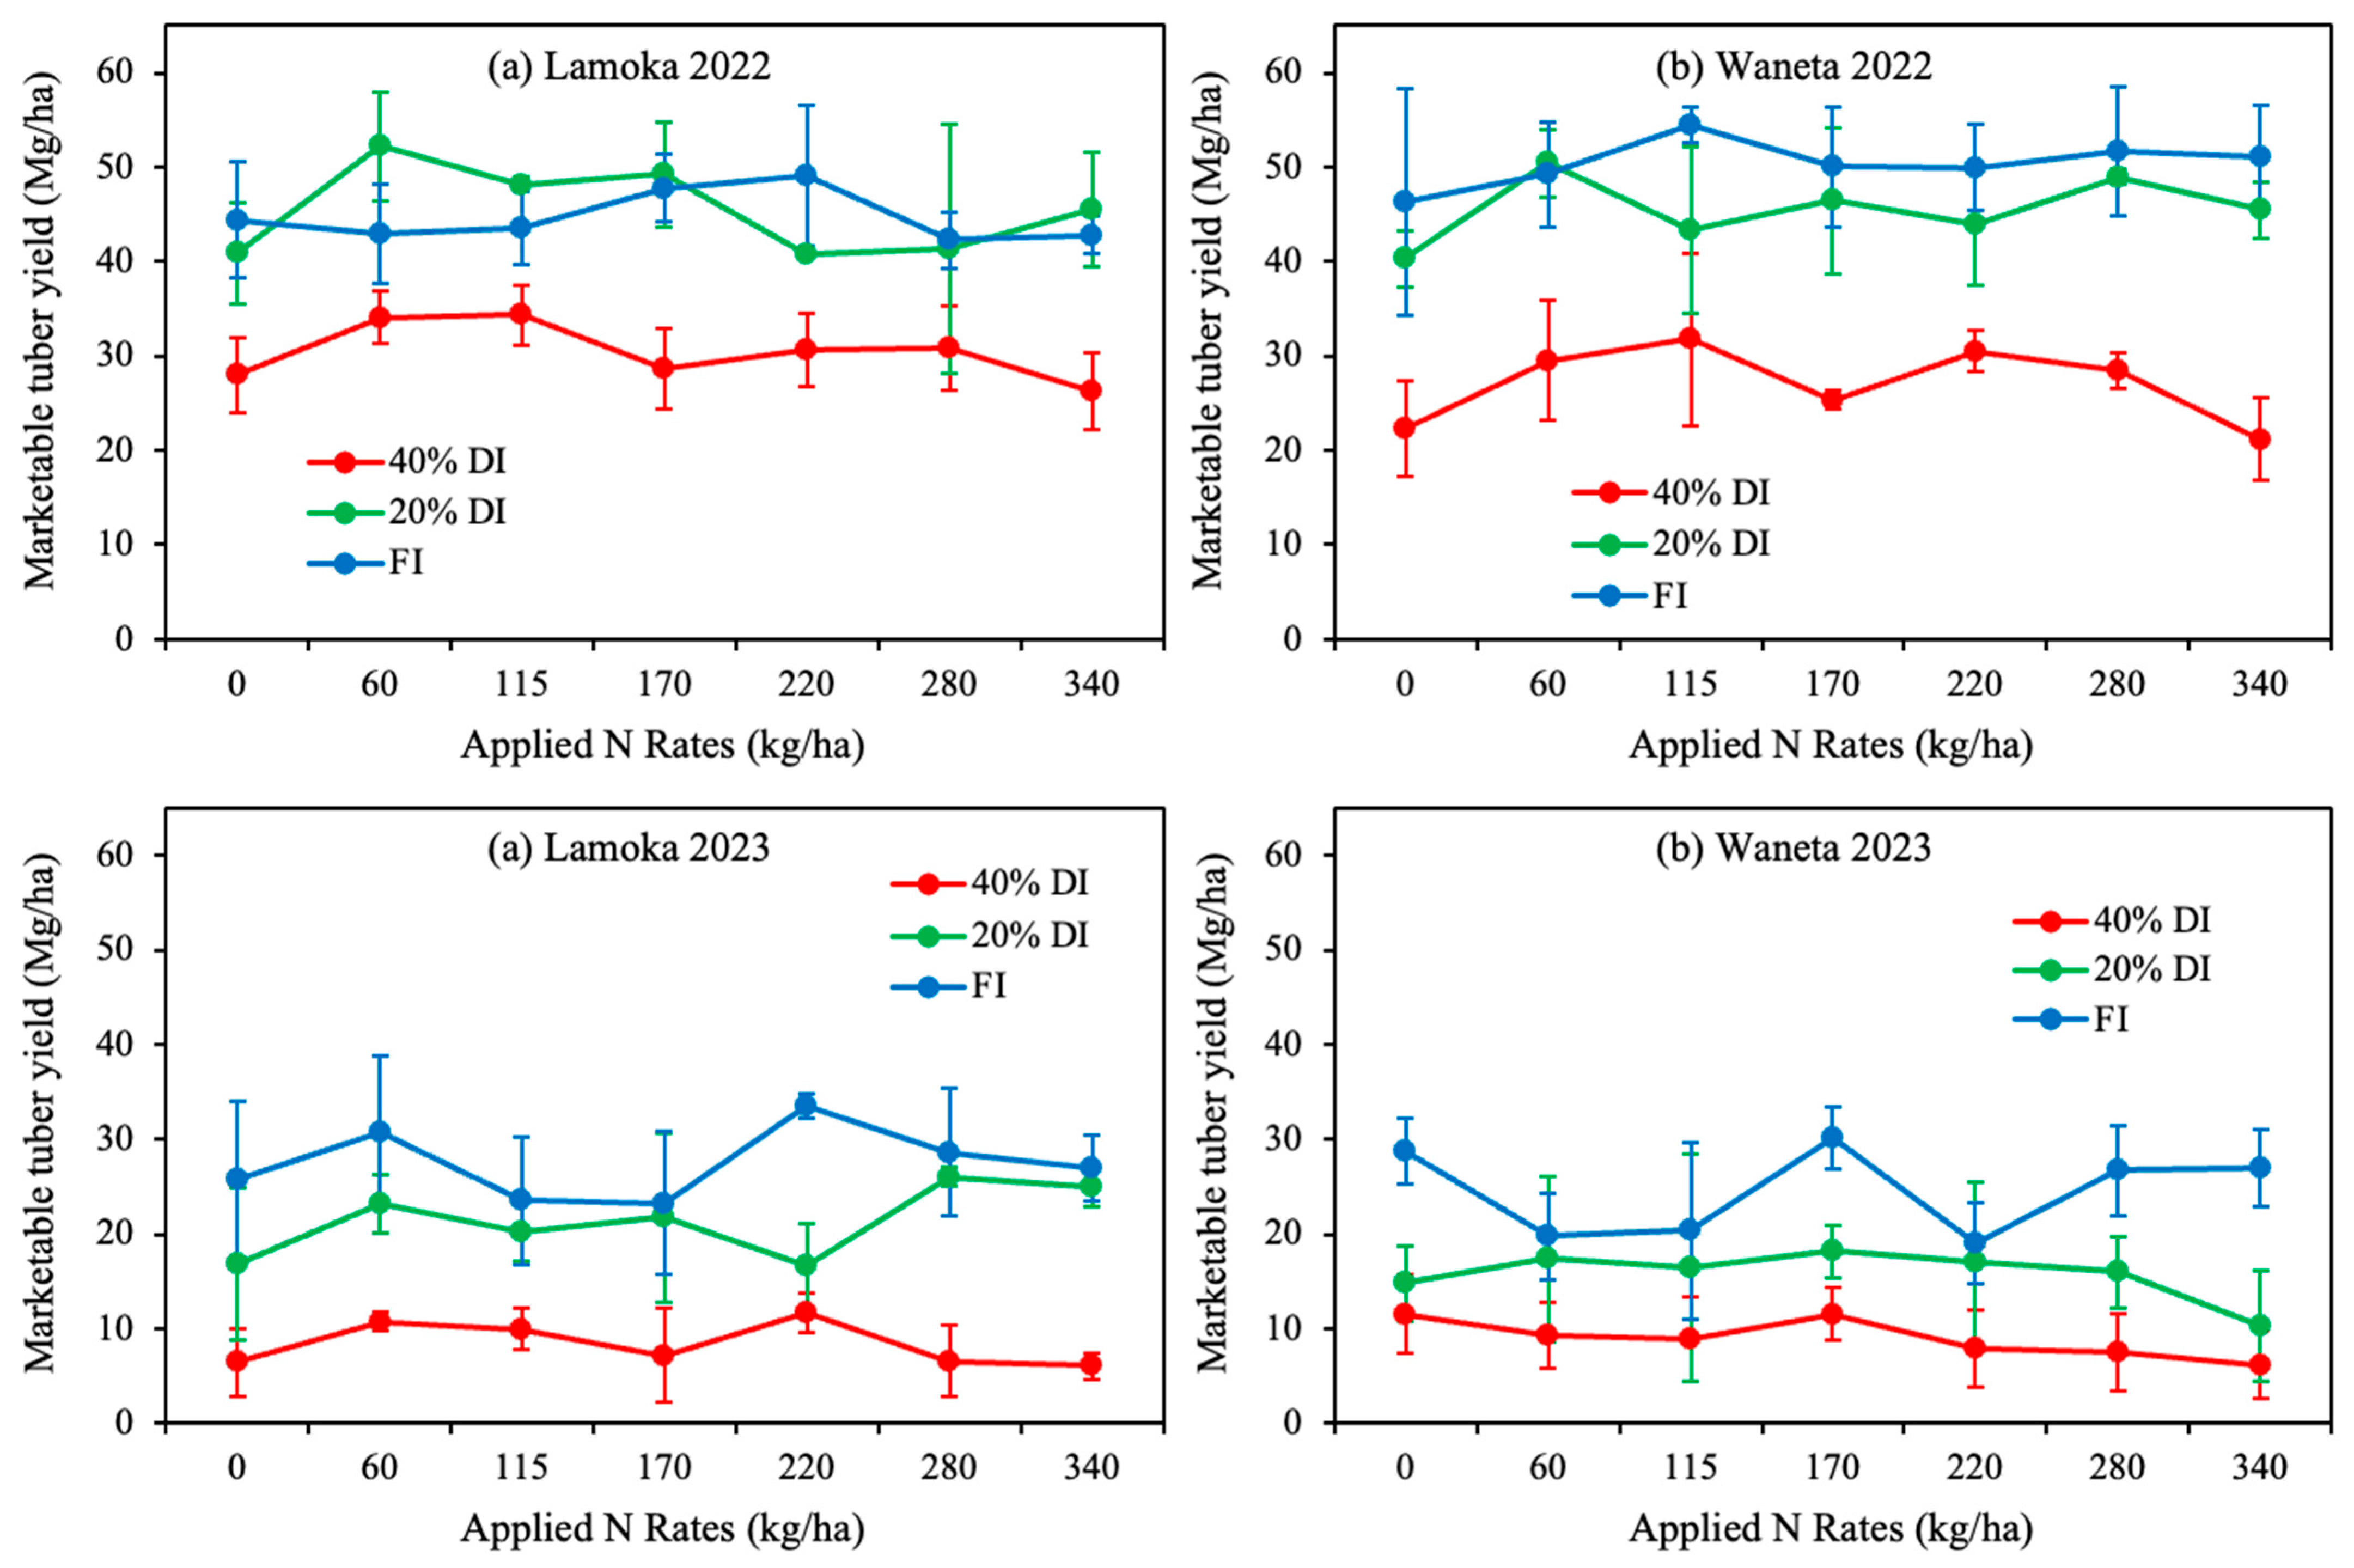
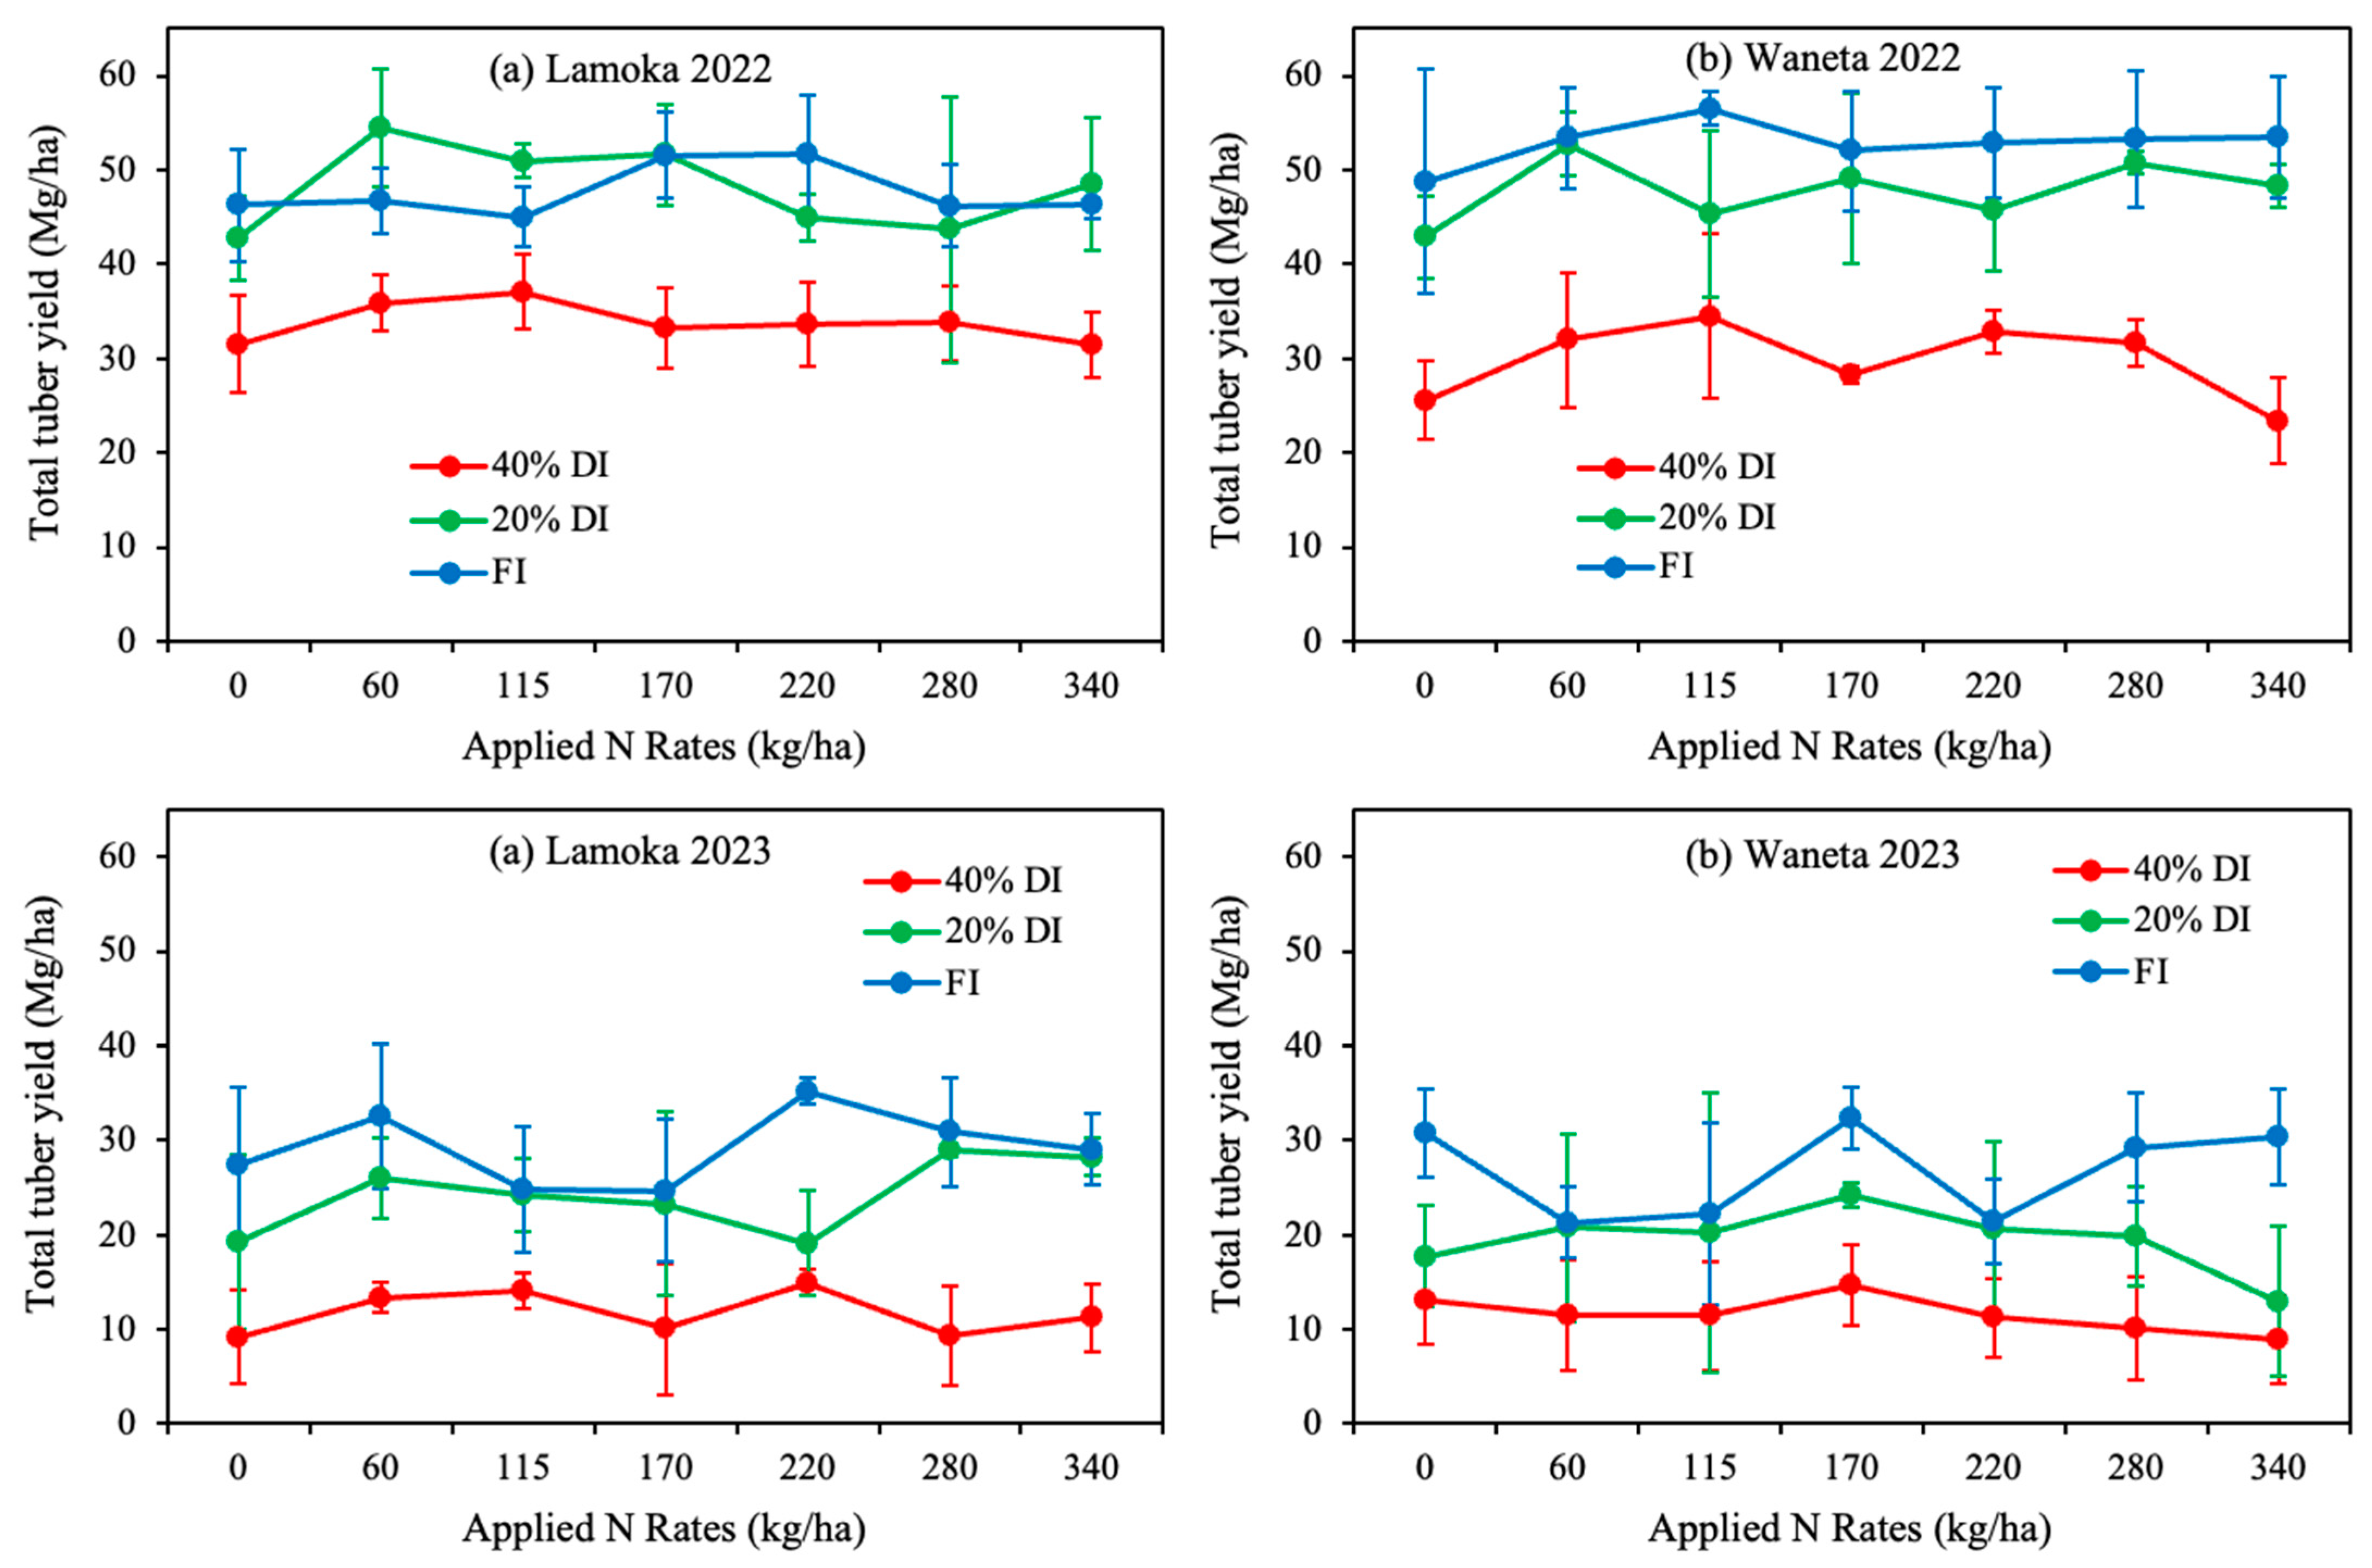
3.3.2. Tuber Yield
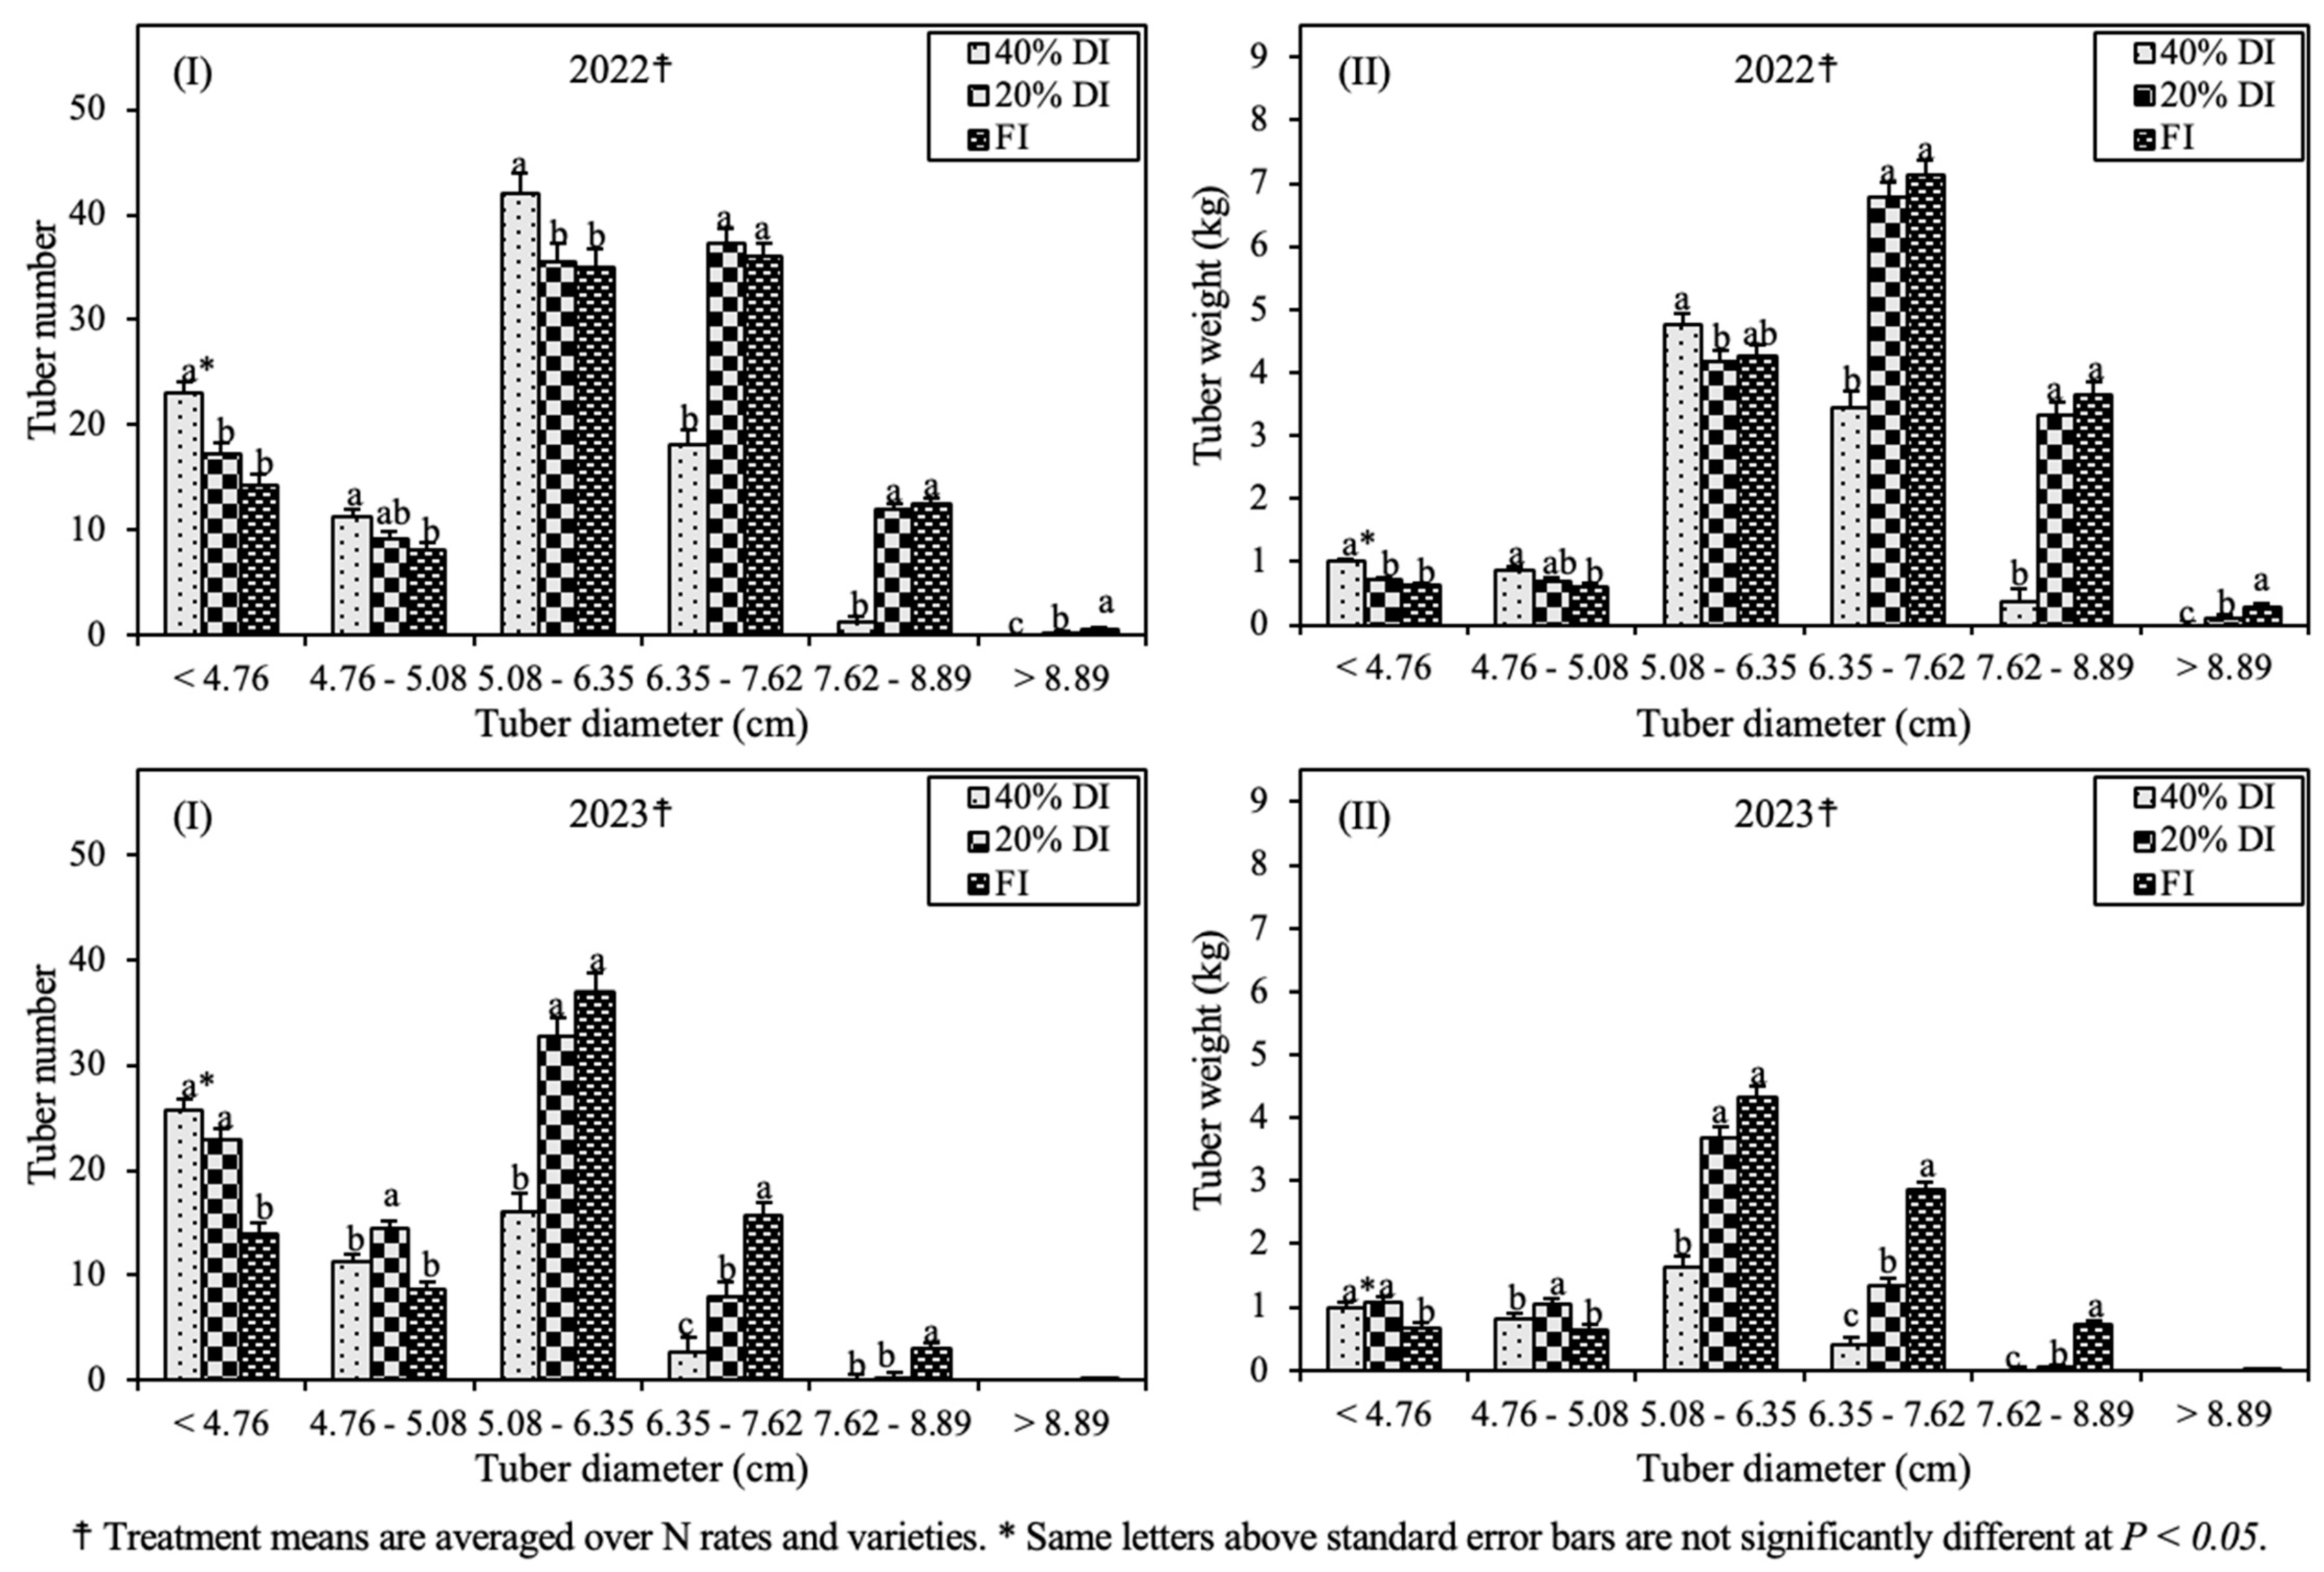
3.3.3. Tuber Size Distribution
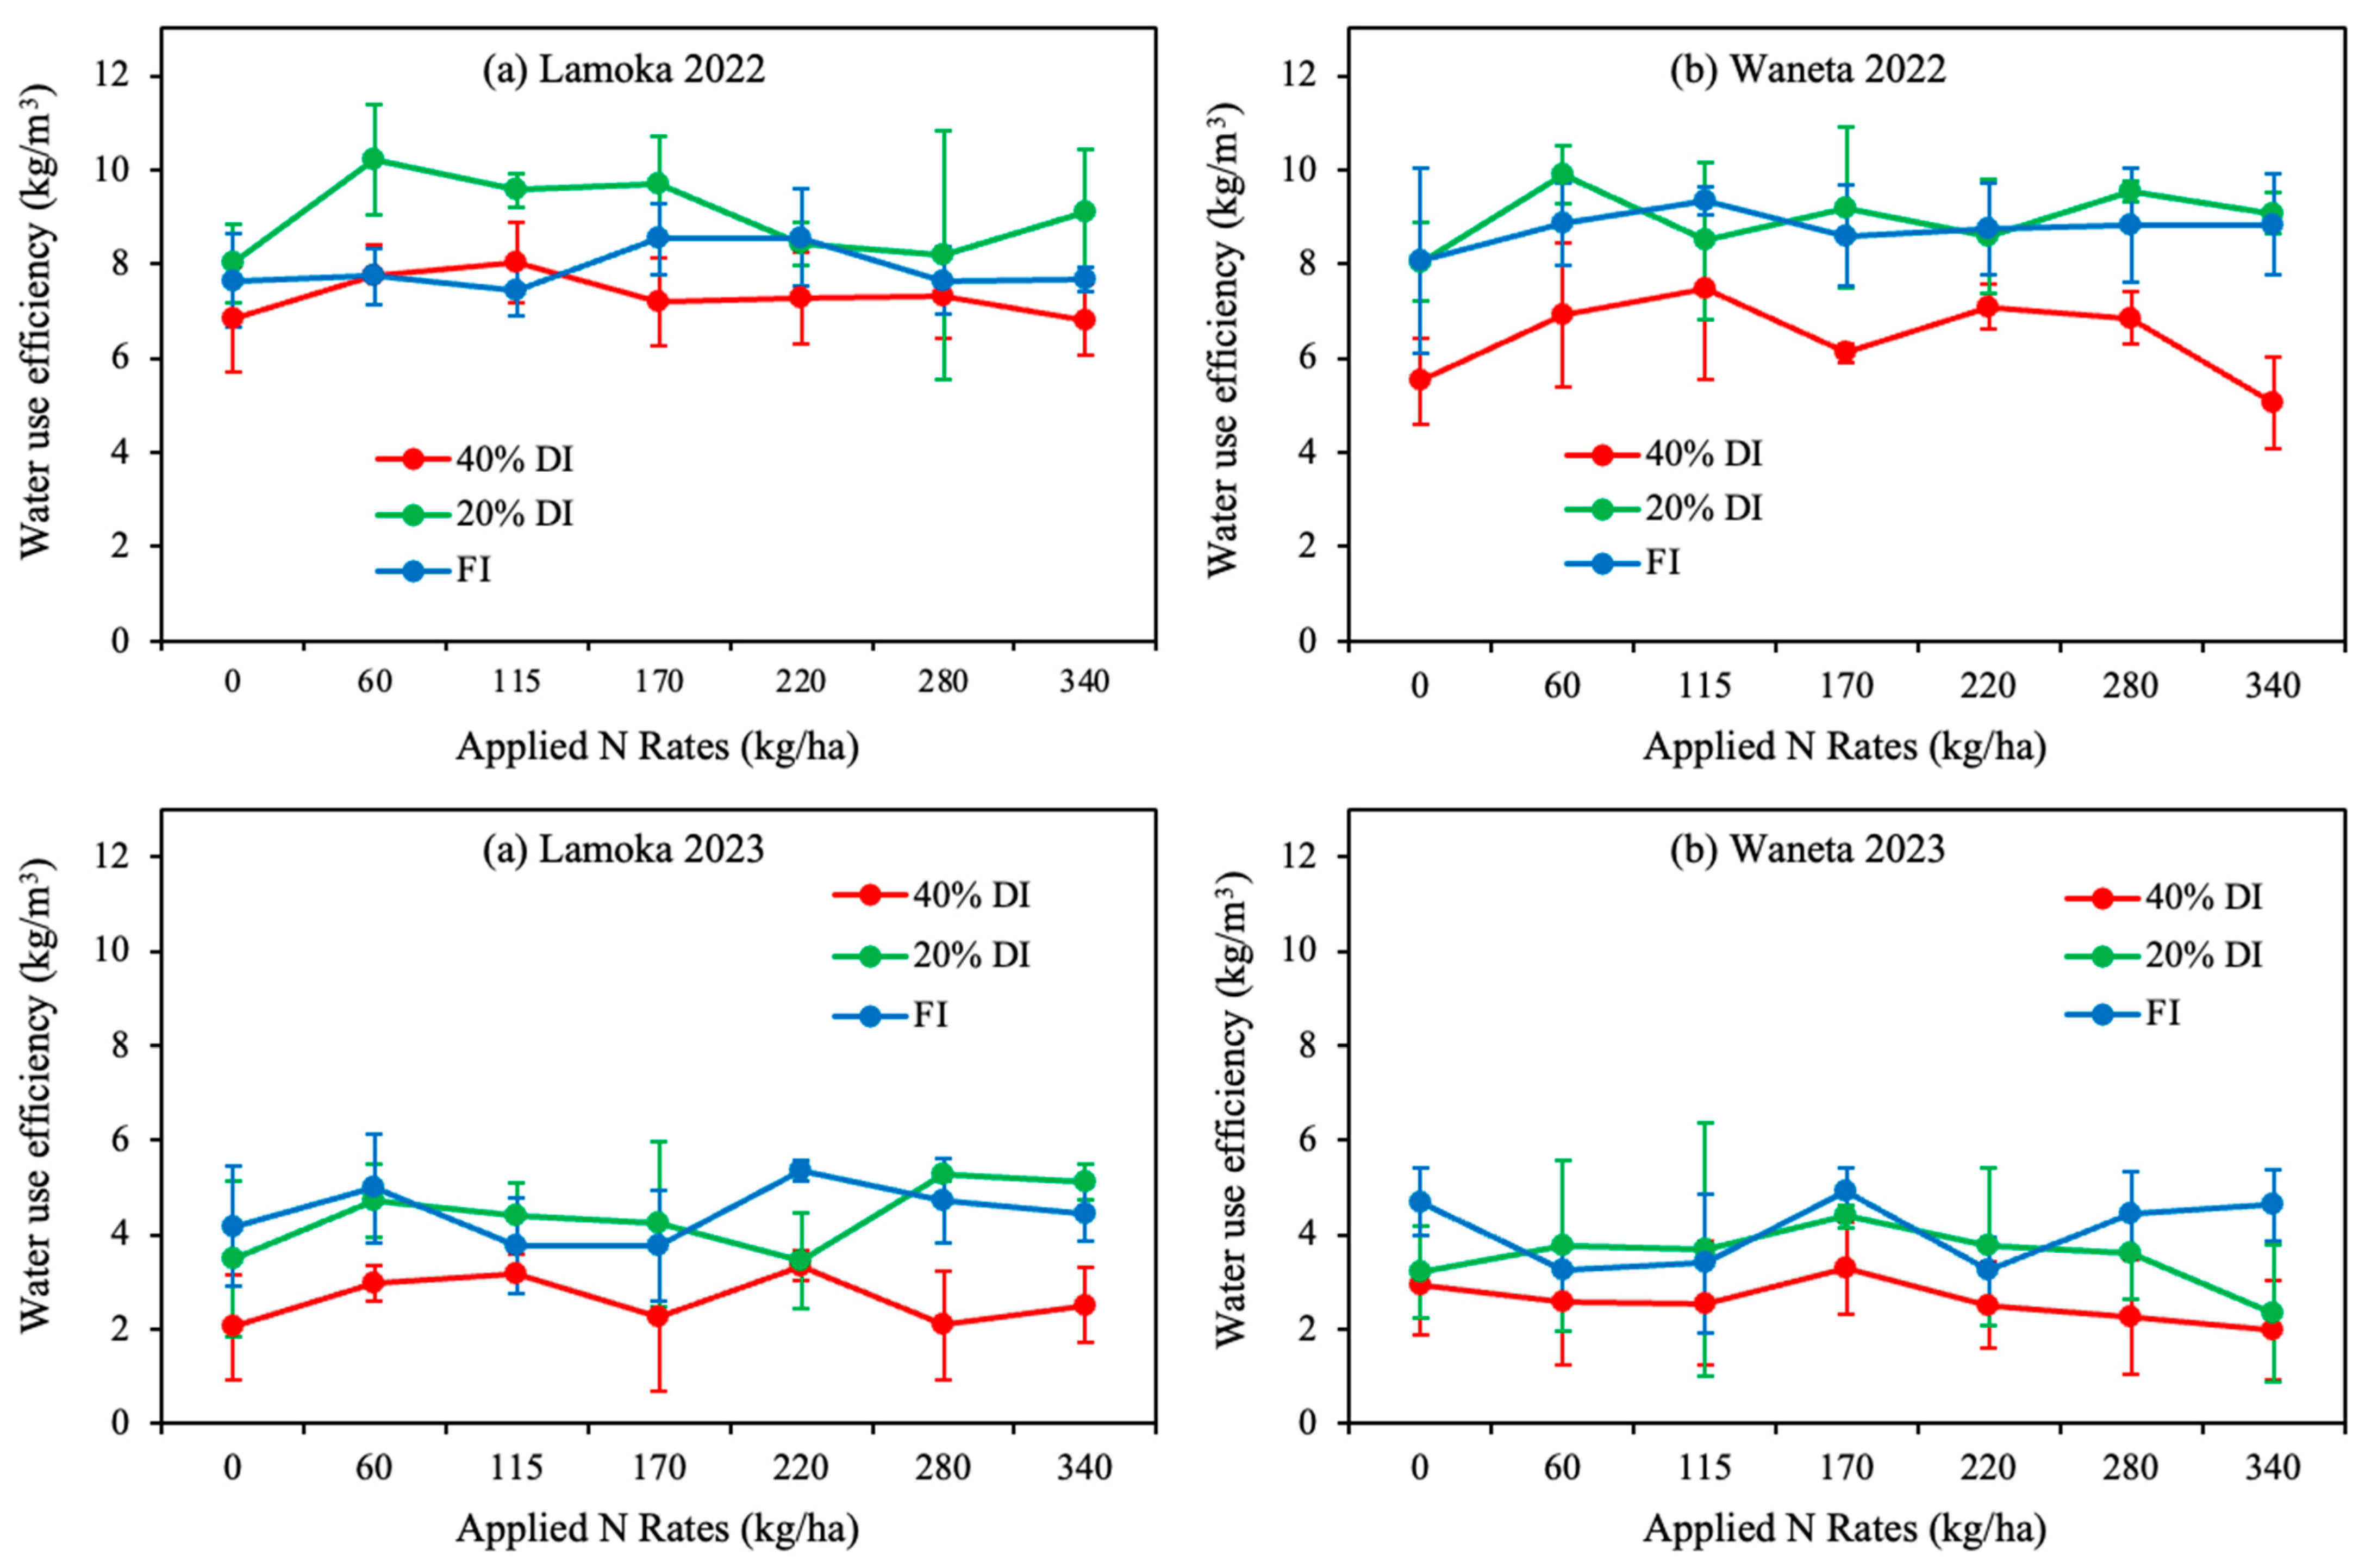
3.4. Water Use Efficiency (WUE)
3.5. Nitrogen Use Efficiency (NUE)
4. Discussion
4.1. Plant Growth Parameters
4.2. Plant Physiological Parameters
4.3. Tuber Yield and Yield Components
4.4. Water and Nitrogen Use Efficiencies
5. Conclusions
Author Contributions
Funding
Data Availability Statement
Acknowledgments
Conflicts of Interest
References
- FAOSTAT. Food and Agriculture Organization of the United Nations. 2021. Available online: https://www.fao.org/faostat/en/#data/QCL (accessed on 4 December 2023).
- United States Department of Agriculture (USDA). Potatoes 2022 Summary; United States Department of Agriculture (USDA): Washington, DC, USA, 2023.
- DeFauw, S.L.; He, Z.; Larkin, R.P.; Mansour, S.A. Sustainable Potato Production and Global Food Security. In Sustainable Potato Production: Global Case Studies; He, Z., Larkin, R., Honeycutt, W., Eds.; Springer: Dordrecht, The Netherlands, 2012. [Google Scholar] [CrossRef]
- Devaux, A.; Kromann, P.; Ortiz, O. Potatoes for sustainable global food security. Potato Res. 2014, 57, 185–199. [Google Scholar] [CrossRef]
- Devaux, A.; Goffart, J.-P.; Petsakos, A.; Kromann, P.; Gatto, M.; Okello, J.; Suarez, V. Global Food Security, Contributions from Sustainable Potato Agri-Food Systems. In The Potato Crop; Campos, H., Ortiz, O., Eds.; Springer: Cham, Switzerland, 2020. [Google Scholar] [CrossRef]
- Djaman, K.; Irmak, S.; Koudahe, K.; Allen, S. Irrigation management in potato (Solanum tuberosum L.) production: A Review. Sustainability 2021, 13, 1504. [Google Scholar] [CrossRef]
- Djaman, K.; Koudahe, K.; Saibou, A.; Darapuneni, M.; Higgins, C.; Irmak, S. Soil water dynamics, effective rooting zone, and evapotranspiration of sprinkler irrigated potato in a sandy loam soil. Agronomy 2022, 12, 864. [Google Scholar] [CrossRef]
- Sood, M.C.; Singh, N. Water management. In The Potato: Production and Utilization in Sub-Tropics; Khurana, S.M.P., Minhas, J.S., Pandey, S.K., Eds.; Mehta Publishers: New Dehli, India, 2003; pp. 111–112. [Google Scholar]
- United States Department of Agriculture. USDA Census of Irrigation [2018 Irrigation and Water Management Survey]. 2020. Available online: https://nawi.openei.org/submissions/8 (accessed on 29 February 2024).
- Terrell, B.L.; Johnson, P.N.; Segarra, E. Ogallala aquifer depletion: Economic impact on the Texas high plains. Water Policy 2002, 4, 33–46. [Google Scholar] [CrossRef]
- McGuire, V.L. Water-level changes and change in water in storage in the High Plains aquifer, predevelopment to 2013 and 2011–13. In Scientific Investigations Report (2014–5218); U.S. Geological Survey: Reston, VA, USA, 2014. [Google Scholar] [CrossRef]
- Hopkins, B.G.; Stark, J.C.; Kelling, K.A. Nutrient management. In Potato Production Systems; Stark, J.C., Thornton, M., Nolte, P., Eds.; Springer International Publishing: New York City, NY, USA, 2020; pp. 155–202. [Google Scholar] [CrossRef]
- Fontes, P.C.R.; Braun, H.; Busato, C.; Cecon, P.R. Economic optimum nitrogen fertilization rates and nitrogen fertilization rate effects on tuber characteristics of potato cultivars. Potato Res. 2010, 53, 167–179. [Google Scholar] [CrossRef]
- Zotarelli, L.; Rens, L.R.; Cantliffe, D.J.; Stoffella, P.J.; Gergela, D.; Fourman, D. Nitrogen fertilizer rate and application timing for chipping potato cultivar Atlantic. Agron. J. 2014, 106, 2215–2226. [Google Scholar] [CrossRef]
- Hodges, T. Water nitrogen applications for potato: Commercial experimental rates compared to a simulation model. J. Sustain. Agric. 1999, 13, 79–90. [Google Scholar] [CrossRef]
- Clément, C.-C.; Cambouris, A.N.; Ziadi, N.; Zebarth, B.J.; Karam, A. Potato yield response and seasonal nitrate leaching as influenced by nitrogen management. Agronomy 2021, 11, 2055. [Google Scholar] [CrossRef]
- Vashisht, B.B.; Nigon, T.; Mulla, D.J.; Rosen, C.; Xu, H.; Twine, T.; Jalota, S.K. Adaptation of water and nitrogen management to future climates for sustaining potato yield in Minnesota: Field and simulation study. Agric. Water Manag. 2015, 152, 198–206. [Google Scholar] [CrossRef]
- Kassaye, K.T.; Yilma, W.A.; Fisha, M.H.; Haile, D.H. Yield and water use efficiency of potato under alternate furrows and deficit irrigation. Int. J. Agron. 2020, 2020, e8869098. [Google Scholar] [CrossRef]
- Crosby, T.W.; Wang, Y. Effects of irrigation management on chipping potato (Solanum tuberosum L.) production in the Upper Midwest of the U.S. Agronomy 2021, 11, 768. [Google Scholar] [CrossRef]
- Fereres, E.; Soriano, M.A. Deficit irrigation for reducing agricultural water use. J. Exp. Bot. 2007, 58, 147–159. [Google Scholar] [CrossRef]
- Shrestha, B.; Darapuneni, M.; Stringam, B.L.; Lombard, K.; Djaman, K. Irrigation Water and Nitrogen Fertilizer Management in Potato (Solanum tuberosum L.): A Review. Agronomy 2023, 13, 2566. [Google Scholar] [CrossRef]
- United States Department of Agriculture, Natural Resources Conservation Service (USDA-NRCS). (2022). Web Soil Survey. Available online: https://websoilsurvey.nrcs.usda.gov/app/WebSoilSurvey.aspx (accessed on 16 May 2022).
- Christiansen, J.E. Irrigation by Sprinkling; University of California Agricultural Experiment Station Bulletin 670; University of California: Berkeley, CA, USA, 1942. [Google Scholar]
- Hatfield, J.L.; Dold, C. Water-use efficiency: Advances and challenges in a changing climate. Front. Plant Sci. 2019, 10, 103. [Google Scholar] [CrossRef]
- Djaman, K.; O’Neill, M.; Owen, C.K.; Smeal, D.; Koudahe, K.; West, M.; Allen, S.; Lombard, K.; Irmak, S. Crop evapotranspiration, irrigation water requirement and water productivity of maize from meteorological data under semiarid climate. Water 2018, 10, 405. [Google Scholar] [CrossRef]
- Moll, R.H.; Kamprath, E.J.; Jackson, W.A. Analysis and interpretation of factors which contribute to efficiency of nitrogen utilization. Agron. J. 1982, 74, 562–564. [Google Scholar] [CrossRef]
- Bates, D.; Maechler, M.; Bolker, B.; Walker, S. Fitting linear mixed-effects models using Lme4. J. Stat. Softw. 2015, 67, 1–48. [Google Scholar] [CrossRef]
- Lenth, R.V. Emmeans: Estimated Marginal Means, Aka Least-Squares Means. R Package Version 1.8.8. 2023. Available online: https://cran.r-project.org/web/packages/emmeans/index.html (accessed on 26 September 2023).
- Yuan, B.-Z.; Nishiyama, S.; Kang, Y. Effects of different irrigation regimes on the growth and yield of drip-irrigated potato. Agric. Water Manag. 2003, 63, 153–167. [Google Scholar] [CrossRef]
- Aytekin, R.İ.; Çalışkan, S. Irrigation and potassium fertilization effects on plant growth, tuber yield, quality, and water use efficiency of potato. Irrig. Sci. 2023, 42, 367–385. [Google Scholar] [CrossRef]
- Elhani, S.; Haddadi, M.; Csákvári, E.; Zantar, S.; Hamim, A.; Villányi, V.; Douaik, A.; Bánfalvi, Z. Effects of partial root-zone drying and deficit irrigation on yield, irrigation water-use efficiency and some potato (Solanum tuberosum L.) quality traits under glasshouse conditions. Agric. Water Manag. 2019, 224, 105745. [Google Scholar] [CrossRef]
- Satognon, F.; Owido, S.F.O.; Lelei, J.J. Effects of supplemental irrigation on yield, water use efficiency and nitrogen use efficiency of potato grown in mollic Andosols. Environ. Syst. Res. 2021, 10, 38. [Google Scholar] [CrossRef]
- Akkamis, M.; Caliskan, S. Responses of yield, quality and water use efficiency of potato grown under different drip irrigation and nitrogen levels. Sci. Rep. 2023, 13, 9911. [Google Scholar] [CrossRef]
- Ramírez, D.A.; Yactayo, W.; Gutiérrez, R.; Mares, V.; De Mendiburu, F.; Posadas, A.; Quiroz, R. Chlorophyll concentration in leaves is an indicator of potato tuber yield in water-shortage conditions. Sci. Hortic. 2014, 168, 202–209. [Google Scholar] [CrossRef]
- Li, S.; Kupriyanovich, Y.; Wagg, C.; Zheng, F.; Hann, S. Water deficit duration affects potato plant growth, yield and tuber quality. Agriculture 2023, 13, 2007. [Google Scholar] [CrossRef]
- Romero, A.P.; Alarcón, A.; Valbuena, R.I.; Galeano, C.H. Physiological assessment of water stress in potato using spectral information. Front. Plant Sci. 2017, 8. [Google Scholar] [CrossRef]
- Ziadi, N.; Grant, C.; Samson, N.; Nyiraneza, J.; Bélanger, G.; Parent, L.-É. Efficiency of controlled-release urea for a potato production system in Quebec, Canada. Agron. J. 2011, 103, 60–66. [Google Scholar] [CrossRef]
- Güler, S. Effects of nitrogen on yield and chlorophyll of potato (Solanum tuberosum L.) cultivars. Bangladesh J. Bot. 2009, 38, 2. [Google Scholar] [CrossRef]
- Zaeen, A.A.; KSharma, L.; Jasim, A.; Bali, S.; Buzza, A.; Alyokhin, A. Yield and quality of three potato cultivars under series of nitrogen rates. Agrosyst. Geosci. Environ. 2020, 3, e20062. [Google Scholar] [CrossRef]
- Boguszewska-Mańkowska, D.; Pieczyński, M.; Wyrzykowska, A.; Kalaji, H.M.; Sieczko, L.; Szweykowska-Kulińska, Z.; Zagdańska, B. Divergent strategies displayed by potato (Solanum tuberosum L.) cultivars to cope with soil drought. J. Agron. Crop Sci. 2018, 204, 13–30. [Google Scholar] [CrossRef]
- Lal, M.K.; Tiwari, R.K.; Kumar, A.; Dey, A.; Kumar, R.; Kumar, D.; Jaiswal, A.; Changan, S.S.; Raigond, P.; Dutt, S.; et al. Mechanistic concept of physiological, biochemical, and molecular responses of the potato crop to heat and drought stress. Plants 2022, 11, 2857. [Google Scholar] [CrossRef] [PubMed]
- Liu, F.; Shahnazari, A.; Andersen, M.N.; Jacobsen, S.-E.; Jensen, C.R. Effects of deficit irrigation (DI) and partial root drying (PRD) on gas exchange, biomass partitioning, and water use efficiency in potato. Sci. Hortic. 2006, 109, 113–117. [Google Scholar] [CrossRef]
- Ahmadi, S.H.; Andersen, M.N.; Plauborg, F.; Poulsen, R.T.; Jensen, C.R.; Sepaskhah, A.R.; Hansen, S. Effects of irrigation strategies and soils on field-grown potatoes: Gas exchange and xylem [ABA]. Agric. Water Manag. 2010, 97, 1486–1494. [Google Scholar] [CrossRef]
- Karam, F.; Amacha, N.; Fahed, S.; ELAsmar, T.; Domínguez, A. Response of potato to full and deficit irrigation under semiarid climate: Agronomic and economic implications. Agric. Water Manag. 2014, 142, 144–151. [Google Scholar] [CrossRef]
- Badr, M.A.; El-Tohamy, W.A.; Zaghloul, A.M. Yield and water use efficiency of potato grown under different irrigation and nitrogen levels in an arid region. Agric. Water Manag. 2012, 110, 9–15. [Google Scholar] [CrossRef]
- Xing, Y.; Zhang, T.; Jiang, W.; Li, P.; Shi, P.; Xu, G.; Cheng, S.; Cheng, Y.; Fan, Z.; Wang, X. Effects of irrigation and fertilization on different potato varieties growth, yield and resources use efficiency in the Northwest China. Agric. Water Manag. 2022, 261, 107351. [Google Scholar] [CrossRef]
- Jovanovic, Z.; Stikic, R.; Vucelic-Radovic, B.; Paukovic, M.; Brocic, Z.; Matovic, G.; Rovcanin, S.; Mojevic, M. Partial root-zone drying increases WUE, N and antioxidant content in field potatoes. Eur. J. Agron. 2010, 33, 124–131. [Google Scholar] [CrossRef]
- Yadav, B.; Jogawat, A.; Rahman, M.S.; Narayan, O.P. Secondary metabolites in the drought stress tolerance of crop plants: A review. Gene Rep. 2021, 23, 101040. [Google Scholar] [CrossRef]
- Al-Omran, A.; Louki, I.; Alkhasha, A.; Abd El-Wahed, M.H.; Obadi, A. Water saving and yield of potatoes under partial root-zone drying drip irrigation technique: Field and modelling study using SALTMED model in Saudi Arabia. Agronomy 2020, 10, 1997. [Google Scholar] [CrossRef]
- Crosby, T.W.; Wang, Y. Effects of different irrigation management practices on potato (Solanum tuberosum L.). Sustainability 2021, 13, 10187. [Google Scholar] [CrossRef]
- Vogel, E.; Donat, M.G.; Alexander, L.V.; Meinshausen, M.; Ray, D.K.; Karoly, D.; Meinshausen, N.; Frieler, K. The effects of climate extremes on global agricultural yields. Environ. Res. Lett. 2019, 14, 054010. [Google Scholar] [CrossRef]
- Nyiraneza, J.; Cambouris, A.N.; Nelson, A.; Khakbazan, M.; Mesbah, M.; Perron, I.; Ziadi, N.; Lafond, J. Potato yield, net revenue and specific gravity responses to nitrogen fertilizer under different Canadian agroecozones. Agronomy 2021, 11, 1392. [Google Scholar] [CrossRef]
- Liu, K.; Du, J.; Zhong, Y.; Shen, Z.; Yu, X. The response of potato tuber yield, nitrogen uptake, soil nitrate nitrogen to different nitrogen rates in red soil. Sci. Rep. 2021, 11, 22506. [Google Scholar] [CrossRef] [PubMed]
- Makani, M.N.; Zotarelli, L.; Sargent, S.A.; Huber, D.J.; Sims, C.A. Nitrogen fertilizer rate affects yield and tuber quality of drip-irrigated tablestock potatoes (Solanum tuberosum L.) Grown under Subtropical Conditions. Am. J. Potato Res. 2020, 97, 605–614. [Google Scholar] [CrossRef]
- Nurmanov, Y.T.; Chernenok, V.G.; Kuzdanova, R.S. Potato in response to nitrogen nutrition regime and nitrogen fertilization. Field Crops Res. 2019, 231, 115–121. [Google Scholar] [CrossRef]
- Yang, M.-D.; Leghari, S.J.; Guan, X.-K.; Ma, S.-C.; Ding, C.-M.; Mei, F.-J.; Wei, L.; Wang, T.-C. Deficit subsurface drip irrigation improves water use efficiency and stabilizes yield by enhancing subsoil water extraction in winter wheat. Front. Plant Sci. 2020, 11, 508. [Google Scholar] [CrossRef]
- Kumar, P.; Pandey, S.K.; Singh, B.P.; Singh, S.V.; Kumar, D. Effect of nitrogen rate on growth, yield, economics and crisps quality of Indian potato processing cultivars. Potato Res. 2007, 50, 143–155. [Google Scholar] [CrossRef]
- Ierna, A.; Mauromicale, G. Sustainable and profitable nitrogen fertilization management of potato. Agronomy 2019, 9, 582. [Google Scholar] [CrossRef]
- Makani, M.N.; Sargent, S.A.; Zotarelli, L.; Huber, D.J.; Sims, C.A. Harvest interval has greater effect on periderm maturity and storage quality of early-maturing, tablestock potato than nitrogen rate. HortScience 2017, 52, 1390–1395. [Google Scholar] [CrossRef]


| Depth (cm) | pH | Organic Matter % | N ppm | Olsen P ppm | K ppm | Ca ppm | Mg ppm | Na ppm | S ppm | Zn ppm | Fe ppm | Mn ppm | Cu ppm |
|---|---|---|---|---|---|---|---|---|---|---|---|---|---|
| 0–30 | 8.1 | 1.7 | 0.6 | 10.6 | 273 | 3834 | 287 | 54 | 389 | 1.36 | 2.9 | 5.3 | 0.49 |
| 30–60 | 8.2 | 1.4 | 2.5 | 8.9 | 89 | 3872 | 315 | 44 | 13.1 | 0.4 | 3 | 2.2 | 0.36 |
| 60–90 | 8.4 | 1.2 | 0.8 | 7.3 | 43 | 3636 | 429 | 35 | 16.2 | 0.14 | 1.8 | 1.2 | 0.24 |
| 90–120 | 8.4 | 1.1 | 1.5 | 8.1 | 35 | 3453 | 411 | 38 | 9.5 | 0.13 | 1.3 | 1.3 | 0.1 |
| Main Plot Factors: | Sub-Plot Factors: | Sub-Sub Plot Factors: |
|---|---|---|
| [3 Irrigation regimes] 40% DI = 40% deficit irrigation (40% water saving) 20% DI = 20% deficit irrigation (20% water saving) FI = Full irrigation | [7 Nitrogen rates] N0 = 0 kg/ha N60 = 60 kg/ha N115 = 115 kg/ha N170 = 170 kg/ha N220 = 220 kg/ha N280 = 280 kg/ha N340 = 340 kg/ha | [2 Chip potato varieties] 1. Lamoka 2. Waneta |
| Irrigation Regimes | 2022 | 2023 |
|---|---|---|
| FI | 604.27 | 655.32 |
| 20% DI | 533.15 | 551.69 |
| 40% DI | 462.03 | 448.06 |
| Treatments | Tuber Number/Plant | Marketable Tuber Number Ratio (%) | |||
|---|---|---|---|---|---|
| 2022 | 2023 | 2022 | 2023 | ||
| Irrigation regimes † | |||||
| 40% DI | 6.64 bႴ | 3.99 b | 76.0 b | 56.2 c | |
| 20% DI | 7.54 a | 5.53 a | 84.4 a | 70.9 b | |
| FI | 7.36 a | 5.28 a | 86.0 a | 81.7 a | |
| N Rates (kg/ha) ‡ | |||||
| 0 | 7.07 a | 4.51 a | 81.5 a | 72.6 ab | |
| 60 | 7.70 a | 4.88 a | 83.3 a | 73.3 a | |
| 115 | 7.05 a | 4.94 a | 84.3 a | 68.9 ab | |
| 170 | 7.37 a | 4.98 a | 81.6 a | 71.2 ab | |
| 220 | 7.15 a | 4.88 a | 82.9 a | 67.9 ab | |
| 280 | 7.09 a | 5.11 a | 81.6 a | 69.3 ab | |
| 340 | 6.85 a | 5.25 a | 79.7 a | 64.2 b | |
| Variety § | |||||
| Lamoka | 7.21 a | 5.00 a | 82.4a | 71.3 a | |
| Waneta | 7.15 a | 4.88 a | 81.8a | 67.9 b | |
| Mean (year) | 7.18 | 4.94 | 82.1 | 69.6 | |
| Source of variation | df | p-Value | |||
| I | 2 | <0.001 *** | <0.001 *** | <0.001 *** | <0.001 *** |
| N | 6 | 0.311 ns | 0.892 ns | 0.223 ns | 0.037 * |
| V | 1 | 0.744 ns | 0.676 ns | 0.543 ns | 0.026 * |
| I × N | 12 | 0.707 ns | 0.740 ns | 0.060 ns | 0.226 |
| I × V | 2 | <0.001 *** | 0.813 ns | 0.970 *** | <0.001 *** |
| N × V | 6 | 0.406 ns | 0.099 ns | 0.133 ns | 0.089 ns |
| I × N × V | 12 | 0.675 ns | 0.822 ns | 0.462 ns | 0.581 ns |
| Treatments | Marketable Yield (Mg/ha) | Total Yield (Mg/ha) | WUE (kg/m3) | ||||
|---|---|---|---|---|---|---|---|
| 2022 | 2023 | 2022 | 2023 | 2022 | 2023 | ||
| Irrigation regimes † | |||||||
| 40% DI | 28.7 bႴ | 8.67 c | 31.8 b | 11.7c | 6.87c | 2.60b | |
| 20% DI | 45.5 a | 18.57 b | 48.0 a | 21.8b | 9.00a | 3.96a | |
| FI | 47.5 a | 26.01 a | 50.3 a | 28.0a | 8.33b | 4.28a | |
| N rates (kg/ha) ‡ | |||||||
| 0 | 37.0 b | 17.3 a | 39.6 b | 19.6 a | 7.36 b | 3.42 a | |
| 60 | 43.1 a | 18.5 a | 45.9 a | 20.9 a | 8.56 a | 3.71 a | |
| 115 | 42.6 a | 16.6 a | 44.9 ab | 19.5 a | 8.39 a | 3.49 a | |
| 170 | 41.2 ab | 18.7 a | 44.3 ab | 21.5 a | 8.23 ab | 3.81 a | |
| 220 | 40.8 ab | 17.6 a | 43.6 ab | 20.4 a | 8.12 ab | 3.62 a | |
| 280 | 40.6 ab | 18.6 a | 43.2 ab | 21.4 a | 8.06 ab | 3.73 a | |
| 340 | 38.7 ab | 16.9 a | 41.9 ab | 20.1 a | 7.76 ab | 3.51 a | |
| Variety § | |||||||
| Lamoka | 40.2 a | 19.1 a | 43.2 a | 21.9 a | 8.08 a | 4.19 a | |
| Waneta | 41.0 a | 16.4 b | 43.5 a | 19.3 b | 8.06 a | 3.77 b | |
| Mean (year) | 40.6 | 17.8 | 43.4 | 20.5 | 8.07 | 3.61 | |
| Source of variation | df | p-value | |||||
| I | 2 | <0.001 *** | <0.001 *** | <0.001 *** | <0.001 *** | <0.001 *** | <0.001 *** |
| N | 6 | 0.015 * | 0.834 ns | 0.025 * | 0.922 ns | <0.015 * | 0.936 ns |
| V | 1 | 0.406 ns | 0.005 ** | 0.772 ns | 0.027 * | 0.895 ns | 0.035 * |
| I × N | 12 | 0.166 ns | 0.654 ns | 0.430 ns | 0.627 ns | 0.306 ns | 0.695 ns |
| I × V | 2 | <0.001 *** | 0.031 * | 0.001 ** | 0.250 ns | <0.001 *** | 0.252 ns |
| N × V | 6 | 0.637 ns | 0.069 ns | 0.729 ns | 0.078 ns | 0.724 ns | 0.089 ns |
| I × N × V | 12 | 0.822 ns | 0.165 ns | 0.818 ns | 0.322 ns | 0.838 ns | 0.481 ns |
Disclaimer/Publisher’s Note: The statements, opinions and data contained in all publications are solely those of the individual author(s) and contributor(s) and not of MDPI and/or the editor(s). MDPI and/or the editor(s) disclaim responsibility for any injury to people or property resulting from any ideas, methods, instructions or products referred to in the content. |
© 2024 by the authors. Licensee MDPI, Basel, Switzerland. This article is an open access article distributed under the terms and conditions of the Creative Commons Attribution (CC BY) license (https://creativecommons.org/licenses/by/4.0/).
Share and Cite
Shrestha, B.; Stringam, B.L.; Darapuneni, M.K.; Lombard, K.A.; Sanogo, S.; Higgins, C.; Djaman, K. Effect of Irrigation and Nitrogen Management on Potato Growth, Yield, and Water and Nitrogen Use Efficiencies. Agronomy 2024, 14, 560. https://doi.org/10.3390/agronomy14030560
Shrestha B, Stringam BL, Darapuneni MK, Lombard KA, Sanogo S, Higgins C, Djaman K. Effect of Irrigation and Nitrogen Management on Potato Growth, Yield, and Water and Nitrogen Use Efficiencies. Agronomy. 2024; 14(3):560. https://doi.org/10.3390/agronomy14030560
Chicago/Turabian StyleShrestha, Bhimsen, Blair L. Stringam, Murali K. Darapuneni, Kevin A. Lombard, Soumaila Sanogo, Charles Higgins, and Koffi Djaman. 2024. "Effect of Irrigation and Nitrogen Management on Potato Growth, Yield, and Water and Nitrogen Use Efficiencies" Agronomy 14, no. 3: 560. https://doi.org/10.3390/agronomy14030560
APA StyleShrestha, B., Stringam, B. L., Darapuneni, M. K., Lombard, K. A., Sanogo, S., Higgins, C., & Djaman, K. (2024). Effect of Irrigation and Nitrogen Management on Potato Growth, Yield, and Water and Nitrogen Use Efficiencies. Agronomy, 14(3), 560. https://doi.org/10.3390/agronomy14030560