Article

Water Footprint Assessment of Agricultural Crop Productions in the Dry Farming Region, Shanxi Province, Northern China

1
State Key Laboratory of Sustainable Dryland Agriculture (In Preparation), Shanxi Agricultural University, Taiyuan 030031, China
2
School of Forestry, Nanjing Forestry University, Nanjing 210037, China
3
Co-Innovation Center for Sustainable Forestry in Southern China, Nanjing Forestry University, Nanjing 210037, China
4
Jiangsu Provincial Key Laboratory of Soil Erosion and Ecological Restoration, Nanjing Forestry University, Nanjing 210037, China
*
Author to whom correspondence should be addressed.
Agronomy 2024, 14(3), 546; https://doi.org/10.3390/agronomy14030546
Submission received: 30 January 2024 / Revised: 28 February 2024 / Accepted: 5 March 2024 / Published: 7 March 2024
(This article belongs to the Section Water Use and Irrigation)

Abstract

:
Exploring the crop production water footprint and their driving factors is of significant importance for management of agricultural water resources. However, how do we effectively assess the total agricultural water consumption and explore the significance of their driving factors, i.e., population, economy, and agricultural production conditions, using a backpropagation neural network (BPNN)? It is still ambiguous. Water consumption for crops during the growing season is explicitly explored by way of water footprint indicators (green water footprint, WFPg, and blue water footprint, WFPb). This study provides new insights into the factors driving the changes in crop production water footprint in Taiyuan City over the period of 2005–2021. Simulations of crop evapotranspiration using the CROPWAT model were quantified. The results showed that Taiyuan City has a low crop yield level below the average level of China, with the highest crop yield in maize. The crop production water footprint in Taiyuan City showed a non-linearly decreasing trend over time. The average annual crop production water footprint was 187.09 × 10³ m3/kg in Taiyuan City, with the blue water footprint and green water footprint accounting for 63.32% and 36.68%, respectively. The crop production water footprint in the west and north of Taiyuan City was significantly higher than those in other areas, accounting for 42.92% of the total crop production water footprint. Oilseed crops contributed most to the total crop production water footprint, accounting for 47.11%. The GDP and total sown area of crops were more important for the changes in WFPb. Agricultural machinery power and agriculture-to-non-agriculture ratio were more important for the changes in WFPg. Agricultural machinery power and GDP were more important for the changes in IWFP. In-depth analysis of the factors driving the changes in crop production water footprint is dramatically important for agricultural decision makers to mitigate water resource pressure in Taiyuan City.

1. Introduction

Generally, water resources are necessary for the health of natural ecosystems and human demand [1]. However, with the effects of climate change and human activities, water resource crises have become severe. Water scarcity has become a worldwide problem due to the over-exploitation of water resources, resulting in negative environmental impacts, i.e., natural ecosystem function loss and land degradation. Water scarcity constitutes a threat to the sustainable development of China [2]. The Yellow River Basin is an important source of water resources for North China [3]. Since the 1950s, the water quantity and quality of the Yellow River Basin have been deteriorating significantly with the development of industry and urbanization. Along with urbanization, the factors that influence the spatial and temporal distribution of water resources in the Yellow River Basin have not been solved systematically [4]. In recent years, the exploitation intensity of water resources has increased with increasing population pressure, and the stability of the water resource cycle has been reduced [5]. Therefore, those problems might cause great constraints to the sustainable development of the basin [6].
In the Yellow River Basin, agriculture is the largest consumer of water resources [7]. As expected, agricultural water consumption has been increasing and accounts for 90% of the total water consumption. Due to rapid economic development, increasing population explosion, expansion of the agricultural sector, and also climate change, water shortage has caused agricultural drought [7]. However, how to rationally allocate agricultural water resources under the pressure of human demand has become a major issue. Therefore, improving the efficiency of agricultural water resource utilization is pivotal to maintain the sustainability of water resources, which requires suitable methods to assess agricultural water resource consumption and their driving factors. The problem is that it is now necessary to find solutions to reduce agricultural water consumption without affecting food supplies. Recently, proposed solutions to allocate agricultural water resources primarily focus on the development of virtual water.
The proposal of virtual water [8] and water footprint would provide new insight for solving agricultural water consumption problems. Water footprint is a promising indicator which can reflect the degree of water consumption at the regional or national scale [9]. Water footprint is defined as the total amount of consumed freshwater resources including direct and indirect water resources during human production and consumption [10,11]. In fact, water footprint can strongly imply the relationship between human activities and water crises. It also provides an innovative approach for effective water resource management [12]. Water footprint is categorized into the blue water footprint, green water footprint, and grey water footprint [13]. The blue water footprint refers to the amount of blue water resources including surface water and groundwater resources [14]. The green water footprint refers to the amount of green water resources, namely precipitation in so far as it does not become runoff [14]. The grey water footprint refers to the volume of water resources needed to dilute a certain amount of pollution so that it is equivalent to the natural background concentration. Hoekstra [12] proposed the Water Footprint Assessment Manual and proposed water footprint assessment methodologies. Numerous studies have increasingly quantified the crop production water footprint [15,16,17]. For example, Hoekstra and Booij [18] concluded that the crop production water footprint ranged from 859 to 1895 m3/cap/a. Liu et al. [19] used a GIS-based GEPIC model to simulate crop yield per unit area and crop water demand during the growing season and calculated the crop production water footprint. Mekonnen and Hoekstra [20] estimated the green, blue, and grey water footprint of wheat and assessed the impact of wheat production on the blue water footprint. Sun et al. [21] accounted for the spring wheat production water footprint in China’s irrigation areas and distinguished the water footprint of irrigated agriculture and rain-fed agriculture. Bazrafshan et al. [22] investigated almond cultivation in Iran and compared the water footprint of rain-fed and irrigated almond cultivation. Zhang et al. [23] calculated the agricultural water footprint and constructed a regional water use evaluation index system in a typical arid zone to indicate the water stress. However, most previous studies explored the crop water footprint at a global scale, whereas few studies quantified the crop water footprint at agricultural scales using crop models, i.e., CROPWAT model [24].
Crop water footprint studies primarily focus on the assessment of the green and blue water footprints. In general, the blue water footprint places more pressure on water consumption compared with the green water footprint [25]. Recent studies have explored the effects of various factors driving the change in crop water footprint. Zhao and Chen [26] found that economic activity was positively correlated with the agricultural consumption water footprint and that water efficiency improvement was affected negatively. Therefore, it is very important to certify the influences of various factors on the changes in crop water footprint for the purpose of alleviating water resources. Many previous studies employed comparatively standard statistical tools to illustrate the relationship between the various factors and predicted results. So far, the data-driven model interpretations can provide a deeper understanding. As data-driven models, the backpropagation neural network (BPNN) has been widely used to imply the relationship between the input variables and the output results. BPNN is applied to handle the relationships between the input variables and the output results. The BPNN model is dedicated to the study of computer simulations. Also, the model aims to use a large number of datasets to make predictions and achieve the study objectives [27]. The model has been applied to the predictions of agricultural crop yield, crop cost, water quality, and water requirements [24]. However, few studies on the quantification of crop production water footprint have been based on BPNN. In addition, comprehensive studies on the crop production water footprint in Taiyuan City based on BPNN are yet to be assessed.
In addition, there is a lack of recent studies providing comprehensive analysis of the effects of population, economy, and agricultural production conditions on the crop production water footprint in Taiyuan City. Nevertheless, the hypothesis that differential influencing factors could explain crop production water footprint changes has rarely been tested. Taiyuan City was selected as the study area. The area is located in the Yellow River Basin, where agricultural water resource problems are prominent [28]. It has been facing severe water scarcity, wastewater loss, and water quality pollution due to the over-exploitation of water resources in the area [29,30]. Developing the efficiency of agricultural water utilization is crucial for the highly effective water resource management of the Yellow River Basin [31]. The main aims of this study were as follows: (1) to focus on the quantification of the crop green and blue water footprints in Taiyuan City over the period of 2000–2021; (2) to specify the spatial variations in the changes in crop production water footprint in different locations of Taiyuan City; and (3) to indicate the factors driving the spatial and temporal changes in crop production water footprint. In this study, the indicator of integrated crop production water (IWFP) is used to provide a comprehensive measurement of water use for agriculture. The IWFP is the combined produced water footprint of each crop obtained by weighting the produced water footprint of various crops against the crop yield [32]. Our study provides support for rational agricultural water use for the Yellow River Basin.

2. Materials and Methods
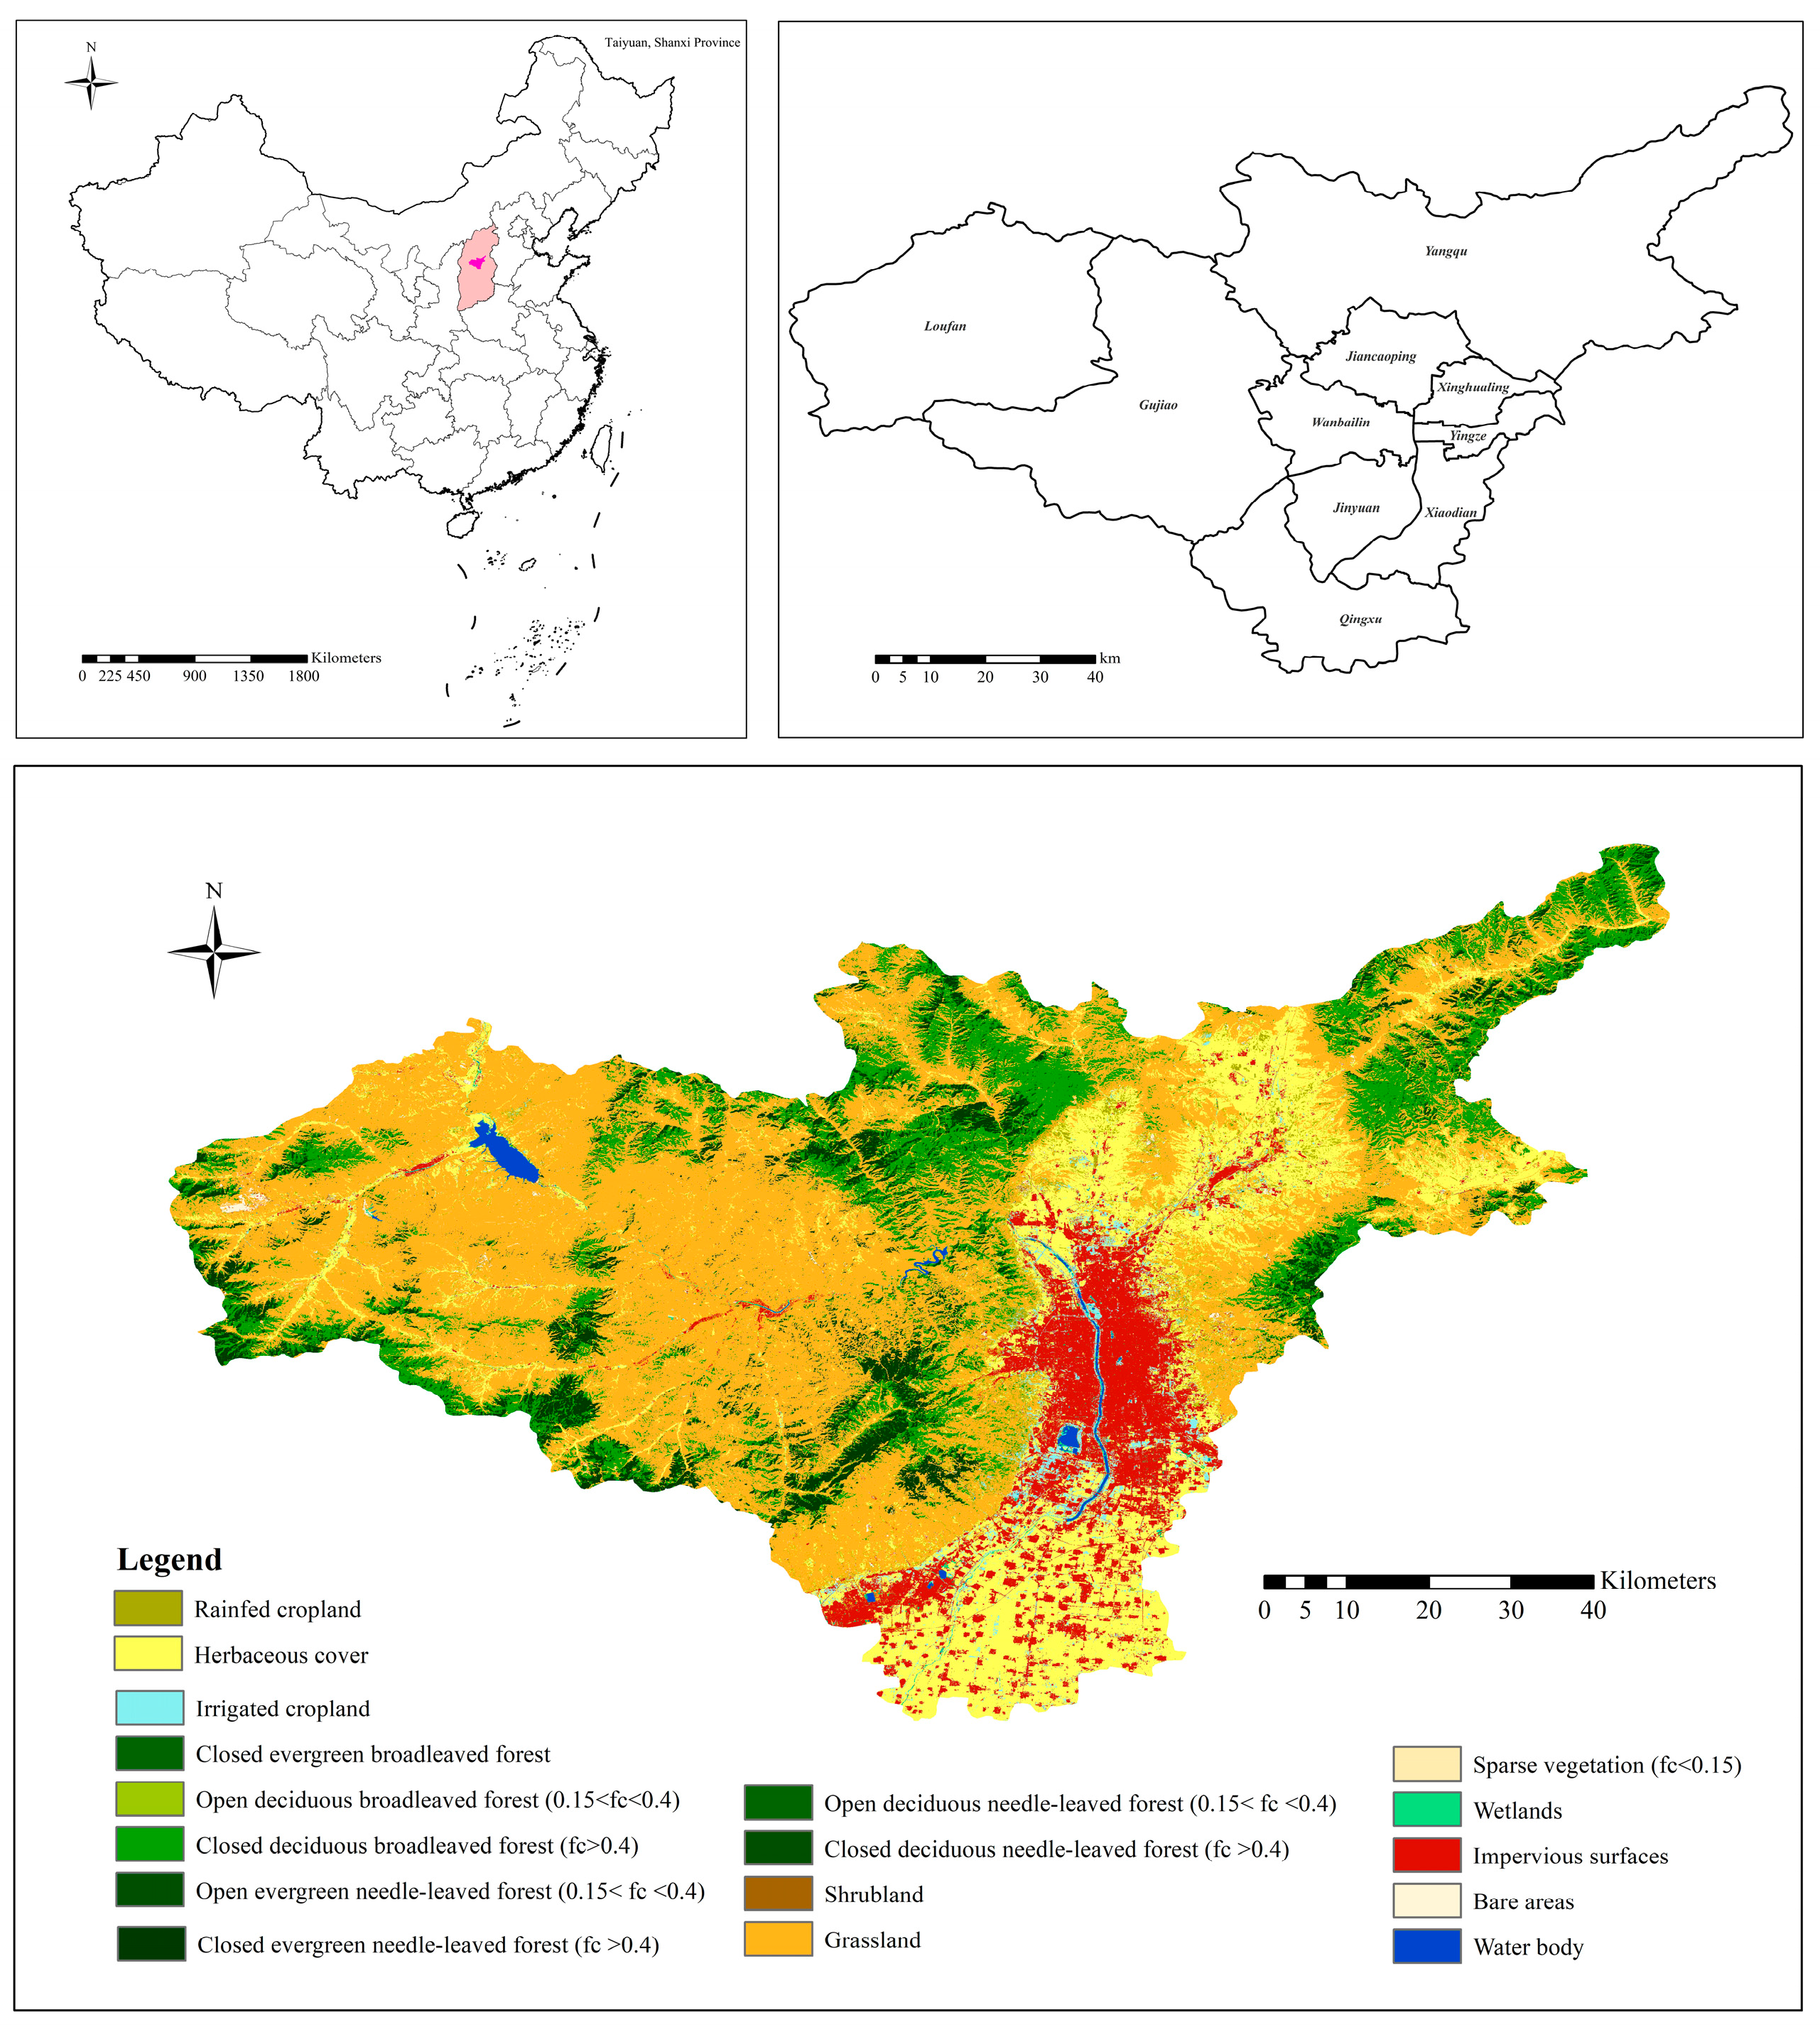
2.1. Study Area

Taiyuan City, Shanxi Province, in northern China, is located on the plain of Fen River valley at an altitude of 760–800 m (Figure 1). Spring and autumn seasons in the area have shorter time periods, with rapid temperature changes and frequent drought events. The average annual precipitation is 456 mm, the average annual temperature is 11 °C, and the average annual sunshine duration is 2449 h. The soil in the area is predominantly brown [33]. Taiyuan City has 392,000 hectares of arable land and a rich variety of crops, including corn, wheat, cotton, vegetables, fruits, etc. In recent years, the level of urbanization in Taiyuan City has been rising [34]. This rising urbanization not only causes the transformation of land use patterns, but also changes the spatial and temporal distribution of water resources.

2.2. Crop Water Footprint Calculation

2.2.1. Crop Evapotranspiration (ETc)

The FAO (Food and Agriculture Organization of the United Nations, Rome, Italy) Penman–Monteith equation is recommended to calculate the reference ET0. The reference evapotranspiration (ET0) was calculated following the formula:
ET 0 = 0.408 Δ R n   G + γ 900 T + 273 u 2 ( e s   e a ) Δ + γ ( 1 + 0.34 u 2 )
where ET0 is the reference evapotranspiration (mm/day), Rn is the net radiation (MJ/m2·day), G is the soil heat flux (MJ/m2·day), T is the average daily temperature at two meters (°C), u2 is the wind speed at a height of two meters (m/s), es is the saturated vapor pressure (kPa), ea is the real water vapor pressure (kPa), es − ea represents the vapor pressure deficit of the air, ∆ represents the slope of the saturation vapor pressure–temperature relationship, γ is the hygrometer constant.
Estimation of crop evapotranspiration is based on the effective precipitation in a 10-day cycle throughout the growing season. The equation is as follows:
ETc = Kc × ET0
where Kc is the crop coefficient, determined by the crop characteristics and the average evaporation effect of the soil [35].

2.2.2. Crop Water Footprint

Crop water footprint is the amount of water consumed by crops during growing season. In accordance with The Water Footprint Assessment Manual [12], the water footprint of the crops was calculated as follows:
ETg = min (ETc, Peff),
ETb = max (0, ETc − Peff),
WFPg = 10ETg/Y,
WFPb = 10ETb/Y,
where ETg is the evapotranspiration of green water of the crop (mm); ETb is the evapotranspiration of blue water of the crop (mm); Peff is the effective precipitation (m3/hm2); Y is the crop yield per unit area (kg/hm2); WFPg is the crop growth period green water footprint (m3/kg); WFPb is the crop growth period blue water footprint (m3/kg).
Effective precipitation (Peff) is calculated using the CROPWAT 8.0 model, based on the United States Department of Agriculture Soil Conservation Service (USDA SCS, Washington, DC, USA) methodology. The equation is as follows:
P eff = P ( 125     0.2 P ) / 125 ,   P     250 125 + 0.1 P , P   >   250
where P is the decadal precipitation (mm), and the effective precipitation in the whole growing period is obtained by accumulating the monthly precipitation.

2.2.3. Integrated Crop Production Water Footprint (IWFP)

The calculation formula of IWFP is as follows:
IWFP j = i WFP i , j   ×   P i , j i P i , j
where IWFPj is the water footprint of integrated crop production (m3/kg) for region j (i.e., 10 districts and counties in Taiyuan City: Xiaodian, Yingze, Xinghualing, Jiancaoping, Wanbailin, Jinyuan, Qingxu, Yangqu, Loufan, and Gujiao); WFPi,j is the produced water footprint (m3/kg) of crop i (i.e., maize, wheat, sorghum, millet, soybean, potato, etc.) in region j; Pi,j is the total production of crop i in region j (t).

2.3. Factors Influencing the Water Footprint of Crop Production

2.3.1. Evaluation Indexes Selection

In this study, we constructed an evaluation index system for the urbanization process of Taiyuan City. A total of 14 indicators including population factors, economic factors, and agricultural production conditions were selected. The specific indicators are shown in Table 1.

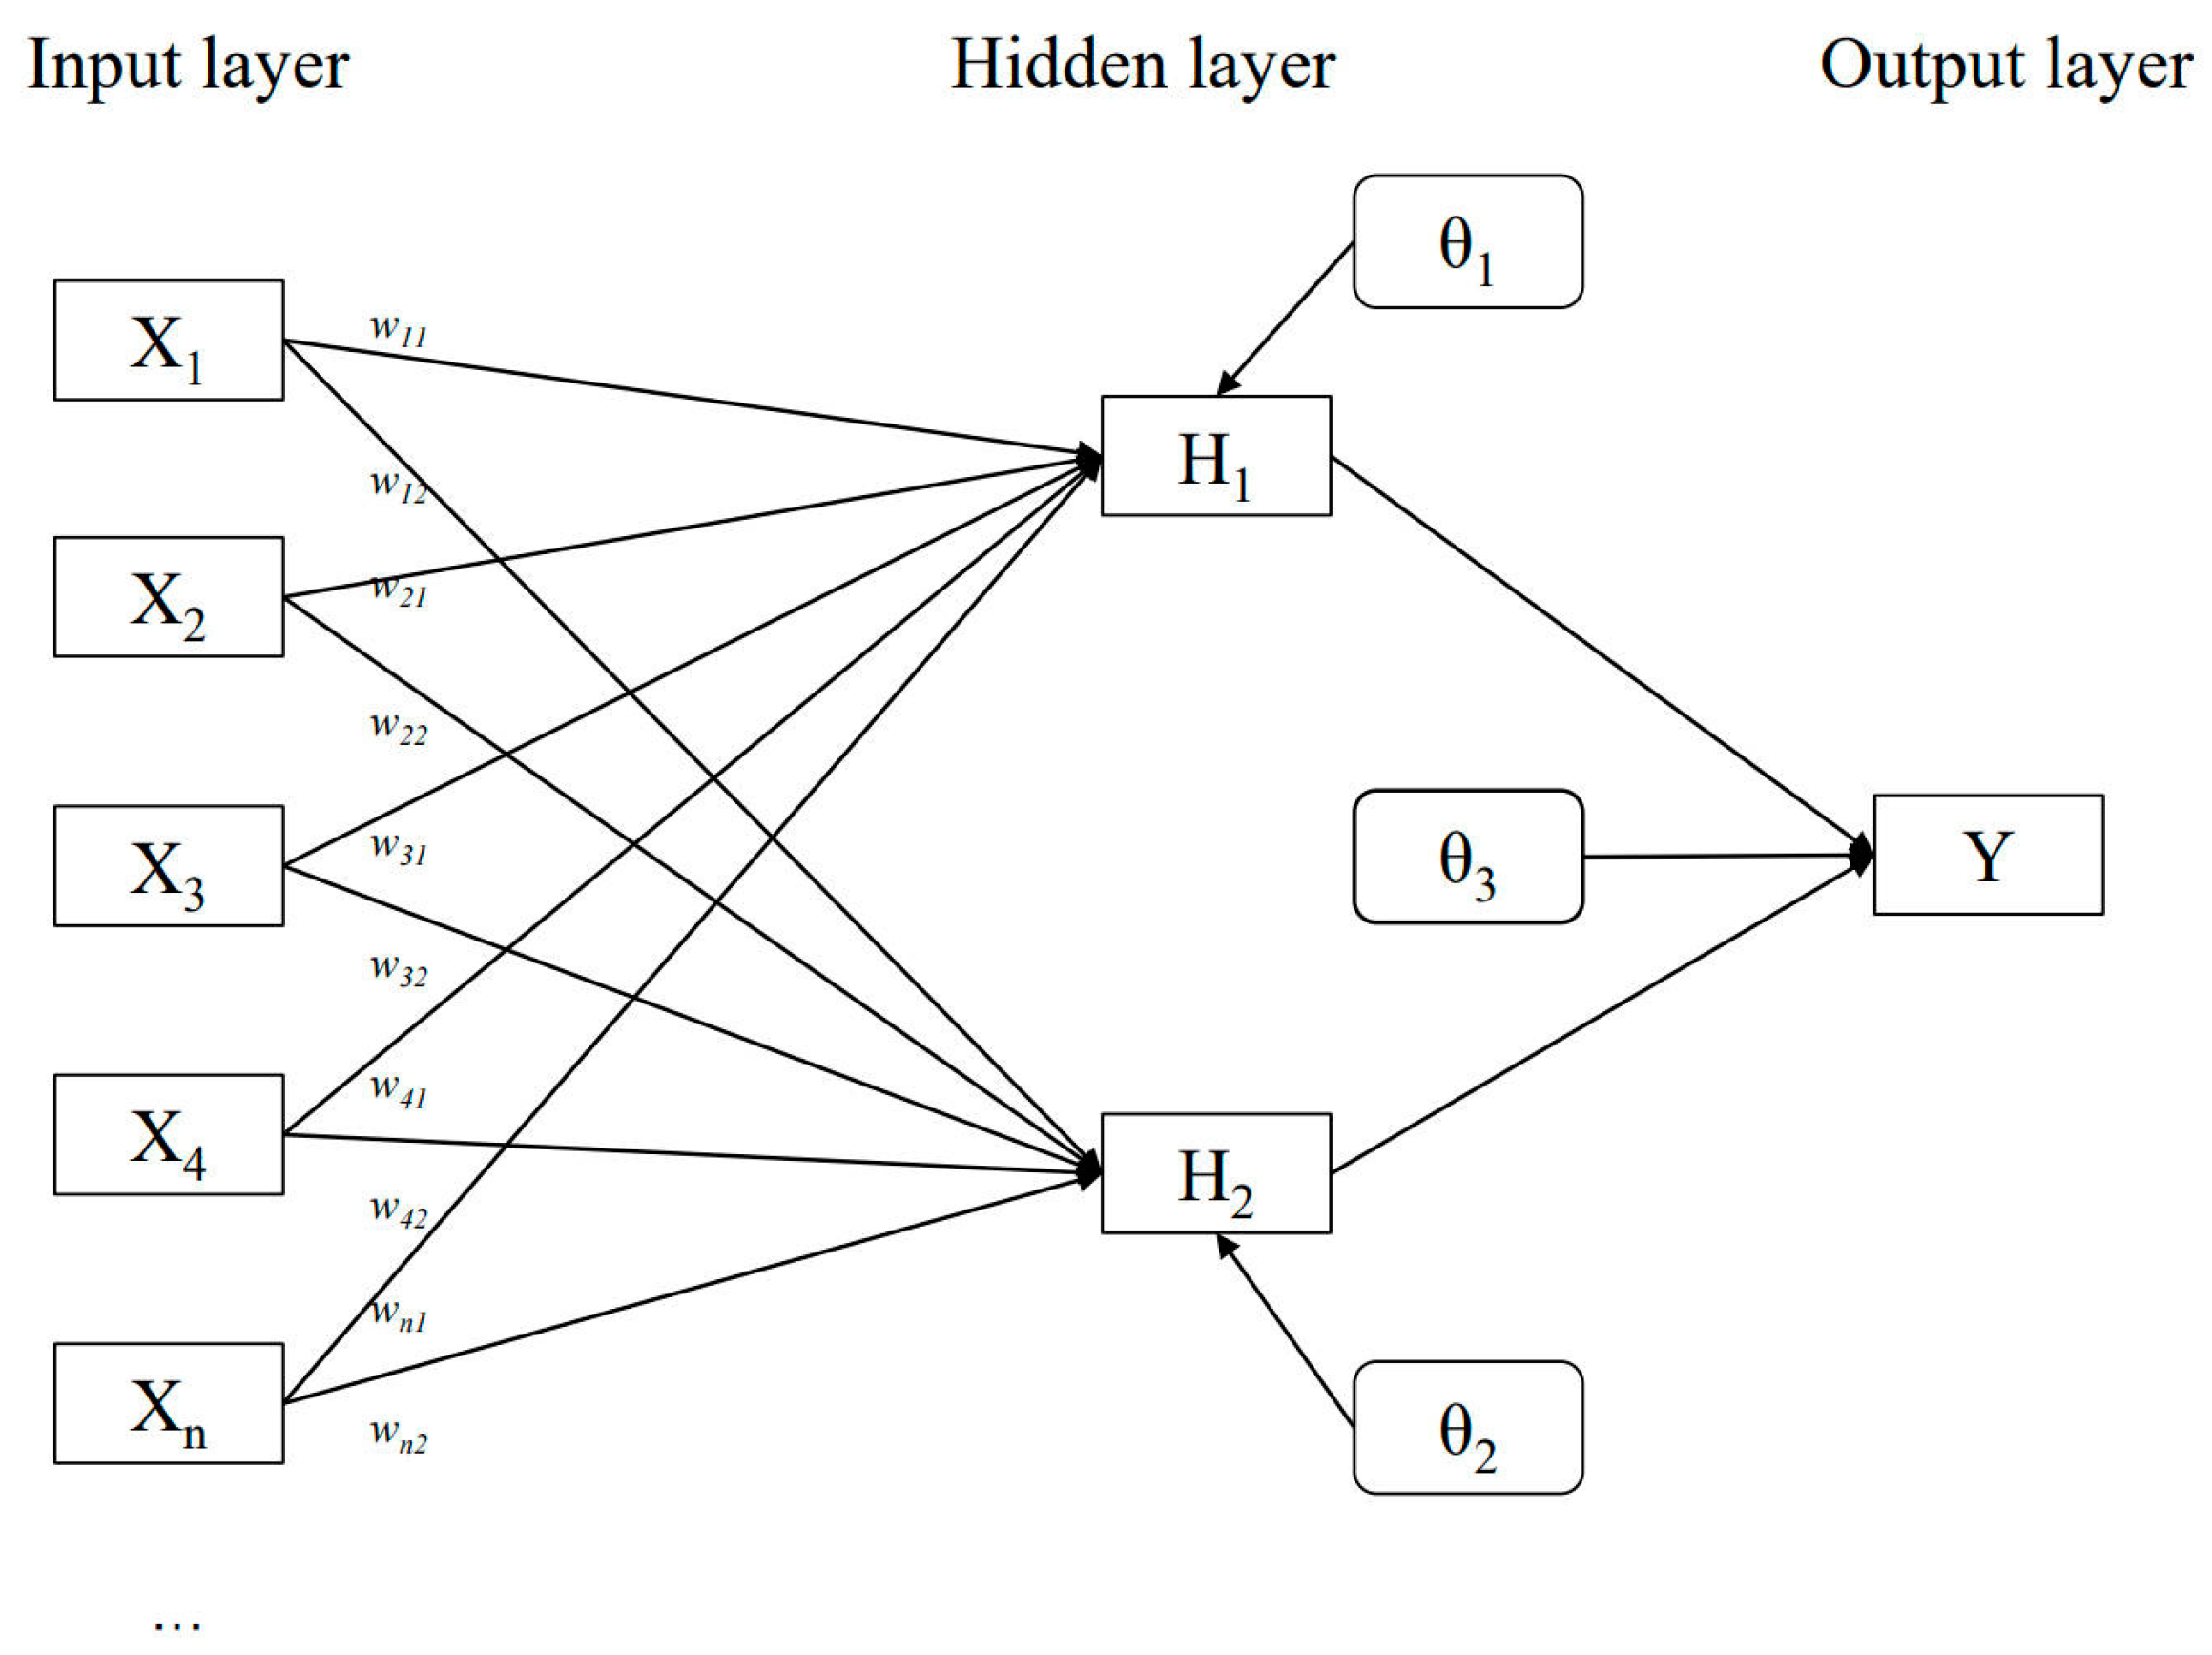
2.3.2. Backpropagation Neural Network (BPNN)

According to studies, neurons, layers, and networks are the main parts of BPNNs [36]. In general, neurons are the most basic units of BPNNs. There are three layers inside the BPNN, i.e., an input layer, a hidden layer, and an output layer. The entire network inside the BPNN includes the interconnected basic neurons with weights during the training processes. That is, each neuron in each layer can make contact with the connection between the preceding layers and the following layers to obtain a neural network. The input variables can be set in the input layer. With respect to the input layer, neurons do not perform computations but pass useful information to the next layer. For the hidden layer inside the BPNN, this layer performs all the computations. In the final step, the output layer creates the predicted results. In total, the BPNN model can obtain the complex non-linear relationship between the input variables and the output results [27]. The BPNN structure is shown in Figure 2.
The input variables in this study are total population (X1), rural population (X2), urban population (X3), agriculture-to-non-agriculture ratio (X4), population density (X5), natural population growth rate (X6), GDP (X7), GDP per capita (X8), effective irrigated area (X9), total sown area of crops (X10), agricultural mechanization power (X11), rural electricity consumption (X12), amount of agricultural fertilizer application (X13), and amount of agricultural land film used (X14). The output results mainly include predicted crop production water footprint values, i.e., IWFP, WFPb, and WFPg.
In order to maintain the quality of the BPNN, the input and output data should be normalized. The normalization formula is as follows [37,38]:
Scalex i = x i   x min x max x min
where x i is the real value of each vector quantity, x min is the minimum value of the input matrix and the output vector, and x max is the maximum value.
X = (x1, x2, x3, …, xn) is the input value of the BPNN. The hidden layer excitation function f chosen in this study is
f U j = 1 1 + e U j
Hidden layer output Hf can be obtained by
H f = f U j   j = 1 , 2 , l
where f is the activation function of the hidden layer, U j is the input of the hidden layer nodes, and l is the number of nodes in the hidden layer.
U j = i = 1 n   w ij x i + θ j
where w ij is the connection weight of the input and output layers, θ j is the hidden layer threshold.
The predicted output Ok of the BPNN can be obtained as follows:
O k = i = 1 l H j w jk + θ k
where w jk is the connection weight and θk is the output layer threshold.
We used generalized weights from a BPNN to determine the relative importance of the different drivers of virtual water. The neuralnet package in R 4.1.3 (R Foundation for Statistical Computing, Vienna, Austria) was used to calculate the GW, which estimates the relative importance of the variables.
GW is calculated as follows:
GW i = ( log O k 1     O k ) x i
In this study, the BPNN model was performed using the neural net package in R. Historical data were divided into two segments as input variables in the BPNN model, from 2005 to 2016 for training (70% of the datasets) and from 2017 to 2021 for testing (30% of the datasets). The training data were the set of data, while the testing data were applied to certify the BPNN model performance by comparing the predicted crop water footprint values with the actual values calculated from CROPWAT model. The best combination of the input variables with several hidden neurons in each layer for predicting the crop water footprint were selected in detail [24]. The steps of the computing process of the BPNN model were as follows (Figure 3): (1) Data collection. The input variables are shown in Table 1. (2) Data normalization. The normalization formula (9) is used. (3) Neural configuration. The parameters like number of input, hidden, and output neurons are designed. The input parameters range from X1 to X14. The number of hidden layers is one. The number of hidden neurons is 10 based on the proposed criteria. (4) Calibration and validation. A proportion of 70% of the datasets from 2005 to 2016 are used for training, and 30% of the datasets from 2017 to 2021 are used for testing. (5) Compute the BPNN model in the proposed combination of the input variables and hidden neurons to obtain the network for predicting crop production water footprint. (6) Performance evaluation. Quantify the BPNN model performance on the basis of the predicted crop production water footprint values with the actual values [39].

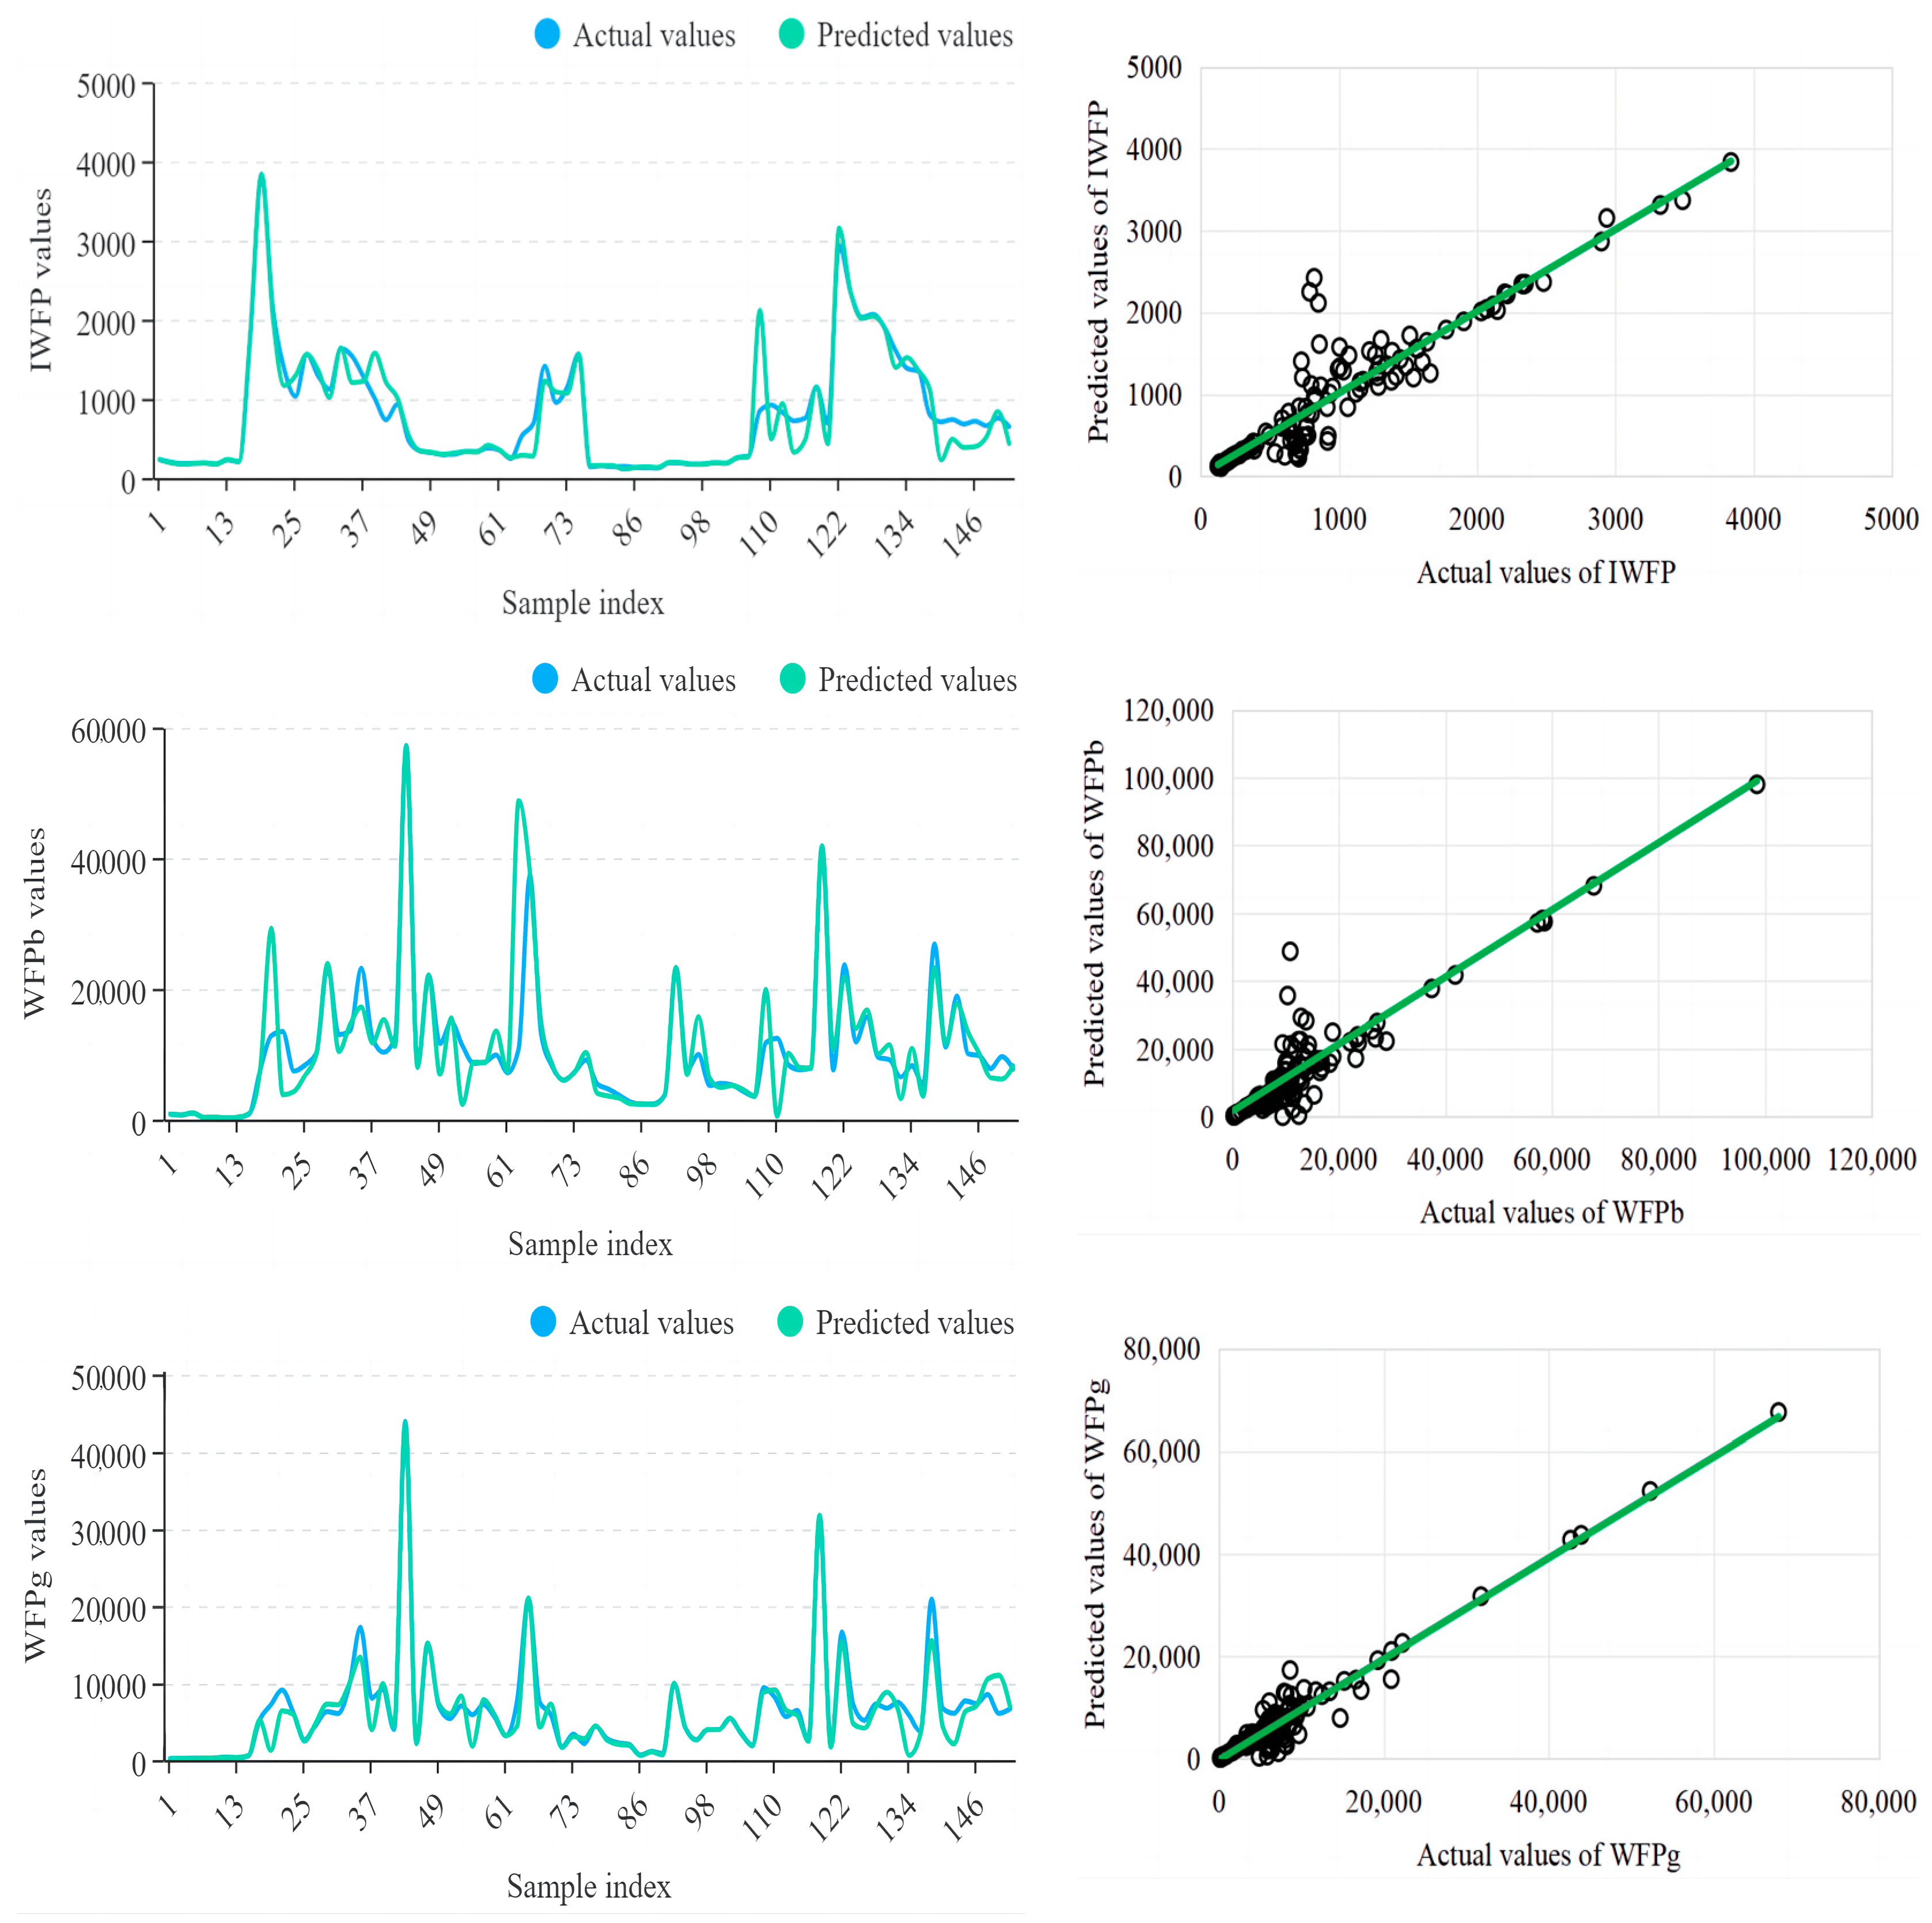
2.3.3. BPNN Model Performance

To ensure model stability and increase reliability, measures of the BPNN model performance were considered: the goodness of fit (R2), the root-mean-squared error (RMSE), and the mean absolute error (MAE). R2 measures the percentage of variation explained by the BPNN model, RMSE measures the overall accuracy of the prediction, and MAE measures how close the prediction is to observation.
The formula used to calculate the R2, RMSE, and MAE is as follows:
R 2 = 1 i   = 1 n Y actual Y predicted 2 i   = 1 n Y actual Y actual ¯ 2
RMSE = 1 n i   = 1 n Y actual Y predicted 2
MAE = 1 n i   = 1 n Y actual Y predicted
where Y predicted and Y actual are the predicted and actual crop production water footprint values; n is the number of samples; Y ¯ predicted   and Y ¯ actual are the means for the predicted and actual crop production water footprint values. A good model will have R2 close to 1 and RMSE and MAE of almost 0.

2.4. Data Source and Analysis

Meteorological data included monthly average maximum temperature, monthly average minimum temperature, monthly average temperature, average wind speed, relative humidity, sunshine hours, and precipitation in Taiyuan from 2005 to 2021, and the data were obtained from open access data, i.e., the China Meteorological Science Data Sharing Network (https://data.cma.cn/ accessed on 14 February 2023). Crop coefficients and fertility periods referred to the Irrigation Water Quotas for Major Crops in Northern Areas [40] and the database of the Food and Agriculture Organization of the United Nations (FAO). Shanxi Provincial Statistical Yearbook and Regional Statistical Yearbooks (2000–2021) obtained annual crop yield, unit area yield, and sown area data. Soil data were combined with local soil types from the FAO global database to find the soil information corresponding to this type. The maps in this study were prepared using ArcGIS 10.2 (Esri Redlands, CA, USA). Statistical analysis was prepared using Origin 2022 software. Influence factors were analyzed using the neuralnet package in R 4.1.3 (R Foundation for Statistical Computing, Vienna, Austria).

3. Results

3.1. Spatial and Temporal Variability in Crop Production in Taiyuan City

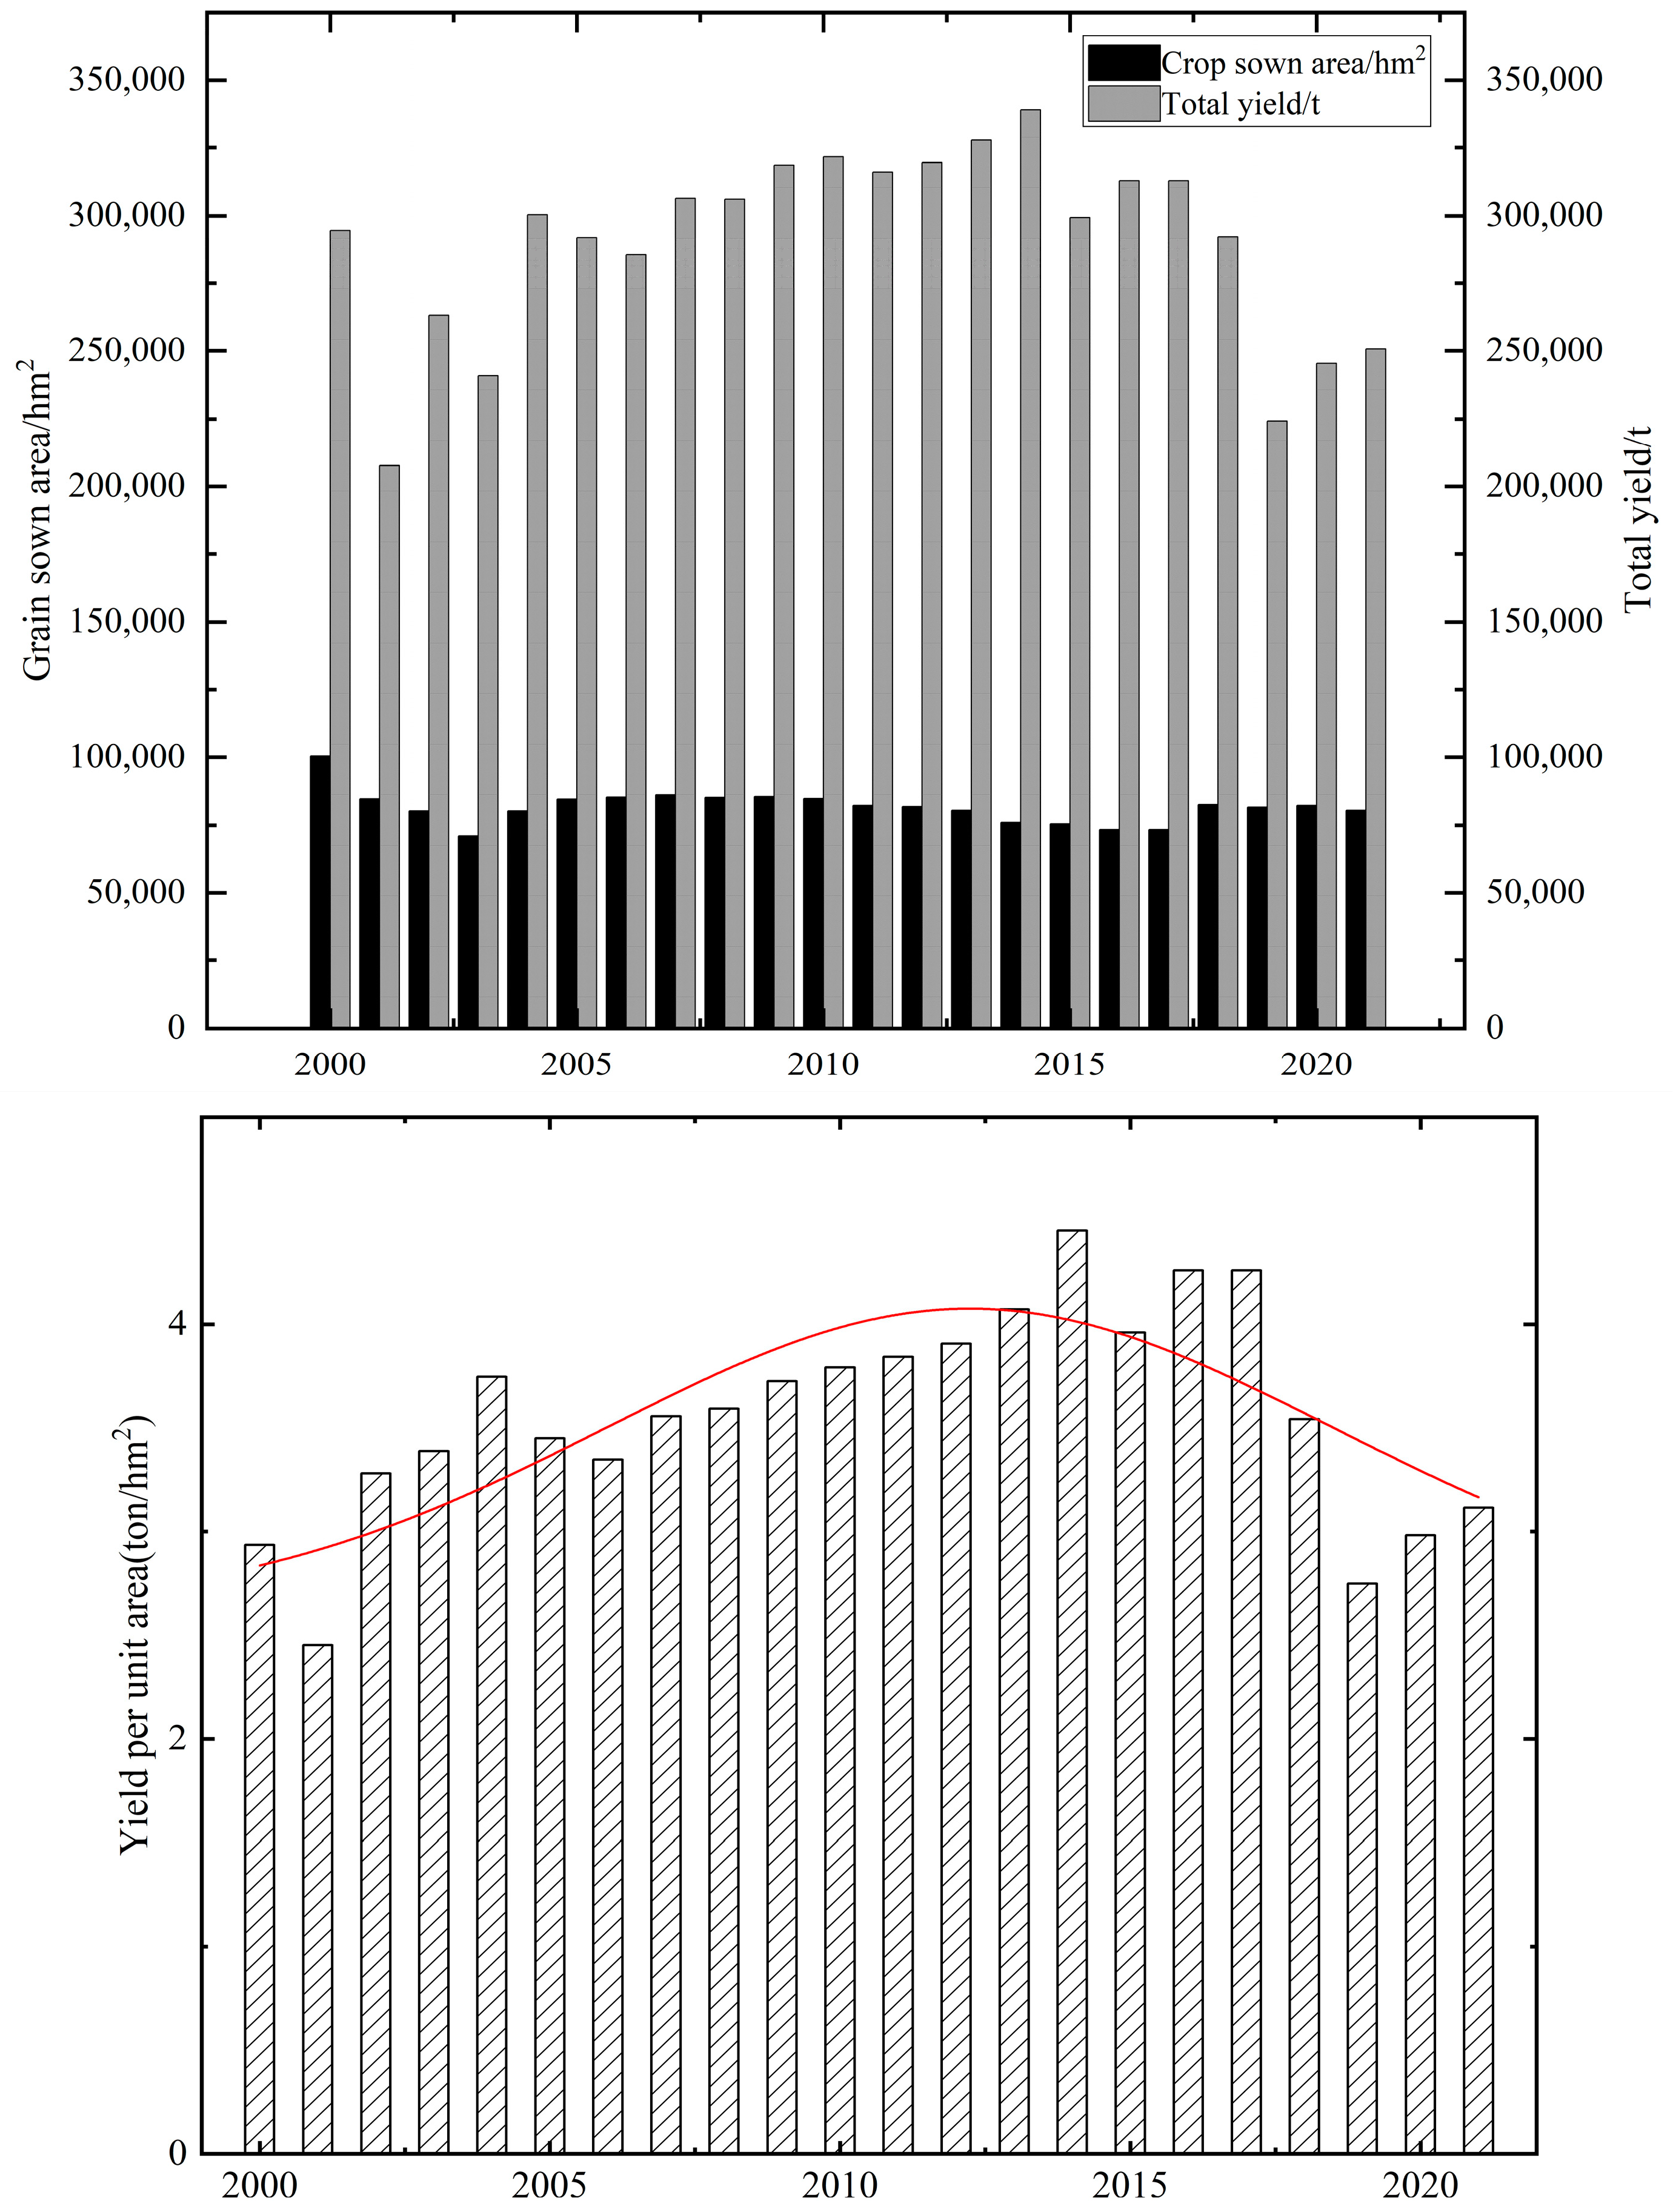
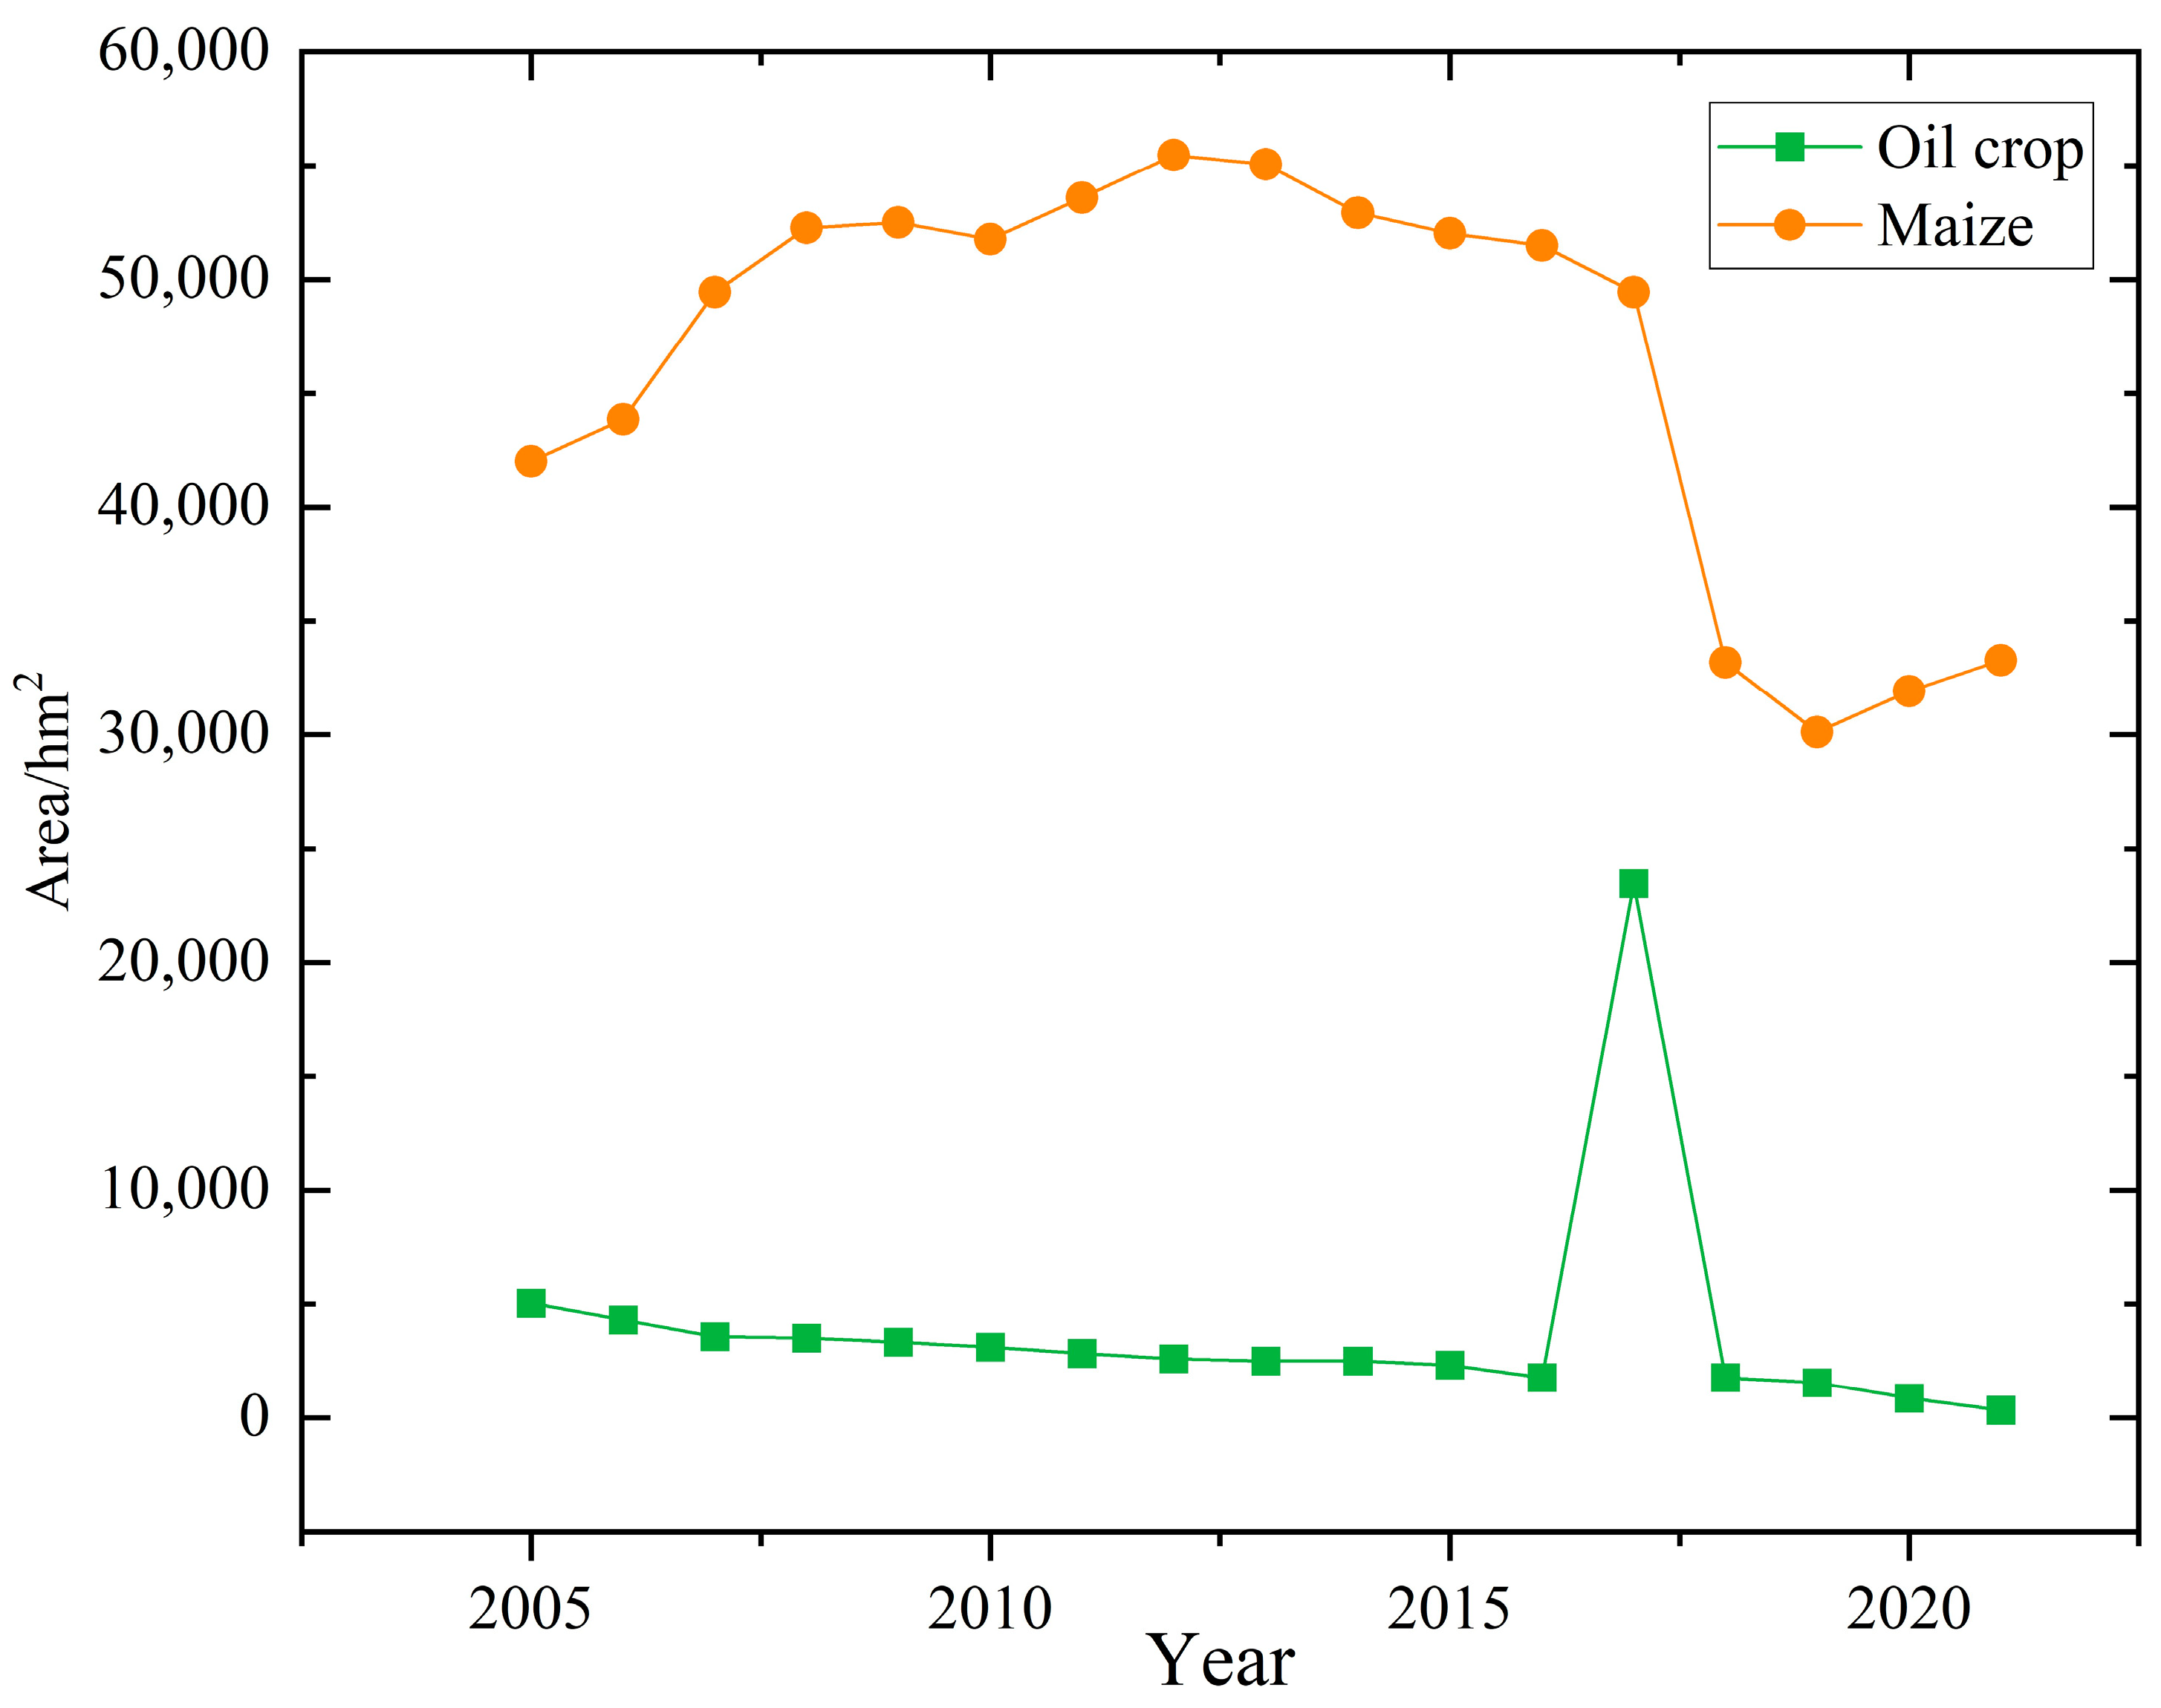
3.1.1. Characteristics of Crop Sown Area and Yield

From Figure 4, it was found that the crop sown area with an annual average value of 81,721.18 hm2 in Taiyuan City has not significantly changed from 2000 to 2021. The proportion of the crop sown area in Taiyuan City to that in Shanxi province was almost 3%. From 2000 to 2021, the total yield of crop production each year increased at first and then decreased, with an annual average value of 289,835.86 ton. The proportion of crop yield in Taiyuan City to that in Shanxi province showed an obvious decreasing trend, from 3.45% in 2000 to 1.65% in 2019. The crop yield per unit area in Taiyuan City also increased at first and then decreased with time. During 2000–2021, the mean annual value of crop yield per unit area was 3.56 ton/hm2.

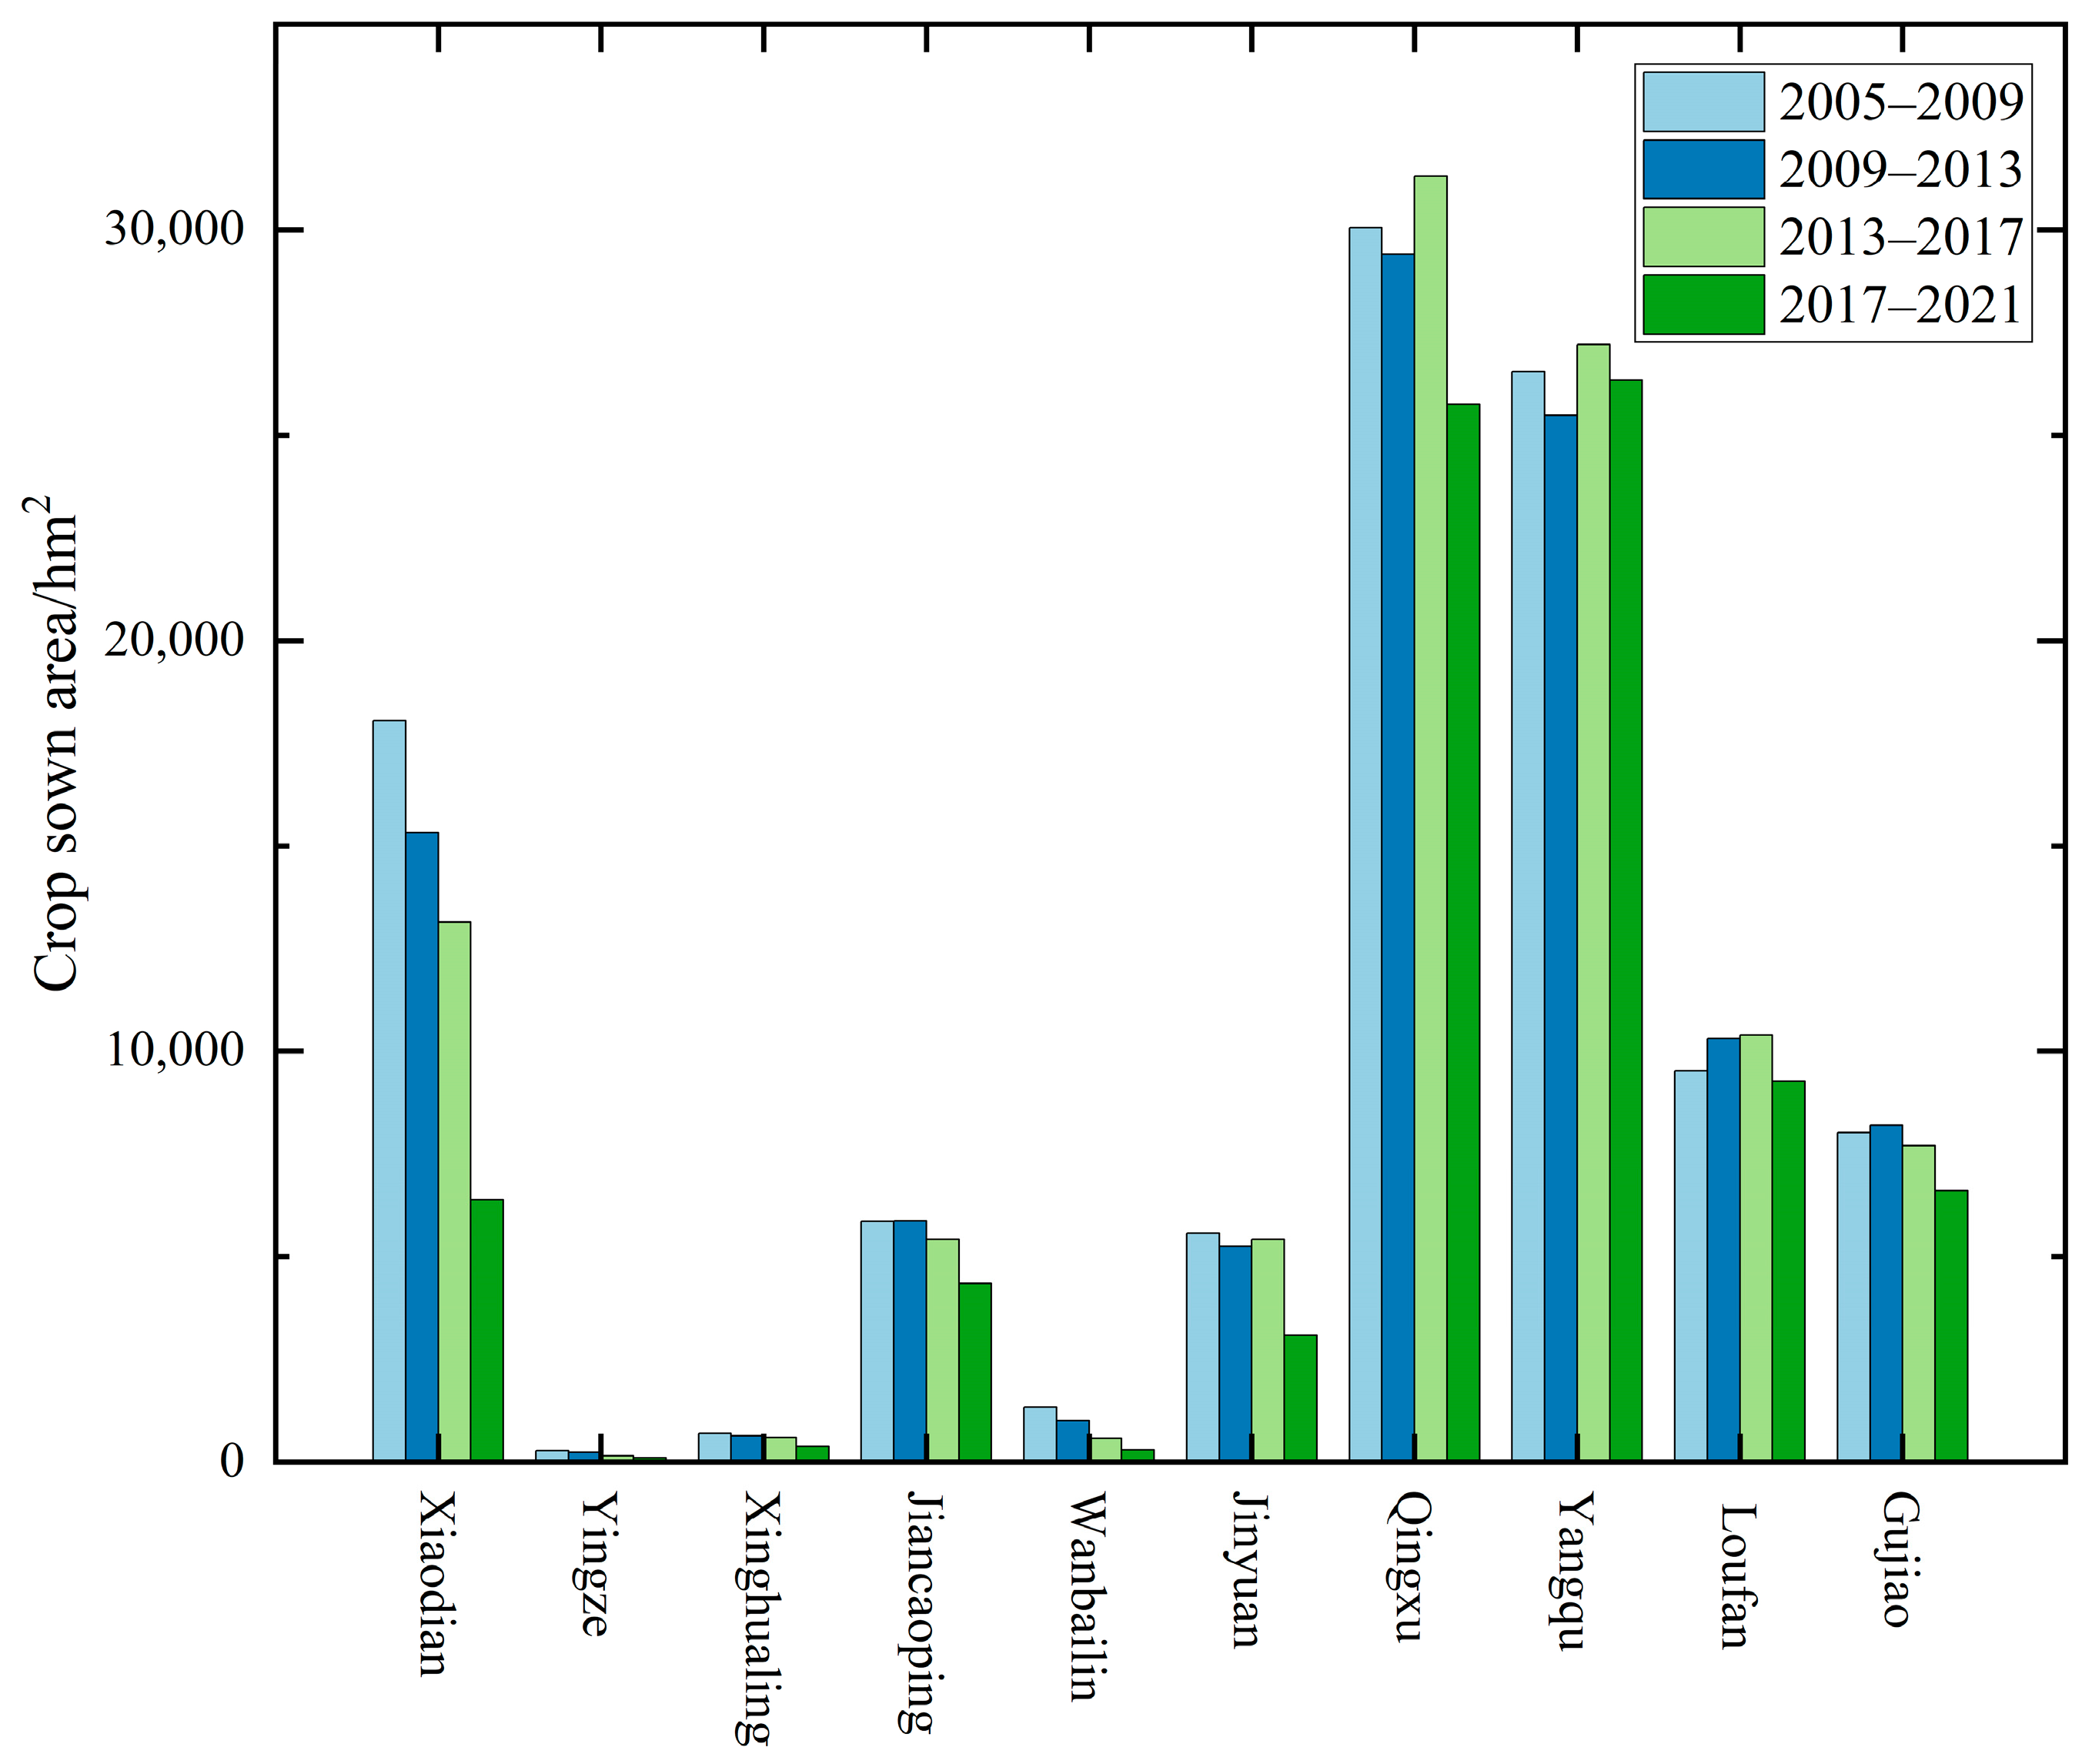
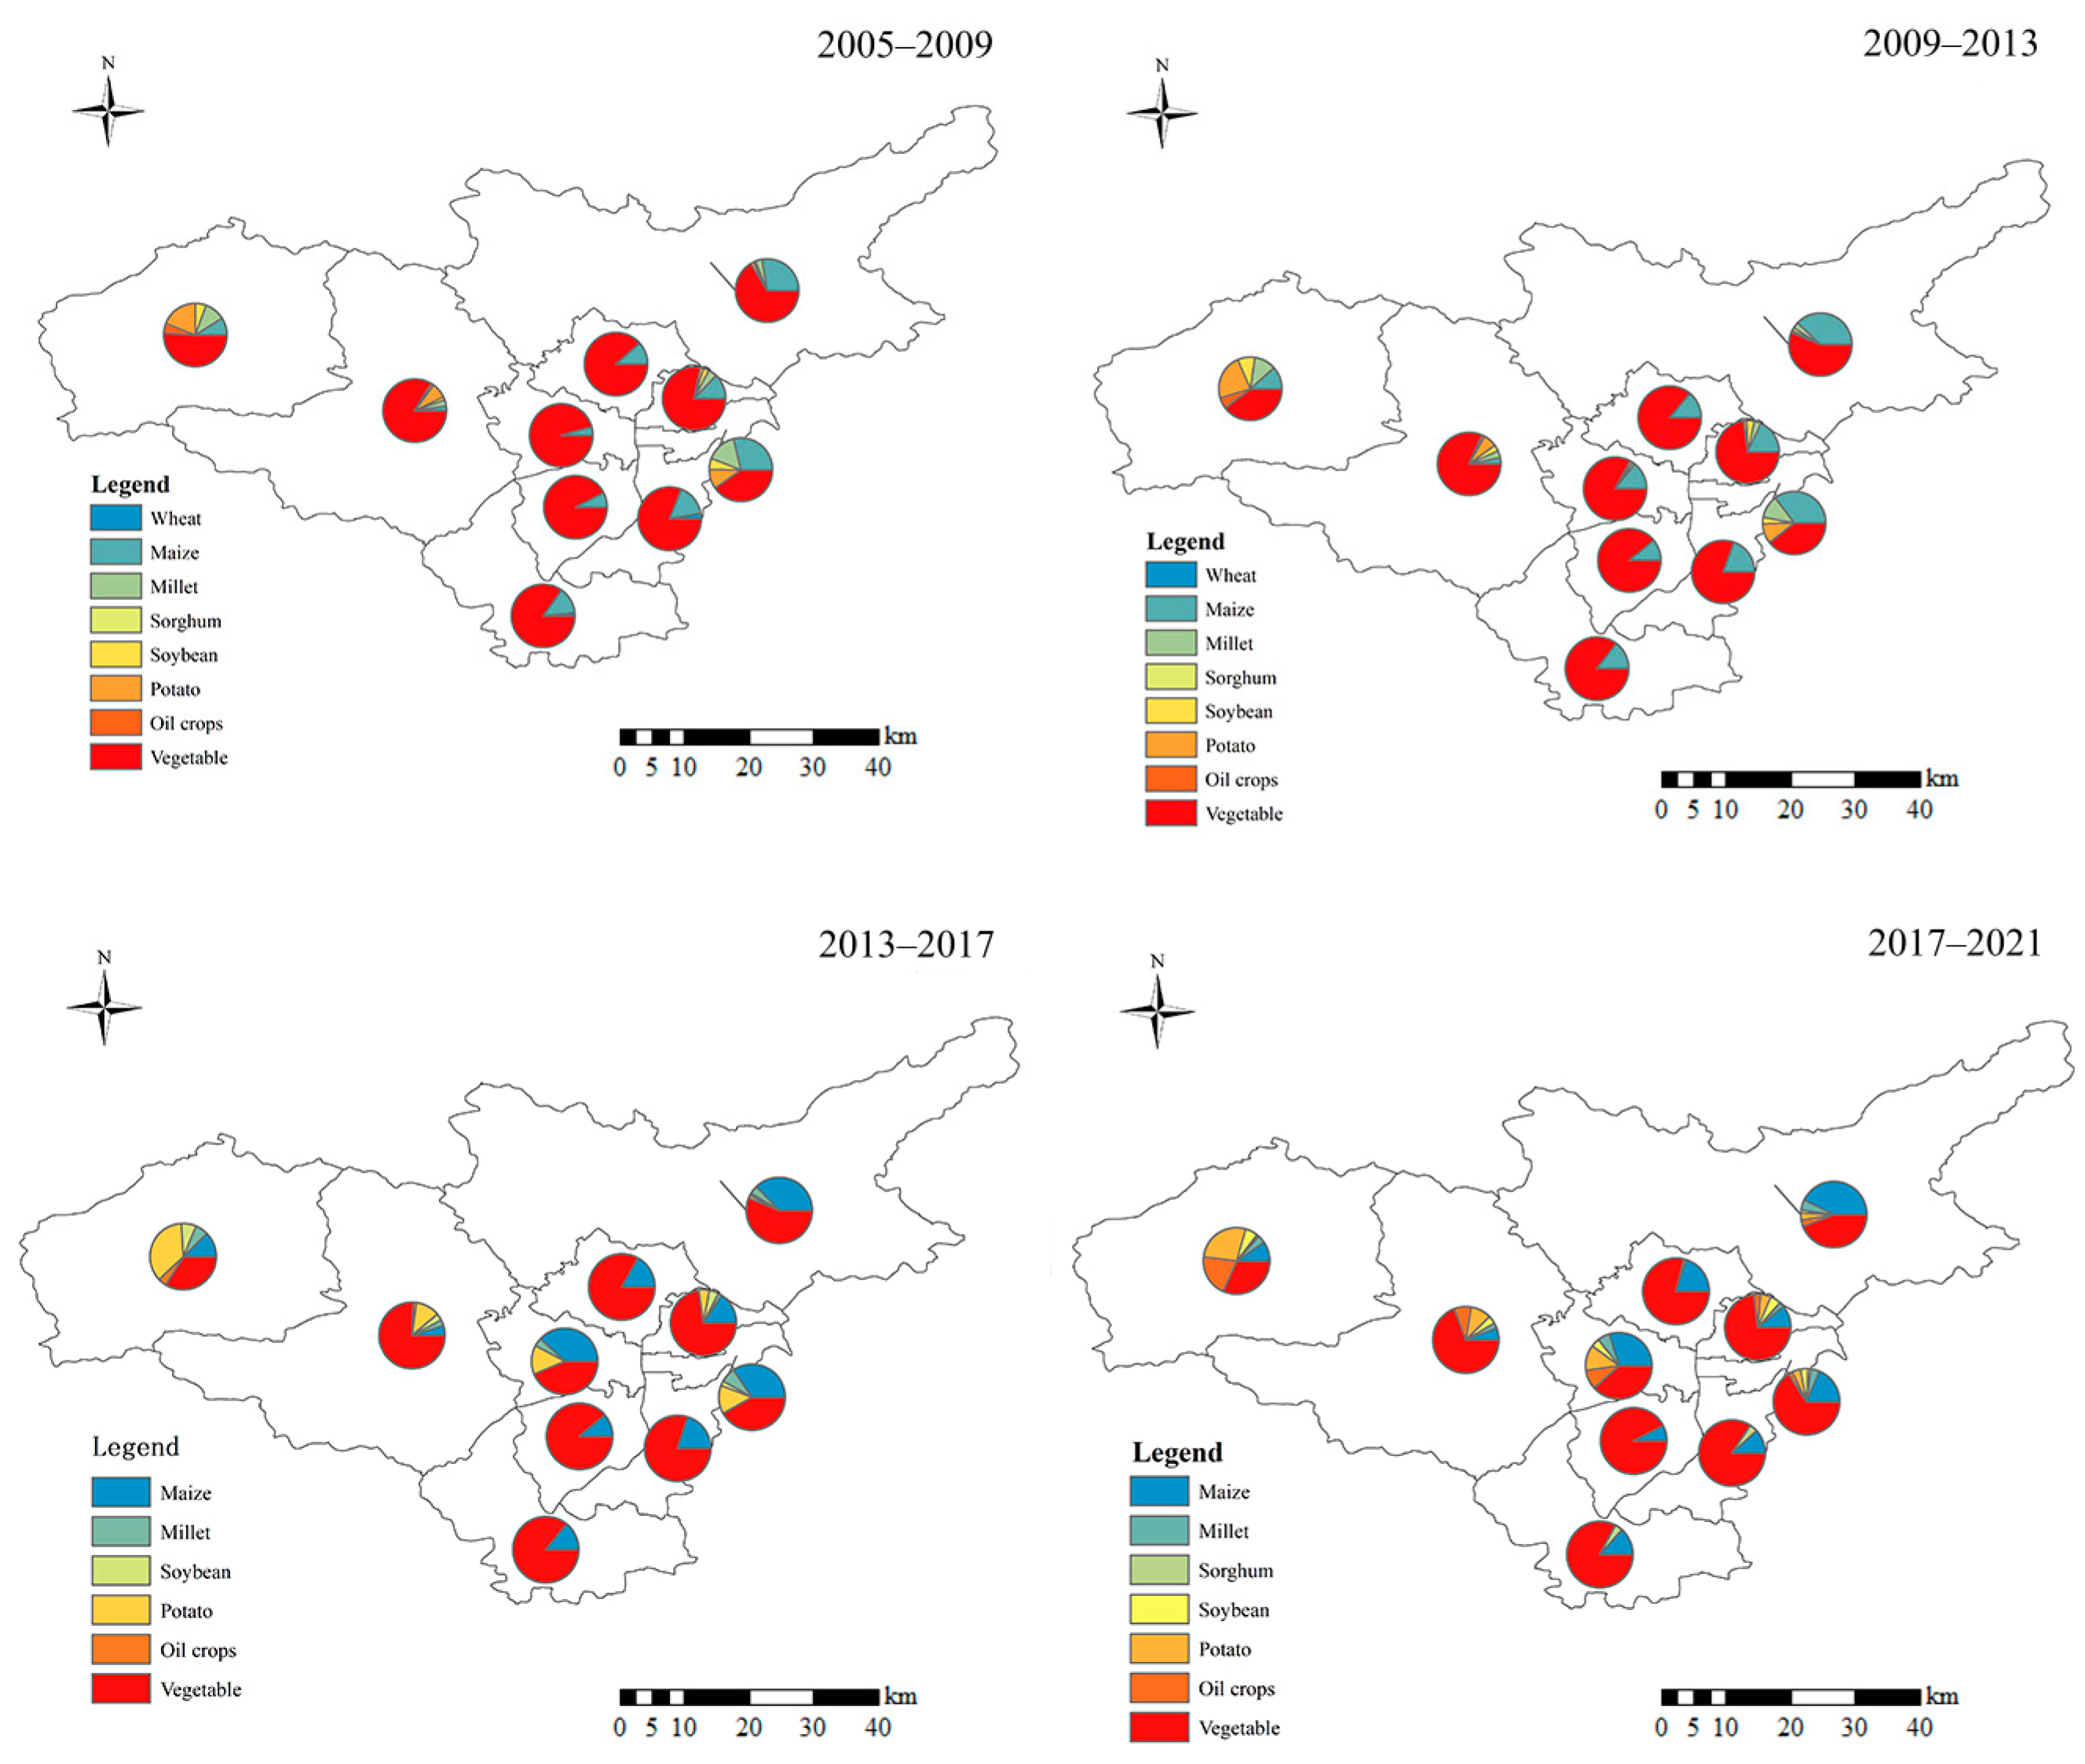
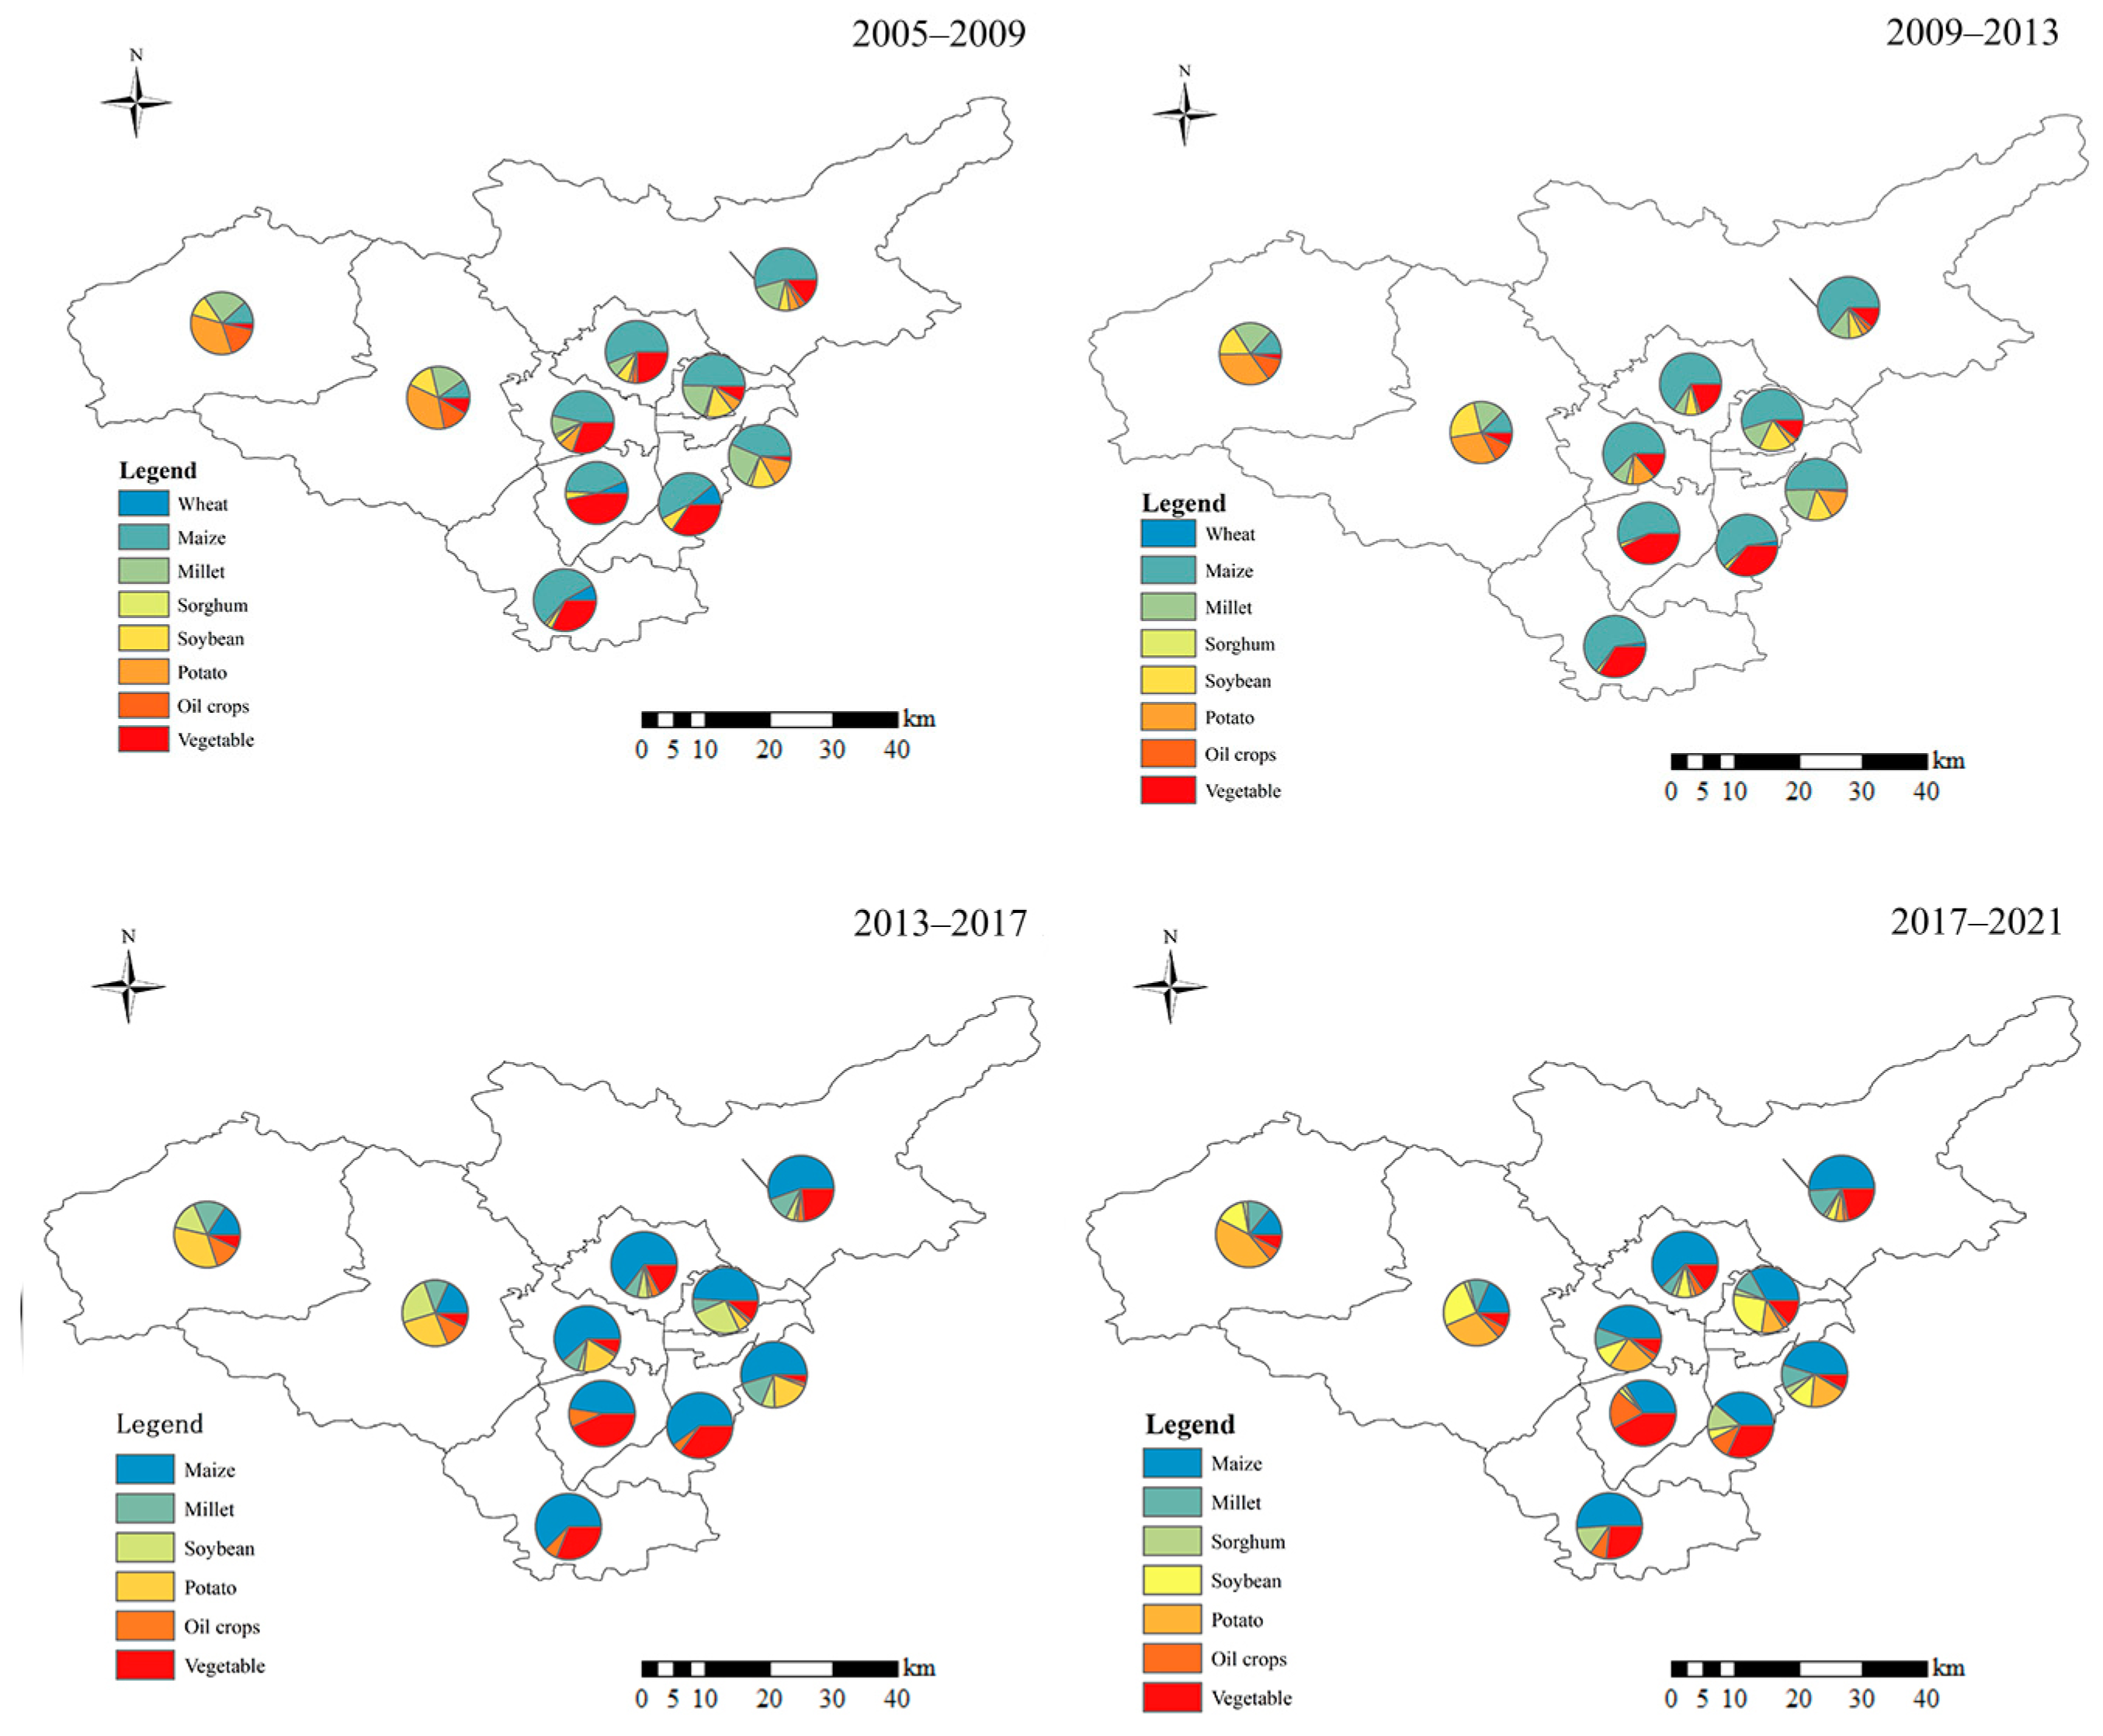
3.1.2. Characteristics of Crop Sown Area in Different Districts of Taiyuan City

From Figure 5, the larger crop sown areas were located in the north (Yangqu) and south (Qingxu) of Taiyuan City, while the smaller crop sown areas were located in the center (Yingze, Xinghualing, and Wanbailin) of Taiyuan City. From 2005 to 2021, Yingze was the region with the smallest crop sown area. From 2017 to 2021, Yangqu became the region with the largest sown area. The crop sown area showed a decreasing trend in all districts with time. The spatial distribution of sown area for different crops of each district is indicated in Figure 6. The sown area of wheat was smallest at 5816.46 hm2, while the sown area of maize was highest at 189,019.53 hm2. From the results analysis, the sown area of maize was highest all the time. However, the smallest sown area in Taiyuan City was from different kinds of crops in different periods. For example, the sown area of sorghum was smallest in 2005–2009, while it was smallest for wheat, soybean, and oilseed crops in 2009–2013, 2013–2017, and 2017–2021, respectively. In the west (Loufan and Gujiao) of Taiyuan City, they mainly planted potatoes and soybeans, and the proportion of the sown areas of potatoes and soybeans to the total sown areas was more than 50%.

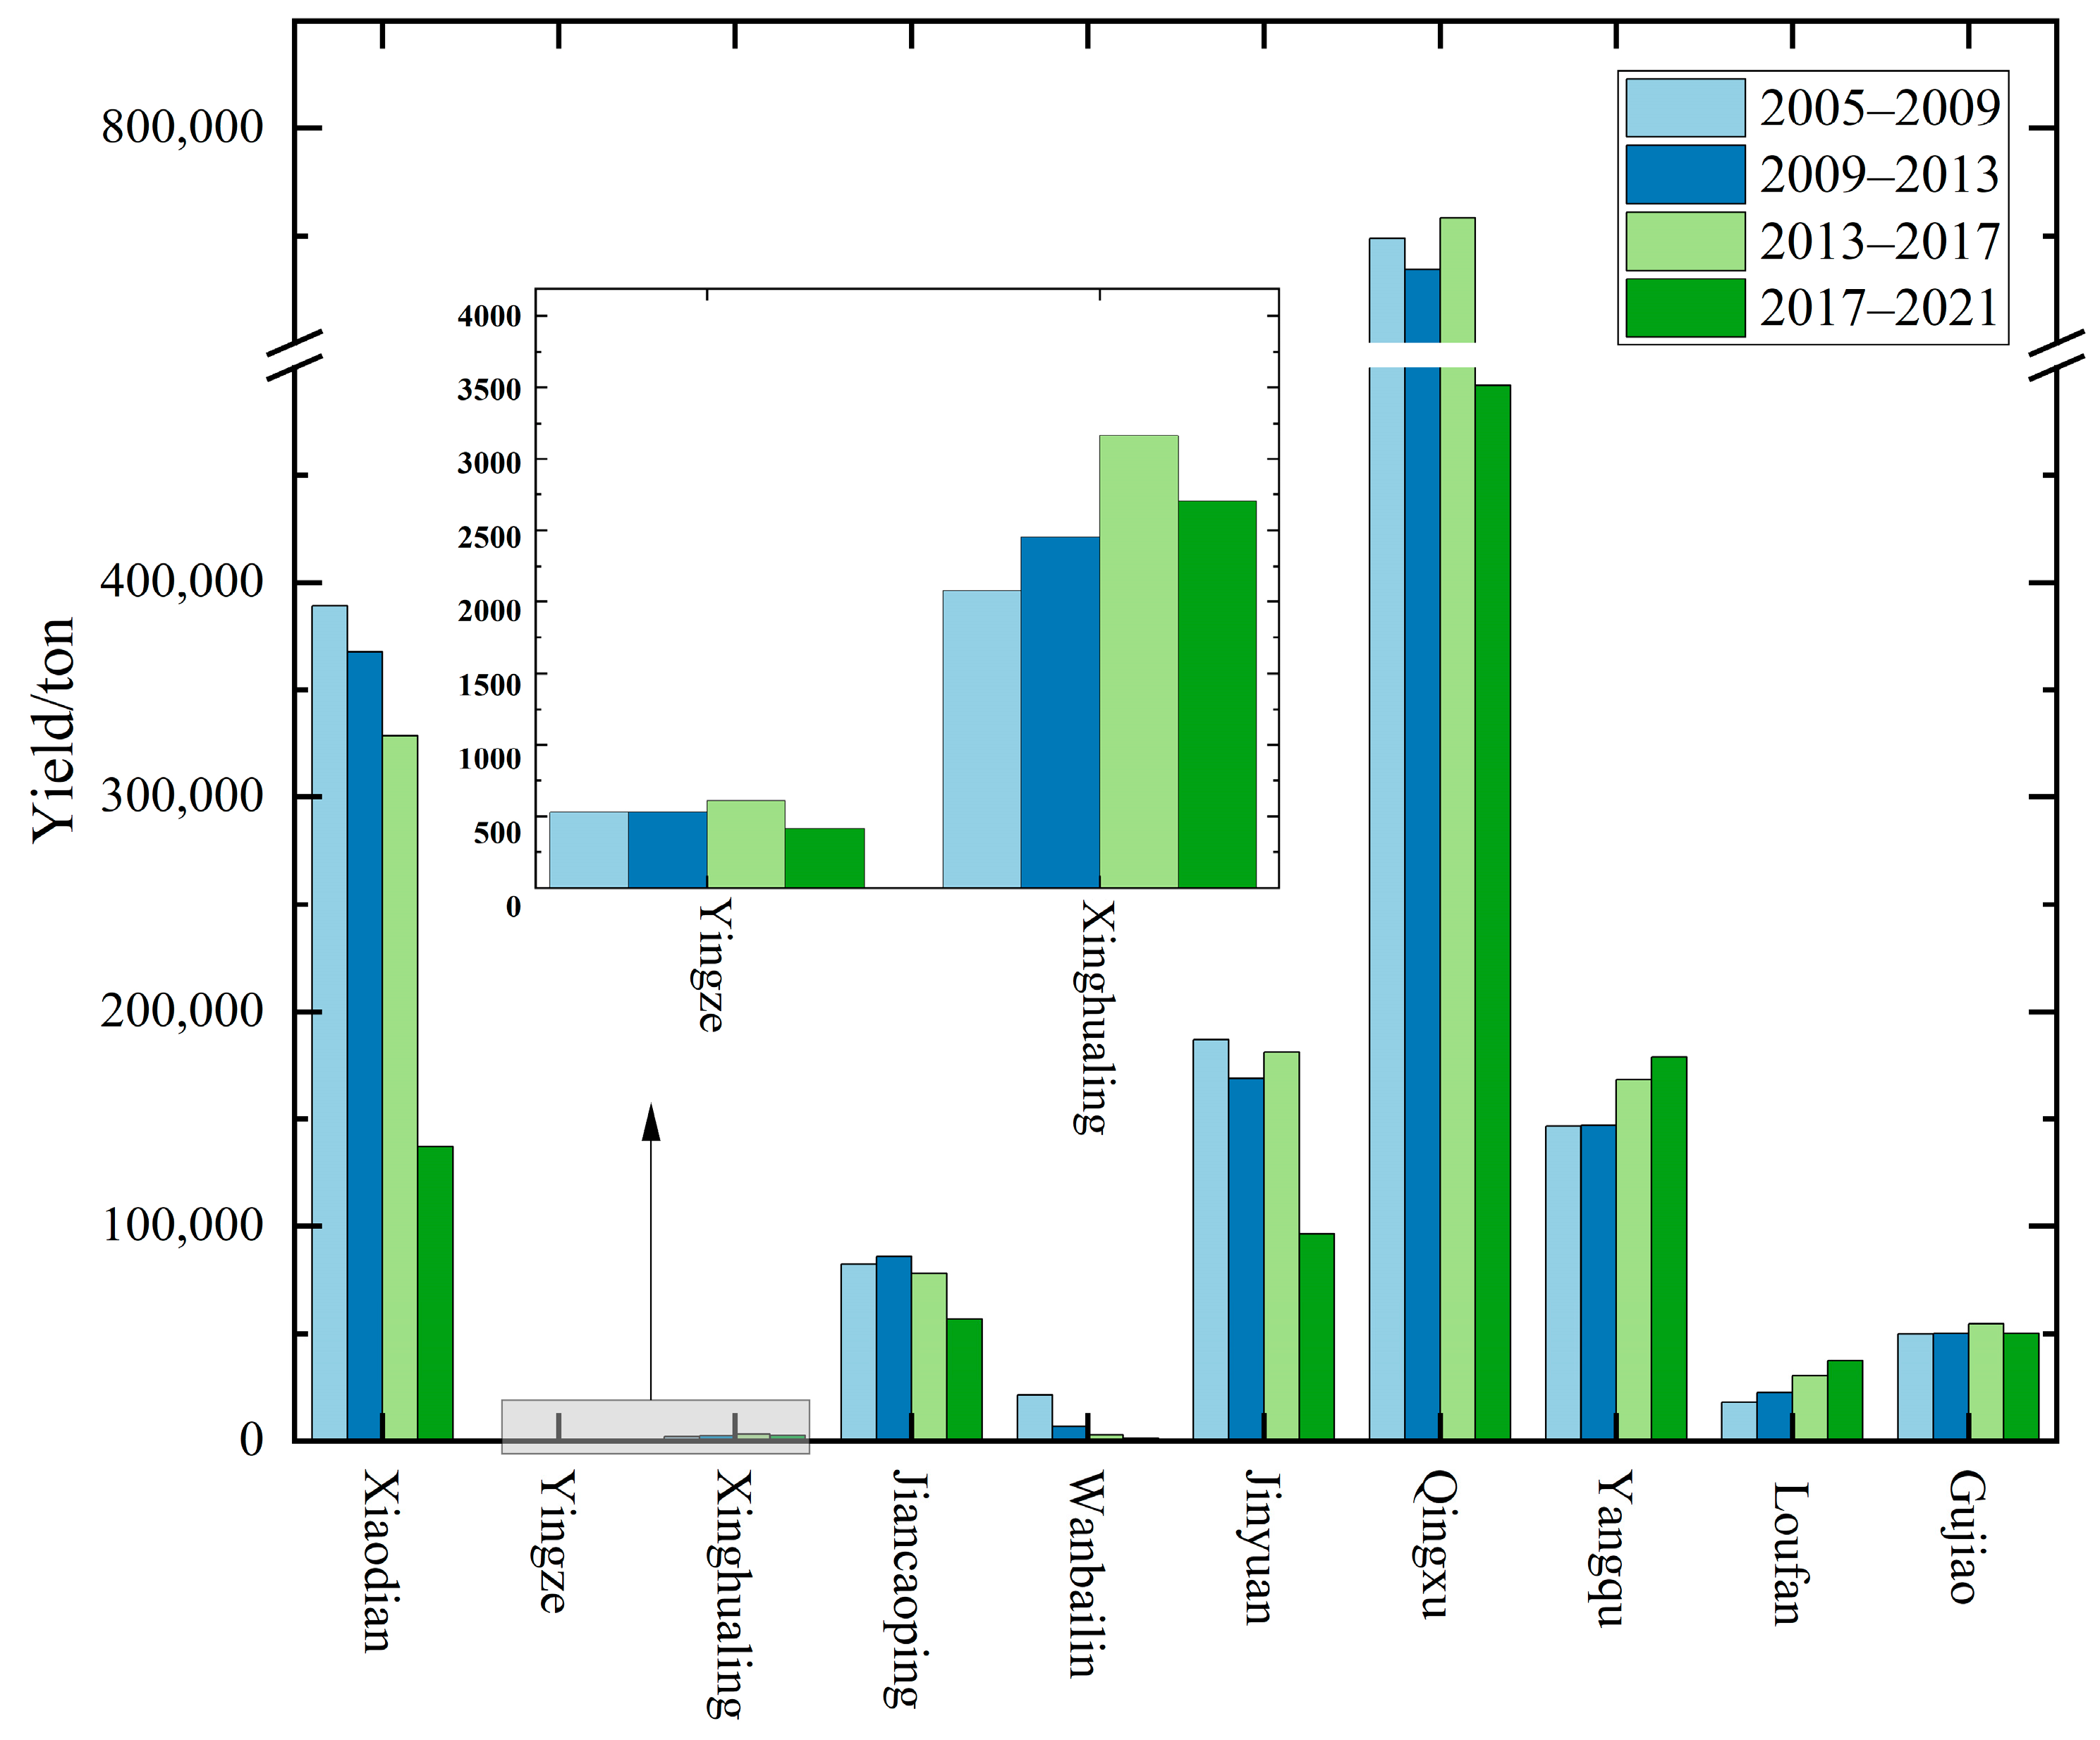
3.1.3. Characteristics of Crop Yield Changes in Different Districts of Taiyuan City

From Figure 7, the crop yield of Yangqu and Loufan gradually increased with time. The crop yield of Gujiao was more stable in recent years. The other districts showed a decreasing trend in crop yield with time. From 2005 to 2009, 2009 to 2013, 2013 to 2017, and 2017 to 2021, Qingxu had the highest crop yield of 74.89 × 10⁴ ton, 73.44 × 10⁴ ton, 75.83 × 10⁴ ton, and 49.19 × 10⁴ ton, respectively, whereas Yingze had the lowest crop yield of 527.85 ton, 528.82 ton, 605.00 ton, and 416.20 ton, respectively.
From Figure 8, vegetables accounted for the highest yield of 470.16 × 10⁴ ton, followed by maize with 96.16 × 10⁴ ton. Oilseed crops accounted for the lowest yield of 2.65 × 10⁴ ton, and the yield of wheat crops was slightly higher at 2.83 × 10⁴ ton. From 2005 to 2009, vegetables had the highest yield of 135.55 × 10⁴ ton accounting for 75.6% of the total crop yield. The highest yield of grain was maize with 23.12 × 10⁴ ton, while the lowest was oil crops (2703.05 ton). From 2009 to 2013, vegetables still had the highest yield of 127.82 × 10⁴ ton, while the lowest yield of sorghum was 2786.26 ton. The yield of wheat decreased significantly from 2.38 × 10⁴ ton over the period of 2005–2009 to 4508.66 ton over the period of 2009–2013, a decrease of 81.0%. From 2013 to 2017, the yield of wheat and sorghum declined quickly compared with the previous two periods. Other crops remained relatively stable from 2013 to 2017 compared with that from 2005 to 2009. From 2017 to 2021, the proportion of the yield of vegetables accounting for the total crop yield decreased remarkably, while the proportion of other crops increased compared with the previous periods. However, vegetables and maize still accounted for the highest yield, and soybeans accounted for the lowest.

3.2. Spatial and Temporal Characteristics of the Water Footprint of Crop Production

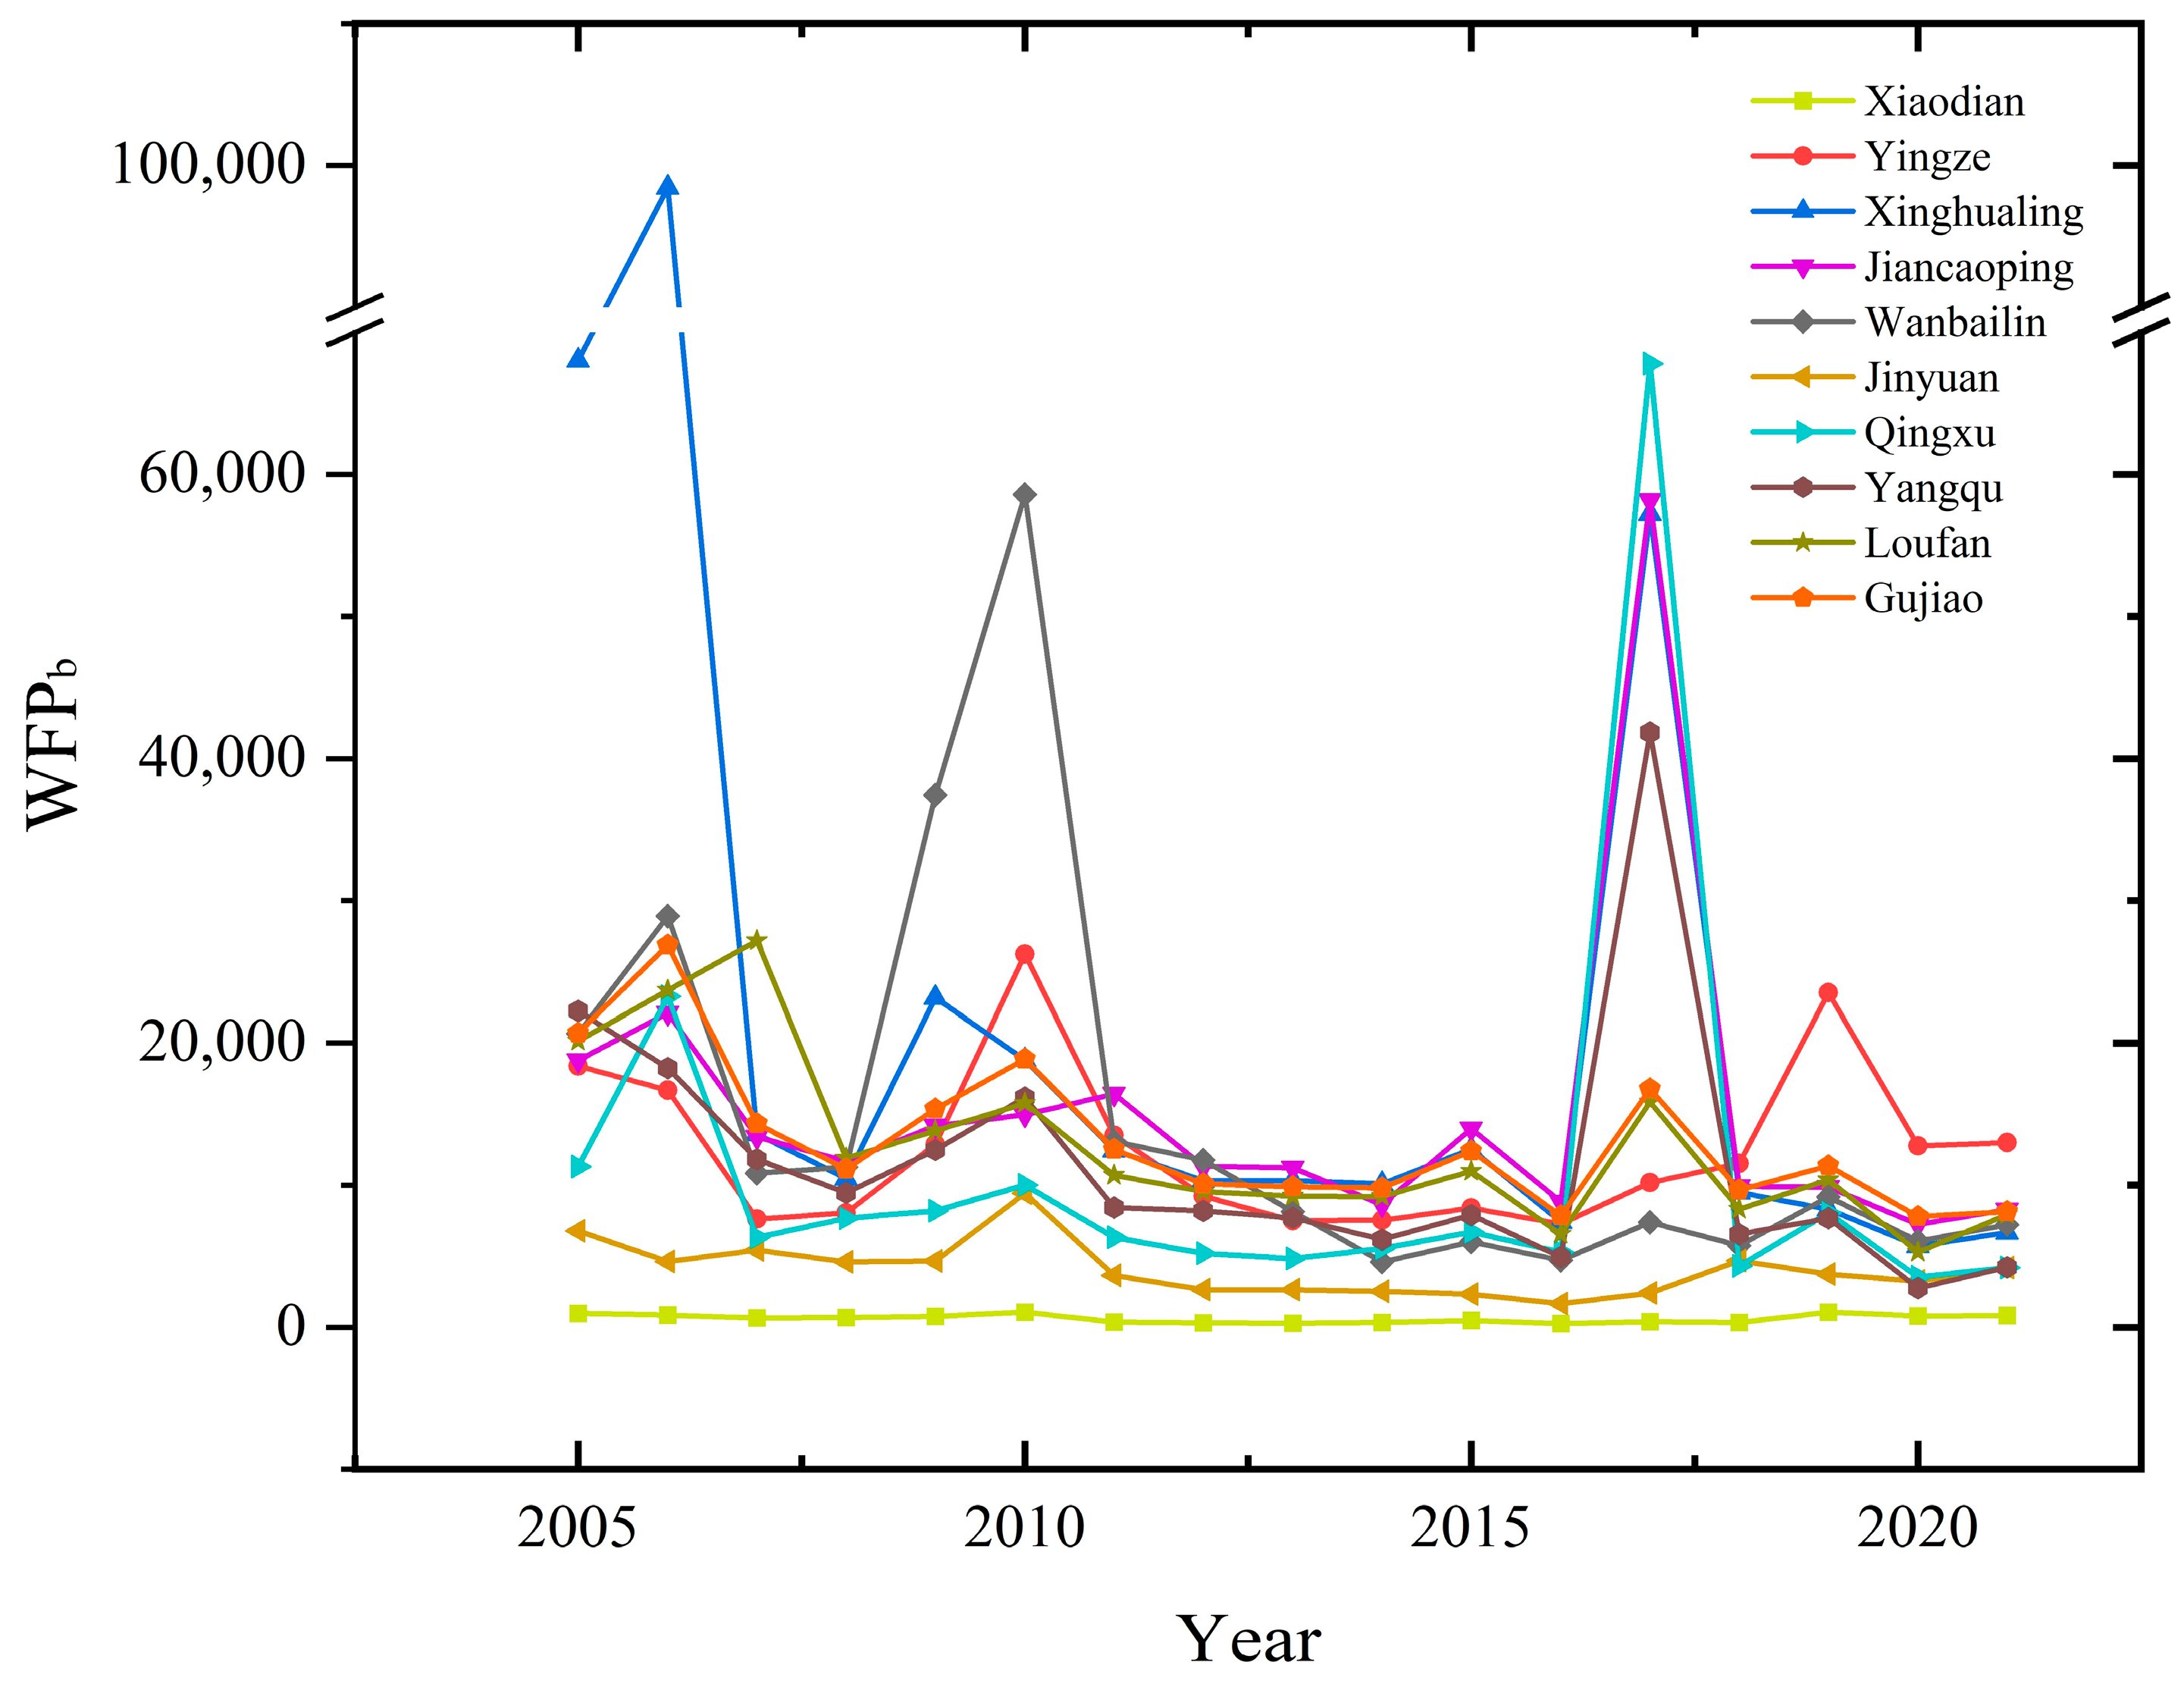
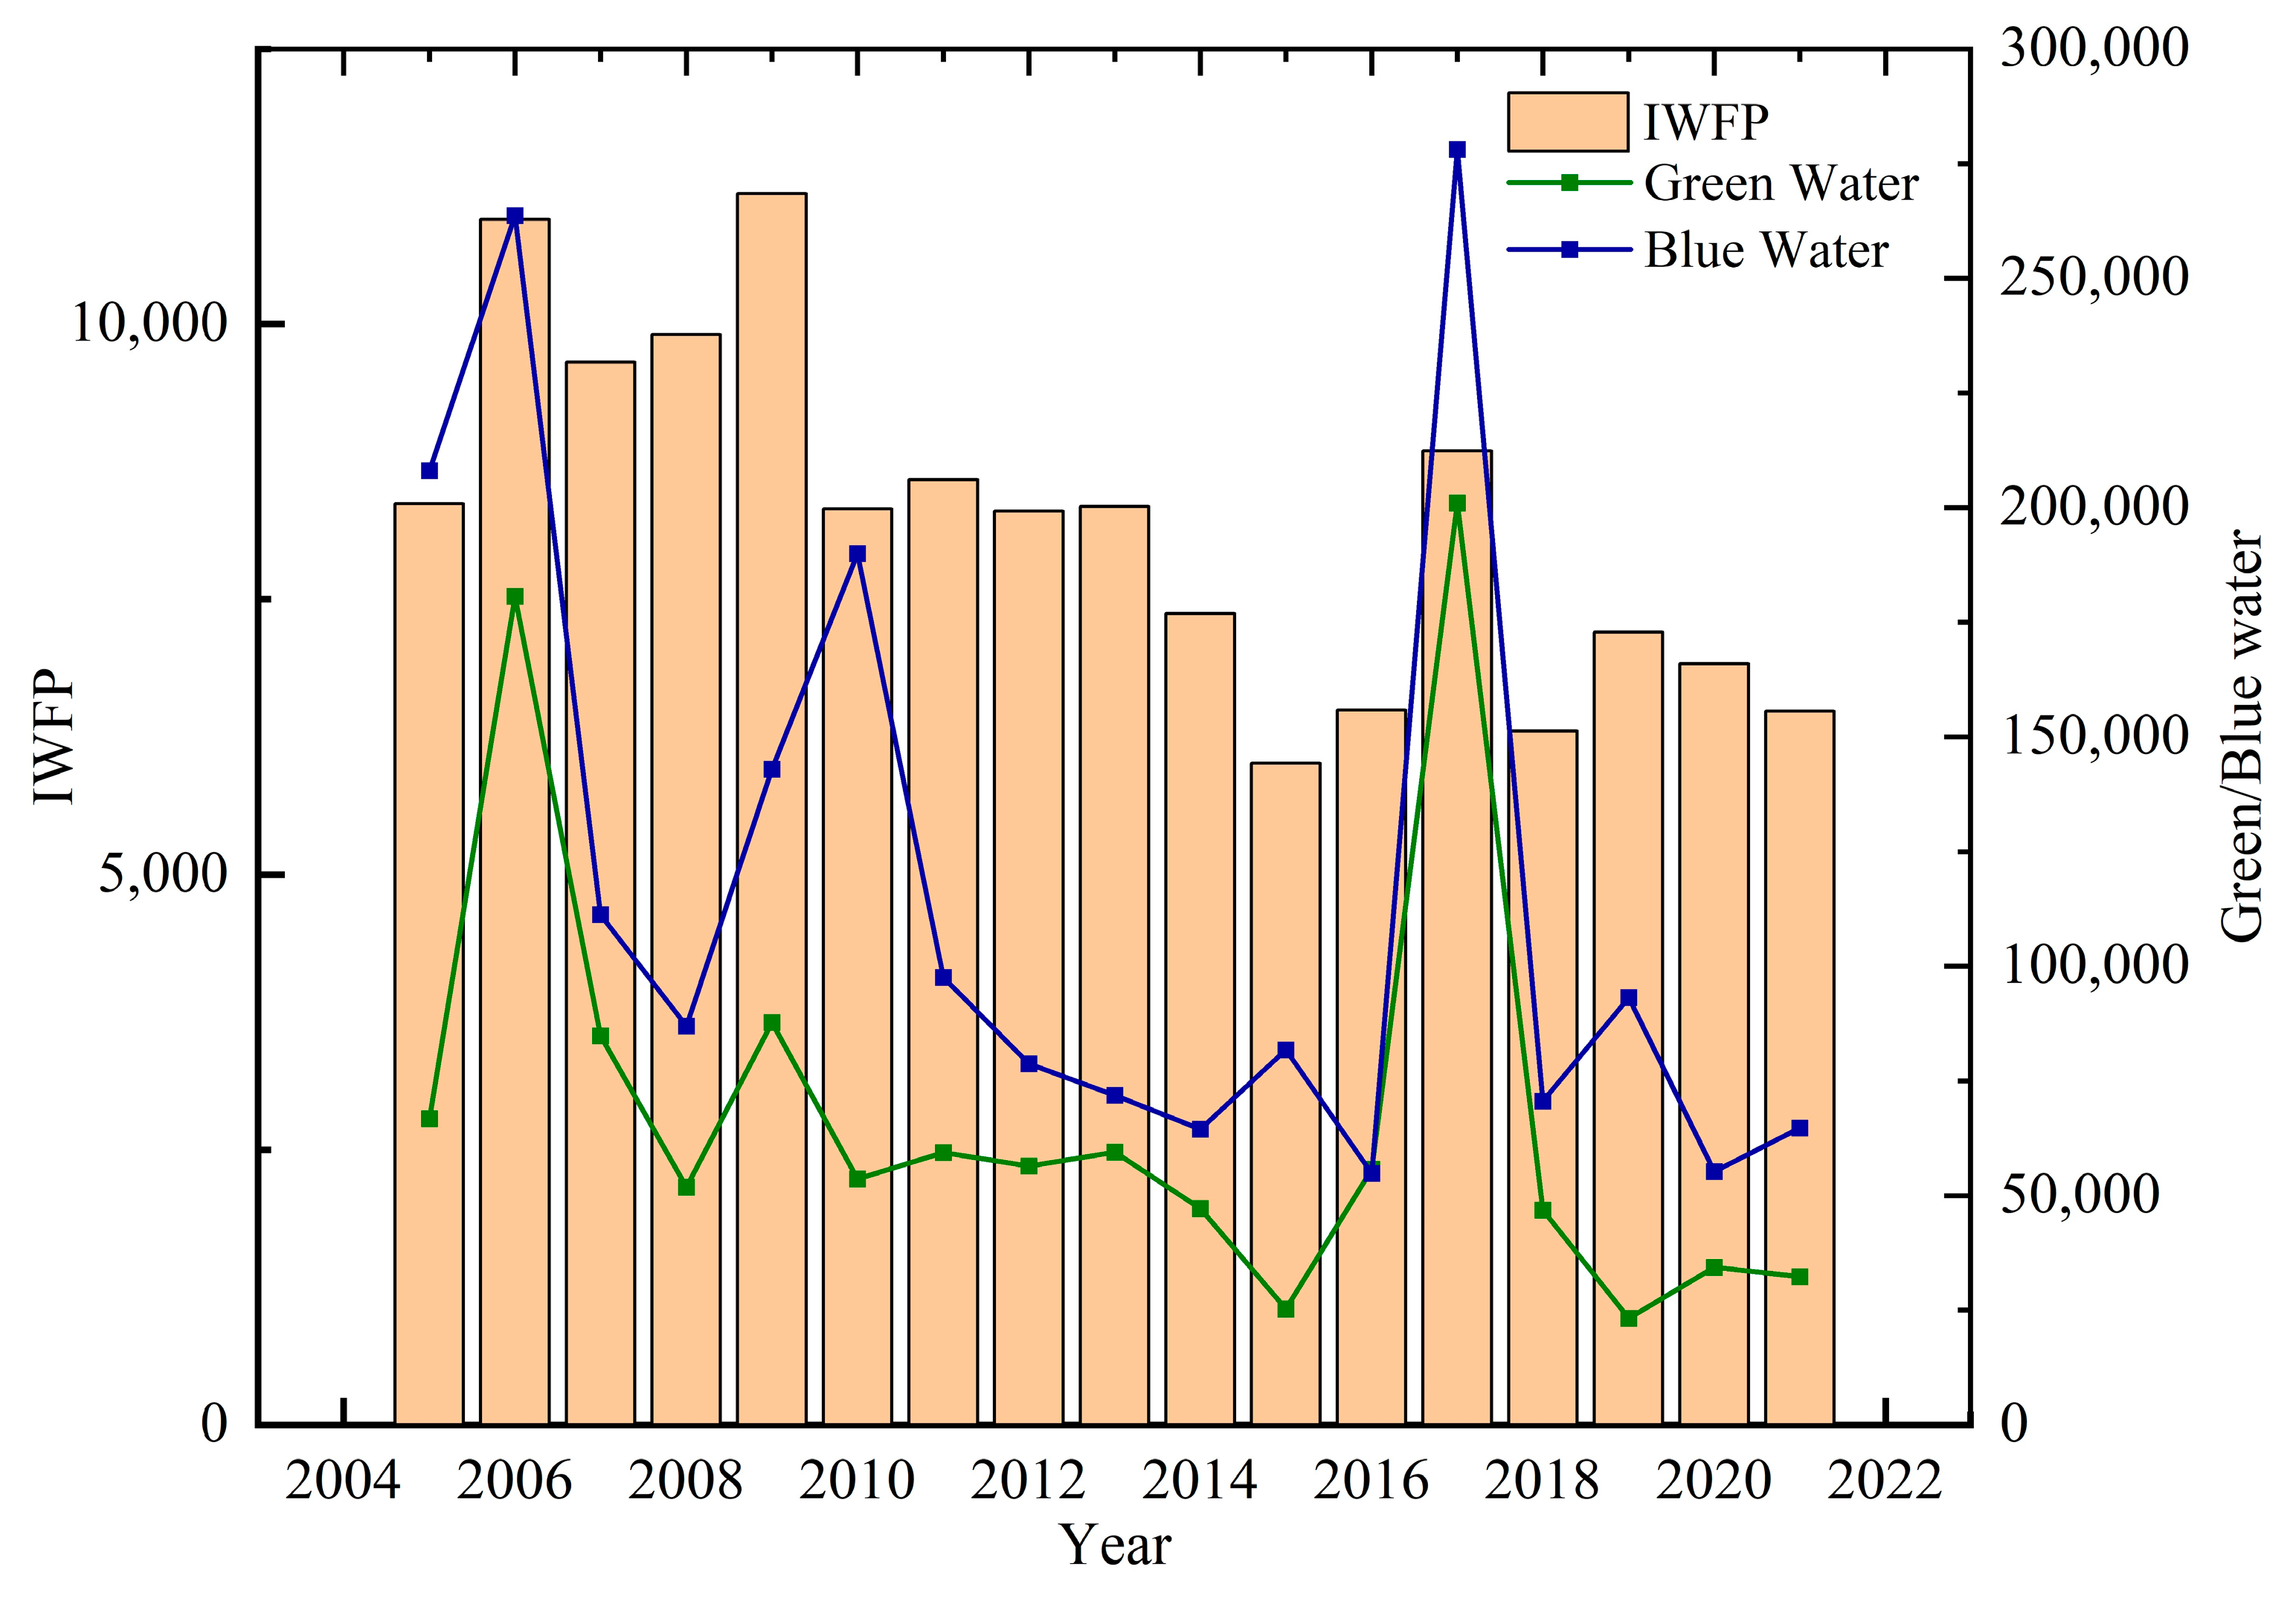
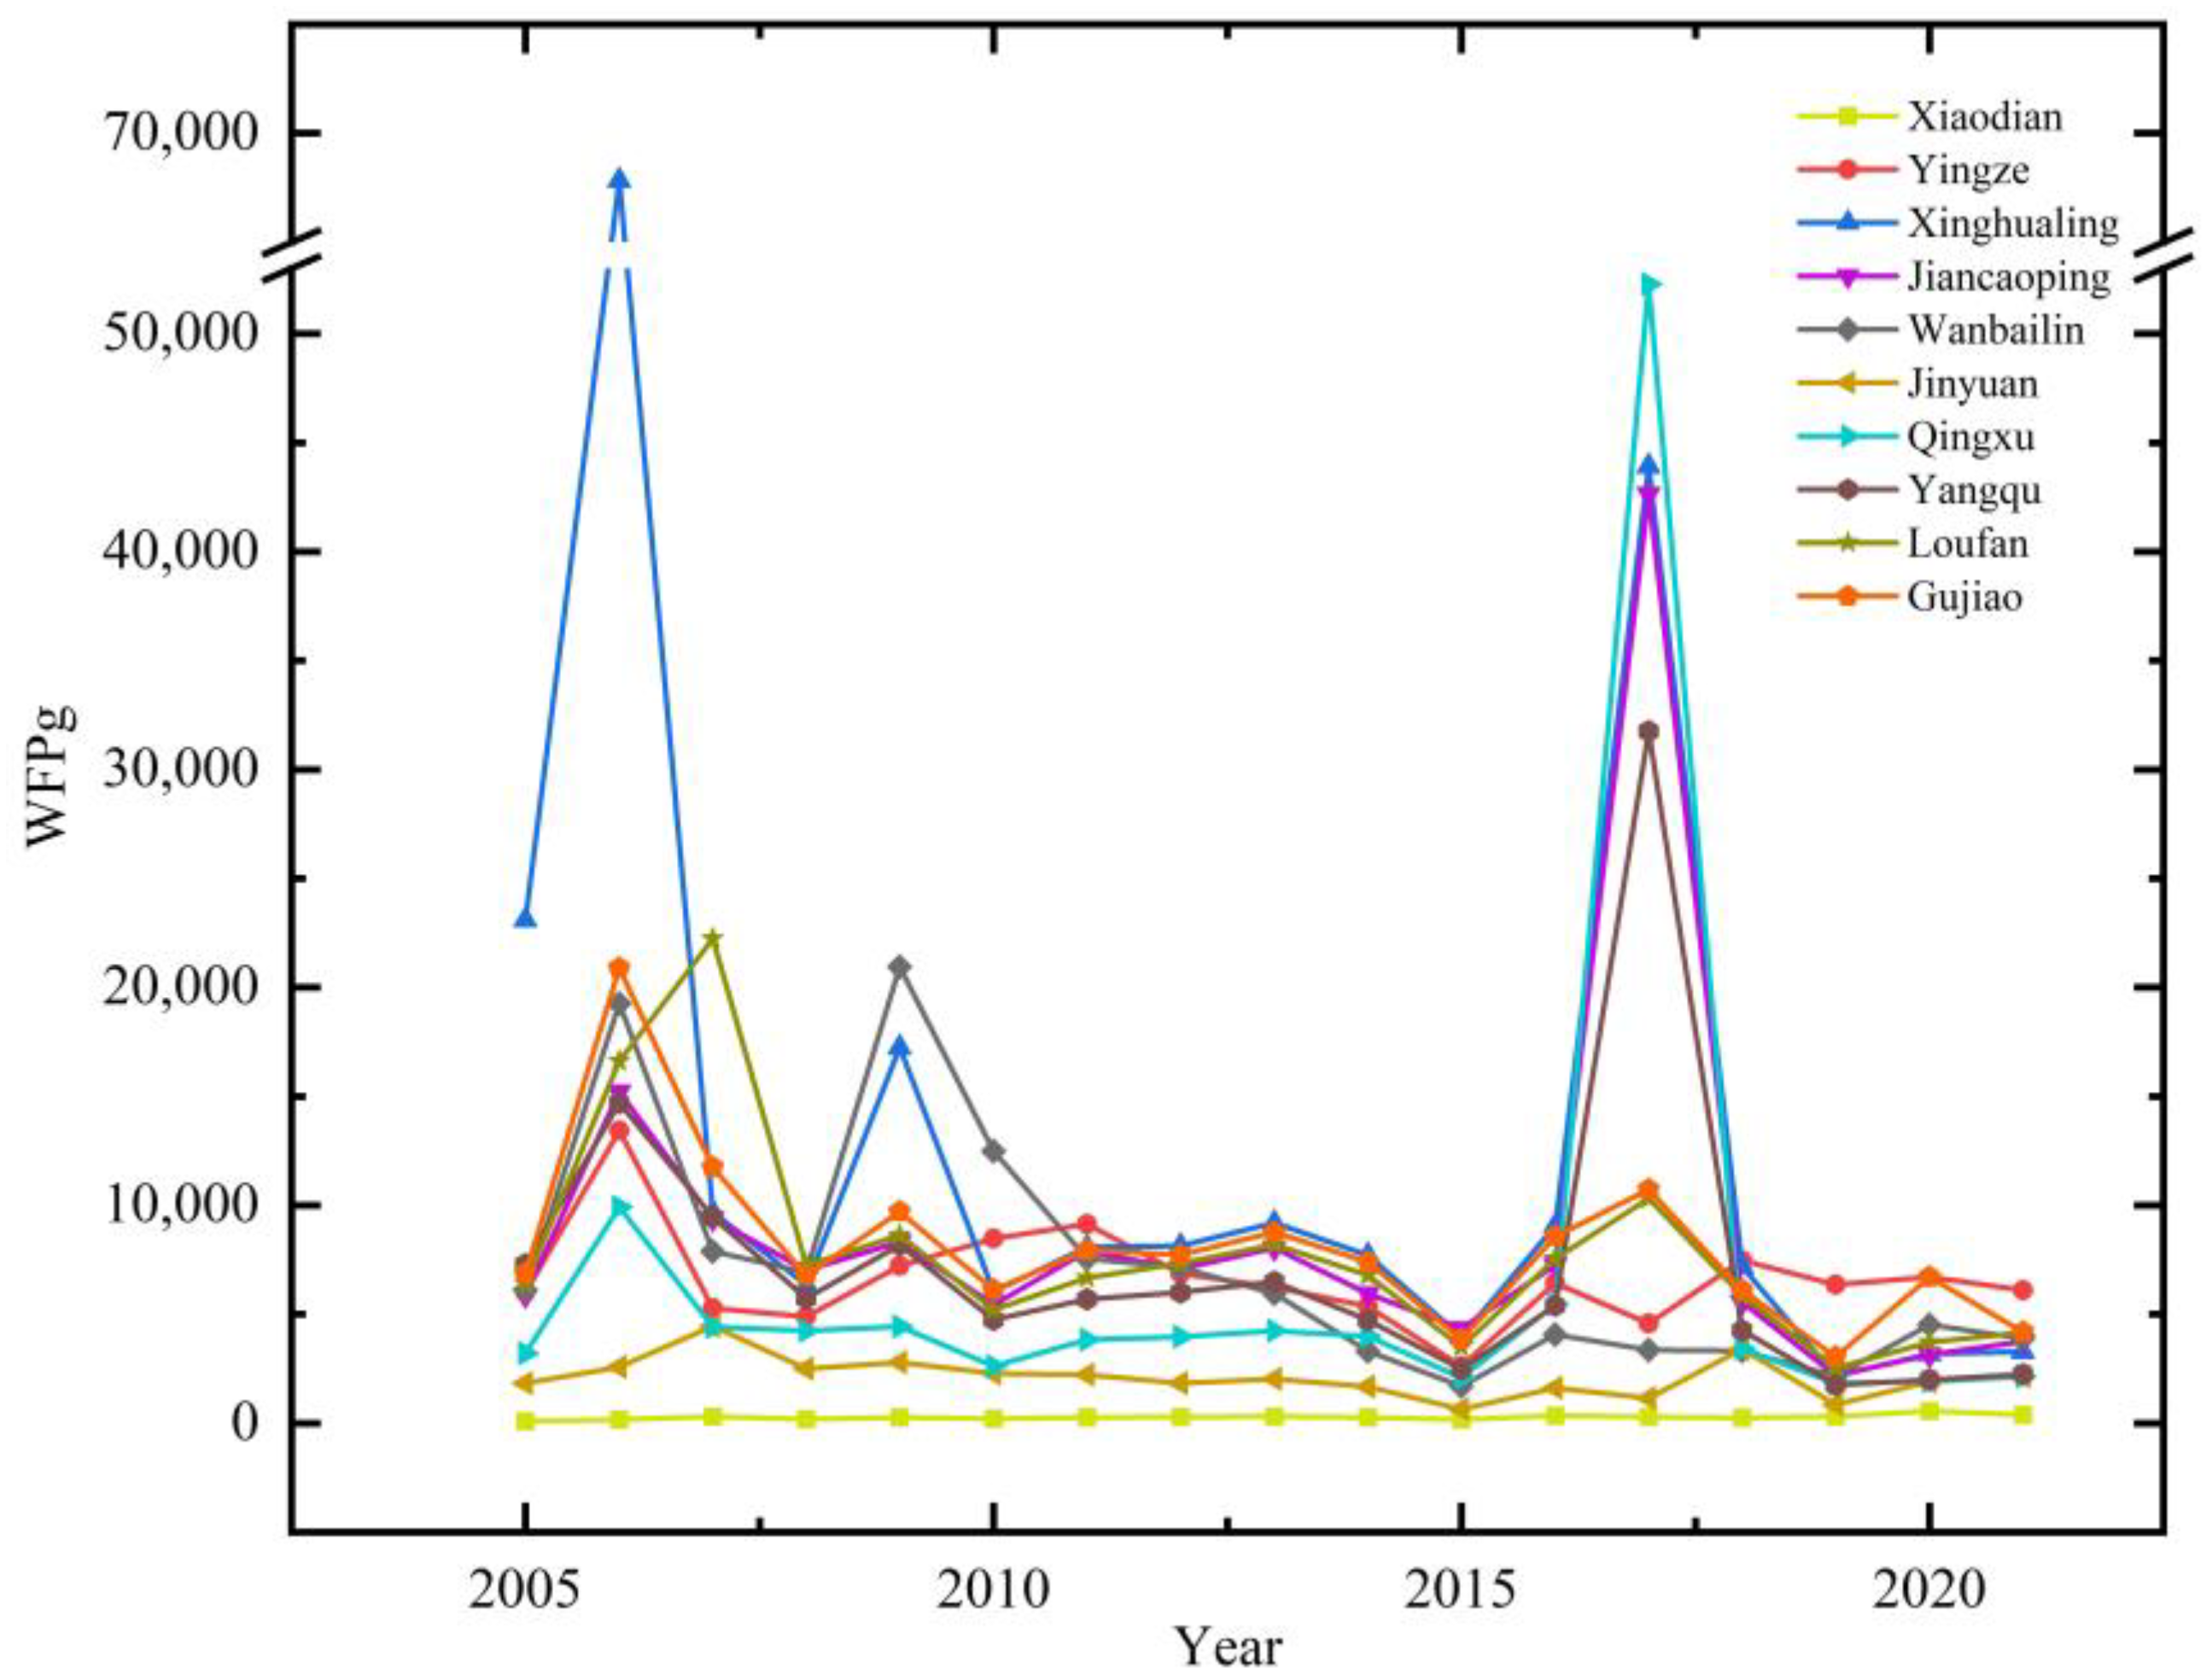
3.2.1. The Characteristics of Blue and Green Water Footprint

The changes in blue and green water footprint with time showed great fluctuations in some districts of Taiyuan City, such as Qingxu, Jiancaoping, Xinghualing, and Yangqu (Figure 9). As expected in Xinghualing, the blue and green water footprint was 98,439.11 m3/kg and 67,839.14 m3/kg, respectively, in 2006, and then declined to 13,605.26 m3/kg and 9685.80 m3/kg, respectively. Both the blue and green water footprint gradually decreased from 2005, peaked again in 2010 and 2017, and started to decline in those regions. The blue and green water footprint in Xiaodian remained relatively stable over time. Figure 10 shows the relationship between the BPNN-predicted crop water footprint, i.e., IWFP, WFPb, and WFPg, and the actual data. We noticed that there is a low deviation between the predicted and the actual crop water footprint values. The BPNN model produced high predicted results. For IWFP, the actual values varied from 122.13 to 3835.83 m3/kg, while the predicted values varied from 112.26 to 3839.33 m3/kg. The actual versus predicted IWFP values were found to have an R2 of 0.993, RMSE of 0.078, and MAE of 0.052. For WFPb, the actual values varied from 259.18 to 98,439.11 m3/kg, while the predicted values varied from 274.84 to 98,067.21 m3/kg. The model had an R2 of 0.992, RMSE of 0.090, and MAE of 0.058. For WFPg, the actual values varied from 166.55 to 67,839.14 m3/kg, while the predicted values varied from 162.83 to 67,605.57 m3/kg. It was found that the model had an R2 of 0.991, RMSE of 0.094, and MAE of 0.059.

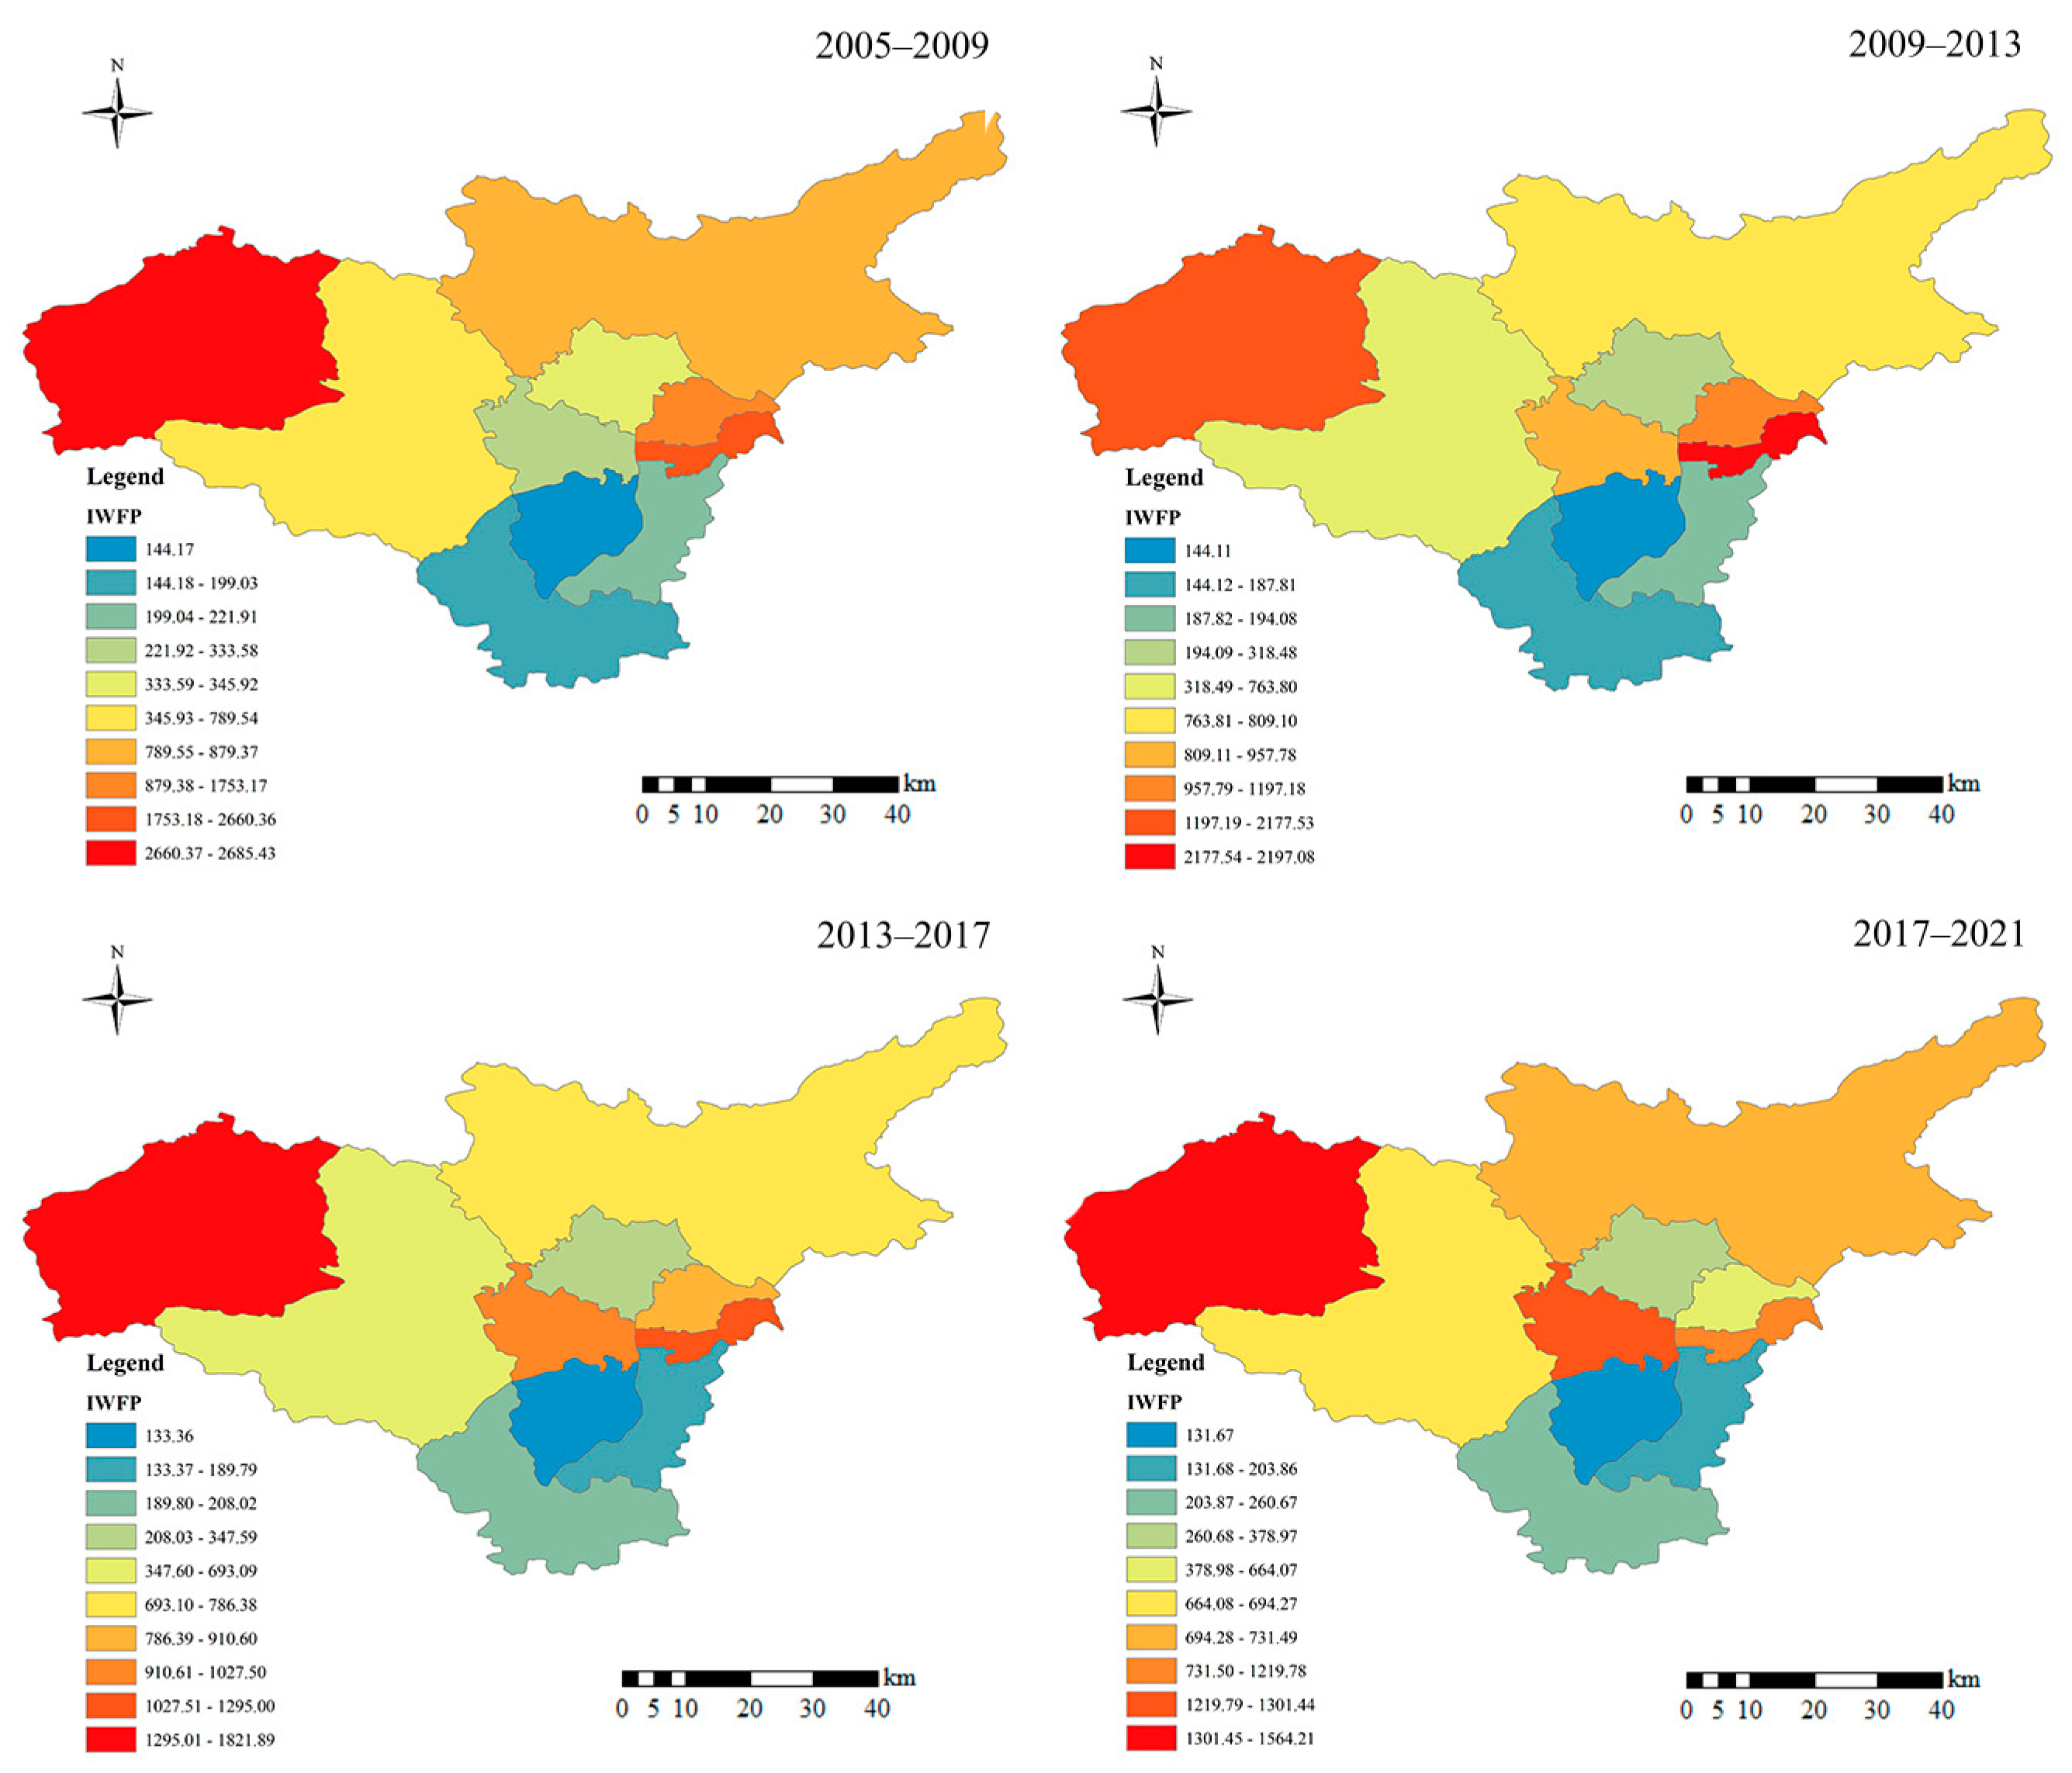
3.2.2. Spatial and Temporal Characteristics of Integrated Crop Production Water Footprint (IWFP)

The results showed that IWFP values showed a non-linearly decreasing trend with time (Figure 11), with a maximum value of 11,183.29 m3/kg and a minimum value of 6009.84 m3/kg. The spatial distribution of IWFP in different districts of Taiyuan City in different periods is shown in Figure 12. It can be seen from Figure 12 that IWFP in the north and west of Taiyuan City was significantly higher than that in the south of Taiyuan City (i.e., Jinyuan, Xiaodian, and Qingxu). The crop production water footprint in the west and north of Taiyuan City accounted for 42.92% of the total crop production water footprint. Oilseed crops contributed most to the total crop production water footprint, accounting for 47.11%.

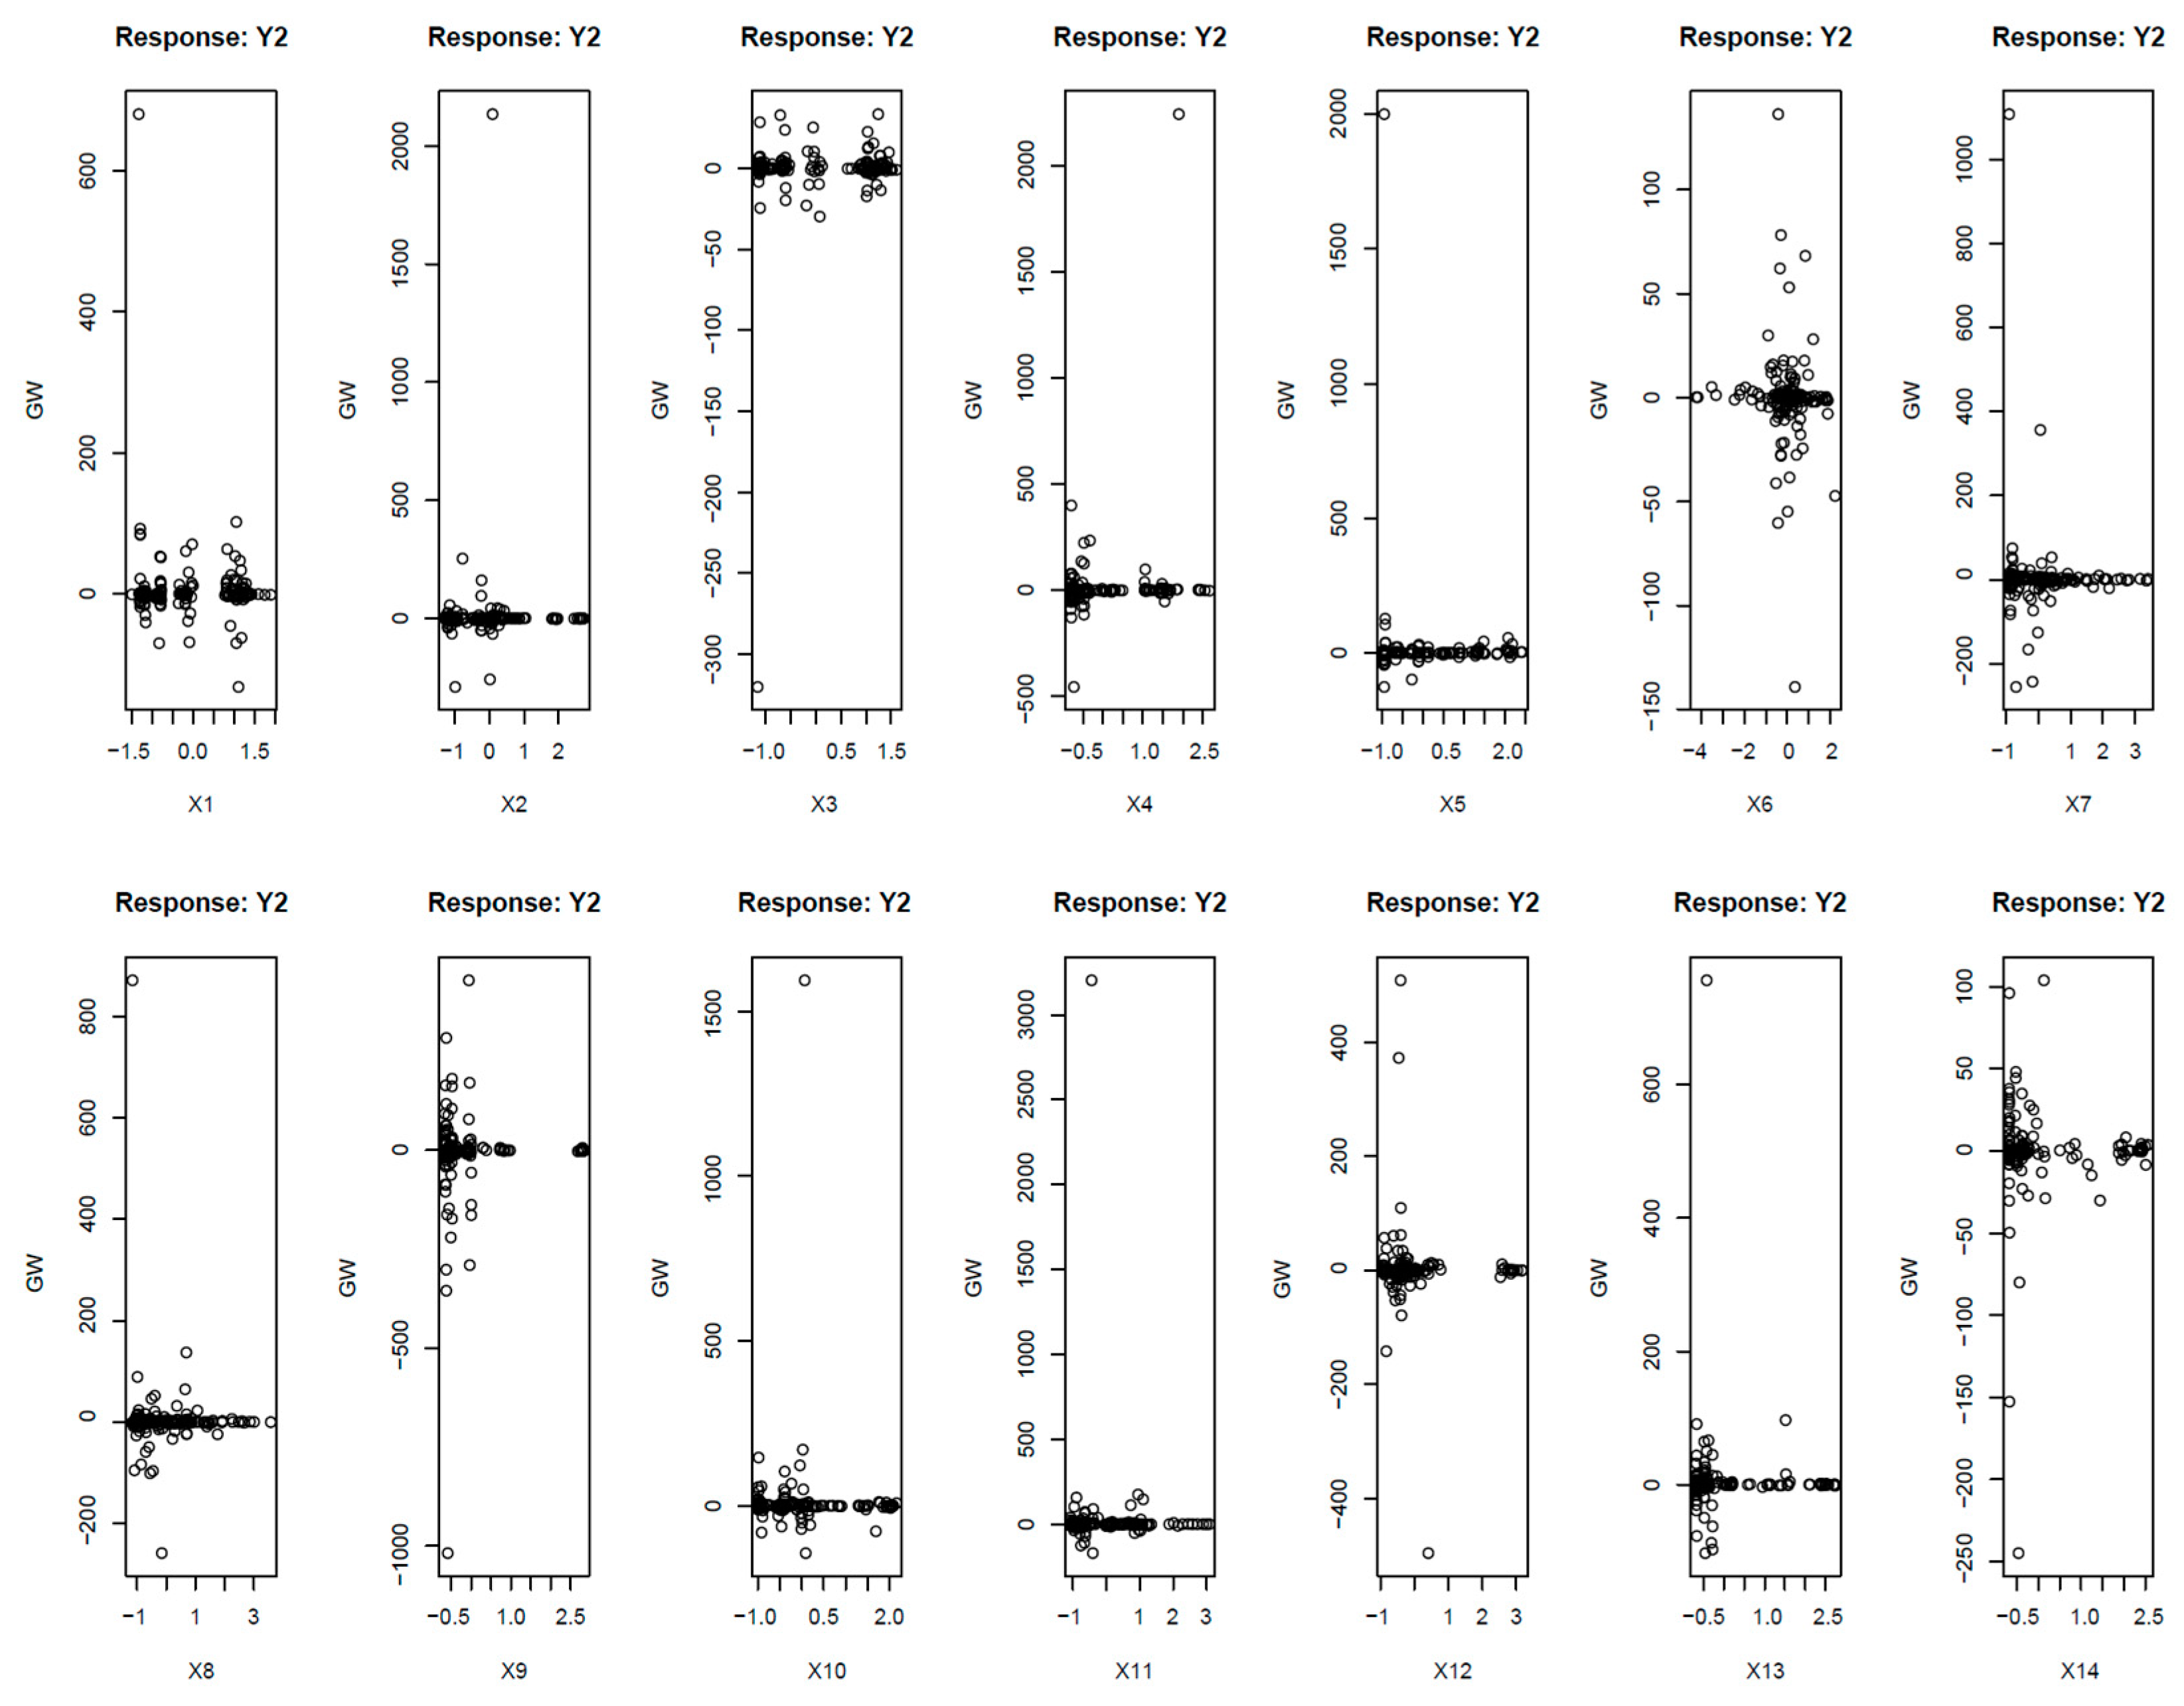
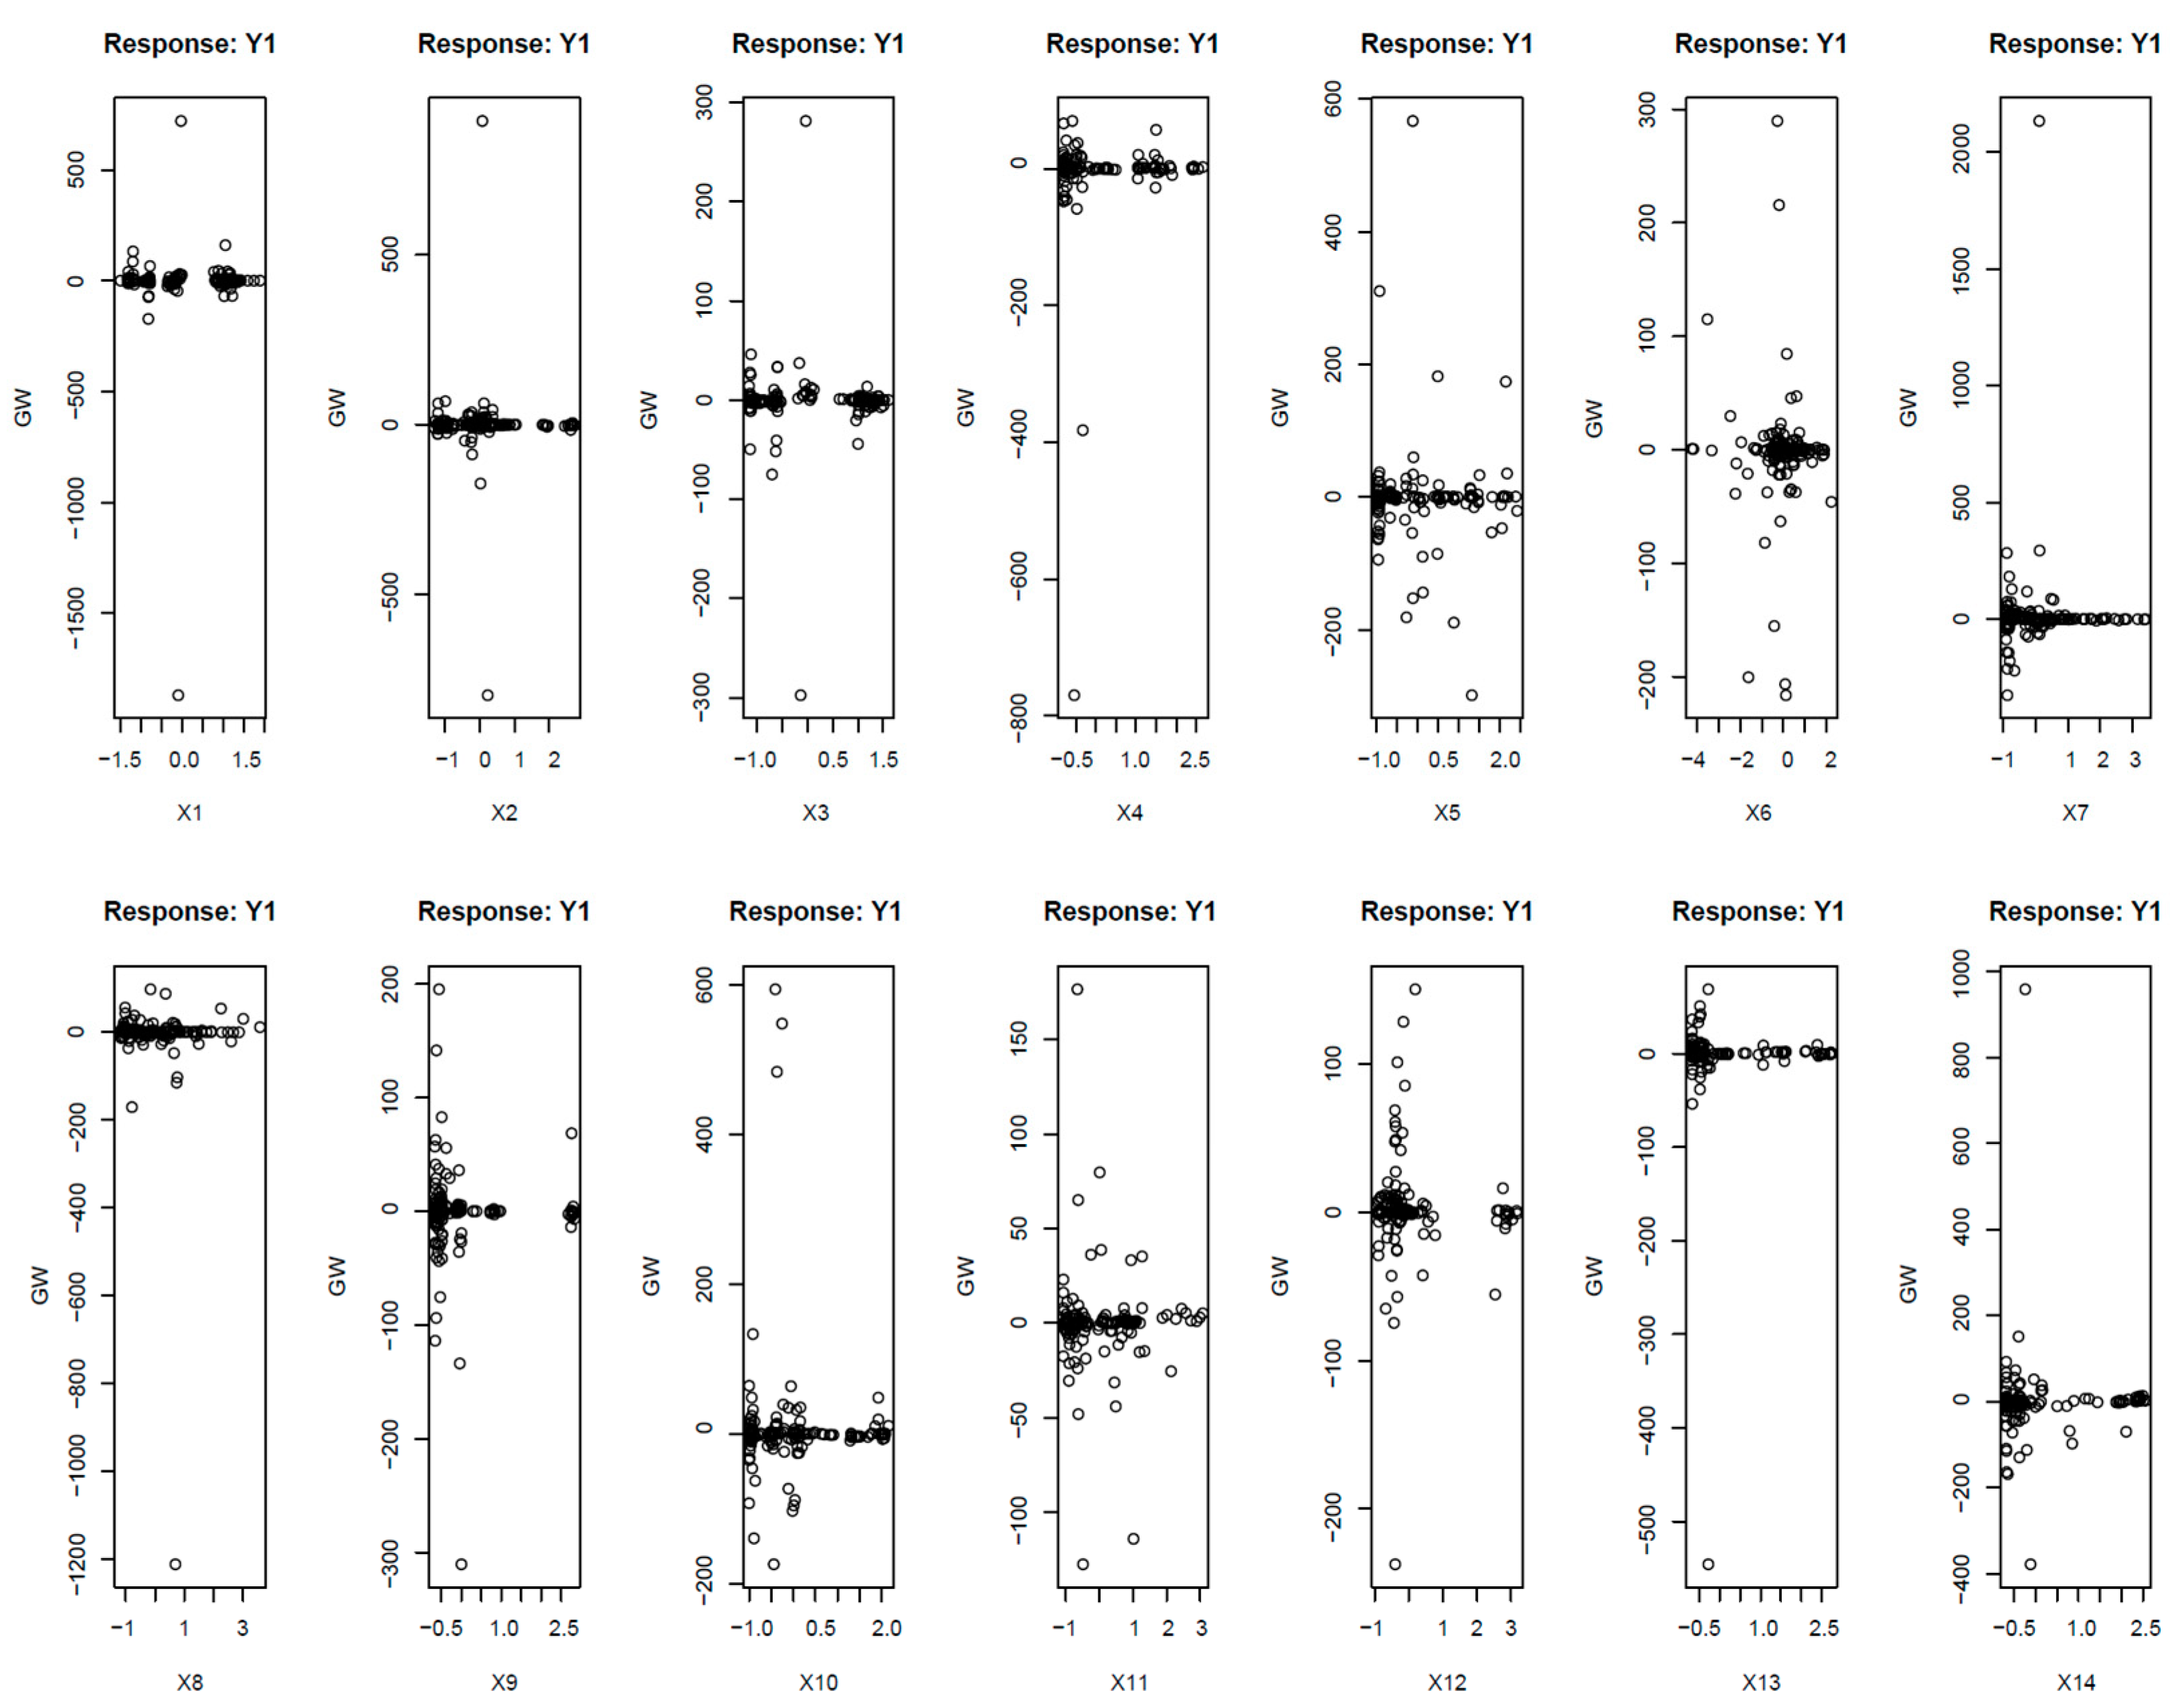
3.3. Analysis of the Influencing Factors Driving the Changes in Crop Production Water Footprint

The sensitivity analysis of various factors to WFPb, WFPg, and IWFP is shown in Figure 13, Figure 14 and Figure 15, respectively. The GW of those factors (Table 2) indicated that GDP (X7) and the total sown area of crops (X10) were more important for the changes in WFPb of Taiyuan City. Agricultural machinery power (X11) and agriculture-to-non-agriculture ratio (X4) were more important for the changes in WFPg of Taiyuan City. Agricultural machinery power (X11) and GDP (X7) were more important for the changes in IWFP of Taiyuan City.

4. Discussion

4.1. Crop Production

Our studies showed that the yield per unit area of crops was low, below the average level in China. The proportion of crop sown area and total yield of Taiyuan City to that of Shanxi province showed a gradually decreasing trend, which might be caused by the changes in population and agricultural restructuring. With urbanization and industrialization, the rural population is moving from countries to cities, leading to a shift in agriculture from food production to cash crops or service-based agriculture [41]. This may be related to the changes in consumption structure [42]. Rising consumption promotes consumption structure changes. Our study also showed that both maize sown area and total yield accounted for the largest proportion in all districts of Taiyuan City. Maize is one of the major crops in the Yellow River Basin, accounting for 27.3% of the total sown area [43,44]. On the one hand, farmers’ traditional farming habits have accumulated a wealth of experience for maize plantations in Taiyuan City. On the other hand, there is a significant pivotal position for maize in the agricultural sector of the area, particularly due to the climate advantages [45], and the preferred climate could provide warm, well-watered, and fertilized soil conditions for maize [46,47].

4.2. Crop Production Water Footprint

The results indicated that the crop production water footprint showed a non-linearly decreasing trend over the period of 2000–2021. For the total water footprint, the contribution of the blue water footprint is greater than that of the green water footprint. The results are consistent with El-Marsafawy and Mohamed [48], which showed that the blue water footprint contributed more to the total water footprint in arid regions compared with the green water footprint. The spatial distribution of the crop production water footprint significantly differed among different districts, with a lower water footprint in the south of Taiyuan City and a higher amount in the north and west of the study area. This may be related to spatial variations in precipitation as well as the different crop planting structures in this area, and the result of this study was basically consistent with research in Zimbabwe [49]. In general, changes in precipitation have a direct impact on the crop production water footprint [50]. The different districts in Taiyuan City have unevenly distributed precipitation, resulting in the subsequent spatial variations in crop production water footprint. In south Taiyuan City, i.e., Qingxu, although the precipitation level over the period of 2001–2020 has exceeded the average level of Taiyuan City, the relatively poor agricultural production conditions lead to a lower crop production water footprint [51]. Meanwhile, studies have shown that the different crop planting structures could reduce the crop production water footprint by changing the agricultural product, which means that the crop planting structure is essential for the crop production water footprint [42]. In the south of Taiyuan City, a single crop planting mode may be the most important factor significantly reducing the crop production water footprint. However, some studies have observed that agricultural management may have a greater impact on the water footprint than climate change. For example, Sun et al. [21] indicated that the crop production water footprint is largely determined by agricultural management rather than regional agroclimate. Furthermore, the IWFP achieved a peak in 2017, mainly due to a sharp increase in the sown area of oilseed crops (Figure 16 and Figure 17). However, after 2017, the sown area of maize declined significantly, which also results in the decrease in the blue and green water footprint. But more importantly, oilseed crops, as the most water-intensive crops, have the greatest impact on the changes in sown area and yield, as well as on the changes in crop production water footprint. Therefore, in grain-producing districts such as Qingxu and Xiaodian, managers should pay more attention to improving the utilization rate of the blue water footprint for maize and oilseed crops, so they should adjust the crop plantation structure to save more water resources [52].
In our study, IWFP in Taiyuan City was positively correlated to agricultural machinery power, GDP, and population density, and they were the largest contributing factors driving the changes in IWFP. The factor with the highest contribution to the changes in IWFP is agricultural machinery power. This is consistent with the study of Aihua Long [53]. Agricultural machinery power not only increases the crop yield, but also saves agricultural water consumption. Agricultural machinery power would primarily improve the efficiency of water utilization, which contributes to the large savings in the amount of blue water [54]. Therefore, well-developed agricultural machinery power may result in a lower blue water footprint [55]. With agricultural modernization, agricultural machinery power saves time in the crop production process in all crop growth stages [55]. In general, a GDP increase shows that rapid economic growth has been significantly driven by industrialization. Many farmers in the locality of Taiyuan City still strongly rely on agriculture [54]. Local farmers have accelerated the improvement in agriculture, resulting in an increase in IWFP. Meanwhile, current farmers with higher income tend to be less sensitive to the price of agricultural water resources, which increases agricultural water consumption and therefore crop water footprint [42]. With respect to population, population density is also the driver for the changes in IWFP. Population density reflects the extent of rural–urban migration, and the urbanization process is usually accompanied by an increase in urban population [54]. The urbanization in Taiyuan City over the last two decades has contributed to higher personal incomes, resulting in a higher food consumption. Therefore, as the population density increases, the virtual water volume increases.
Our results showed that GDP and the total sown area of crops were more important for the changes in blue water footprint of Taiyuan City. Both GDP and GDP per capita provide better measures of the impact of economic development on the prosperity of urban economies and on individual living standards. Economic development could promote improvements in the efficiency of agricultural water resource utilization, finally lowering the crop water footprint [51]. The total sown area of crops significantly positively affects the changes in total yield, thereby reducing the amount of the blue water footprint, which agrees with the results of Zheng et al. [56]. With respect to the changes in green water footprint, agricultural machinery power was more important for the changes in green water footprint. Agricultural machinery power can indicate the degree of agriculture modernization in Taiyuan City. Taiyuan’s agricultural production has transferred from relying on human animal power to mechanical power dominated by mechanization. In other words, the increase in the power of agricultural mechanization indicates the degree of modernization of Taiyuan’s rural areas. In this regard, changes in green water footprint are also strongly influenced by the urbanization process of Taiyuan City.

5. Conclusions

This study provides new insight into the evaluation of the crop production water footprint and its driving factors based on the BPNN model. We conclude that Taiyuan City has a low level of crop production below the level of China. The crop sown area of Taiyuan City remains relatively stable, while both the total yield and yield pear unit area increase at first and then decrease with time. Crop sown area and total yield are in the following order: maize > vegetables > potatoes. The crop production water footprint in Taiyuan City shows a non-linearly decreasing trend over the period of 2005–2021. The spatial and temporal distribution of IWFP varies among different districts of Taiyuan City, with lower values in the south of Taiyuan City and higher values in the north and west. In particular, GDP, total sown area, and agricultural machinery power are more important for the changes in crop production water footprint.

Author Contributions

Conceptualization, L.W. and Y.Z.; Data Curation, L.W.; Investigation, C.Y.; Methodology, L.W. and W.Z.; Software, L.W.; Validation, L.W.; Writing—Original Draft Preparation, L.W.; Writing—Review and Editing, L.W. and Y.Z. All authors have read and agreed to the published version of the manuscript.

Funding

This research was supported by the State Key Laboratory of Sustainable Dryland Agriculture (YJHZKF2102), National Natural Science Foundation of China (41907007), and Natural Science Foundation of Jiangsu Province (BK20190747).

Data Availability Statement

Some or all data, models, or codes that support the findings of this study are available from the corresponding author upon reasonable request.

Conflicts of Interest

The authors declare no conflicts of interest.

References

  1. Peng, T.; Jin, Z.Y.; Xiao, L.J. Assessing carrying capacity of regional water resources in karst areas, southwest China: A case study. Environ. Dev. Sustain. 2022, 25, 15139–15162. [Google Scholar] [CrossRef]
  2. Luo, X.P.; Liu, X.J. Regional Differences on Typical Crop Water Requirement and Water Footprint in China from A Production Perspective. Water Sav. Irrig. 2020, 88–93. (In Chinese) [Google Scholar] [CrossRef]
  3. Wang, C.H.; Gong, W.F.; Zhao, M.Z.; Zhou, Y.; Zhao, Y. Spatio-temporal evolution characteristics of eco-efficiency in the Yellow River Basin of China based on the super-efficient SBM model. Environ. Sci. Pollut. Res. 2023, 30, 72236–72247. [Google Scholar] [CrossRef] [PubMed]
  4. Sun, X.R.; Zhou, Z.X.; Wang, Y. Water resource carrying capacity and obstacle factors in the Yellow River basin based on the RBF neural network model. Environ. Sci. Pollut. Res. 2023, 30, 22743–22759. [Google Scholar] [CrossRef] [PubMed]
  5. Liu, D.; Qi, X.C.; Fu, Q.; Li, M.; Zhu, W.; Zhang, L.; Faiz, M.A.; Khan, M.I.; Li, T.; Cui, S. A resilience evaluation method for a combined regional agricultural water and soil resource system based on Weighted Mahalanobis distance and a Gray-TOPSIS model. J. Clean. Prod. 2019, 229, 667–679. [Google Scholar] [CrossRef]
  6. Wang, L.H.; Li, J. Strategies of Water Resources Management for Response to Climate Change in Pollution Induced Water Shortage Areas. In Proceedings of the 5th International Yellow River Forum on Ensuring Water Right of the River’s Demand and Healthy River Basin maintenance, Minist Water Resources, Yellow River Conservancy Commiss, Zhengzhou, China, 24–28 September 2012. [Google Scholar]
  7. Zhang, Y.; Tan, Q.; Zhang, T.Y.; Zhang, S. Sustainable agricultural water management incorporating inexact programming and salinization-related grey water footprint. J. Contam. Hydrol. 2022, 247, 103961. [Google Scholar] [CrossRef] [PubMed]
  8. Allan, J.A. ‘Virtual Water’: A Long-Term Solution for Water-Short Middle Eastern Economies? Water Issues Group, School of Oriental and African Studies. University of London: London, UK. Available online: http://www.soas.ac.uk/faculties/lawsocialsciences.cfm?navid=2811 (accessed on 6 February 2024).
  9. Hoekstra, A.Y.; Hung, P.Q. Virtual water trade. In Proceedings of the International Expert Meeting on Virtual Water Trade; IHE: Delft, The Netherlands, 2003. [Google Scholar]
  10. Hoekstra, A.Y.; Hung, P.Q. Virtual water trade a quantification of virtual water flows between nations in relation to international crop trade. In Ethical Consumption; Routledge: London, UK, 2002. [Google Scholar] [CrossRef]
  11. Zhang, J.N.; Duan, Y.Q.; Zhou, S.B.; Huang, Y. Evaluation of the Effectiveness of Water Ecological Restoration Based on the Relationship between the Supply and Demand of Ecological Products—A Case Study of the Yellow River Delta. Land 2023, 12, 2093. [Google Scholar] [CrossRef]
  12. Hoekstra, A.Y. The Water Footprint Assessment Manual: Setting the Global Standard; Routledge: London, UK, 2011. [Google Scholar]
  13. Wang, Y.J.; Liu, J.G.; Zhao, D.D. Assessing Water Resources Based on Theory of Water Footprint-A Case Study in Xuanhua District, Zhangjiakou City, Hebei Province. Bull. Soil Water Conserv. 2018, 38, 213–219. (In Chinese) [Google Scholar] [CrossRef]
  14. Gerbens-Leenes, P.; Xu, L.; De Vries, G.; Hoekstra, A.Y. The blue water footprint and land use of biofuels from algae. Water Resour. Res. 2014, 50, 8549–8563. [Google Scholar] [CrossRef]
  15. Hoekstra, A.Y.; Chapagain, A.K. The Water Footprints of Morocco and the Netherlands; Wiley: Hoboken, NJ, USA, 2006. [Google Scholar] [CrossRef]
  16. Kampman, D.A.; Hoekstra, A.Y.; Krol, M.S. The water footprint of India. Value Water Res. Rep. Ser. 2008, 32, 1–152. [Google Scholar]
  17. Van Oel, P.; Krol, M.S.; Hoekstra, A.Y. A river basin as a common-pool resource: A case study for the Jaguaribe basin in Brasil. Int. J. River Basin Manag. 2009, 7, 345–353. [Google Scholar] [CrossRef]
  18. Bulsink, F.; Hoekstra, A.Y.; Booij, M.J. The water footprint of Indonesian provinces related to the consumption of crop products. Hydrol. Earth Syst. Sci. 2010, 14, 119–128. [Google Scholar] [CrossRef]
  19. Liu, J.G.; Williams, J.R.; Zehnder, A.J.; Yang, H. GEPIC–modelling wheat yield and crop water productivity with high resolution on a global scale. Agric. Syst. 2007, 94, 478–493. [Google Scholar] [CrossRef]
  20. Mekonnen, M.M.; Hoekstra, A.Y. A global and high-resolution assessment of the green, blue and grey water footprint of wheat. Hydrol. Earth Syst. Sci. 2010, 14, 1259–1276. [Google Scholar] [CrossRef]
  21. Sun, S.K.; Wu, P.T.; Wang, Y.B.; Zhao, X.N. Impacts of climate change on water footprint of spring wheat production: The case of an irrigation district in China. Span. J. Agric. Res. 2012, 10, 1176–1187. [Google Scholar] [CrossRef]
  22. Bazrafshan, O.; Vafaei, K.; Etedali, H.R.; Zamani, H.; Hashemi, M. Economic analysis of water footprint for water management of rain-fed and irrigated almonds in Iran. Irrig. Sci. 2024, 42, 115–133. [Google Scholar] [CrossRef]
  23. Zhang, L.Y.; Yu, Y.; Malik, I.; Wistuba, M.; Sun, L.; Yang, M.; Wang, Q.; Yu, R. Water Resources Evaluation in Arid Areas Based on Agricultural Water Footprint-A Case Study on the Edge of the Taklimakan Desert. Atmosphere 2023, 14, 67. [Google Scholar] [CrossRef]
  24. Elbeltagi, A.; Deng, J.; Wang, K.; Hong, Y. Crop Water footprint estimation and modeling using an artificial neural network approach in the Nile Delta, Egypt. Agric. Water Manag. 2020, 235, 106080. [Google Scholar] [CrossRef]
  25. Wang, X.; Li, X.B.; Fischer, G.; Sun, L.; Tan, M.; Xin, L.; Liang, Z. Impact of the changing area sown to winter wheat on crop water footprint in the North China Plain. Ecol. Indic. 2015, 57, 100–109. [Google Scholar] [CrossRef]
  26. Zhao, C.F.; Chen, B. Driving force analysis of the agricultural water footprint in China based on the LMDI method. Environ. Sci. Technol. 2014, 48, 12723–12731. [Google Scholar] [CrossRef]
  27. Li, Z.B.; Wang, W.; Ji, X.X.; Wu, P.; Zhuo, L. Machine learning modeling of water footprint in crop production distinguishing water supply and irrigation method scenarios. J. Hydrol. 2023, 625, 130171. [Google Scholar] [CrossRef]
  28. Li, L.; Lei, Y.L.; Wu, S.M.; He, C.; Yan, D. Study on the coordinated development of economy, environment and resource in coal-based areas in Shanxi Province in China: Based on the multi-objective optimization model. Resour. Policy 2018, 55, 80–86. [Google Scholar] [CrossRef]
  29. Wu, J.H.; Wang, Z.C.; Dong, L.Y.P. Prediction and analysis of water resources demand in Taiyuan City based on principal component analysis and BP neural network. Aqua-Water Infrastruct. Ecosyst. Soc. 2021, 70, 1272–1286. [Google Scholar] [CrossRef]
  30. Li, J.L.; Zhang, C.X.; Wang, Y.X.; Liao, X.-P.; Yao, L.-L.; Liu, M.; Xu, L. Pollution Characteristics and Distribution of Polycyclic Aromatic Hydrocarbons and Organochlorine Pesticides in Groundwater at Xiaodian Sewage Irrigation Area, Taiyuan City. Environ. Sci. 2015, 36, 172–178. (In Chinese) [Google Scholar] [CrossRef]
  31. Zhuo, L.; Mekonnen, M.M.; Hoekstra, A.Y.; Wada, Y. Inter-and intra-annual variation of water footprint of crops and blue water scarcity in the Yellow River basin (1961–2009). Adv. Water Resour. 2016, 87, 29–41. [Google Scholar] [CrossRef]
  32. Shi, L.J.; Wu, P.T.; Wang, Y.B.; Sun, S.K.; Liu, J. Assessment of water stress in Shaanxi Province based on crop water footprint. Chin. J. Eco-Agric. 2015, 23, 650–658. [Google Scholar] [CrossRef]
  33. Ma, X.H.; Su, Y.H.; Lin, F.; Dai, C.Y. Land use/cover change and its driving factors in Taiyuan city. Ecol. Sci. 2021, 40, 201–210. (In Chinese) [Google Scholar] [CrossRef]
  34. Zheng, P.X.; Deng, F.; Li, Z.Y.; Zhao, E.L.; Feng, Q.; Han, Y. Remote Sensing Study on the Evolution of Heat Island in Taiyuan Urban Agglomeration in Recent 20 Years. J. Shanxi Univ. 2023, 1–12. (In Chinese) [Google Scholar] [CrossRef]
  35. Xiong, J.R.; Liang, F.T.; Yang, X.L.; Du, T.; Pacenka, S.; Steenhuis, T.S.; Siddique, K.H.M. Water Footprint Assessment of Green and Traditional Cultivation of Crops in the Huang-Huai-Hai Farming Region. Agronomy 2022, 12, 2494. [Google Scholar] [CrossRef]
  36. Mcclelland, J.L.; Rumelhart, D.E. Distributed memory and the representation of general and specific information. J. Exp. Psychol. Gen. 1985, 114, 159. [Google Scholar] [CrossRef]
  37. Li, X.N.; Cheng, X.; Wu, W.J.; Wang, Q.; Tong, Z.; Zhang, X.; Deng, D.; Li, Y. Forecasting of bioaerosol concentration by a Back Propagation neural network model. Sci. Total Environ. 2020, 698, 134315. [Google Scholar] [CrossRef]
  38. Sun, W.; Huang, C.C. A carbon price prediction model based on secondary decomposition algorithm and optimized back propagation neural network. J. Clean. Prod. 2020, 243, 118671. [Google Scholar] [CrossRef]
  39. Sheela, K.G.; Deepa, S.N. Review on methods to fix number of hidden neurons in neural networks. Math. Probl. Eng. 2013, 2013, 425740. [Google Scholar] [CrossRef]
  40. Duan, A.W. Irrigation Water Quotas for Major Crops in Northern Areas; China Agricultural Science and Technology Press: Beijing, China, 2004. [Google Scholar]
  41. Liu, Y.; Huang, X.J.; Yang, H.; Zhong, T. Environmental effects of land-use/cover change caused by urbanization and policies in Southwest China Karst area–A case study of Guiyang. Habitat Int. 2014, 44, 339–348. [Google Scholar] [CrossRef]
  42. Cai, J.P.; Xie, R.; Wang, S.J.; Deng, Y.; Sun, D. Patterns and driving forces of the agricultural water footprint of Chinese cities. Sci. Total Environ. 2022, 843, 156725. [Google Scholar] [CrossRef]
  43. Xue, J.Q.; Zhang, R.H.; Li, F.Y.; Zhang, X.H. Current status, problem and strategy of maize breeding in Shannxi Province. J. Maize Sci. 2008, 139–141. (In Chinese) [Google Scholar]
  44. Wang, J.Q.; Qin, L.J.; Li, B.; Dang, Y. Assessing the hotspots of crop water footprint in Jilin Province of China. Environ. Sci. Pollut. Res. 2022, 29, 50010–50024. [Google Scholar] [CrossRef]
  45. Huang, X.; Xing, R.P.; Wu, Z.; Ding, J. Analysis of the Current Situation and Countermeasures for the Development of Corn Seed Industry in Shanxi. Agric. Technol. 2015, 35, 232+55. (In Chinese) [Google Scholar] [CrossRef]
  46. Nguyen, H.T.; Leipner, J.; Stamp, P.; Guerra-Peraza, O. Low temperature stress in maize (Zea mays L.) induces genes involved in photosynthesis and signal transduction as studied by suppression subtractive hybridization. Plant Physiol. Biochem. 2009, 47, 116–122. [Google Scholar] [CrossRef]
  47. Ren, C.Q. Corn growth habit and fertilizer demand characteristics. Friends Farmers’ Wealth 2016, 11, 160. (In Chinese) [Google Scholar]
  48. El-Marsafawy, S.M.; Mohamed, A.I. Water footprint of Egyptian crops and its economics. Alex. Eng. J. 2021, 60, 4711–4721. [Google Scholar] [CrossRef]
  49. Govere, S.; Nyamangara, J.; Nyakatawa, E.Z. Climate change signals in the historical water footprint of wheat production in Zimbabwe. Sci. Total Environ. 2020, 742, 140473. [Google Scholar] [CrossRef] [PubMed]
  50. Zhao, Y.; Ding, D.Y.; Si, B.C.; Zhang, Z.; Hu, W.; Schoenau, J. Temporal variability of water footprint for cereal production and its controls in Saskatchewan, Canada. Sci. Total Environ. 2019, 660, 1306–1316. [Google Scholar] [CrossRef]
  51. Fang, H.; Wu, N.; Adamowski, J.; Wu, M.; Cao, X. Crop water footprints and their driving mechanisms show regional differences. Sci. Total Environ. 2023, 904, 167549. [Google Scholar] [CrossRef] [PubMed]
  52. Ma, X.L.; Jiao, S.X. Comprehensive analysis of water resources from the perspective of water footprint and water ecological footprint: A case study from Anyang City, China. Environ. Sci. Pollut. Res. 2023, 30, 2086–2102. [Google Scholar] [CrossRef] [PubMed]
  53. Long, A.H.; Zhang, P.; Hai, Y.; Deng, X.; Li, J.; Wang, J. Spatio-temporal variations of crop water footprint and its influencing factors in Xinjiang, China during 1988–2017. Sustainability 2020, 12, 9678. [Google Scholar] [CrossRef]
  54. Ye, Q.L.; Li, Y.; Zhang, W.L.; Cai, W. Influential factors on water footprint: A focus on wheat production and consumption in virtual water import and export regions. Ecol. Indic. 2019, 102, 309–315. [Google Scholar] [CrossRef]
  55. Wang, Q.; Huang, K.; Liu, H.; Yu, Y. Factors affecting crop production water footprint: A review and meta-analysis. Sustain. Prod. Consum. 2023, 36, 207–216. [Google Scholar] [CrossRef]
  56. Zheng, J.Z.; Wang, W.G.; Ding, Y.M.; Liu, G.; Xing, W.; Cao, X.; Chen, D. Assessment of climate change impact on the water footprint in rice production: Historical simulation and future projections at two representative rice cropping sites of China. Sci. Total Environ. 2020, 709, 136190. [Google Scholar] [CrossRef]
Figure 1. The location of study area, Taiyuan City.
Agronomy 14 00546 g001
Figure 2. The structure of the BPNN.
Agronomy 14 00546 g002
Figure 3. The steps of the computing process of the BPNN model.
Agronomy 14 00546 g003
Figure 4. The changes in crop sown area, yield, and per-unit-area yield with time in Taiyuan City.
Agronomy 14 00546 g004
Figure 5. Crop sown area in each district in Taiyuan City during recent years.
Agronomy 14 00546 g005
Figure 6. Spatial distribution of crop sown area in different districts of Taiyuan City.
Agronomy 14 00546 g006
Figure 7. Spatial distribution of total yield in Taiyuan City.
Agronomy 14 00546 g007
Figure 8. Spatial distribution of the crop yield in different districts of Taiyuan City.
Agronomy 14 00546 g008
Figure 9. The blue and green water footprint in different districts of Taiyuan City.
Agronomy 14 00546 g009aAgronomy 14 00546 g009b
Figure 10. The relationship between predicted crop production water footprint, i.e., IWFP, WFPb, and WFPg, and the actual data.
Agronomy 14 00546 g010
Figure 11. The changes in blue water footprint, green water footprint, and IWFP with time.
Agronomy 14 00546 g011
Figure 12. Integrated crop production water footprint in different districts of Taiyuan City.
Agronomy 14 00546 g012
Figure 13. The contribution of GW of various factors to WFPb in Taiyuan City.
Agronomy 14 00546 g013
Figure 14. The contribution of GW of various factors to WFPg in Taiyuan City.
Agronomy 14 00546 g014
Figure 15. The contribution of GW of various factors to IWFP in Taiyuan City.
Agronomy 14 00546 g015
Figure 16. Crop virtual water volume map.
Agronomy 14 00546 g016
Figure 17. Area sown under maize and oil crop.
Agronomy 14 00546 g017
Table 1. Influencing factors in Taiyuan City.
CategoryInfluencing FactorsUnit
Population factorsTotal population (X1)Person
Rural population (X2)Person
Urban population (X3)Person
Agriculture-to-non-agriculture ratio (X4)/
Population density (X5)/
Natural population growth rate (X6)%
Economic factorsGDP (X7)CNY million
GDP per capita (X8)
Agricultural production conditionsEffective irrigated area (X9)Hectares
Total sown area of crops (X10)Hectares
Agricultural mechanization power (X11)Kilowatt
Rural electricity consumption (X12)million kWh
Amount of agricultural fertilizer application (X13)ton
Amount of agricultural land film used (X14)ton
Table 2. The GW of factors driving the changes in WFPb, WFPg, and IWFP of Taiyuan City.
FactorsWFPbFactorsWFPgFactorsIWFP
X72070.674X113591.756X11240.919
X101047.365X42512.343X7212.793
X12313.762X52147.828X5101.123
X24.176X101914.496X671.368
X11−33.632X21847.951X13−15.653
X3−133.775X1971.494X10−27.638
X9−188.374X13824.686X3−42.596
X14−203.179X8521.191X2−61.594
X13−310.528X7502.410X14−63.390
X5−349.744X12223.795X4−65.848
X6−443.786X6−5.333X1−83.043
X4−975.993X14−93.555X8−117.975
X1−1121.162X3−197.029X9−221.800
X8−1265.435X9−1066.951X12−222.422
Disclaimer/Publisher’s Note: The statements, opinions and data contained in all publications are solely those of the individual author(s) and contributor(s) and not of MDPI and/or the editor(s). MDPI and/or the editor(s) disclaim responsibility for any injury to people or property resulting from any ideas, methods, instructions or products referred to in the content.

