Article

Comprehensive Identification of Main, Environment Interaction and Epistasis Quantitative Trait Nucleotides for 100-Seed Weight in Soybean (Glycine max (L.) Merr.)

1
Key Laboratory of Biology and Genetics Improvement of Soybean, Ministry of Agriculture, Zhongshan Biological Breeding Laboratory (ZSBBL), National Innovation Platform for Soybean Breeding and Industry-Education Integration, State Key Laboratory of Crop Genetics & Germplasm Enhancement and Utilization, College of Agriculture, Nanjing Agricultural University, Nanjing 210095, China
2
Département de phytologie, Université Laval, Québec, QC G1V 0A6, Canada
3
Department of Agricultural Biotechnology, Faculty of Agriculture, Food and Consumer Sciences, University for Development Studies, Tamale P.O. Box TL 1882, Ghana
*
Authors to whom correspondence should be addressed.
These authors contributed equally to this work.
Agronomy 2024, 14(3), 483; https://doi.org/10.3390/agronomy14030483
Submission received: 2 February 2024 / Revised: 25 February 2024 / Accepted: 26 February 2024 / Published: 28 February 2024

Abstract

:
Soybean hundred seed weight (HSW) is a complex quantitative trait affected by multiple genes and environmental factors. To date, a large number of quantitative trait nucleotides (QTNs) have been reported, but less information on QTN-by-environment interactions (QEIs) and QTN-QTN interaction (QQIs) for soybean HSW is available. Mapping without QEIs and QQIs result in missing some important QTNs that are significantly related to HSW. Therefore, the present study conducted genome-wide association analysis to map main QTNs, QEIs and QQIs for HSW in a panel with 573 diverse soybean lines tested in three independent environments (E1, E2 and E3) with Mean- and best linear unbiased value (BLUP)- phenotype. In all, 147 main effect QTNs, 11 QEIs, and 24 pairs of QQIs were detected in the Mean-phenotype, and 138 main effect QTNs, 13 QEIs, and 27 pairs of QQIs in the BLUP-phenotype. The total phenotypic variation explained by the main effect QTNs, QEIs, and QQIs were 35.31–39.71, 8.52–8.89 and 34.77–35.09%, respectively, indicating an important role of non-additive effects on HSW. Out of these, 33 QTNs were considered as stable with 23 colocalized with previously known loci, while 10 were novel QTNs. In addition, 10 pairs stable QQIs were simultaneously detected in the two phenotypes. Based on homolog search in Arabidopsis thaliana and in silico transcriptome data, seven genes (Glyma13g42310, Glyma13g42320, Glyma08g19580, Glyma13g44020, Glyma13g43800, Glyma17g16620 and Glyma07g08950) from some main-QTNs and two genes (Glyma06g19000 and Glyma17g09110) of QQIs were identified as potential candidate genes, however their functional role warrant further screening and functional validation. Our results shed light on the involvement of QEIs and QQIs in regulating HSW in soybean, and these together with candidate genes identified would be valuable genomic resources in developing soybean cultivars with desirable seed weight.

1. Introduction

As an important crop with rich nutritional value and wide application, soybean [Glycine max (L.) Merr.] plays an important role in human health and food security. In order to maximize the potential of soybean yield related factors, scientists are deeply developing excellent varieties, as one of the three major factors in yield formation, seed weight has become a key target for breeders [1,2]. The 100-seed weight (HSW) of soybean is not only a key factor in the evolution of plant adaptation, but also an important agronomic trait in the process of crop domestication [3].
HSW is a typical complex quantitative trait, which is controlled by a few major genes and several minor genes. Therefore, genome-wide association analysis (GWAS) is one of the important methods to mine the excellent genes of HSW. Since quantitative trait loci mapping have been applied to soybean [4], many stable QTN significantly correlated with HSW have been detected [5,6], in order to identify superior alleles in soybean and provide useful reference for further understanding the genetic basis of soybean 100-seed weight. At present, a couple of hundreds quantitative trait loci/nucleotides (QTL/QTNs) for HSW in soybean have been documented on SoyBase (www.soybase.org; accessed on 15 February 2023) by both linkage and genome-wide association study mapping strategies. Previous studies identified QTL/QTN and validated the underlying genes for seed weight: the PP2C-1 gene [7], the WRKY transcription factor GmWRKY15a [8], and the seed development related gene GmGA20ox [9]. For this purpose, scholars have proposed a lot of GWAS methods, including common single-locus association analysis methods [10,11,12] and multi-locus association analysis methods [13]. However, these association analysis studies about HSW were limited to main effect QTN were detected in a single environment, and more complex factors such as gene-environment interactions and gene-gene interactions are not considered.
With the changes in climate and the constant intensification, the influence of environmental factors on gene expression and phenotype is increasingly significant. The generation of phenotypes is a complex process, most of them are simultaneously affected by heredity and environment [14]. Therefore, the detection of environment-gene interactions (QTN-by-environment; QEIs) and their genetic analysis are becoming more and more important. Moreover, in the field of population and quantitative genetics, epistasis is seen as a key concept to explain the variability of individual phenotypes and the impact of genetic background [15]. The epistasis analysis is helpful to find those loci in QQIs (QTN-by-QTN interactions) that have significant influence on traits, but they could be not found in main effect model. By further research on epistasis, researchers will be able to better understand how genetic variation affects individual phenotypes and the mechanisms of population evolution. QEIs and QQIs have been gradually valued in mining elite gene of complexity traits [15,16,17].
Currently, many methods and software packages have been used to detect gene-environment interactions and gene-gene interactions in GWAS [18], among them include mixed linear model of multi-site random-SNP effect (3VmrMLM) which combines the three-variance component hybrid model and the multi-locus model mrMLM method and maps the main QTNs, QEIs and QQIs [19]. In this study, 3VmrMLM method was used for GWAS mapping using Mean-phenotype (were mean values of 3 replications) and BLUP-phenotype (were obtained from the best linear unbiased value of 3 replications) to identify: (i) the main QTNs, QEIs and QQIs, and (ii) predict putative candidate genes that may underline major and stable QTNs. Our findings provide valuable insights into the genetic bases of HSW and provide a repertoire of key candidate genes for the enhancement of HSW through breeding programs.

2. Materials and Methods

2.1. Materials

The experimental materials used in this study were 573 genotypes selected from Yangtze-Huai soybean breeding line population (YHSBLP) under National Center for Soybean Improvement, Nanjing Agricultural University (NAU), Nanjing-China. This population mainly contained new germplasm of suitable maturity, high quality and high yield from Yangtze-Huai area. This population was developed from domestic and foreign excellent cultivars and the core parents materials (Yuchu 4, Nannong 86-4, Nannong 88-48 and Nannongcaidou 5) [20]. The hybrid method was used, and then excellent and stable lines for yield from F8–F14 generations were selected a panel in this population. The experiment was laid in a completely random block design, with three replications. The hill plot was set 50 cm × 50 cm, the HSW of each replicate was measured under the moisture content of 13% [20].

2.2. Phenotypic Data

Soybean HSW from YHSBLP population in 2013, 2017 and 2018 [20] were re-analyzed by 3VmrMLM, with 3 replications for each year. Here, a year is regarded as an environment, so there are three environments in total, which are sequentially encoded as E1, E2 and E3. The phenotypic data are available in the National Center for Soybeans Improvement website (http://ncsi.njau.edu.cn/info/1150/2069.htm; accessed on 1 February 2023) or from additional file in Karikari et al. [20]. We processed the above phenotypic data in two aspects, which compensated for the influence of phenotypic data differences on GWAS results. One is Mean-phenotype, we took mean from 3 replications of each environment as the phenotypic data for the single environmental association analysis and multi-environment dataset joint analysis, then mean from mean value of three environments for epistasis analysis. The other is BLUP-phenotype, lme4 package in R4.2.1 software [21] was used to calculate the BLUP of 3 replications in each environment, respectively, as the phenotypic data for the single environment association analysis and multi-environment dataset joint analysis, and the BLUP of 3 environments was used to conduct epistasis analysis.

2.3. Genotypic Data

The DNA of 573 samples were extracted by CTAB method, the genomic DNA sequences were obtained by Illumina HiSeq2000 sequencer, and Multiple Shotgun Genotyping (MSG) was used, and the size of DNA fragments ranged from 400 to 600 bp. RealSFS [22] were used to extract and confirm single nucleotide polymorphisms (SNPs) based on Bayesian estimates of locus frequency, and original SNPs markers were obtained. The SNPs dataset of this population was deposited on National Center for Biotechnology Information under Sequence Read Archive (SRA) with accession number PRJNA648781, and the website of National Center for Soybean Improvement (http://ncsi.njau.edu.cn/info/1150/2069.htm; accessed on 1 February 2023). In brief, the SNPs consisted of 61,166 SNPs distributed on 20 chromosomes of soybean, with frequency of heterozygous alleles missing ≤30% and minor alleles frequency ≥5% [20].

2.4. Population Structure Analysis

The STRUCTURE 2.3.4 software [23] was used to calculate the population structure Q matrix was obtained for the association analysis. In the results of Structure, the statistic ∆K presented significantly higher value at K = 3 compared to the other three cases, indicating that the population is composed of three subpopulations, which is consistent with the number of subpopulations analyzed by Karikari et al. [20].

2.5. Phenotypic Data Analysis and Heritability Estimation

Descriptive statistical analysis of Mean- and BLUP-phenotype of soybean HSW phenotypic data was performed using SPSS software (IBM SPSS Statistics 26.0.0. Released 2019, IBM Corp. IBM SPSS Armonk, NY, USA: IBM Corp). The analysis of variance was performed by SPSS software, the heritability of Mean-phenotypes and BLUP-phenotypes was estimated by the heritability Formula (1) [24]. Among them, V g denotes the genetic variance, V ε denotes residual variance.
h 2 = V g V g + V ε

2.6. Genome Wide Association Analysis of Soybean HSW

In this study, the compressed-variance component mixed linear model method 3VmrMLM was used to conduct association analysis on 61,166 SNPs and phenotypic data (Mean-phenotype and BLUP-phenotype), to obtain the main effect QTNs, QEIs and QQIs related to 100-seed weight. The threshold was set to logarithm of odd (LOD) ≥ 3.0. Specific analyses performed are as follows:
(i)
Three kinds of association analyses were included: single environment association analysis for significant main-effect QTNs; multi-environment dataset joint analysis [19] for stable main effect QTNs and QEIs (QTN-by-environment interactions); and epistatic analysis can obtain main effect QTNs and QQIs (QTN-QTN interaction).
(ii)
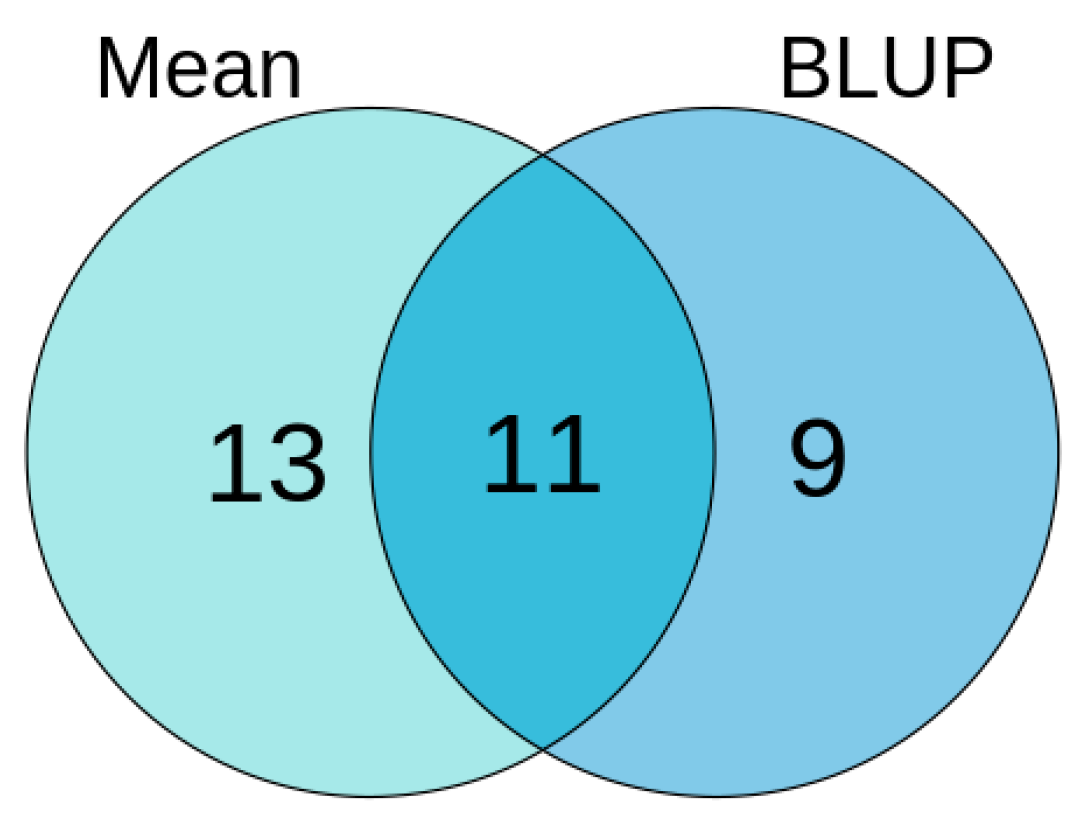
Phenotypic data used in Single environment association analysis: E1, E2 and E3 was three single environments. Mean-phenotype was mean of 3 replications of each single environment. BLUP-phenotype was BLUP (best linear unbiased value) of 3 replications of each single environment.
(iii)
Phenotypic data used in multi-environment dataset joint analysis: Mean-phenotype of three environment E1, E2 and E3 were combined together for association analysis. BLUP-phenotype were processed in the same way as the Mean-phenotype.
(iv)
Phenotypic data used in epistatic analysis: The mean of the mean value of three environments were used as phenotypic data, namely, Mean-phenotype. BLUP-phenotype was BLUP from 3 replications of three environments.
(v)
stable locus: In this study, QTNs/QEIs/QQIs that appeared in at least twice in single-environment association analysis, multi-environment dataset joint analysis, and epistatic association analysis were considered as the stable locus [20] in Mean-phenotype. For BLUP-phenotype, the criterion for screening locus was the same.

2.7. Functional Annotation of Arabidopsis Homologous Genes

The SoyBase website was used to search for potential candidate genes for the screened QTNs/QEIs/QQIs within a distance of 500 kb upstream and downstream [20]. Since many biological pathways and hormone regulation are involved in the formation of seed centroid weight, this study uses G. max William 82 reference gene model 1.0 in SoyBase database to identify potential candidate genes that may be related to seed centroid weight through functional annotation of Arabidopsis homologous genes.

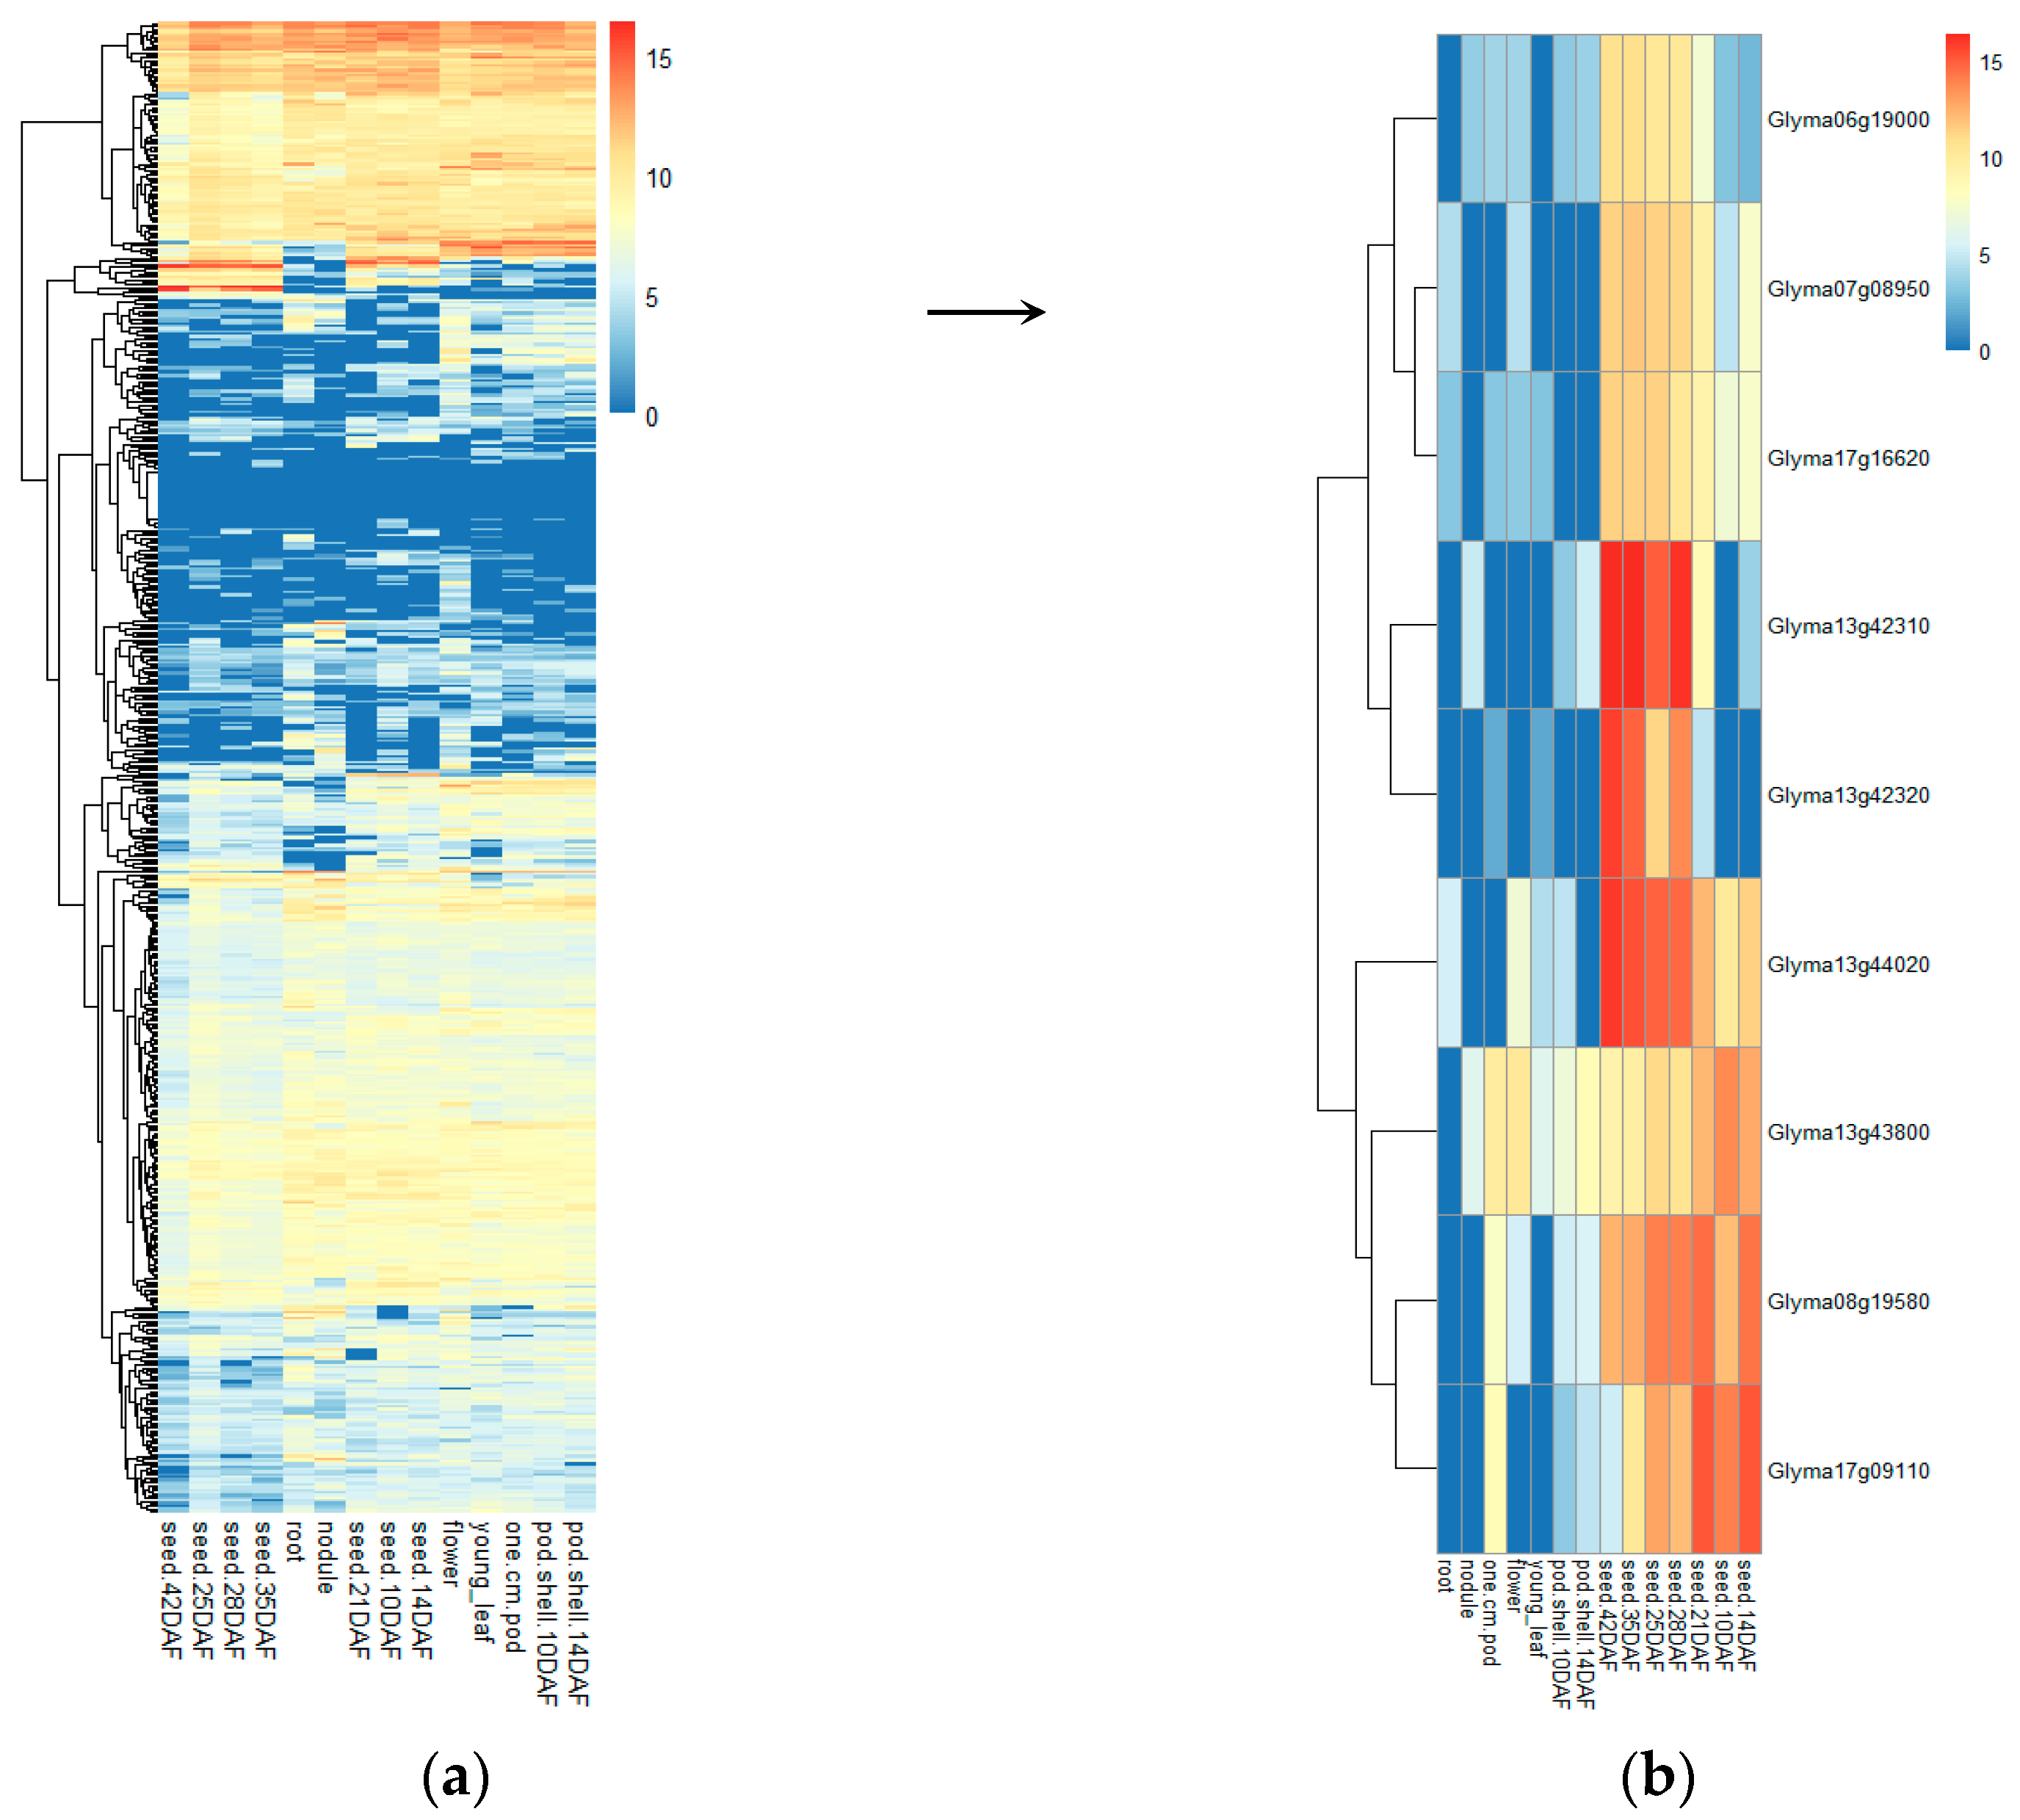
2.8. Differential Expression Analysis of Potential Candidate Genes in 14 Tissues

RNA-seq data of candidate genes in different soybean tissues (root, nodule, one cm of pod, flower, young leaf, pod shell and seed) and developmental stages were retrieved from SoyBase (https://www.soybase.org/soyseq/; accessed on 10 August 2023; Severin, et al. [25]), however those with high expression levels in seed related tissues were considered as potential candidate genes. Heatmaps of the fragment per kilobase per million mapped fragments values of model genes was used to speculate that these genes may be the key regulatory genes involved in the formation of soybean 100-seed weight.

2.9. Haplotype Block Analysis and Phenotypic Difference Analysis of Potential Candidate Gene Loci

Linkage disequilibrium and haplotype blocks of QTNs/QEIs/QQIs with candidate genes were analyzed by the default “Four Gamete Rule” method in Haploview software 4.2 [26], and the difference of HWS between each group in each haplotype block was evaluated by t-test, with the threshold p < 0.05.

3. Results

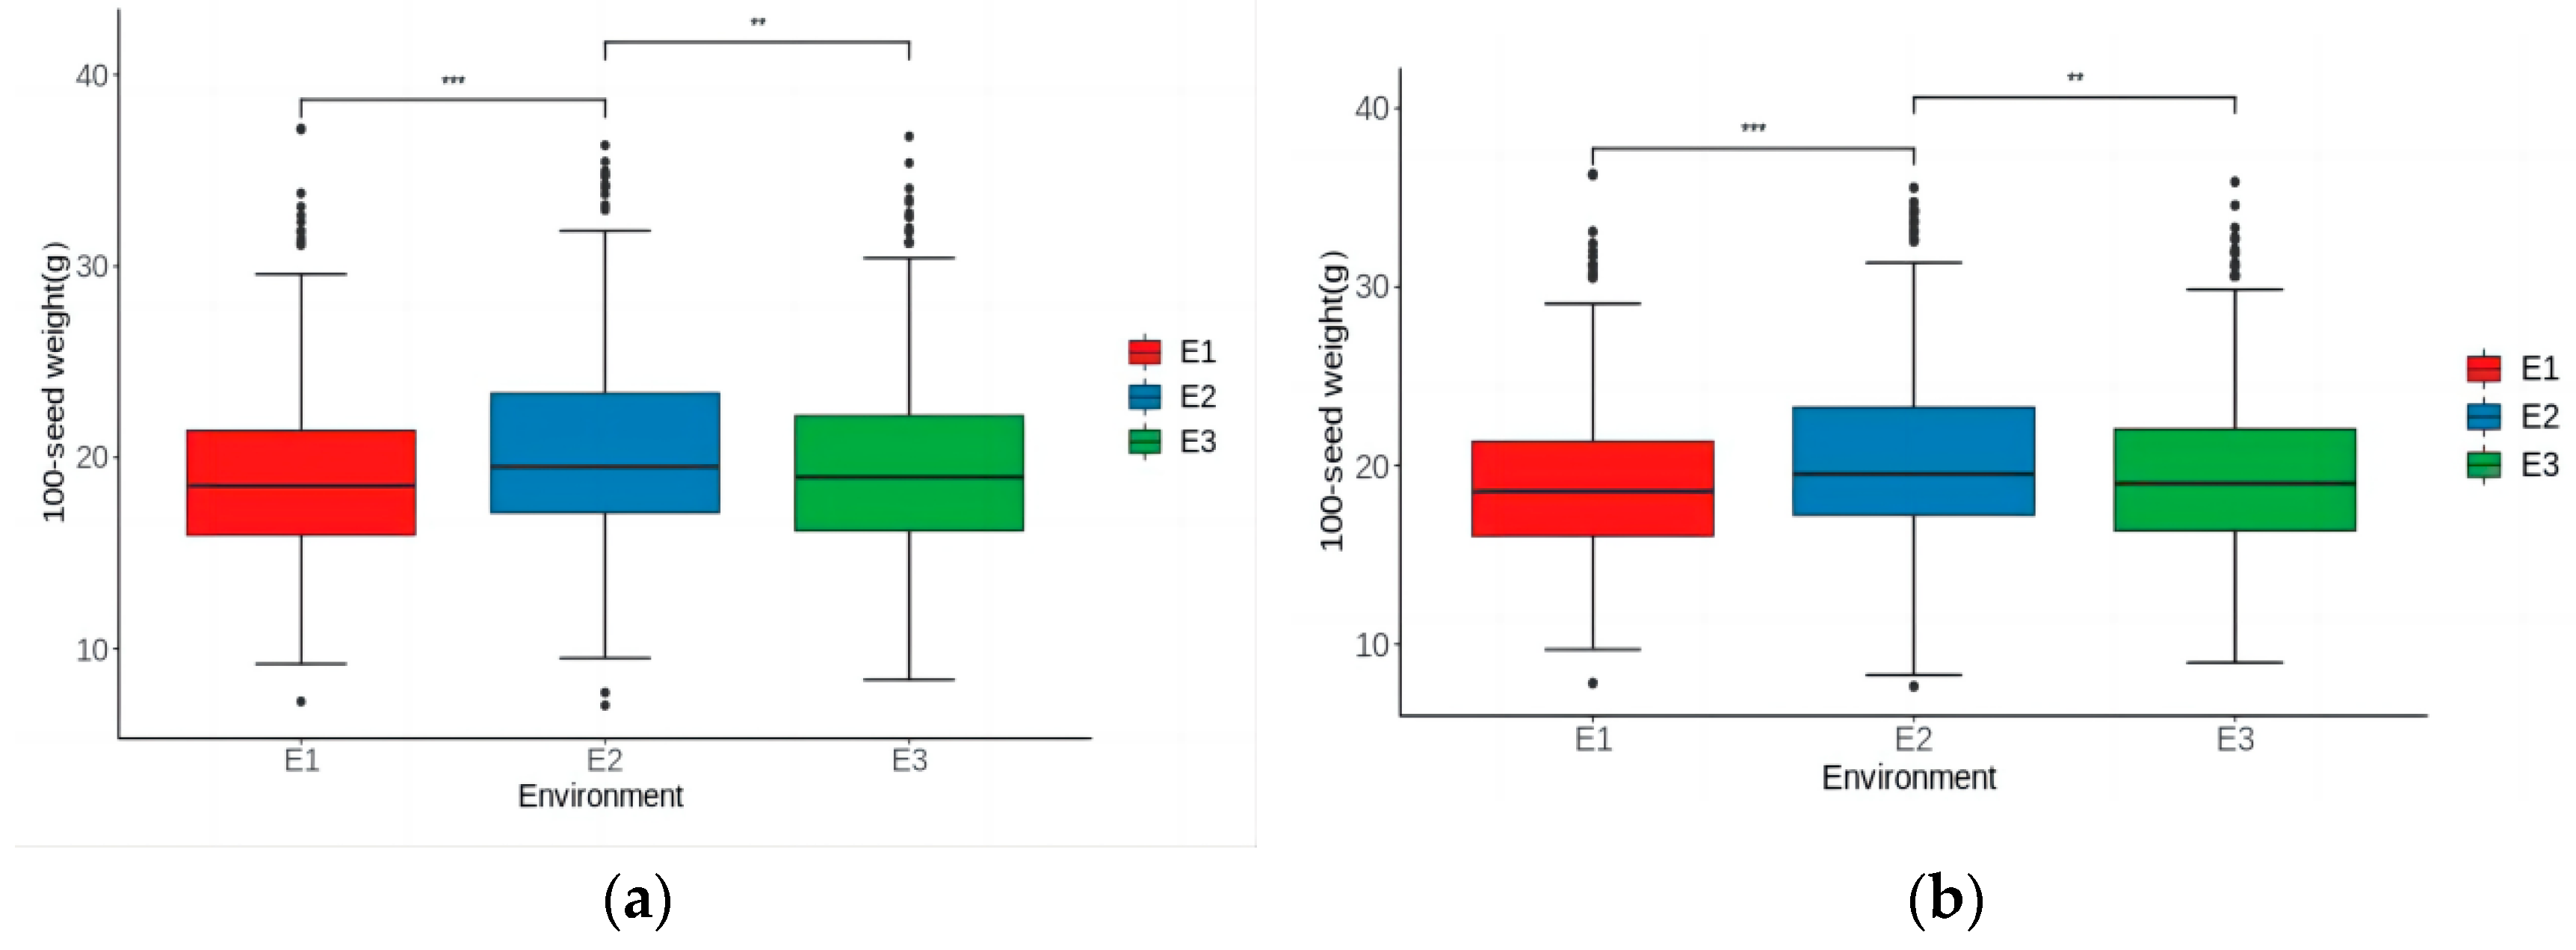
3.1. Phenotypic Analysis of 100-Seed Weight

The HSW of 573 soybean breeding lines were identified in E1 to E3 environments, the descriptive statistics analysis of Mean-phenotype showed that the average of the three environments E1~E3 ranged from 18.99 to 20.29 (g), and the highest phenotype values were observed in E1, while the lowest phenotype values were observed in E2, the difference between the highest value and the lowest value is 30.15 (g). The coefficients of variation were 23, 24 and 25 (%) respectively, and the board-sense heritability (h2) ranged from 94.6 to 96.4 (%) (Table 1).
After analyzing of the BLUP-phenotype, the average is 18.99~20.28 g, and the coefficient of variation is 22, 23 and 24%, respectively (Table 1), the h2 of HSW in E1~E3 environments are 95.13, 96.87 and 94.8%, respectively. Both the average and h2 of E2 were the highest by comparison, indicating that genetic effects play an important role in phenotypic variation. The t-test results showed that E1 and E2, E2 and E3 in Mean-phenotype and BLUP-phenotype were significantly different (Figure 1).

3.2. Association Analysis of Mean-Phenotype for 100-Seed Weight

3.2.1. QTNs of Single Environment Analysis

The results of single environment association analysis in 3VmrMLM method showed that 33, 25 and 25 significant main effect QTNs were detected in environment E1, E2 and E3, respectively, a total of 83 QTNS were detected, among which E1 contributed with the most loci (Figure 2). The log of odd (LOD) scores of these QTNs ranged from 4.04 to 38.24, phenotypic variation explained (R2) values ranged from 0.30 to 3.18%, and QTNs effect ranged from 0.37 to 1.57, indicating that these main effect QTNs may be small effect loci related to HSW. The sum of phenotypic variation explained in single environment were ranged from 36.77 to 39.71. Among them, 12 QTNs are located on chromosome 13, which was the greatest number of SNPs in the same chromosome, accounting for 14.45% of the total number of significant QTNs. Moreover, 2 main effect QTNs were detected simultaneously in at least two environments, among which Gm05_37024496 was detected simultaneously in E2 and E3, with LOD scores of 8.65 and 12.41, respectively; Gm13_41961934 was detected in both E1 and E3, with the LOD scores of 7.98 and 5.07, respectively (Table 2).

3.2.2. QTNs and QEIs of Multi-Environment Dataset Joint Analysis

In this study, a total of 63 main effect QTNs and 11 QEIs were detected through joint analysis of phenotypic data of three environments E1, E2 and E3 (Figure 2). Among these 63 QTNs, the p-value ranged from 9.18 × 10⁻¹⁷~4.47 × 10⁻⁸ and LOD scores ranged from 3.47 to 104.26; the overall R2 for 63 main effect QTNs was 35.31%. For the 11 QEIs, their LOD scores were all greater than 7.00, and R2 values was 8.52%, suggesting these QEIs accumulatively play an important role in modulation of HSW. The 11 significant QEIs indicated that there was significant gene-environment interaction in soybean 100-seed weight, which was consistent with the results of analysis of variance for phenotypic data.

3.2.3. QTNs and QQIs of Epistasis Analysis

In the detection of QQIs, it requires the fact that the enormous computational requirements for epistasis analysis when there are a large number of markers, therefore, to solve this issue, 5768 SNPs obtained from further filtering through “-blocks” in PLINK1.9 was used. Finally, 1 main effect QTN and 24 significant QQIs were detected (Figure 2). The LOD scores of main effect QTN was 4.30, with p-value of 8.68 × 10⁻⁶, the effect value was 1.18, and R2 was 2.99%. The LOD scores of 24 QQIs ranged from 3.01 to 10.21, with p-values of 7.21 × 10⁻¹²~1.98 × 10⁻⁴, QQIs effect of 0.10 to 1.05, and R2 values was 35.09%.

3.2.4. Stable QTNs of Single Environment, Multi-Environment and Epistasis Analysis

By comparing the results of single environment and multi-environment association analysis, it was found that 20 main effect QTNs simultaneously appeared in both types of analyses (Table 2). Among them, 8, 4, and 9 QTNs detected in multi-environments analysis were simultaneously detected in the single environment analysis of E1, E2, and E3, respectively (Table 2). This indicated that the multi-environmental datasets joint analysis can reduce the accumulation of gene-environment interaction effects, effectively reduce the impact of environment, detect more stable loci related to trait [19]. Gm13_41961934 was detected as the main effect QTN in E1, E3 and multi-environment analysis, in these three cases, its LOD scores were 7.97, 5.07 and 16.37, and its effect values were 0.52, 0.56 and 0.44, respectively, R2 values were 0.80, 0.73 and 0.48%, respectively. Gm15_32270601 appeared simultaneously as the main effect QTN of E3 and the QEI of multi-environment, its LOD scores were 15.60 and 19.91, respectively, and R2 values were 1.59 and 1.05%, respectively (Table 2). It is speculated that this locus, which interacts with the environment, has a significant impact on the phenotypic variation of 100-seed weight in the E3 environment.
Table 2. Stable QTNs detected in single environment, multi-environment, and epistasis association analysis for Mean-phenotype.
QTNs aChr bLOD cEffect dR2 (%) eTypes of QTNs Detected f
Gm05_3702449658.65, 12.410.70, 0.880.75, 1.13E2, E3
Gm04_36981242438.24, 104.261.23, 1.171.78, 1.41E1, Multi-environment QTN
Gm07_7333790715.33, 52.04−0.74, −0.800.60, 0.60E1, Multi-environment QTN
Gm08_4692303830.47, 57.581.08, 0.842.71, 1.45E1, Multi-environment QTN
Gm13_102825731312.95, 22.97−0.68, −0.510.54, 0.27E1, Multi-environment QTN
Gm13_267504641310.68, 7.650.61, 0.301.49, 0.31E1, Multi-environment QTN
Gm17_136588641720.12, 7.960.86, 0.302.37, 0.26E1, Multi-environment QTN
Gm03_372470539.29–30.060.73, 0.601.17, 0.83E2, Multi-environment QTN
Gm07_22276117711.28, 61.190.80, 0.870.72, 0.89E2, Multi-environment QTN
Gm16_153334181618.57, 16.90−1.05, −0.440.89, 0.17E2, Multi-environment QTN
Gm02_569851724.28, 4.490.51, 0.231.09, 0.23E3, Multi-environment QTN
Gm08_1454519086.49, 51.24−0.63, −0.791.25, 2.07E3, Multi-environment QTN
Gm09_437632398.04, 15.310.70, 0.422.05, 0.77E3, Multi-environment QTN
Gm10_39624231012.92, 6.160.90, 0.271.80, 0.17E3, Multi-environment QTN
Gm14_407219101411.56, 11.270.85, 0.361.62, 0.31E3, Multi-environment QTN
Gm18_4966581817, 10.96−1.04, −0.361.26, 0.16E3, Multi-environment QTN
Gm19_34854234197.86, 7.99−0.69, −0.301.10, 0.21E3, Multi-environment QTN
Gm18_554912351810.11, 6.110.79, 0.602.33, 0.35E3, epistasis QQI
Gm15_322706011515.60, 19.911.0, 0.671.59, 1.05E3, Multi-environment QEI
Gm13_41961934137.97, 5.07, 16.370.52, 0.56, 0.440.80, 0.73, 0.48E1, E3,
Multi-environment QTN
Gm06_1271502610.97, 15.80, 3.430.62, 0.42, 0.181.62, 0.68, 0.16E1, Multi-environment QTN,
epistasis QQI
Gm11_105066241115.32, 12.14, 4.580.94, 0.38, 0.412.93, 0.49, 0.87E2, Multi-environment QTN,
epistasis QQI
Gm01_47969266118.36, 4.330.46, 0.940.46, 3.69Multi-environment QTN,
epistasis QQI
Gm02_445346225.34, 4.330.24, 0.940.18, 3.70Multi-environment QTN,
epistasis QQI
a: Stable QTNs, the naming followed Glycine max (Gm) adding chromosome number underscore with the position of the SNP. b: The chromosome where QTN is located. c: Log of odds. d: The statistical estimate of QTNs effect. e: Phenotypic variation explained by each QTN. f: Situations where Loci detected at least twice in single-environment, multi-environment, and epistatic analysis for Mean-phenotype. E1 indicates that the locus was detected in single-environment E1; E2 and E3 are the same; Multi-environment QTN indicates that locus is main QTN detected in multi-environment; Multi-environment QEI indicates that locus is QEI detected in multi-environment; epistasis QQI indicates that the locus is one QTN of QQIs detected in epistatic analysis.
Five QQIs in epistasis analysis were detected simultaneously in single environment and multi-environment analysis. Gm18_55491235, the main effect QTNs of single environment had QTN-QTN interaction with Gm07_36350977. In addition, Gm01_47969266, Gm02_4453462, Gm06_1271502 and Gm11_10506624 are both main effect QTNs of multi-environment dataset joint analysis and QQIs of epistasis analysis. Among them, Gm06_1271502 and Gm11_10506624 appeared in significant QTNs of single environment. The LOD scores of Gm06_1271502 in single environment, multi-environments and epistasis analysis were 10.97, 15.80, and 3.43, respectively. The LOD scores of Gm11_10506624 in single environment, multi-environment and epistasis analysis were 15.32, 12.14 and 4.59, respectively.

3.3. Association Analysis of BLUP-Phenotype of 100-Seed Weight

In this study, BLUP-phenotype was used as another phenotypic data, which is not only beneficial for selecting the relatively stable QTNs, QEIs and QQIs, but also provide complementation on the basis of significant loci detected by Mean-phenotype, in order to mining of potential candidate genes related to soybean genetic breeding.

3.3.1. QTNs of Single Environment Analysis

The results of single environment analysis by 3VmrMLM showed that 82 main effect QTNs were found in E1, E2 and E3 environments (Figure 2), with LOD scores between 3.95 and 35.47, R2 values ranged from 0.34% to 3.19%, and QTNs effect ranged from 0.36 to 1.48. The overall phenotypic variation explained were 36.78–38.04%. The number of QTNs detected in E1 is the highest, which was 32. These 82 QTNs are unevenly distributed on 20 chromosomes, with a higher number of QTNs distributed on chromosomes 7, 8, 13, and 14, ranging from 6 to 11, chromosome 13 has the highest number of QTNs, accounting for 13.41% of the total QTNs. Four QTNs were detected in at least two single environments. Specifically, Gm03_3724705 was detected simultaneously in E1 and E2, with the LOD values of 18.74 and 6.99, respectively; Gm04_5395873 was also detected in E1 and E2, with the LOD values of 10.10 and 9.30, respectively; Gm05_37024496 was detected simultaneously in E2 and E3, with the LOD values were 8.43 and 11.85, respectively; Gm14_9347269 was detected in E1 and E3, with the LOD values of 24.28 and 35.47, respectively (Table 3).

3.3.2. QTNs and QEIs of Multi-Environment Dataset Joint Analysis

A total of 55 main effect QTNs and 13 QTN-environment interaction QEIs were detected in the multi-environment dataset joint analysis (Figure 2). The LOD scores of the 55 main-effect QTNs ranged from 3.26 to 110.58, with p values ranging from 9.5 × 10−113 to 1.08 × 10⁴, and R2 values was 38.1%. The LOD scores of 13 QEIs ranged from 3.75 to 20.78, and R2 values was 8.89%.

3.3.3. QTNs and QQIs of Epistasis Analysis

In epistasis analysis, 1 main-effect QTN and 27 pairs of QTN-QTN interaction QQIs were detected with the above 5768 SNPs in epistasis analysis of BLUP-phenotype (Figure 2). More significant QTNs were detected in the form of QQI. The LOD scores of main effect QTN was 3.97, its effect was 0.97, and the R2 values was 2.56%. LOD scores of QTN-QTN interaction QQIs ranged from 3.01 to 7.31, epistatic effect ranged from 0.05 to 0.88, and R2 was 34.77%.

3.3.4. Stable QTNs of Single Environment, Multi-Environment and Epistasis Analysis

In all, 11 main-effect QTNs were detected in both single environment analysis and multi-environment analysis, with 5, 2 and 4 QTNs in E1, E2, and E3, respectively, which were simultaneously detected (Table 3). Comparison with the Mean-phenotype, Gm15_32270601 was again detected as the main effect QTN in E3 and QEI, with LOD scores of 15.34 and 19.58, and effect values of 0.93 and 0.66, and phenotypic interpretation rate R2 of 1.56 and 1.11%, respectively. Given the influence of environmental factors on gene expression and phenotypic stability, Gm15_32270601 as QTNs of E3 and QEI detected repeatedly appeared in both Mean-phenotype and BLUP-phenotype suggesting that it had significant effect on phenotypic variation of 100-seed weight in E3 environment (Table 3).
Table 3. Stable QTNs detected in single-environment, multi-environment, and epistatic association analysis for BLUP-phenotype.
QTNs aChr bLOD cEffect dR2 (%) eTest Results f
Gm04_5395873418.74, 6.99−0.82, −0.601.87, 0.81E1, E2
Gm03_3724705310.10, 9.300.60, 0.701.03, 1.17E1, E2
Gm05_3702449658.43, 11.850.66, 0.810.73, 1.07E2, E3
Gm14_93472691424.28, 35.47−0.94, −1.481.18, 2.37E1, E3
Gm06_48581982610.77, 16.44−0.61, −0.431.99, 0.85E1, Multi-environment QTN
Gm07_7333790717.86, 68.04−0.79, −0.900.78, 0.86E1, Multi-environment QTN
Gm13_434802801312.02, 21.88−0.64, −0.491.30, 0.67E1, Multi-environment QTN
Gm20_34264812206.39, 8.580.47, 0.311.04, 0.39E1, Multi-environment QTN
Gm19_83517661913.69, 74.540.86, 0.960.66, 0.89E2, Multi-environment QTN
Gm06_1390937668.35, 14.90−0.65, −0.411.97, 0.82E2, Multi-environment QTN
Gm08_1454519087.04, 31.76−0.61, −0.601.35, 1.34E3, Multi-environment QTN
Gm09_437632398.07, 9.090.65, 0.322.05, 0.48E3, Multi-environment QTN
Gm10_39624231012.86, 14.010.84, 0.391.79, 0.41E3, Multi-environment QTN
Gm19_34854234197.88, 13.34−0.65, −0.381.10, 0.34E3, Multi-environment QTN
Gm15_322706011515.34, 19.580.93, 0.661.56, 1.11E3, Multi-environment QEI
Gm14_18307701410.2, 3.61−0.59, −0.511.20, 1.20E1, epistasis QQI
Gm18_554912351810.72, 4.850.77, 0.222.47, 0.33E3, epistasis QQI
Gm02_445346224.93, 13.93, 4.470.40, 0.40, 0.590.62, 0.50, 1.86E1, Multi-environment QTN,
epistasis QQI
Gm06_1271502644.82, 5.090.72, 0.42.16, 0.99Multi-environment QTN,
epistasis QQI
Gm15_470351631526.52, 5.120.55, 0.531.41, 1.87Multi-environment QTN,
epistasis QQI
a: Stable QTNs, the naming followed Glycine max (Gm) adding chromosome number underscore with the position of the SNP. b: The chromosome where QTN is located. c: Log of odds. d: The statistical estimate of QTNs effect. e: Phenotypic variation explained by each QTN. f: Situations where Loci detected at least twice in single-environment, multi-environment, and epistatic analysis for BLUP-phenotype. E1 indicates that the locus was detected in single-environment E1; E2 and E3 are the same; Multi-environment QTN indicates that locus is main QTN detected in multi-environment; Multi-environment QEI indicates that locus is QEI detected in multi-environment; epistasis QQI indicates that the locus is one QTN of QQIs detected in epistatic analysis.
Moreover, Gm02_4453462, Gm14_1830770 and Gm18_55491235 were detected as both main effect QTNs in single environment and QQIs in epistasis analysis. Gm02_4453462, Gm06_1271502, and Gm15_47035163 were identified as multi-environment main effect QTNs and epistatic QQIs. The LOD scores of three QTNs varied widely: Gm02_4453462 (4.47–4.93), Gm06_1271502 (5.09–44.82) and Gm15_47035163 (5.12–26.52). Gm02_4453462 particularly was detected simultaneously in single-environment analysis, multi-environment analysis, and epistatic analysis (Table 3), indicating that this locus is stable and would be valuable for further studies to unravel its contribution to 100-seed weight in the mapping population.

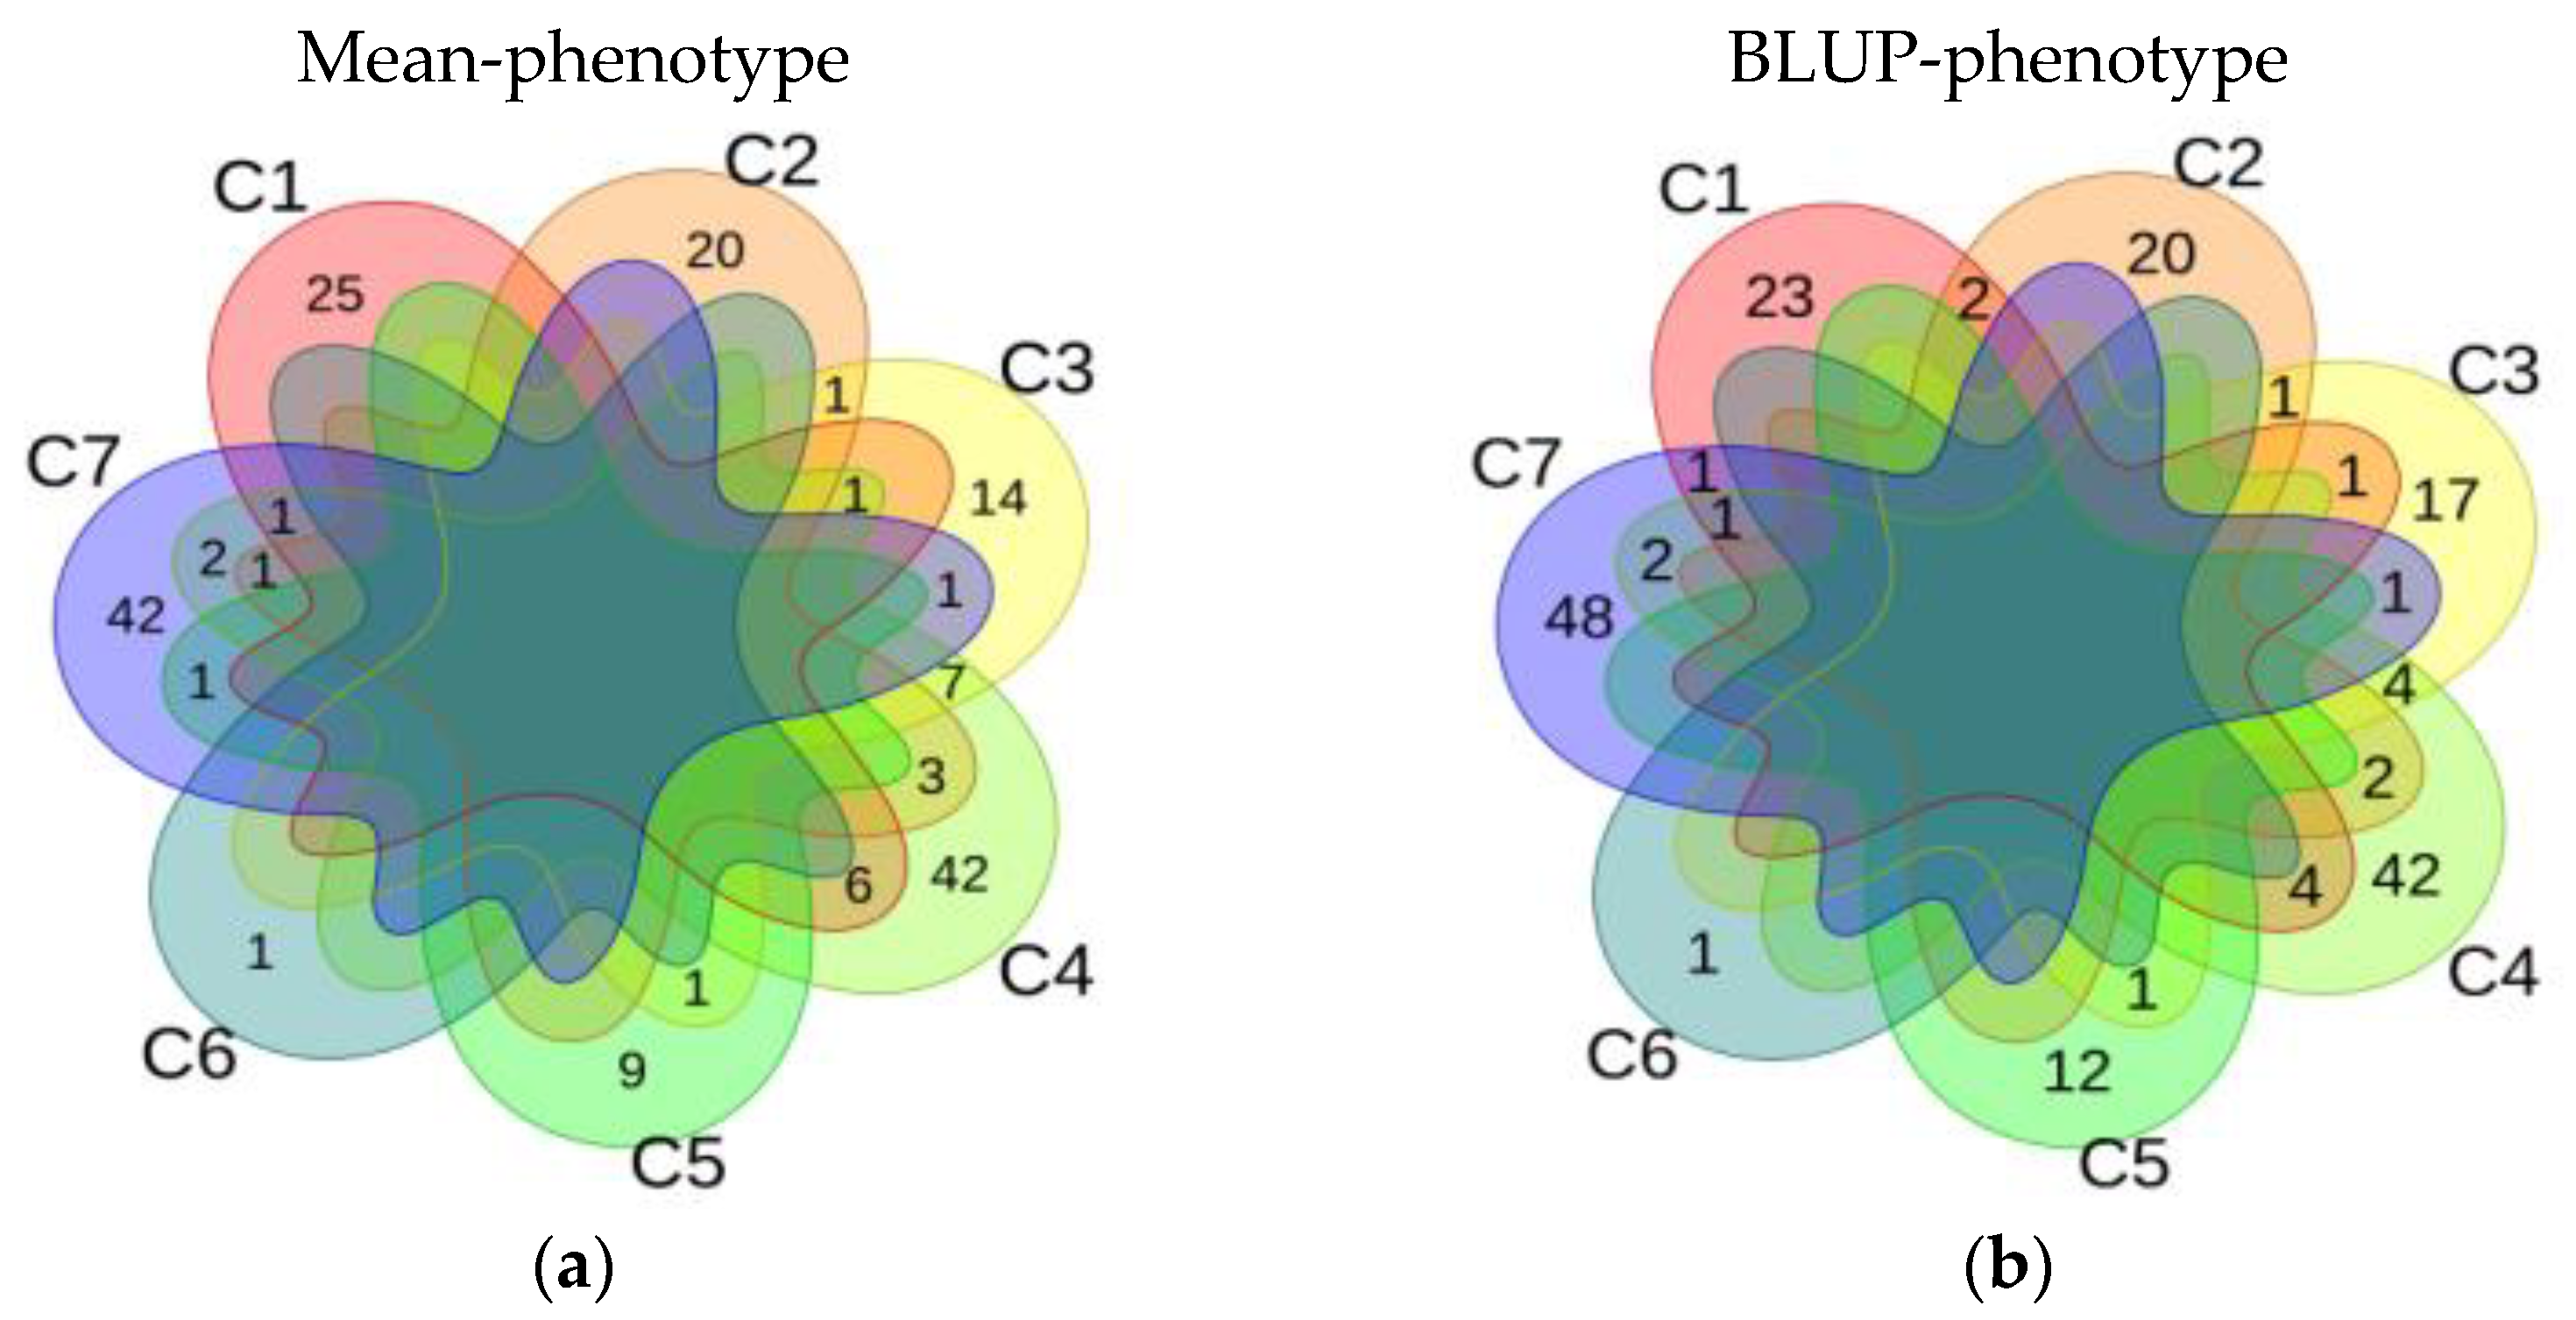
3.4. Comprehensive Results of Association Analysis of Mean-Phenotype and BLUP-Phenotype in Soybean HSW

The stability QTN is crucial for its practical use in plant breeding, therefore, this study selected stable loci that were identified in at least two scenarios (single environment analysis for detecting main-effect QTNs, multi environment dataset joint analysis for detecting main-effect QTNs and QEIs, epistatic analysis for detecting main-effect QTNs and QQIs) from the results of association analysis based on Mean- and BLUP-phenotype. Based on the above criteria, 24 stable loci were detected in Mean-phenotype (Table 2) and 20 stable loci in BLUP-phenotype (Table 3). Among them, 11 loci were mapped using the Mean-phenotype and BLUP-phenotype, while the remaining 13 and 9 loci complemented each other (Figure 3). Among the 13 complementary loci provided by Mean-phenotype, except Gm08_4692303, the other 12 loci appeared in either single environment, multi-environment or epistatic analysis of BLUP-phenotype.
In addition, 9 complementary loci were detected by BLUP-phenotype, out of these, 7 loci also appeared in the significant but unstable QTNs of mean-phenotype with exception of Gm06_48581982 and Gm15_47035163. Therefore, the cross-validation of complementary loci once again proved the reliability of screening loci in this study.
The 33 loci were distributed on 18 chromosomes, the number of loci distributed on chromosome 13 is greatest, with a total of four, followed by chromosome 2, 6, 14 and 19, with 3 loci each. Among them, Gm06_1271502 was found as the main effect QTN in a single environment (E1), QTN of multi-environment and QQI of epistasis analysis in Mean-phenotype, and QTN of multi-environment and QQI of epistasis analysis in BLUP-phenotype. On the other hand, Gm02_4453462 was detected as a QTN of multi-environment and QQI in Mean-phenotype, and QTN of single environment, QTN of multi-environment and QQI in BLUP-phenotype (Table 2 and Table 3). The high frequency occurrence of the above two loci not only shows the stability of 3VmrMLM method in mining QTN of quantitative traits, but also indicates that these two loci may have significant role in modulating 100-seed weight trait. We compared genomic regions of these 33 loci with previously reported gene locations associated with 100-seed weight and found that 23 of them colocalized within/near the vicinity of known markers/QTL (Supplementary Materials: Table S1), while 10 QTNs are being reported as novel in this study to the best of our knowledge.
In addition, this study compared 24 and 27 pairs of QQIs detected respectively by Mean-phenotype and BLUP-phenotype, and found that 10 pairs of QQI were duplicated (Table 4). Five QQIs of them, phenotypic variation explained by each pairs of QQIs was higher in GWAS results of Mean-phenotype and BLUP-phenotype. Specifically, the QQI between Gm02_25227246 and Gm11_16022081 explained 3.50% PV in Mean-phenotype (3.16% in BLUP-phenotype), and the QQIs between Gm06_13595169 and Gm06_14999200 explained 4.64% (4.17%) PV. Moreover, compared with the QTNs located by main effect model in Karikari et al. [20] and the study, 75% of the 20 QTNs in these QQIs were detected only in epistasis analysis, indicating that these epistatic QTNs significantly associated with HSW are not easily found as the main-effect QTNs. Through further study of the interaction patterns of these 10 pairs of QQIs, it is helpful to understand the expression mode and interaction of genes, revealing the operation mechanism of genetic information, and effectively guide the breeding work.

3.5. Exploration and Analysis of Candidate Genes for Soybean 100-Seed Weight

3.5.1. Identification of Potential Candidate Genes through Functional Annotation of Homologous Genes in Arabidopsis

Using G. max William82 reference gene model 1.0 on SoyBase database, we searched for model genes around stable QTNs (±500 kb) in the Mean- and BLUP-phenotype, and a total of 2920 model genes for 33 stable loci and 1504 model genes for 10 pairs of stable QQIs were retrieved. Based on the annotation information retrieved, 704 potential candidate genes may be involved 100-seed weight regulation according to homology in Arabidopsis functional annotation. Among them, 4, 556 and 313 candidate genes were identified with genomic regions of QEIs, main-effect QTNs and QQIs, respectively.
The candidate gene Glyma06g17520, Glyma06g17530 and Glyma06g17540 located within the 42 kb region of Gm06_13909376, and the gene Glyma08g19580 appeared in Gm08_14545190 have been annotated to be involved in sucrose transport process. Sucrose acts as carbon assimilation and transport during plant photosynthesis to produce organic matter for its own growth, its synthesized in green leaves and transported to various organs and tissues through phloem, sucrose transporters play a crucial role in seed development [27]. In addition, 17 candidate genes belong to sugar transporter family known to contribute to the plant transport of carbon-containing compounds.
Lu et al. [7] found that PP2C-1 interacts with transcription factors in the brassinosteroids signaling pathway, thus activating transcription factors through dephosphorylation and changing the expression of downstream genes related to seed size to increase seed weight. In this study, we identified a candidate gene Glyma05g32231 in Gm05_37024496, its a highly abscisic acid (ABA) induced PP2C gene that may play a role in increasing seed weight phenotype in soybean.
In the loci Gm07_7333790 and Gm18_496658, we found three candidate genes (Glyma07g08851, Glyma18g01610, and Glyma18g01605) that encode proteins belonging to the ABC (ATP-binding cassette) transporter family. Studies have shown that ABC transporters are kinds of proteins with transport biological function. These transporters have been shown to be involved in regulating seed size and weight [20,28].
In addition to sucrose/monosaccharide/sugar transport, seed weight is related to many factors such as flower/other parts development, cell cycle, cell proliferation, cell wall modification, and the regulation of various hormones such as jasmonic acid, gibberellin, abscisic acid, auxin, brassinosteroids, etc. In the past few decades, several signalling pathways have been identified that determine seed size by regulating maternal tissue or endosperm growth, such as ubiquitin-proteasome pathway, and G protein signalling pathway, etc. [29]. These signalling pathways and phytohormones may affect the final soybean yield to varying degrees.

3.5.2. Identification of Candidate Genes through Differential Expression Analysis

In order to further identify the candidate genes related to seed weight, we identified the expression of 571 of the candidate genes in 14 different tissues using RNA-seq data provided by the SoyBase website. Then we searched for genes with significant expression difference by heatmap analysis of fragments per kilobase per million mapped fragments (FPKM) values of these candidate genes, speculating that these genes may be the key regulatory genes involved in the process of seed weight formation. The 571 candidate genes are from main-effect QTNs or QQIs, while RNA-seq data for four candidate genes from QEI are provided on SoyBase website.
The results showed that among the soybean HSW, 9 potential candidate genes (Glyma06g19000, Glyma08g19580, Glyma07g08950, Glyma13g42310, Glyma13g42320, Glyma13g44020, Glyma13g43800, Glyma17g16620 and Glyma17g09110) are highly expressed in seed-related tissues/developmental stages and were clustered together, suggesting that they may play vital roles in seed weight formation (Figure 4). For example, Glyma07g08950 (GA20OX) is involved in flower development; Glyma08g19580 (GmSWEET24) not only plays an important role in sucrose transmembrane transport, but also responds to cell stimulation of abscisic acid; Glyma13g42310 (LOX2) and Glyma13g42320 (LOX1.1) mediate cell response to abscisic acid stimulation; Glyma13g44020 (GmPM30) regulates embryonic development and plant-type cell wall modification; Glyma17g16620 (GmPM16) controls seed development processes in addition to regulate embryonic development (Table 5). Seven of these genes were all candidate genes obtained within the QTNs in single-environment or multi-environment analysis, and the other two genes (Glyma06g19000 and Glyma17g09110) were located within the QQIs genomic regions. Therefore, epistatic analysis is helpful to identify the genes related to 100-seed weight.

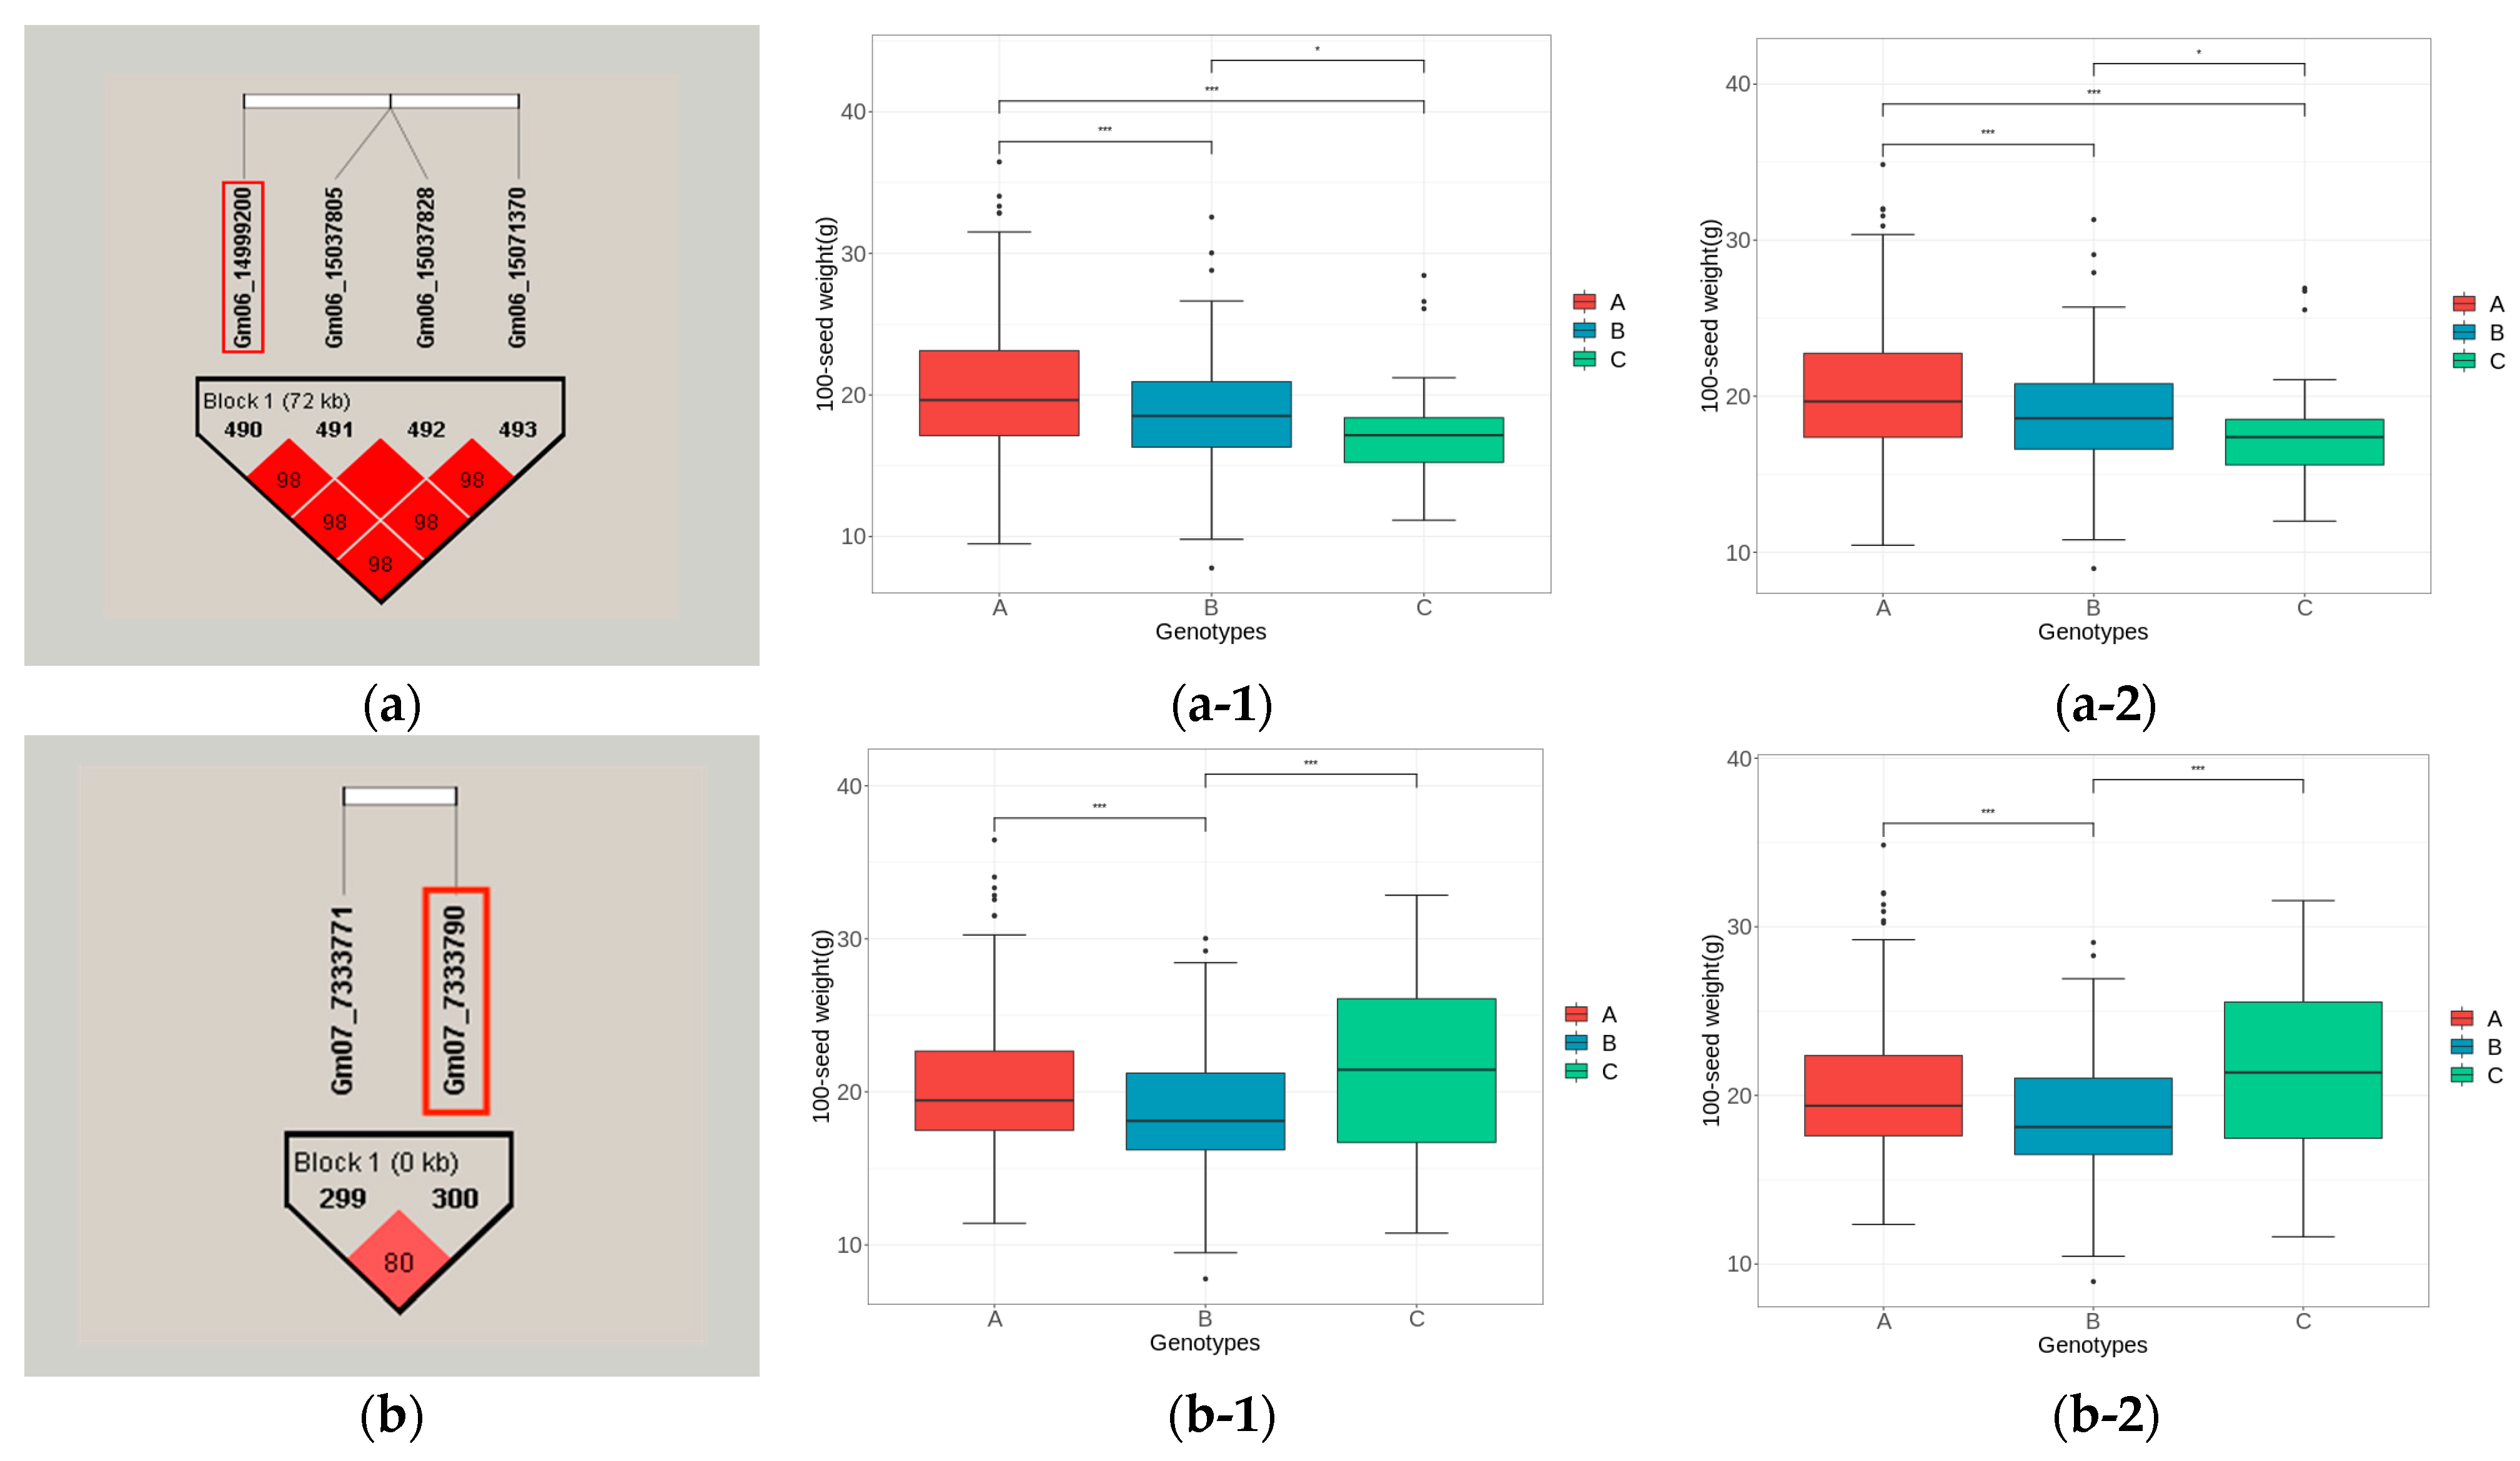
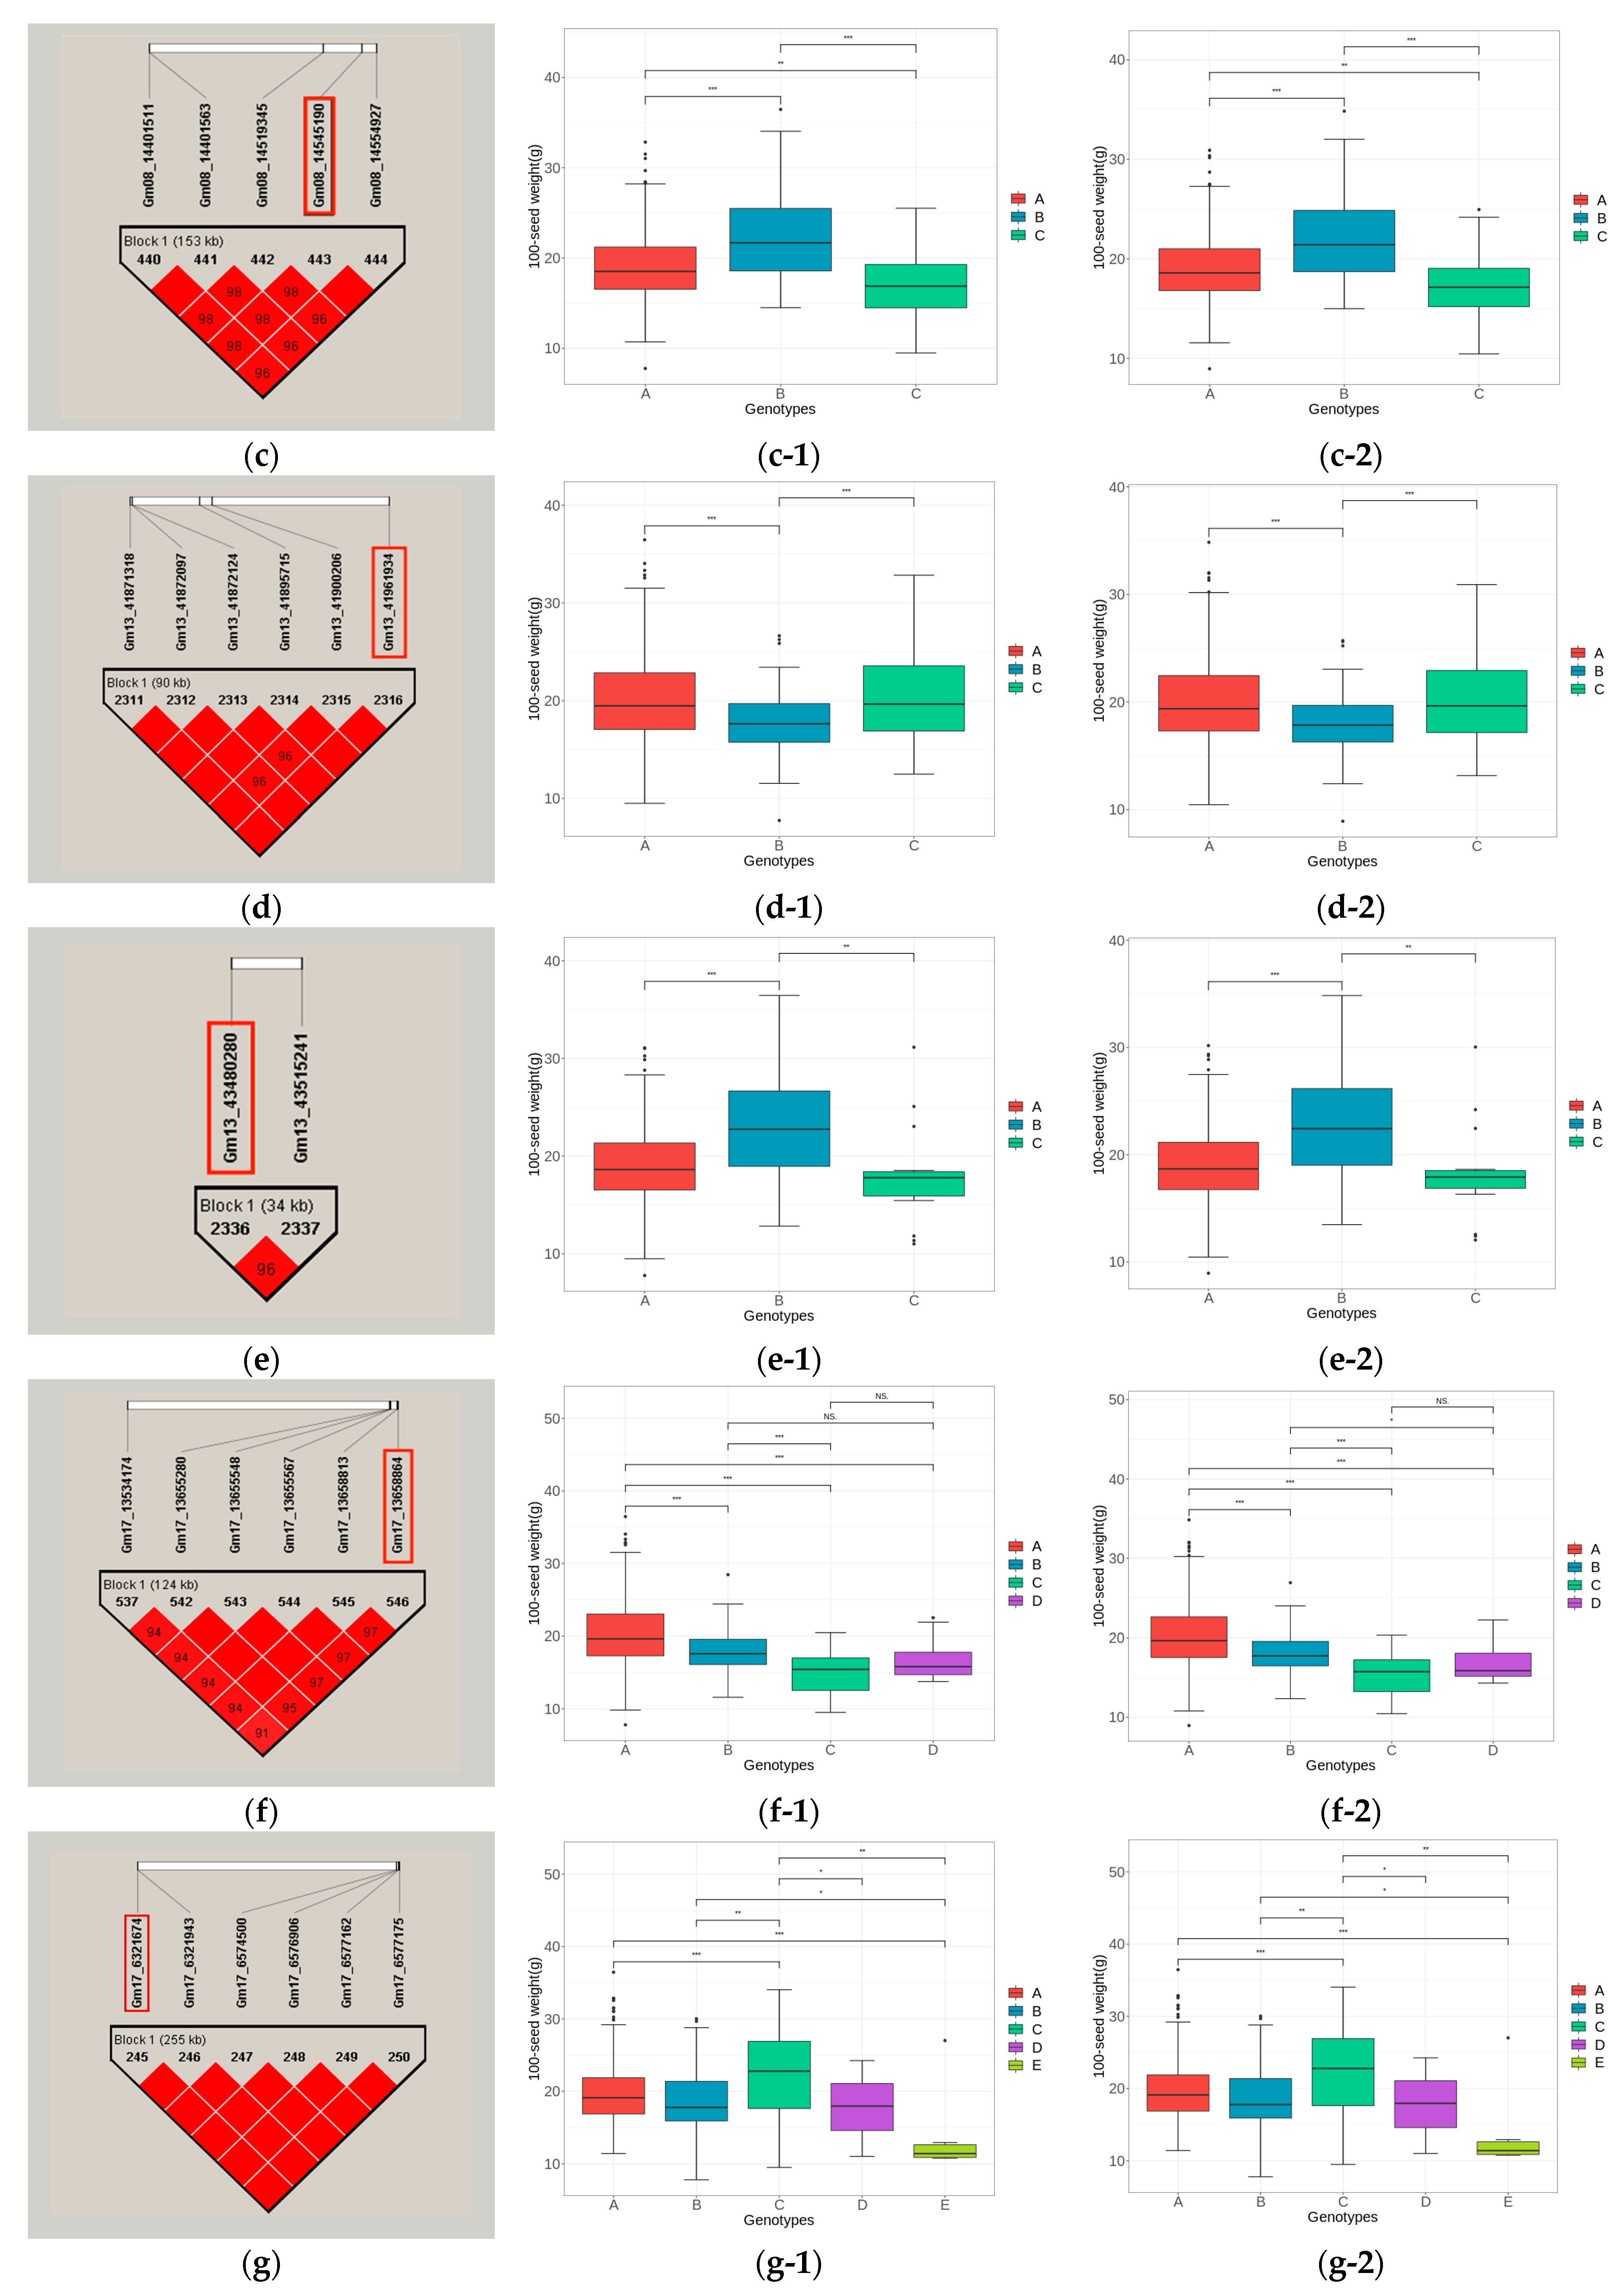
3.5.3. Haplotype Block Analysis of Candidate Genes

In order to effect of haplotypes and their associated alleles on 100-seed weight, we conducted haplotype block analysis on 7 QTNs, with upstream and downstream 500 kb (Table 5). Figure 5 shows the linkage disequilibrium and haplotype blocks of Gm06_14999200, Gm07_7333790, Gm08_14545190, Gm13_41961934, Gm13_43480280, Gm17_13658864, and Gm17_6321674 and their nearby 500 kb SNPs. The distance of each block ranged 0~255 kb with 2~7 closely linked SNPs and these grouped the mapping population into 3~5 different phenotypic groups. There were 2 candidate genes in the haplotype block Gm13_41961934 and the remaining four blocks each have one candidate gene. By t-test analysis, there exist significant variation among the grouping based on either Mean- or BLUP-phenotype around the stable SNPs (Figure 5a–g). Among them, Gm06_14999200, Gm07_7333790, Gm08_14545190, and Gm17_6321674 are the loci detected by Mean-phenotype and BLUP-phenotype together, while Gm13_41961934 and Gm17_13658864 are detected separately by Mean-phenotype. Gm13_43480280 was detected by BLUP alone. Therefore, the seven stable loci were from the two different phenotypes, which again verified the necessity of using Mean-phenotype and BLUP-phenotype for complementary detection in this study.

4. Discussion

4.1. Comparison between Stable QTNs Identified in This Study and Reported QTL

According to information published in the SoyBase database, 304 QTL have been mined that correlated with the 100-seed weight. In this study, 33 stable QTNs that were detected by Mean- and BLUP-phenotype and repeated in at least two situations were compared with previous results. Among them, 23 QTNs were 500kb upstream and downstream from the QTL discovered by predecessors (Supplementary Materials: Table S1), including 12 stable QTNs located less than 100kb from the physical positions of previously discovered marker [20,31,32,33,34,35,36], which is a relatively reliable mapping interval. The above results further proved the accuracy of the QTNs obtained in this study. More importantly, ten new stable QTNs were found, including Gm03_3724705, Gm06_1271502, Gm07_2227611, Gm13_10282573, Gm14_1830770 and Gm16_15333418, which will provide a new source for the study of soybean 100-seed weight in the future.

4.2. Detection Capability of the 3VmrMLM Method

In this study, the 3VmrMLM method [19] was used to conduct a diversified association analysis on 61,166 SNPs markers and two phenotypic data. 3VmrMLM overcome the shortcomings of traditional models that could only detected main effect QTNs and did not consider QTN-environment interaction (QEIs) and QTN-QTN interaction (QQIs), to provide more references for phenotypic variation of 100 seed weight of soybean. Specifically, we detected 147 main effect QTNs, 11 QEIs, and 24 pairs of QQIs in the Mean-phenotype, and 138 main effect QTNs, 13 QEIs, and 27 pairs of QQIs in the BLUP-phenotype. The effect estimate, LOD score, phenotypic interpretation rate and other characteristic values of these loci can better analyze the genetic structure of complex traits, pointing the way forward for soybean breeding work. Therefore, multi-environment analysis and epistatic analysis can identify potential candidate genes related to hundred-seed weight that have been masked due to influences of environmental or epistatsis.
The high frequency occurrence of some main effect QTNs not only confirms the stability of the method, but also emphasizes the importance of these QTNs. In this study, Gm02_4453462 and Gm06_1271502 were detected in five different scenarios, indicating that they are of great promise for future use in breeding targeted at altering seed weight for specific a use.

4.3. Significance of QTN-Environment Interaction and QTN-QTN Interaction

Plant growth is affected by external environmental factors. Under current circumstances, global climate change has threatened or is threatening global ecosystem and biodiversity, the increase of temperature and carbon dioxide concentration and the frequency of extreme weather directly hinder the process of crop growth and yield formation, so cultivating excellent germplasm that adapts to climate change is an effective way to solve this problem [37,38,39]. Due to the generation of phenotypes is a complex process, which is influenced by environment (internal environment, external environment) as well as genes (alleles, non-alleles) [14,40], most of the traits are the result of the combined effect of heredity and environment, and QEIs as a gene-environment interaction locus have been gradually valued in the research of mining quantitative trait loci [16,17,18,27]. In this study, we used the multi-environment dataset joint analysis in 3VmrMLM and found 11 and 13 QEIs in the Mean- and BLUP-phenotype, respectively. Among them, 6 QEIs were detected simultaneously in both sets of phenotypes, they were Gm08_16964379, Gm13_7443815, Gm15_32270601, Gm17_3520036, Gm20_33516364 and Gm20_43250246, respectively. For the stable locus Gm15_32270601 among them, four potential candidate genes Glyma15g29880, Glyma15g29200, Glyma15g29340 and Glyma15g29410 were screened according to functional annotation of Arabidopsis thaliana, which may be related to 100-seed weight of soybean. They can be considered as new candidate genes for further analysis. These QEIs not only provide strong support for the cultivation of soybean germplasm adapted to environmental changes and promote the realization of high and stable yield of soybean, but also contribute important genetic resources for addressing the challenge of climate change.
Epistasis refers to the non-additive interactions between genes located in different seats in population genetics and quantitative genetics [15,41]. In the whole-genome association analysis, some SNPs are not significantly associated with traits under univariate analysis, but after combining with other SNP in multivariate analysis, their association with traits will be significantly enhanced. So, QQIs epistasis plays an important role in the genetic analysis of complex traits [15,42]. However, in practical application, the data of SNPs is as high as tens or even hundreds of thousands, and the computational amounts of epistasis analysis also increases exponentially, the huge data brings great challenge to epistasis analysis in the whole genome. Therefore, SNPs data will be dimensionally reduced before epistatic analysis [19,43]. In this study, genotype data contained 5768 SNPs which were selected through “-blocks” in PLINK1.9 for epistasis analysis to improving the computational efficiency. Although the number of SNPs is small, the results are meaningful, it was shown that Mean- and BLUP-phenotype jointly identified 10 interaction loci, these loci provided a new source of information for the gene interaction research, which enabled researchers to understand the gene expression and interaction more comprehensively, and promoted the process of soybean breeding.

4.4. Potential Candidate Genes Discovered by the Complementary Mapping Approaches

Soybean is a typical dicotyledon crop, whose seeds are composed of internal and external parts, including cotyledon, germ, hypocotyl and radicle, etc. [44], these tissues act together to form the embryo, the core of the seed, while the seed coat protects the embryo externally, and the cotyledon provides nutrition for the seed. The development process of the seed coat and embryo controls the size and weight of the seeds [45]. With the advancement in tissue culture and functional genomics in soybean [46,47,48,49], identification and validation of candidate genes have become integral part of forward genetics. Therefore, the present study relied on genomic resources available on SoyBase to mine potential candidate genes. 6 potential candidate genes are highly expressed in seed-related tissues/developmental stages (Table 5).
Glyma07g08950 (GA20OX) is a key enzyme in GA biosynthesis, it plays an indispensable role in the formation of soybean yield. Previous studies showed that GA20OX expression in soybean germplasm was significantly positively correlated with grain weight [9]. Glyma08g19580 was named SWEET24 that predicted to encode a bidirectional transporter protein [50]. The SWEET gene family is crucial for maintaining the development of plant seeds and pollen [51,52]. Some researchers have proposed that enhanced nutrient flow to the developing endosperm and embryo can also improve seed yield by overexpressing the SWEET gene and cell wall invertase and hexose symporter protein gene at the mother-child interface of soybean seeds [53,54]. Glyma13g42310 (LOX2) and Glyma13g42320 (LOX1.1) are members of the Late Embryogenetic Enrichment (LEA) protein family, which encode genes for seed maturation proteins, thus abundant at later stages of seed development. In addition, Glyma13g44020 (GmPM30) protein reacts strongly with sucrose and phospholipids in the dry state, which is considered to be a key condition for seed drying [55]. The accumulation of Glyma17g16620 (GmPM16) protein starts from the middle stage of development and gradually increases during seed maturation, the interaction between GMPM16 protein and sugar forms a glass matrix structure, effectively improves seed drying resistance and extends the storage time of seeds [56]. The findings of this study further validated the importance of these genes and laid a foundation for subsequent cloning research and functional identification.

5. Conclusions

In summary, this study employed 3VmrMLM method of GWAS to map main, QEIs and QQIs QTNs for 100-seed weight in a diverse mapping population of >500. Our results revealed that beside the main effect QTNs, both QEIs and QQIs play significant role in modulating 100-seed weight. We identified 33 stable QTNs, out of which 23 colocalized with previously known loci and 10 were novel, highlighting the reliability of mapping procedure. Also, nine potential candidates were predicted and these warrant for future functional validation to ascertain their roles in modulating 100-seed weight in soybean. Two of them were identified in QQIs. Taken together the results from this study lay foundation for targeting a specific seed-weight to meet the needs of different consumers.

Supplementary Materials

The following supporting information can be downloaded at: https://www.mdpi.com/article/10.3390/agronomy14030483/s1, Table S1: Comparison of 23 QTNs with QTLs reported in previous studies [57,58,59,60,61,62,63,64,65].

Author Contributions

Conceptualization, J.F.; Data curation, B.K., Z.W. and T.Z.; Formal analysis, L.W. and J.F.; Funding acquisition, T.Z.; Investigation, Z.W.; Methodology, L.W., H.Z., C.Z. and J.F.; Resources, B.K. and T.Z.; Supervision, T.Z. and J.F.; Validation, B.K. and J.F.; Visualization, T.Z.; Writing—original draft, L.W., H.Z. and J.F.; Writing—review & editing, L.W., B.K., C.Z., T.Z. and J.F. All authors have read and agreed to the published version of the manuscript.

Funding

This research was funded by the National Key R & D Program of China (2021YFD1201603), National Natural Science Foundation of China (Grant Nos. 32171965), the Core Technology Development for Breeding Program of Jiangsu Province (JBGS-2021-014), and the Program of Collaborative Innovation Center for Modern Crop Production co-sponsored by Province and Ministry (CIC-MCP).

Data Availability Statement

All data generated during this study are included in this published article and its Supplementary Information Files.

Conflicts of Interest

The authors declare no conflict of interest.

References

  1. Liu, S.L.; Zhang, M.; Feng, F.; Tian, Z.X. Toward a “Green Revolution” for Soybean. Mol. Plant 2020, 5, 688–697. [Google Scholar] [CrossRef]
  2. Vogel, J.T.; Liu, W.D.; Olhoft, P.; Crafts-Brandner, S.J.; Pennycooke, J.C.; Christiansen, N. Soybean Yield Formation Physiology—A Foundation for Precision Breeding Based Improvement. Front. Plant Sci. 2021, 12, 719706. [Google Scholar] [CrossRef]
  3. Orsi, C.H.; Tanksley, S.D. Natural Variation in an ABC Transporter Gene Associated with Seed Size Evolution in Tomato Species. PLoS Genet. 2009, 5, e1000347. [Google Scholar] [CrossRef]
  4. Keim, P.; Diers, B.W.; Olson, T.C.; Shoemaker, R.C. RFLP Mapping in Soybean: Association between Marker Loci and Variation in Quantitative Traits. Genetics 1990, 126, 735–742. [Google Scholar] [CrossRef]
  5. Qi, Z.Y.; Song, J.; Zhang, K.X.; Liu, S.L.; Tian, X.C.; Wang, Y.; Fang, Y.L.; Li, X.Y.; Wang, J.J.; Yang, C.; et al. Identification of QTNs Controlling 100-Seed Weight in Soybean Using Multilocus Genome-Wide Association Studies. Front. Gene 2020, 11, 689. [Google Scholar] [CrossRef]
  6. Zhang, W.; Xu, W.J.; Zhang, H.M.; Liu, X.Q.; Cui, X.Y.; Li, S.S.; Song, L.; Zhu, Y.L.; Chen, X.; Chen, H.T. Comparative Selective Signature Analysis and High-Resolution GWAS Reveal a New Candidate Gene Controlling Seed Weight in Soybean. Theor. Appl. Genet. 2021, 134, 1329–1341. [Google Scholar] [CrossRef] [PubMed]
  7. Lu, X.; Xiong, Q.; Cheng, T.; Li, Q.T.; Liu, X.L.; Bi, Y.D.; Li, W.; Zhang, W.K.; Ma, B.; Lai, Y.C.; et al. A PP2C-1 Allele Underlying a Quantitative Trait Locus Enhances Soybean 100-Seed Weight. Mol. Plant 2017, 10, 670–684. [Google Scholar] [CrossRef] [PubMed]
  8. Gu, Y.Z.; Li, W.; Jiang, H.W.; Wang, Y.; Gao, H.H.; Liu, M.; Chen, Q.S.; Lai, Y.C.; He, C.Y. Differential Expression of a WRKY Gene between Wild and Cultivated Soybeans Correlates to Seed Size. J. Exp. Bot. 2017, 68, 2717–2729. [Google Scholar] [CrossRef]
  9. Lu, X.; Li, Q.T.; Xiong, Q.; Li, W.; Bi, Y.D.; Lai, Y.C.; Liu, X.L.; Man, W.Q.; Zhang, W.K.; Ma, B.; et al. The Transcriptomic Signature of Developing Soybean Seeds Reveals the Genetic Basis of Seed Trait Adaptation during Domestication. Plant J. 2016, 86, 530–544. [Google Scholar] [CrossRef]
  10. Yu, J.M.; Pressoir, G.; Briggs, W.H.; Bi, I.V.; Yamasaki, M.; Doebley, J.F.; McMullen, M.D.; Gaut, B.S.; Nielsen, D.M.; Holland, J.B.; et al. A Unified Mixed-Model Method for Association Mapping That Accounts for Multiple Levels of Relatedness. Nat. Genet. 2006, 38, 203–208. [Google Scholar] [CrossRef] [PubMed]
  11. Pritchard, J.K.; Stephens, M.; Donnelly, P. Inference of Population Structure Using Multilocus Genotype Data. Genetics 2000, 155, 945–959. [Google Scholar] [CrossRef]
  12. Zhang, Z.W.; Ersoz, E.; Lai, C.Q.; Todhunter, R.J.; Tiwari, H.K.; Gore, M.A.; Bradbury, P.J.; Yu, J.M.; Arnett, D.K.; Ordovas, J.M.; et al. Mixed Linear Model Approach Adapted for Genome-Wide Association Studies. Nat. Genet. 2010, 42, 355–360. [Google Scholar] [CrossRef]
  13. Wang, S.B.; Feng, J.Y.; Ren, W.L.; Huang, B.; Zhou, L.; Wen, Y.J.; Zhang, J.; Dunwell, J.M.; Xu, S.Z.; Zhang, Y.M. Improving Power and Accuracy of Genome-Wide Association Studies via a Multi-Locus Mixed Linear Model Methodology. Sci. Rep. 2016, 6, 19444. [Google Scholar] [CrossRef]
  14. Ni, G.; Van Der Werf, J.; Zhou, X.; Hypponen, E.; Wray, N.R.; Lee, S.H. Genotype-Covariate Correlation and Interaction Disentangled by a Whole-Genome Multivariate Reaction Norm Model. Nat. Commun. 2019, 10, 2239. [Google Scholar] [CrossRef]
  15. Carlborg, Ö.; Haley, C.S. Epistasis: Too Often Neglected in Complex Trait Studies? Nat. Rev. Genet. 2004, 5, 618–625. [Google Scholar] [CrossRef]
  16. Li, X.; Guo, T.; Wang, J.; Bekele, W.A.; Sukumaran, S.; Vanous, A.E.; McNellie, J.P.; Cortes, L.T.; Lopes, M.S.; Lamkey, K.R.; et al. An Integrated Framework Reinstating the Environmental Dimension for GWAS and Genomic Selection in Crops. Mol. Plant 2021, 14, 874–887. [Google Scholar] [CrossRef] [PubMed]
  17. Liu, J.Y.; Lin, Y.; Chen, J.B.; Yan, Q.; Xue, C.C.; Wu, R.R.; Chen, X.; Yuan, X.X. Genome-Wide Association Studies Provide Genetic Insights into Natural Variation of Seed-Size-Related Traits in Mungbean. Front. Plant Sci. 2022, 13, 997988. [Google Scholar] [CrossRef] [PubMed]
  18. Kerin, M.; Marchini, J. Inferring Gene-by-Environment Interactions with a Bayesian Whole-Genome Regression Model. Am. J. Hum. Genet. 2020, 107, 698–713. [Google Scholar] [CrossRef] [PubMed]
  19. Li, M.; Zhang, Y.W.; Zhang, Z.C.; Xiang, Y.; Liu, M.H.; Zhou, Y.H.; Zuo, J.F.; Zhang, H.Q.; Chen, Y.; Zhang, Y.-M. A Compressed Variance Component Mixed Model for Detecting QTNs and QTN-by-Environment and QTN-by-QTN Interactions in Genome-Wide Association Studies. Mol. Plant 2022, 15, 630–650. [Google Scholar] [CrossRef] [PubMed]
  20. Karikari, B.; Wang, Z.L.; Zhou, Y.L.; Yan, W.L.; Feng, J.Y.; Zhao, T.J. Identification of Quantitative Trait Nucleotides and Candidate Genes for Soybean Seed Weight by Multiple Models of Genome-Wide Association Study. BMC Plant Biol. 2020, 20, 404. [Google Scholar] [CrossRef] [PubMed]
  21. Bates, D.M.; Maechler, M.; Bolker, B.M.; Walker, S. Lme4: Linear Mixed-Effects Models Using Eigen and S4. 2015. R Package. Available online: http://CRAN.R-Project.Org/Package=lme4 (accessed on 20 March 2023).
  22. Yi, X.; Liang, Y.; Huerta-Sanchez, E.; Jin, X.; Cuo, Z.X.P.; Pool, J.E.; Xu, X.; Jiang, H.; Vinckenbosch, N.; Korneliussen, T.S.; et al. Sequencing of 50 Human Exomes Reveals Adaptation to High Altitude. Science 2010, 329, 75–78. [Google Scholar] [CrossRef]
  23. Hubisz, M.J.; Falush, D.; Stephens, M.; Pritchard, J.K. Inferring Weak Population Structure with the Assistance of Sample Group Information. Mol. Ecol. Resour. 2009, 9, 1322–1332. [Google Scholar] [CrossRef] [PubMed]
  24. Pattee, H.E.; Giesbrecht, F.G.; Mozingo, R.W. A Note on Broad-Sense Heritability of Selected Sensory Descriptors in Virginia-Type Arachis hypogaea L. Peanut Sci. 1993, 20, 24–26. [Google Scholar] [CrossRef]
  25. Severin, A.J.; Woody, J.L.; Bolon, Y.; Joseph, B.; Diers, B.W.; Farmer, A.D.; Muehlbauer, G.J.; Nelson, R.T.; Grant, D.; Specht, J.E.; et al. RNA-Seq Atlas of Glycine Max: A Guide to the Soybean Transcriptome. BMC Plant Biol. 2010, 10, 160. [Google Scholar] [CrossRef] [PubMed]
  26. Barrett, J.C.; Fry, B.; Maller, J.; Daly, M.J. Haploview: Analysis and Visualization of LD and Haplotype Maps. Bioinformatics 2005, 21, 263–265. [Google Scholar] [CrossRef]
  27. Bertero, H.D.; Vega, A.J.D.L.; Correa, G.; Jacobsen, S.E.; Mujica, A. Genotype and Genotype-by-Environment Interaction Effects for Grain Yield and Grain Size of Quinoa (Chenopodium quinoa Willd.) as Revealed by Pattern Analysis of International Multi-Environment Trials. Field Crop. Res. 2004, 89, 299–318. [Google Scholar] [CrossRef]
  28. Hickey, L.T.; Hafeez, A.N.; Robinson, H.; Jackson, S.A.; Leal-Bertioli, S.C.M.; Tester, M.; Gao, C.X.; Godwin, I.D.; Hayes, B.J.; Wulff, B.B.H. Breeding Crops to Feed 10 Billion. Nat. Biotechnol. 2019, 37, 744–754. [Google Scholar] [CrossRef]
  29. Li, N.; Xu, R.; Li, Y.H. Molecular Networks of Seed Size Control in Plants. Annu. Rev. Plant Biol. 2019, 70, 435–463. [Google Scholar] [CrossRef]
  30. McCouch, S.R.; Chen, X.; Panaud, O.; Temnykh, S.; Xu, Y.; Yong, G.C.; Huang, N.; Ishii, T.; Blair, M. Microsatellite marker development, mapping and applications in rice genetics and breeding. Plant Mole. Biol. 1997, 35, 89–99. [Google Scholar] [CrossRef]
  31. Hu, Z.B.; Zhang, H.R.; Kan, G.Z.; Ma, D.Y.; Zhang, D.; Shi, G.X.; Hong, E.L.; Zhang, G.Z.; Yu, D.Y. Determination of the Genetic Architecture of Seed Size and Shape via Linkage and Association Analysis in Soybean (Glycine max L. Merr.). Genetica 2013, 141, 247–254. [Google Scholar] [CrossRef]
  32. Chen, Y.J.; Xiong, Y.J.; Hong, H.L.; Li, G.; Gao, J.; Guo, Q.Y.; Sun, R.J.; Ren, H.L.; Zhang, F.; Wang, J.; et al. Genetic Dissection and Genomic Selection for Seed Weight, Pod Length, and Pod Width in Soybean. Crop. J. 2023, 11, 832–841. [Google Scholar] [CrossRef]
  33. Elattar, M.A.; Karikari, B.; Li, S.G.; Song, S.Y.; Cao, Y.C.; Aslam, M.; Hina, A.; Abou-Elwafa, S.F.; Zhao, T.J. Identification and Validation of Major QTLs, Epistatic Interactions, and Candidate Genes for Soybean Seed Shape and Weight Using Two Related RIL Populations. Front. Genet. 2021, 12, 666440. [Google Scholar] [CrossRef]
  34. Mian, M.A.R.; Bailey, M.A.; Tamulonis, J.P.; Shipe, E.R.; Carter, T.E., Jr.; Parrott, W.A.; Ashley, D.A.; Hussey, R.S.; Boerma, H.R. Molecular Markers Associated with Seed Weight in Two Soybean Populations. Theor. Appl. Genet. 1996, 93, 1011–1016. [Google Scholar] [CrossRef]
  35. Wang, J.; Zhang, Y.W.; Jiao, Z.J.; Liu, P.P.; Chang, W. Identification of QTLs and Candidate Genes for 100-Seed Weight Trait Using PyBSASeq Algorithm in Soybean. Acta Agron. Sinica 2022, 48, 635–643. [Google Scholar] [CrossRef]
  36. Orf, J.H.; Chase, K.; Jarvik, T.; Mansur, L.M.; Cregan, P.B.; Adler, F.R.; Lark, K.G. Genetics of Soybean Agronomic Traits: I. Comparison of Three Related Recombinant Inbred Populations. Crop. Sci. 1999, 39, 1642–1651. [Google Scholar] [CrossRef]
  37. Djanaguiraman, M.; Prasad, P.V.V.; Schapaugh, W.T. High Day or Nighttime Temperature Alters Leaf Assimilation, Reproductive Success, and Phosphatidic Acid of Pollen Grain in Soybean [Glycine max (L.) Merr.]. Crop. Sci. 2013, 53, 1594–1604. [Google Scholar] [CrossRef]
  38. Vantoai, T.T.; Beuerlein, J.E.; Chmitthenner, A.F.; Stmartin, S.K. Genetic Variability for Flooding Tolerance in Soybeans. Crop. Sci. 1994, 34, 1112–1115. [Google Scholar] [CrossRef]
  39. Manavalan, L.P.; Guttikonda, S.K.; Phan Tran, L.S.; Nguyen, H.T. Physiological and Molecular Approaches to Improve Drought Resistance in Soybean. Plant Cell Physiol. 2009, 50, 1260–1276. [Google Scholar] [CrossRef] [PubMed]
  40. Manuck, S.B.; McCaffery, J.M. Gene-Environment Interaction. Annu. Rev. Psychol. 2014, 65, 41–70. [Google Scholar] [CrossRef]
  41. Holzinger, E.R.; Szymczak, S.; Dasgupta, A.; Malley, J.; Li, Q.; Bailey-Wilson, J.E. Variable Selection Method for the Identification of Epistatic Models. In Proceedings of the Pacific Symposium, Kohala Coast, HI, USA, 4–8 January 2015; pp. 195–206. [Google Scholar] [CrossRef]
  42. Sakai, T.; Abe, A.; Shimizu, M.; Terauchi, R. Ril-Step: Epistasis Analysis of Rice Recombinant Inbred Lines Reveals Candidate Interacting Genes That Control Seed Hull Color and Leaf Chlorophyll Content. G3-Genes Genom. Genet. 2021, 11, jkab130. [Google Scholar] [CrossRef]
  43. Kim, K.H.; Kim, J.Y.; Lim, W.J.; Jeong, S.; Lee, H.Y.; Cho, Y.; Moon, J.K.; Kim, N. Genome-Wide Association and Epistatic Interactions of Flowering Time in Soybean Cultivar. PLoS ONE 2020, 15, e0228114. [Google Scholar] [CrossRef] [PubMed]
  44. Medic, J.; Atkinson, C.; Hurburgh, C.R. Current Knowledge in Soybean Composition. J. Am. Oil Chem. Soc. 2014, 91, 363–384. [Google Scholar] [CrossRef]
  45. Zhuang, W.J.; Chen, H.; Yang, M.; Wang, J.P.; Pandey, M.K.; Zhang, C.; Chang, W.C.; Zhang, L.S.; Zhang, X.T.; Tang, R.H.; et al. The Genome of Cultivated Peanut Provides Insight into Legume Karyotypes, Polyploid Evolution and Crop Domestication. Nat. Genet. 2019, 51, 865–876. [Google Scholar] [CrossRef] [PubMed]
  46. Zhang, M.; Liu, S.L.; Wang, Z.; Yuan, Y.Q.; Zhang, Z.F.; Liang, Q.J.; Yang, X.; Duan, Z.B.; Liu, Y.C.; Kong, F.J.; et al. Progress in Soybean Functional Genomics over the Past Decade. Plant Biotechnol. J. 2022, 20, 256–282. [Google Scholar] [CrossRef]
  47. Li, S.X.; Cong, Y.H.; Liu, Y.P.; Wang, T.T.; Shuai, Q.; Chen, N.N.; Gai, J.Y.; Li, Y. Optimization of Agrobacterium-Mediated Transformation in Soybean. Front. Plant Sci. 2017, 24, 246. [Google Scholar] [CrossRef]
  48. Liu, J.; Gunapati, S.; Mihelich, N.T.; Stec, A.O.; Michno, J.M.; Stupar, R.M. Genome Editing in Soybean with CRISPR/Cas9: Methods and Protocols. Method. Mol. Biol. 2019, 1917, 217–234. [Google Scholar] [CrossRef]
  49. Xiao, Y.T.; Karikari, B.; Wang, L.; Chang, F.G.; Zhao, T.J. Structure Characterization and Potential Role of Soybean Phospholipases A Multigene Family in Response to Multiple Abiotic Stress Uncovered by CRISPR/Cas9 Technology. Environ. Exp. Bot. 2021, 188, 104521. [Google Scholar] [CrossRef]
  50. Patil, G.; Valliyodan, B.; Deshmukh, R.; Prince, S.; Nicander, B.; Zhao, M.Z.; Sonah, H.; Song, L.; Lin, L.; Chaudhary, J. Soybean (Glycine Max) SWEET Gene Family: Insights through Comparative Genomics, Transcriptome Profiling and Whole Genome Re-Sequence Analysis. BMC Genom. 2015, 16, 520. [Google Scholar] [CrossRef]
  51. Timilsina, S.; Potnis, N.; Newberry, E.A.; Liyanapathiranage, P.; Iruegas-Bocardo, F.; White, F.F.; Goss, E.M.; Jones, J.B. Xanthomonas Diversity, Virulence and Plant-Pathogen Interactions. Nat. Rev. Microbiol. 2020, 18, 415–427. [Google Scholar] [CrossRef]
  52. Langner, T.; Kamoun, S.; Belhaj, K. CRISPR Crops: Plant Genome Editing toward Disease Resistance. Annu. Rev. Phytopathol. 2018, 56, 479–512. [Google Scholar] [CrossRef]
  53. Saijo, Y.; Loo, E.P. Plant Immunity in Signal Integration between Biotic and Abiotic Stress Responses. New Phytol. 2020, 225, 87–104. [Google Scholar] [CrossRef]
  54. Weschke, W.; Panitz, R.; Gubatz, S.; Wang, Q.; Radchuk, R.; Weber, H.; Wobus, U. The Role of Invertases and Hexose Transporters in Controlling Sugar Ratios in Maternal and Filial Tissues of Barley Caryopses during Early Development. Plant J. 2003, 33, 395–411. [Google Scholar] [CrossRef]
  55. Hernández-Sánchez, I.E.; Maruri-López, I.; Martinez-Martinez, C.; Janis, B.; Jiménez-Bremont, J.F.; Covarrubias, A.A.; Menze, M.A.; Graether, S.P.; Thalhammer, A. LEAfing through Literature: Late Embryogenesis Abundant Proteins Coming of Age-Achievements and Perspectives. J. Exp. Bot. 2022, 73, 6525–6546. [Google Scholar] [CrossRef] [PubMed]
  56. Magwanga, R.O.; Lu, P.; Kirungu, J.N.; Lu, H.J.; Wang, X.X.; Cai, X.Y.; Zhou, Z.L.; Zhang, Z.M.; Salih, H.R.; Wang, K.B.; et al. Characterization of the Late Embryogenesis Abundant (LEA) Proteins Family and Their Role in Drought Stress Tolerance in Upland Cotton. BMC Genet. 2018, 19, 6. [Google Scholar] [CrossRef] [PubMed]
  57. Assefa, T.; Otyama, P.I.; Brown, A.V.; Brown, A.V.; Kalberer, S.R.; Kulkarni, R.S.; Cannon, S.B. Genome-wide associations and epistatic interactions for internode number, plant height, seed weight and seed yield in soybean. BMC Genom. 2019, 20, 257. [Google Scholar] [CrossRef]
  58. Zhang, X.L.; Ding, W.T.; Xue, D.; Li, X.N.; Zhou, Y.; Shen, J.C.; Feng, J.Y.; Guo, N.; Qiu, L.J.; Xing, H.; et al. Genome-wide association studies of plant architecture-related traits and 100-seed weight in soybean landraces. BMC Genom. Data 2021, 22, 10–24. [Google Scholar] [CrossRef]
  59. Csanádi, G.Y.; Vollmann, J.; Stift, G.; Lelley, T. Seed quality QTLs identified in a molecular map of early maturing soybean. Theor. Appl. Genet. 2001, 103, 912–919. [Google Scholar] [CrossRef]
  60. Hoeck, J.A.; Fehr, W.R.; Shoemaker, R.C.; Shoemaker, R.C.; Welke, G.A.; Johnson, S.L.; Cianzio, S.R. Molecular marker analysis of seed size in soybean. Crop Sci. 2003, 43, 68–74. [Google Scholar] [CrossRef]
  61. Kato, S.; Sayama, T.; Fujii, K.; Yumoto, S.; Kono, Y.; Hwang, T.; Kikuchi, A.; Takada, Y.; Tanaka, Y.; Shiraiwa, T.; et al. A major and stable QTL associated with seed weight in soybean across multiple environments and genetic backgrounds. Theor. Appl. Genet. 2014, 127, 1365–1374. [Google Scholar] [CrossRef]
  62. Kulkarni, K.P.; Asekova, S.; Lee, D.H.; Bilyeu, K.; Song, J.T.; Lee, J. Mapping QTLs for 100-seed weight in an interspecific soybean cross of Williams 82 (Glycine max) and PI 366121 (Glycine soja). Crop Pasture Sci. 2017, 68, 148–155. [Google Scholar] [CrossRef]
  63. Kuroda, Y.; Kaga, A.; Tomooka, N.; Yano, H.; Takada, T.; Kato, S.; Vaughan, D. QTL affecting fitness of hybrids between wild and cultivated soybeans in experimental fields. Ecol. Evol. 2013, 3, 2150–2168. [Google Scholar] [CrossRef]
  64. Liang, Q.; Cheng, X.H.; Mei, M.T.; Yan, X.L.; Liao, H. QTL analysis of root traits as related to phosphorus efficiency in soybean. Ann. Bot. 2010, 106, 223–234. [Google Scholar] [CrossRef]
  65. Teng, W.; Han, Y.; Du, Y.; Sun, D.; Zhang, Z.; Qiu, L.; Sun, G.; Li, W. QTL analyses of seed weight during the development of soybean (Glycine max L. Merr.). Heredity 2009, 102, 372–380. [Google Scholar] [CrossRef]
Figure 1. Boxplot of Mean-phenotype and BLUP-phenotype phenotypic data in three environments (E1, E2 and E3). (a) Box plot with the Mean-phenotype; (b) Box plot with the BLUP-phenotype. E1, E2 and E3 represent mention locations for the phenotypic; ** represents significant differences with p < 0.01; *** represents significant differences with p < 0.001.
Agronomy 14 00483 g001
Figure 2. Venn diagram of loci identified by single environment analysis, multi-environment dataset joint analysis and epistasis analysis. (a) represents the analysis results in Mean-phenotype; (b) represents the analysis results in BLUP-phenotype. C1, C2 and C3, respectively, represent the main effect QTNs of single-environment analysis in E1, E2 and E3; C4 and C5 represents the main effect QTNs and QEIs in multi-environment dataset joint analysis; C6 and C7 represents QTNs and QQIs in epistasis analysis. The sets C1–C7 are represented in different colors, and the numbers on the Venn diagram show the number of QTNs in the overlapping regions of these sets.
Agronomy 14 00483 g002
Figure 3. Comparison of the number of hundred seed weight related loci between Mean-phenotype and BLUP-phenotype.
Agronomy 14 00483 g003
Figure 4. Clustering heat map of expression levels of 446 candidate genes and 6 candidate genes in 14 tissues. (a,b) represent the expression levels of 446 candidate genes and 6 candidate genes in 14 tissues, respectively; The original RNA-seq data was converted by log2(FPKM + 1) for heat map analysis. Only genes expressed in different tissues were shown in the map. DAF: Number of days after flowering.
Agronomy 14 00483 g004
Figure 5. Haplotype block analysis and t-test for selected QTNs. The selected QTNs are marked with a red box. (ag) represent the haplotype respectively blocks and t-test of Gm06_14999200, Gm07_7333790, Gm08_14545190, Gm13_41961934, Gm13_43480280, Gm17_13658864 and Gm17_6321674. (a-1g-1) represents the result of t-test using Mean-phenotype; and (a-2g-2) represents the result using BLUP-phenotype. *, ** and *** respectively indicates significant difference at p < 0.05, p < 0.01 and p < 0.001.
Agronomy 14 00483 g005aAgronomy 14 00483 g005b
Table 1. Phenotypic analysis of the Mean-phenotype and BLUP-phenotype of HSW for 573 soybean germplasm under three environments.
Phenotype aEnvironment bMeanMinMaxSDSkewKurtCV (%)h2 (%)
Mean-phenotypeE118.997.2437.194.460.781.012395.10
E220.297.0436.324.880.540.442496.40
E319.478.3836.784.870.640.462594.60
BLUP-phenotypeE118.997.8136.34.220.711.022295.13
E220.287.6335.554.690.530.412396.87
E319.498.9635.884.600.660.452494.80
Min: minimum; Max: Maximum; SD: standard deviation; Skew: Skewness; Kurt: kurtosis; CV: coefficient of variation; h2: Generalized heritability. a: Two phenotypes for association analysis were obtained from the raw phenotypic data; Mean-phenotype is mean value of 3 replications of each environment; BLUP-phenotype is the best linear unbiased prediction of 3 replications in each environment. b: The three environments refer to the year 2013, 2017, and 2018, respectively, and are denoted as E1, E2, and E3, respectively.
Table 4. QQIs detected simultaneously in Mean-phenotype and BLUP-phenotype.
QQIs aMean-PhenotypeBLUP-Phenotype
QTN1QTN2LOD bEffect cVariance dR2 (%) eLOD bEffect cVariance dR2 (%) e
Gm01_47969266Gm02_44534624.330.940.713.704.470.600.281.86
Gm02_5698503Gm08_525816810.201.050.824.295.190.580.251.64
Gm02_25227246Gm11_160220815.72−0.870.673.493.75−0.740.483.16
Gm06_13595169Gm06_149992004.620.720.512.684.640.800.634.17
Gm07_22276137Gm13_73377977.30−0.670.241.276.74−0.880.422.73
Gm07_36350977Gm18_554912356.120.610.361.854.860.230.050.33
Gm10_5133417Gm20_411002263.010.590.291.523.260.320.090.57
Gm13_2423497Gm17_63216744.61−0.290.070.355.59−0.240.050.31
Gm13_18560842Gm16_303142603.450.410.160.834.670.270.070.44
Gm14_43246298Gm18_465672185.82−0.100.010.054.29−0.130.020.11
a: QTN-QTN interaction, the two interacting QTNs are denoted as QTN1 and QTN2. b: Log of odds. c: The statistical estimate of epistasis effect. d: Variance of QQI detected. e: Phenotypic variation explained by each QQI.
Table 5. Potential candidate genes near stable QTNs for soybean 100-seed weight.
QTNs aPosition bCandidate Gene
Wm82.a1.v1 cWm82.a2.v1 cPosition (bp) dGene Symbol eFunctional Annotation f
qHSW-6-2Gm06_14999200Glyma06g19000Glyma.06g180000Gm06:15230602
15235616
LOC100776762Cell division cycle protein 48 homolog (CDC48)
qHSW-7-1Gm07_7333790Glyma07g08950Glyma.07g081700Gm07:7480416-
7483393
GA20OXGibberellin 20 oxidase 2; Response to gibberellin stimulation, flower development
qHSW-8-2Gm08_14545190Glyma08g19580Glyma.08g183500Gm08:14793461-
14795629
GmSWEET24Sucrose transportation
qHSW-13-2Gm13_41961934Glyma13g42310Glyma.13g347500Gm13:42321510-
42325915
LOX2Lipoxygenase 1; Response to abscisic acid stimulation, Response to jasmonic acid stimulation
Glyma13g42320Glyma.13g347600Gm13:42328964-
42333252
LOX1.1Lipoxygenase 1; Response to abscisic acid stimulation, Response to jasmonic acid stimulation
qHSW-13-3Gm13_43480280Glyma13g44020Glyma.13g363300Gm13:43580634-
43581833
GmPM30Rich late embryogenesis (plant) LEA related
Glyma13g43800Glyma.13g361200Gm13:43396690-43398891LOC100500488AUX/IAA family protein
qHSW-17-1Gm17_13658864Glyma17g16620Glyma.17g155000Gm17:13354202-
13355951
GmPM16Rich late embryogenesis (plant) LEA related
qHSW-17-2Gm17_6321674Glyma17g09110Glyma.17g083600Gm17:6748647
6750218
LOC100812289Response to jasmonic acid stimulus; protein STRICTOSIDINE SYNTHASE-LIKE 12
a: QTNs (quantitative trait nucleotides) detected in the study following the nomenclature of McCouch et al. [30]. b: including Glycine max (Gm), chromosome number, underscore and the position of the QTN. c: Predicted candidate genes in this study (both version 1 and 2 of William 82 reference genome). d: Position of candidate gene from the QTN position. e: Gene symbol from National Center for Biotechnology Information. f: Biological functions related to seed development obtained from SoyBase.
Disclaimer/Publisher’s Note: The statements, opinions and data contained in all publications are solely those of the individual author(s) and contributor(s) and not of MDPI and/or the editor(s). MDPI and/or the editor(s) disclaim responsibility for any injury to people or property resulting from any ideas, methods, instructions or products referred to in the content.

