Article

Identifications of Seed Vigor-Related QTLs and Candidate Genes Combined Cultivated Soybean with Wild Soybean

1
National Key Laboratory of Smart Farm Technology and System, Key Laboratory of Soybean Biology in Chinese Ministry of Education, College of Agriculture, Northeast Agricultural University, Harbin 150030, China
2
Crop Development Research Institute, Heilongjiang Academy of Land Reclamation Sciences, Harbin 150038, China
3
Heilongjiang Green Food Science Research Institute, Harbin 150023, China
*
Authors to whom correspondence should be addressed.
These authors contributed equally to this work.
Agronomy 2024, 14(2), 332; https://doi.org/10.3390/agronomy14020332
Submission received: 18 December 2023 / Revised: 2 February 2024 / Accepted: 3 February 2024 / Published: 6 February 2024
(This article belongs to the Special Issue Functional Genomics and Molecular Breeding of Soybeans)

Abstract

:
Soybean (Glycine max) is an economically important cash crop and food source that serves as a key source of high-quality plant-derived protein and oil. Seed vigor is an important trait that influences the growth and development of soybean plants in an agricultural setting, underscoring a need for research focused on identifying seed vigor-related genetic loci and candidate genes. In this study, a population consisting of 207 chromosome segment substitution lines (CSSLs) derived from the crossing and continuous backcrossing of the Suinong14 (improved cultivar, recurrent parent) and ZYD00006 (wild soybean, donor parent) soybean varieties was leveraged to identify quantitative trait loci (QTLs) related to seed vigor. The candidate genes detected using this approach were then validated through RNA-seq, whole-genome resequencing, and qPCR approaches, while the relationship between specific haplotypes and seed vigor was evaluated through haplotype analyses of candidate genes. Phenotypic characterization revealed that the seed vigor of Suinong14 was superior to that of ZYD00006, and 20 total QTLs were identified using the selected CSSLs. Glyma.03G256700 was also established as a seed vigor-related gene that was upregulated in high-vigor seeds during germination, with haplotypes for this candidate gene also remaining consistent with observed soybean seed vigor. The QTLs identified herein can serve as a foundation for future marker-assisted and convergent breeding efforts aimed at improving seed vigor. In addition, future molecular and functional research focused on Glyma.03G256700 has the potential to elucidate the signaling network and key regulatory mechanisms that govern seed germination in soybean plants.

1. Introduction

Soybean (Glycine max) is an economically important crop that serves as one of the most important global sources of vegetable protein and edible oil [1,2]. There have been many efforts in recent years to improve soybean yields to meet the ever-growing demand [1,3]. Several different factors can influence the yield of soybean plants, including the imbibition rate (IR), germination index (GI), germination potential (GP), and germination rate (GR) [4]. All of these parameters can shape germination speed and uniformity, potentially contributing to a higher germination frequency, the emergence of fast-growing uniform seedlings, higher degrees of stress resistance, and improved productivity [5,6].
A range of variables can influence seed vigor, including the seed formation process, seed nutrient composition, the conditions under which seeds are stored, the impacts of diseases or pests, and the environmental conditions during germination [7,8]. Efforts to optimize these factors can enhance seed vigor, thereby contributing to more reliable germination and more robust plant growth [5]. Consistent with its complexity as a trait, several genes and genetic loci have been identified as important regulators of seed vigor. Seed vigor-related genes have been reported in a range of crop species. For example, transcriptomic analyses, comparative analysis, and broadly targeted metabolic profiling have confirmed that the rice bZIP23 protein serves as an enhancer of seed vigor such that overexpressing bZIP23 results in improved seed vigor and rice yields [6]. OslecRK is a lectin-like receptor protein kinase that has been confirmed to be capable of inhibiting α-amylase in rice, thereby decreasing seed vigor [9]. Conversely, the overexpression of ZmGOLS2 (GALACTINOL SYNTHASE2 gene of Zea mays) alone or in combination with ZmRS (RAFFINOSE SYNTHASE gene of Zea mays) in Arabidopsis results in significant increases in oligosaccharide levels and seed vigor [10]. Owing to differences in genetic factors, the seed vigor of individual germplasms tends to vary under identical environmental conditions. Efforts that leverage different available germplasm resources can thus allow for the elucidation of seed vigor-related genetic loci [11,12,13]. By studying a variety of crops, analyses of quantitative trait loci (QTLs) associated with seed vigor have been successful. In wheat (Triticum aestivum), 49 additive trail-related QTLs were identified to be distributed across 12 chromosomes (1B, 2D, 3A, 3B, 3D, 4A, 4D, 5A, 5B, 5D, 6D, and 7A) through analyses of a doubled haploid population derived from the crossing of Hanxuan 10 × Lumai 14 [4]. The use of 132 recombinant inbred lines (RILs) generated by crossing 93-11 (Oryza sativa ssp. indica) × PA64s (O. sativa ssp. indica) further led to the identification of 57 rice QTLs, several of which were co-localized with previously identified QTLs [14]. Fine-mapping efforts localized the major qSSL1b QTL to an 80.5 kb region situated between two insertion-deletion (InDel) markers. RIL population-based analyses have also identified QTLs associated with aspects of seed vigor including germination rate, final germination percentages, and germination index values, with most vigor-related QTLs coinciding with loci related to seed size, weight, or dormancy [15]. Genetic loci associated with seed vigor when stored at −20 °C have also been identified, including two major QTLs and eight QTL hotspots on chromosomes 3, 6, 9, 11, 15, 16, 17, and 19 that were identified through comparisons of two different storage conditions [5]. Multi-omics analyses based on the integration of genetic and proteomic data have also enabled mining for and identification of seed vigor-associated genes and gene networks, as in comparisons of two Brassica napus germplasms with differing vigor levels [16,17]. To date, there have been relatively few studies focused on soybean genes and loci associated with seed vigor under normal germination conditions, and efforts to screen for these genes offer excellent potential as an approach to the improvement of soybean seed vigor.
Wild soybean plants are widely distributed throughout the northeastern and Huang-Huai-hai regions of China, providing a key source of germplasm resources for genetic efforts aimed at improving soybean crops [1,18]. Currently, soybean landraces and extensively cultivated varieties are derived from wild soybean plants through artificial selection or natural variations, whereas extant wild soybean varieties exhibit greater allelic diversity without any evidence of reproductive isolation among cultivated, landrace, and wild soybeans [19]. Wild soybean isolates thus hold promise as a germplasm resource for efforts aimed at enhancing specific traits through genetic exchange and introgression [2,20]. Here, the cultivated Suinong14 variety with high levels of seed vigor and the wild ZYD00006 soybean variety with lower levels of seed vigor were utilized as parents to establish a chromosome segment substitution line (CSSL) population, through the crossing and six backcrosses, DNA fragments from ZYD00006 have been inserted into the Suinong14 genome. Thus, the genomes of different individuals in the CSSLs are composed of most Suinong14 genomes and a few ZYD00006 DNA fragments. This insertion has led to different genomic compositions in different individuals, resulting in a variety of seed-vigor phenotypes. Compared with other soybean genetics, the CSSLs could be used to identify the important locus related to seed-vigor more effectively. Four seed-vigor related phenotypes of CSSLs were leveraged for the identification of seed vigor-related QTLs, then the RNA-sequencing (RNA-Seq), whole-genome resequencing, and qPCR were additionally used to identify and validate candidate genes within these QTLs. The associations between Glyma.03G256700 haplotypes in natural soybean varieties had been analyzed to determine the relationship between candidate gene haplotype and seed vigor. The results of this study reveal a novel genetic locus that can serve as a foundation for efforts to breed high-vigor soybean varieties while also highlighting promising candidate genes for the improvement of soybean plants.

2. Materials and Methods

2.1. Soybean Materials

This study utilized 207 CSSLs derived from the crossing and six backcrosses of the improved Suinong14 cultivar and the wild ZYD00006 soybean variety, which served as the recurrent and non-recurrent parents, respectively. In addition, 310 natural varieties of soybean collected in northeastern China were employed for testing of seed vigor. The final CSSL-based map included 6308 markers and 20 linkage groups, with an overall length of 2655.68 cM and an average of 0.5 cM between adjacent markers [21]. Whole genome resequencing was performed for the 310 natural soybean germplasms identified herein [22]. CSSL and natural soybean seeds were obtained from the Xiangyang experimental Farm of Northeast Agricultural University (45.58° N 126.92° E), Harbin, China, in 2021.

2.2. Seed Vigor Testing

After initially sterilizing seeds using 30% (w/w) H2O2 and 75% (v/v) ethanol and washing them two times using sterile water to abrogate the effects of any pathogens, 50 equally-sized intact seeds free of any evidence of disease were transferred onto filter paper in sterile Petri dishes, followed by the addition of 20 mL of sterile water. Seed vigor was analyzed using the IR, GI, GP, and GR values with the following formulae: IR = (W2W1)/W1 × 100%, where W1 and W2 denote seed dry weight and seed weight at 48 h of imbibition, respectively; GI = Σ(Gt/Dt), where Gt denotes the total number of germinated seeds on day t, and Dt denotes the time, in days, that corresponds to Gt; GP = N2/N × 100%, where N3 indicates the numbers of germinated seeds on day 2 and N is indicative of the total experimental seed number; and GR = Nt/N × 100%, where Nt represents the numbers of seeds germinated on day t whereas N corresponds to the overall experimental seed number [23]. After rinsing all seeds, IR, GI, GP, and GR were calculated by assessing germinated seed numbers. Analyses were conducted in triplicate.

2.3. QTL Mapping

Seed vigor-associated QTLs were identified using a genetic map generated using the CSSLs generated by crossing Suinong14 and ZYD00006. The mapping of QTLs for IR, GI, GP, and GR was performed with WinQTL Cartographer 2.5 via CIM, with a LOD peak score > 3.0 being indicative of a seed vigor-related trait [21].

2.4. ZYD00006 Chromosome Insertion Analyses

Different CSSLs exhibiting extreme IR, GI, GP, and GR phenotypes were used for further chromosomal fragment insertion analyses, shortening the candidate QTL regions using Bin maps and SSR markers.

2.5. Candidate Gene Screening

The Williams 82 reference genome (Glycine max Wm82.a2.v1, https://phytozome-next.jgi.doe.gov/info/Gmax_Wm82_a2_v1, accessed on 17 May 2022) was used to predict and annotate all genes within candidate QTL regions of interest.

2.6. SNP Analyses of Candidate Genes

Suinong14 and ZYD00006 whole-genome data were used to analyze SNPs in QTL regions in detail, with a focus only on SNPs in promoter and exonic regions of candidate genes.

2.7. RNA-Seq

TRIzol was used to extract total RNA from Suinong14 and ZYD00006 at 24 and 48 h of germination, with three replicates per variety. A Nanodrop ND-2000 instrument (Thermo Scientific, Waltham, MA, USA) was used to measure A260/A280 values, while an Agilent Bioanalyzer 4150 (Agilent Technologies, Santa Clara, CA, USA) was used to quantify RIN values. Paired-end library construction was performed with qualified samples, and an Illumina NovaSeq 6000 instrument was then used for sequencing performed by APTBIO (Shanghai, China). The resultant data were analyzed with an in-house pipeline from Shanghai Applied Protein Technology (Shanghai, China). FPKM values for all genes were calculated with Cuffdiff, with differentially expressed genes (DEGs) being identified as those exhibiting a fold change ≥ 2 and a false discovery rate (FDR) < 0.05. GO annotation was conducted using PANNZER2 (http://ekhidna2.biocenter.helsinki.fi/sanspanz/, accessed on 17 May 2022) [24]. ClusterProfiler 4.0 was used for enrichment testing [25].

2.8. qPCR Validation

RNA was isolated and quantified as above, after which a HiScript III RT SuperMix for qPCR (+gDNA wiper) kit (Vazyme, Nanjing, China) was used to prepare cDNA. Specific primers (Table S4) were then used for qPCR analyses performed with a Roche 480 instrument (Stratagene, San Diego, CA, USA) and the ChamQ Universal SYBR qPCR Master Mix (Vazyme, Nanjing, China). GmUNK1 (Glyma.12g020500) served as an internal normalization control [26].

2.9. Haplotype Analyses of Glyma.03G256700

Glyma.03G256700 haplotypes were analyzed through the use of resequencing data for CSSLs and 310 natural soybean varieties. The coding sequence and the region 2500 bp upstream of Glyma.03G256700 were obtained for these different varieties, and SNPs therein were detected via local BLAST. The Haps format module was used for analyses performed with Haploview 4.2 (Cambridge, MA, USA), and Microsoft Excel 2019 was utilized to assess correlations between vigor-related traits and haplotypes [22].

3. Results

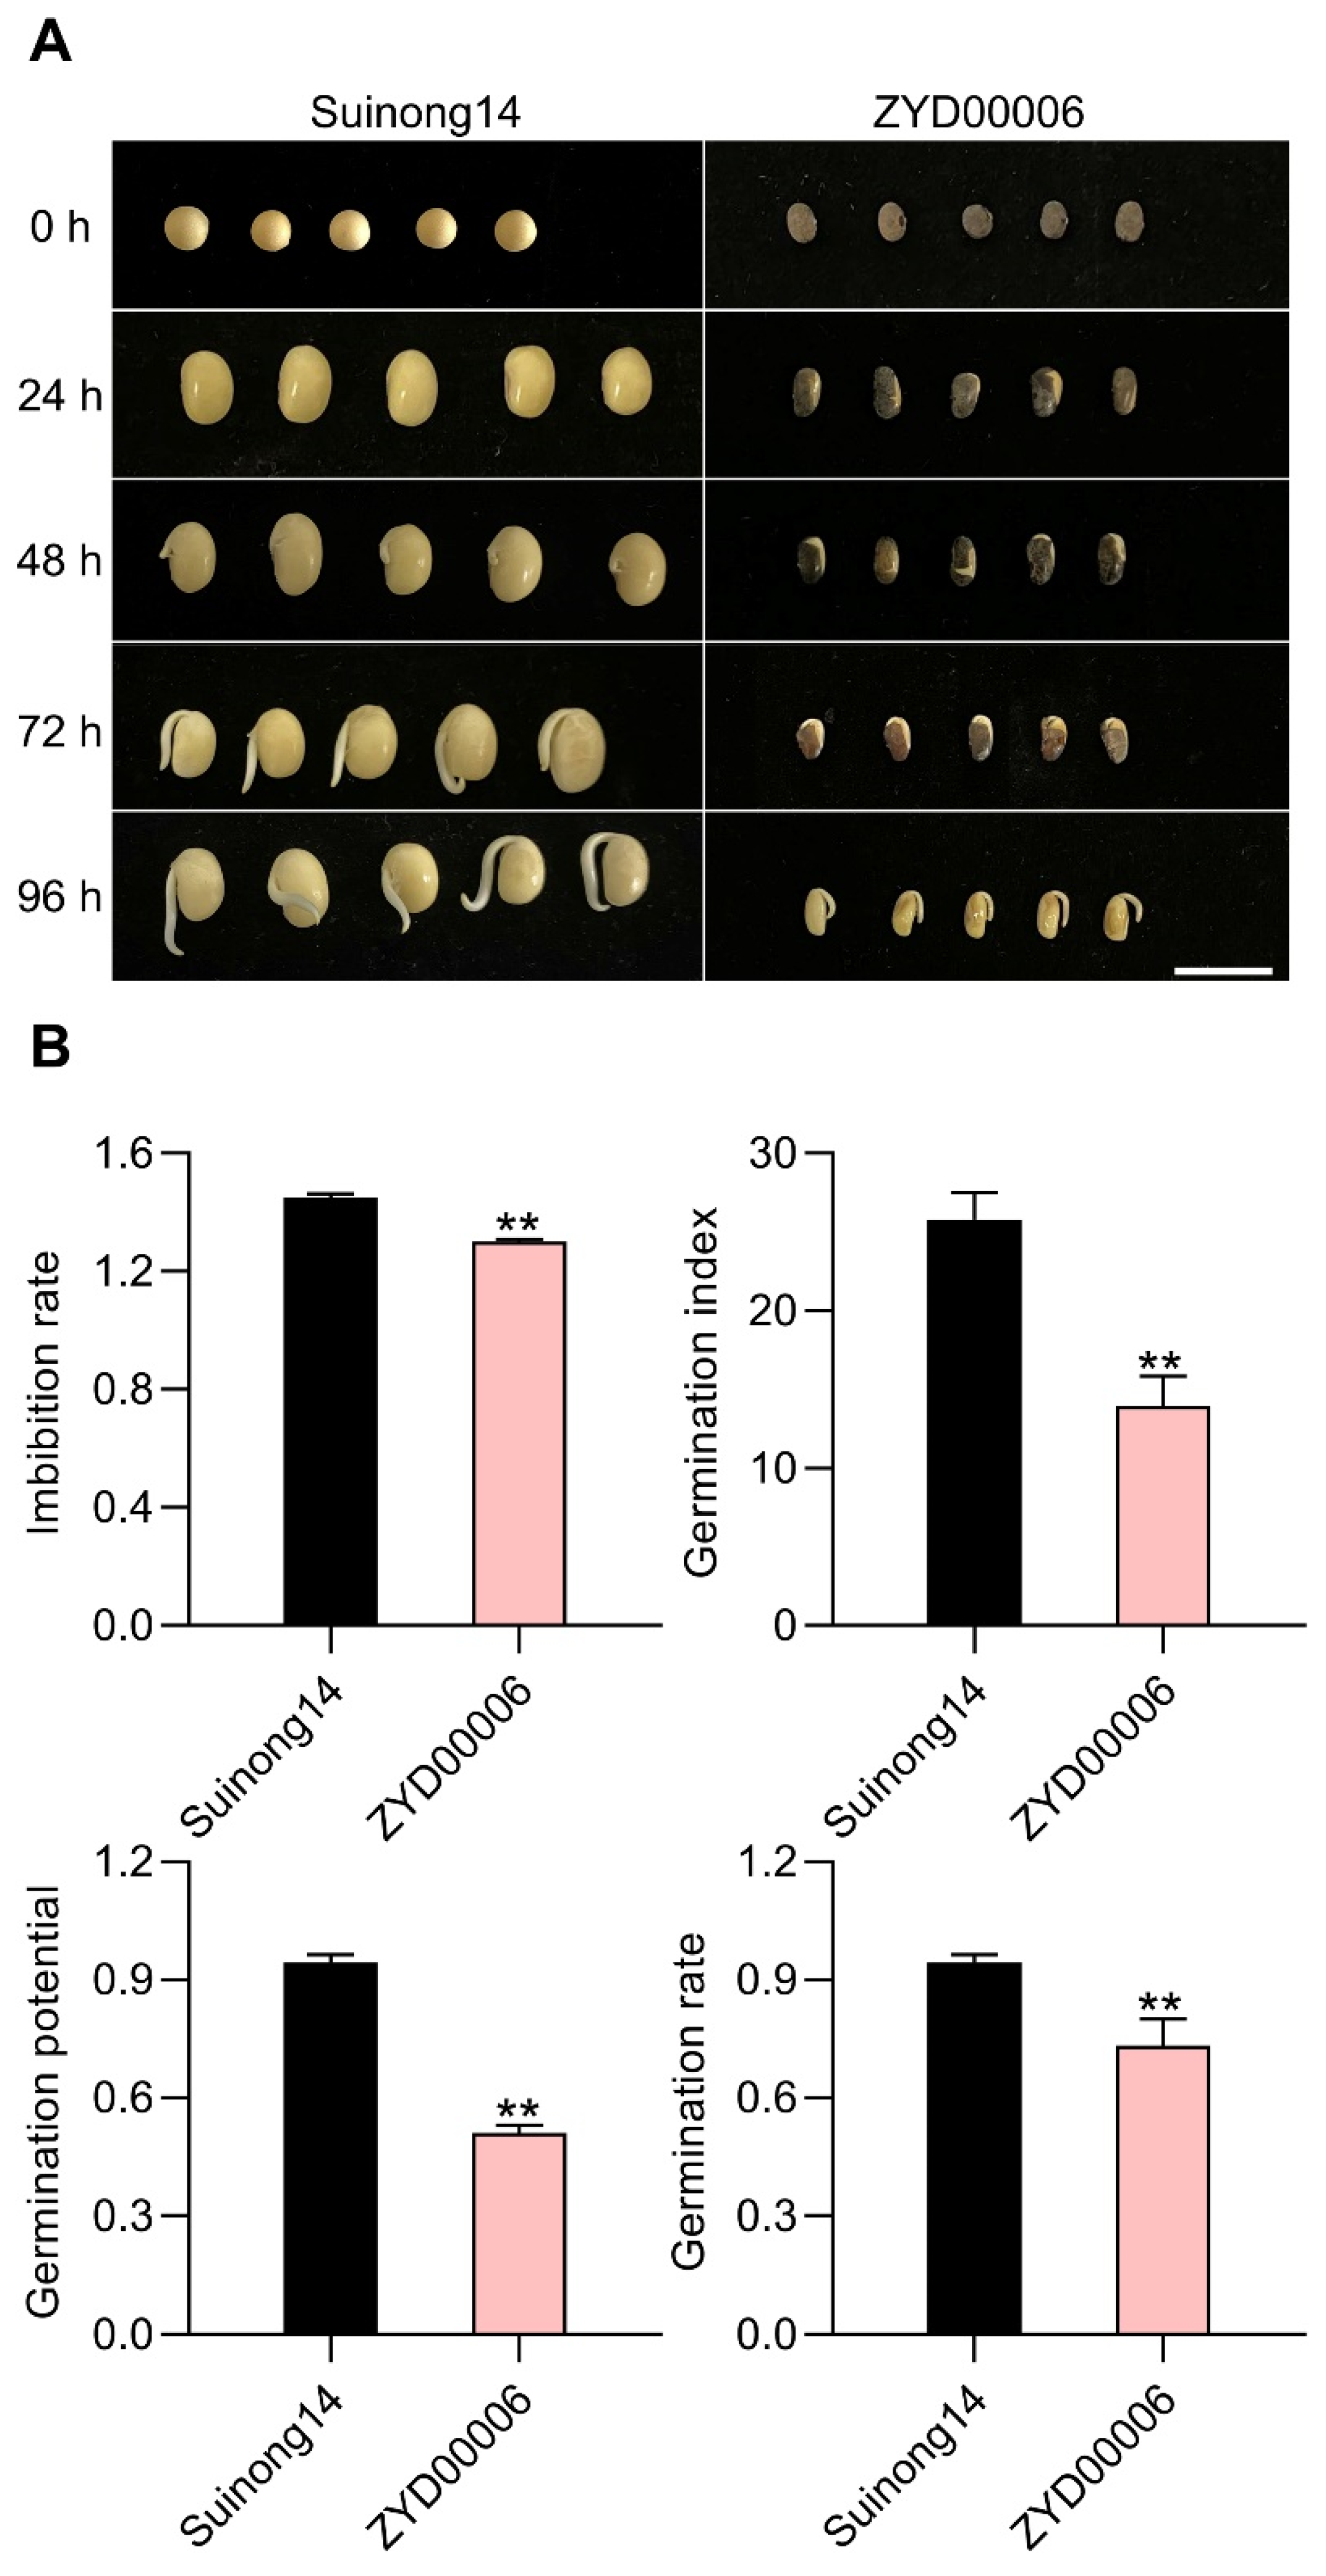
3.1. The Seed Vigor of the Improved Suinong14 Cultivar Is Superior to That of Wild ZYD00006 Soybean

Through the sowing of different germplasm resources under field conditions in specific years, the improved Suinong14 cultivar was found to exhibit a higher germination rate than that of the wild ZYD00006 cultivar. Given this observation and the fact that Suinong14 seedling growth was more orderly than that of ZYD0006, this suggests that the seed vigor of Suinong14 exceeds that of ZYD00006. To test this hypothesis, four traits (imbibition rate (IR), germination index (GI), germination potential (GP), and germination rate (GR)) were evaluated to compare the seed vigor of these varieties, revealing significant differences in all four traits when comparing the Suinong14 and ZYD00006 varieties at three time points (24, 48, and 72 h post-inoculation). Relative to ZYD00006, Suinong14 exhibited significantly higher IR (1.45 vs. 1.30), GI (25.78 vs. 13.94), GP (0.94 vs. 0.51) and GR values (0.94 vs. 0.73) (Figure 1A,B). These traits all suggested that the seed vigor of Suinong14 is superior to that of ZYD00006, indicating that these two varieties can be leveraged for the identification of seed vigor-related QTLs.

3.2. Seed Vigor-Associated QTL Identification in Soybean CSSL Populations

To begin identifying QTLs of interest, a population composed of 207 CSSLs derived from the crossing and six backcrosses of Suinong14 (recurrent parent) and ZYD00006 (donor parent) was constructed. The respective IR, GI, GP, and GR values for these CSSLs ranged from 1.22 to 1.52, 12.35 to 26.91, 0.51 to 0.96, and 0.60 to 0.96, respectively, with the corresponding values for both parental strains falling within these ranges (Table 1). These results are consistent with the genetic differences between the Suinong14 and ZYD00006 varieties having contributed to the observed differences in seed vigor levels among CSSLs. The WinQTL Cartographer tool was used to identify QTLs associated with these four traits based on a composite interval mapping model (CIM), analyzing phenotypic data with 1000 permutation tests and selecting QTLs based on a p-value < 0.05 and LOD peak scores > 3.0 (WinQTL Cartographer default threshold). In total, 20 seed vigor-related QTLs were identified, including five associated with IR (qIR-02, qIR-03, qIR-08, qIR-12, and qIR-14), five associated with GI (qGI-03, qGI-05, qGI-10, qGI-12 and qGI-15), four associated with GP (qGP-03, qGP-06, qGP-07 and qGP-13), and six associated with GR (qGR-03, qGR-06, qGR-09, qGR-12, qGR-16 and qGR-18) (Table 2).

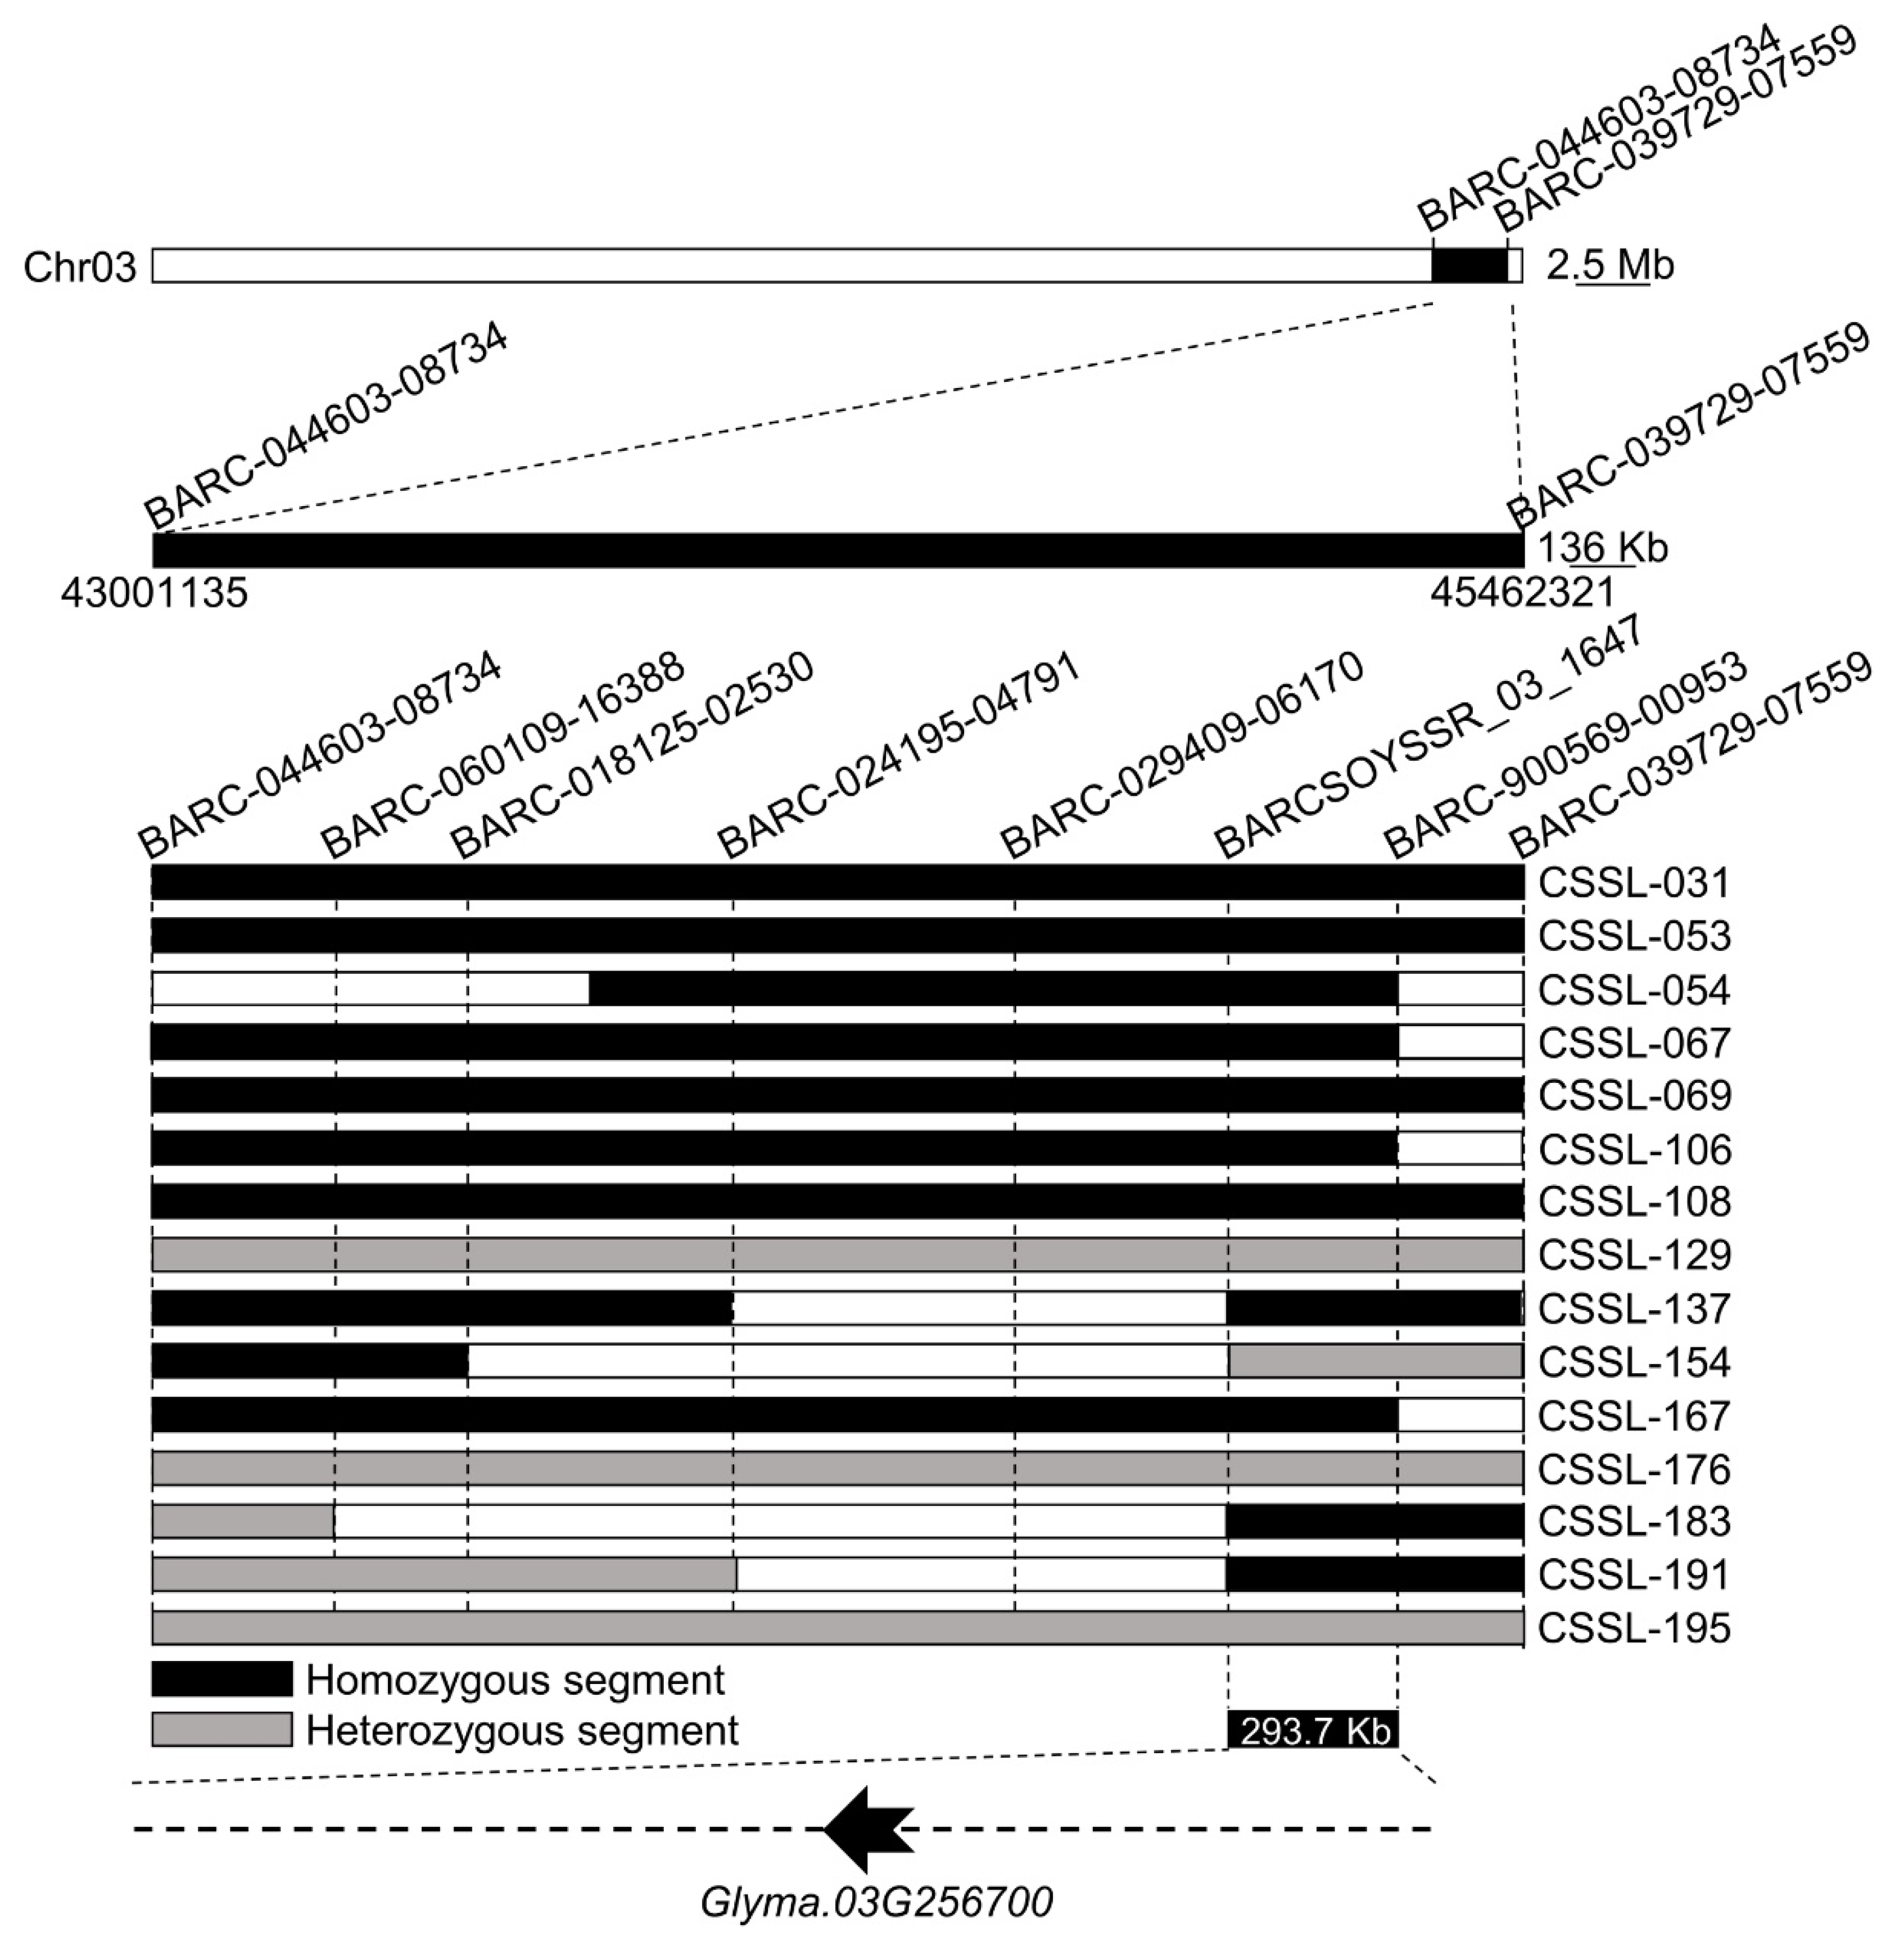
3.3. Chromosome Fragment Insertion-Based Identification of Candidate Intervals

Over the course of the backcrossing process used to generate the 207 CSSLs used for this study, ZYD00006-derived DNA fragments were integrated into the Suinong14 genome such that the genome of each CSSL was primarily that of the Suinong14 parental line with small ZYD00006 genomic insertions, with the different insertions accounting for the different properties exhibited by these individual lines. Given that Suinong14 exhibited greater seed vigor, inserting ZYD00006 genomic material had the potential to yield plants with profoundly reduced vigor. To identify the genomic insertions associated with such a loss of vigor, 15 CSSLs exhibiting extremely low levels of seed vigor were selected for resequencing, analyzing fragment insertions based on SSR markers. These analyses revealed that the insertion of ZYD00006 DNA fragments into a 293.7 kb region (44.88 Mb–45.18 Mb) between the BARCSOYSSR_03_1647 and BARC-900569-00953 markers on chromosome 3 overlapping with the QTL intervals identified above was potentially related to seed vigor (Figure 2). As such, at least one gene within this interval is predicted to serve as a regulator of seed vigor during germination.

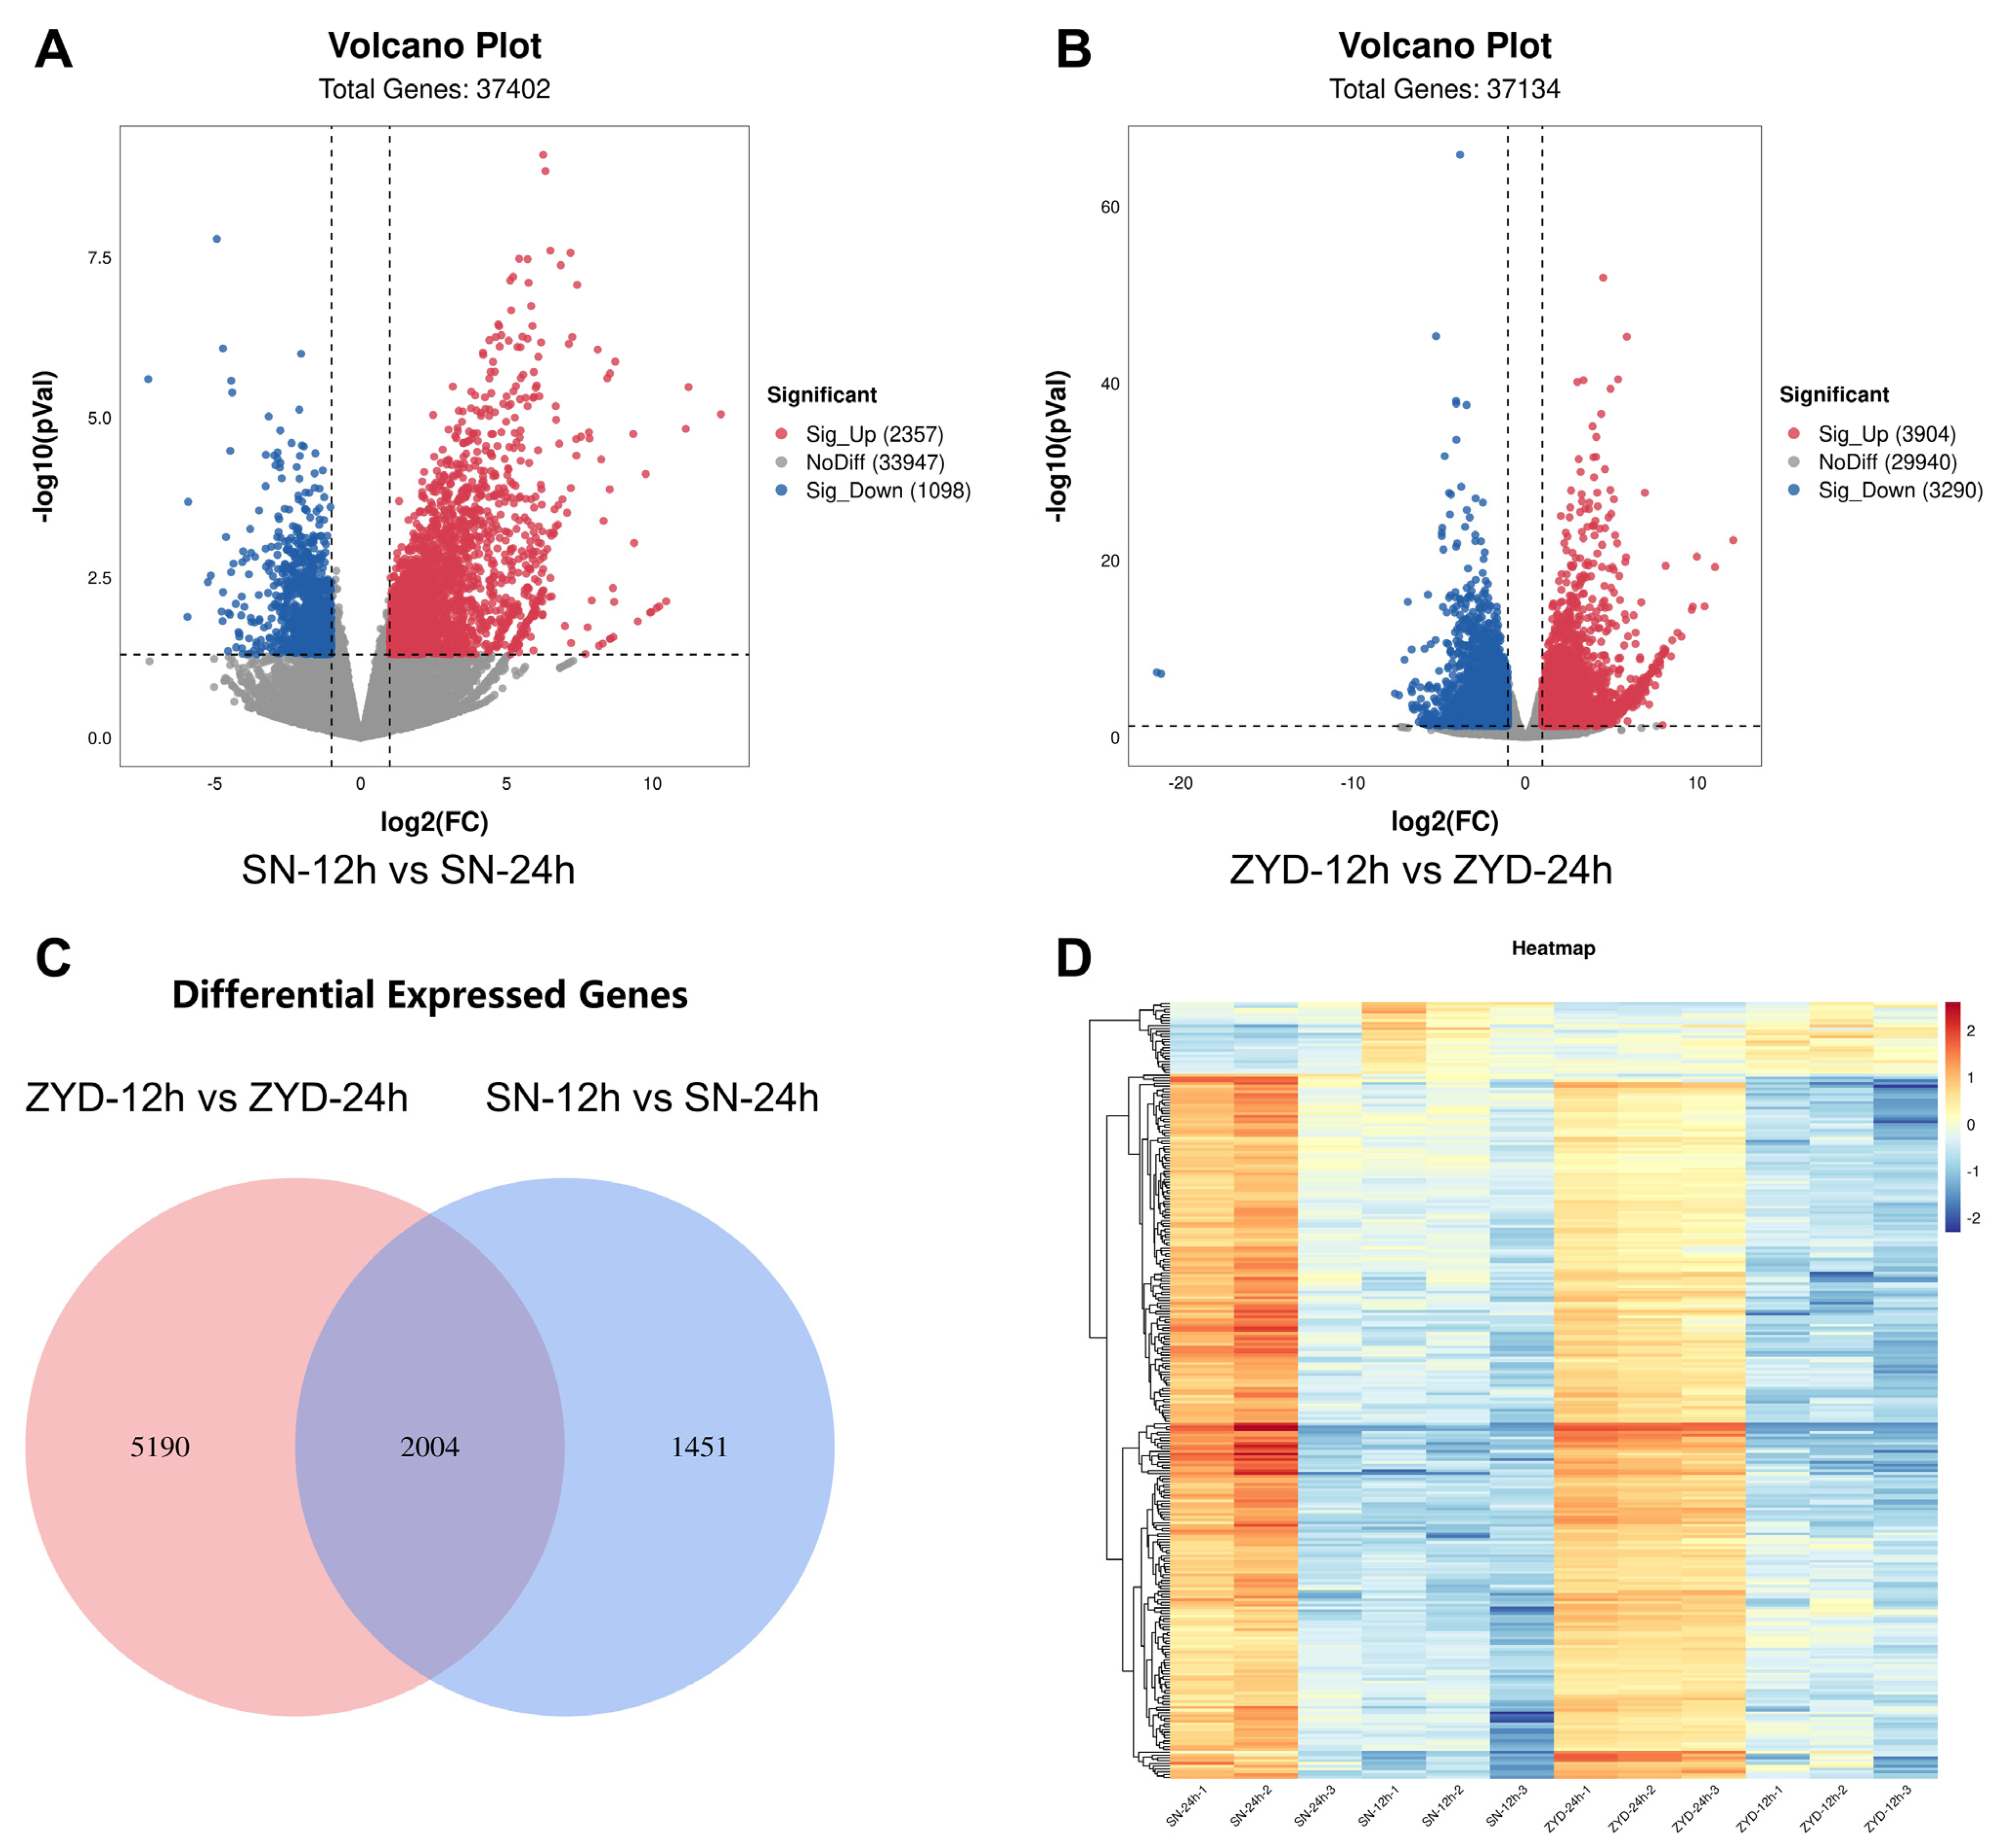
3.4. High-Throughput RNA-Seq of Germinating Suinong14 and ZYD00006 Varieties

Suinong14 and ZYD00006 seeds collected at 12 and 24 h of germination were used for RNA-Seq analyses, yielding ~633 M clean reads after quality control, with a mapping ratio of 91.44–94.23%. The Suinong14 and ZYD00006 samples respectively yielded approximately 54 and 51 M clean reads on average (Table S2), with these numbers being adequate for transcriptomic sequencing efforts. Transcriptomic analyses revealed 40,546 genes expressed in these two parental lines through a global read mapping analysis, including 3455 differentially expressed genes (DEGs; log2FC > 1 and <−1, adjusted p < 0.05) when SN-12 h vs. SN-24 h. These included 2357 and 1098 upregulated and downregulated DEGs, respectively (Figure 3A), these included the identification of DEGs associated with seed vigor compounds involved in some signaling pathways (Figure S1A,B). Including 7194 differentially expressed genes (DEGs; log2FC > 1 and <−1, adjusted p < 0.05) when ZYD-12 h vs. ZYD-24 h. These included 3904 and 3290 upregulated and downregulated DEGs, respectively (Figure 3B), these included the identification of DEGs associated with seed vigor compounds involved in some signaling pathways (Figure S2A,B). In total, 6641 genes have been identified and compared; SN-12 h vs. SN-24 h with ZYD-12 h vs. ZYD-24 h (Figure 3C), and global DEG expression patterns are presented in Figure 3D. These included the identification of DEGs associated with seed vigor compounds involved in the flavonoid biosynthetic process (GO:0009813), transmembrane transport (GO:0055085), ethylene-activated signaling pathway (GO:0009873), response to light stimulus (GO:0009416), negative regulation of transcription, DNA-templated (GO:0045892), chloroplast envelope (GO:0009941), chloroplast thylakoid membrane (GO:0009535), zinc ion binding (GO:0008270), response to water deprivation (GO:0008270), cell differentiation (GO:0030154), response to wounding (GO:0009611), cell division (GO:0051301), response to cadmium ion (GO:0046686), cell wall organization (GO:0071555), endoplasmic reticulum (GO:0005783), cell wall (GO:0005618), hydrolase activity (GO:0016787) (Figures S1A and S2A). KEGG enrichment analyses also revealed the enrichment of certain DEGs in the mRNA surveillance pathway, namely aminoacyl-tRNA biosynthesis, glutathione metabolism, cysteine and methionine metaboli, glyoxylate and dicarboxylate metabolism, glycerolipid metabolism, protein processing in endoplasmic reticulum, ubiquitin-mediated proteolysis, purine metabolism, phenylpropanoid biosynthesis, amino sugar and nucleotide sugar metabolism, and pyrimidine metabolism (Figures S1B and S2B).

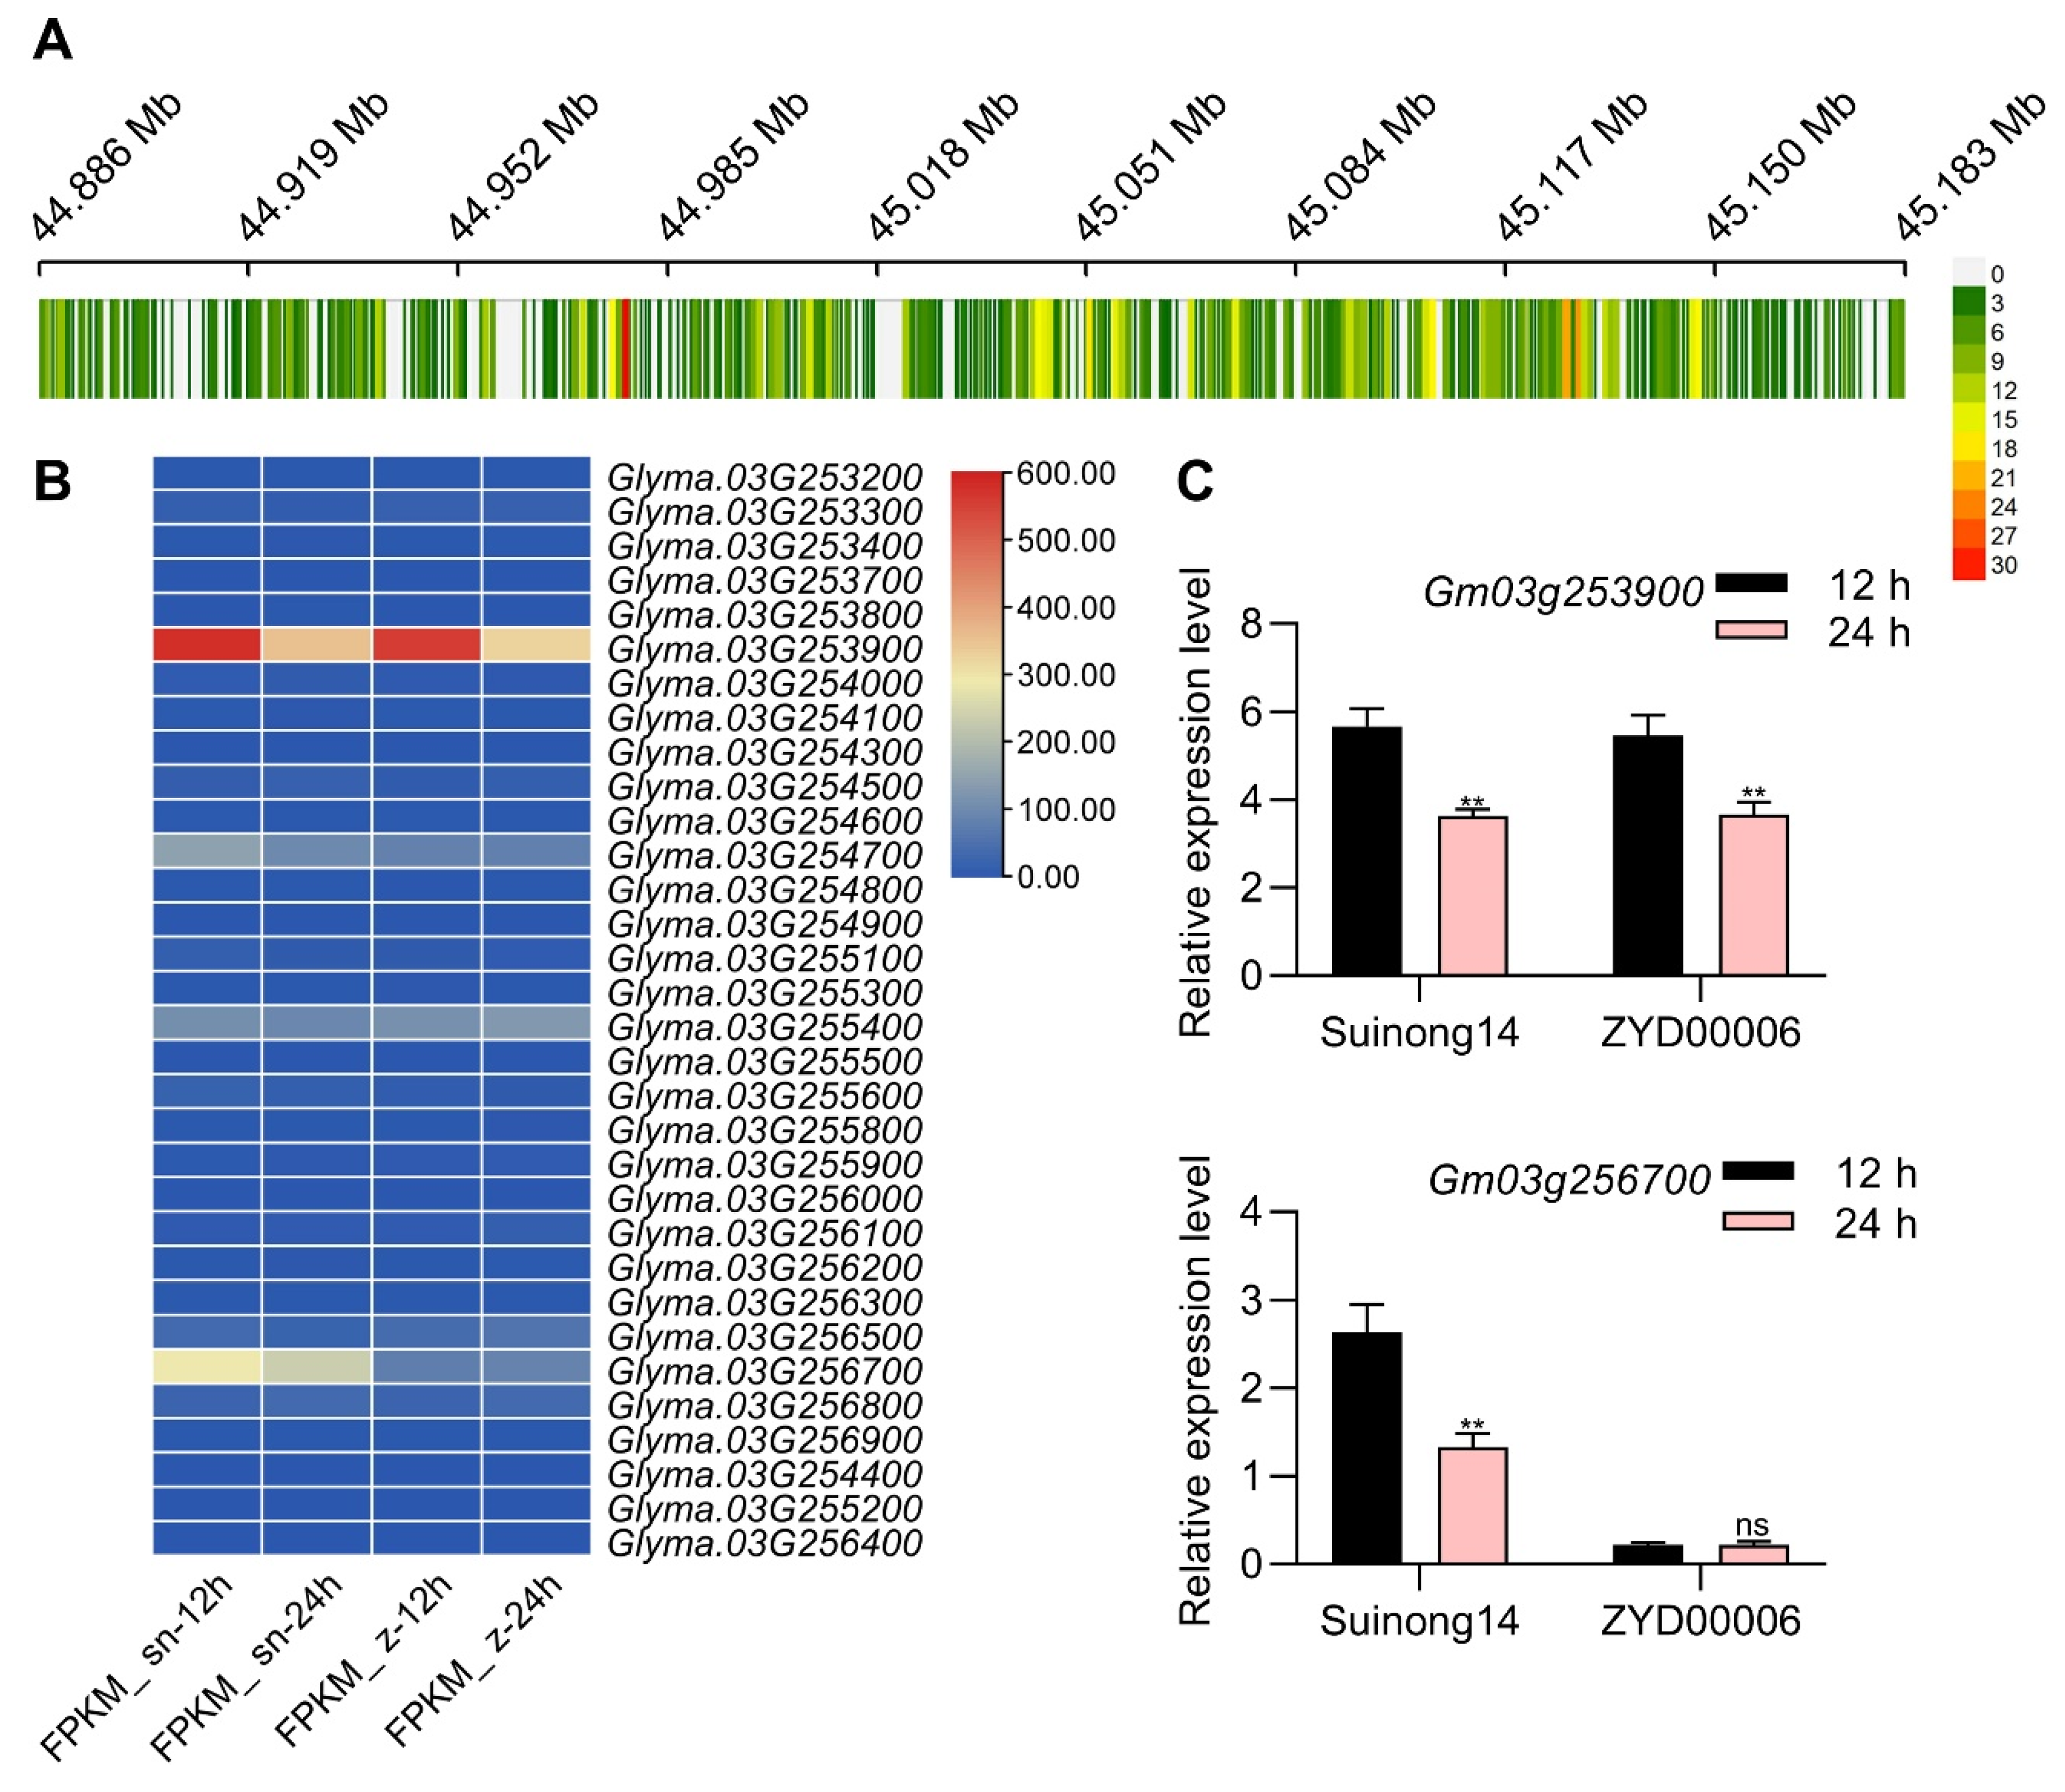
3.5. Sequencing-Based Seed Vigor-Related Candidate Gene Identification

There were 38 genes in 293.7 kb region according to the reference genome of Williams 82, Suinong14 and ZYD00006, and 867 SNPs (single nucleotide polymorphism) and 337 InDels (insertion and deletions) within this region of chromosome 3 had been detected (Figure 4A). Of these SNPs, 37 were located within exonic regions of 20 genes, while 265 were located within the 3000 bp promoter regions upstream of 11 genes (Table S3). Of these InDels, five were located within exonic regions of four genes, while 128 were located within the 3000 bp promoter regions upstream of 24 genes (Table S3). In total, there were SNPs or InDels in 32 genes, and all SNPs and InDels could not led to early termination of translation. Transcriptome data demonstrated that among the 32 genes, Glyma.03g253500 and Glyma.03G256700 can be expressed at the seed germination stage, and Glyma.03G256700 exhibited significantly different expression during seed germinating in Suinong14 compared with ZYD00006 (Figure 4B). Subsequent qPCR analyses confirmed that the expression levels of Glyma.03G256700 in Suinong14 at 12 h or 24 h post-germination were higher than that in ZYD00006 at 12 h or 24 h post-germination, but Glyma.03g253500 had no different expression pattern in Suinong14 compared with ZYD00006 (Figure 4C). SNP analyses of Glyma.03G256700 in these two parental lines revealed four SNPs and three InDels in promoter region (Table S3). This suggested that the promoter region SNPs and InDels likely account for the differences in Glyma.03G256700 expression observed during germination. As such, Glyma.03G256700 was chosen as a gene candidate for further research focused on soybean seed vigor.

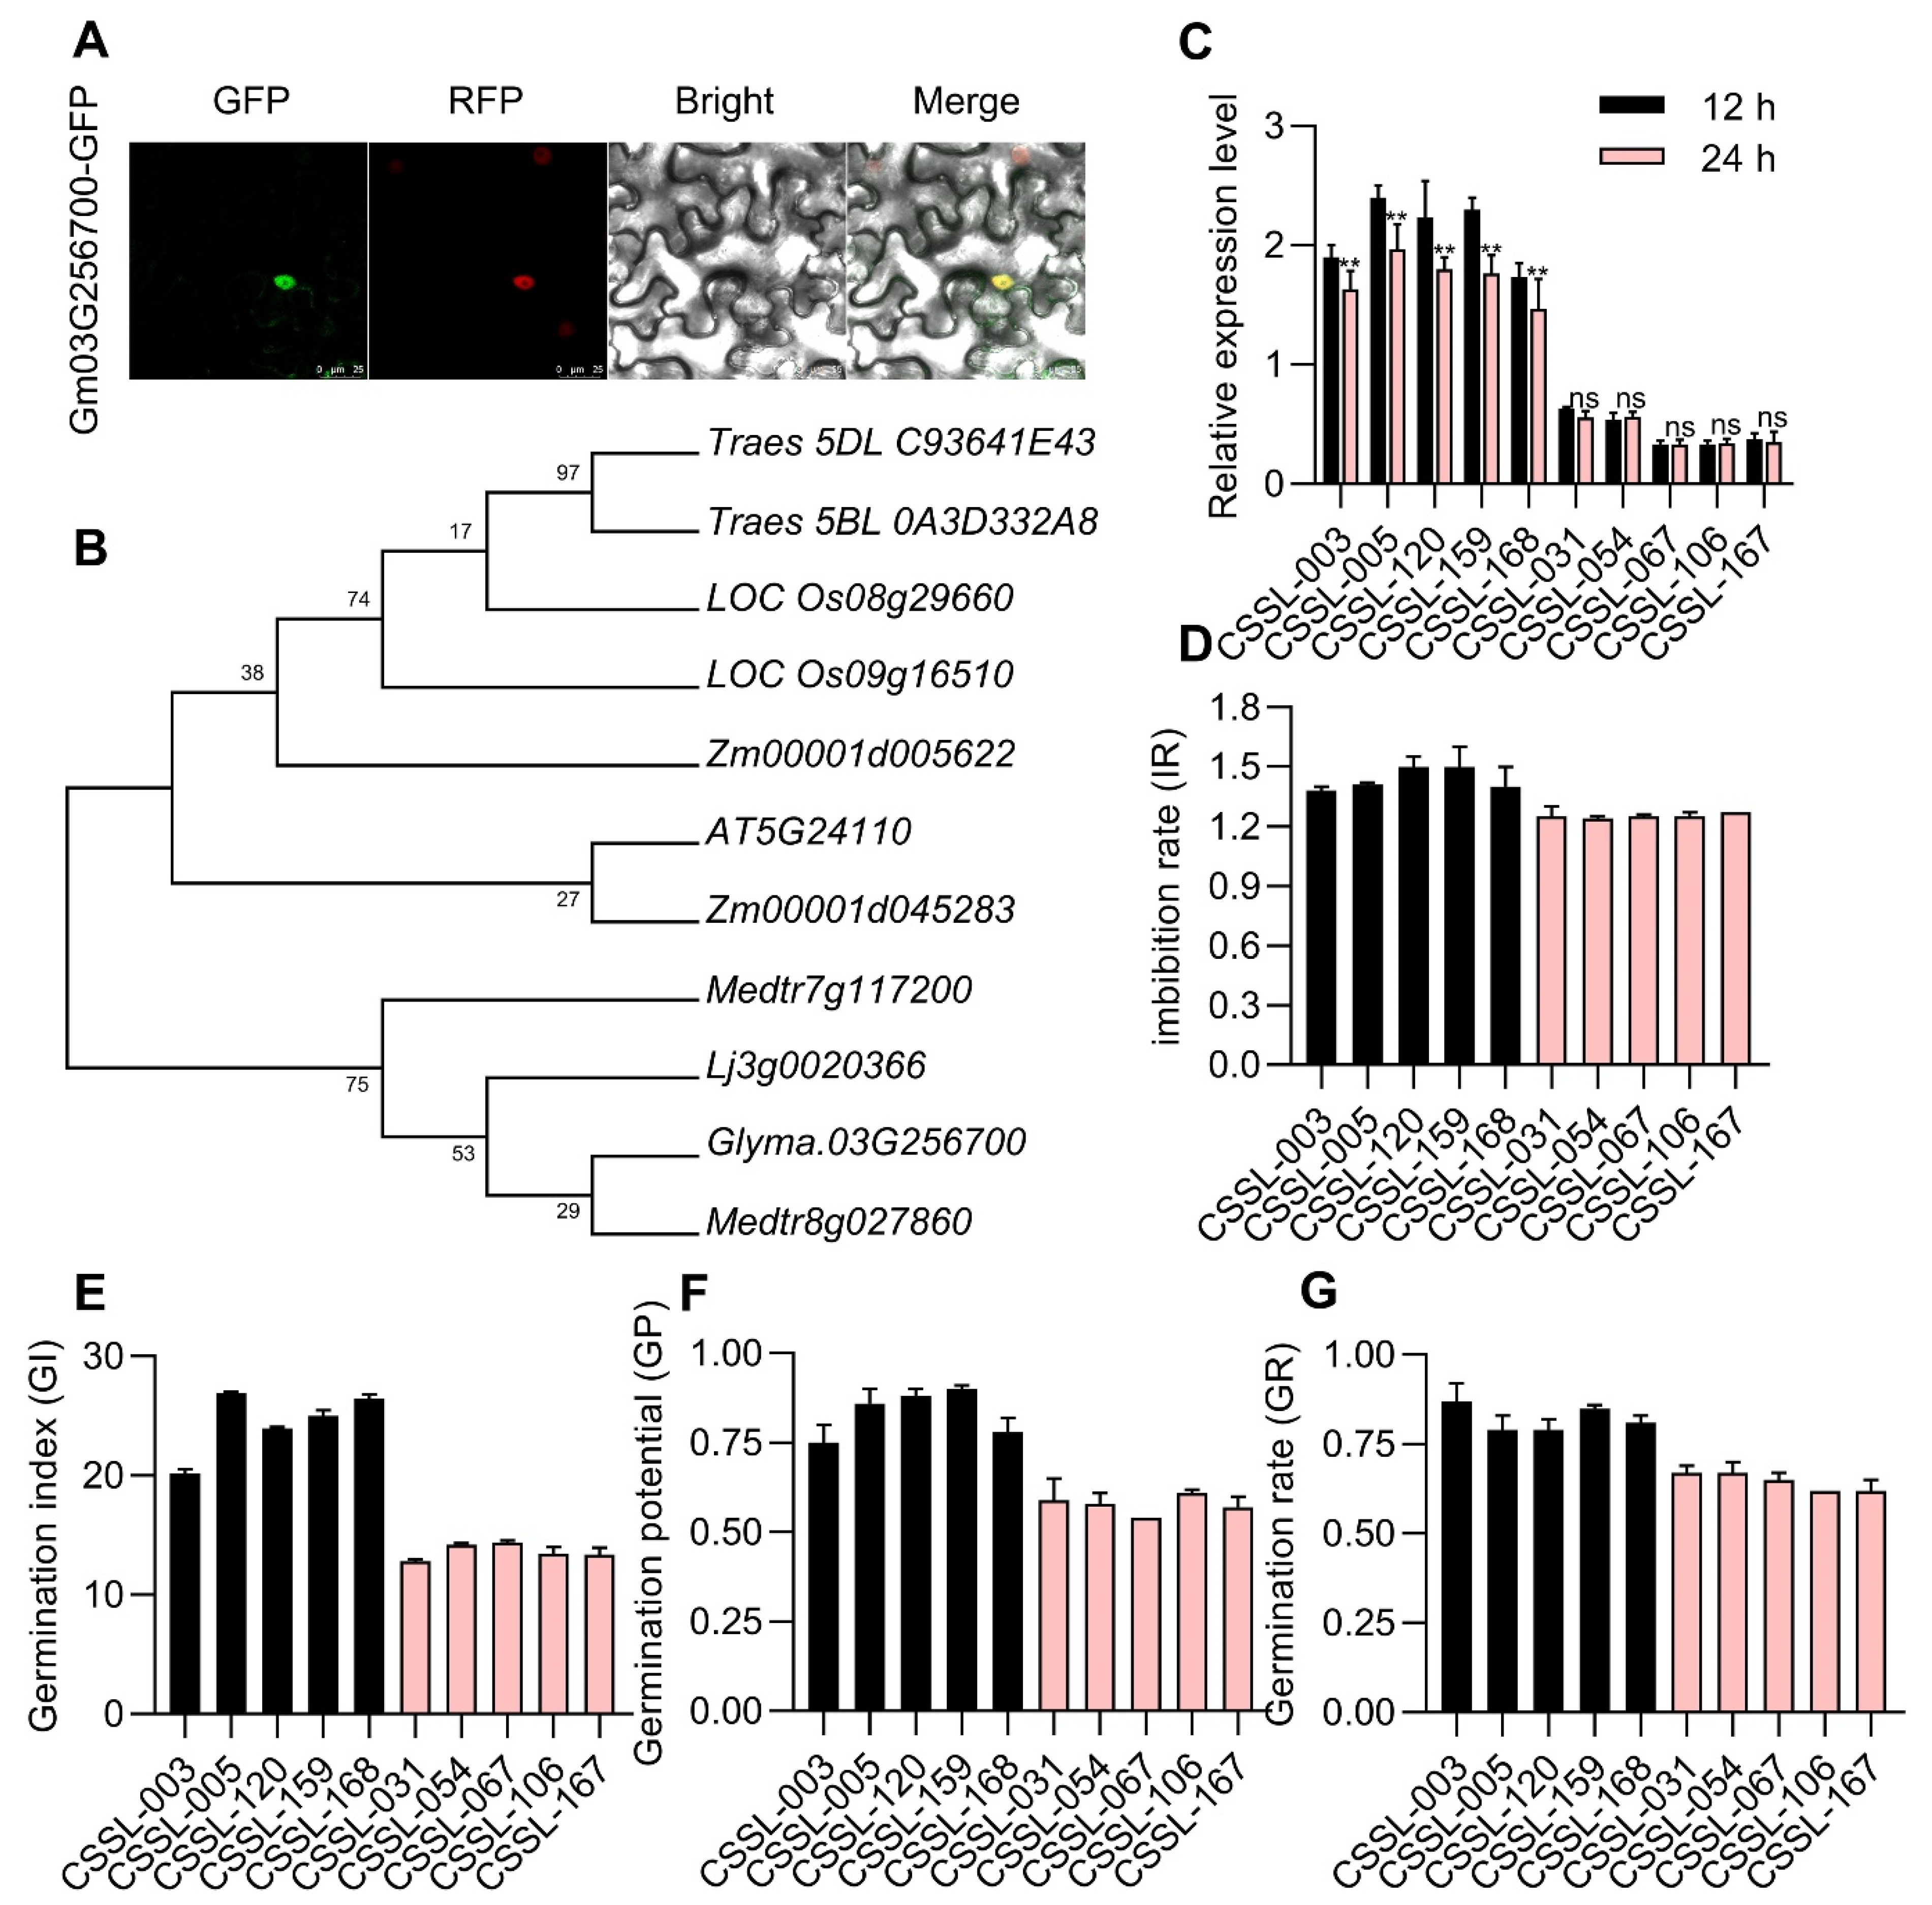
3.6. Glyma.03G256700 Encodes a WRKY53 Protein Exhibiting Differential Expression in CSSLs Exhibiting Varying Levels of Seed Vigor

Glyma.03G256700 is a 1089 bp gene encoding a member of the WRKY protein family that is 363 amino acids long and targeted to the nuclear compartment (Figure 5A). Phylogenetic analyses of six species (Glycine max, Triticum aestivum, Oryza sativa, Zea mays, Lotus corniculatus, Arabidopsis thaliana, and Medicago truncatula) revealed a close relationship between Glyma.03G256700 and both Medtr8g0278600 and Li3g0020366, which belong to the legume family (Figure 5B). A qPCR approach was next employed to compare Glyma.03G256700 levels at 24 h post-germination in 20 representative CSSLs (Figure 5C), including five with enhanced seed vigor (CSSL-003, CSSL-012, CSSL-120, CSSL-159 and CSSL-168) and five with poorer seed vigor (CSSL-031, CSSL-054, CSSL-067, CSSL-106, and CSSL-167). The Glyma.03G256700 expression of five high-seed vigor varieties were higher than the expression level in five low-seed vigor varieties (Figure 5D). This strategy revealed Glyma.03G256700 upregulation in the CSSLs with higher levels of seed vigor, confirming the potential for Glyma.03G256700 to regulate this important agronomic trait.

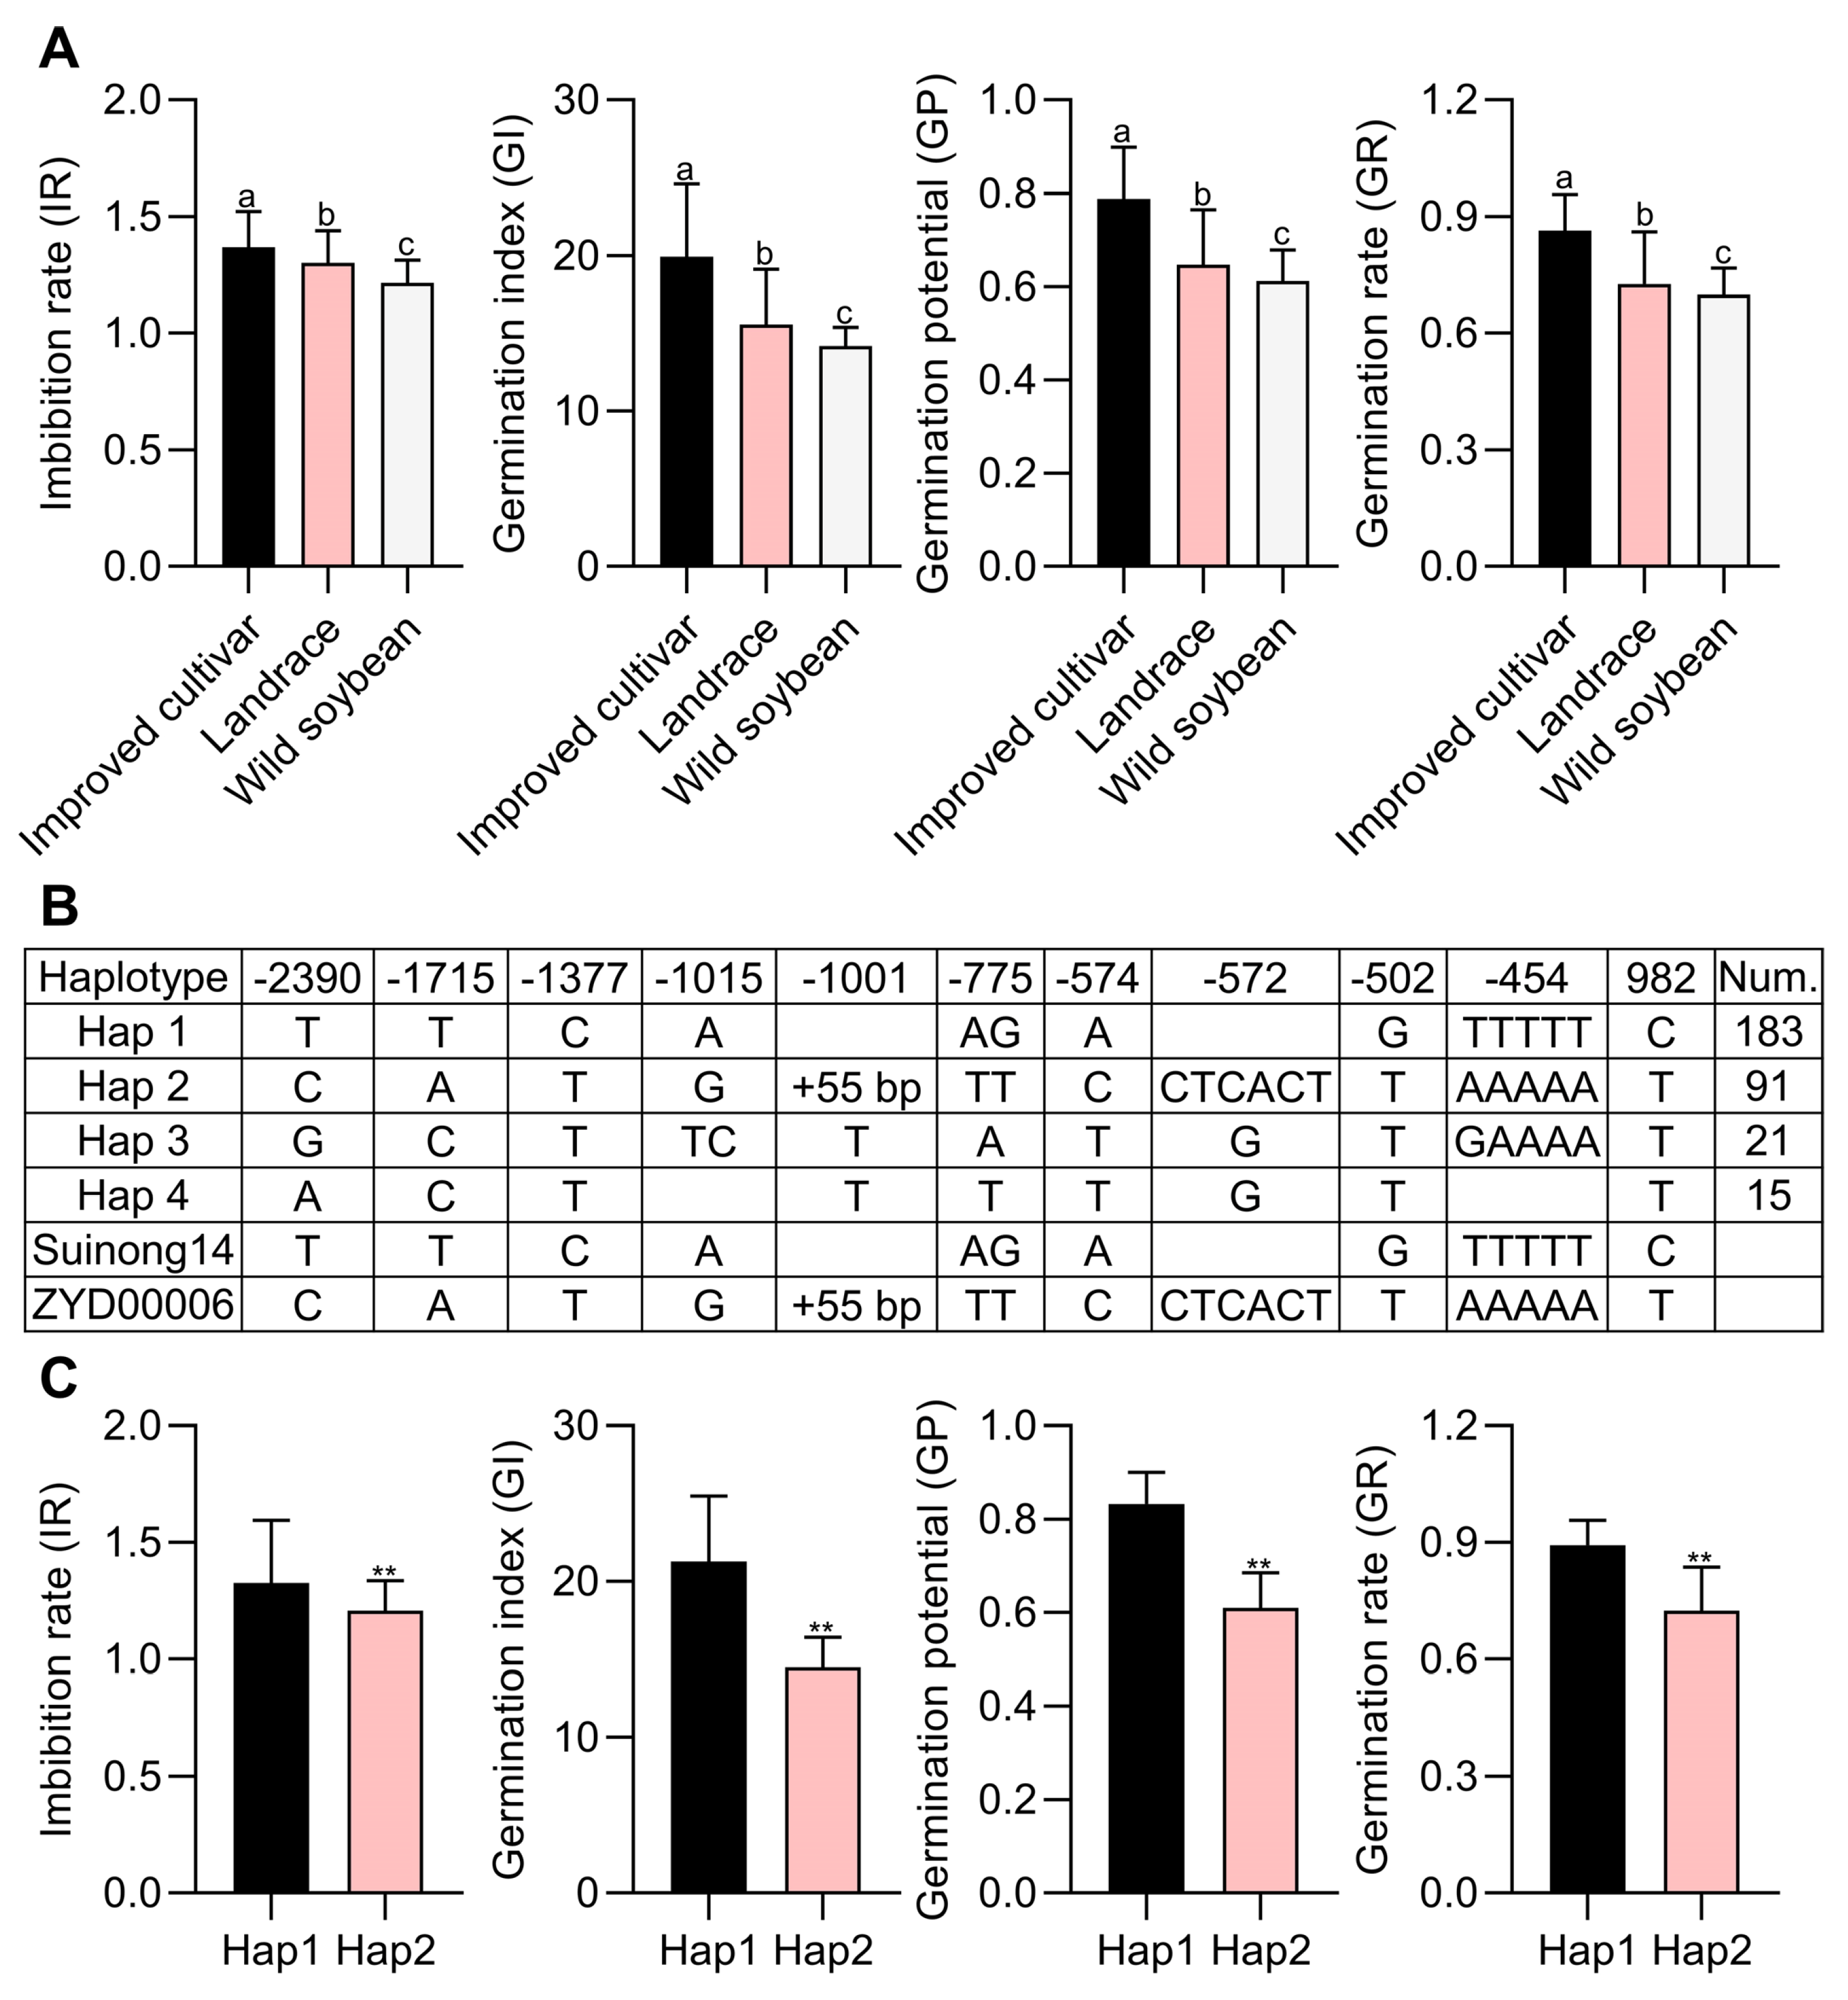
3.7. Analyses of Glyma.03G256700 Haplotypes in Natural Soybean Germplasms

For further analyses of seed vigor, 310 soybean germplasms from northeastern China were collected, including 229 improved cultivars, 71 landraces, and 10 wild varieties (Table S2). The phenotypes of these varieties were examined, revealing that the seed vigor of wild accessions was poorer than that of the landraces or improved cultivars, the latter of which exhibited the highest level of seed vigor (Figure 6A). To confirm the relationship between Glyma.03G256700 and seed vigor, the Dnasp 5.0 software was utilized to assess Glyma.03G256700 haplotypes based on the resequencing and phenotypic results obtained above. A total of four Glyma.03G256700 haplotypes were identified across these 310 varieties, with two consisting of greater than 10 accessions being regarded as dominant (Figure 6B). In total, eight SNPs and two InDels were identified within the promoter and exon regions for Hap 1 (including Suinong14) and Hap 2 (including ZYD00006) (Figure 6B). To clarify relationships between Glyma.03G256700 alleles and seed vigor variations, combined phenotypic and haplotype analyses were performed for these 310 soybean germplasms. This approach revealed profound differences in seed vigor when comparing the Hap1 and Hap2 soybean accessions (Figure 6C). Subsequently, qPCR approaches were employed to assess Glyma.03G256700 patterns at 24 h post-germination in six Hap1 varieties exhibiting high seed vigor levels and six Hap2 varieties exhibiting poorer seed vigor. This strategy revealed significantly higher Glyma.03G256700 expression in these six Hap1 varieties as compared to the Hap2 varieties (Figure S3A–E). As such, the present haplotype analysis results support the predicted link between Glyma.03G256700 and seed vigor in soybean plants.

4. Discussion

As a complex trait under the regulation of multiple genetic factors, seed vigor is an agronomically important trait that influences the quality of seeds, with low levels contributing to the failure of field emergence and the post-germination establishment of seedlings [8,16]. The heritability of genetic factors that shape seed vigor phenotypes is particularly important [5,28]. Research focused on soybean seed vigor remains relatively immature at present, although certain candidate genes have been linked to this trait in other species. The utilization of high-quality genetic populations and efficient bioinformatics techniques can guide the identification of loci of interest, with studies of the factors that regulate these loci, in turn, providing valuable insight that can aid genetic efforts to augment soybean seed vigor [3].
Soybean germplasm resources are broadly grouped into improved cultivars, landraces, and wild soybean varieties based on their degree of domestication [29]. As the most domesticated varieties, improved cultivars were initially derived from landraces and wild cultivars through selection for specific agronomic traits, thereby reducing their genetic diversity [1,30]. Wild soybeans, in contrast, tend to exhibit more pronounced phenotypic and genetic diversity [31,32]. While they tend to be better suited to adaptation to abiotic stressors and environmental changes, wild soybeans often retain agronomic traits that are undesirable including poor stability, poor quality, and limited yields [33]. Genetic differences among these three classes of germplasm resources can aid in the breeding of soybean varieties [34]. Here, 229, 71, and 10 improved cultivars, landraces, and wild varieties were leveraged to explore the associations between genetic haplotypes and seed vigor. As expected, improved cultivars exhibited the highest levels of seed vigor, followed by landraces and wild varieties. The improved cultivar Suinong14 and the wild ZYD00006 variety were herein used to establish a CSSL population, with the insertion of ZYD00006 chromosomal fragments then being detected through molecular marker-assisted selection. Given that backcrossing has been continuously performed for more than 10 years, ZYD00006 DNA fragments inserted into the Suinong14 genome differed among individual CSSLs, minimizing the impact of genetic background on the present analyses [20]. A total of 20 seed vigor-related QTLs were ultimately identified, including five associated with IR, five associated with GI, four associated with GP, and six associated with GR. These loci included some overlap with loci previously linked to germination-associated phenotypes including qSTIR-8 [21], qGP-6 [5], qDG003 [27] and qGR-6 [5]. These findings are thus consistent with the accuracy of this QTL mapping and genetic analysis strategy. Subsequently, chromosome fragment insertion, whole-genome resequencing, and RNA-Seq were employed to screen for seed vigor-associated loci as a means of further refining these findings.
RNA-Seq, SNP, and qPCR analyses confirmed the identity of Glyma.03G256700 as a seed vigor-related gene. Glyma.03G256700 was found to encode WRKY53, a WRKY family protein 363 amino acids in length that is expressed in flowers, leaves, pods, and dry seeds. The WRKY transcription factors function by binding to W-box elements [TTGAC(C/T)] using the 1–2 WRKY domains that they contain, which are ~60 amino acids long and harbor conserved WRKYGQK sequence followed by C2H2 or C2HC zinc-finger motifs [35,36]. WRKY53 has increasingly been reported to play a role in a range of plant growth and development-related activities. In Arabidopsis, for example, AtWRKY53 shapes organ senescence, and the chromatin accessibility of the WRKY53 promoter region can be modulated, likely enabling the regulated control of WRKY53 expression to shape the onset of senescence in response to particular environmental [37,38]. AtWRKY53 is also capable of interacting with HISTONE DEACETYLASE9 (HDA9), thereby facilitating POWERDRESS/HDA9 complex recruitment to promoters containing W-box sequences upstream of important negative regulators of senescence [39,40]. In the context of flowering, AtWRKY53 directly activates AtLFY (LEAFY) and AtSOC1 (SUPPRESSOR OF OVEREXPRESSION OF CO1) transcription, additionally mediating guvermectin to promote flowering [41]. When plants are exposed to stressors, interactions between AtWRKY53 and AtCAM1 can control biosynthesis and negatively regulate the responses of these plants to herbivory [42]. The binding of WRKY53 to LOX promoters can also suppress the expression of LOX (13S lipoxygenase gene) [43]. There is further evidence for the importance of AtWRKY53 as a regulator of plant immunity and development owing to its ability to influence pathways responsible for SA metabolism [44,45]. The rice OsWRKY53 protein is capable of interacting with OsBZR1, thereby synergistically regulating BR signaling activity while also shaping seed size and leaf angle via influencing the MAPKKK10-MAPKK4-MAPK6 cascade [46]. OsWRKY53 knockout in different rice varieties can also reportedly enhance cold tolerance without adversely impacting yield [47]. OsWRKY53 also reportedly promotes OsSWEET2a expression in response to sheath blight, negatively regulating pathogen resistance [48]. A total of 174 WRKY genes in the soybean genome have been established to date, but there have not been any focused studies of WRKY53 [49,50]. In addition, most of these other WRKY family members have only been assessed in the context of growth and development. Overexpressing GmWRKY58 or GmWRKY76 in transgenic Arabidopsis, for example, failed to adversely impact abiotic stress tolerance or disease resistance whereas it did promote flowering and the enhancement of flowering-related gene expression [51]. When these two genes were silenced using a virus-induced knockdown strategy in soybean plants, this resulted in severely stunted growth, reduced height, and smaller leaves [52]. GmWRKY27 and GmMYB174 are capable of interacting to suppress the expression of the negative stress tolerance-related protein GmNAC29, thereby enhancing soybean stress tolerance [52]. The present results support a role for Glyma.03G256700, a WRKY53 transcription factor, as a regulator of soybean seed vigor. During seed germination, the expression of Glyma.03G256700 was enhanced, and SNPS and InDels within its promoter region were related to differing expression patterns across soybean varieties. Phenotypic and haplotype analyses focused on Glyma.03G256700 conducted using CSSLs and natural soybean varieties highlighted a strong correlation between Glyma.03G256700 haplotype and seed vigor. Cis-acting element analyses for the promoter regions from Suinong14 and ZYD00006 revealed that a MYB-binding site was missing from the Glyma.03G256700 promoter in ZYD00006 (Tables S5 and S6). MYB-binding site can affect the binding of MYB transcription factors to promoters, thereby affecting the regulation of gene transcription, and differences in these sequences may underlie the observed differences in the expression of these genes between these two soybean varieties during germination, thus contributing to altered seed vigor [53]. These data therefore provide support for the functionality of Glyma.03G256700 as a mediator of seed vigor, offering a basis for future mechanistic work exploring the dynamics of soybean seed germination. These findings can also be leveraged to facilitate the breeding of soybean varieties with superior seed vigor, thus enhancing crop yields and quality.

5. Conclusions

In this study, the improved Suinong14 cultivar was found to exhibit a higher germination rate than that of the wild ZYD00006 cultivar, and 20 seed-vigor related QTLs had been identified using the CSSLs derived from Suinong14 and ZYD00006. Through the RNA-seq, whole-genome resequencing, and qPCR approaches, Glyma.03G256700 was confirmed be related to seed vigor, it was upregulated in high-vigor seeds during germination, and with haplotypes of Glyma.03G256700 also remaining consistent with observed soybean seed vigor. Our findings provide new insights into the future marker-assisted and convergent breeding efforts aimed at improving seed vigor, and the future molecular and functional research of Glyma.03G256700 in seed-vigor regulation has the potential to elucidate the signaling network and key regulatory mechanisms that govern seed germination in soybean.

Supplementary Materials

The following supporting information can be downloaded at: https://www.mdpi.com/article/10.3390/agronomy14020332/s1, Figure S1. (A) GO and (B) KEGG annotations for the DEGs when SN-12 h vs. SN-24 h; Figure S2. (A) GO and (B) KEGG annotations for the DEGs when ZYD-12 h vs. ZYD-24 h; Figure S3. (A–D) The seed vigor phenotypes of the selected Hap1 and Hap2 varieties. (E) Glyma.03G256700 expression after germination in selected Hap1 and Hap2 varieties. Data are means ± SE of three replicate analyses; ** p < 0.01, ns: non-significant, Student’s t-test; Table S1. The seed-vigor phenotype in the CSSLs; Table S2. The seed-vigor phenotype in the natural varieties; Table S3. The SNPs and InDels of candidate genes in the QTL region between Suinong14 and ZYD00006, and the candidate genes annotation; Table S4. Primers used in this study; Table S5. Promoter sequence of different haplotypes; Table S6. Promoter elements analysis of different haplotypes.

Author Contributions

Conceptualization, Q.C. and M.Y.; methodology, S.M., Q.C. and M.Y.; investigation, S.M., H.F., Y.S., L.Y. and C.T.; data curation, S.M., H.F., Y.Z., L.X., J.W., C.L. and D.X.; writing—original draft preparation, S.M. and H.F.; writing—review and editing, S.M., H.F., Q.C. and M.Y.; visualization, Q.C. and M.Y.; supervision, Q.C. and M.Y.; funding acquisition, Q.C. and M.Y. All authors have read and agreed to the published version of the manuscript.

Funding

This research was funded by the National Natural Science Foundation of China (Grant numbers: 32272072 and 32201809), and the APC was funded by the National Natural Science Foundation of China (Grant numbers: 32272072 and 32201809).

Data Availability Statement

The data presented in this study are available on request from the corresponding author.

Acknowledgments

The authors would like to thank Northeast Agricultural University for supporting this study.

Conflicts of Interest

The authors declare no conflicts of interest.

References

  1. Li, Y.H.; Zhou, G.; Ma, J.; Jiang, W.; Jin, L.G.; Zhang, Z.; Guo, Y.; Zhang, J.; Sui, Y.; Zheng, L.; et al. De novo assembly of soybean wild relatives for pan-genome analysis of diversity and agronomic traits. Nat. Biotechnol. 2014, 32, 1045–1052. [Google Scholar] [CrossRef] [PubMed]
  2. Wang, J.; Ma, C.; Ma, S.N.; Zheng, H.Y.; Tian, H.L.; Wang, X.; Wang, Y.; Jiang, H.W.; Wang, J.X.; Zhang, Z.G.; et al. Genetic variation in GmCRP contributes to nodulation in soybean (Glycine max Merr.). Crop J. 2023, 11, 332–344. [Google Scholar] [CrossRef]
  3. Zhang, M.; Liu, S.L.; Wang, Z.; Yuan, Y.Q.; Zhang, Z.F.; Liang, Q.J.; Yang, X.; Duan, Z.B.; Liu, Y.C.; Kong, F.J.; et al. Progress in soybean functional genomics over the past decade. Plant Biotechnol. J. 2022, 20, 256–282. [Google Scholar] [CrossRef] [PubMed]
  4. Shi, H.; Guan, W.H.; Shi, Y.G.; Wang, S.G.; Fan, H.; Yang, J.W.; Chen, W.G.; Zhang, W.J.; Sun, D.Z.; Jing, R.L. QTL mapping and candidate gene analysis of seed vigor-related traits during artificial aging in wheat (Triticum aestivum). Sci. Rep. 2020, 10, 22060. [Google Scholar] [CrossRef] [PubMed]
  5. Wang, R.; Wu, F.; Xie, X.; Yang, C. Quantitative Trait Locus Mapping of Seed Vigor in Soybean under −20 °C Storage and Accelerated Aging Conditions via RAD Sequencing. Curr. Issues Mol. Biol. 2021, 43, 1977–1996. [Google Scholar] [CrossRef] [PubMed]
  6. Wang, W.Q.; Xu, D.Y.; Sui, Y.P.; Ding, X.H.; Song, X.J. A multiomic study uncovers a bZIP23-PER1A-mediated detoxification pathway to enhance seed vigor in rice. Proc. Natl. Acad. Sci. USA 2022, 119, e2026355119. [Google Scholar] [CrossRef]
  7. Reed, R.C.; Bradford, K.J.; Khanday, I.; Bradford, K.J.; Khanday, I. Seed germination and vigor: Ensuring crop sustainability in a changing climate. Heredity 2022, 128, 450–459. [Google Scholar] [CrossRef]
  8. Zhao, J.; He, Y.; Huang, S.; Wang, Z. Advances in the Identification of Quantitative Trait Loci and Genes Involved in Seed Vigor in Rice. Front. Plant Sci. 2021, 12, 659307. [Google Scholar] [CrossRef]
  9. Huang, Y.T.; Wu, W.; Zhao, T.Y.; Lu, M.; Wu, H.P.; Cao, D.D. Drying temperature regulates vigor of high moisture rice seeds via involvement in phytohormone, ROS, and relevant gene expression. J. Sci. Food Agric. 2021, 101, 2143–2155. [Google Scholar] [CrossRef]
  10. Li, T.; Zhang, Y.; Wang, D.; Liu, Y.; Dirk, L.M.A.; Goodman, J.; Downie, A.B.; Wang, J.; Wang, G.; Zhao, T. Regulation of Seed Vigor by Manipulation of Raffinose Family Oligosaccharides in Maize and Arabidopsis thaliana. Mol. Plant 2017, 10, 1540–1555. [Google Scholar] [CrossRef] [PubMed]
  11. Xu, S.; Fei, Y.; Wang, Y.; Zhao, W.; Hou, L.; Cao, Y.; Wu, M.; Wu, H. Identification of a Seed Vigor-Related QTL Cluster Associated with Weed Competitive Ability in Direct-Seeded Rice (Oryza sativa L.). Rice 2023, 16, 45. [Google Scholar] [CrossRef]
  12. Zeng, Z.; Guo, C.; Yan, X.; Song, J.; Wang, C.; Xu, X.; Hao, Y. QTL mapping and KASP marker development for seed vigor related traits in common wheat. Front. Plant Sci. 2022, 13, 994973. [Google Scholar] [CrossRef]
  13. Nguyen, D.T.; Hayes, J.E.; Harris, J.; Sutton, T. Fine Mapping of a Vigor QTL in Chickpea (Cicer arietinum L.) Reveals a Potential Role for Ca4_TIFY4B in Regulating Leaf and Seed Size. Front. Plant Sci. 2022, 13, 829566. [Google Scholar] [CrossRef] [PubMed]
  14. Yang, W.; Zhang, F.; Zafar, S.; Wang, J.; Lu, H.; Naveed, S.; Lou, J.; Xu, J. Genetic dissection of heterosis of indica-japonica by introgression line, recombinant inbred line and their testcross populations. Sci. Rep. 2021, 11, 10265. [Google Scholar] [CrossRef]
  15. Dang, X.; Thi, T.G.; Dong, G.; Wang, H.; Edzesi, W.M.; Hong, D. Genetic diversity and association mapping of seed vigor in rice (Oryza sativa L.). Planta 2014, 239, 1309–1319. [Google Scholar] [CrossRef]
  16. Gu, J.; Hou, D.; Li, Y.; Chao, H.; Zhang, K.; Wang, H.; Xiang, J.; Raboanatahiry, N.; Wang, B.; Li, M. Integration of proteomic and genomic approaches to dissect seed germination vigor in Brassica napus seeds differing in oil content. BMC Plant Biol. 2019, 19, 21. [Google Scholar] [CrossRef] [PubMed]
  17. Luo, T.; Zhang, Y.; Zhang, C.; Nelson, M.N.; Yuan, J.; Guo, L.; Xu, Z. Genome-Wide Association Mapping Unravels the Genetic Control of Seed Vigor under Low-Temperature Conditions in Rapeseed (Brassica napus L.). Plants 2021, 10, 426. [Google Scholar] [CrossRef]
  18. Zhou, Z.; Jiang, Y.; Wang, Z.; Gou, Z.; Lyu, J.; Li, W.; Yu, Y.; Shu, L.; Zhao, Y.; Ma, Y.; et al. Resequencing 302 wild and cultivated accessions identifies genes related to domestication and improvement in soybean. Nat. Biotechnol. 2015, 33, 408–414. [Google Scholar] [CrossRef]
  19. Liu, Y.; Du, H.; Li, P.; Shen, Y.; Peng, H.; Liu, S.; Zhou, G.A.; Zhang, H.; Liu, Z.; Shi, M.; et al. Pan-Genome of Wild and Cultivated Soybeans. Cell 2020, 182, 162–176.e13. [Google Scholar] [CrossRef] [PubMed]
  20. Zheng, H.; Hou, L.; Xie, J.; Cao, F.; Wei, R.; Yang, M.; Qi, Z.; Zhu, R.; Zhang, Z.; Xin, D.; et al. Construction of Chromosome Segment Substitution Lines and Inheritance of Seed-Pod Characteristics in Wild Soybean. Front. Plant Sci. 2022, 13, 869455. [Google Scholar] [CrossRef]
  21. Xin, D.; Qi, Z.; Jiang, H.; Hu, Z.; Zhu, R.; Hu, J.; Han, H.; Hu, G.; Liu, C.; Chen, Q.; et al. QTL Location and Epistatic Effect Analysis of 100-Seed Weight Using Wild Soybean (Glycine soja Sieb. & Zucc.) Chromosome Segment Substitution Lines. PLoS ONE 2016, 11, e0149380. [Google Scholar] [CrossRef]
  22. Qi, Z.; Guo, C.; Li, H.; Qiu, H.; Li, H.; Jong, C.; Yu, G.; Zhang, Y.; Hu, L.; Wu, X.; et al. Natural variation in Fatty Acid 9 is a determinant of fatty acid and protein content. Plant Biotechnol. J. 2023. Version of Record online. [Google Scholar] [CrossRef]
  23. Zhang, W.; Liao, X.; Cui, Y.; Ma, W.; Zhang, X.; Du, H.; Ma, Y.; Ning, L.; Wang, H.; Huang, F.; et al. A cation diffusion facilitator, GmCDF1, negatively regulates salt tolerance in soybean. PLoS Genet. 2019, 15, e1007798. [Google Scholar] [CrossRef]
  24. Törönen, P.; Medlar, A.; Holm, L. PANNZER2: A rapid functional annotation web server. Nucleic Acids Res. 2018, 46, W84–W88. [Google Scholar] [CrossRef]
  25. Yu, G.; Wang, L.G.; Han, Y.; He, Q.Y. clusterProfiler: An R package for comparing biological themes among gene clusters. Omics 2012, 16, 284–287. [Google Scholar] [CrossRef] [PubMed]
  26. Wang, J.; Wang, J.; Ma, C.; Zhou, Z.; Yang, D.; Zheng, J.; Wang, Q.; Li, H.; Zhou, H.; Sun, Z.; et al. QTL Mapping and Data Mining to Identify Genes Associated With the Sinorhizobium fredii HH103 T3SS Effector NopD in Soybean. Front. Plant Sci. 2020, 11, 453. [Google Scholar] [CrossRef] [PubMed]
  27. Bobby, R.; Bazzelle, R.; Clark, W.; Kantartzi, S.K.; Meksem, K.; Akond, M.; Kassem, M.A. Genetic Analysis of Yield Components in the PI 438489B by ‘Hamilton’ Recombinant Inbred Line (RIL) Population of Soybean [Glycine max (L.) Merr.]. J. Agric. Sci. 2012, 4, 98–105. [Google Scholar] [CrossRef]
  28. Zuo, J.; Liu, J.; Gao, F.; Yin, G.; Wang, Z.; Chen, F.; Li, X.; Xu, J.; Chen, T.; Li, L.; et al. Genome-Wide Linkage Mapping Reveals QTLs for Seed Vigor-Related Traits Under Artificial Aging in Common Wheat (Triticum aestivum). Front. Plant Sci. 2018, 9, 1101. [Google Scholar] [CrossRef] [PubMed]
  29. Zhuang, Y.; Li, X.; Hu, J.; Xu, R.; Zhang, D. Expanding the gene pool for soybean improvement with its wild relatives. aBIOTECH 2022, 3, 115–125. [Google Scholar] [CrossRef] [PubMed]
  30. Lin, X.; Fang, C.; Liu, B.; Kong, F. Natural variation and artificial selection of photoperiodic flowering genes and their applications in crop adaptation. aBIOTECH 2021, 2, 156–169. [Google Scholar] [CrossRef]
  31. Cai, X.; Jia, B.; Sun, M.; Sun, X. Insights into the regulation of wild soybean tolerance to salt-alkaline stress. Front. Plant Sci. 2022, 13, 1002302. [Google Scholar] [CrossRef]
  32. Du, H.; Fang, C.; Li, Y.; Kong, F.; Liu, B. Understandings and future challenges in soybean functional genomics and molecular breeding. J. Integr. Plant Biol. 2023, 65, 468–495. [Google Scholar] [CrossRef]
  33. Singh, G.; Gudi, S.; Amandeep Upadhyay, P.; Shekhawat, P.K.; Nayak, G.; Goyal, L.; Kumar, D.; Kumar, P.; Kamboj, A.; Thada, A.; et al. Unlocking the hidden variation from wild repository for accelerating genetic gain in legumes. Front. Plant Sci. 2022, 13, 1035878. [Google Scholar] [CrossRef]
  34. Lu, S.; Fang, C.; Abe, J.; Kong, F.; Liu, B. Current overview on the genetic basis of key genes involved in soybean domestication. aBIOTECH 2022, 3, 126–139. [Google Scholar] [CrossRef] [PubMed]
  35. Wani, S.H.; Anand, S.; Singh, B.; Bohra, A.; Joshi, R. WRKY transcription factors and plant defense responses: Latest discoveries and future prospects. Plant Cell Rep. 2021, 40, 1071–1085. [Google Scholar] [CrossRef] [PubMed]
  36. Javed, T.; Gao, S.J. WRKY transcription factors in plant defense. Trends Genet. 2023, 39, 787–801. [Google Scholar] [CrossRef] [PubMed]
  37. Sun, Y.; Yu, D. Activated expression of AtWRKY53 negatively regulates drought tolerance by mediating stomatal movement. Plant Cell Rep. 2015, 34, 1295–1306. [Google Scholar] [CrossRef] [PubMed]
  38. Xie, Y.; Huhn, K.; Brandt, R.; Potschin, M.; Bieker, S.; Straub, D.; Doll, J.; Drechsler, T.; Zentgraf, U.; Wenkel, S. REVOLUTA and WRKY53 connect early and late leaf development in Arabidopsis. Development 2014, 141, 4772–4783. [Google Scholar] [CrossRef] [PubMed]
  39. Zheng, Y.; Ge, J.; Bao, C.; Chang, W.; Liu, J.; Shao, J.; Liu, X.; Su, L.; Pan, L.; Zhou, D.X. Histone Deacetylase HDA9 and WRKY53 Transcription Factor Are Mutual Antagonists in Regulation of Plant Stress Response. Mol. Plant 2020, 13, 598–611. [Google Scholar] [CrossRef] [PubMed]
  40. Chen, X.; Lu, L.; Mayer, K.S.; Scalf, M.; Qian, S.; Lomax, A.; Smith, L.M.; Zhong, X. POWERDRESS interacts with HISTONE DEACETYLASE 9 to promote aging in Arabidopsis. eLife 2016, 5, e17214. [Google Scholar] [CrossRef] [PubMed]
  41. Yang, C.; Liu, C.; Li, S.; Zhang, Y.; Zhang, Y.; Wang, X.; Xiang, W. The Transcription Factors WRKY41 and WRKY53 Mediate Early Flowering Induced by the Novel Plant Growth Regulator Guvermectin in Arabidopsis thaliana. Int. J. Mol. Sci. 2023, 24, 8424. [Google Scholar] [CrossRef]
  42. Jiao, C.; Li, K.; Zuo, Y.; Gong, J.; Guo, Z.; Shen, Y. CALMODULIN1 and WRKY53 Function in Plant Defense by Negatively Regulating the Jasmonic Acid Biosynthesis Pathway in Arabidopsis. Int. J. Mol. Sci. 2022, 23, 7718. [Google Scholar] [CrossRef] [PubMed]
  43. Wang, C.; Zhang, M.; Zhou, J.; Gao, X.; Zhu, S.; Yuan, L.; Hou, X.; Liu, T.; Chen, G.; Tang, X. Transcriptome analysis and differential gene expression profiling of wucai (Brassica campestris L.) in response to cold stress. BMC Genom. 2022, 23, 137. [Google Scholar] [CrossRef] [PubMed]
  44. Freeborough, W.; Gentle, N.; Rey, M.E.C. WRKY Transcription Factors in Cassava Contribute to Regulation of Tolerance and Susceptibility to Cassava Mosaic Disease through Stress Responses. Viruses 2021, 13, 1820. [Google Scholar] [CrossRef] [PubMed]
  45. Zhang, H.; Huang, L.; Dai, Y.; Liu, S.; Hong, Y.; Tian, L.; Huang, L.; Cao, Z.; Li, D.; Song, F. Arabidopsis AtERF15 positively regulates immunity against Pseudomonas syringae pv. tomato DC3000 and Botrytis cinerea. Front. Plant Sci. 2015, 6, 686. [Google Scholar] [CrossRef]
  46. Tian, X.; He, M.; Mei, E.; Zhang, B.; Tang, J.; Xu, M.; Liu, J.; Li, X.; Wang, Z.; Tang, W. WRKY53 integrates classic brassinosteroid signaling and the mitogen-activated protein kinase pathway to regulate rice architecture and seed size. Plant Cell 2021, 33, 2753–2775. [Google Scholar] [CrossRef] [PubMed]
  47. Tang, J.; Tian, X.; Mei, E.; He, M.; Gao, J.; Yu, J.; Xu, M.; Liu, J.; Song, L.; Li, X.; et al. WRKY53 negatively regulates rice cold tolerance at the booting stage by fine-tuning anther gibberellin levels. Plant Cell 2022, 34, 4495–4515. [Google Scholar] [CrossRef]
  48. Gao, Y.; Xue, C.Y.; Liu, J.M.; He, Y.; Mei, Q.; Wei, S.; Xuan, Y.H. Sheath blight resistance in rice is negatively regulated by WRKY53 via SWEET2a activation. Biochem. Biophys. Res. Commun. 2021, 585, 117–123. [Google Scholar] [CrossRef]
  49. Yang, Y.; Zhou, Y.; Chi, Y.; Fan, B.; Chen, Z. Characterization of Soybean WRKY Gene Family and Identification of Soybean WRKY Genes that Promote Resistance to Soybean Cyst Nematode. Sci. Rep. 2017, 7, 17804. [Google Scholar] [CrossRef]
  50. Yu, Y.; Wang, N.; Hu, R.; Xiang, F. Genome-wide identification of soybean WRKY transcription factors in response to salt stress. Springerplus 2016, 5, 920. [Google Scholar] [CrossRef]
  51. Yang, Y.; Chi, Y.; Wang, Z.; Zhou, Y.; Fan, B.; Chen, Z. Functional analysis of structurally related soybean GmWRKY58 and GmWRKY76 in plant growth and development. J. Exp. Bot. 2016, 67, 4727–4742. [Google Scholar] [CrossRef] [PubMed]
  52. Wang, F.; Chen, H.W.; Li, Q.T.; Wei, W.; Li, W.; Zhang, W.K.; Ma, B.; Bi, Y.D.; Lai, Y.C.; Liu, X.L.; et al. GmWRKY27 interacts with GmMYB174 to reduce expression of GmNAC29 for stress tolerance in soybean plants. Plant J. 2015, 83, 224–236. [Google Scholar] [CrossRef] [PubMed]
  53. Baillo, E.H.; Kimotho, R.N.; Zhang, Z.; Xu, P. Transcription Factors Associated with Abiotic and Biotic Stress Tolerance and Their Potential for Crops Improvement. Genes 2019, 10, 771. [Google Scholar] [CrossRef] [PubMed]
Figure 1. Phenotypic analyses of seed vigor-associated traits in Suinong14 and ZYD00006. (A) Suinong14 and ZYD00006 seed vigor phenotypes after germination. (B) Suinong14 exhibited higher IR, GI, GP, and GR values than ZYD00006. Data are means ± SE of three replicate analyses; ** p < 0.01, Student’s t-test.
Agronomy 14 00332 g001
Figure 2. Fine mapping of segregants exhibiting divergent seed vigor phenotypes. Black and striped sections correspond to ZYD00006 chromosomal fragments, whereas black sections with black and striped areas respectively indicating homozygous and heterozygous areas. Wild soybean chromosomal segment distributions in these CSSLs were utilized to narrow seed vigor-associated gene candidates to a 293.7 kb region between the BARCSOYSSR_03_1647 and BARC-900569-00953 markers.
Agronomy 14 00332 g002
Figure 3. Comparisons of the transcriptomes of germinated Suinong14 and ZYD00006 seeds. (A,B) Volcano plots, (C) the Venn of genes differentially expressed between ZYD-12 h vs. ZYD-24 h and SN-12 h vs. SN-24 h, (D) heatmap of identified DEGs.
Agronomy 14 00332 g003
Figure 4. Sequencing-based seed vigor-related candidate gene identification. (A) SNPs distributed in the 44.88 Mb–45.18 Mb region of chromosome 03 in the Suinong14 and ZYD00006 varieties were analyzed using a sliding window approach with a window size of 1 kb. The number of SNPs and InDels within this window is indicated with the corresponding colors, ranging from 0 (grey) to 30 (red), with white indicating the absence of any SNPs and InDels. (B) A heat map for candidate genes containing SNPs or InDels. The color key (blue to red) represents gene expression (fragments per kilobase per million mapped reads, FPKM). (C) Relative Glyma.03G253900 and Glyma.03G256700 expression levels during Suinong14 and ZYD00006 seed germination were established by qPCR, employing the 2−ΔCt method to calculate relative expression. GmUNK1 (Gm12g020500) was selected as a normalization control. Data are means ± SE of three replicate analyses; ** p < 0.01, ns: non-significant, Student’s t-test.
Agronomy 14 00332 g004
Figure 5. Analyses of Glyma.03G256700 and its expression in different soybean accessions. (A) YFP-fused Glyma.03G256700 was assessed for subcellular localization. BF: brightfield; scale bar: 25 μm. (B) Maximum-likelihood phylogenetic analysis of the Glyma.03G256700 in Glycine max, Triticum aestivum, Oryza sativa, Zea mays, Lotus corniculatus, Arabidopsis thaliana, and Medicago truncatula as generated using MEGA7. (C) Glyma.03G256700 expression was analyzed at 12 h and 24 h post-germination in 10 CSSLs each exhibiting high and low levels of seed vigor. Data are means ± SE of three replicate analyses; ** p < 0.01, ns: non-significant, Student’s t-test. (DG) The seed vigor phenotypes after germination in five with enhanced seed vigor (CSSL-003, CSSL-012, CSSL-120, CSSL-159 and CSSL-168) and five with poorer seed vigor (CSSL-031, CSSL-054, CSSL-067, CSSL-106, and CSSL-167).
Agronomy 14 00332 g005
Figure 6. Haplotype analyses of Glyma.03G256700. (A) Seed vigor phenotypes were analyzed for 310 soybean varieties (229 improved cultivars, 71 landraces, and 10 wild varieties), different letters represent significant differences (p < 0.05), while the same letters indicate no significant differences, Student’s t-test. (B) Glyma.03G256700 haplotype analyses in these 310 soybean accessions. (C) Hap1 and Hap2 seed vigor phenotypes, data are means ± SE of three replicate analyses; ** p < 0.01, Student’s t-test.
Agronomy 14 00332 g006
Table 1. The IR, GI, GP and GR of CSSL populations.
TraitParentsCSSL Population (n = 207)
ZYD00006Suinong14MeanSD aKurtosis bSkewness c
IR1.30 **1.451.380.15−0.75−0.32
GI13.94 **25.7819.827.60−0.75−0.08
GP0.51 **0.940.760.24−0.83−0.19
GR0.73 **0.940.790.20−1.00−0.06
** indicates p ≤ 0.01, a indicates standard deviation, b was used to determine how steep or smooth the data distribution is, and c was used to determine the degree of asymmetry and direction of data distribution.
Table 2. Main QTLs related to seed vigor identified in the CSSL population.
TraitChrQTLPosition (Mb)LODR² (%)ADDPutative Causal Genes or QTLs Identified in Previous Studies
IRChr02qIR-021.33.625−0.28
Chr03qIR-0345.24.5420.70
Chr08qIR-0824.43.8930.90qSTIR-8 [23]
Chr12qIR-1215.23.225−0.48
Chr14qIR-1432.23.505−0.68
GIChr03qGI-0343.04.9510.24
Chr05qGI-0516.53.4210.27
Chr10qGI-1033.83.0671.29
Chr12qGI-1232.210.025−0.42
Chr15qGI-1515.93.414−0.47
GPChr03qGP-0345.54.4080.75
Chr06qGP-0614.93.9760.48qGP-6 [5]
Chr07qGP-0720.33.125−0.38
Chr13qGP-1339.43.523−0.58qDG003 [27]
GRChr03qGR-0344.73.4260.49
Chr06qGR-061.83.2920.31qGR-6 [5]
Chr09qGR-0916.33.915−0.59
Chr12qGR-1235.214.424−0.32
Chr16qGR-1636.43.401−0.42
Chr18qGR-1815.33.215−0.42
Note: QTL, quantitative trait loci; LOD, log-of-odds; R2, phenotypic variance explained; ADD, the additive effects contributed by the QTL; The LOD score cutoff for major QTLs was determined by permutation tests (1000 times; p < 0.05).
Disclaimer/Publisher’s Note: The statements, opinions and data contained in all publications are solely those of the individual author(s) and contributor(s) and not of MDPI and/or the editor(s). MDPI and/or the editor(s) disclaim responsibility for any injury to people or property resulting from any ideas, methods, instructions or products referred to in the content.

