Article

The Effects of Irrigation and Nitrogen Application on the Water and Nitrogen Utilization Characteristics of Drip-Irrigated Winter Wheat in the North China Plain

1
Institute of Farmland Irrigation, Chinese Academy of Agriculture Sciences, Xinxiang 453002, China
2
Key Laboratory of Water–Saving Engineering, Ministry of Agriculture and Rural Affairs, Xinxiang 453002, China
*
Author to whom correspondence should be addressed.
Agronomy 2024, 14(11), 2629; https://doi.org/10.3390/agronomy14112629
Submission received: 12 October 2024 / Revised: 4 November 2024 / Accepted: 6 November 2024 / Published: 7 November 2024
(This article belongs to the Section Water Use and Irrigation)

Abstract

:
Reducing irrigation and nitrogen fertilizer application while maintaining crop yields is crucial for sustainable agriculture in the North China Plain. To investigate the effects of irrigation and nitrogen application on above-ground nitrogen accumulation (ANA), yield, water consumption, and the water and nitrogen use efficiency of drip-irrigated winter wheat, a three-season field experiment was conducted with four levels of nitrogen fertilizer application (250, 167, 83, and 0 kg hm−2, referred to as N3, N2, N1, and N0, respectively) and three levels of irrigation (80, 60, and 40 mm per irrigation event, referred to as W3, W1, and W1, respectively). Additionally, a control treatment (CK) was set up with almost no irrigation (only 10 mm of fertilizer water for topdressing was applied) at the N3 application level. The results indicated that over the three seasons, the average yield of irrigation treatments was 35.3% higher than that of the CK treatment under the N3 condition. Both irrigation and nitrogen application improved wheat yield and ANA; however, when irrigation exceeded W2 or nitrogen application exceeded N2, their positive effects were negligible. Due to the seasonal depletion of soil nitrogen by low-nitrogen treatments (N1 and N0), along with their other negative effects on soil health, the yields and ANA of N1 and N0 treatments gradually declined over seasons. Increased irrigation promoted evapotranspiration (ET), and when nitrogen application did not exceed N2, higher nitrogen levels also enhanced ET and soil water consumption within ET. Moderately reducing irrigation can enhance water use efficiency (WUE); however, extreme water scarcity can also decrease WUE. Compared to higher irrigation and nitrogen application treatments, the W2N2 treatment showed no significant decrease in either yield or WUE, along with an increase in NPE. Moreover, the NPFP of the N2 treatment was higher than that of the N3 treatment. Consequently, the W2N2 treatment is recommend as the optimal irrigation and nitrogen management strategy under the experimental conditions.

1. Introduction

The wheat produced in the North China Plain (NCP) constitutes around 70% of China’s total wheat output, making it crucial for ensuring the country’s food security [1]. However, the NCP faces significant challenges due to excessive irrigation and nitrogen application, resulting in persistently low water–nitrogen use efficiency.
During the winter wheat season, the region experiences relative aridity and insufficient rainfall to meet the growth and development needs of the crop. Irrigation has become one of the primary strategies to ensure grain production in this region, leading to low water use efficiency and substantial wastage of resources. Extensive agricultural water use has caused the groundwater level in the North China Plain to decline at a rate of 0.5 to 1.0 m per year [2,3]. This decline has resulted in numerous severe environmental and ecological issues [3], highlighting the urgent need for the region to enhance the utilization rate of water resources to achieve sustainable management.
Enhancing nitrogen use efficiency is widely regarded as the most effective strategy to balance crop production with environmental protection [4]. However, influenced by traditional practices, farmers in the NCP have historically applied excessive nitrogen fertilizers to ensure stable and high yields. While increasing nitrogen application can enhance crop yields, it simultaneously reduces nitrogen fertilizer use efficiency, with about 29% of the nitrogen lost to the environment, becoming a pollutant [5]. This loss leads to various environmental issues, including groundwater contamination, air pollution, and soil acidification [6], which in turn pose significant risks to human health [7,8].
Crops absorb water and nitrogen through their root systems, which regulates their growth and development. Increasing irrigation within an appropriate range can enhance soil moisture conditions in agricultural fields, promoting crop growth and thereby enhancing crop yield and water–nitrogen use efficiency [9]. Insufficient soil moisture leads to inadequate water and nutrient uptake by the roots, hindering transpiration and adversely affecting crop growth and development, ultimately resulting in significant yield reductions [10,11,12]. However, when irrigation exceeds a certain threshold, it can lead to waterlogging, which deteriorates soil aeration and obstructs root respiration [13]. This disruption impairs crop growth and reduces yield, while also decreasing water–nitrogen use efficiency [14]. Excessive irrigation can also result in water leaching and nutrient loss, potentially causing nutrient deficiencies that further diminish crop yields and water–nitrogen use efficiency [15].
Nitrogen application significantly affects the growth, yield, and water–nitrogen use efficiency of winter wheat [16,17,18,19]. Appropriate nitrogen application can promote tillering and stem–leaf growth in winter wheat [17,20], increase chlorophyll content [21], and enhance photosynthetic efficiency [22]. This process helps increase the number of ears and grains per unit area, ultimately boosting yield [23]. Adequate nitrogen application also facilitates nitrogen absorption and transport, which in turn affects wheat’s water–nitrogen use efficiency [19]. However, the relationship between nitrogen application, yield, and nitrogen use efficiency is not linear. Excessive nitrogen can make wheat prone to lodging [24] and inhibit its antioxidant capacity and grain filling, adversely affecting yield and potentially reducing crop quality [25,26]. Moreover, excessive nitrogen can lead to soil acidification, which negatively impacts soil health and crop growth. It also increases nitrogen leaching and ammonia volatilization, resulting in higher nitrous oxide emissions, thereby reducing nitrogen fertilizer use efficiency and causing environmental pollution [27]. Additionally, there is an interaction between irrigation and nitrogen application; irrigation influences wheat’s nitrogen absorption, transport, and assimilation by altering soil moisture conditions [28], which in turn affects nitrogen fertilizer use efficiency. Appropriately increasing nitrogen application can partially mitigate the negative effects of soil moisture deficit on crop growth and yield [29,30].
Therefore, based on the goal of stabilizing and increasing crop yields, it is crucial to improve water–nitrogen use efficiency in the NCP by controlling irrigation and nitrogen application levels. Although there are many papers have examined the effects of irrigation and nitrogen application on water and nitrogen utilization characteristics of wheat, there is still limited research on the lasting effects of three consecutive years of fixed-position irrigation and nitrogen application on the water–nitrogen utilization characteristics of wheat under drip irrigation conditions. Through three seasons of field experiments on drip-irrigated winter wheat, this study investigated the effects of varying irrigation and nitrogen application rates on drip-irrigated winter wheat yield, ANA, ET, and water–nitrogen use efficiency. The primary objective is to provide an optimal combination of irrigation and nitrogen application strategies for drip-irrigated winter wheat cultivation in the North China Plain.

2. Materials and Methods

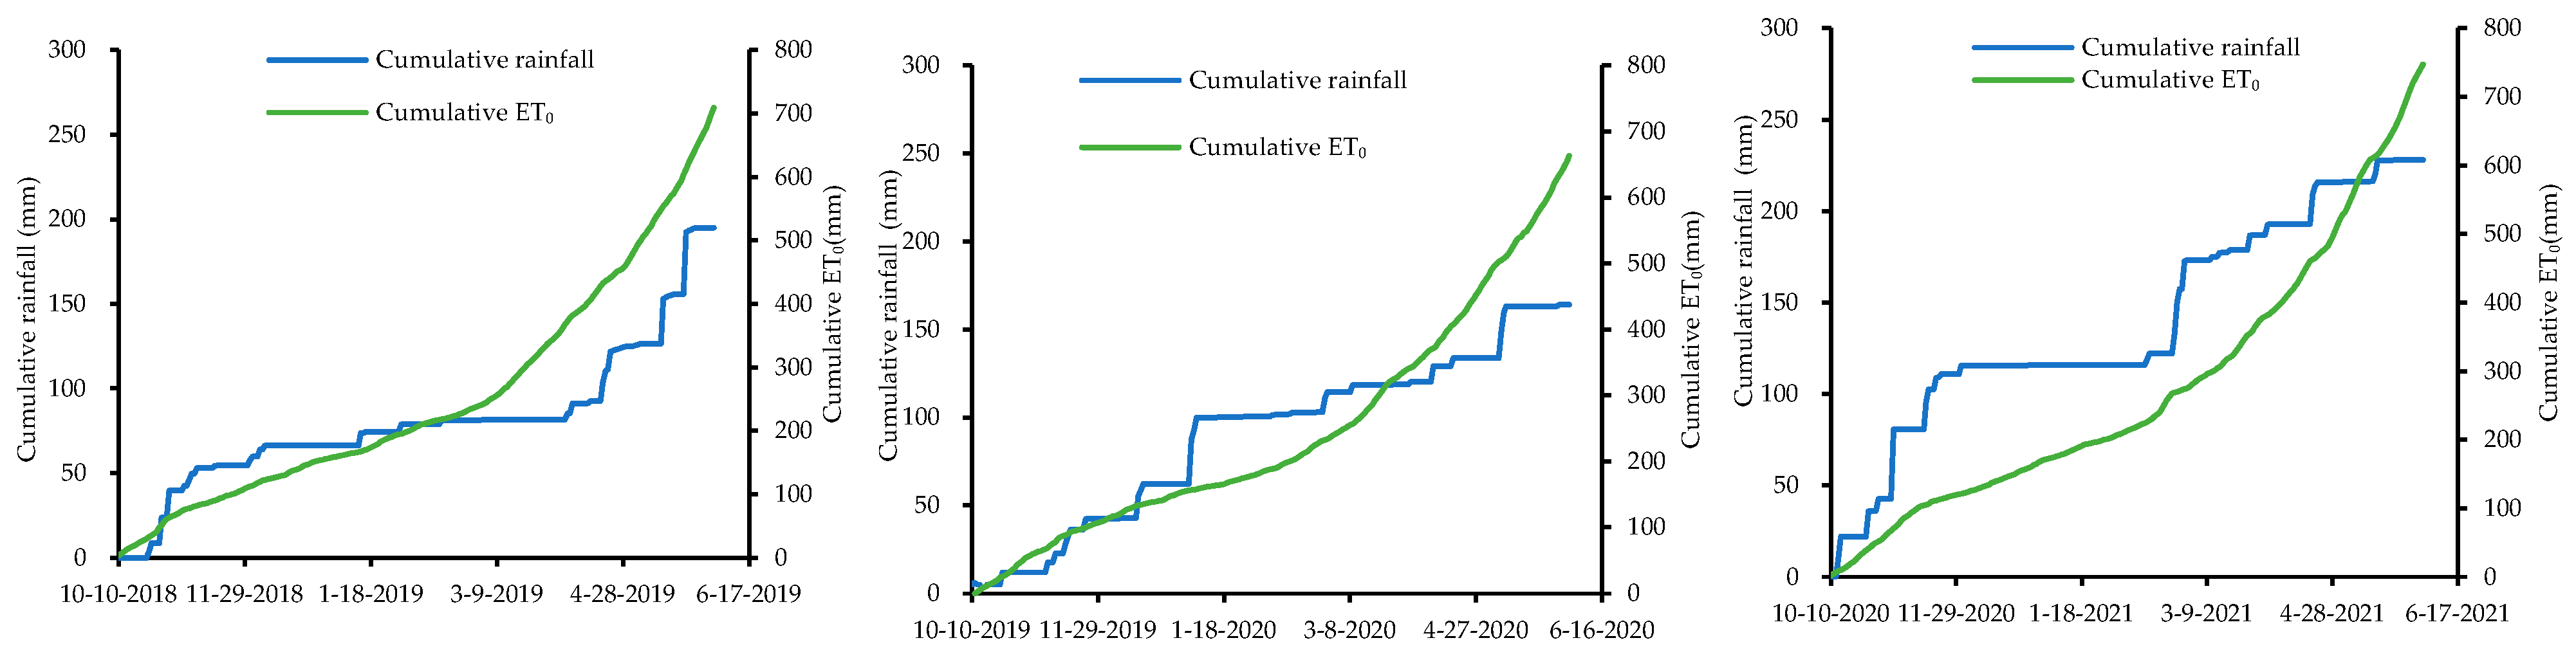
2.1. Experimental Site

A winter wheat field experiment was conducted during the 2018–2019, 2019–2020, and 2020–2021 wheat seasons at the Xinxiang Comprehensive Experimental Station of the Chinese Academy of Agricultural Sciences (CAAS), located in Qiliying Town, Xinxiang, China. The site is situated in the west-central region of the North China Plain (35.18° N, 113.54° E, 81 m above sea level) and features a biannual cropping system, primarily involving winter wheat and summer maize. The experimental site has an average annual rainfall of 581 mm, with 70% to 80% occurring from July to September. The multi-year average temperature is 14.2 °C, with an average evapotranspiration of 2000 mm (measured using a 20 cm diameter evaporating dish), a frost-free period of 210 days, and 2399 h of sunshine, providing abundant thermal and light resources.
The soil at the experimental site is classified as sandy loam, with an average bulk density of 1.50 g cm−3 for the 0–140 cm layer (Table 1). The field’s water-holding capacity is 30.6%, and the year-round depth of groundwater exceeds 6 m. A weather station was installed at the experimental site to record air temperature, relative humidity, wind speed, solar radiation, and rainfall every hour at a height of 2 m. The cumulative rainfall and reference crop evapotranspiration (ET0) during the experiment are shown in Figure 1, with ET0 calculated using the Penman–Monteith equation.

2.2. Experimental Design

The experimental setup was designed as a complete combination of three irrigation levels and four nitrogen application levels. The three irrigation levels—80 mm, 60 mm, and 40 mm per event—denoted as W3, W2, and W1, respectively, were applied at the following three key growth stages: reviving–jointing, jointing–anthesis, and filling–maturity; the dates of each growth stage of wheat during the experiment are presented in Table 2. The four nitrogen application levels were 250, 167, 83, and 0 kg hm−2 (pure nitrogen application in a single season), denoted as N3, N2, N1, and N0, respectively. Half of the nitrogen fertilizer was applied to the field by machine before sowing, while the other half was applied through drip irrigation after the onset of greening. Additionally, a control treatment (CK) with almost no irrigation (only 10 mm of fertilizer water for topdressing was applied) at the N3 application level was set up. During the 2020–2021 wheat reviving–jointing stage, cumulative rainfall reached 54 mm, closely matching the irrigation quota for the W2 irrigation level treatment. As a result, irrigation during the reviving–jointing stage was canceled. To ensure the uniform emergence of winter wheat seedlings throughout the experiment, all treatments received 60 mm of irrigation water after sowing. The irrigation dates after wheat emergence are listed in Table 3.
Three experimental plots were established for each treatment, with each plot measuring 7.6 m × 8 m. The position of each treatment plot was fixed throughout the experiment. Drip irrigation was used, with a drip tape spacing of 0.6 m, a dripper flow rate of 3 L h−1, and a dripper spacing of 0.2. The winter wheat variety was “Lunxuan 69” (Zhongnong Dwarfing-sterile wheat Breeding Technology Innovation Center, Xinxiang, China), and urea with a nitrogen concentration of 46.7% served as the nitrogen fertilizer. Additionally, 245 kg hm−2 of superphosphate and 165 kg hm−2 of potassium sulfate were applied prior to sowing.

2.3. Sampling and Measurements

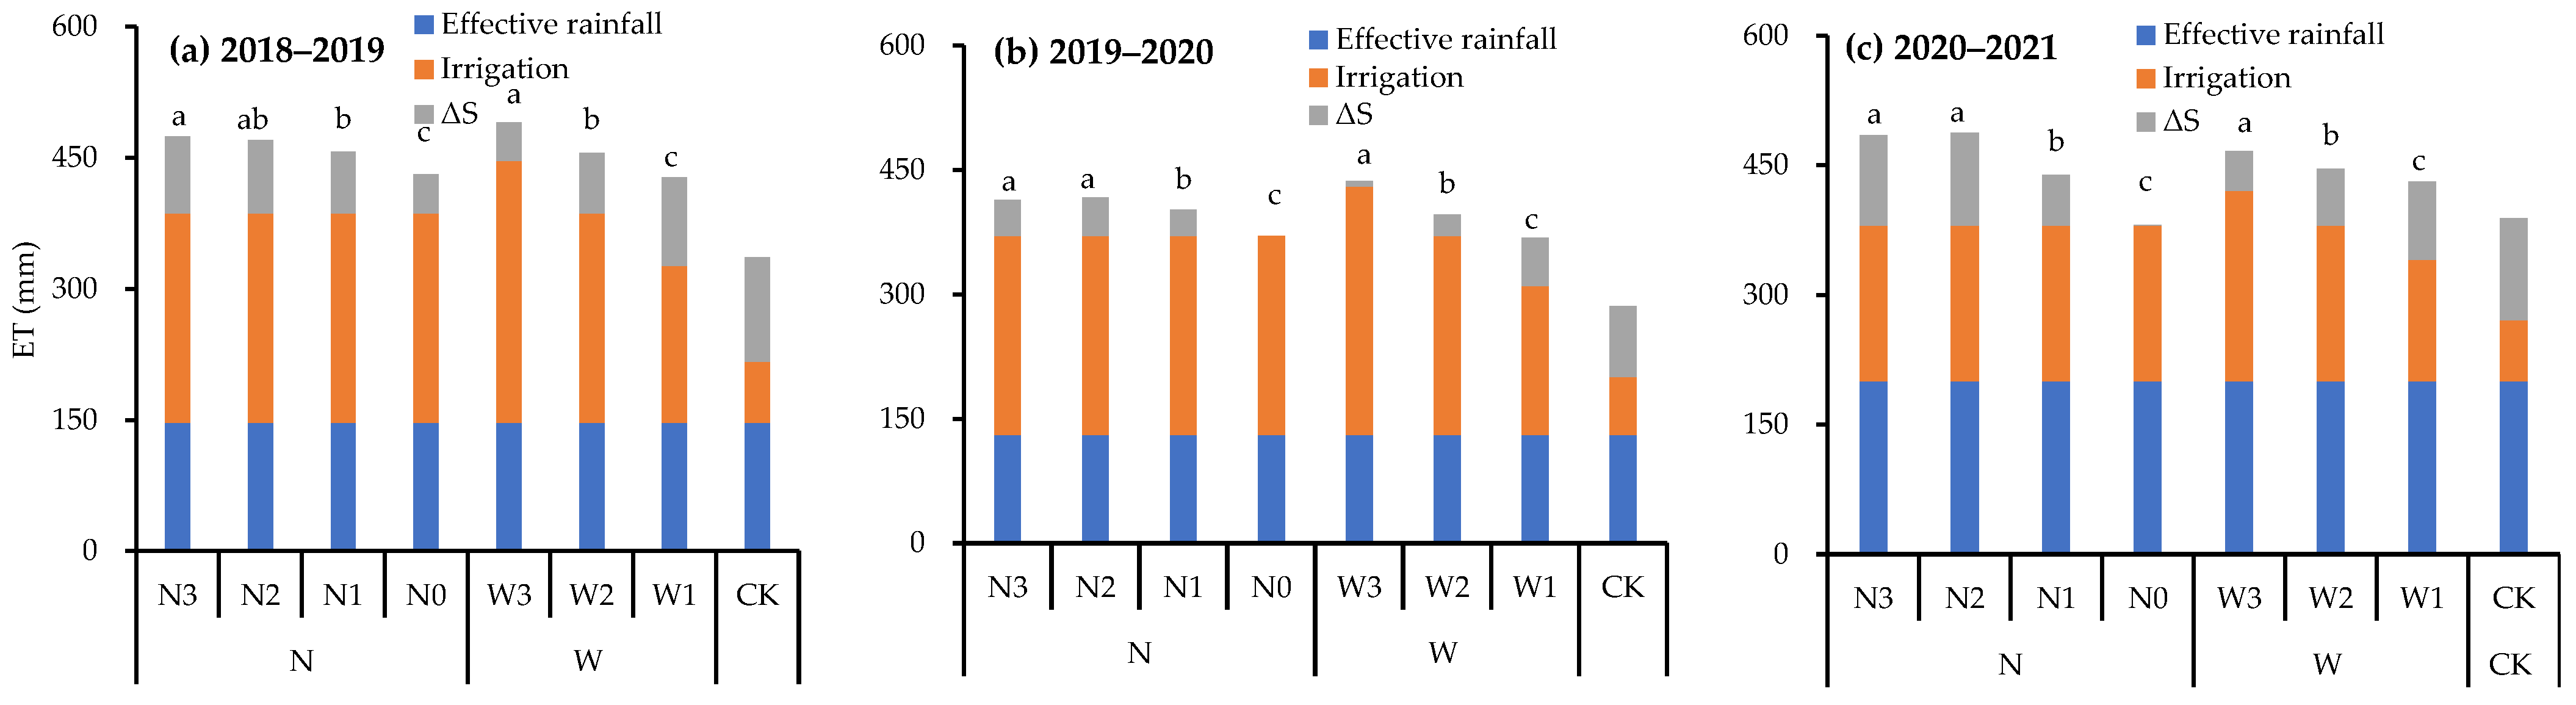
2.3.1. Soil Water Content and Evapotranspiration

Before sowing and after harvesting winter wheat, soil samples were collected using a soil drill to a depth of 140 cm, with sampling intervals of 20 cm. After sampling, soil water content was determined using the gravity method. Two points were selected from each plot for soil sampling: one directly below the drip tape and the other in the middle of the two drip tapes. Crop evapotranspiration (ET), or crop water consumption, was calculated using the following formula:
ET = R + W D + Δ S
where R is effective rainfall (mm), W is the amount of irrigation water (mm), D is the water drainage from the 0–140 cm soil layer (mm), and ΔS is soil water consumption (mm). A positive ΔS indicates a decrease in soil water content, while a negative ΔS indicates an increase. In this experiment, the maximum irrigation amount was 80 mm, representing only 26% of the field water-holding capacity of the 0–140 cm soil layer. Based on the soil water content observed during the experimental period, there was negligible drainage (D) following irrigation and rainfall.

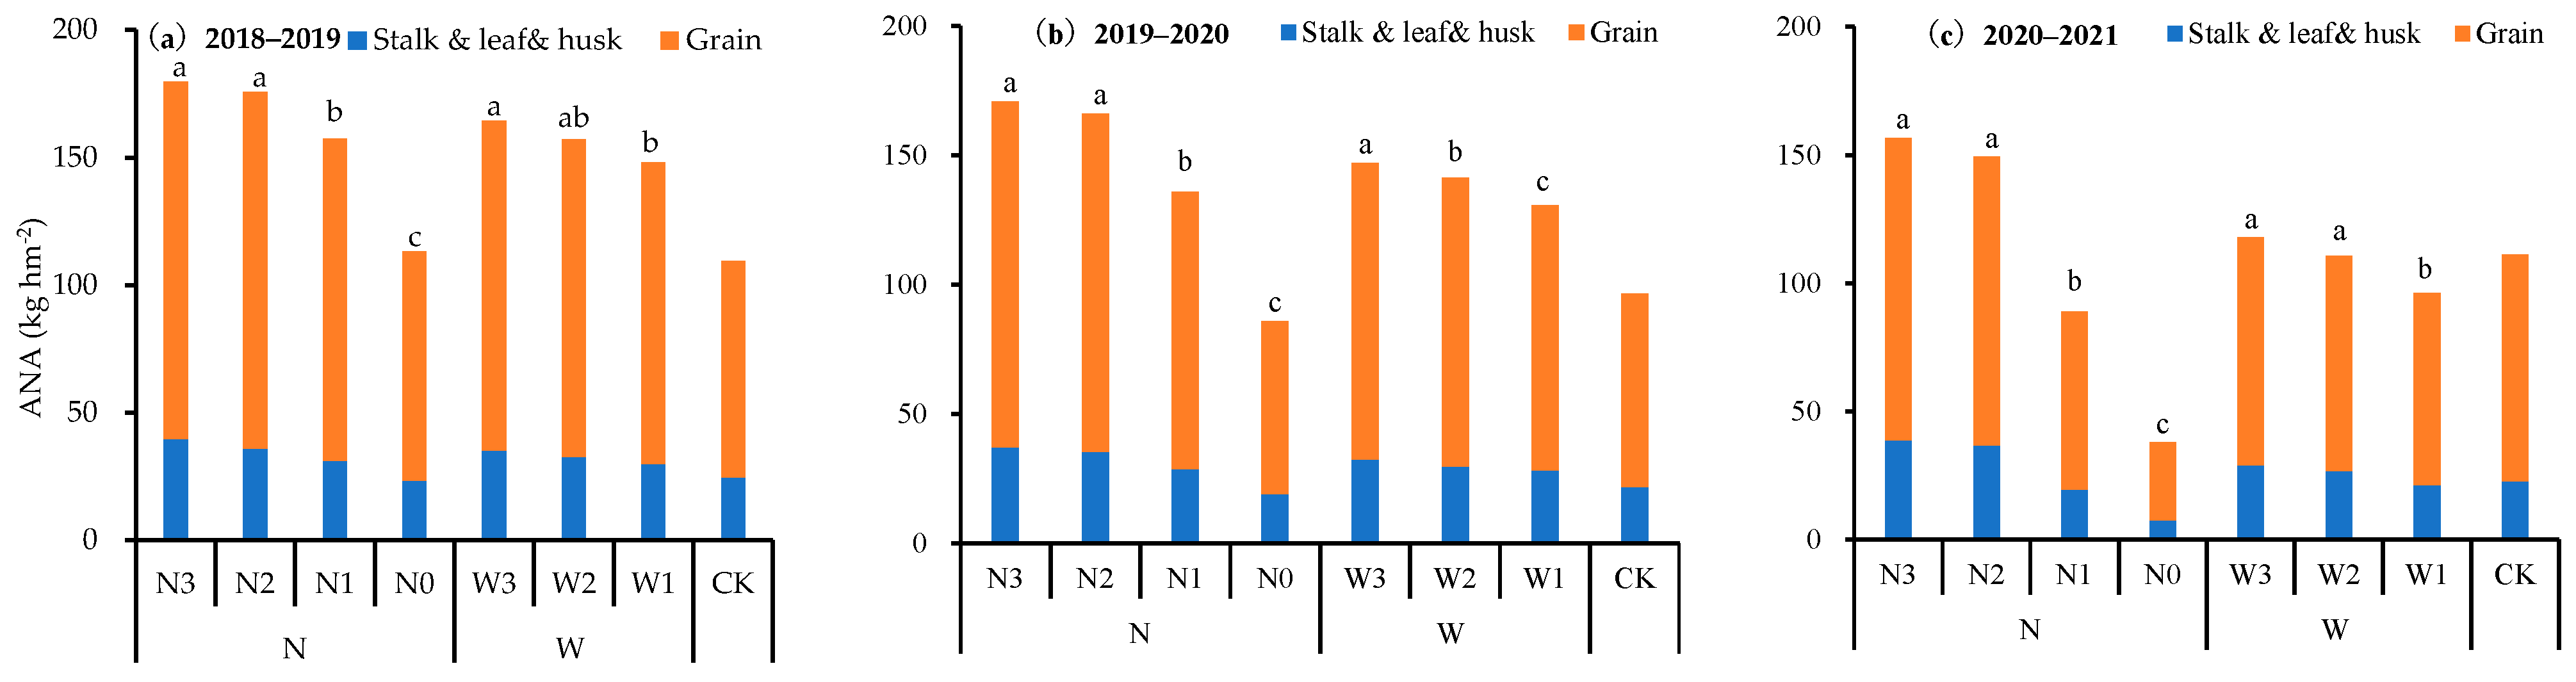
2.3.2. Above-Ground Nitrogen Accumulation

After winter wheat reached maturity, 10 wheat plant samples were collected from each plot. The samples included stems, leaves, husks, and grains, which were then dried, weighed, crushed, and sieved. The samples were then digested using H2SO4–H2O2, and nitrogen concentration was measured with an AA3 Continuous Flow Analyzer (Seal Analytical Inc. AA3–HR, Mequon, WI, USA). Above-ground nitrogen accumulation (ANA) was calculated based on above-ground biomass.

2.3.3. Grain Yield and Its Characteristics

After winter wheat reached maturity, an area of 2 m2 of undisturbed wheat was taken from the inner part of the plot to measure yield, and the number of plants was recorded. The grains were weighed after natural air drying and converted to yield per hectare at 13% moisture content. Additionally, 10 plants were selected from the inner part of the plot to measure indicators such as the number of grains per spike and the 1000-grain weight.

2.3.4. Water and Nitrogen Use Efficiency

Water use efficiency (WUE, kg m−3), nitrogen partial factor productivity (NPFP, kg kg−1) and nitrogen physiological efficiency (NPE, kg kg−1) were calculated using the following formulas:
WUE = GY 10 × ET
NPFP = GY N
NPE = GY ANA
where GY is the grain yield, kg hm−2; ET is the crop evapotranspiration, mm; ANA is the above-ground nitrogen accumulation, kg hm−2; N is the nitrogen application rate, kg hm−2

2.3.5. Statistical Analysis

Analysis of variance (ANOVA) was performed in SPSS 24.0 to assess the effects of irrigation and nitrogen application on grain yield, above-ground nitrogen accumulation (ANA), evapotranspiration (ET), water use efficiency (WUE), nitrogen physiological efficiency (NPE), and nitrogen partial factor productivity (NPFP). Differences were evaluated using the least significant difference (LSD) method at the p < 0.05 level. Pearson’s correlation coefficients were calculated to analyze the relationships between grain yield and its characteristics.

3. Results

3.1. Grain Yield and Its Characteristics

3.1.1. Grain Yield

Both irrigation and nitrogen application had a highly significant effect on grain yield in all three seasons, while the interaction between irrigation and nitrogen application did not significantly affect grain yield in any of the seasons (Table 4 and Table A1). The grain yield of wheat ranged from 6214 to 9984, 5249 to 10,016, and 3164 to 9841 kg hm−2 across treatments in the 2018–2019, 2019–2020, and 2020–2021 seasons, respectively, demonstrating a seasonal decline in the minimum achieved grain yield. In all three seasons, increasing the irrigation amount promoted grain yield; however, the average yield growth rate was only 2.1% when the irrigation amount increased from the W2 to the W3 treatment. For nitrogen application treatments, the grain yield followed the order of N2 > N1 > N0, although there was no significant difference in grain yield between the N3 and N2 treatments. The difference in grain yield due to varying nitrogen application levels increased over seasons. Under the N3 nitrogen application condition, the average grain yield for the W3, W2, and W1 treatments was 39.9%, 37.1%, and 28.8% higher, respectively, compared to the CK treatment.

3.1.2. Yield Characteristics

Both irrigation and nitrogen application significantly affected spike number, grains per spike, and 1000-grain weight in all three seasons, except for nitrogen application, which did not have a significant effect on 1000-grain weight. Additionally, the interaction between irrigation and nitrogen application showed no significant effect on any yield characteristics in all three seasons. The trends observed in spike number, grains per spike, and the grain yield of winter wheat were similar with respect to irrigation and nitrogen application. While nitrogen application had no significant effect on 1000-grain weight, increasing the irrigation amount significantly enhanced the 1000-grain weight.

3.1.3. Relationship Between Yield and Its Characteristics

Pearson correlation analysis (Table 5) was conducted on the spike number, grains per spike, 1000-grain weight, and grain yield data for each treatment across three seasons. A significant correlation was observed between spike number and grain yield, as well as between grains per spike and grain yield. The Pearson correlation coefficient between spike number and yield was 0.976, while the coefficient between grains per spike and yield was 0.891. However, 1000-grain weight did not show a significant correlation with yield, with a Pearson correlation coefficient of only 0.117.

3.2. Above-Ground Nitrogen Accumulation

Both irrigation and nitrogen application had a significant effect on above-ground nitrogen accumulation (ANA) across all three seasons. However, the interaction between irrigation and nitrogen application only had a significant effect on ANA during the 2020–2021 season (Table 6). The ANA ranged from 107.03 to 190.26 kg hm−2, 77.03 to 180.02 kg hm−2, and 33.71 to 169.73 kg hm−2 across treatments in the 2018–2019, 2019–2020, and 2020–2021 seasons, respectively (Figure 2; Table A2).
For the ANA in the 2020–2021 season, the variation patterns of ANA across the three irrigation levels were consistent (Table A2). There were no significant differences in ANA between the N3 and N2 treatments. For the N2, N1, and N0 treatments, ANA followed the pattern: N2 > N1 > N0. In the 2020–2021 season, ANA for the N3 treatment was higher than for the N0 treatment by 278.2%, 362.1%, and 310.9% under W3, W2, and W1 conditions, respectively. The greatest ANA differences were observed under W2 conditions, while the smallest differences were seen under W3 conditions.
For the mean values of ANA for the various irrigation and nitrogen treatments (Table 6), generally, increasing irrigation and nitrogen application promoted ANA in wheat plants; however, the differences between the N3 and N2 treatments were small and not statistically significant. The average ANA for the N3 treatment was 58.43%, 98.71%, and 313.81% higher than that of the N0 treatment in the 2018–2019, 2019–2020, and 2020–2021 seasons, respectively. This indicates that the differences between nitrogen application treatments increased from season to season.
Under the N3 nitrogen application condition, the average ANA for the W3, W2, and W1 treatments was 73.68%, 68.52%, and 49.71% higher than that of the CK treatment. Grain nitrogen accumulation in all treatments accounted for approximately 78% of the total ANA.

3.3. Evapotranspiration

Both irrigation and nitrogen application had a highly significant effect on evapotranspiration (ET) in all three seasons; however, the interaction between irrigation and nitrogen application did not have a significant effect on ET in any of the three seasons (Table 7). In all three seasons, when the nitrogen application rate did not exceed N2 treatment, ET increased with the nitrogen application rate, with no significant difference observed between the N3 and N2 treatments (Figure 3; Table A3). ET also increased with the amount of irrigation applied. The average ET for the N3 treatment was 10.0%, 11.9%, and 27.2% higher than that of the N0 treatment in the 2018–2019, 2019–2020, and 2020–2021 seasons, respectively, indicating that the effect of nitrogen application treatments on ET progressively increased over seasons. Under N3 conditions, the average ET for the W3, W2, and W1 treatments was 44.2%, 36.0%, and 27.3% higher than that of the CK treatment across the three experimental seasons, respectively. Regarding soil water consumption, when nitrogen application did not exceed N2 treatment, increased nitrogen application also led to higher soil water consumption within ET. Conversely, an increase in irrigation amount resulted in decreased soil water consumption.

3.4. WUE, NPFP and NPE

For WUE, irrigation significantly affected WUE only in the 2018–2019 season, while nitrogen application significantly affected WUE in all three seasons; the interaction between irrigation and nitrogen application significantly affected WUE only in the 2018–2019 season. (Table 8 and Table A4). For the WUE in the 2018–2019 season, there was no significant difference between the N3 and N2 treatments across all three irrigation levels. In contrast, the treatments exhibited the following trend: N2 > N1 > N0. Under the W3, W2, and W1 conditions, N3 was 36.5%, 31.3%, and 37.0% higher than N0, respectively (Table A4).
For the average WUE for the various irrigation and nitrogen treatments (Table 8), in the 2018–2019 and 2019–2020 seasons, increasing irrigation reduced WUE. In the 2020–2021 season, WUE was greatest at the W2 treatment, but irrigation did not significantly affect WUE. For nitrogen treatments, except for the N3 and N2 treatments, which showed no significant difference in WUE, increasing the nitrogen application promoted WUE, and the difference in WUE caused by nitrogen treatments increased as the growing season progressed. Under N3 conditions, the WUE of CK treatment was lower than other irrigation treatments.
For NPFP and NPE, both irrigation and nitrogen application significantly affected NPFP and NPE in all three seasons; the interaction between irrigation and nitrogen application did not have a significant effect on NPFP and NPE across the three seasons. (Table 8 and Table A4). Increasing nitrogen application decreased NPFP and NPE, and increasing irrigation increased NPFP but decreased NPE in all three seasons.

4. Discussion

4.1. Grain Yield and Above-Ground Nitrogen Accumulation

Increasing irrigation and nitrogen application within a certain range can increase crop nitrogen accumulation and yield, whereas exceeding certain thresholds of these inputs fails to significantly increase plant nitrogen accumulation and crop yield further [31,32,33,34,35]. The optimal nitrogen application rate for winter wheat in the NCP varies under different research conditions due to the influence of multiple factors [17,36,37,38,39]. Under the conditions of this experiment, increasing irrigation and nitrogen application across the three seasons generally promoted ANA and yield. However, when irrigation exceeded W2 and nitrogen application exceeded N2, further increase in irrigation and nitrogen application had relatively small promotional effects on ANA and yield. Specifically, the average yield under the N3 treatment across the three seasons was only 1.2% higher than that under the N2 treatment, while the average yield under W3 treatment was only 2.2% higher than that under W2 treatment.
Our study also revealed that ANA in the low-nitrogen treatments (N1 and N0) significantly declined from season to season. This decline can be attributed to two main factors: (1) Insufficient nitrogen application in these low-nitrogen treatments led to a gradual depletion of soil nitrogen due to crop uptake, resulting in a seasonal decrease in soil nitrogen content; and (2) nitrogen deficiency caused a range of adverse physical, chemical, and biological effects on farmland soil [40,41,42,43], which in turn limited wheat growth and reduced yield. Wang et al. [40] conducted a 23-year field experiment and found that, compared to nitrogen application, no nitrogen fertilization not only decreases soil nitrogen resources but also indirectly degrades soil structure by reducing the formation of large macroaggregates, lowering soil organic carbon (SOC) turnover, and shifting the localization of microorganisms away from the macroaggregates. Chen et al. [41] conducted a two-year experiment on wheat–maize rotation and observed that within a certain range, reducing nitrogen fertilizer application led to decreases in soil dehydrogenase and urease activities, basal respiration, and nitrification potential, accompanied by a slight increase in soil pH. Murugan et al. [42] found that the low-nitrogen treatment significantly reduced the concentration of large macroaggregates in the subsurface soil of the maize crop. Additionally, it decreased dehydrogenase activity in both the surface and subsurface soils, as well as urease activity in the surface soil. Wang et al. [43] found that diminishing nitrogen fertilizer input reduced the activity of soil autotrophic bacterial communities, resulting in a decline in soil organic carbon.

4.2. Yield Characteristics

The grain yield of winter wheat is determined by the product of spike number, grains per spike, and 1000-grain weight. This study demonstrated that both spike number and grains per spike exhibited highly significant positive correlations with grain yield, whereas 1000-grain weight did not show a significant correlation, which indicated that the interaction of irrigation and nitrogen application mainly increased the grain yield of winter wheat by regulating the spike number and the grains per spike.
From the perspective of nitrogen application alone, across three seasons, as nitrogen application rates increased from N0 to N3, spike number, grains per spike, and 1000-grain weight increased by 52.3%, 20.8%, and −1.6%, respectively. This suggests that nitrogen fertilizer application increases yield primarily by enhancing spike number and grains per spike, with spike number contributing more significantly to yield increase than grains per spike.
Regarding irrigation, when the irrigation amount was increased from W1 to W3 treatment, spike number, grains per spike, and 1000-grain weight increased by 2.4%, 3.7%, and 11.3%, respectively. The contributions of these factors to yield increase were ranked as follows: 1000-grain weight > grains per spike > spike number. Overall, under the experimental conditions of this study, nitrogen application had a greater effect on yield than irrigation.

4.3. Evapotranspiration

Moderate increases in nitrogen application and irrigation increase ET [17,44,45], and increases in irrigation increase soil water content, which in turn leads to an increase in soil evapotranspiration; moderate irrigation also increases crop LAI and improves leaf stomatal conductance, which in turn increases crop transpiration. Changing nitrogen application can change the crop canopy structure, which in turn changes the root water absorption status, thus affecting the crop ET.
The average ET for the maximum nitrogen application treatment (N3) and the maximum irrigation treatment (W3) over the three seasons were 457.6 mm and 464.8 mm, respectively. Xu et al. [46] and Zhang et al. [47] reported that the ET of winter wheat under traditional irrigation conditions in the NCP is approximately 450 mm, which is close to the average ET observed for the N3 and W3 treatments in our study.
This study found that the ET of winter wheat in the 2019–2020 season was lower than that observed in the other two seasons. Through analysis, it was found that the ET0 of winter wheat in the 2018–2019, 2019–2020, and 2020–2021 seasons was 708.7, 663.2, and 747.2 mm, respectively, indicating that the ET0 in the 2019–2020 season was lower than the other two seasons, which suggested that the lower ET in the 2019–2020 season compared to the other two seasons is likely due to meteorological factors.

4.4. WUE, NPFP, NPE

Appropriate irrigation and nitrogen management practices can enhance water availability in the root zone, and increase water use efficiency (WUE) [48]. This study demonstrated that moderately reducing irrigation for winter wheat can enhance WUE. Additionally, we found that under the N3 nitrogen application condition, the WUE of the CK treatment was lower than that of the other irrigation treatments, indicating that extreme water scarcity can also reduce WUE.
Regarding the effect of nitrogen application on WUE, across three seasons, an increase in nitrogen application up to the N2 treatment significantly promoted WUE, primarily attributed to the additional nitrogen fertilizer that facilitated crop growth and yield, ultimately enhancing WUE.
Increasing nitrogen use efficiency is generally regarded as the most effective strategy for balancing crop production and environmental protection [4]. Typically, increasing irrigation enhances (NPFP) [49] and decreases NPE, while increasing nitrogen application decreases both NPFP and NPE [19,49,50,51], which concurs with our findings. Although decreasing nitrogen application increased NPFP and NPE, it significantly reduced wheat yield and WUE. Consequently, balancing yield and WUE considerations, the W2N2 treatment is recommended as an optimal irrigation and nitrogen application strategy in the NCP.

5. Conclusions

Both irrigation and nitrogen application positively influenced wheat yield and above-ground nitrogen accumulation; however, their benefits became negligible when the irrigation quota exceeded 60 mm per irrigation or when the seasonal nitrogen application surpassed 167 kg hm−2. Low-nitrogen treatments could lead to seasonal soil nitrogen depletion, negatively affecting soil health and ultimately resulting in sustained yield reductions. While moderate reductions in irrigation can improve water use efficiency, extreme water scarcity can also decrease water use efficiency. Notably, the combination of a nitrogen rate of 167 kg hm−2 and an irrigation quota of 40 mm per irrigation maintained yield and WUE comparable to those of higher irrigation and nitrogen levels, while also demonstrating better nitrogen partial factor productivity than a nitrogen rate of 250 kg hm−2. Therefore, this combination is recommended as the optimal strategy for irrigation and nitrogen management under these conditions. The conclusions of this study provide valuable scientific guidance for irrigation and nitrogen management in drip-irrigated winter wheat in the North China Plain.

Author Contributions

Conceptualization, J.Q. and M.L.; methodology, J.Q.; Investigation, X.F., X.W. and M.J.; data curation, X.F., X.W. and M.J.; formal analysis, X.F., X.W. and M.J.; writing—original draft preparation, J.Q.; writing—review and editing, M.L.; resources, J.Q.; project administration, J.Q. All authors have read and agreed to the published version of the manuscript.

Funding

This study was funded by key R&D and promotion projects in Henan Province, China: Science and Technology Research Projects (NO. 232102320279) and (NO. 222102110022).

Data Availability Statement

The original contributions presented in the study are included in the article, further inquiries can be directed to the corresponding author.

Conflicts of Interest

The authors declare no conflicts of interest.

Appendix A

Table A1. Grain yield and yield characteristics of winter wheat for each treatment.
Wheat SeasonsIrrigation
Treatments
Nitrogen
Treatments
Spike Number
(104 hm−2)
Grains per Spike1000-Grain Weight (g)Grain Yield
(kg hm−2)
2018–2019W3N3567 a32.0 abcd55.0 abc9984 a
N2553 a32.3 abc57.9 a9834 a
N1545 ab32.0 abcd55.6 abc9051 bc
N0420 c30.8 bcd57.6 a6803 d
W2N3556 a33.4 a55.3 abc9792 a
N2548 ab31.8 abcd56.8 ab9745 a
N1529 b32.5 abc55.0 abc8756 c
N0419 c29.9 d56.4 ab6514 de
W1N3548 ab31.7 abcd52.0 cd9223 b
N2533 b31.4 bcd53.3 bcd9124 b
N1533 b30.4 cd53.8 bcd9015 bc
N0404 c29.1 cd53.2 bcd6214 e
CK449 c29.7 d50.1 d6613 de
2019–2020W3N3579 ab31.7 a53.8 a10,016 a
N2585 a31.9 a52.8 ab9708 a
N1543 c30.9 ab53.6 a8469 c
N0411 de29.4 ab56.2 a6173 d
W2N3584 a31.2 a51.7 ab9818 a
N2565 ab31.5 a52.7 ab9565 ab
N1550 bc29.2 ab50.1 bc8114 c
N0406 de27.4 b52.3 ab6192 d
W1N3575 ab31.2 a48.0 c9110 b
N2581 a30.9 ab46.9 c9214 b
N1539 c28.8 ab46.7 c8148 c
N0388 e27.6 b47.5 c5429 e
CK430 d29.6 ab41.1 d6584 d
2020–2021W3N3532 a32.4 a57.3 a9441 a
N2526 a32.3 ab55.8 a9327 a
N1401 c30.0 bc55.4 a6435 d
N0279 d26.0 de55.0 a3462 f
W2N3528 a32.7 ab54.3 ab9240 ab
N2536 a30.7 abc55.2 a9196 ab
N1407 c27.2 cde55.7 a6339 d
N0270 d24.0 ef56.9 a3264 f
W1N3515 a33.4 a49.5 bc8781 b
N2515 a32.6 ab49.7 bc8657 b
N1392 c28.6 cd48.4 c5859 e
N0277 d22.8 f49.2 bc3164 f
CK521 a32.3 ab45.9 d7848 c
Note: Different lowercase letters in same column within the same wheat season indicate significant differences among different treatments at p < 0.05 level.
Table A2. Above-ground nitrogen accumulation (ANA) of winter wheat plant at harvest for each treatment (kg hm−2).
Wheat
Seasons
Irrigation
Treatments
Nitrogen
Treatments
Stem and Leaf and HuskGrainANA
2018–2019W3N343.11 a147.15 a190.26 a
N239.31 ab144.25 a183.55 a
N132.88 bc129.92 b162.80 b
N024.95 d96.12 d121.07 d
W2N339.78 ab144.84 a184.62 a
N235.55 abc146.05 a181.59 a
N131.86 bcd118.52 c150.38 c
N023.53 d88.51 de112.04 de
W1N335.97 abc128.03 bc164.00 b
N233.09 bc128.95 bc162.05 b
N129.11 cd130.40 b159.51 bc
N021.41 d85.63 e107.03 e
CK 24.54 d85.01 e109.55 e
2019–2020W3N339.59 a140.44 a180.02 a
N237.62 ab134.66 a172.27 ab
N131.40 bc112.24 cd143.64 de
N021.14 de71.21 f92.35 g
W2N338.63 a136.20 a174.83 ab
N233.57 b132.65 ab166.21 bc
N127.81 cd108.11 de135.92 ef
N018.19 e70.37 f88.56 g
W1N333.24 b124.47 bc157.71 cd
N234.69 ab125.53 bc160.22 c
N127.04 cd100.74 e127.78 f
N017.45 e59.58 g77.03 g
CK21.76 de74.82 f96.57 g
2020–2021W3N343.94 a125.79 a169.73 a
N240.18 a116.02 a156.20 a
N122.97 cd77.44 c100.40 cd
N08.89 e35.99 e44.88 f
W2N340.73 a121.26 a161.99 a
N239.74 ab117.70 a157.44 a
N118.17 d70.06 cd88.22 de
N07.64 e27.41 e35.05 f
W1N331.47 bc107.05 b138.52 b
N230.13 bc104.39 b134.52 b
N117.21 d61.44 d78.65 e
N05.66 e28.05 e33.71 f
CK22.74 cd88.37 c111.10 c
Note: Letters that differ within the same column denote statistically significant differences at the p < 0.05 level for the same growing season.
Table A3. Effective rainfall, irrigation water, soil water consumption and total ET of winter wheat for each treatment (mm).
Wheat SeasonsIrrigation
Treatments
Nitrogen
Treatments
Effective
Rainfall
Irrigation
Water
Soil Water
Consumption
Total ET
2018–2019W3N3146.7 30054.3 fg501.0 a
N2146.7 30055.8 fg502.5 a
N1146.7 30047.3 gh494.0 ab
N0146.7 30019.3 i466.0 cd
W2N3146.7 24095.8 cd482.5 bc
N2146.7 24080.6 de467.3 cd
N1146.7 24065.5 def452.2 cde
N0146.7 24034.8 fh421.5 ef
W1N3146.7 180112.7 ab439.4 e
N2146.7 180114.2 ab440.9 de
N1146.7 18097.9 bc424.6 ef
N0146.7 18079.0 cde405.7 f
CK146.7 70119.3 a336.0 g
2019–2020W3N3130.4 30020.0 de450.4 a
N2130.4 30022.5 de452.9 a
N1130.4 3008.1 ef438.5 a
N0130.4 300−24.2 g406.2 b
W2N3130.4 24038.5 c408.9 b
N2130.4 24042.2 c412.6 b
N1130.4 24025.3 cd395.7 bc
N0130.4 240−1.5 f368.9 d
W1N3130.4 18071.1 b381.5 cd
N2130.4 18075.2 b385.6 cd
N1130.4 18060.7 b371.1 d
N0130.4 18023.5 de333.9 e
CK130.4 7085.6 a286.0 f
2020–2021W3N3200.5 22085.7 d506.2 a
N2200.5 22088.3 c508.8 a
N1200.5 22033.8 f454.3 cd
N0200.5 220−23.7 h396.8 f
W2N3200.5 180102.0 b482.5 b
N2200.5 180105.7 b486.2 ab
N1200.5 18054.4 e434.9 de
N0200.5 1800.1 g380.6 fg
W1N3200.5 140125.4 a465.9 bcd
N2200.5 140126.8 a467.3 bcd
N1200.5 14086.2 d426.7 bc
N0200.5 14025.3 f365.8 g
CK200.5 70118.0 a388.5 fg
Note: Letters that differ within the same column denote statistically significant differences at the p < 0.05 level for the same growing season.
Table A4. WUE, NPFP and NPE of winter wheat for each treatment.
Wheat
Seasons
Irrigation
Treatments
Nitrogen
Treatments
WUE
(kg m−3)
NPFP
(kg kg−1)
NPE
(kg kg−1)
2018–2019W3N31.99 ab39.94 c52.47 e
N21.96 ab58.89 b53.58 de
N11.83 b109.05 a55.60 cd
N01.46 c/56.19 bc
W2N32.03 a39.17 c53.04 de
N22.09 a58.35 b53.66 de
N11.94 ab105.49 a58.23 ab
N01.55 c/58.14 ab
W1N32.10 a36.89 c56.24 bc
N22.07 a54.63 b56.30 bc
N12.12 a108.61 a56.52 bc
N01.53 c/58.06 ab
CK1.97 ab26.45 d60.37 a
2019–2020W3N32.22 ab40.06 c55.64 d
N22.14 abc58.13 b56.35 cd
N11.93 cde102.04 a58.96 c
N01.52 c/66.84 ab
W2N32.40 a39.27 cd56.16 cd
N22.32 ab57.28 b57.55 cd
N12.05 bc97.76 a59.70 c
N01.68 de/69.92 a
W1N32.39 a36.44 d57.76 cd
N22.39 a55.17 b57.51 cd
N12.20 abc98.17 a63.76 b
N01.63 e/70.48 a
CK2.30 ab26.34 e68.17 a
2020–2021W3N31.86 a37.76 d55.62 f
N21.83 a55.85 c59.71 e
N11.42 b77.53 a64.09 d
N00.87 c/77.14 b
W2N31.91 a36.96 d57.04 e
N21.89 a55.07 c58.41 e
N11.46 b76.37 a71.85 c
N00.86 c/93.12 a
W1N31.88 a35.12 d63.39 d
N21.85 a51.84 c64.36 d
N11.37 b70.59 b74.49 b
N00.87 c/93.86 a
CK2.02 a31.39 e70.64 c
Note: Letters that differ within the same column denote statistically significant differences at the p < 0.05 level for the same growing season.

References

  1. National Bureau of Statistics of China. Available online: http://www.stats.gov.cn/sj (accessed on 25 November 2023).
  2. Feng, W.; Shum, C.; Zhong, M.; Pan, Y. Groundwater storage changes in China from satellite gravity: An overview. Remote Sens. 2018, 10, 674. [Google Scholar] [CrossRef]
  3. Currell, M.J.; Han, D.; Chen, Z.; Cartwright, I. Sustainability of groundwater usage in northern China: Dependence on palaeowaters and effects on water quality, quantity and ecosystem health. Hydrol. Process. 2012, 26, 4050–4066. [Google Scholar] [CrossRef]
  4. Bai, N.; Mi, X.; Tao, Z.; Kang, J.; He, G.; Wang, Z. China’s nitrogen management of wheat production needs more than high nitrogen use efficiency. Eur. J. Agron. 2022, 139, 126557. [Google Scholar] [CrossRef]
  5. Gu, B.; Ju, X.; Chang, J.; Ge, Y.; Vitousek, P.M. Integrated reactive nitrogen budgets and future trends in China. Proc. Natl. Acad. Sci. USA 2015, 112, 8792–8797. [Google Scholar] [CrossRef]
  6. Guo, J.H.; Liu, X.J.; Zhang, Y.; Shen, J.L.; Han, W.X.; Zhang, W.F.; Christie, P.; Goulding, K.W.T.; Vitousek, P.M.; Zhang, F.S. Significant acidification in major Chinese croplands. Science 2010, 327, 1008–1010. [Google Scholar] [CrossRef]
  7. Burow, K.R.; Nolan, B.T.; Rupert, M.G.; Dubrovsky, N.M. Nitrate in groundwater of the United States, 1991−2003. Environ. Sci. Technol. 2010, 44, 4988–4997. [Google Scholar] [CrossRef]
  8. Davidson, E.A.; David, M.B.; Galloway, J.N.; Goodale, C.L.; Haeuber, R.; Harrison, J.A.; Howarth, R.W.; Jaynes, D.B.; Lowrance, R.R.; Nolan, B.T.; et al. Excess nitrogen in the US environment: Trends, risks, and solutions. Issues Ecol. 2011, 15. [Google Scholar]
  9. Liu, W.; Wang, J.; Wang, C.; Ma, G.; Wei, Q.; Lu, H.; Xie, Y.; Ma, D.; Kang, G. Root growth, water and nitrogen use efficiencies in winter wheat under different irrigation and nitrogen regimes in North China Plain. Front. Plant Sci. 2018, 9, 1798. [Google Scholar] [CrossRef]
  10. Coelho, A.P.; Faria, R.T.D.; Leal, F.T.; Barbosa, J.D.A.; Lemos, L.B. Biomass and nitrogen accumulation in white oat (Avena sativa L.) under water deficit. Rev. Ceres 2020, 67, 1–8. [Google Scholar] [CrossRef]
  11. Dietz, K.J.; Zörb, C.; Geilfus, C.M. Drought and crop yield. Plant Biol. 2021, 23, 881–893. [Google Scholar] [CrossRef]
  12. Motalebifard, R.; Najafi, N.; Oustan, S.; Nyshabouri, M.R.; Valizadeh, M. The combined effects of phosphorus and zinc on evapotranspiration, leaf water potential, water use efficiency and tuber attributes of potato under water deficit conditions. Sci. Hortic. 2013, 162, 31–38. [Google Scholar] [CrossRef]
  13. Araki, H.; Hossain, M.A.; Takahashi, T. Waterlogging and hypoxia have permanent effects on wheat root growth and respiration. J. Agron. Crop Sci. 2012, 198, 264–275. [Google Scholar] [CrossRef]
  14. Sun, H.Y.; Liu, C.M.; Zhang, X.Y.; Shen, Y.J.; Zhang, Y.Q. Effects of irrigation on water balance, yield and WUE of winter wheat in the North China Plain. Agric. Water Manag. 2006, 85, 211–218. [Google Scholar] [CrossRef]
  15. Wang, Q.; Li, F.; Zhao, L.; Zhang, E.; Shi, S.; Zhao, W.; Song, W.; Vance, M.M. Effects of irrigation and nitrogen application rates on nitrate nitrogen distribution and fertilizer nitrogen loss, wheat yield and nitrogen uptake on a recently reclaimed sandy farmland. Plant Soil 2010, 337, 325–339. [Google Scholar] [CrossRef]
  16. Qi, D.L.; Hu, T.T.; Xue, S. Effects of nitrogen application rates and irrigation regimes on grain yield and water use efficiency of maize under alternate partial root-zone irrigation. J. Integr. Agric. 2020, 19, 2792–2806. [Google Scholar] [CrossRef]
  17. Si, Z.; Zain, M.; Mehmood, F.; Wang, G.; Gao, Y.; Duan, A. Effects of nitrogen application rate and irrigation regime on growth, yield, and water-nitrogen use efficiency of drip-irrigated winter wheat in the North China Plain. Agric. Water Manag. 2020, 231, 106002. [Google Scholar] [CrossRef]
  18. Srivastava, R.K.; Panda, R.K.; Chakraborty, A.; Halder, D. Enhancing grain yield, biomass and nitrogen use efficiency of maize by varying sowing dates and nitrogen rate under rainfed and irrigated conditions. Field Crops Res. 2018, 221, 339–349. [Google Scholar] [CrossRef]
  19. Ye, T.; Ma, J.; Zhang, P.; Shan, S.; Liu, L.; Tang, L.; Cao, W.; Liu, B.; Zhu, Y. Interaction effects of irrigation and nitrogen on the coordination between crop water productivity and nitrogen use efficiency in wheat production on the North China Plain. Agric. Water Manag. 2022, 271, 107787. [Google Scholar] [CrossRef]
  20. Zhang, L.; He, X.; Liang, Z.; Zhang, W.; Zou, C.; Chen, X. Tiller development affected by nitrogen fertilization in a high-yielding wheat production system. Crop Sci. 2020, 60, 1034–1047. [Google Scholar] [CrossRef]
  21. Skudra, I.; Ruza, A. Effect of nitrogen and sulphur fertilization on chlorophyll content in winter wheat. Rural Sustain. Res. 2017, 37, 29–37. [Google Scholar] [CrossRef]
  22. Kubar, M.S.; Alshallash, K.S.; Asghar, M.A.; Feng, M.; Raza, A.; Wang, C.; Saleem, K.; Ullah, A.; Yang, W.; Kubar, K.A.; et al. Improving winter wheat photosynthesis, nitrogen use efficiency, and yield by optimizing nitrogen fertilization. Life 2022, 12, 1478. [Google Scholar] [CrossRef] [PubMed]
  23. Maadi, B.; Fathi, G.; Siadat, S.A.; Alami Saeid, K.; Jafari, S. Effects of preceding crops and nitrogen rates on grain yield and yield components of wheat (Triticum aestivum L.). World Appl. Sci. J. 2010, 17, 1331–1336. [Google Scholar]
  24. Wu, W.; Ma, B.L.; Fan, J.J.; Sun, M.; Yi, Y.; Guo, W.S.; Voldeng, H.D. Management of nitrogen fertilization to balance reducing lodging risk and increasing yield and protein content in spring wheat. Field Crops Res. 2019, 241, 107584. [Google Scholar] [CrossRef]
  25. Kong, L.; Xie, Y.; Hu, L.; Si, J.; Wang, Z. Excessive nitrogen application dampens antioxidant capacity and grain filling in wheat as revealed by metabolic and physiological analyses. Sci. Rep. 2017, 7, 43363. [Google Scholar] [CrossRef]
  26. Wang, R.; Wang, H.; Jiang, G.; Yin, H.; Che, Z. Effects of Nitrogen Application Strategy on Nitrogen Enzyme Activities and Protein Content in Spring Wheat Grain. Agriculture 2022, 12, 1891. [Google Scholar] [CrossRef]
  27. Wang, D.; Xu, Z.; Zhao, J.; Wang, Y.; Yu, Z. Excessive nitrogen application decreases grain yield and increases nitrogen loss in a wheat–soil system. Acta Agric. Scand. Sect. B Soil Plant Sci. 2011, 61, 681–692. [Google Scholar] [CrossRef]
  28. Shi, Z.L.; Jing, Q.; Cai, J.; Jiang, D.; Cao, W.X.; Dai, T.B. The fates of 15N fertilizer in relation to root distributions of winter wheat under different N splits. Eur. J. Agron. 2012, 40, 86–93. [Google Scholar] [CrossRef]
  29. Ma, X.H.; Wang, D.; Yu, Z.W.; Wang, X.Z.; Xu, Z.Z. Effect of irrigation regimes on water co-nsumption characteristics and nitrogen distribution in wheat at differen tnitrogen applications. Acta Ecol. Sin. 2010, 30, 1955–1965. [Google Scholar]
  30. Zhang, D.B.; Zhang, C.; Ren, H.L.; Xu, Q.; Yao, Z.Y.; Yuan, Y.Q.; Yao, P.W.; Zhao, N.; Li, Y.Y.; Zhang, S.Q.; et al. Trade-offs between winter wheat production and soil water consumption via leguminous green manures in the Loess Plateau of China. Field Crops Res. 2021, 272, 108278. [Google Scholar] [CrossRef]
  31. Hu, Y.; Zeeshan, M.; Wang, G.; Pan, Y.; Liu, Y.; Zhou, X. Supplementary irrigation and varying nitrogen fertilizer rate mediate grain yield, soil-maize nitrogen accumulation and metabolism. Agric. Water Manag. 2023, 276, 108066. [Google Scholar] [CrossRef]
  32. Qiao, J.; Yang, L.; Yan, T.; Xue, F.; Zhao, D. Rice dry matter and nitrogen accumulation, soil mineral n around root and n leaching, with increasing application rates of fertilizer. Eur. J. Agron. 2013, 49, 93–103. [Google Scholar] [CrossRef]
  33. Xu, Z.Z.; Yu, Z.W.; Wang, D.; Zhang, Y.L. Nitrogen accumulation and translocation for winter wheat under different irrigation regimes. J. Agron. Crop Sci. 2005, 191, 439–449. [Google Scholar] [CrossRef]
  34. Yan, F.; Zhang, F.; Fan, X.; Fan, J.; Wang, Y.; Zou, H.; Wang, H.; Li, G. Determining irrigation amount and fertilization rate to simultaneously optimize grain yield, grain nitrogen accumulation and economic benefit of drip-fertigated spring maize in northwest China. Agric. Water Manag. 2021, 243, 106440. [Google Scholar] [CrossRef]
  35. Yan, S.; Wu, Y.; Fan, J.; Zhang, F.; Zheng, J.; Qiang, S.; Guo, J.; Xiang, Y.; Zou, H.; Wu, L. Dynamic change and accumulation of grain macronutrient (n, p and k) concentrations in winter wheat under different drip fertigation regimes. Field Crops Res. 2020, 250, 107767. [Google Scholar] [CrossRef]
  36. Hu, S.; Qiao, B.; Yang, Y.; Rees, R.M.; Huang, W.; Zou, J.; Zhang, L.; Zheng, H.; Liu, S.; Shen, S.; et al. Optimizing nitrogen rates for synergistically achieving high yield and high nitrogen use efficiency with low environmental risks in wheat production–Evidences from a long-term experiment in the North China Plain. Eur. J. Agron. 2023, 142, 126681. [Google Scholar] [CrossRef]
  37. Si, Z.; Zain, M.; Li, S.; Liu, J.; Liang, Y.; Gao, Y.; Duan, A. Optimizing nitrogen application for drip-irrigated winter wheat using the DSSAT-CERES-Wheat model. Agric. Water Manag. 2021, 244, 106592. [Google Scholar] [CrossRef]
  38. Li, Y.; Liu, H.; Huang, G. The effect of nitrogen rates on yields and nitrogen use efficiencies during four years of wheat–maize rotation cropping seasons. Agron. J. 2016, 108, 2076–2088. [Google Scholar] [CrossRef]
  39. Junye, Z.; Zhenwen, Y. Effects of nitrogen fertilizer rate on uptake, distribution and utilization of nitrogen in winter wheat under high yielding cultivated condition. Acta Agron. Sin. 2006, 32, 484–490. [Google Scholar]
  40. Wang, Y.; Wang, Z.L.; Zhang, Q.; Hu, N.; Li, Z.; Lou, Y.; Li, Y.; Xue, D.; Chen, Y.; Wu, C.; et al. Long-term effects of nitrogen fertilization on aggregation and localization of carbon, nitrogen and microbial activities in soil. Sci. Total Environ. 2018, 624, 1131–1139. [Google Scholar] [CrossRef]
  41. Chen, L.; Zhang, J.; Zhao, B.; Ma, D. Crop yield and soil biochemical properties under different nitrogenfertilization and irrigation management schemes. Chin. J. Eco Agric. 2014, 22, 501–508. [Google Scholar]
  42. Murugan, R.; Parama, V.R.; Madan, B.; Muthuraju, R.; Ludwig, B. Short-term effect of nitrogen intensification on aggregate size distribution, microbial biomass and enzyme activities in a semi-arid soil under different crop types. Pedosphere 2019, 29, 483–491. [Google Scholar] [CrossRef]
  43. Wang, J.; Xie, J.; Li, L.; Luo, Z.; Zhang, R.; Jiang, Y. Nitrogen application increases soil microbial carbon fixation and maize productivity on the semiarid Loess Plateau. Plant Soil 2023, 488, 9–22. [Google Scholar] [CrossRef]
  44. Bandyopadhyay, P.K.; Mallick, S. Actual evapotranspiration and crop coefficients of wheat (Triticum aestivum) under varying moisture levels of humid tropical canal command area. Agric. Water Manag. 2003, 59, 33–47. [Google Scholar] [CrossRef]
  45. Dar, E.A.; Brar, A.S.; Mishra, S.K.; Singh, K.B. Simulating response of wheat to timing and depth of irrigation water in drip irrigation system using CERES-Wheat model. Field Crops Res. 2017, 214, 149–163. [Google Scholar] [CrossRef]
  46. Xu, X.; Zhang, M.; Li, J.; Liu, Z.; Zhao, Z.; Zhang, Y.; Zhou, S.; Wang, Z. Improving water use efficiency and grain yield of winter wheat by optimizing irrigations in the North China Plain. Field Crops Res. 2018, 221, 219–227. [Google Scholar] [CrossRef]
  47. Zhang, X.; Chen, S.; Sun, H.; Shao, L.; Wang, Y. Changes in evapotranspiration over irrigated winter wheat and maize in North China Plain over three decades. Agric. Water Manag. 2011, 98, 1097–1104. [Google Scholar] [CrossRef]
  48. Sun, M.; Ren, A.X.; Gao, Z.Q.; Wang, P.R.; Mo, F.; Xue, L.Z.; Lei, M.M. Long-term evaluation of tillage methods in fallow season for soil water storage, wheat yield and water use efficiency in semiarid southeast of the Loess Plateau. Field Crops Res. 2018, 218, 24–32. [Google Scholar] [CrossRef]
  49. Pradhan, S.; Chopra, U.K.; Bandyopadhyay, K.K.; Singh, R.; Jain, A.K.; Chand, I. Effect of water and nitrogen management on water productivity and nitrogen use efficiency of wheat in a semi-arid environment. Int. J. Agric. Food Sci. Technol. 2013, 4, 727–732. [Google Scholar]
  50. Cui, Z.; Zhang, F.; Chen, X.; Li, F.; Tong, Y. Using in-season nitrogen management and wheat cultivars to improve nitrogen use efficiency. Soil Sci. Soc. Am. J. 2011, 75, 976–983. [Google Scholar] [CrossRef]
  51. Sinclair, T.R.; Pinter, P.J., Jr.; Kimball, B.A.; Adamsen, F.J.; LaMorte, R.L.; Wall, G.W.; Hunsaker, D.J.; Adam, N.; Brooks, T.J.; Garcia, R.L.; et al. Leaf nitrogen concentration of wheat subjected to elevated [CO2] and either water or N deficits. Agric. Ecosyst. Environ. 2000, 79, 53–60. [Google Scholar] [CrossRef]
Figure 1. Cumulative rainfall and reference crop evapotranspiration (ET0) during the experiment.
Agronomy 14 02629 g001
Figure 2. Above-ground nitrogen accumulation (ANA) and its composition in winter wheat plants after maturity under different irrigation and nitrogen treatments during the experiment. (ac) represents data in the 2018–2019, 2019–2020 and 2020–2021 season, respectively. Different letters in the figure indicate significant differences between nitrogen or irrigation treatments at the p < 0.05 level.
Agronomy 14 02629 g002
Figure 3. Evapotranspiration (ET) and its sources, including effective rainfall, irrigation, and soil water consumption (ΔS) under different irrigation and nitrogen treatments during the experiment. (ac) represents data in the 2018–2019, 2019–2020 and 2020–2021 season, respectively. Different letters in the figure indicate significant differences between nitrogen or irrigation treatments at the p < 0.05 level.
Agronomy 14 02629 g003
Table 1. Primary soil physical properties in the 0–140 cm soil layer.
Soil Layer (cm)Particle Content Percentage (%)Bulk Density
(g cm−3)
Field Capacity
(cm3 cm−3)
Saturated Water Content (cm3 cm−3)
(0–0.002 mm)(0.002–0.02 mm)(0.02–2 mm)
0–206.8350.6342.541.5333.80%41.23%
20–406.4339.5354.041.6133.26%41.25%
40–606.3138.4055.291.5631.87%41.12%
60–806.2836.9056.821.5030.67%43.52%
80–1005.6638.9855.361.4629.45%45.02%
100–1205.9732.7861.251.4127.36%47.24%
120–1403.4330.20 66.371.4127.89%47.14%
Table 2. Dates of each growth stage of winter wheat during the experiment.
Growth Stage2018–20192019–20202020–2021
Sowing10 October12 October10 October
Reviving22 February25 February22 February
Jointing15 March15 March14 March
Anthesis23 April22 April25 April
Maturity3 June3 June3 June
Table 3. Irrigation dates after winter wheat emergence during the experiment.
201920202021
12 March9 March/
19 April19 April11 April
15 May15 May14 May
Table 4. Effects of irrigation and nitrogen application on grain yield and yield characteristics of winter wheat.
Wheat SeasonsTreatmentsSpike Number
(104 hm−2)
Grains per Spike1000-Grain Weight (g)Grain Yield
(kg hm−2)
2018–2019N3557 a32.4 a54.1 a9666 a
N2545 b31.8 a56.0 a9568 a
N1536 b31.6 a54.8 a8941 b
N0414 c29.9 b55.7 a6510 c
p-value0.0020.034NS0.000
W3521 a31.8 a56.5 a8918 a
W2513 ab31.9 a55.9 a8702 ab
W1505 b30.7 b53.1 b8394 b
p-value0.0000.0220.0260.000
N × WNSNSNSNS
CK449 29.7 50.1 6613
2019–2020N3580 a31.4 a51.1 a9648 a
N2577 a31.4 a50.8 a9496 b
N1544 b29.6 b50.1 a8244 c
N0402 c28.1 c52.0 a5931
p-value0.0000.010NS0.000
W3529 a31.0 a54.1 a8591 a
W2526 ab29.8 b51.7 b8422 a
W1521 b29.6 b47.3 c7975 b
p-value0.0000.0320.0260.000
N × WNS0.037NSNS
CK430 29.6 41.1 6584
2020–2021N3525 a32.8 a53.7 a9154 a
N2526 a31.8 a53.6 a9060 a
N1400 b28.6 b53.2 a6211 b
N0275 c24.3 c53.7 a3297 c
p-value0.0000.013NS0.014
W3435 a30.2 a55.9 a7166 a
W2435 a28.6 b55.5 a7010 a
W1425 b29.3 b49.2 b6615 b
p-value0.0000.0250.0310.000
N × WNSNS0.018NS
CK521 32.3 45.9 7848
Note: The table presents the mean values for each irrigation or nitrogen treatment. Letters that differ within the same column denote statistically significant differences at the p < 0.05 level for the same growing season. “N × W” refers to the p-value for the interaction between irrigation (W) and nitrogen (N), while “NS” indicates no significant difference.
Table 5. Pearson correlation coefficient between grain yield and yield characteristics.
Pearson CorrelationSpike NumberGrains per Spike1000-Grain WeightGrain Yield
Spike number1
Grains per spike0.844 **1
1000-grain weight−0.0230.1221
Yield0.976 **0.891 **0.1171
Note: The data for the Pearson correlation analysis are derived from Table A1 in Appendix A, which includes 39 data points for each yield indicator. ** indicates a significant correlation at the p < 0.01 level (two-tailed).
Table 6. ANOVA (p-value) for ANA of winter wheat plant after maturity.
Wheat SeasonsFactorsStalk and Leaf and HuskGrainANA
2018–2019W0.0000.0000.000
N0.0000.0000.000
W × NNSNSNS
2019–2020W0.0000.0000.000
N0.0000.0000.000
W × NNSNSNS
2020–2021W0.0000.0000.000
N0.0000.0000.000
W × NNSNS0.034
Note: W × N means the p-value for the interaction between W and N; NS means no significant difference.
Table 7. ANOVA (p-value) for ET of winter wheat.
Wheat SeasonsFactorsET
2018–2019W0.000
N0.023
W × NNS
2019–2020W0.000
N0.008
W × NNS
2020–2021W0.000
N0.000
W × NNS
Note: W × N means the interaction between W and N; NS means no significant difference.
Table 8. Effects of irrigation and nitrogen application on WUE, NPFP and NPE of winter wheat.
Treatments2018–20192019–20202020–2021
WUE
(kg m−3)
NPFP
(kg kg−1)
NPE
(kg kg−1)
WUE
(kg m−3)
NPFP
(kg kg−1)
NPE
(kg kg−1)
WUE
(kg m−3)
NPFP
(kg kg−1)
NPE
(kg kg−1)
N32.04 a38.67 c53.92 a2.34 a38.59 c56.52 c1.89 a36.62 c58.68 c
N22.04 a57.29 b54.51 ab2.28 a56.86 b57.13 c1.86 a54.25 b60.83 c
N11.96 a107.72 a56.78 bc2.06 b99.32 a60.81 b1.42 b74.83 a70.15 b
N01.51 b/57.46 c1.61 c/69.08 a0.86 c/88.04 a
p-value0.0000.0230.0270.0000.0050.0250.0000.0020.006
W31.81 b69.29 a54.46 b1.95 a66.74 a59.45 b1.50 a57.05 a64.14 c
W21.90 ab67.67 ab55.77 ab2.11 a64.77 ab60.83 ab1.53 a56.13 a70.1 ab
W11.96 a66.71 b56.78 a2.15 a63.26 b62.38 a1.49 a52.52 b74.03 a
p-value0.0310.0310.028NS0.0330.027NS0.0370.034
N × W0.042NSNSNSNSNSNSNSNS
CK1.9726.4560.372.3026.3468.172.0231.3970.64
Note: The table presents the mean values for each irrigation or nitrogen treatment. Letters that differ within the same column denote statistically significant differences at the p < 0.05 level for the same growing season. “N × W” refers to the p-value for the interaction between irrigation (W) and nitrogen (N), while “NS” indicates no significant difference.
Disclaimer/Publisher’s Note: The statements, opinions and data contained in all publications are solely those of the individual author(s) and contributor(s) and not of MDPI and/or the editor(s). MDPI and/or the editor(s) disclaim responsibility for any injury to people or property resulting from any ideas, methods, instructions or products referred to in the content.

