Article

Geoelectric Joint Inversion for 3D Imaging of Vineyard Ground

1
Department of Physics and Earth Sciences, University of Ferrara, 44122 Ferrara, Italy
2
INFN Ferrara Section, 44122 Ferrara, Italy
3
GeoExplorer Impresa Sociale s.r.l., 52100 Arezzo, Italy
*
Author to whom correspondence should be addressed.
Agronomy 2024, 14(11), 2489; https://doi.org/10.3390/agronomy14112489
Submission received: 20 September 2024 / Revised: 16 October 2024 / Accepted: 21 October 2024 / Published: 24 October 2024
(This article belongs to the Special Issue Precision Viticulture for Vineyard Management)

Abstract

:
Using a novel joint inversion approach, this study tackles the challenge of accurately characterizing subsurface electrical resistivity in vineyards, a critical and strategic aspect of precision viticulture. For the first time, we integrate 3D Galvanic Contact Resistivity with multi-2D Capacitively Coupled Resistivity data. Conducted in a prestigious Sangiovese vineyard in Montalcino (Tuscany, Italy), the data are analyzed utilizing a single algorithm capable of inverting Capacitively Coupled Resistivity, Galvanic Contact Resistivity, and joint datasets. This approach combines data sensitive to different depths and spatial resolutions, resulting in a comprehensive analysis of soil resistivity variations and moisture distribution, thus providing a detailed and coherent subsurface model. The joint inversion produced a high spatial resolution 3D resistivity model with a density of 20.21 data/m3. This model significantly enhances subsurface characterization, delineating root systems and correlating water distribution with resistivity patterns, showing relative variations sometimes greater than 50%. This method reduced data misfit more effectively than individual inversions and identified a low-resistivity volume (<20 Ω·m), extending from northeast to south, indicating the presence of subsurface water. The systematic alternation of high and low resistivity across vineyard rows highlights the impact of soil management activities on resistivity and supports targeted interventions for vineyard health.

1. Introduction

Within Agriculture 4.0, precision viticulture integrates advanced technologies to enhance the efficiency, precision, and sustainability of grape cultivation. Detailed soil studies are vital, as they impact vine health, grape quality, and productivity [1,2,3]. Soil properties like moisture, texture, clay content, and structure significantly influence cultivation stages. For instance, clay-rich soils retain more moisture, necessitating careful irrigation to avoid waterlogging, while sandy soils require frequent watering. Fertilization is influenced by soil texture, with clay soils holding more nutrients. Well-structured soils promote root growth and aeration, enhancing pest control through increased microbial activity, whereas compacted soils hinder water infiltration, affecting irrigation and pest management [4,5]. This optimizes resource use and promotes sustainability [6]. Accurate soil characterization supports data-driven decision-making to improve long-term vineyard management [7].
Agronomic techniques widely used to obtain soil and root information often rely on point-based or destructive methods, such as soil and root sampling and analysis [8], trench wall excavation [8], and the installation of agro-weather networks [9]. Additionally, non-destructive imaging systems, such as Minirhizotron root observation tubes [10], can also employed. While these methods provide accurate and reliable data, their main limitation lies in the localized nature of the information they offer, making them unsuitable for capturing spatial variability. Moreover, techniques that provide geometric and structural root data, such as trench excavation, often require significant disruption of the planting area, limiting their utility for improving cultivation on the specific plants under study.
In contrast, emerging agrogeophysical techniques utilize non-invasive geophysical methods to study soil–plant–atmosphere interactions [11]. These methods include Electromagnetic Induction (EMI) to swiftly evaluate soil salinity and texture variations, guiding precise fertilizer application [12]. Ground-Penetrating Radar can reveal the hidden architecture of large root systems, enhancing our understanding of crop resilience [13]. Time Domain Reflectometry provides detailed measurements of soil water content, ensuring optimal irrigation strategies [14]. Seismic methods uncover zones of soil compaction, preventing root growth barriers [15], while X-ray Computed Tomography provides an in-depth view of soil structure and porosity, vital for managing soil health [16]. Together, these techniques supply comprehensive insights, enabling the fine-tuning of agricultural practices for both productivity and sustainability.
Geoelectric applications are fundamental in the agrogeophysical study of vineyards, providing non-invasive insights into subsurface features, particularly soil and root interactions, with greater detail compared to traditional methods [17]. Among these methods, electrical resistivity tomography (ERT) is especially effective in detecting variations in soil resistivity, which correlate with key subsurface properties such as moisture content, root structure, and soil compaction [18]. ERT operates by injecting electrical currents into the soil and measuring the resulting voltage differences, which vary based on the soil’s resistivity at different depths. These resistivity measurements provide indirect but valuable information about subsurface features. While ERT does not directly map specific structures, it reveals resistivity contrasts that can be interpreted to identify areas of higher moisture uptake [19], soil salinity [20], and compaction [21]. These insights enable efficient water management [22], help delineate groundwater aquifers [23], and identify clay content distribution [24], providing valuable information for agricultural decision-making.
The ERT method relies on Ohm’s law, measuring the subsurface’s electrical resistivity by injecting a current, recording the resulting voltage difference, and applying a proper geometrical factor. The subsurface features and structures in the ground are identified by analyzing the variations of the inferred resistivity [25]. Geoelectrical methods such as Electromagnetic Induction (EMI), Galvanic Contact Resistivity (GCR), and Capacitively Coupled Resistivity (CCR) are distinct but complementary. EMI measures soil Electrical Conductivity (ECa) by generating an electromagnetic field that induces currents in the soil, with the secondary field detected to estimate ECa [26]. GCR involves direct contact with the soil using electrodes to inject a current and measure the voltage differences [27]. CCR uses capacitive coupling to measure resistivity without direct soil contact, utilizing dipole antennas to create and detect electrical fields [28]. To transform raw geophysical data into meaningful subsurface models, the application of appropriate inversion techniques is fundamental. This process iteratively refines initial models by minimizing the difference between observed and computed resistivity values. Utilizing methods such as the damped least-squares approach, the inversion process stabilizes solutions in ill-posed problems, ensuring accurate subsurface characterization [29]. This method enhances spatial resolution, reduces ambiguity, and provides a comprehensive and coherent view of geological and lithological features over extensive subsurface areas, which is essential for accurate management and decision-making in agriculture. In the realm of geophysical inversion techniques, joint inversion represents an advanced technique that integrates multiple methods to improve subsurface model accuracy by combining complementary data sensitivities and spatial resolutions [30].
This paper seeks to develop a joint inversion methodology for resistivity using two different methods: 3D CCR and multi 2D GCR. This approach is applied for the first time to study soil features in a vineyard, aiming to enhance the spatial resolution and accuracy of subsurface property characterization. Improved characterization is critical for optimizing viticultural practices and improving vineyard management, contributing to more precise and sustainable viticultural techniques.

2. Materials and Methods

2.1. Experimental Site

The “Il Poggione” estate vineyard, located in the municipality of Montalcino (Siena) in the Tuscany region of Italy, serves as the study site (Figure 1). The Montalcino area is characterized by a hilly terrain composed of Pliocene clays, deeply incised by watercourses, with prevalent erosive formations, which are types of badland formations commonly referred to in the Italian regional literature as “calanchi” and “biancane”, linked to clay substrates [31]. In addition, the area includes Quaternary deposits such as anthropogenic fills, travertine from chemical precipitation, and lacustrine, palustrine, lagoonal, and colmatation deposits, providing a comprehensive understanding of the local lithology and geomorphological processes [32].
The soil texture at the study site was investigated through the analysis of five samples using the Jar test method [33], resulting in an average composition of 31.8% sand, 34.9% silt, and 33.3% clay, classifying the soil as clay loam according to the United States Department of Agriculture soil texture classification. This classification is further supported by data from the Toscana Region’s pedological database, which provides similar percentages for the soil composition in the area, confirming the clay loam classification [34].
Montalcino’s unique terroir, characterized by its hilltop location and soil composition, enhances the wine’s distinct profile and illustrates the high standards of Italian viticulture [35].
The selected vineyard spans 1253 ha, is south-facing, and lies on soil with variable textures and a 2% average slope. The vineyard is primarily dedicated to the production of Brunello di Montalcino, a DOCG (Denominazione di Origine Controllata e Garantita: controlled and guaranteed designation of origin) wine distinguished by its exclusive use of 100% Sangiovese Grosso grapes grown in the area surrounding Montalcino.
The root architecture of these grapevines predominantly spans the top 60 cm of soil, although roots can extend beyond 6 m, depending on soil composition and cultural practices [36]. In Sangiovese (“Vitis vinifera L.”), rootstock selection is vital for enhancing drought tolerance by enabling deeper water access [37,38]. Considering these factors, the survey design adopts a conservative approach, as detailed in Table 1 and depicted in the layout presented in Figure 1b, to ensure comprehensive subsurface characterization that accounts for potential root distribution variations.
The planting density is 4200 vines per hectare with a row spacing of 2.80 m and an intra-row spacing of 1.10 m. The site is unirrigated, organically managed, and employs an alternate row plowing technique. By alternating between plowed and grass-covered rows, this approach effectively reduces grapevine vigor, which in turn minimizes the risk of bunch rot [39]. These specific vineyard management practices exert a significant impact on the chemical and sensory profiles of the wines, influencing attributes such as color indices and polyphenol composition. These practices enhance the vine’s access to deep water reserves and nutrients, further improving the quality and distinctiveness of the wines produced [40].

2.2. Data Acquisition

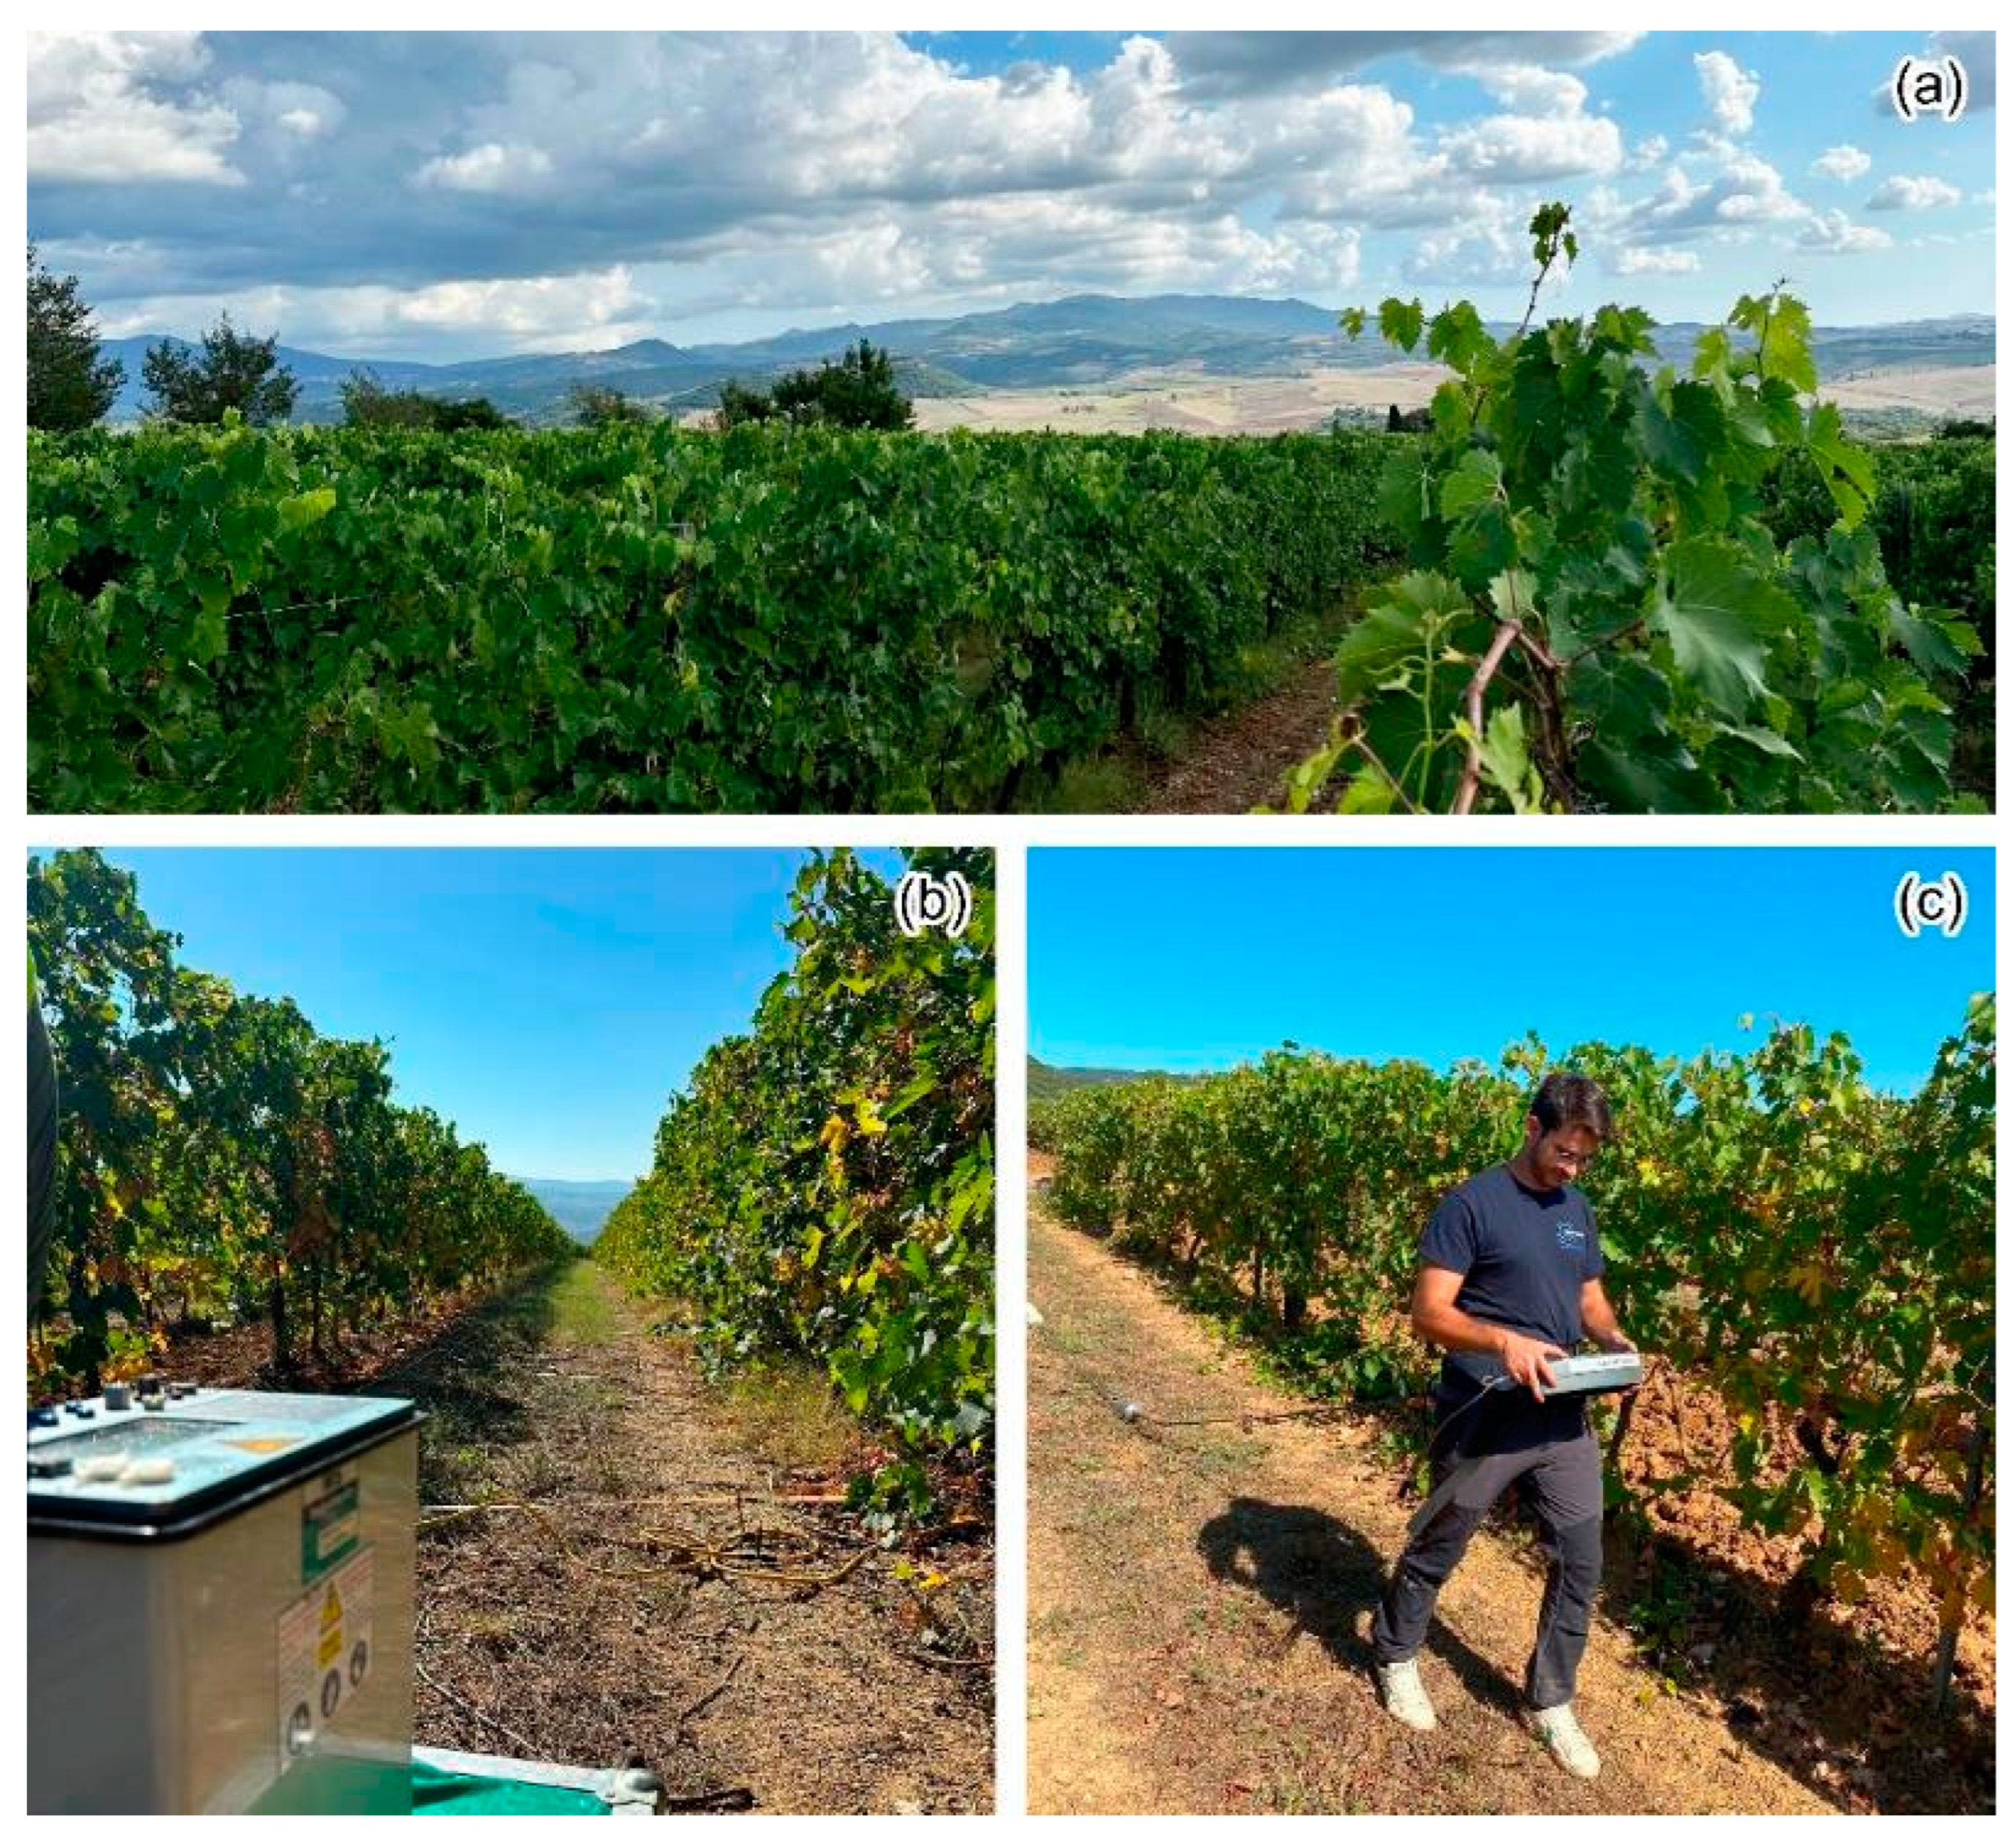
The Galvanic Contact Resistivity (GCR) survey is performed using 1359 electric current injections managed by the Syscal Pro resistivity system (IRIS Instruments, Orleans, France, Figure 2b). For the Capacitively Coupled Resistivity (CCR) method, measurements are conducted using the OhmMapper resistivimeter (Geometrics Inc., San Jose, CA, USA) at a fixed frequency of 16.5 kHz [41], with an antenna offset of 5 m and variable nonconductive cable configurations (Figure 2c). The acquisition parameters are summarized in Table 1.
Both the GCR and CCR methods measure subsurface electrical resistivity, fundamentally relying on Ohm’s Law
V = I R
where V is the voltage, I is the current, and R is the resistance. The apparent resistivity ( ρ a ) for both methods is calculated using
ρ a = k V I
with k being a geometric factor dependent on electrode spacing and configuration.
The GCR method involves injecting a current through electrodes and recording the voltage differences. Enhanced by the Syscal Pro instrument, this method performs electrical resistivity tomography (ERT) through various electrode configurations.
The potential ( Φ ) in a homogeneous medium is given by
Φ = ρ I 2 π r    
where ρ is the resistivity, I is the current, and r is the distance from the single current electrode, facilitating detailed subsurface imaging [29,42].
Conversely, the CCR method measures subsurface resistivity without galvanic electrodes, using a coaxial-cable array of transmitter and receiver sections dragged along the ground. It utilizes capacitive coupling to inject an oscillating current through capacitive sensors instead of direct galvanic contact. The transfer impedance ( Z ) in CCR is expressed as
Z = 1 i ω C O 1 K E S α  
where i is the imaginary unit, ω is the angular frequency, C O is the mutual capacitance, K E S is the electrostatic geometric factor, and α is a complex number representing dielectric properties. This approach reliably emulates DC resistivity measurements in complex field environments.
The pseudo-depth of investigation Z for the OhmMapper is given by
Z = 0.285   ·   l   ·   n 0.87  
where l is the dipole length and n is the number of dipole lengths between the transmitter and the receiver. This empirical equation is derived from field tests with the OhmMapper system [43].
The CCR method offers significant flexibility, allowing for the adjustment of dipole and tow-link lengths to modify the depth of investigation and the volume of the subsurface surveyed. Although particularly advantageous on highly resistive ground, CCR also proves effective in soils with moderate resistivity, as it maintains sufficient capacitive coupling [26]. Furthermore, this method provides a high measurement-speed-to-data-density ratio, which eliminates the need for electrode installation, significantly improving field efficiency [44]. This makes the CCR method especially useful for soil moisture mapping, environmental monitoring, geotechnical investigations, and studies in areas such as permafrost, arid regions, and urban environments, where extensive lines can be surveyed without the need to remove electrodes [43]. However, the CCR method is limited by its shallow depth of investigation and moderate spatial resolution. In addition, the movement of the antennas during surveys introduces noise, leading to spikes in apparent resistivity that can affect the accuracy of the results [44,45].
The GCR method investigates greater depths than the CCR method, using a dipole–dipole configuration. GCR provides more stable and controlled measurements, as its stationary galvanic electrodes maintain direct contact with the ground, reducing variability during data acquisition. This stability contrasts with the CCR method, where moving capacitive antennas introduce variability, such as fluctuations in coupling efficiency and positional shifts, leading to higher resistance values during acquisition. Despite this stability, GCR has limitations, particularly in terms of survey efficiency, as it requires electrode installation and removal, which can be time-consuming, especially for large-scale surveys. Additionally, factors like subsurface infrastructure interference and challenging surface conditions, such as dry or highly resistive soils, can affect data quality [29,46].
Maintaining consistency in resistivity studies provides robust constraints for inversion algorithms, which is essential for accurate model reconstruction [47]. Furthermore, analyzing the same physical property across various datasets through joint inversion techniques allows for the integration of multiple information sources, thereby improving model reliability and spatial resolution for effective subsurface characterization [48].

2.3. Data Processing

The inversion methodology employs an original modified and integrated framework based on SimPEG [49], running on a PC with an Intel (R) Core (TM) i7-10700K CPU, 128 GB RAM, ROG Strix Z490-H motherboard. The software modular design facilitates the exploration of DC resistivity data inversion, the integration of forward simulation, data misfit evaluation, and model parameter regularization to enhance subsurface characterization. The process extends to implement a joint inversion algorithm on a shared model that quantifies similarities between different aspects of the same subsurface physical property [50].
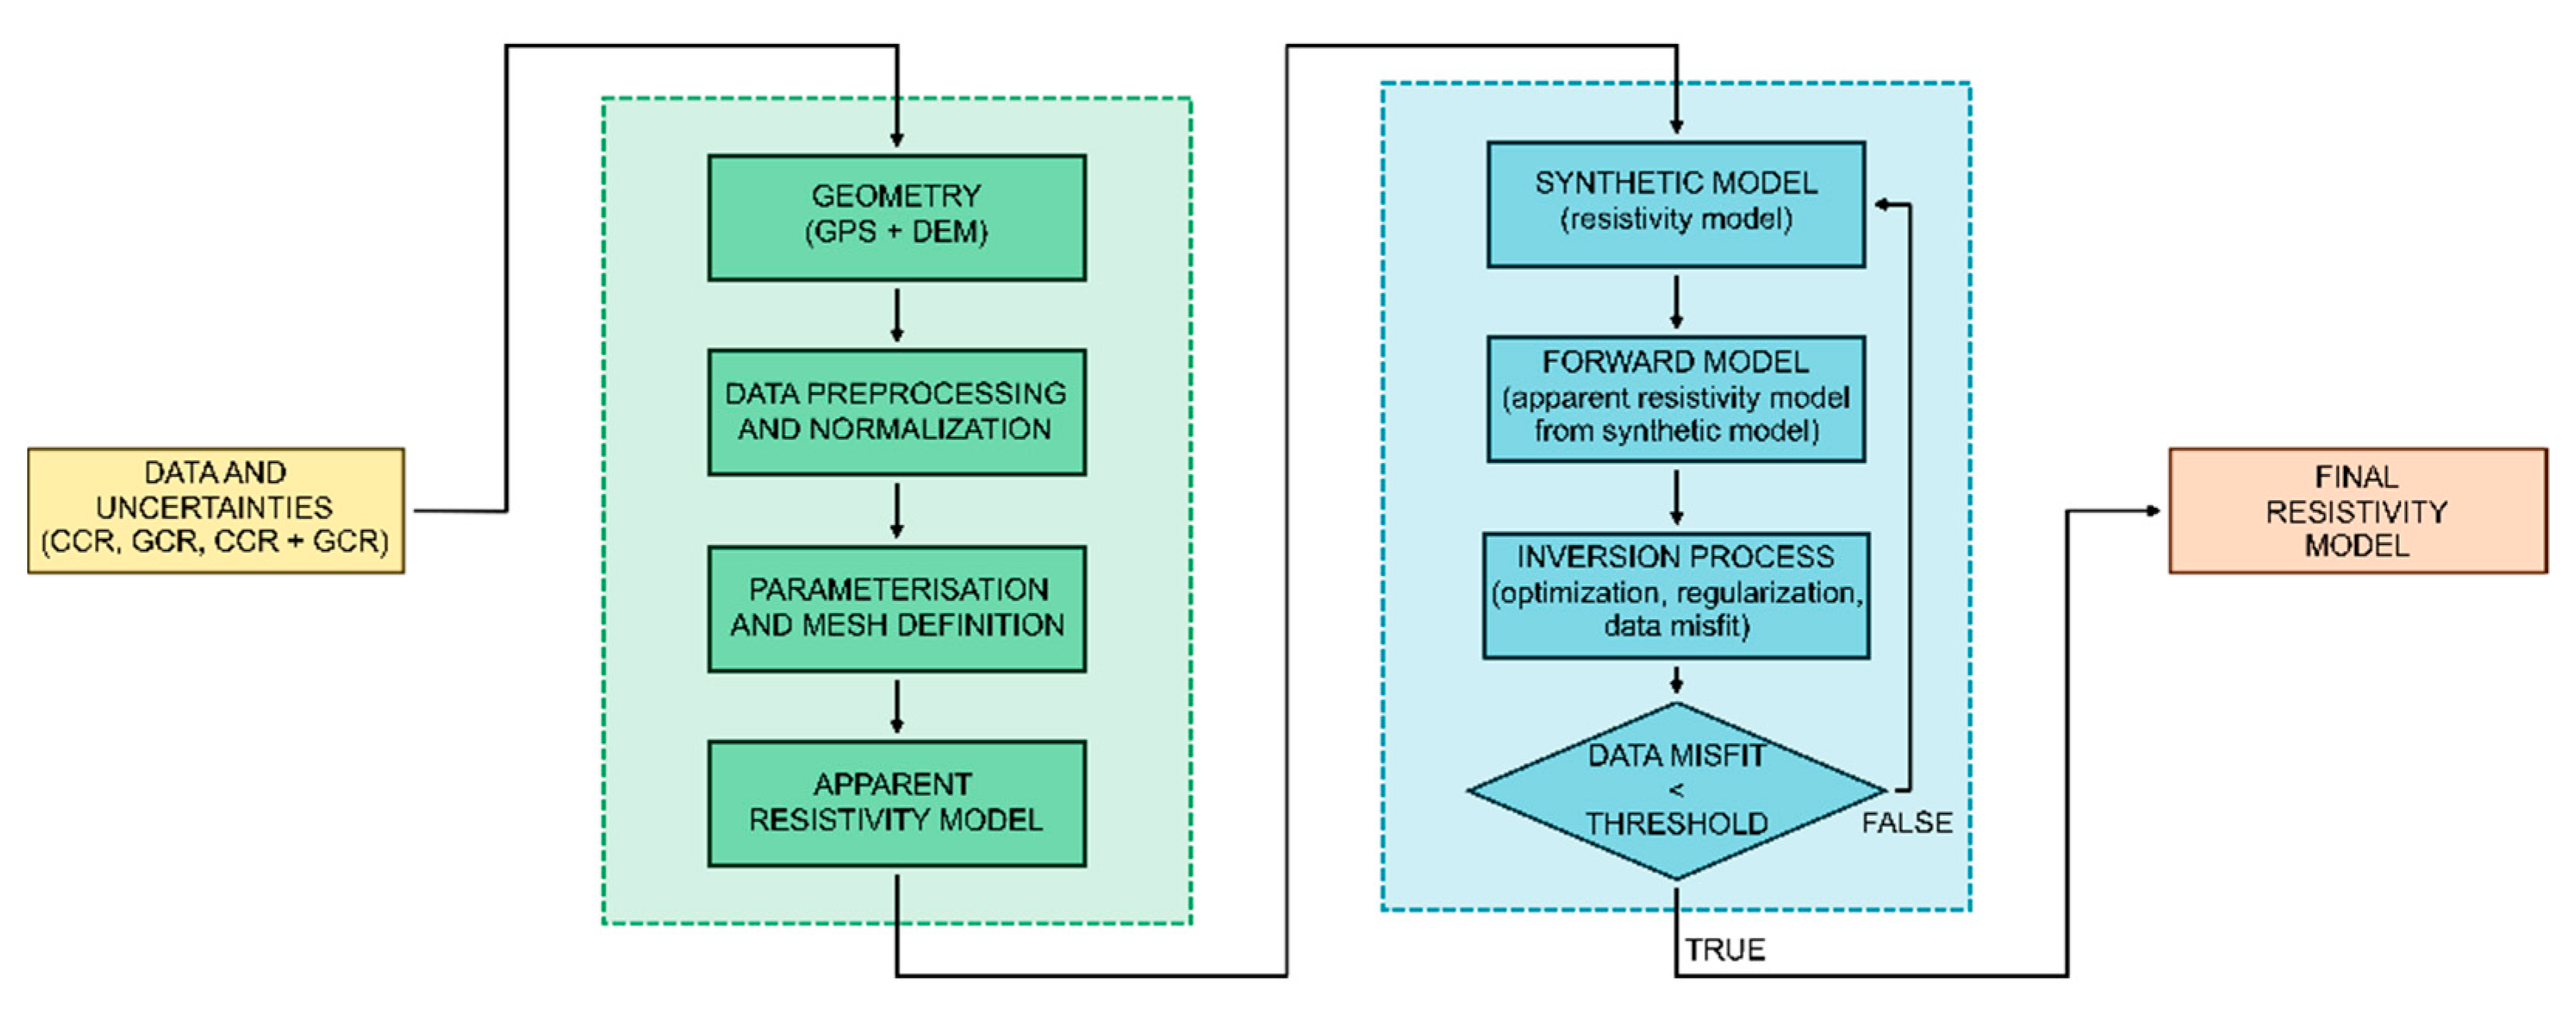
The framework (Figure 3) formulates the corresponding inverse problem as a least-squares optimization problem and supports both individual (GCR and CCR) and joint inversions.
Table 2 summarizes the quantitative progression from raw measurements to processed datasets for GCR, CCR, and joint inversions. It reflects the refinement steps of both input data and output data, including outlier removal and data filtering, ensuring the integrity and reliability of the data used in subsequent inversion modeling.
The natural logarithm of the acquired measurements (i.e., resistance measurements in Ω), along with their associated uncertainties, undergoes rigorous preprocessing to ensure integrity and uniformity. The GCR and CCR datasets, formatted in an XYZ array with columns for spatial coordinates (x, y, z) and resistance values, are integrated with topographical information in an N × 3 matrix to adjust geospatial datasets for elevation variations. Moreover, the literature (Neukirch & Klitzsch, 2010 [44]; Oldenborger & LeBlanc, 2013 [51]) highlights that inversion algorithms optimized for CCR data are not well established, and that the system does not conform to a perfect dipole–dipole configuration. To address this, and based on recommendations from previous studies, we applied a conservative correction factor of 0.8 to the antenna length as an empirical adjustment. This correction aims to account for the actual geometry of the Ohm-mapper system and enhance the accuracy of the data. The GCR data are filtered by a quality factor (Q), excluding data with a Q over 5% [51]. Measurements continue until the Q drops below 5% or five stacks are reached; high standard deviations at maximum stacks lead to data exclusion. To further ensure data integrity, the GCR data are filtered based on their quality factor (Q). During the acquisition phase, measurements continue until Q drops below 5% or a maximum of five stacks is reached. High standard deviation values associated with maximum stacks indicate insufficient improvement in measurement quality, leading to the exclusion of data with a Q greater than 5%.
Following this preprocessing, the refined measurements, which resulted in a reduction in the dataset by less than 2%, serve as the input data (row 2 Table 2) for subsequent analysis and modeling.
Building upon the processed data, the discretized model space is defined through mesh generation [52]. TreeMesh, chosen for its balance of computational efficiency and spatial resolution through adaptive refinement, provides fine sampling in areas with higher measurement density while maintaining a coarser discretization in regions with sparser data and at greater depths. [53]. The specific TreeMesh employed has a minimum horizontal cell width of 0.4 m (dxy) and a minimum vertical cell width of 0.25 m (dz), with extents of 30 m horizontally and 8 m vertically, optimizing memory allocation and processing resources.
Starting models use an air conductivity value of ln ( 10 8 ) S/m and a background conductivity value. For the GCR method, it is also possible to model only the subsurface, excluding the air layer, to improve computational efficiency. However, for the CCR method, the air layer must still be modeled due to the nature of its antennas. For the CCR and GCR methods, this background is the natural logarithm of the mean apparent conductivity from each method (ln (0.1) S/m for CCR and ln (0.045) S/m for GCR, respectively). For the joint model, it is the natural logarithm of the weighted mean apparent conductivities from both methods (ln (0.073) S/m). These models are mapped from the model space to active cells, ensuring they align with the inversion framework and accurately reflect the subsurface properties.
Structured as an optimization problem (Equation (6)), the inverse problem infers subsurface properties from observational data. The objective function ( ϕ ( m ) ), consisting of data misfit ( ϕ d ( m ) ) and model regularization terms ( β ϕ m ( m ) ), is minimized using the L2 norm to refine the subsurface model.
ϕ ( m ) = ϕ d ( m ) + β ϕ m ( m )
The forward model predicts the subsurface geophysical response, generating synthetic data that refine the fit by adjusting cell values during inversion. Data misfit measures the discrepancy between the observed and predicted data, while regularization stabilizes the process by integrating prior geological knowledge. The trade-off parameter ( β ) balances model accuracy with geological plausibility [26,54]. In this research, the optimization employs the Inexact Gauss–Newton method, which approximates the Hessian matrix using gradients and Jacobians, reduces computational costs, and enhances efficiency [55].
Accurate and stable modeling requires careful parameterization and optimization. The Beta ratio balances data misfit with model complexity, while the Cooling factor and Cooling rate control the reduction and frequency of β , ensuring stability and precision [56,57]. Parameters such as ε, max iterations LS, and max iterations CG contribute significantly to the optimization. The ε parameter stabilizes the regularization function by mitigating potential numerical instabilities. Setting limits on max iterations for LS and CG during line search and conjugate gradient processes enhances computational efficiency. Effective convergence is achieved through specific stopping criteria. Max iterations limit the total iterations to prevent infinite loops and include an “early-stopping” criteria to prevent overfitting, while tolerance parameters such as Tol CG, Tol F, and Tol X define the required precision for the conjugate gradient solver, the minimal change in the objective function value, and acceptable movement in the model parameters [58,59]. These parameters ensure the inversion halts at an optimal point.
The optimization of geophysical inversion parameters is refined via a trial-and-error process, integrating empirical analysis and theoretical principles. This process includes performing a multidimensional scan at regular intervals to identify the best value for each parameter, as shown in Table 3. The iterative nature of this method ensures that model parameters are refined for maximum accuracy and stability.
The initial parameter settings are guided by theoretical expectations from geophysical principles, insights from previous studies, and existing code implementations, as well as the specific characteristics of the study area.
Theoretical expectations inform the initial parameter settings, grounded in geophysical principles. Emphasis is placed on the trade-off parameter and data misfit, given their critical influence on the objective function, to achieve a precise balance between inversion accuracy and stability.
The trade-off parameter ( β ), ideally approaching zero, must be managed to avoid causing the inversion to overflow or the model to overfit, which would result in unrealistic resistivity values. Similarly, the data misfit ( ϕ d ( m ) ) should decrease to minimize discrepancies between observed and predicted data, but excessive reduction can also lead to instability, yielding extreme resistivity values [60].
The final step in the inversion workflow involves the assessment of the data misfit, which is quantified using the normalized L2 norm difference between the observed and predicted data:
M i s f i t = i = 1 N ( D o b s ,   i D p r e d ,   i ) 2
where D o b s ,   i is the i -th observed data component and D p r e d ,   i the i -th predicted data component.
The inversion algorithm is versatile, allowing for both independent and joint inversions of the CCR and GCR datasets. This flexibility enables seamless switching between datasets or their integration for joint inversion, tailored to the specific requirements of the analysis. A key aspect of this process is the parameter α , which adjusts the weighting between the GCR and CCR data misfits. In this study, α is aligned with the acquisition proportions, assigning 93% to GCR and 7% to CCR. Implementing a unified algorithm for CCR, GCR, and joint inversion provides an advantage, allowing for a comprehensive assessment of each dataset’s influence on the inversion parameters. The joint data misfit ( ϕ d j o i n t ( m ) ) is defined as follows:
ϕ d j o i n t ( m ) = ( 1 α )   ϕ d G C R ( m ) + α   ϕ d C C R ( m )
Here, α is the weighted ratio of ϕ d G C R ( m ) to ϕ d C C R ( m ) , with α adjusting the influence of each data misfit, with the individual GCR and CCR inversion results serving as initial calibration points. This integrated approach ultimately produces a unified three-dimensional resistivity model of the subsurface.
Upon finalizing the inversion process, we conduct a rigorous outlier analysis of the resulting model cell values (as shown in row 3 of Table 2) using the boxplot method [61]. This post-inversion analysis yields resistivity values for the GCR, CCR, and joint inversion models as detailed in row 4 of Table 2. Although the initial input datasets are smaller, the number of 3D TreeMesh cells is significantly greater, with their magnitude being highly dependent on the grid refinement around the electrodes.

3. Results

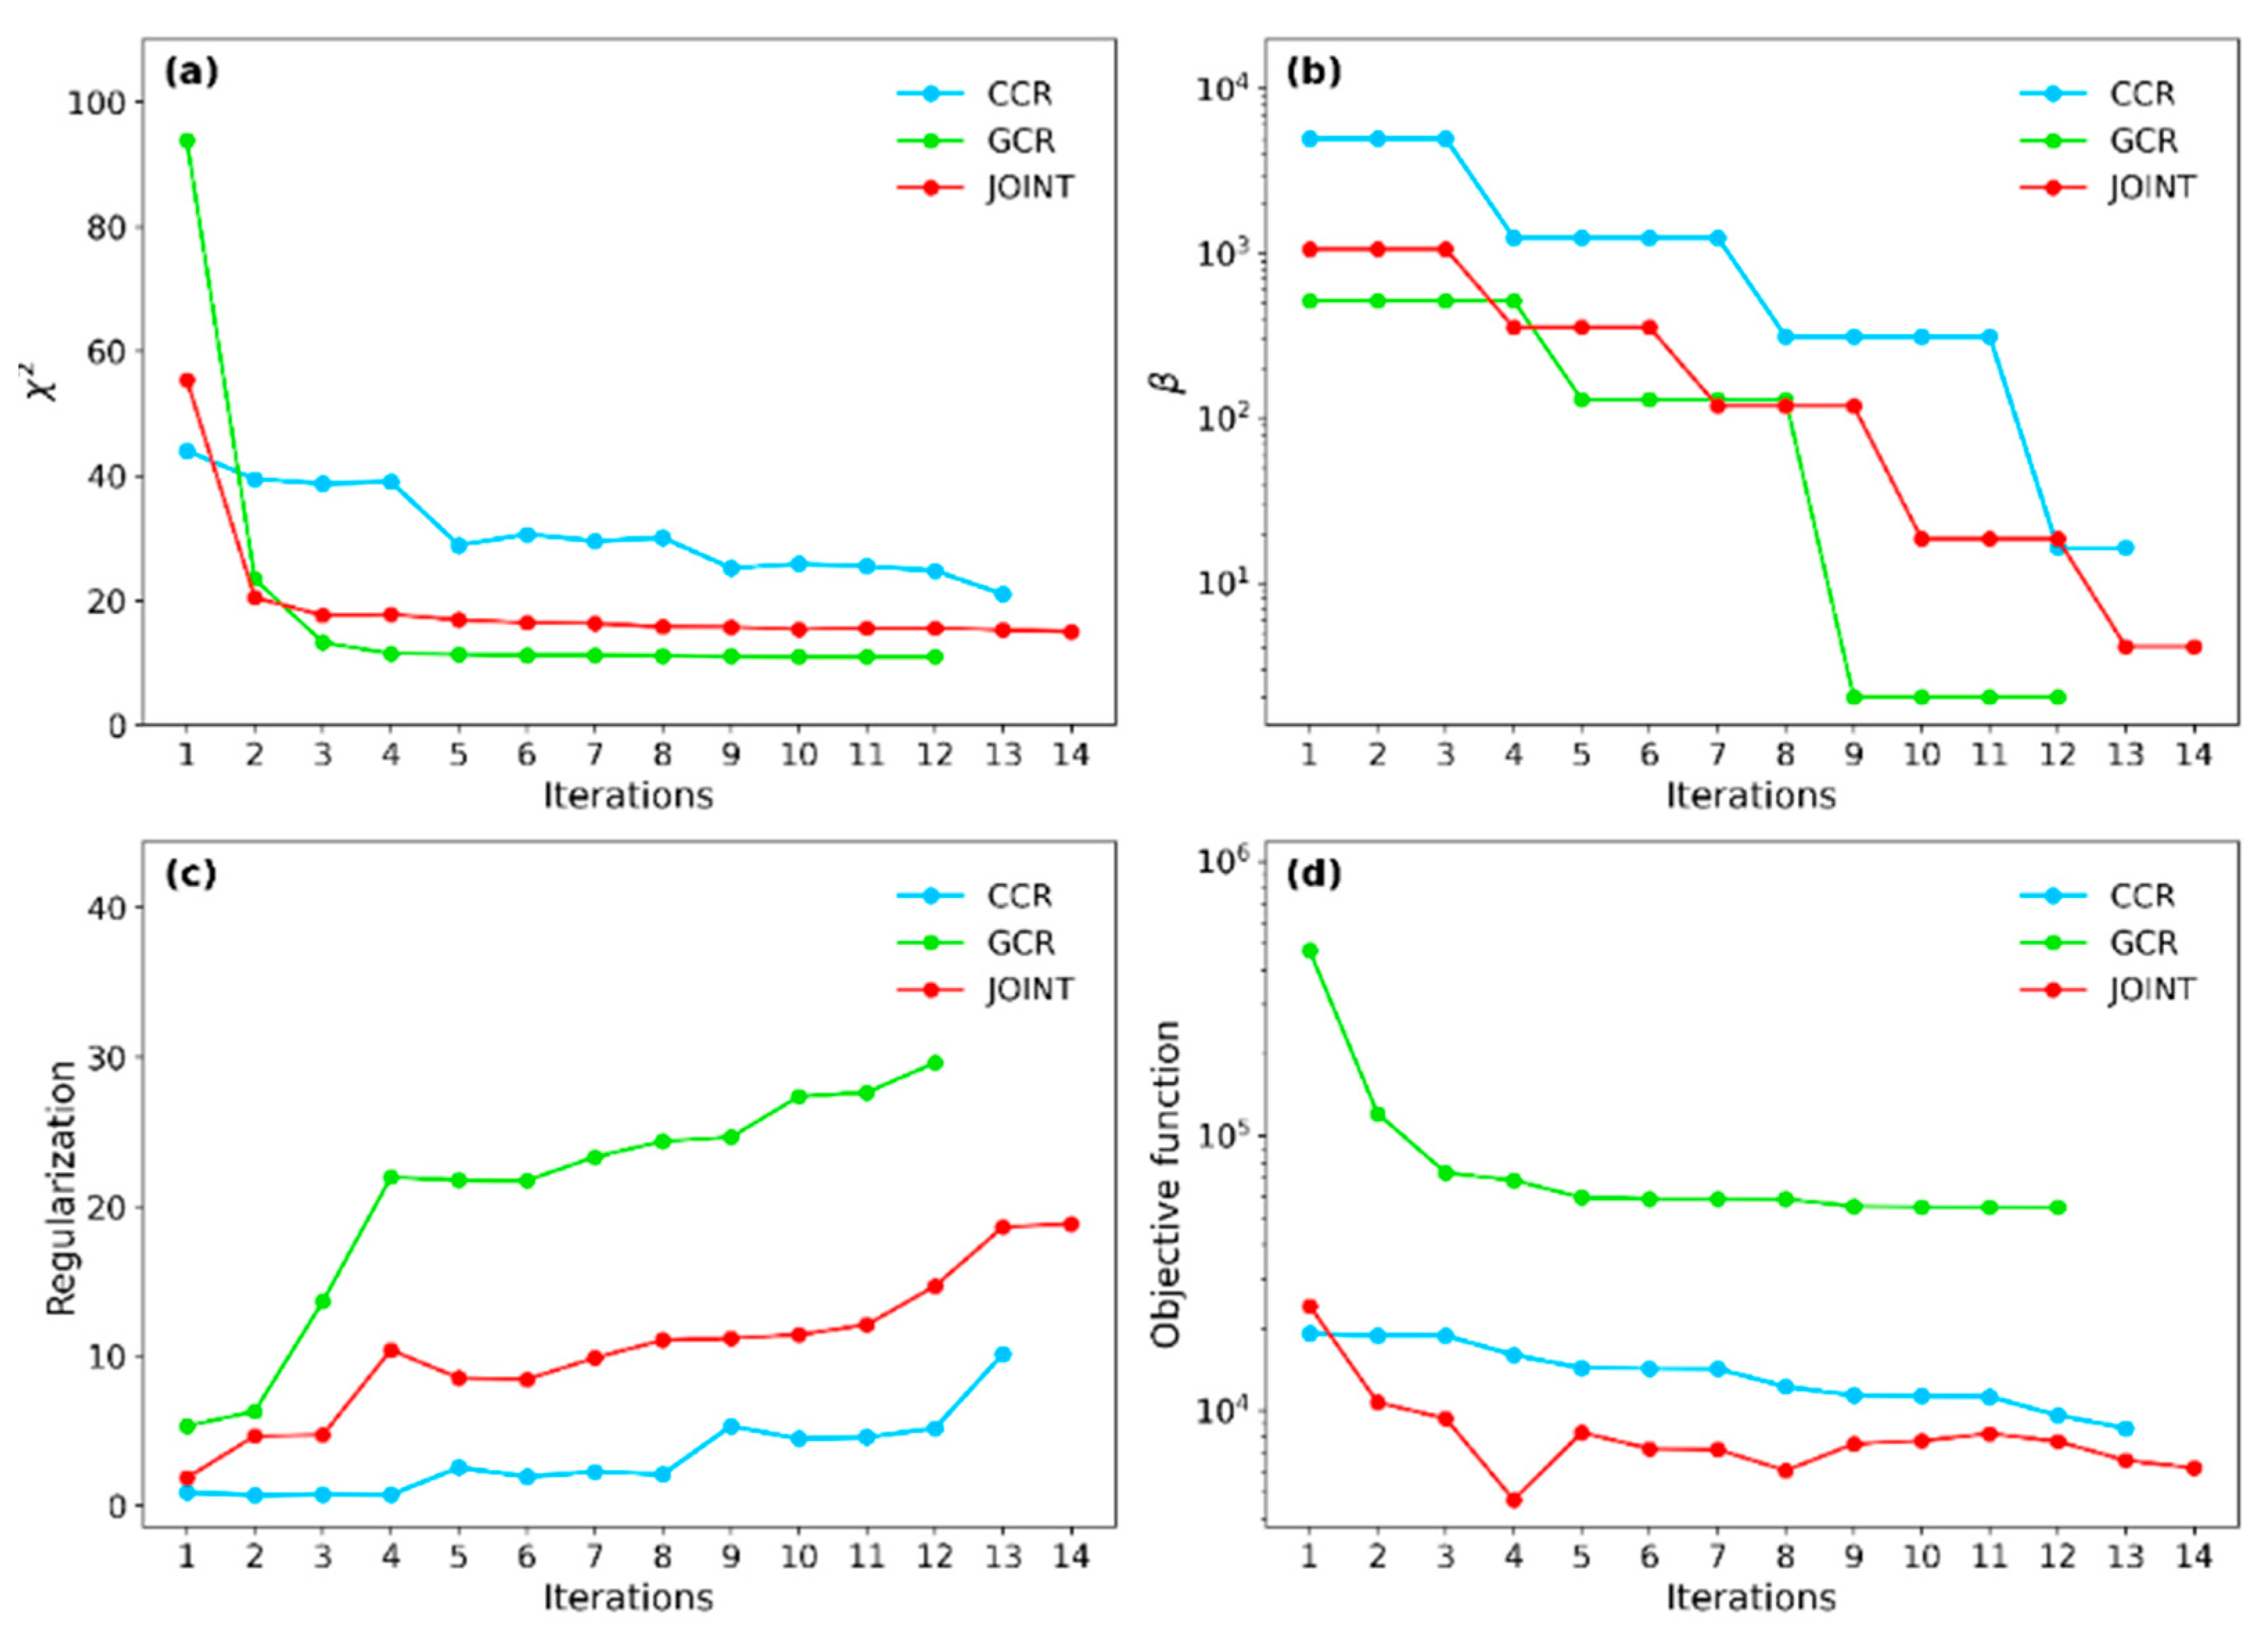
Using the best parameters from Table 3, the inversion process for GCR converges in 29 min and 24 s over 12 iterations (corresponding to a computational speed of 147.0 s/iteration), CCR converges in 27 min and 13 s over 13 iterations (125.6 s/iteration), and the joint inversion converges in 1 h, 17 min, and 19 s over 14 iterations (331.4 s/iteration).
Figure 4 shows the trends observed during these inversion processes. While the parameters do not always align with theoretical optima, they follow expected trends without inducing instability, ensuring that the selected parameters are specifically tailored to accurately represent the subsurface conditions of the vineyard of the experimental site, rather than being universally applicable to other joint inversion scenarios.
The χ2 parameter, given by
χ 2 = M i s f i t N
where M i s f i t represents the data misfit function (Equation (7)) evaluated at the current model, and N is the total number of observations and is the highest for CCR, reaching a value of 21. This higher value is due to CCR’s increased sensitivity to near-surface variability. Specifically, CCR probes depths where there are significant resistivity contrasts, which complicates accurate model reconstruction. In comparison, the χ2 value for GCR is lower, at 11, reflecting its deeper investigation range and the smoother resistivity distribution in those layers. The joint inversion results in an χ2 value of 15, effectively balancing the strengths of both methods, leading to a more uniform reduction in the overall data misfit. More importantly, all methods demonstrate a consistent decrease in χ2 values, showcasing the efficiency of the inversion processes in minimizing data misfit through iterative refinement.
The β parameter exhibits a decreasing trend across all methods, corresponding with the expected reduction in regularization weight as the inversion process converges. For GCR, the final β value is 2, demonstrating a steady reduction throughout the iterations. This decrease is accompanied by an increase in the regularization parameter, culminating in a final value of 29.6, indicating robust model smoothness as the inversion progresses. The objective function, which combines the misfit of the data and the regularization terms, reaches 55,019 for GCR, reflecting a balance between achieving a smooth model and fitting the deeper subsurface features.
Similarly, for CCR, the final β is 16.3, reflecting a less rapid yet consistent decline in β . Despite the variability in superficial layers, the regularization parameter increases to a final value of 10.1, signifying a controlled enhancement in model smoothness tailored to the data’s sensitivity characteristics. The objective function for CCR reaches 8616, indicating an effective, though more moderate, balance between model smoothness and data fit.
In the joint inversion, the β parameter decreases more significantly to a final value of 4.1, consistent with the α value, which assigns greater weight to GCR data. This substantial decline is paralleled by an increase in the regularization parameter, reaching a final value of 18.9. The objective function for the joint inversion achieves a final lowest value of 6186, demonstrating an improved model fit by effectively integrating both datasets and minimizing the combined data misfit. This behavior underscores the ability of the joint inversion to balance model complexity with data fidelity, resulting in a more consistent and reliable solution across the dataset.
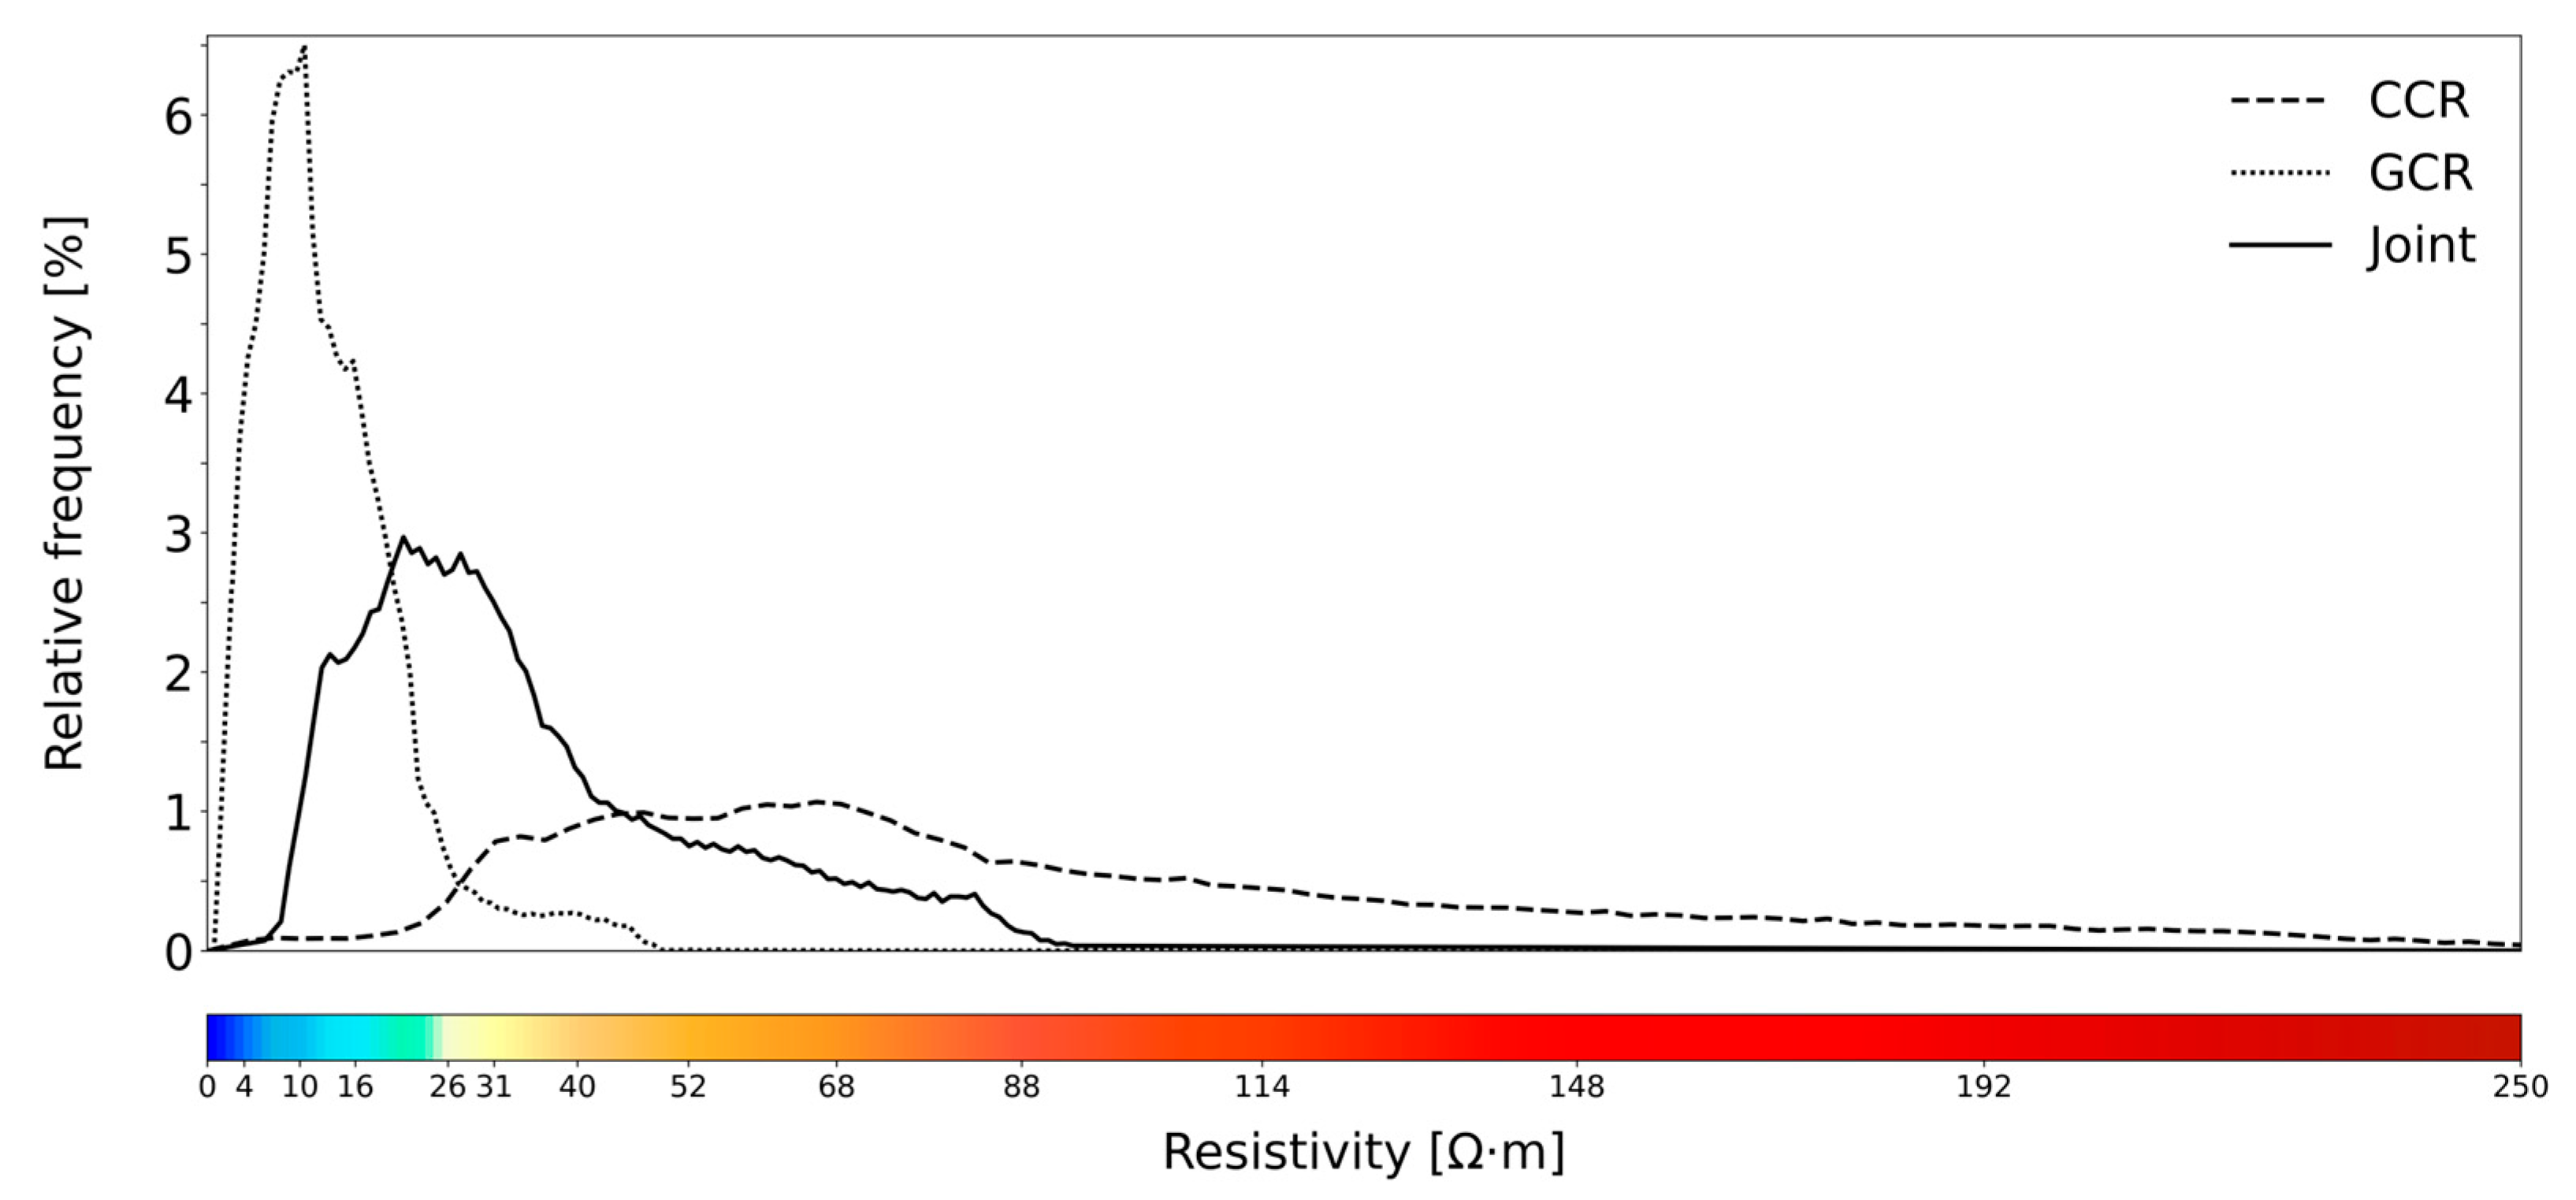
The distribution of resistivity values for GCR, CCR, and joint inversion methods shows distinct characteristics, with positive skewness more evident in the joint inversion and CCR distributions (Figure 5). Joint inversion yields a smoother and more consistent distribution compared to the individual methods, effectively integrating data and reducing overall variability. The median resistivity from the joint inversion lies between the medians of GCR and CCR, while the minimum and maximum values highlight the differences in sensitivity and spatial resolution among the methods (Table 4).
The narrower distribution in the GCR data highlights a greater homogeneity in resistivity values, reflecting its focus on deeper regions where resistivity is generally lower, and the likelihood of subsurface water is higher. In contrast, the CCR method spans a much wider range of values, indicating significant variability and heightened sensitivity to near-surface resistivity heterogeneities. The joint inversion method provides a balanced perspective, integrating the sensitivities of both GCR and CCR to deliver a comprehensive view of subsurface resistivity.
To facilitate a detailed analysis, the chromatic variations in the color scale (Figure 5) were assigned to specific values with the aim of enabling a more granular interpretation of resistivity values across the study area. This division allows for a clearer identification of resistivity transitions within the electrical tomography, highlighting structures that correlate with lithological, geological, and agronomic evidence.
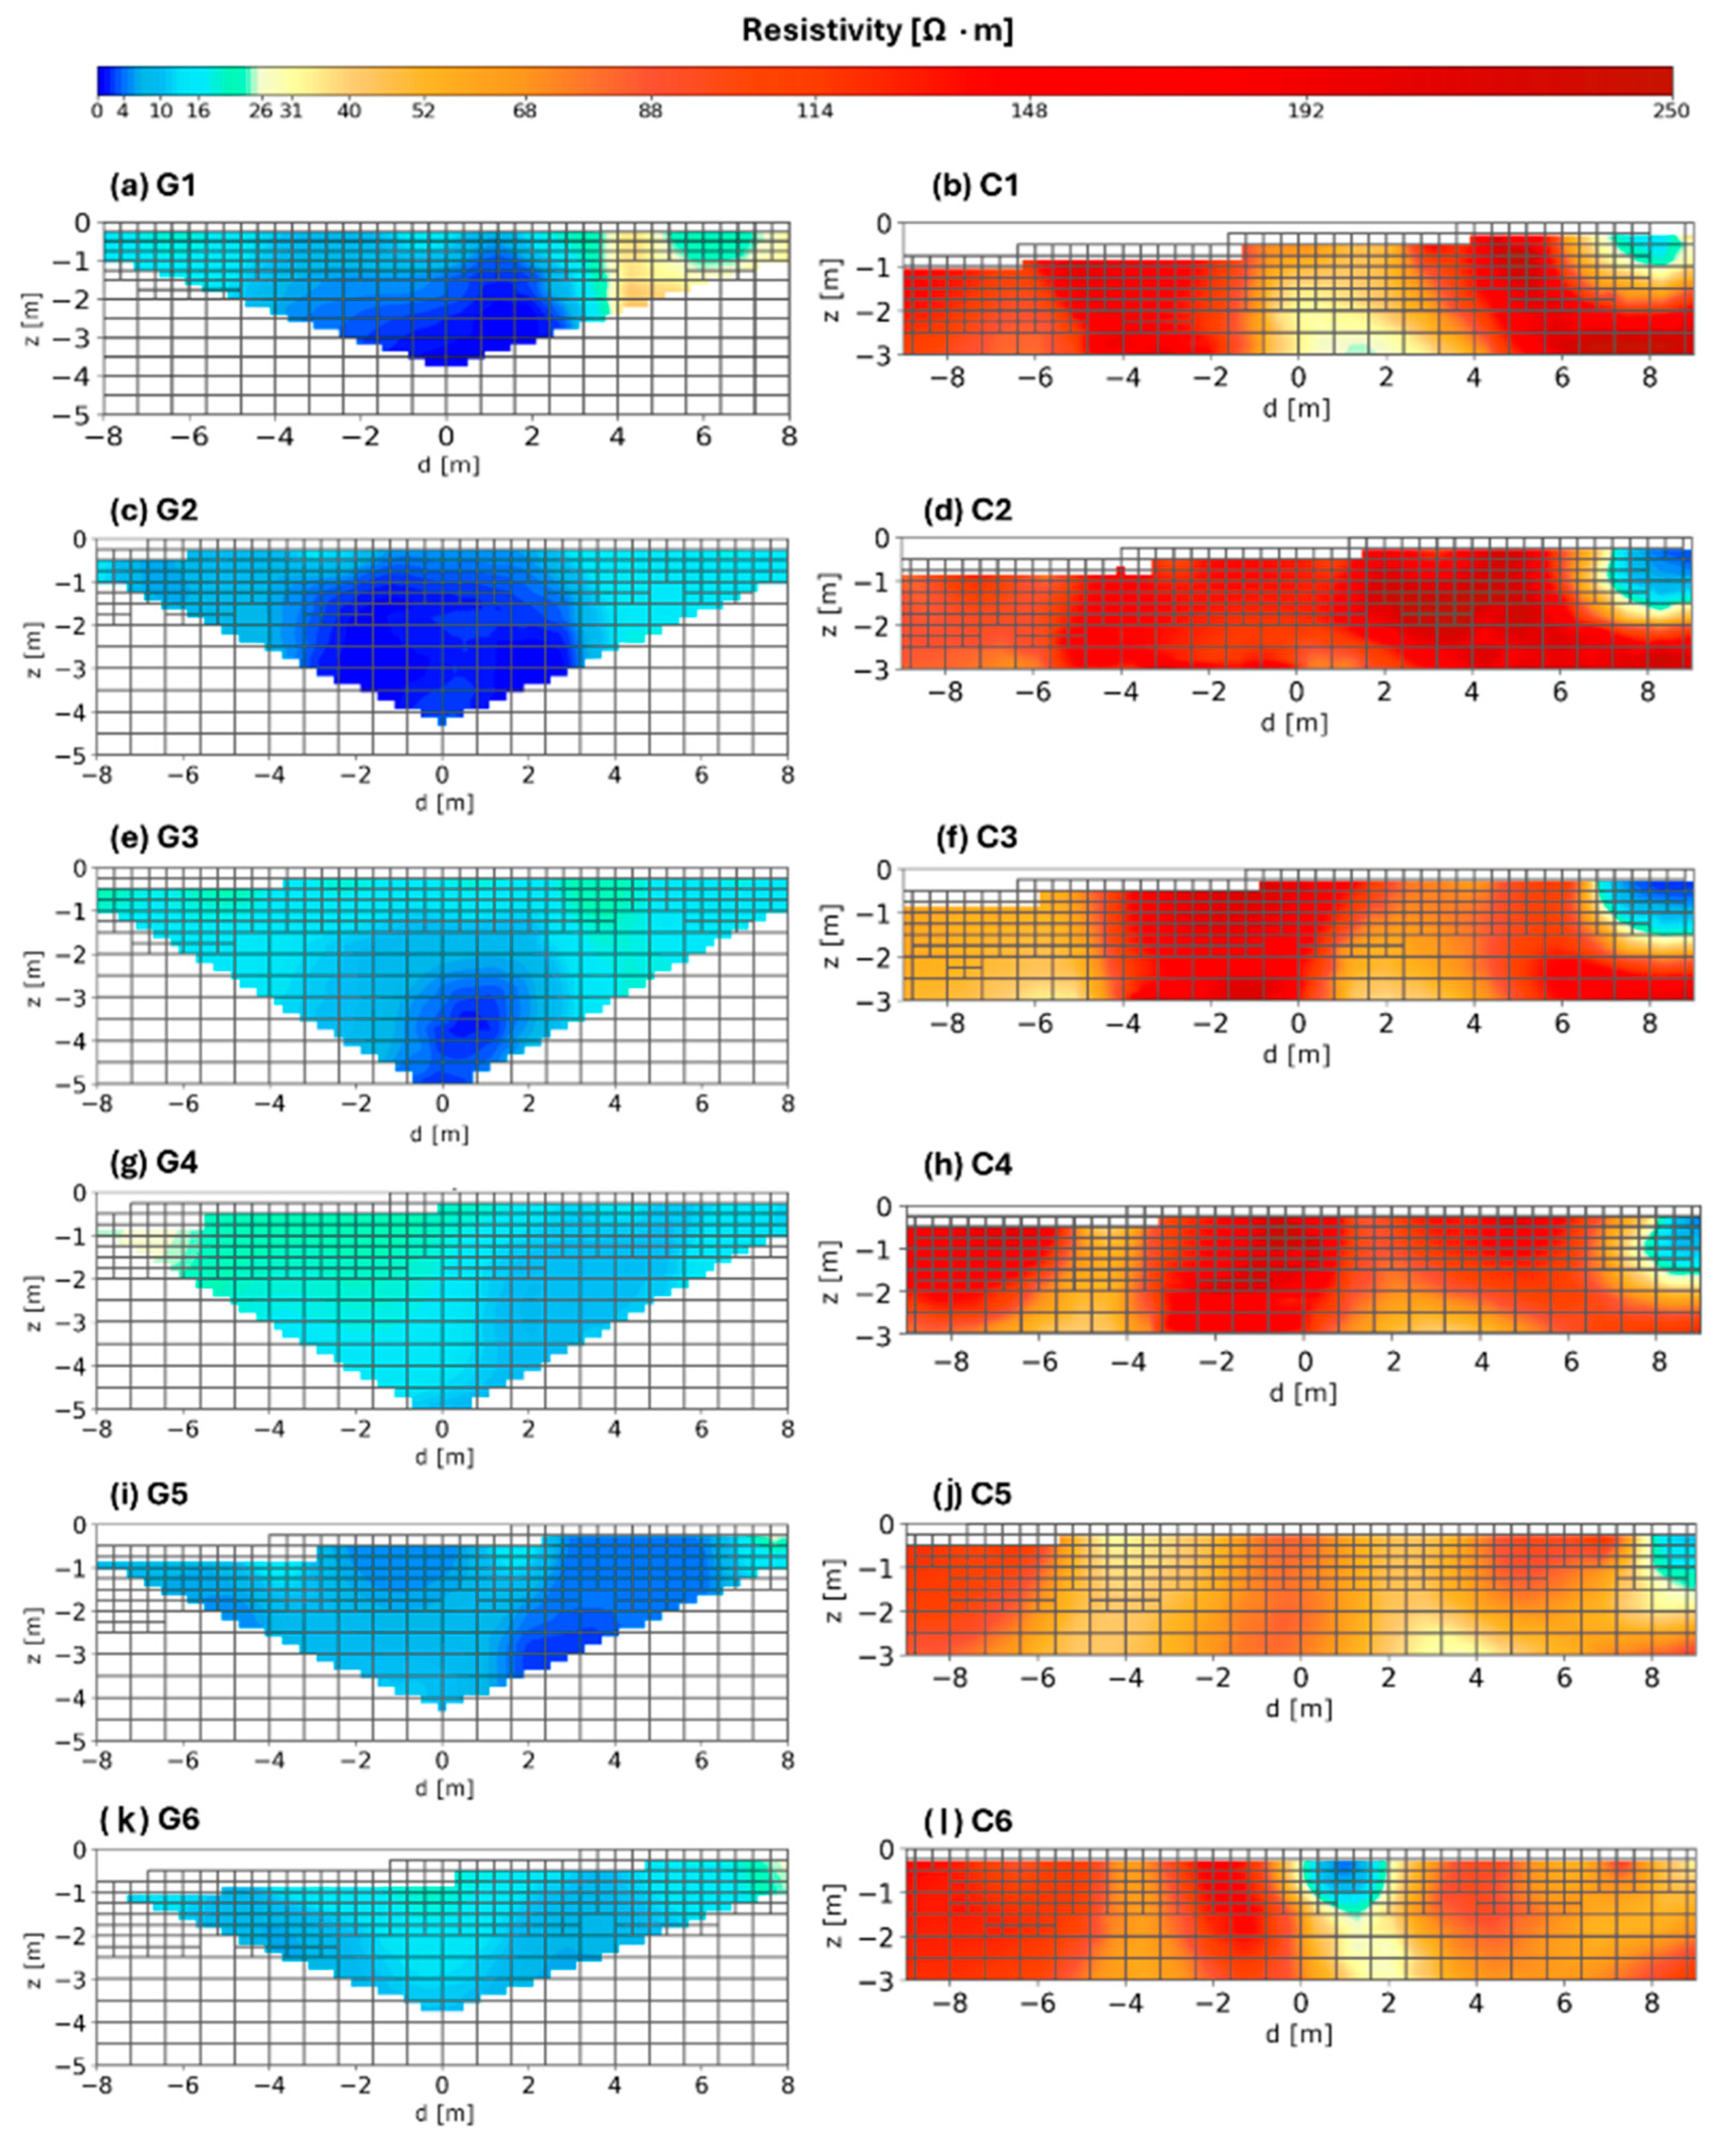
The GCR sections, reaching depths of up to 5 m, provide a more extensive view of the subsurface compared to the 3 m depth achieved by the CCR sections (Figure 6). This difference stems from the varying acquisition techniques and configurations adopted in each method. The subsoil characterization shows that CCR inversion effectively delineates superficial layers, but loses spatial resolution with increasing depth, while GCR inversion, despite probing deeper layers, also experiences reduced spatial resolution at these depths. All sections show a reduction in accuracy towards the edges due to the lower signal coverage in those regions.
The joint inversion of GCR and CCR data combines the strengths of both methods, resulting in a more comprehensive three-dimensional subsoil model (Figure 7). This approach integrates the high-spatial-resolution shallow information from CCR with the deeper probing capability of GCR, producing resistivity values that capture the key features of both datasets.

4. Discussion

The application of each inversion algorithm generates a subsurface resistivity model, with forward modeling used to simulate signal propagation and acquisition, producing synthetic data for each model. The quality of the GCR, CCR, and joint models is then assessed by calculating their misfit using a modified version of Equation (7), where D p r e d ,   i represents the synthetic data component, and the misfit is normalized by the total number of observations.
The CCR and GCR methods provide different spatial coverage and spatial resolution. Consequently, the signal propagation simulated by forward modeling affects various parts of the synthetic model. This difference enables us to evaluate the fit of different, potentially overlapping regions of the model with respect to the two techniques and their acquisition configurations. As reported in Table 5, the best outcomes, indicated by the smallest misfits, occur when comparing synthetic data from single-objective models with the observed data used for inversion (e.g., synthetic data from the GCR model against GCR observed data). Conversely, single-objective models show the largest misfits when compared with data for which they are not optimized (e.g., synthetic data from the GCR model against CCR observed data).
The joint inversion produces strong overall results, successfully creating a model that fits both the CCR and GCR data. This indicates that the overall accuracy of the predicted model is significantly improved, as it integrates more constraints than models obtained from single-objective inversions.
When integrated through joint inversion, electrical resistivity methods provide a comprehensive three-dimensional model of soil conductivity, offering a detailed underground view of the vineyard. Even though closely spaced electrodes may introduce artifacts, such as spurious anomalies or distortions in the resistivity data due to strong coupling effects [25,62], it is still possible to identify subsurface structures whose characteristics align with agronomic features. With a high resistivity value density (20.21 data per m3) the subsurface panorama reveals distinguishable structures related to lithological variations, the presence of subsurface water, and the distribution of root systems. These features not only highlight the spatial variability within the vineyard, but also provide insights into the roots’ vital activity, contributing to a deeper understanding of the interactions between soil properties and vine health.
The joint inversion model effectively delineates root systems within the vineyard. Mary et al. [63] and Ehosioke et al. [64] demonstrate that resistivity variations effectively identify root presence and features, as roots alter soil moisture and electrolyte content through water and nutrient uptake, leading to distinct resistivity contrasts. The resistivity contrasts observed in our study reveal root depth up to 1 m (Figure 7), confirming the studies of Serra et al. [38]. Thicker roots, characterized by higher resistivity due to their dense structure, contrast with thinner roots, which exhibit lower resistivity values. This differentiation provides a detailed understanding of the spatial distribution and structural composition of the roots, thereby offering valuable insights into the overall morphology and function of the root system.
The 3D model (Figure 8) identifies zones of low resistivity (<20 Ω·m), which indicate the presence of subsurface water. These low-resistivity zones shift from the northeast to the south, expanding and reaching superficial areas. In the region where G ≥ 4, the low-resistivity volume is 75.77 m3 up to a depth of 5 m, increasing to 141.34 m3 in regions where G ≤ 3. Courjault-Radé et al. [65] support this observation, noting that similar resistivity values correspond to saturated conditions. These findings align with established correlations between resistivity values and subsurface materials, suggesting conductive materials like clays or water-saturated sediments in low-resistivity areas, and coarser, less conductive materials like sands and gravels in high-resistivity ones.
Further analysis of the 3D model reveals the impact of soil management practices (e.g., terrain plowing) on resistivity variations. Sections examined perpendicular to the vineyard rows and intra-rows, up to a depth of −1 m, reveal a systematic alternation between areas of high and low resistivity (Figure 9). Jeřábek et al. [66] explain that plowed soil typically exhibits lower resistivity due to higher soil bulk density and reduced porosity in the compacted plow pan, which prevents water infiltration into deeper soil layers and reduces water supply to lower layers. In contrast, unplowed soil is more resistive. This understanding supports the identified patterns, indicating that plowed intra-rows exhibit lower resistivity, while unplowed intra-rows show higher resistivity. The spatial location of these intra-rows align with the observed resistivity variations, further substantiating the geoelectrical findings and providing a clear correlation between resistivity values and soil treatment.
The model’s ability to reveal critical zones for water dynamics within the vineyard supports agronomic decision-making. Variations in water availability across vine rows are identified, with specific plants having greater access to water (lower resistivity values) and others having limited access (higher resistivity zones). This differentiation has implications for vine health and productivity. Songy et al. [67] highlight that high soil water reserves predispose vines to grapevine trunk diseases, emphasizing the importance of managing soil moisture to mitigate disease risk. Excess water accumulation creates favorable conditions for pathogenic fungi, influencing the spread and severity of these diseases. Thus, the 3D resistivity model not only enhances our understanding of water dynamics within the vineyard, but also provides valuable insights into the spatial distribution of soil moisture and its implications for disease treatment. This information is pivotal for developing effective strategies to manage soil water content and improve overall vineyard health.
Equally significant, the three-dimensional resistivity model supports oenological analysis by facilitating precise vineyard management through soil microzonation.
Bonfante et al. [68] emphasize that soil microzonation optimizes hydrological and pedological characteristics, directly influencing grape quality through precise water and nutrient supply. This approach allows for better adaptation to soil variability, thus supporting improved vine health and productivity. Similarly, Wang et al. [69] demonstrate the significant impact of soil type on vine growth and wine quality, highlighting the need for detailed soil characterization to optimize viticultural practices. Employing this model achieves a comprehensive understanding of subsoil conditions, leading to rationale resource management and enhanced wine quality. Targeted interventions ensure that specific vineyard areas receive appropriate care, ultimately benefiting the wine industry through improved production practices.

5. Conclusions

The joint inversion of Capacitively Coupled Resistivity (CCR) and Galvanic Contact Resistivity (GCR) data presented in this study produced a highly detailed 3D resistivity model of the investigated vineyard, providing a high spatial resolution subsurface “snapshot” with 20.21 data/m3. This model significantly enhances subsurface soil characterization, effectively delineating root systems, identifying the pattern of water distribution, and capturing the effects of soil management practices, with recurring patterns showing relative variations in resistivity values sometimes greater than 50%. Quantitative analysis demonstrates that the developed joint inversion model not only reduces data misfit more effectively than individual inversions, but also successfully integrates measurements of the same physical quantity using different approaches. The result is a smoother and more balanced range of resistivity values that seamlessly integrate shallow and deeper subsurface data.
In addition, the 3D model identified a low-resistivity zone (<20 Ω·m) indicative of the presence of subsurface water, extending from the northeast to the south and expanding to superficial areas. The systematic alternation of high- and low-resistivity anomalies in cross-sections perpendicular to and between vineyard rows, down to a depth of −1 m, further illustrates how the variation in resistivity values reflects the impact of soil management practices, demonstrating the necessity to adopt targeted interventions for improving vineyard health.
While the joint inversion method significantly improves the subsurface characterization, it does not fully capture all the environmental conditions of the vineyard. To achieve a more accurate assessment, the presented method should be complemented by surface-based investigations by means of agrometeorological stations or proximal and remote sensing surveys. The use of these additional sensors contributes to providing a comprehensive picture of the vineyard, capturing the variations in surface variables and parameters to be coupled with the 3D resistivity distribution provided by the joint inversion of the geoelectric methods. The integration of these data sources could unlock new opportunities for precision viticulture. In addition, the developed algorithm has strong commercial potential as specialized software to support scalable, data-driven decision-making.
Future research could extend the joint inversion of geoelectrical data developed in this study. Building on established methodologies [70], the implementation of permanent monitoring networks for electrical resistivity in vineyards would enable continuous time-lapse analysis, transitioning from 3D to 4D models. This approach could provide valuable insights into changes in subsurface features over time, such as soil moisture dynamics and root system development.
In addition, the integration of machine learning techniques could address the challenges associated with non-linear and ill-conditioned resistivity inversions. By training convolutional neural networks to map pseudo-resistivity data to resistivity space, this approach could provide a data-driven alternative to traditional methods, enhancing the accuracy and efficiency of geophysical inversions and improving the quality of subsurface models [70,71].

Author Contributions

Conceptualization, N.L., F.M. and S.P.; Data curation, N.L., F.G., F.M., S.P. and K.G.C.R.; Formal analysis, N.L. and S.P.; Funding acquisition, T.C.; Investigation, N.L., D.P., and S.P.; Methodology, N.L., F.M., D.P. and S.P.; Project administration, T.C. and V.S.; Resources, N.L., T.C., and E.G.; Software, N.L., E.C. and S.P.; Supervision, T.C., E.G., F.M. and V.S.; Validation, N.L. and F.M.; Visualization, M.A., A.B., E.C., D.P., K.G.C.R. and V.S.; Writing—original draft, N.L.; Writing—review and editing, N.L., M.A., A.B., E.C., T.C., F.G., E.G., F.M., D.P., S.P., K.G.C.R. and V.S. All authors have read and agreed to the published version of the manuscript.

Funding

This research was funded by (i) the project STELLA (Sistema inTEgrato per Lo studio del contenuto d’acqua in agricoLturA) (CUP: D94E20002180009) funded by the Tuscany region under the program POR FESR 2014/2020. This work is partially supported by (ii) the ICSC—Centro Nazionale di Ricerca in High Performance Computing, Big Data and Quantum Computing, funded by European Union—NextGenerationEU—CUP F77G22000120006, (iii) the project PERBACCO (Early warning system per la PrEvenzione della diffusione della flavescenza doRata BAsato sul monitoraggio multiparametriCo airborne delle COlture vinicole) (CUP E47F23000030002) funded by the Emilia-Romagna Region and (iv) the “GeoneUtrinos: mESSengers of the Earth’s interior” (GUESS) project—CUP F53D23001280006.

Data Availability Statement

The data that support the findings of this study are available from the corresponding author, N.L., upon reasonable request.

Acknowledgments

The authors express their gratitude to the Tenuta Il Poggione for their valuable cooperation, and thank Marco Antoni, Giovanni Collodi, Gabriele Galli, Andrea Maino, Antonio Manes, Riccardo Salvini, and Vivien De Lucia for the support and fruitful discussions. The authors express their gratitude to the reviewers for improving the quality of this work.

Conflicts of Interest

The authors declare no conflicts of interest.

References

  1. Sarri, D.; Lombardo, S.; Pagliai, A.; Perna, C.; Lisci, R.; De Pascale, V.; Rimediotti, M.; Cencini, G.; Vieri, M. Smart Farming Introduction in Wine Farms: A Systematic Review and a New Proposal. Sustainability 2020, 12, 7191. [Google Scholar] [CrossRef]
  2. Ammoniaci, M.; Kartsiotis, S.-P.; Perria, R.; Storchi, P. State of the Art of Monitoring Technologies and Data Processing for Precision Viticulture. Agriculture 2021, 11, 201. [Google Scholar] [CrossRef]
  3. Visconti, F.; López, R.; Olego, M. The Health of Vineyard Soils: Towards a Sustainable Viticulture. Horticulturae 2024, 10, 154. [Google Scholar] [CrossRef]
  4. Upadhyay, S.; Raghubanshi, A. Determinants of soil carbon dynamics in urban ecosystems. In Urban Ecology; Elsevier: Amsterdam, The Netherlands, 2020; pp. 299–314. [Google Scholar]
  5. Rasheed, M.W.; Tang, J.; Sarwar, A.; Shah, S.; Saddique, N.; Khan, M.U.; Khan, M.I.; Nawaz, S.; Shamshiri, R.R.; Aziz, M.; et al. Soil Moisture Measuring Techniques and Factors Affecting the Moisture Dynamics: A Comprehensive Review. Sustainability 2022, 14, 11538. [Google Scholar] [CrossRef]
  6. Karunathilake, E.M.B.M.; Le, A.T.; Heo, S.; Chung, Y.S.; Mansoor, S. The Path to Smart Farming: Innovations and Opportunities in Precision Agriculture. Agriculture 2023, 13, 1593. [Google Scholar] [CrossRef]
  7. Maffezzoli, F.; Ardolino, M.; Bacchetti, A.; Perona, M.; Renga, F. Agriculture 4.0: A systematic literature review on the paradigm, technologies and benefits. Futures 2022, 142, 102998. [Google Scholar] [CrossRef]
  8. Bordoni, M.; Vercesi, A.; Maerker, M.; Ganimede, C.; Reguzzi, M.; Capelli, E.; Wei, X.; Mazzoni, E.; Simoni, S.; Gagnarli, E.; et al. Effects of vineyard soil management on the characteristics of soils and roots in the lower Oltrepò Apennines (Lombardy, Italy). Sci. Total Environ. 2019, 693, 133390. [Google Scholar] [CrossRef] [PubMed]
  9. Faid, A.; Sadik, M.; Sabir, E. An Agile AI and IoT-Augmented Smart Farming: A Cost-Effective Cognitive Weather Station. Agriculture 2021, 12, 35. [Google Scholar] [CrossRef]
  10. Bauerle, T.L.; Smart, D.R.; Bauerle, W.L.; Stockert, C.; Eissenstat, D.M. Root foraging in response to heterogeneous soil moisture in two grapevines that differ in potential growth rate. New Phytol. 2008, 179, 857–866. [Google Scholar] [CrossRef]
  11. Garré, S.; Hyndman, D.; Mary, B.; Werban, U. Geophysics conquering new territories: The rise of “agrogeophysics”. Vadose Zone J. 2021, 20, e20115. [Google Scholar] [CrossRef]
  12. Carrera, A.; Pavoni, M.; Barone, I.; Boaga, J.; Dal Ferro, N.; Cassiani, G.; Morari, F. On the use of seismic geophysical methods to characterize different soil compaction levels. In Proceedings of the Copernicus Meetings, Vienna, Austria, 23–28 April 2023. [Google Scholar]
  13. Lombardi, F.; Ortuani, B.; Facchi, A.; Lualdi, M. Assessing the Perspectives of Ground Penetrating Radar for Precision Farming. Remote. Sens. 2022, 14, 6066. [Google Scholar] [CrossRef]
  14. He, H.; Aogu, K.; Li, M.; Xu, J.; Sheng, W.; Jones, S.B.; González-Teruel, J.D.; Robinson, D.A.; Horton, R.; Bristow, K.; et al. A review of time domain reflectometry (TDR) applications in porous media. In Advances in Agronomy; Elsevier: Amsterdam, The Netherlands, 2021; Volume 168, pp. 83–155. [Google Scholar] [CrossRef]
  15. Pradipta, A.; Soupios, P.; Kourgialas, N.; Doula, M.; Dokou, Z.; Makkawi, M.; Alfarhan, M.; Tawabini, B.; Kirmizakis, P.; Yassin, M. Remote Sensing, Geophysics, and Modeling to Support Precision Agriculture—Part 1: Soil Applications. Water 2022, 14, 1158. [Google Scholar] [CrossRef]
  16. Singh, J.; Singh, N.; Kumar, S. X-ray computed tomography–measured soil pore parameters as influenced by crop rotations and cover crops. Soil Sci. Soc. Am. J. 2020, 84, 1267–1279. [Google Scholar] [CrossRef]
  17. Brillante, L.; Mathieu, O.; Bois, B.; Van Leeuwen, C.; Lévêque, J. The use of soil electrical resistivity to monitor plant and soil water relationships in vine-yards. Soil 2015, 1, 273–286. [Google Scholar] [CrossRef]
  18. Cimpoiaşu, M.O.; Kuras, O.; Pridmore, T.; Mooney, S.J. Potential of geoelectrical methods to monitor root zone processes and structure: A review. Geoderma 2020, 365, 114232. [Google Scholar] [CrossRef]
  19. Vanella, D.; Cassiani, G.; Busato, L.; Boaga, J.; Barbagallo, S.; Binley, A.; Consoli, S. Use of small scale electrical resistivity tomography to identify soil-root interactions during deficit irrigation. J. Hydrol. 2018, 556, 310–324. [Google Scholar] [CrossRef]
  20. Innocenti, A.; Pazzi, V.; Napoli, M.; Fanti, R.; Orlandini, S. Assessing the efficiency of the irrigation system in a horticulture field through time-lapse electrical resistivity tomography. Irrig Sci 2024. [Google Scholar] [CrossRef]
  21. Romero-Ruiz, A.; Linde, N.; Baron, L.; Breitenstein, D.; Keller, T.; Or, D. Lasting Effects of Soil Compaction on Soil Water Regime Confirmed by Geoelectrical Monitoring. Water Resour. Res. 2022, 58, e2021WR030696. [Google Scholar] [CrossRef]
  22. Dumont, M.; Singha, K. Geophysics as a hypothesis-testing tool for critical zone hydrogeology. Wiley Interdiscip. Rev. Water 2024, 11, e1732. [Google Scholar] [CrossRef]
  23. Abbas, M.; Deparis, J.; Isch, A.; Mallet, C.; Jodry, C.; Azaroual, M.; Abbar, B.; Baltassat, J. Hydrogeophysical characterization and determination of petrophysical parameters by integrating geophysical and hydrogeological data at the limestone vadose zone of the Beauce aquifer. J. Hydrol. 2022, 615, 128725. [Google Scholar] [CrossRef]
  24. Kritikakis, G.; Kokinou, E.; Economou, N.; Andronikidis, N.; Brintakis, J.; Daliakopoulos, I.N.; Kourgialas, N.; Pavlaki, A.; Fasarakis, G.; Markakis, N.; et al. Estimating Soil Clay Content Using an Agrogeophysical and Agrogeological Approach: A Case Study in Chania Plain, Greece. Water 2022, 14, 2625. [Google Scholar] [CrossRef]
  25. Loke, M.H. Tutorial: 2-D and 3-D Electrical Imaging Surveys; Geotomo Software: Birmingham, UK, 2004. [Google Scholar]
  26. Gebbers, R.; Lück, E.; Dabas, M.; Domsch, H. Comparison of instruments for geoelectrical soil mapping at the field scale. Near Surf. Geophys. 2009, 7, 179–190. [Google Scholar] [CrossRef]
  27. Allred, B.J.; Ehsani, M.R.; Saraswat, D. Comparison of electromagnetic induction, capacitively-coupled resistivity, and galvanic contact resistivity methods for soil electrical conductivity measurement. Appl. Eng. Agric. 2006, 22, 215–230. [Google Scholar] [CrossRef]
  28. Kuras, O.; Beamish, D.; Meldrum, P.I.; Ogilvy, R.D. Fundamentals of the capacitive resistivity technique. Geophysics 2006, 71, G135–G152. [Google Scholar] [CrossRef]
  29. Loke, M.H.; Chambers, J.E.; Rucker, D.F.; Kuras, O.; Wilkinson, P.B. Recent developments in the direct-current geoelectrical imaging method. J. Appl. Geophys. 2013, 95, 135–156. [Google Scholar] [CrossRef]
  30. Garofalo, F.; Sauvin, G.; Socco, L.V.; Lecomte, I. Joint inversion of seismic and electric data applied to 2D media. Geophysics 2015, 80, EN93–EN104. [Google Scholar] [CrossRef]
  31. Conti, P.; Cornamusini, G.; Carmignani, L. An outline of the geology of the Northern Apennines (Italy), with geological map at 1:250,000 scale. Ital. J. Geosci. 2020, 139, 149–194. [Google Scholar] [CrossRef]
  32. Vezzosi, R.; Rizzotti, S.; Rossi, M.; Poggi, F.; Giovannuzzi, D.; Frasconi, M.; Galmacci, L.; Batistoni, N.; Coletta, M.; Campana, S.; et al. Piano strutturale: Relazione geologica. In Technical Report; Comune di Montalcino: Montalcino, Italy, 2024. [Google Scholar]
  33. DeByle, N.V.; Winokur, R.P. Aspen: Ecology and Management in the Western United States; US Department of Agriculture, Forest Service, Rocky Mountain Forest and Range Experiment Station: Washington, DC, USA, 1985; Volume 119. [Google Scholar]
  34. Regione Toscana, ‘Geoscopio’. Available online: https://www502.regione.toscana.it/geoscopio/cartoteca.html (accessed on 3 September 2024).
  35. Mattiacci, A.; Zampi, V. Brunello di Montalcino: How a typical wine could revive a poor country-village. Br. Food J. 2004, 106, 767–778. [Google Scholar] [CrossRef]
  36. Smart, D.R.; Schwass, E.; Lakso, A.; Morano, L. Grapevine Rooting Patterns: A Comprehensive Analysis and a Review. Am. J. Enol. Vitic. 2006, 57, 89–104. [Google Scholar] [CrossRef]
  37. Poni, S.; Bernizzoni, F.; Civardi, S. Response of “Sangiovese” grapevines to partial root-zone drying: Gas-exchange, growth and grape composition. Sci. Hortic. 2007, 114, 96–103. [Google Scholar] [CrossRef]
  38. Serra, I.; Strever, A.; Myburgh, P.A.; Deloire, A. Review: The interaction between rootstocks and cultivars (Vitis vinifera L.) to enhance drought tolerance in grapevine: Rootstocks to enhance drought tolerance in grapevine. Aust. J. Grape Wine Res. 2014, 20, 1–14. [Google Scholar] [CrossRef]
  39. Bigot, G.; Mosetti, D.; Cargnus, E.; Freccero, A.; Moosavi, F.K.; Lujan, C.; Stecchina, M.; Tacoli, F.; Zandigiacomo, P.; Sivilotti, P.; et al. Influence of vineyard inter-row management on vegetative and bunch sanitary status, and grape yield and quality of two Sauvignon Blanc clones in Friuli Venezia Giulia (north-eastern Italy). VITIS-J. Grapevine Res. 2022, 61, 53–62. [Google Scholar] [CrossRef]
  40. Fichtl, L.; Hofmann, M.; Kahlen, K.; Voss-Fels, K.P.; Cast, C.S.; Ollat, N.; Vivin, P.; Loose, S.; Nsibi, M.; Schmid, J.; et al. Towards grapevine root architectural models to adapt viticulture to drought. Front. Plant Sci. 2023, 14, 1162506. [Google Scholar] [CrossRef]
  41. Geometrics. Ohm-Mapper TR1, Operation Manual; Geometrics, Inc.: San Jose, CA, USA, 2001; 147p. [Google Scholar]
  42. Reynolds, J.M. An Introduction to Applied and Environmental Geophysics; John Wiley & Sons: Hoboken, NJ, USA, 2011. [Google Scholar]
  43. Walker, J.P.; Houser, P.R. Evaluation of the OhmMapper Instrument for Soil Moisture Measurement. Soil Sci. Soc. Am. J. 2002, 66, 728–734. [Google Scholar] [CrossRef]
  44. Neukirch, M.; Klitzsch, N. Inverting Capacitive Resistivity (Line Electrode) Measurements with Direct Current Inversion Programs. Vadose Zone J. 2010, 9, 882–892. [Google Scholar] [CrossRef]
  45. Kuras, O. The Capacitive Resistivity Technique for Electrical Imaging of the Shallow Subsurface. Ph.D Thesis, University of Nottingham, Nottingham, UK, 2002. [Google Scholar]
  46. Zhdanov, M.S. Inverse Theory and Applications in Geophysics; Elsevier: Amsterdam, The Netherlands, 2015; Volume 36. [Google Scholar]
  47. Accaino, F.; Da Col, F.; Böhm, G.; Picotti, S.; Giorgi, M.; Meneghini, F.; Schleifer, A. Petro-physical Characterization of the Shallow Sediments in a Coastal Area in NE Italy from the Integration of Active Seismic and Resistivity Data. Surv. Geophys. 2023, 44, 1211–1238. [Google Scholar] [CrossRef]
  48. Canzoneri, A.; Capizzi, P.; Martorana, R.; Albano, L.; Bonfardeci, A.; Costa, N.; Favara, R. Geophysical Constraints to Reconstructing the Geometry of a Shallow Groundwater Body in Caronia (Sicily). Water 2023, 15, 3206. [Google Scholar] [CrossRef]
  49. Cockett, R.; Kang, S.; Heagy, L.J.; Pidlisecky, A.; Oldenburg, D.W. SimPEG: An open source framework for simulation and gradient based parameter estimation in geophysical applications. Comput. Geosci. 2015, 85, 142–154. [Google Scholar] [CrossRef]
  50. Wagner, F.M.; Uhlemann, S. An overview of multimethod imaging approaches in environmental geo-physics. In Advances in Geophysics; Elsevier: Amsterdam, The Netherlands, 2021; Volume 62, pp. 1–72. [Google Scholar] [CrossRef]
  51. Bernard, J.; Leite, O.; Vermeersch, F.; Instruments, I.R.I.S.; Orleans, F. Multi-Electrode Resistivity Imaging for Environmental and Mining Applications; IRIS Instruments: Orleans, France, 2006. [Google Scholar]
  52. Heagy, L.J.; Cockett, R.; Kang, S.; Rosenkjaer, G.K.; Oldenburg, D.W. A framework for simulation and inversion in electromagnetics. Comput. Geosci. 2017, 107, 1–19. [Google Scholar] [CrossRef]
  53. Haber, E.; Schwarzbach, C. Parallel inversion of large-scale airborne time-domain electromagnetic data with multiple OcTree meshes. Inverse Probl. 2014, 30, 055011. [Google Scholar] [CrossRef]
  54. Pierini, S.; Aleardi, M.; Mazzotti, A. A method to attenuate genetic drift in genetic-algorithm optimizations: Applications to analytic objective functions and two seismic optimization problems. Geophysics 2019, 84, R295–R310. [Google Scholar] [CrossRef]
  55. Loke, M.; Barker, R. Rapid least-squares inversion of apparent resistivity pseudosections by a quasi-Newton method. Geophys. Prospect. 1996, 44, 131–152. [Google Scholar] [CrossRef]
  56. Oldenburg, D.W.; Pratt, D.A. Geophysical inversion for mineral exploration: A decade of progress in theory and practice. Proc. Explor. 2007, 7, 61–95. [Google Scholar]
  57. Tikhonov, A.N. On the solution of ill-posed problems and the method of regularization. Dokl. Akad. Nauk. Russ. Acad. Sci. 1963, 151, 501–504. [Google Scholar]
  58. Rodi, W.; Mackie, R.L. Nonlinear conjugate gradients algorithm for 2-D magnetotelluric inversion. Geophysics 2001, 66, 174–187. [Google Scholar] [CrossRef]
  59. Nocedal, J.; Wright, S.J. Numerical Optimization; Springer: Berlin/Heidelberg, Germany, 1999. [Google Scholar]
  60. Binley, A.; Slater, L. Resistivity and Induced Polarization: Theory and Applications to the Near-Surface Earth; Cambridge University Press: Cambridge, UK, 2020. [Google Scholar]
  61. Schwertman, N.C.; Owens, M.A.; Adnan, R. A simple more general boxplot method for identifying outliers. Comput. Stat. Data Anal. 2004, 47, 165–174. [Google Scholar] [CrossRef]
  62. Edwards, L.S. A modified pseudosection for resistivity and IP. Geophysics 1977, 42, 1020–1036. [Google Scholar] [CrossRef]
  63. Mary, B.; Peruzzo, L.; Boaga, J.; Schmutz, M.; Wu, Y.; Hubbard, S.S.; Cassiani, G. Small-scale characterization of vine plant root water uptake via 3-D electrical resistivity tomography and mise-à-la-masse method. Hydrol. Earth Syst. Sci. 2018, 22, 5427–5444. [Google Scholar] [CrossRef]
  64. Ehosioke, S.; Nguyen, F.; Rao, S.; Kremer, T.; Placencia-Gomez, E.; Huisman, J.A.; Kemna, A.; Javaux, M.; Garré, S. Sensing the electrical properties of roots: A review. Vadose Zone J. 2020, 19, e20082. [Google Scholar] [CrossRef]
  65. Courjault-Radé, P.; Llubes, M.; Darrozes, J.; Munoz, M.; Maire, E.; Hirissou, N. A 2D electrical resistivity tomography survey of a vineyard plot of the Gaillac appellation (France): Interpretation with respect to possible implications on vine water supply. OENO One 2010, 44, 51. [Google Scholar] [CrossRef]
  66. Jeřábek, J.; Zumr, D.; Dostál, T. Identifying the plough pan position on cultivated soils by measurements of electrical resistivity and penetration resistance. Soil Tillage Res. 2017, 174, 231–240. [Google Scholar] [CrossRef]
  67. Songy, A.; Fernandez, O.; Clément, C.; Larignon, P.; Fontaine, F. Grapevine trunk diseases under thermal and water stresses. Planta 2019, 249, 1655–1679. [Google Scholar] [CrossRef] [PubMed]
  68. Bonfante, A.; Agrillo, A.; Albrizio, R.; Basile, A.; Buonomo, R.; De Mascellis, R.; Gambuti, A.; Giorio, P.; Guida, G.; Langella, G.; et al. Viticulture microzoning: A functional approach aiming to grape and wine qualities. Soil Discuss. 2014, 1, 1203–1237. [Google Scholar] [CrossRef]
  69. Wang, R.; Sun, Q.; Chang, Q. Soil Types Effect on Grape and Wine Composition in Helan Mountain Area of Ningxia. PLoS ONE 2015, 10, e0116690. [Google Scholar] [CrossRef]
  70. Hojat, A.; Arosio, D.; Ivanov, V.I.; Loke, M.H.; Longoni, L.; Papini, M.; Tresoldi, G.; Zanzi, L. Quantifying seasonal 3D effects for a permanent electrical resistivity tomography monitoring system along the embankment of an irrigation canal. Near Surf. Geophys. 2020, 18, 427–443. [Google Scholar] [CrossRef]
  71. Aleardi, M.; Vinciguerra, A.; Hojat, A. A convolutional neural network approach to electrical resistivity tomography. J. Appl. Geophys. 2021, 193, 104434. [Google Scholar] [CrossRef]
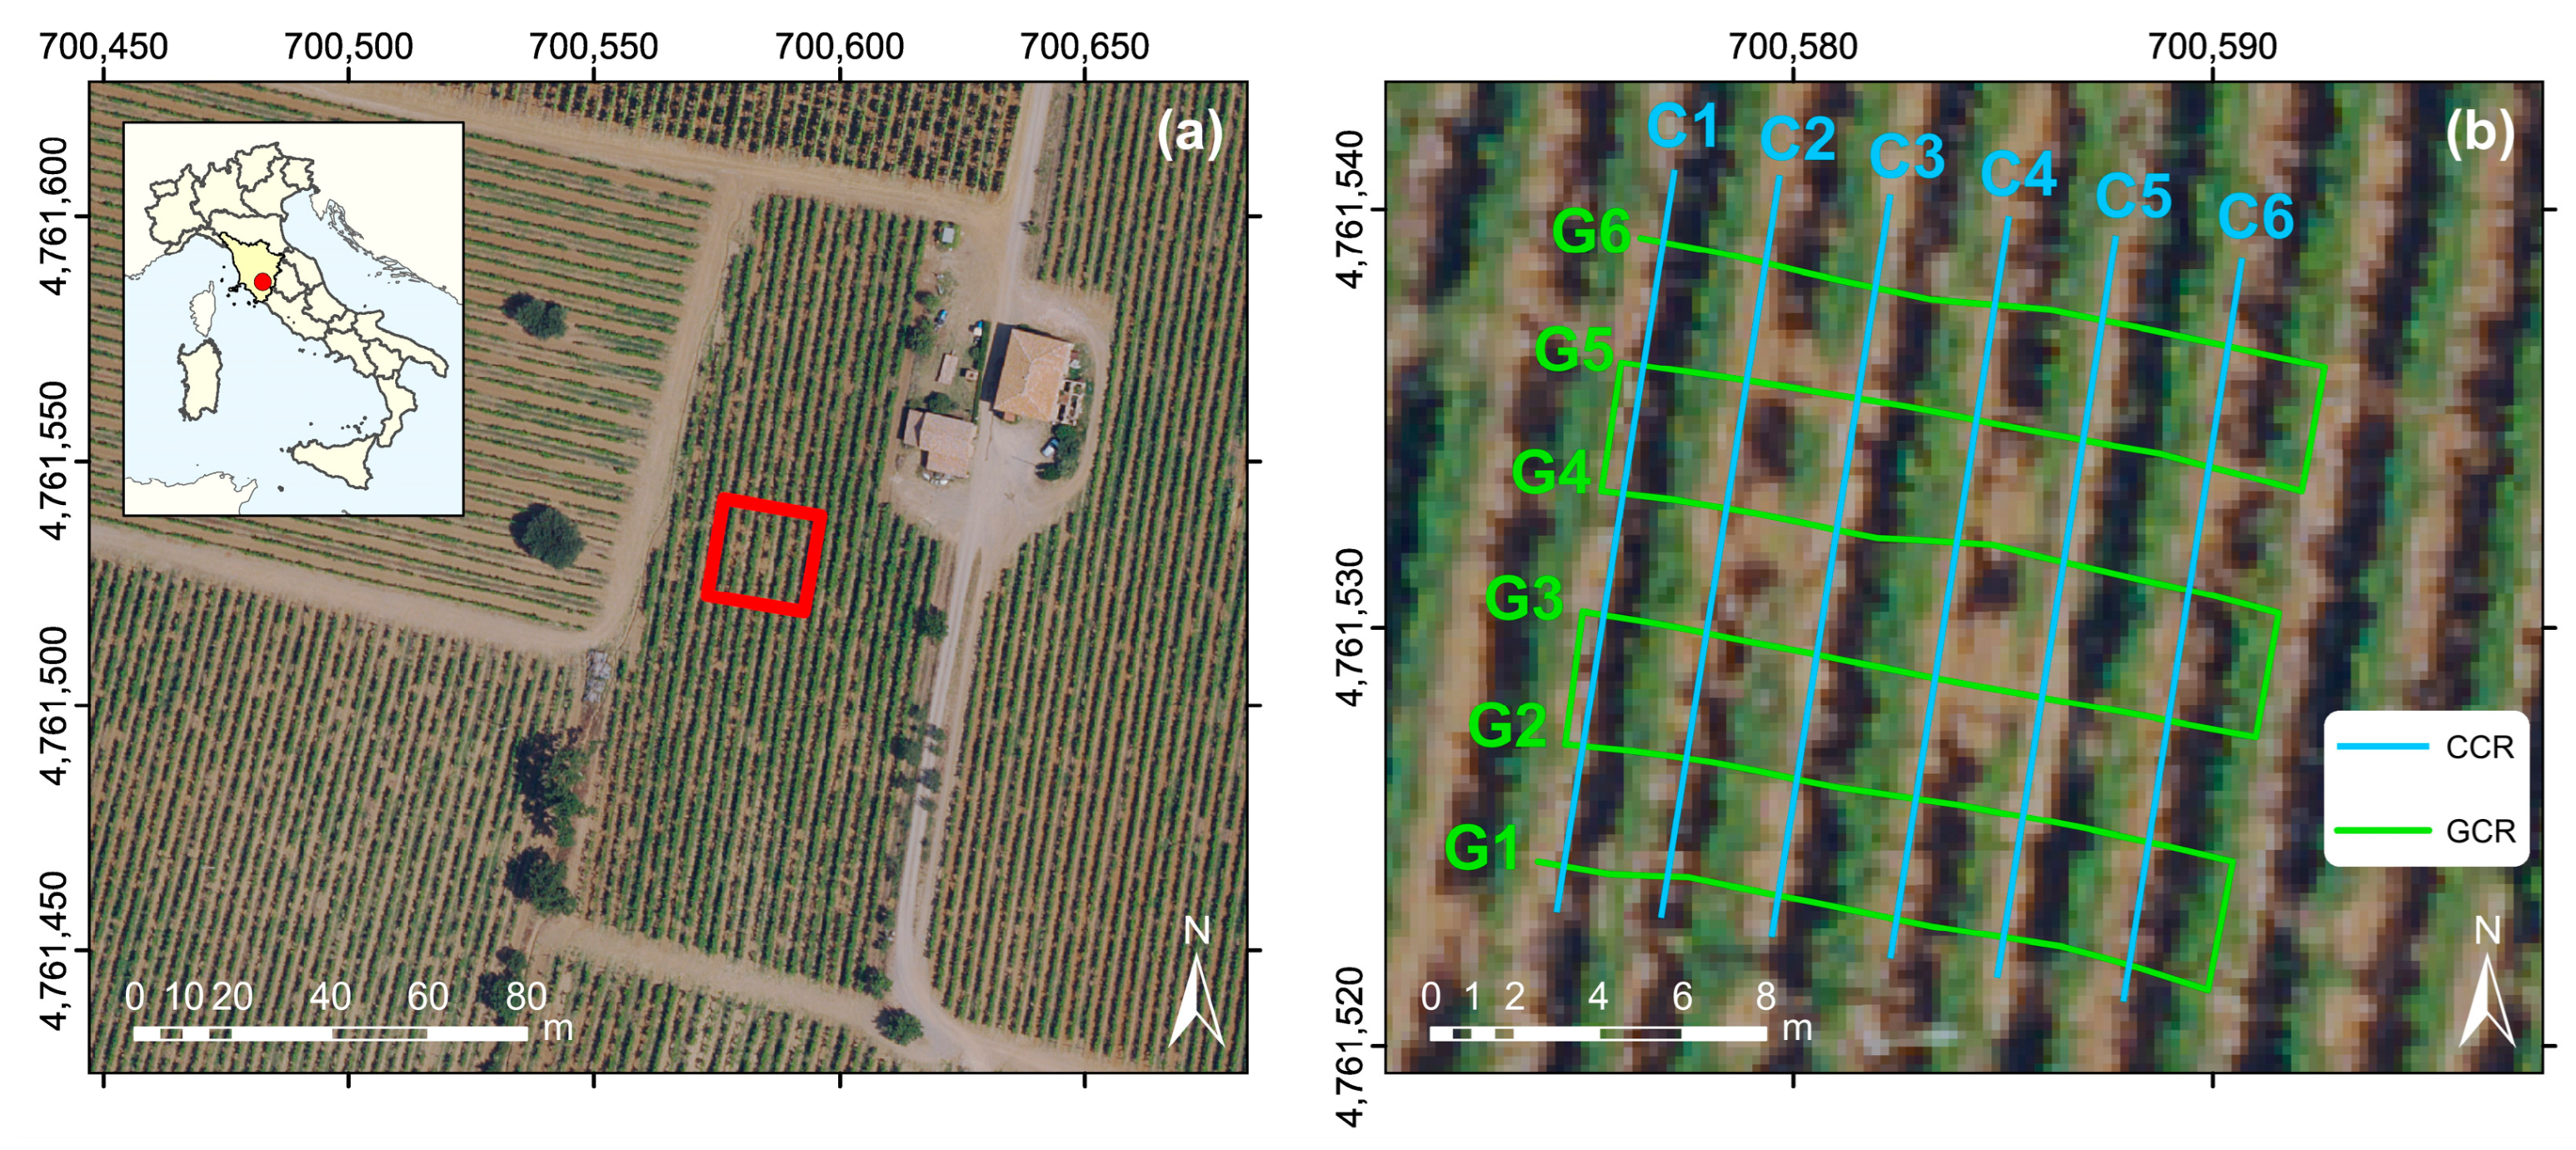
Figure 1. Location and layout of test site. (a) General overview of vineyard at “Il Poggione” estate, located in Tuscany (Italy); red square encloses studied plot. (b) Grid setup for CCR (labeled by letter “C”) and GCR (labeled by letter “G”). Base picture from Regione Toscana—Id. RT: 162-Orto2023-66c; date 31 July 2023; pixel size 0.15 m; license CC BY 4.0. Coordinates are in WGS84-UTM 32N (EPSG: 32632).
Agronomy 14 02489 g001
Figure 2. Data collection. (a) An overview of the study area. (b) The Syscal Pro instrument used in the GCR method. (c) A field operator using the OhmMapper for CCR measurements.
Agronomy 14 02489 g002
Figure 3. Flowchart of the data inversion processing workflow. The diagram details the novel procedures for both single-objective and joint inversion approaches, incorporating GCR and CCR data to enhance subsurface characterization.
Agronomy 14 02489 g003
Figure 4. Trend comparison of the observed iterations during the inversion processes of GCR, CCR, and the joint method. (a) χ2 progression calculated as the ratio of data misfit to the number of observations; a better fit for GCR, a slower rate of decrease for CCR, and an effective balance for joint inversion can be observed. (b) β parameter: these trends demonstrate that joint inversion effectively reduces the regularization weight, aligning with the theoretical expectation of β approaching zero. (c) Regularization parameter; a better fit for GCR, a slower rate of decrease for CCR, and an effective balance for joint inversion can be observed. (d) Objective function combining the data misfit and regularization terms, the joint inversion achieves the lowest objective function value, demonstrating an improved model fit, and the ability of the joint inversion to balance model complexity with data fidelity.
Agronomy 14 02489 g004
Figure 5. Resistivity value distribution for GCR, CCR, and joint inversion. The curves display different peaks: GCR is concentrated at lower resistivity values and CCR at higher values, while the joint inversion shows a wider distribution. The color scale also used in the following images aligns with the distribution patterns, is also included to visualize the resistivity range.
Agronomy 14 02489 g005
Figure 6. Resistivity sections from GCR and CCR inversions. Panels (a,c,e,g,i,k) display six resistivity sections (identified by the letter “G”) derived from GCR inversion, corresponding to acquisition spreads oriented perpendicular to those used in the CCR inversion. Panels (b,d,f,h,j,l) show the resistivity (identified by the letter “C”) sections from CCR inversion, each aligned with its respective acquisition spreads. For the spatial location of the sections, refer to Figure 1.
Agronomy 14 02489 g006
Figure 7. Resistivity sections obtained from the joint inversion. Panels (a,c,e,g,i,k) display sections along the GCR lines (identified by the letter “G”). Panels (b,d,f,h,j,l) show sections along the CCR lines (identified by the letter “C”). For the spatial location of the sections, refer to Figure 1.
Agronomy 14 02489 g007
Figure 8. Three-dimensional resistivity model derived from the joint inversion. The 3D visualization highlights subsurface volume with resistivity values <20 Ω·m, providing a comprehensive view of the spatial resistivity distribution across the surveyed area. Location of GCR, CCR, and plant rows are identified, respectively, by the letters G, C, and R.
Agronomy 14 02489 g008
Figure 9. Average resistivity values of the joint inversion model (black line) within the first meter of depth at the virtual profile located between the G3 and G4 line. The gray band corresponds to the 1 standard deviation uncertainty range, the brown and green band highlight, respectively, the alternation between plowed and unplowed inter-row areas. The locations of the vine plants rows are indicated by the letter R.
Agronomy 14 02489 g009
Table 1. Summary of data acquisition parameters. A comparison of different parameters with equivalent practical significance is provided to enhance the understanding of the applied methods. “n” is the maximum distance between the voltage and current dipoles. “a” is the basic electrode spacing between adjacent electrodes.
GCR CCR
Electrode distance (m)1Cord length (m)1.25–5–10
Max pseudo-depth (m)5.5Max pseudo-depth (m)3.5
Spread length (m)16Run length (m)18
Number of spreads6Number of runs6
Spread distance (m)3Run distance (m)2.7
MethodDipole–DipoleMethodDipole–Dipole
Acquisition dur. (h)0:48Acquisition dur. (h)2:17
Min V/I (Ω) 1.45   ×   10 5 Min V/I (Ω) 1.90   ×   10 5
Max V/I (Ω)3.01Max V/I (Ω)1.52
Max n + 1a (m)20Max n + 1a (m)7
Table 2. Summary of data acquired and elaborated for the GCR, CCR, and joint inversions. “N° measurements acquired” refers to raw data points collected in the field, “N° input data” are processed data points used for inversion, and “N° output data” represent the number of output discretized cells generated during the inversion.
GCRCCRJoint
N° measurements acquired 5049 384 -
N° input data49593845343
N° output data (cells of the model)26,82430,15530,751
N° output data after outlier removal26,01828,42529,102
Table 3. Ranges of parameters and optimal values used in the inversion processes. This includes the minimum and maximum limits for each parameter, along with the best-fit values determined during the inversion procedures.
GCRCCRJoint
RangeBestRangeBestRangeBest
Beta ratio 10 4 10 3 10 2 10 4 10 3 10 10 4 10 3 200
Cooling factor1– 20 41– 20 41– 20 4.5
Cooling rate1–631–641–63
Max iterations LS10–403010–403010–4030
Max iterations CG10–403510–403510–4035
ε 10 4 –1 10 2 10 4 –1 10 2 10 4 –1 10 2
Max iterations3–50123–50133–5014
Tol CG 10 5 10 4 10 1 10 5 10 4 10 1 10 3 –10 10 2
Tol F 10 5 10 4 0.04 10 5 10 4 0.01 10 1 –100.003
Tol X 10 5 10 4 0.12 10 5 10 4 0.19 10 1 –100.34
Table 4. Statistical summary of the resistivity values for GCR, CCR, and joint inversion. The joint inversion method produces a smoother and more consistent resistivity distribution compared to the other methods. Joint inversion effectively integrates data, reducing overall variability, with the median resistivity lying between those of GCR and CCR.
GCRCCRJoint
Max value (Ω·m) 87.5 269 64.7
Min value (Ω·m)0.10.20.1
Mean value (Ω·m)14.4103.736.7
Median value (Ω·m)13.788.230.6
Skewness0.41.40.9
Table 5. Misfit values measured using the normalized L2 norm difference compared to the observed data, against the synthetic data computed on single-objective (GCR and CCR) and joint inversion models.
Model
Data GCRCCRJoint
GCR 1.04   ×   10 2 27.5   ×   10 2 2.80   ×   10 2
CCR 2.10   ×   10 2 1.91   ×   10 2 1.95   ×   10 2
Disclaimer/Publisher’s Note: The statements, opinions and data contained in all publications are solely those of the individual author(s) and contributor(s) and not of MDPI and/or the editor(s). MDPI and/or the editor(s) disclaim responsibility for any injury to people or property resulting from any ideas, methods, instructions or products referred to in the content.